research report to the hampton roads … roads planning district commission results of a series of...
TRANSCRIPT

ENVISION HAMPTON ROADS
RESEARCH REPORT TO THE
HAMPTON ROADS
PLANNING DISTRICT COMMISSION
Results of a Series of Qualitative Listening Sessions
And a Quantitative Survey among Hampton Roads Residents about
the Region’s Values And Aspirations
June 19, 2014
This research was conducted under HRPDC contract PLN-2014-01 with the
Wason Center for Public Policy at Christopher Newport University. Bonney &
Company of Virginia Beach contributed extensively to the completion of this
research.

ENVISION HAMPTON ROA DS
2 | P a g e
Table of Contents
1. Regional Visions and Regional Actions….…………………..…………… 3
2. Study Background………………………..…………………..…………… 6
3. Purpose and Methodology ……………….…………………..…………… 7
4. Regional Planning: Guiding Values and Actions……………..…………… 10
4.1 Discussion of Findings………………..…………………..…………… 11
5. Sense of Place ………………………….....…………………..…………… 15
5.1. Discussion of Findings: Qualitative “Listening Sessions” …………… 17
5.1.1 Values That Define Hampton Roads..……………..…………… 18
5.1.2 Values That Set Hampton Roads Apart…………..………..…… 19
5.1.3 Values to Which We Aspire as a Region…………..…………… 20
5.1.4 Values That Define Our “Best Self” as a Region………………. 21
5.2. Discussion of the Findings: Quantitative Survey ……………………. 22
5.2.1 How We View Hampton Roads…….……………..…………… 23
5.2.2 Looking to the Future ………………..…………..………..…… 27
5.2.3 Making the Region Better ……………..…………..…………… 28
Appendix A: Visual Summary of the Findings ..………………..…………… 29
Appendix B: Demographic Characteristics of the Sample (Weighted)……… 42
Appendix C: Survey Questionnaire …………...………………..…………… 44
Appendix D: Note on Cross Tabulations ……...………………..…………… 49

ENVISION HAMPTON ROA DS
3 | P a g e
1. Regional Visions and Regional Actions
The information in this report is groundbreaking for a number of reasons. For one, it
recognizes that there are several steps in the development of a successful and effective regional
plan that precede the traditional planning starting point, and that the first stage in this process is
establishing the values and preferred future of the region. Or, in short, it acknowledges the merit
of first asking, “What does the region want?”
Secondly, this process undertaken by the Hampton Roads Planning District Commission is
groundbreaking because it acknowledges that the “public”—the general citizenry, as opposed to
only established “leaders”—has a right to participate in the planning of its future and that the public
will make good choices if presented with real options.
The results of this study provide actionable input to elected officials, planners and others
involved in the regional planning process. The findings presented in this document provide input
that can be used to create a vision for the region that is not only sound from a planning standpoint,
but reflective of the desires of the region and, therefore, far more likely to be embraced by the full
range of the region’s stakeholders, and successfully implemented.
Guiding Values and Planning Priorities
With regard to the region’s values and more specific desired planning actions, this study finds
that residents of Hampton Roads are optimistic about the future, and want a region that embraces
the change that the future will inevitably bring. The majority believes the region will be better or
about the same in ten years.
The public’s voice reflected in this study gives elected officials and regional planners clear
guidance on how to move forward. Specifically, that they should take a strong leadership position
when it comes to acting upon important issues before they become a problem, that they should act
more regionally and less parochially, that they should be responsible stewards of the region’s
natural environment, and that they should generally act to make the region better tomorrow than it
is today.
ENVISION HAMPTON ROA DS
4 | P a g e
Hampton Roads residents would like for the region to be more embracing of change in the
future than they believe it is today. They want their leaders to act boldly to make Hampton Roads a
better place, and to place a higher priority on the interests of the region as a whole, when
appropriate, than on preserving the independence of localities.
Residents of the region used their participation in this study to share with elected officials and
regional planners their highest regional planning action priorities: 1) work to solve the region’s
traffic congestion; 2) work to make the region’s educational system the best it can be, 3) work to
bring high quality jobs to the region, 4) work to make the region a stronger magnet for “brain gain”
and stem the tide of “brain drain” and 5) take care of the region’s natural environment.
Perhaps the most illuminating finding of this study is the consistency of priorities across the
entire geography of the region. There are small differences of opinion here and there, but they are
far more likely to be driven by ideological difference than by where people live. This is important
because it was the goal of this study to identify basic values and priorities that are commonly held
throughout the region, and therefore constitute sound planning elements, rather than focus on areas
where there may be greater controversy. If anything, this survey begins to dispel the long-held
notion among some that the residents of our many Hampton Roads communities are more defined
by their differences than by the similarities in their values and desires.
In summary, this study provides clear guidance to elected officials and regional planners. It
suggests that they will not only not be punished by citizens for collaborating more purposefully on
issues of importance to the entire region, but that they will in fact be encouraged and more
respected by citizens when they do so.
It is often said that Hampton Roads is a unique region. The results of this study tell us, however,
that while there may be challenges imposed upon our region by complex intersections of land and
water, by rivers and bays that divide us as much as they unite us, and by the imposition of
competing independent municipalities, the residents of Hampton Roads would rather that its leaders
find ways to turn the attributes that often threaten to weaken us instead into advantages and use
them to propel the region boldly into the future.

ENVISION HAMPTON ROA DS
5 | P a g e
Recommendations to the Planning District Commission
This study demonstrates that a regional vision and action on that regional vision is not only
viable, but also wanted by citizens. Based on these findings, we recommend that the HRPDC
continue with the planning process for which this study was the first step, including using the input
from this study to develop a “preferred” regional vision, using that vision to develop
implementation strategies and finally, develop plans for funding and completing the implementation
of the vision.
Armed with the findings from this study, the Hampton Roads Planning District Commission is
in a special position. Some of the guiding values and specific planning actions preferred by the
citizens of the region fall within the purview of the Commission. Others do not, but still deserve
attention. Accordingly, we recommend that HRPDC:
1. Become the clearinghouse for regional issues, using its resources and contacts to make sure
that important issues that are not within the Commission’s purview receive adequate
attention and are addressed by the organizations that are the most logical places for these
issues to be addressed.
2. Take advantage of its position as the clearinghouse for regional issues to provide
information and insight to its board members that enable them to be confident, forward-
thinking leaders who can draw and demonstrate connections between the needs of the
region, the wishes of their constituents and their actions.
3. Focus its resources on not only addressing its mandated state and federal requirements, but
also identifying innovative ways to address the region’s opportunities and challenges as they
apply to:
a. Creating a seamless and smoothly operating regional network of transportation
resources.
b. Taking a leadership position in addressing large issues, such as sea level rise, that
touch all of the communities of the region.
c. Supporting world-class public education resources for all learners.
d. Providing information that enables the region’s economy to grow and diversify.
e. Coordinating the development of circumstances that make the region a globally
competitive magnet for innovators in commerce, science and technology, education
and the arts.
f. Providing information and resources that enable the region’s elected leaders and
managers to be more confident embracing new ways of looking at challenges and
opportunities.

ENVISION HAMPTON ROA DS
6 | P a g e
2. Study Background
The Hampton Roads Planning District Commission (HRPDC) is charged with developing a
strategic plan for the region on a periodic basis. The HRPDC staff in consultation with elected
officials, municipal managers and other government and institutional stakeholders has
traditionally carried out this charge. In 2013, based on the emerging best practices of regions that
have been successful in developing highly effective strategic plans, the decision was made to
include residents and other stakeholders in the planning process. In doing so, HRPDC recognized
that no regional vision would be successful without:
Broad public support.
Collaboration between nonprofits, government, citizens, institutions and other
stakeholders.
Preserving what the region considers special.
Assessing the region’s values and expectations.
This initiative has become known as Envision Hampton Roads. The first step in this process
was an assessment of the values and aspirations of the region’s citizens and other stakeholders.
Values are important because:
They are stable and enduring, the undercurrent to everything else.
Recognition of common values creates affinity and consensus among diverse groups.
A sustainable region requires satisfying the values, hopes and dreams of present and
future residents.
Following a series of “listening sessions” with citizens and groups throughout the region, a
scientifically valid quantitative survey was conducted to test and verify the hypotheses developed
based on the listening sessions and provide an accurate statistical “snapshot” of the region’s
values.
ENVISION HAMPTON ROA DS
7 | P a g e
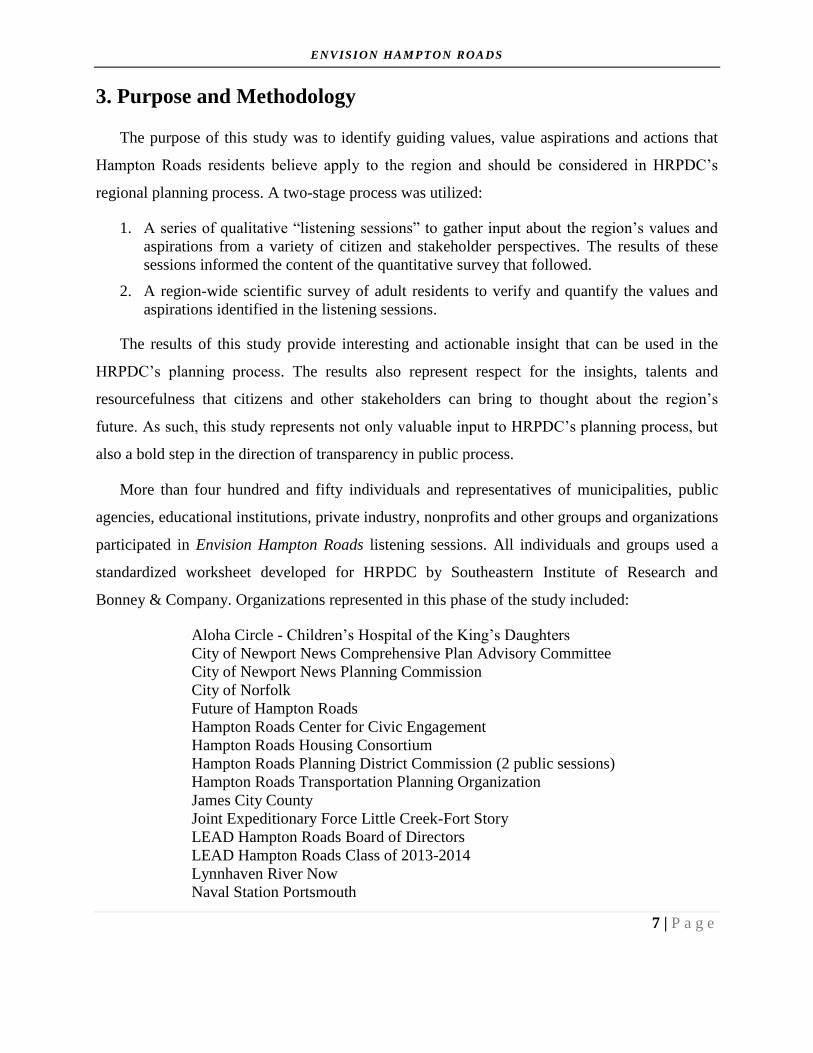
3. Purpose and Methodology
The purpose of this study was to identify guiding values, value aspirations and actions that
Hampton Roads residents believe apply to the region and should be considered in HRPDC’s
regional planning process. A two-stage process was utilized:
1. A series of qualitative “listening sessions” to gather input about the region’s values and
aspirations from a variety of citizen and stakeholder perspectives. The results of these
sessions informed the content of the quantitative survey that followed.
2. A region-wide scientific survey of adult residents to verify and quantify the values and
aspirations identified in the listening sessions.
The results of this study provide interesting and actionable insight that can be used in the
HRPDC’s planning process. The results also represent respect for the insights, talents and
resourcefulness that citizens and other stakeholders can bring to thought about the region’s
future. As such, this study represents not only valuable input to HRPDC’s planning process, but
also a bold step in the direction of transparency in public process.
More than four hundred and fifty individuals and representatives of municipalities, public
agencies, educational institutions, private industry, nonprofits and other groups and organizations
participated in Envision Hampton Roads listening sessions. All individuals and groups used a
standardized worksheet developed for HRPDC by Southeastern Institute of Research and
Bonney & Company. Organizations represented in this phase of the study included:
Aloha Circle - Children’s Hospital of the King’s Daughters
City of Newport News Comprehensive Plan Advisory Committee
City of Newport News Planning Commission
City of Norfolk
Future of Hampton Roads
Hampton Roads Center for Civic Engagement
Hampton Roads Housing Consortium
Hampton Roads Planning District Commission (2 public sessions)
Hampton Roads Transportation Planning Organization
James City County
Joint Expeditionary Force Little Creek-Fort Story
LEAD Hampton Roads Board of Directors
LEAD Hampton Roads Class of 2013-2014
Lynnhaven River Now
Naval Station Portsmouth

ENVISION HAMPTON ROA DS
8 | P a g e
National Station Oceana
Naval Station Norfolk
Naval Station Northwest Annex
Naval Station Yorktown
Regional Environmental Committee
Senior Services of Southeastern Virginia
Seventh Point, Inc. (Advertising & Public Relations)
Surry County Planning Commission
U.S. Coast Guard Portsmouth
Based on the results of the listening sessions, a survey questionnaire was developed by
HRPDC and the Wason Center for Public Policy at Christopher Newport University. Beginning
on April 4 an ending on April 17, a total of 1,216 interviews were conducted with adult Hampton
Roads residents by the Wason Center for Public Policy Survey Research Lab. Qualified
participants in this survey were adult residents of the following Hampton Roads cities and
counties that make up the Hampton Roads Planning District Commission jurisdiction:
Cities Counties
Chesapeake Gloucester
Franklin Isle of Wight
Hampton James City
Newport News Southampton
Norfolk Surry
Poquoson, York
Portsmouth
Suffolk
Virginia Beach
Williamsburg
A dual sample frame was utilized to include landline and cellular phone sampling, and all
landline and cellular telephone numbers in the sample had an equal opportunity of being called.
Post data collection iterative weighting on race, sex, age, and locality of residence was used to
reflect the known demographics of the adult population of Hampton Roads. A total of 636
landline interviews and 580 cellular phone interviews (defined as those who were contacted on
their cell phones and the interview was completed on their cell phones) were conducted.
Potential respondents were contacted through random digit dialing (RDD), and interviews
averaged 13 minutes. Up to five attempts were made on each randomly dialed number. This
emphasis on callbacks improves the accuracy by including often hard-to-reach respondents.

ENVISION HAMPTON ROA DS
9 | P a g e
The survey was conducted between April 4 and April 17, 2014. We are not aware of any
circumstances in the region during this time we believe would have biased the outcome of the
survey in any way.
All results from this study are subject to possible sampling variances. The most important
factor controlling tolerance is the size of the sample, or number of interviews on which the
results are based, and as a rule the larger the sample the more stable and reliable the responses.
Small differences between percentages are seldom significant. The margin of error for the full
sample of 1,216 respondents is plus or minus 2.9 percentage points at the 95% level of
confidence. This means that for any given topline percentage we can be 95% confident that the
true population percentage is with plus or minus 2.9% of this result. The margin of error for
portions of the full sample would be higher, and would depend upon the size of that portion of
the sample. For instance, the sample includes 607 respondents who are male. Any topline
analysis of only male respondents would carry a margin of error of plus or minus 4.0 percentage
points at the 95% level of confidence.

ENVISION HAMPTON ROA DS
10 | P a g e
4. Regional Planning: Guiding Values and Actions
The survey finds that the majority of the region’s residents would prefer that Hampton Roads
be more open to change than they believe it is today. However, short of indications of greater
proactivity from public officials and agencies—particularly greater cooperation and
collaboration between the region’s localities—only a third of residents of the region believe
unconditionally that the region will be in any better condition in ten years than it is today. The
majority are divided in their expectation of whether the region’s population will stay the same or
increase. However, the majority believe that the number of jobs in the region will grow.
In terms of values that they believe should guide any regional planning process, Hampton
Roads residents show their greatest preference for:
Addressing important issues before they become problems.
Protecting and improving air and water quality.
Cities and counties working together toward common goals.
Making the region better than it is today.
By comparison, they felt that the region should not hold back progress to preserve the
independence of our individual cities and counties or maintain a laidback lifestyle.
In terms of specific planning actions, study participants gave their highest support for:
Commitment to the very best public education system.
Bringing in more jobs.
Creating opportunities for young people to stay and work here.
Encouraging the use of recyclable materials to reduce the burden on landfills.
Conversely, they gave their lowest support to:
Focusing more attention on urban development.
Promoting a suburban lifestyle.
Bringing more military to the area.
Bringing professional sports to the area.

ENVISION HAMPTON ROA DS
11 | P a g e
4.1. Discussion of the Findings
The survey results shown in Table 1 are among the most telling in the way Hampton Roads adults
think of the region today and the way they would like the region to be in the future.
When asked about the region’s current predisposition to embrace change, fewer than half (45%) of
respondents believe the region currently has a predisposition to either embrace or thrive on change.
Roughly four-in-ten (39%) say the region is merely comfortable with change. One-in-six (15%)
study participants believe the region is defined by a resistance to change.
But that the region may have a strong inclination to accept the status quo or resist change does not
mean that the region is without ambitions. When asked what they would like the region to be more
like in the future, two-thirds (67%) of respondents said they would like Hampton Roads to be a
place that embraces and thrives on change.
Table 1.
The Region’s Predisposition to Change
And Change Aspiration
Percentage
Want to be Point
Now more like Change
A place where nothing changes 15% 10% - 5
A place comfortable with change 39 20 -19
A place that embraces change 32 43 +11
A place that thrives on change 13 24 +11
Don’t know/no answer 2 3 + 1
Base: 1,216 = 100%

ENVISION HAMPTON ROA DS
12 | P a g e
When asked to rank the importance of various guiding values or regional planning, the 1,216
Hampton Roads adults taking part in this study showed their greatest preference for the
following:
Addressing important issues before they become problems.
Have cities and counties work together toward common goals.
Protecting and improving air and water quality.
Make the region better than it is today.
Least important were:
Preserving the independence of our individual cities and counties.
Maintaining a laidback lifestyle.
Table 2.
Guiding Values for Regional Planning
Very Somewhat Not very Not at all
Important Important Important Important
Addressing importance
issues before they
become problems. 85% 12% 1% 2%
Having cities and counties in
the region work together
toward common goals. 80 17 2 1
Protecting and improving
air and water quality. 79 16 4 1
Making the region better
than it is today. 77 21 2 -
Making our region affordable
affordable for people
at all income levels. 73 21 4 2
Involving citizens more in
public decision-making. 71 25 3 1
Being open to new ways of
dealing with problems. 69 29 1 1
Preserving the independence
of our individual cities
and counties. 43 37 14 6
Maintaining a
laid back lifestyle. 34 42 20 4
Base: 1,216 = 100%

ENVISION HAMPTON ROA DS
13 | P a g e
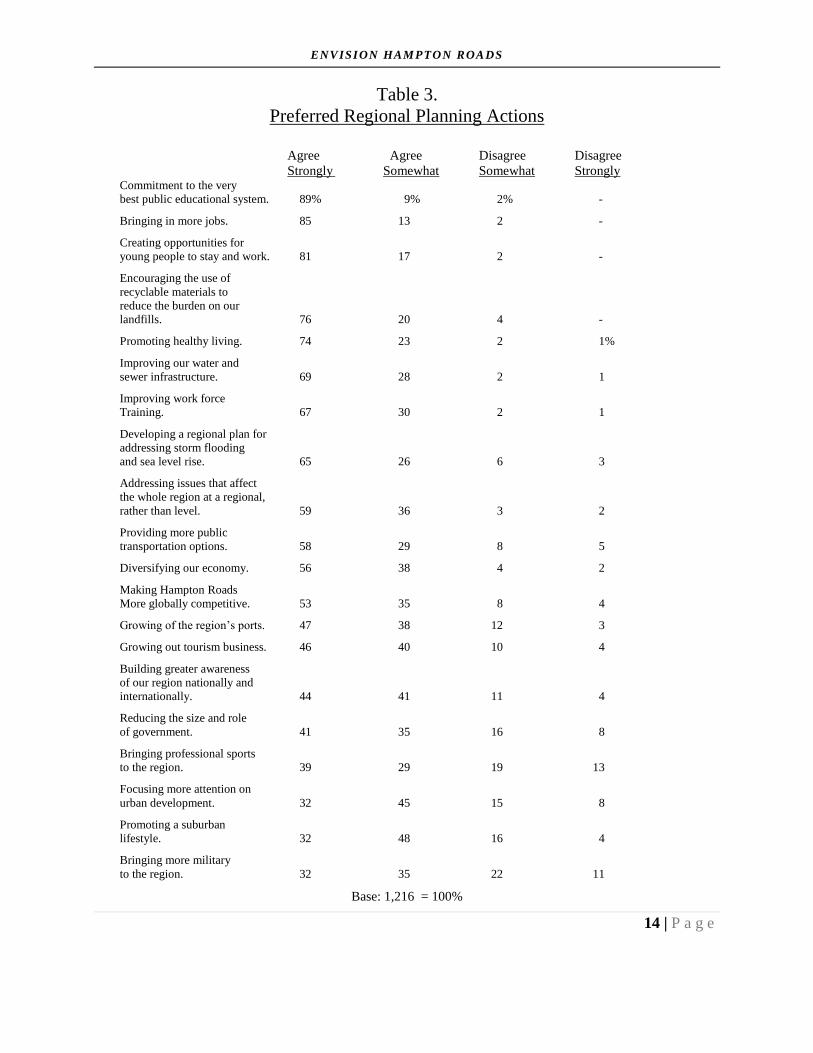
Table 3, on the following page, shows that when asked to indicate their level of agreement with a
variety of regional planning actions, study participants gave their highest agreement to:
Commitment to the very best public education system.
Bringing in more jobs.
Creating opportunities for young people to stay and work.
Encouraging the use of recyclable materials to reduce the burden on landfills.
Conversely, they gave the least agreement to:
Focusing more attention on urban development.
Promoting a suburban lifestyle.
Bringing more military to the area.
Bringing professional sports to the area.
[Continued on following page.]
ENVISION HAMPTON ROA DS
14 | P a g e
Table 3.
Preferred Regional Planning Actions
Agree Agree Disagree Disagree
Strongly Somewhat Somewhat Strongly Commitment to the very
best public educational system. 89% 9% 2% -
Bringing in more jobs. 85 13 2 -
Creating opportunities for
young people to stay and work. 81 17 2 -
Encouraging the use of
recyclable materials to
reduce the burden on our
landfills. 76 20 4 -
Promoting healthy living. 74 23 2 1%
Improving our water and
sewer infrastructure. 69 28 2 1
Improving work force
Training. 67 30 2 1
Developing a regional plan for
addressing storm flooding
and sea level rise. 65 26 6 3
Addressing issues that affect
the whole region at a regional,
rather than level. 59 36 3 2
Providing more public
transportation options. 58 29 8 5
Diversifying our economy. 56 38 4 2
Making Hampton Roads
More globally competitive. 53 35 8 4
Growing of the region’s ports. 47 38 12 3
Growing out tourism business. 46 40 10 4
Building greater awareness
of our region nationally and
internationally. 44 41 11 4
Reducing the size and role
of government. 41 35 16 8
Bringing professional sports
to the region. 39 29 19 13
Focusing more attention on
urban development. 32 45 15 8
Promoting a suburban
lifestyle. 32 48 16 4
Bringing more military
to the region. 32 35 22 11
Base: 1,216 = 100%

ENVISION HAMPTON ROA DS
15 | P a g e
5. Sense of Place
A necessary step in the process of identifying and measuring guiding values and action
priorities for regional planning was identifying and measuring how residents of Hampton Roads
feel about their region and how much they identify with it, or not. The findings of this study
address this information need and additionally remind those who have become so accustomed to
some of our region’s defining characteristics—particularly our natural assets—that we fail to
notice how much they contribute to what defines Hampton Roads and differentiates it from other
regions.
The series of informal “listening sessions” that kicked off Envision Hampton Roads revealed
that what Hampton Roads residents believe most defines and differentiates Hampton Roads from
other regions is its variety of waters, its rich history, its diverse population and, above all, its
significant military presence. Listening session participants also observed that Hampton Roads is
a region where a casual coastal lifestyle masks a resistance to change and a predisposition among
its local governments to go it alone when cooperation and collaboration could be more efficient
and effective. Finally, some noted that while the region is rich in knowledge, talent and
experience, it lacks the capacity to move bold ideas from concept to action.
The listening sessions reveal, however, that Hampton Roads is a region with ambition. The
most frequently mentioned aspiration among the more than four hundred and fifty people who
took part in the listening sessions is that they want Hampton Roads to be better, while protecting
the attributes that make our region so pleasing today.
The quantitative survey of 1,216 adults throughout the region provided an interesting and
statistically valid reflection of how Hampton Roads residents look upon themselves and the
region.
The overwhelming majority of respondents say they identify with “Hampton Roads”
region. Fewer than one-in-ten disavow personal membership in the regional
community.
When asked where they tell people they are from when they are traveling away from
the area, most—including those from the further reaches of the region—say they tell
people they are from “Virginia Beach.”

ENVISION HAMPTON ROA DS
16 | P a g e
“Hampton Roads” is clearly the most used identifier among those who make reference
to being from the region rather than a specific place within it.
Almost all respondents—including those from Virginia Beach—were more likely to
say they are from “Hampton Roads” than they were to mention the specific
municipality where they live.
Among those who made references to the region rather than to a specific municipality,
mentions of “Hampton Roads” far outweighed other regional identifiers such as
“Southeast Virginia, “Virginia Beach/Norfolk” or “Norfolk/Virginia Beach.” (“Coastal
Virginia” was mentioned by fewer than ½ of 1% of respondents.)
What residents of the region value most about the region are our natural assets: our beaches
and waters and our comfortable climate. When asked where they would focus their attention if
given the power to change anything in the region, survey respondents mentioned a variety of
issues they would like to address, but focused their most attention on:
Addressing traffic condition.
Creating more jobs and a stronger economy.
Reducing crime.
Given their feelings about issues such as these, study participants are interestingly divided in
their expectations of the region’s future:
Roughly as many believe the region’s future will be better as believe it will not
change. (One-in-five believe the region will be worse in ten years than it is today.)
They are similarly divided in their expectation of whether the region’s population will
stay the same or increase. (Very few believe the population will decrease.)
The overwhelming majority, however, believe there will be more jobs in the region in
ten years. (We cannot diagnose the logic behind this expectation, but suspect it has
more to do with hope than with any specific knowledge about the workforce or
employment market.)

ENVISION HAMPTON ROA DS
17 | P a g e
5.1. Discussion of the Findings: Qualitative “Listening Sessions”
The “listening sessions” that informed the design of the quantitative survey involved many
different kinds of groups, included a wide array of perspectives and took place in a variety of
locations throughout the region. Some were facilitated by members of the Envision Hampton
Roads project team. Others were self-directed or facilitated by group members.
All of the sessions used a standardized list of questions. Some participants were initially
inclined to answer the questions from the perspective of specific issues—e.g. traffic, sea level
rise, etc.—before getting to the underlying values they believe define Hampton Roads and set it
apart from other regions. Once focused, however, nearly all listening session participants found
them engaged in what they felt was both an interesting, useful and important civic conversation.
The four questions asked in all listening sessions were:
1. What community values or characteristics do you think have historically best described
our Hampton Roads region?
2. Which of these set Hampton Roads apart from other parts of the country?
3. What community values or characteristics would you like Hampton Roads to be more
associated with in the future?
4. Of the values mentioned, which demonstrate, or could demonstrate “our best self” as a
region?

ENVISION HAMPTON ROA DS
18 | P a g e
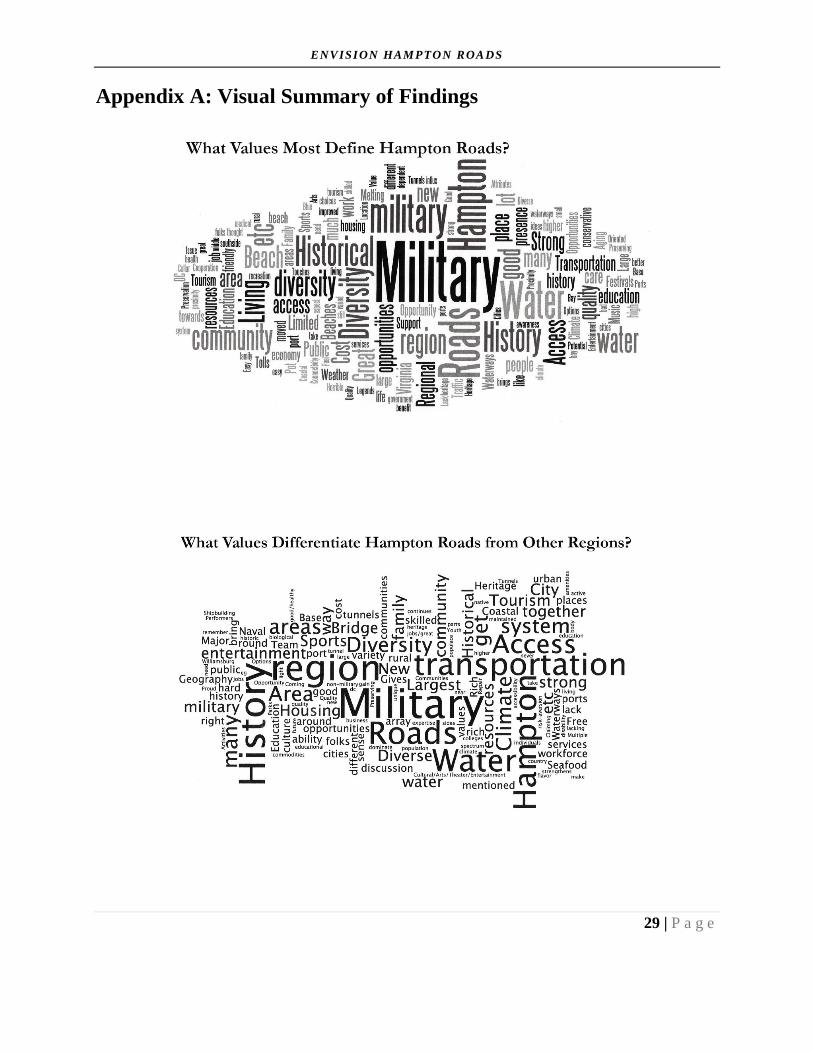
5.1.1 Values that Define Hampton Roads
What community values or characteristics do you think have historically best described our
Hampton Roads region?
The word cloud below provides a visual summary of the answers to this question, using the
size of words to indicate their frequency of mention. There are few surprises. Above all, listening
session participants associate Hampton Roads with the military and its attendant values of
patriotism and nationalism.
Other values and characteristics associated with our region are:
Water
History
Comfortable living
Community
Diversity
Beach
Region
ENVISION HAMPTON ROA DS
19 | P a g e
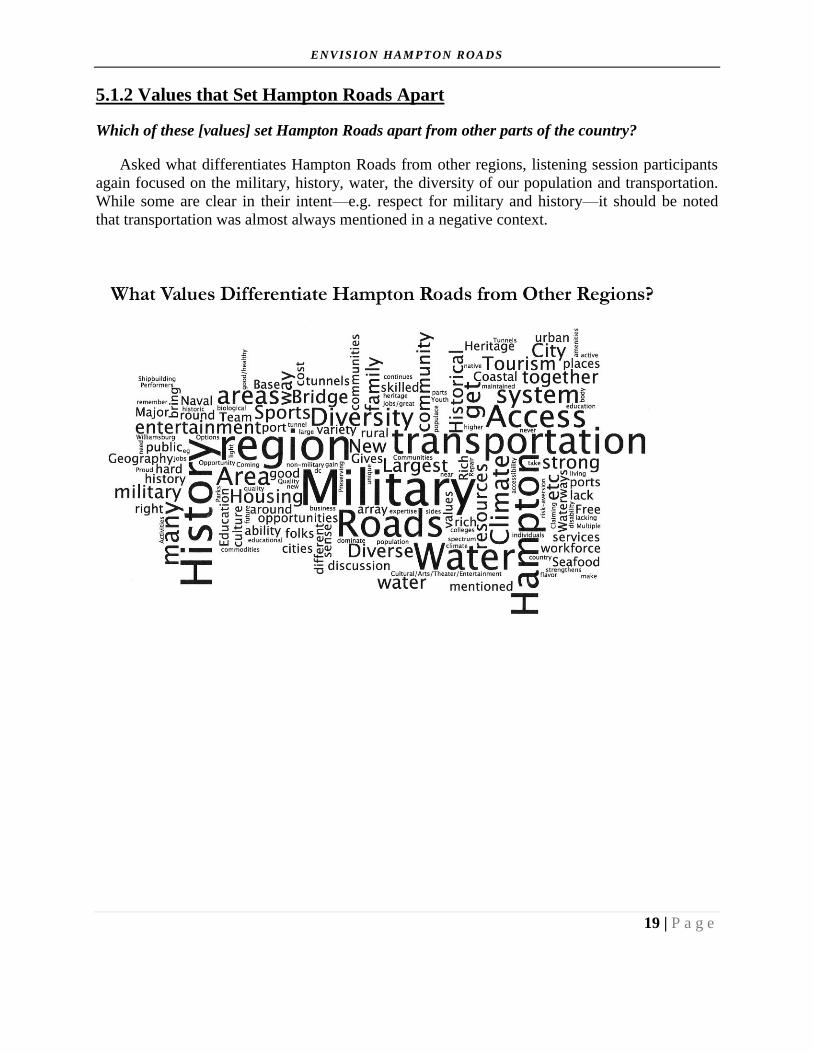
5.1.2 Values that Set Hampton Roads Apart
Which of these [values] set Hampton Roads apart from other parts of the country?
Asked what differentiates Hampton Roads from other regions, listening session participants
again focused on the military, history, water, the diversity of our population and transportation.
While some are clear in their intent—e.g. respect for military and history—it should be noted
that transportation was almost always mentioned in a negative context.

ENVISION HAMPTON ROA DS
20 | P a g e
5.1.3. Values to Which We Aspire as a Region
What community values or characteristics would you like Hampton Roads to be more
associated with in the future?
What are Hampton Roads’ aspirations? What would we like the region to be more like?
Listening session participants were quick to point to attributes they would like to see more of
in our region. The common thread, as indicated by the size of the most mentioned value, is the
desire for the region to be BETTER. Specifically, study participants:
Believe the region must come to terms with addressing its transportation problems.
Believe there must be greater cooperation among municipalities and public agencies
that service our region.
Expect quality education.
Value a diverse array of occupation and lifestyle attributes, including respect for
technology and for sports and cultural life.
Understand that they are part of a region. But they are reluctant to let go of the
aspects of local life that they believe strengthen the social fabric of local
communities.

ENVISION HAMPTON ROA DS
21 | P a g e
5.1.4. Values that Define Our “Best Self” as a Region
Of the values mentioned, which demonstrate, or could demonstrate “our best self” as a
region?
What do we believe represents our “best selves” in Hampton Roads? What is most worth
protecting as the region moves forward?
Compared to the previous word clouds, the word cloud below shows that with just a few
exceptions Hampton Roads residents are extremely fragmented in their conceptions of what
values and characteristics define our region’s “best self.”
Elements mentioned frequently include:
The military
Education
The environment
Diversity
History
One additional element, transportation, is featured prominently in this word cloud. Its
presence constitutes something of a quandary, given the prior mentions of roads and
transportation were made in negative contexts. However, closer review of listening session
participants’ comments finds that prominent mention of roads and transportations is more a
reflection of the belief that transportation conditions can be better rather than the conviction that
currently congested roadways, bridged and tunnels are something of which people are proud.

ENVISION HAMPTON ROA DS
22 | P a g e
5.2. Discussion of Findings: Quantitative Survey
The results that follow come from a quantitative survey that interviewed 1,200 Hampton
Roads adults. The survey was designed to be a regional “statistical snapshot” of perceptions,
preferences and opinions. As such, the results are presented as a single, Hampton Roads region.
Analysis of the findings has been done to explore differences in perceptions based on common
demographic characteristics. However, for the purpose of this report the results are not presented
on a municipality-by-municipality basis, nor contrasting Peninsula with South Hampton Roads.
The sample size does not support a deeper and confident level of analysis for each municipality.
Also, since the purpose of the survey was to take a regional snapshot, presentation of the findings
at a lower-than regional geographic level undermines the concept of a single regional perspective
and encourages the examination of values that create differences over than values that unite and
connect.

ENVISION HAMPTON ROA DS
23 | P a g e
5.2.1. How We View Hampton Roads
There is perhaps no greater or more controversial question asked locally than “What do we
call our region?” This survey does not add to the controversy by asking that question. Instead it
provides more telling insight into how residents describe this region by asking them first where
they tell people they are from when they are traveling throughout the United States.
What is perhaps most important to note in Table 4, below, is that when asked where they tell
people they are from, as many Hampton Roads residents name a specific locality—usually the
one in which they live—as use any kind of larger geographic identifier.
In terms of “regional” identification, just under one-in-five (17%) respondents said that if they
were traveling outside of the region and were asked where they are from, they would say
“Hampton Roads.” This is more than twice as many as mentioned “Tidewater” or the more
recently proposed “Norfolk/Virginia Beach.” (There were no mentions of “Coastal Virginia.”)
Table 4.
What Do You Call Where You’re From?
Virginia Beach area 20%
Hampton Roads 17
Virginia (unspecified) 14
Norfolk Area 6
Newport News 6
Tidewater 5
Williamsburg 5
Chesapeake 4
Southeast Virginia 4
Hampton Area 3
Suffolk 2
Portsmouth 2
Norfolk/Virginia Beach 1
East Coast 1
Other* 10
Base = 100% 1,216
* Other includes responses mentioned by fewer than ½ of 1% of respondents.

ENVISION HAMPTON ROA DS
24 | P a g e
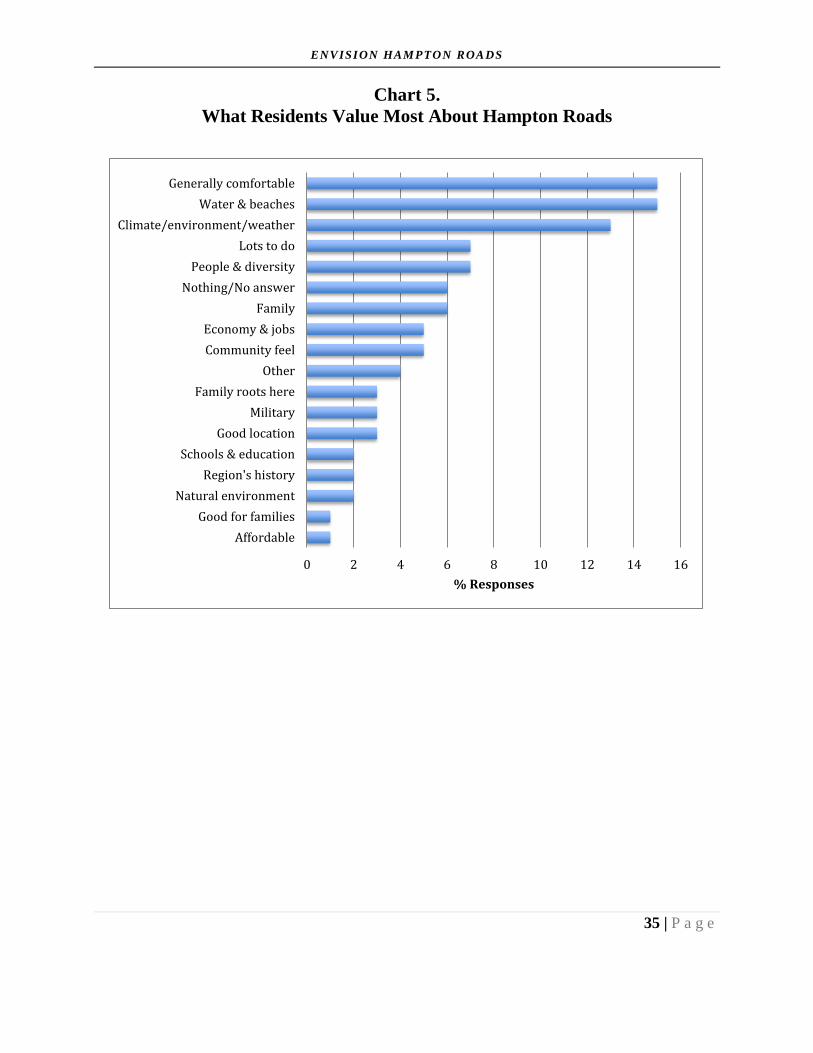
When asked what one thing they value most about Hampton Roads, what is first noticeable about
the responses to this question is how few responses receive anything approaching a meaningful
number of mentions. Table 5 shows that the three characteristics of our region most valued by
Hampton Roads residents are:
Water and beaches
Generally comfortable place
Climate/environment/weather
These responses are not unexpected. However, no single answer was mentioned by more than
15% of respondents. Furthermore, beyond the top three items, the list of responses is short on
specific attributes that set Hampton Roads from many other places, and almost none have
anything to do with the characteristics of people living in the region.
Table 5.
What Do You Value Most about Hampton Roads?
Water and beaches 15%
Generally comfortable place 15
Climate/environment/weather 13
People and diversity 7
Lots to do 7
Family 6
Community feel 5
Economy & jobs 5
Good location 3
Military 3
Family has roots here 3
Natural environment 2
Region’s history 2
Schools and education 2
Affordable 1
Good for families 1
Other* 4
Nothing/no answer 6
Base = 100% 1,216
* Other includes responses mentioned by fewer than ½ of 1% of respondents.
ENVISION HAMPTON ROA DS
25 | P a g e
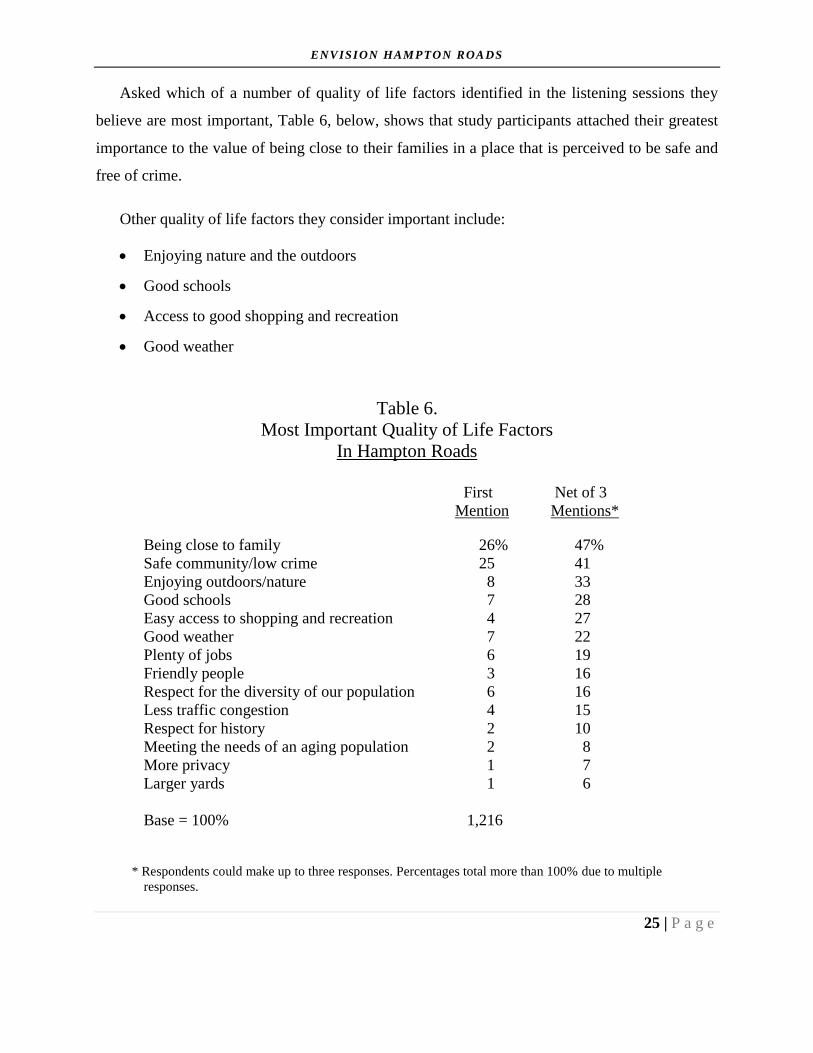
Asked which of a number of quality of life factors identified in the listening sessions they
believe are most important, Table 6, below, shows that study participants attached their greatest
importance to the value of being close to their families in a place that is perceived to be safe and
free of crime.
Other quality of life factors they consider important include:
Enjoying nature and the outdoors
Good schools
Access to good shopping and recreation
Good weather
Table 6.
Most Important Quality of Life Factors
In Hampton Roads
First Net of 3
Mention Mentions*
Being close to family 26% 47%
Safe community/low crime 25 41
Enjoying outdoors/nature 8 33
Good schools 7 28
Easy access to shopping and recreation 4 27
Good weather 7 22
Plenty of jobs 6 19
Friendly people 3 16
Respect for the diversity of our population 6 16
Less traffic congestion 4 15
Respect for history 2 10
Meeting the needs of an aging population 2 8
More privacy 1 7
Larger yards 1 6
Base = 100% 1,216
* Respondents could make up to three responses. Percentages total more than 100% due to multiple
responses.

ENVISION HAMPTON ROA DS
26 | P a g e
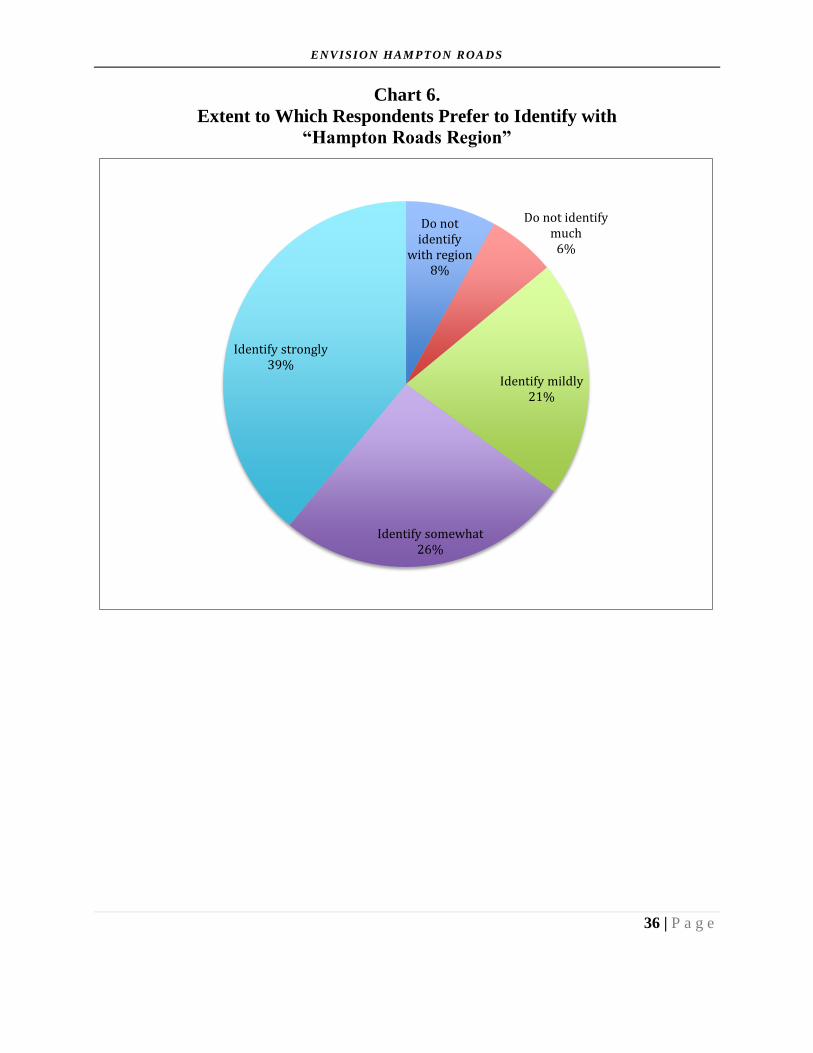
No matter what they call this region, the results of this survey make it clear that the
majority of the region’s adults identify with the region. Table 7, below, shows that nearly four-
in-ten (39%) Hampton Roads adults “identify strongly” with the Hampton Roads region.
Roughly two-thirds (65%) identify with the region to some extent, and only a small percentage
of respondents--8%, or fewer than one-in-ten—say they specifically do not identify with the
region.
Table 7.
Extent to Which the Region’s Residents Prefer to
Identify with the “Hampton Roads Region,” or Not
(Five-point scale)
1 – Do not identify with region 8%
2 6
3 21
4 26
5 – Identify strongly with region 39
Base = 100% 1,216

ENVISION HAMPTON ROA DS
27 | P a g e
5.2.2. Looking to the Future
Slightly more than a third (38%) of Hampton Roads residents are confident enough to say
that the region will be better ten years from now. They vastly outnumber the 21%, or one-fifth,
of adults who believe the region will be in worse condition ten years from now. That almost all
of the remainder—roughly four-in-ten (39%) of respondents—believe conditions will be
unchanged in ten years indicates that net expectations of the region, while not overwhelmingly
negative, are neither overwhelming positive.
Table 8.
How Will Hampton Roads Be in Ten Years?
Better 38%
Worse 21
About the same 39
Don’t know 2
Base = 100% 1,216
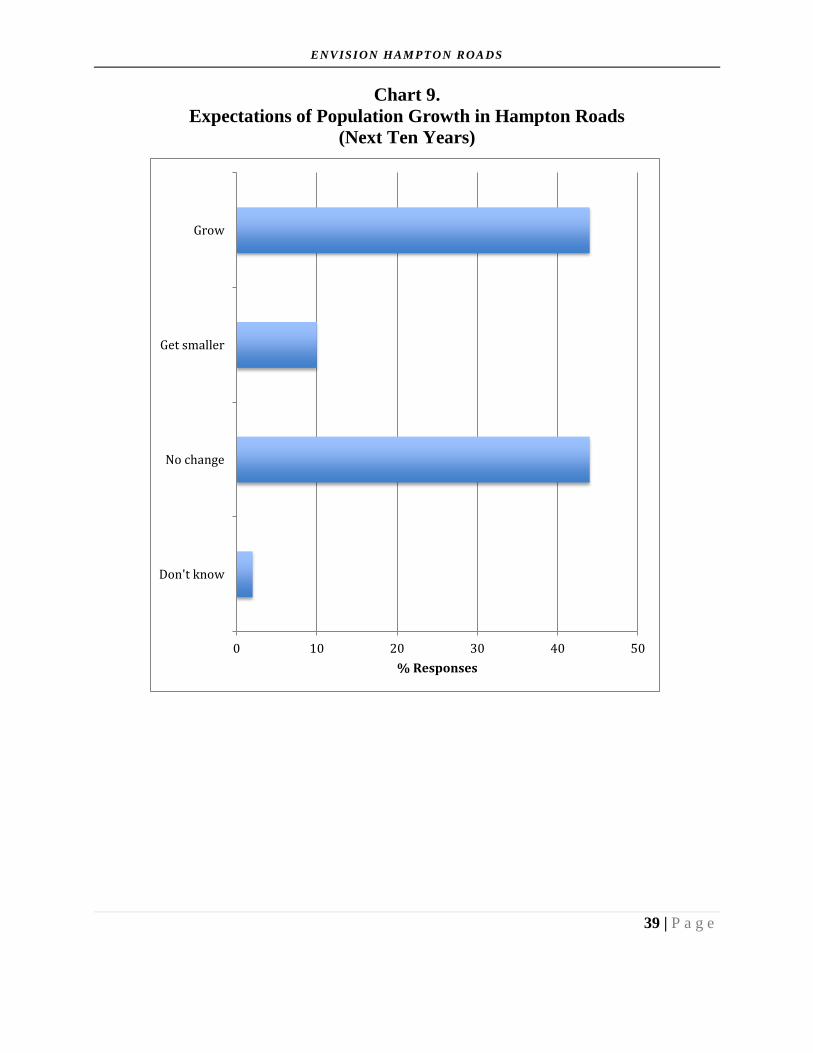
More specifically, just over four-in-ten (44%) Hampton Roads residents believe the
population of the region will increase in the next ten years, compared to the one-in-ten (10%)
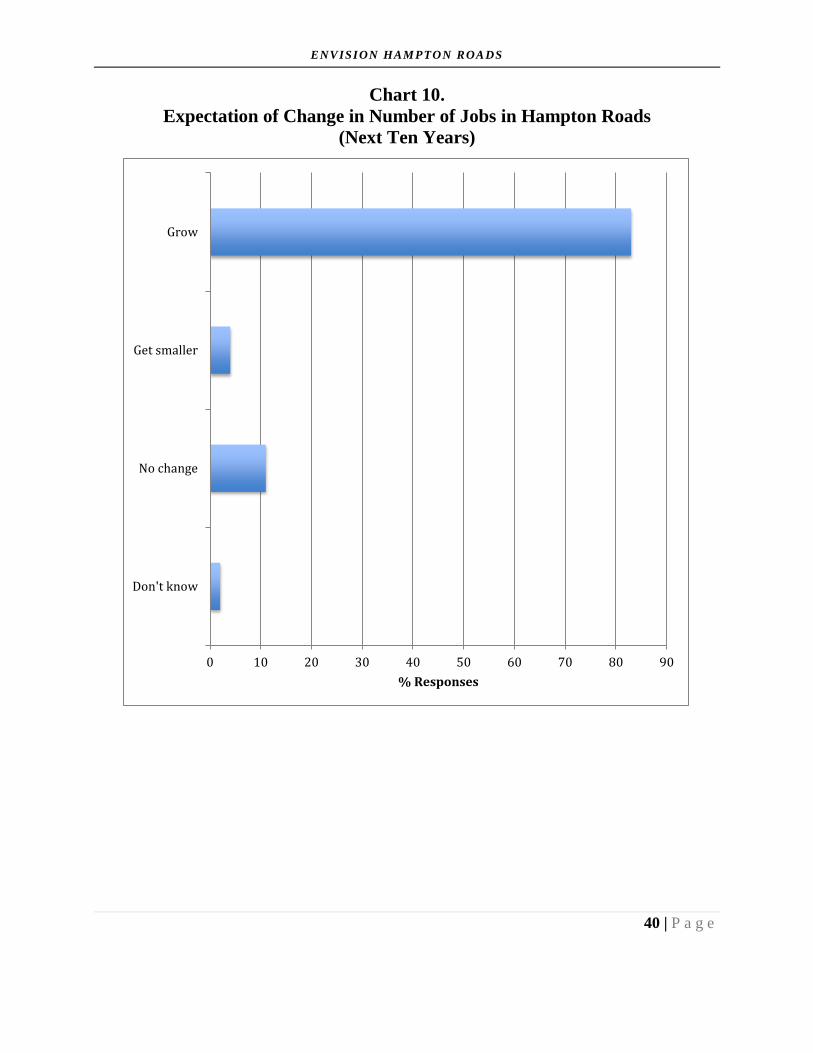
who believe it will decrease. There is little disagreement, however, with respect to the
employment outlook in the coming decade. Whether out of specific knowledge or merely wishful
thinking, the overwhelming majority (83%) of Hampton Roads residents interviewed believe that
the number of jobs in the region will increase over the next ten years. Only 4%--fewer than one-
in-twenty—believe the number of jobs in the region will decrease.
Table 9.
Expectations of Growth (Next Ten Years)
Population Jobs
Increase 44% 83%
Decrease 10 4
No change 44 11
Don’t know 2 2
Base = 1,216 100% 100%

ENVISION HAMPTON ROA DS
28 | P a g e
5.2.3. Making the Region Better
When respondents were asked what one thing they would change about the Hampton Roads
region if they could, the overwhelming majority of respondents said there was at least one thing
they would like to change. The area of greatest focus was relieving traffic congestion. Just under a
third (30%) of respondents said they would address the problem of traffic congestion if they had the
power to make something happen.
The next most mentioned targets of attention were creating jobs and a stronger economy and
reducing crime. However, none of these was mentioned by more than 15% of respondents. A
number of other areas were mentioned, as well. But none was mentioned by more than 4% of
respondents. Fewer than one-in-ten (7%) said there is nothing they would change about the region.
Table 10.
The One Thing You Would Change
(If You Could)
Less traffic congestion 30%
More jobs/stronger economy 15
Less crime 11
Better education 4
Less government 4
Stronger community 4
More public transportation 4
Better government 3
Less development 2
More culture, entertainment & shopping 2
More regionalism 2
More/better public service 2
Professional sports 2
More environmental consciousness 1
More affordable 1
Nothing 7
Other* 8
Base = 100% 1,216
* Other includes responses mentioned by fewer than ½ of 1% of respondents.
ENVISION HAMPTON ROA DS
29 | P a g e
Appendix A: Visual Summary of Findings

ENVISION HAMPTON ROA DS
30 | P a g e

ENVISION HAMPTON ROA DS
31 | P a g e
Chart 1.
Hampton Roads’ Attitude Regarding Change:
Current Perceptions and Preferences for the Future
0
5
10
15
20
25
30
35
40
45
50
Prefer nochange
Comfortablewith change
Embraceschange
Thrives onchange
Don't know
% R
esp
on
ses
Now
Future

ENVISION HAMPTON ROA DS
32 | P a g e
Chart 2.
Guiding Values for Regional Planning
0% 10% 20% 30% 40% 50% 60% 70% 80% 90% 100%
Preserve laid back lifestyle
Preserve locality independence
Open to new solutions
More citizen involvement
Affordability for all income levels
Make region better
Protect air & water
Greater local govt cooperation
Proactive on issues
% Responses
Very important Somewhat important Not very important Not at all important

ENVISION HAMPTON ROA DS
33 | P a g e
Chart 3.
Preferred Regional Planning Actions
0% 10% 20% 30% 40% 50% 60% 70% 80% 90%100%
Promote urban growth
Promote suburban living
Increase military presence
Professional sports
Reduce size and role of government
Create greater national awareness of HR
Grow tourism
Grow region's ports
Become more globally competitive
Diversify the economy
More public transportation options
Address regional issues at regional level
Regional Sea Level Rise Plan
Workforce training
improve water/sewer infrastructure
Promote healthy living
More recycling
Reduce "brain drain"
More jobs
Best public education
% Responses
Agree strongly Agree somewhat Disagree somewhat Disagree strongly

ENVISION HAMPTON ROA DS
34 | P a g e
Chart 4.
Where Do You Say You Are From?
0 5 10 15 20 25
Norfolk/Virginia Beach
East Coast
Virginia Peninsula
Suffolk
Portsmouth
Hampton
SE Virginia
Chesapeake
Tidewater
Williamsburg
Norfolk area
Newport News
Other
Virginia (unspecified)
Hampton Roads
Virginia Beach area
% responses
ENVISION HAMPTON ROA DS
35 | P a g e
Chart 5.
What Residents Value Most About Hampton Roads
0 2 4 6 8 10 12 14 16
Affordable
Good for families
Natural environment
Region's history
Schools & education
Good location
Military
Family roots here
Other
Community feel
Economy & jobs
Family
Nothing/No answer
People & diversity
Lots to do
Climate/environment/weather
Water & beaches
Generally comfortable
% Responses
ENVISION HAMPTON ROA DS
36 | P a g e
Chart 6.
Extent to Which Respondents Prefer to Identify with
“Hampton Roads Region”
Do not identify
with region 8%
Do not identify much
6%
Identify mildly 21%
Identify somewhat 26%
Identify strongly 39%

ENVISION HAMPTON ROA DS
37 | P a g e
Chart 7.
Most Valued Quality of Life factors in Hampton Roads
0 10 20 30 40 50
Larger yards
More privacy
Accomomdating aging population
Respect for history
Less traffic congestion
Friendly people
Respect for diversity
Plenty of jobs
Good weather
Easy access to shopping & recreation
Good schools
Enjoying outdoors
Safe community/low crime
Being close to family
% Responses

ENVISION HAMPTON ROA DS
38 | P a g e
Chart 8.
Will Hampton Roads Be a Better or Worse
Place to Live Ten Years from Now?
0 5 10 15 20 25 30 35 40 45
Don't know
About the same
Worse
Better
% Responses
ENVISION HAMPTON ROA DS
39 | P a g e
Chart 9.
Expectations of Population Growth in Hampton Roads
(Next Ten Years)
0 10 20 30 40 50
Don't know
No change
Get smaller
Grow
% Responses
ENVISION HAMPTON ROA DS
40 | P a g e
Chart 10.
Expectation of Change in Number of Jobs in Hampton Roads
(Next Ten Years)
0 10 20 30 40 50 60 70 80 90
Don't know
No change
Get smaller
Grow
% Responses

ENVISION HAMPTON ROA DS
41 | P a g e
Chart 11.
One Thing Respondents Would Change in Hampton Roads
0 5 10 15 20 25 30 35
More environmental consciousness
More affordable
Less development
More culture/entertainment/shopping
More regionalism
More/better public service
Professional Sports
Better government
Better education
Less government
Stronger Community
More public transportation
Nothing
Other
Less Crime
More jobs/stronger economy
Less traffic congestion
% Responses
ENVISION HAMPTON ROA DS
42 | P a g e
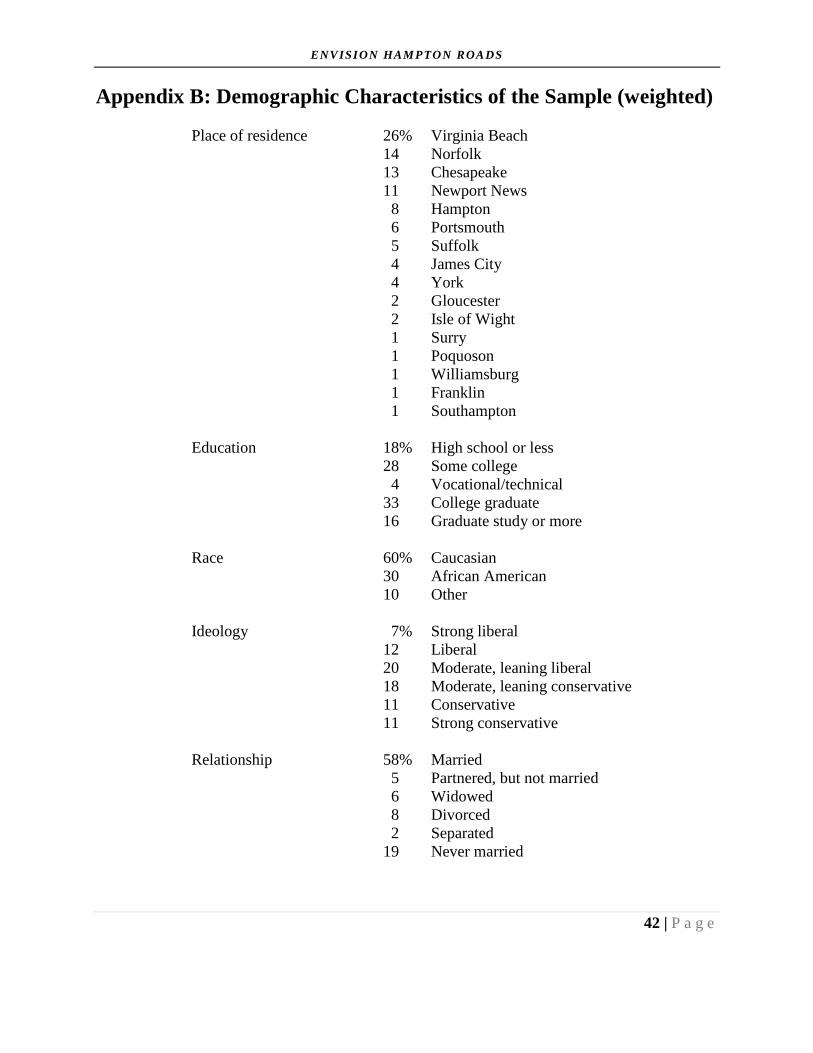
Appendix B: Demographic Characteristics of the Sample (weighted)
Place of residence 26% Virginia Beach
14 Norfolk
13 Chesapeake
11 Newport News
8 Hampton
6 Portsmouth
5 Suffolk
4 James City
4 York
2 Gloucester
2 Isle of Wight
1 Surry
1 Poquoson
1 Williamsburg
1 Franklin
1 Southampton
Education 18% High school or less
28 Some college
4 Vocational/technical
33 College graduate
16 Graduate study or more
Race 60% Caucasian
30 African American
10 Other
Ideology 7% Strong liberal
12 Liberal
20 Moderate, leaning liberal
18 Moderate, leaning conservative
11 Conservative
11 Strong conservative
Relationship 58% Married
5 Partnered, but not married
6 Widowed
8 Divorced
2 Separated
19 Never married

ENVISION HAMPTON ROA DS
43 | P a g e
Active Duty Military 15% Yes
Or Spouse 84 No
Age 16% 18 - 29
16 30 - 39
19 40 - 49
20 50 - 59
14 60 – 69
16 70 and older
Household Income 12% Under $25,000
11 $25,000 - $39, 999
9 $40,000 - $49,999
18 $50,000 - $74,999
15 $75,000 - $99,999
10 $100,000 - $124,999
5 $125,000 - $149,999
7 $150,000 or more
Gender 49% Male
51 Female
ENVISION HAMPTON ROA DS
44 | P a g e
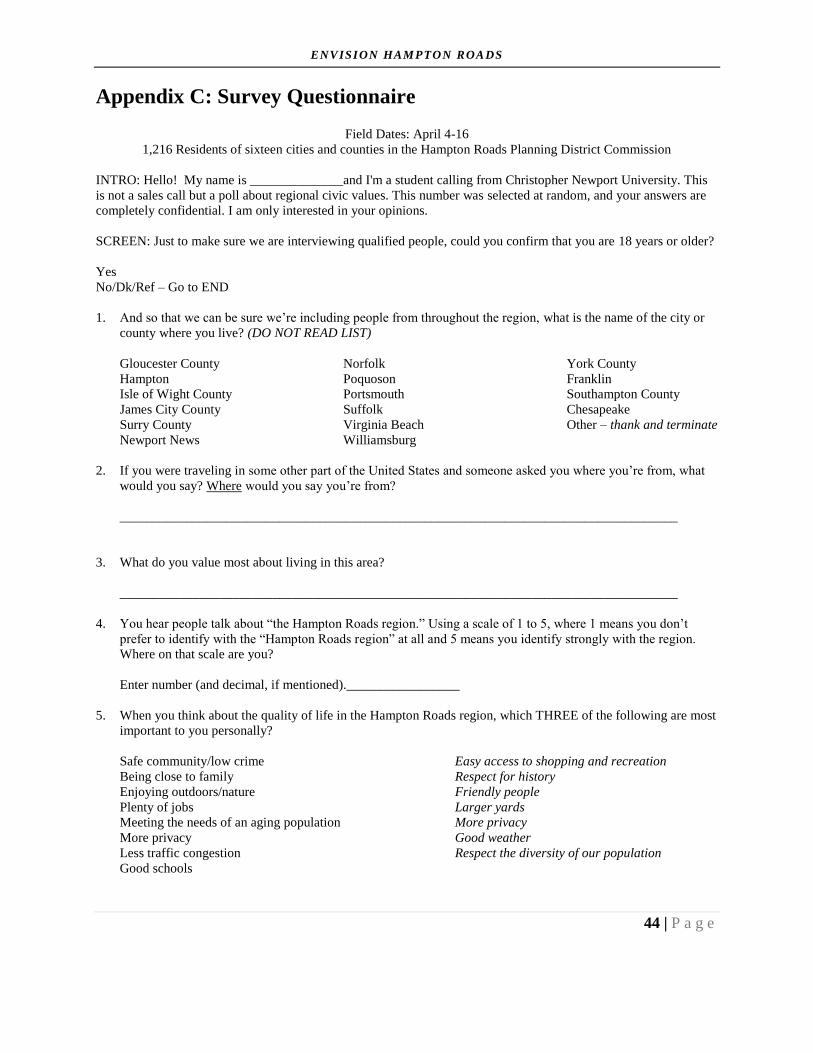
Appendix C: Survey Questionnaire
Field Dates: April 4-16
1,216 Residents of sixteen cities and counties in the Hampton Roads Planning District Commission
INTRO: Hello! My name is ______________and I'm a student calling from Christopher Newport University. This
is not a sales call but a poll about regional civic values. This number was selected at random, and your answers are
completely confidential. I am only interested in your opinions.
SCREEN: Just to make sure we are interviewing qualified people, could you confirm that you are 18 years or older?
Yes
No/Dk/Ref – Go to END
1. And so that we can be sure we’re including people from throughout the region, what is the name of the city or
county where you live? (DO NOT READ LIST)
Gloucester County
Hampton
Isle of Wight County
James City County
Surry County
Newport News
Norfolk
Poquoson
Portsmouth
Suffolk
Virginia Beach
Williamsburg
York County
Franklin
Southampton County
Chesapeake
Other – thank and terminate
2. If you were traveling in some other part of the United States and someone asked you where you’re from, what
would you say? Where would you say you’re from?
____________________________________________________________________________________
3. What do you value most about living in this area?
____________________________________________________________________________________
4. You hear people talk about “the Hampton Roads region.” Using a scale of 1 to 5, where 1 means you don’t
prefer to identify with the “Hampton Roads region” at all and 5 means you identify strongly with the region.
Where on that scale are you?
Enter number (and decimal, if mentioned)._________________
5. When you think about the quality of life in the Hampton Roads region, which THREE of the following are most
important to you personally?
Safe community/low crime
Being close to family
Enjoying outdoors/nature
Plenty of jobs
Meeting the needs of an aging population
More privacy
Less traffic congestion
Good schools
Easy access to shopping and recreation
Respect for history
Friendly people
Larger yards
More privacy
Good weather
Respect the diversity of our population

ENVISION HAMPTON ROA DS
45 | P a g e
6. When you think about Hampton Roads ten years from now, do you think it will be a better place to live, a worse
place to live, or about the same as it is now?
( ) Better
( ) Worse
( ) About the same
( ) Don’t know
7. This next question has to do with growth, by which I mean growth in population and growth in the number of
jobs. For each of these factors, please tell me whether you think the region should try to grow, get smaller or not
change at all.
Grow Get smaller No change Don’t know
Population ( ) ( ) ( ) ( )
Jobs ( ) ( ) ( ) ( )
8. If there were one thing you could change to make Hampton Roads a better place to live, what would that one
thing be?
____________________________________________________________________________________
9. Now I’m going to read several descriptions and ask you which ONE you think best describes Hampton Roads
now:
( ) A place where people would like to keep things the way they are now, or used to be.
( ) A place where people are comfortable with changes after they’ve been proven effective somewhere else
first.
( ) A place where people are open to change and believe it’s a good idea to consider new ideas and ways of
doing things.
( ) A place where people want to try out, and even be a little experimental with new ways of doing things.
10. I’m going to read through that list again, and this time, tell me which of these you’d like Hampton Roads to be
more like in the future:
( ) A place where people would like to keep things the way they are now, or used to be.
( ) A place where people are comfortable with changes after they’ve been proven effective somewhere else
first.
( ) A place where people are open to change and believe it’s a good idea to consider new ideas and ways of
doing things.
( ) A place where people want to try out, and even be a little experimental with new ways of doing things.
ENVISION HAMPTON ROA DS
46 | P a g e
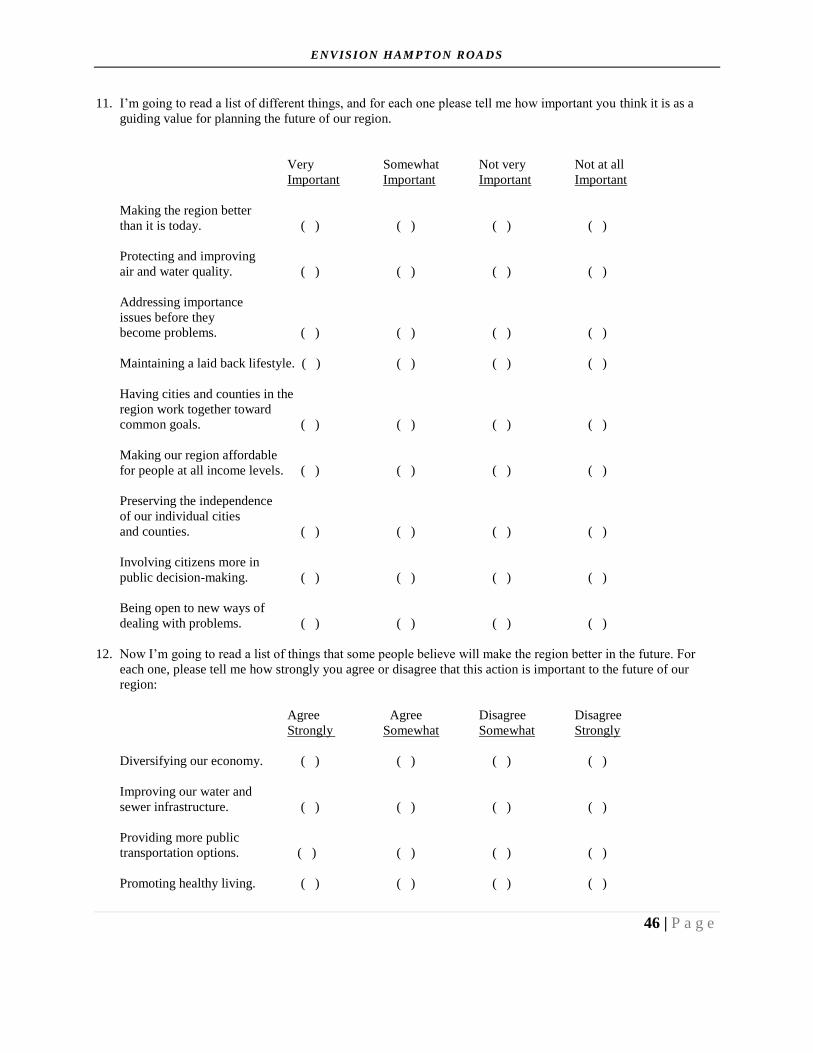
11. I’m going to read a list of different things, and for each one please tell me how important you think it is as a
guiding value for planning the future of our region.
Very Somewhat Not very Not at all
Important Important Important Important
Making the region better
than it is today. ( ) ( ) ( ) ( )
Protecting and improving
air and water quality. ( ) ( ) ( ) ( )
Addressing importance
issues before they
become problems. ( ) ( ) ( ) ( )
Maintaining a laid back lifestyle. ( ) ( ) ( ) ( )
Having cities and counties in the
region work together toward
common goals. ( ) ( ) ( ) ( )
Making our region affordable
for people at all income levels. ( ) ( ) ( ) ( )
Preserving the independence
of our individual cities
and counties. ( ) ( ) ( ) ( )
Involving citizens more in
public decision-making. ( ) ( ) ( ) ( )
Being open to new ways of
dealing with problems. ( ) ( ) ( ) ( )
12. Now I’m going to read a list of things that some people believe will make the region better in the future. For
each one, please tell me how strongly you agree or disagree that this action is important to the future of our
region:
Agree Agree Disagree Disagree
Strongly Somewhat Somewhat Strongly
Diversifying our economy. ( ) ( ) ( ) ( )
Improving our water and
sewer infrastructure. ( ) ( ) ( ) ( )
Providing more public
transportation options. ( ) ( ) ( ) ( )
Promoting healthy living. ( ) ( ) ( ) ( )

ENVISION HAMPTON ROA DS
47 | P a g e
Growing of the region’s ports. ( ) ( ) ( ) ( )
Focusing more attention on
urban development. ( ) ( ) ( ) ( )
Addressing issues that affect
the whole region at a regional,
rather than level. ( ) ( ) ( ) ( )
Building greater awareness
of our region nationally and
internationally. ( ) ( ) ( ) ( )
Bringing in more jobs. ( ) ( ) ( ) ( )
Growing out tourism business. ( ) ( ) ( ) ( )
Improving work force
Training. ( ) ( ) ( ) ( )
Commitment to the very
best public educational system. ( ) ( ) ( ) ( )
Developing a regional plan for
addressing storm flooding
and sea level rise. ( ) ( ) ( ) ( )
Promoting a suburban
lifestyle. ( ) ( ) ( ) ( )
Making Hampton Roads
More globally competitive. ( ) ( ) ( ) ( )
Reducing the size and role
of government. ( ) ( ) ( ) ( )
Creating opportunities for
young people to stay and work. ( ) ( ) ( ) ( )
Bringing more military
to the region. ( ) ( ) ( ) ( )
Bringing professional sports
to the region. ( ) ( ) ( ) ( )
Encouraging the use of
recyclable materials to
reduce the burden on our
landfills. ( ) ( ) ( ) ( )
ENVISION HAMPTON ROA DS
48 | P a g e
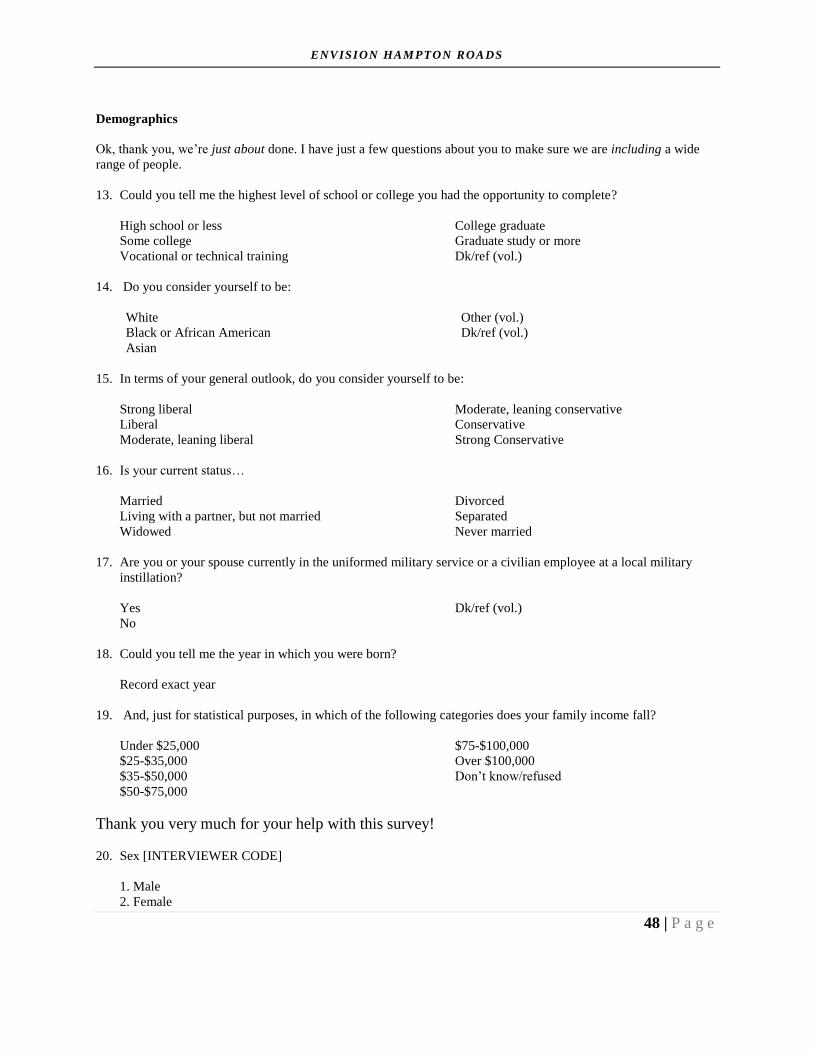
Demographics
Ok, thank you, we’re just about done. I have just a few questions about you to make sure we are including a wide
range of people.
13. Could you tell me the highest level of school or college you had the opportunity to complete?
High school or less
Some college
Vocational or technical training
College graduate
Graduate study or more
Dk/ref (vol.)
14. Do you consider yourself to be:
White
Black or African American
Asian
Other (vol.)
Dk/ref (vol.)
15. In terms of your general outlook, do you consider yourself to be:
Strong liberal
Liberal
Moderate, leaning liberal
Moderate, leaning conservative
Conservative
Strong Conservative
16. Is your current status…
Married
Living with a partner, but not married
Widowed
Divorced
Separated
Never married
17. Are you or your spouse currently in the uniformed military service or a civilian employee at a local military
instillation?
Yes
No
Dk/ref (vol.)
18. Could you tell me the year in which you were born?
Record exact year
19. And, just for statistical purposes, in which of the following categories does your family income fall?
Under $25,000
$25-$35,000
$35-$50,000
$50-$75,000
$75-$100,000
Over $100,000
Don’t know/refused
Thank you very much for your help with this survey!
20. Sex [INTERVIEWER CODE]
1. Male
2. Female

49
Appendix D: Note on Cross Tabulations
As note earlier, all survey findings are subject to possible statistical sampling variances. The
most important factor controlling tolerance is the size of the sample, or number of interviews on
which the results are based. As a rule, the larger the sample size the more stable and reliable the
responses. Small differences between percentages are seldom significant.
The margin of error for the full sample of 1,216 respondents is plus or minus 2.9 percentage
points at the 95% confidence level. The margin of error for smaller segments of the sample—e.g.
just residents of a single municipality—would be higher, with the exact variance depending on
the size of that subsegment.
The tables that follow show breakdowns of findings according to a variety of demographic
and geographic subsegments that are, because of the smaller number of interviews in any given
subsegment, subject to greater statistical variance.