research paper dynamical modeling and ... int. j. struct. & civil engg. res. 2013 pradip gatkine...
TRANSCRIPT
1
Int. J. Struct. & Civil Engg. Res. 2013 Pradip Gatkine and Brijesh Kumar, 2013
DYNAMICAL MODELING AND RESONANCE
FREQUENCY ANALYSIS OF 3.6 M OPTICAL
TELESCOPE PIER
Pradip Gatkine1* and Brijesh Kumar2
The pier is an important building block of large optical telescopes. There are several sources ofvibrations all around the optical telescope. A large height makes it vulnerable to low frequencyoscillations, both as surface waves, as well as bulk oscillations which may be transferred to theoptical system. It mainly happens through the pier, since it is directly connected to the telescope.In order to avoid enhanced transfer of energy between pier and optical system, it is necessary toensure that the resonance frequency of the pier and the telescope fixtures are fairly separated.The as-built structure of telescope pier was simulated using FEM analysis for finding theresonating modes. Various test procedures were defined and on-site testing was done using3C geophones and piezoelectric sensors to closely observe response of the pier. The mainmode in low frequency regime was found to occur at approximately 22±2 Hz by both testing andsimulations. Theoretical supports are also provided for observed modes. A proof of conceptwas demonstrated for impulse response based resonance frequency determination. It wasalso demonstrated that a low-cost piezoelectric sensor based test-bench can be used for findingthe resonating modes, compared to expensive 3C geophones.
1 Indian Institute of Technology Bombay, Powai, Mumbai
2 Aryabhatta Research Institute of Observational Sciences, Nainital, India
*Corresponding author:PradipGatkine � [email protected]
ISSN 2319 – 6009 www.ijscer.com
Vol. 3, No. 1, February 2014
© 2014 IJSCER. All Rights Reserved
Int. J. Struct. & Civil Engg. Res. 2014
Research Paper
Keywords: Telescope Pier, 3C geophones, Piezoelectric sensors, Resonance frequency, FEManalysis
INTRODUCTION
A 3.6 m diameter optical telescope is beingconstructed at Devsthal, Uttarakhand (Sagaret al., 2013). One important challenge is tomake sure that the telescope is not prone tovibrations due to dynamics of various objectsin the telescope assembly. The dominantfrequencies induced in telescope building are
due to dynamics of telescope dome, unsteadywind loads, earthquake tremors and thedynamics of the telescope body itself. It isimportant to study the propagation of thesevibrations into the optics of telescope leadingto inaccuracies and jitter in beam-pointing.This necessitates the study of naturalfrequency of the Telescope Pier which is the

2
Int. J. Struct. & Civil Engg. Res. 2013 Pradip Gatkine and Brijesh Kumar, 2013
main support structure for the telescope.
TELESCOPE PIER
Pier is supposed to be the most stable supportstructure of the telescope. Hence its foundationis also laid deeper and stronger on bedrockrather than just soil (Pierre Bely, 2003). Thepier has to be rigid with natural frequencieshigher than 20 Hz in order to protect thetelescope from seismic loads (Pierre Bely,2003). The main telescope enclosures areprone to large wind loads due to theirgeographical location and large surface area.This causes a moment on the underlyingfoundation which may ultimately transfervibrations to the pier and the telescope. Hence,it is important to have rigid pier foundation andgood isolation with the telescope enclosurefoundation to mitigate the effect of wind loadon telescope and vibrations due to domedynamics. Pier is generally made up ofreinforced concrete due to its low cost andexcellent damping properties (Pierre Bely,2003).
At present, the telescope pier has been builtand construction of dome framework is inprogress. It is important to assess thecompliance of as constructed telescope pierwith as designed specifications. Dynamicaltesting and analysis provides a way to inspectkey parameters of the pier. This paper will
encompass the Finite Element Method (FEM)based study of as built telescope pier as wellas results obtained from on-site vibrationtesting of telescope pier using 3C geophones.Also, the piezoelectric sensor based low-costtest setup has been devised for vibrationaltesting, which is described in brief. A coarseestimate of the resonating modes is alsodetermined analytically. A brief sensitivityanalysis has also been done for pierproperties.
GENERAL METHODOLOGY
In dynamical analysis of pier, 3 modes areimportant to study, which are rocking mode,torsional mode and vertical mode. Thetorsional mode is not very significant in thepresent analysis due to high torsional rigidityof the structure. So mainly rocking mode, i.e.,shear mode and vertical mode are manifestedin the testing as well as FEM simulations.
Analysis of Impulse Response
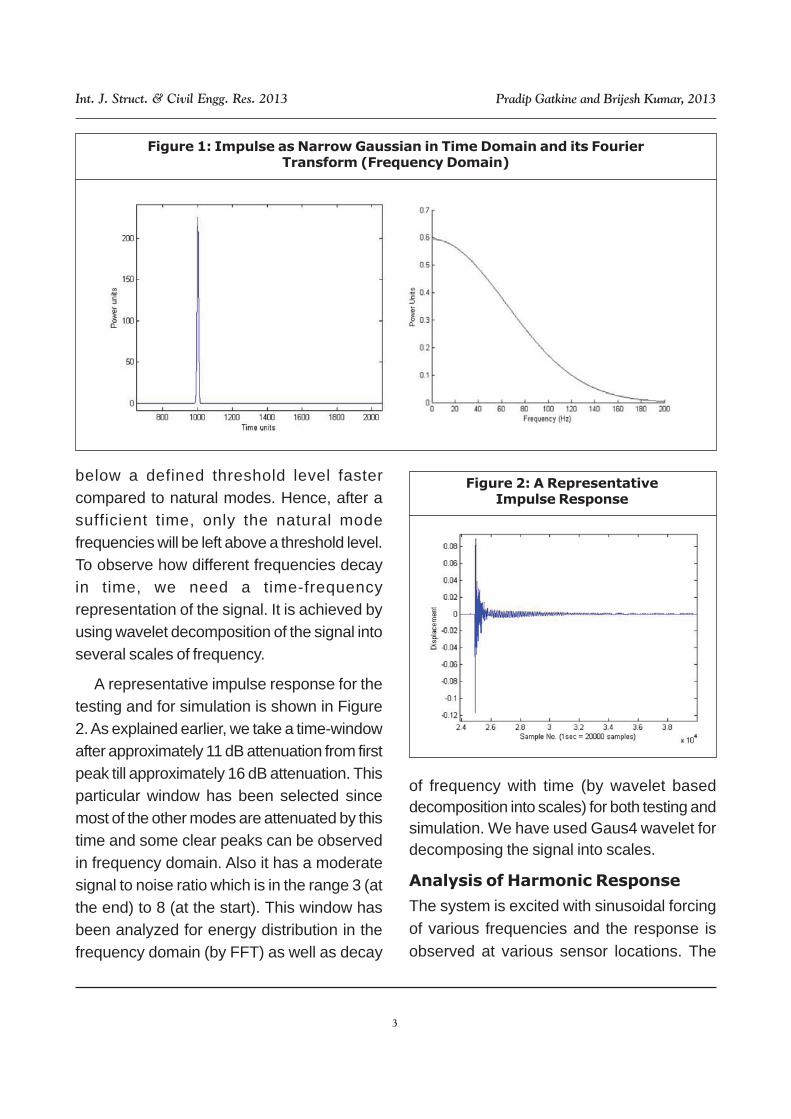
An impulse can be thought of as a very narrowGaussian function in time domain. Hence,infrequency domain it becomes a wideGaussian function, as shown in Figure 1. Whena system is excited with an impulse, thefrequencies in the band covered by thefrequency domain Gaussian are excited atonce. But the frequencies which are not thenatural modes of the system will attenuate
Table 1: Material Properties used for Analysis
Properties: Compressive Tensile Flexural Elastic Shear Poisson Damping
Concrete Strength Strength Strength Modulus Modulus Ratio Ratio
(Cubic) (Mean)
M10 14MPa 1.82MPa 2.2MPa 17GPa 7.83GPa 0.15 0.07
M25 32.5MPa 2.86MPa 3.5MPa 25GPa 11.74GPa 0.15 0.07
3
Int. J. Struct. & Civil Engg. Res. 2013 Pradip Gatkine and Brijesh Kumar, 2013
below a defined threshold level fastercompared to natural modes. Hence, after asufficient time, only the natural modefrequencies will be left above a threshold level.To observe how different frequencies decayin time, we need a time-frequencyrepresentation of the signal. It is achieved byusing wavelet decomposition of the signal intoseveral scales of frequency.
A representative impulse response for thetesting and for simulation is shown in Figure2. As explained earlier, we take a time-windowafter approximately 11 dB attenuation from firstpeak till approximately 16 dB attenuation. Thisparticular window has been selected sincemost of the other modes are attenuated by thistime and some clear peaks can be observedin frequency domain. Also it has a moderatesignal to noise ratio which is in the range 3 (atthe end) to 8 (at the start). This window hasbeen analyzed for energy distribution in thefrequency domain (by FFT) as well as decay
of frequency with time (by wavelet baseddecomposition into scales) for both testing andsimulation. We have used Gaus4 wavelet fordecomposing the signal into scales.
Analysis of Harmonic Response
The system is excited with sinusoidal forcingof various frequencies and the response isobserved at various sensor locations. The
Figure 1: Impulse as Narrow Gaussian in Time Domain and its FourierTransform (Frequency Domain)
Figure 2: A RepresentativeImpulse Response

4
Int. J. Struct. & Civil Engg. Res. 2013 Pradip Gatkine and Brijesh Kumar, 2013
harmonic load excitation is achieved here byrotation of unbalanced (eccentric) massmounted over a motor shaft. The frequency ofexcitation is varied by varying the angularspeed of the eccentric mass. The motor ismounted on the position where we desire toapply loading. The frequency of the harmonicresponse is same as the frequency of harmonicloading. The maximum amplitudes obtainedat each frequency are recorded, and aredivided with forcing amplitude to generatetransfer function of the system. The peaks inthe transfer function denote the naturalfrequencies of the system.
FEM Analysis of Model
The Model
A 3D model of the as-built telescope pier was
made using Solidworks CAD Package. FEM
based simulations were performed on the
model. The details about the dimensions and
materials are as shown in the Figure 3. Wall
thickness of pier = 1 m; inner diameter of pier
= 5 m; top slab thickness = 1 m.
Impulse Response Analysis
A narrow ‘Gaussian’ type of loading wasapplied over specific regions which are: Topsurface center, Bottom surface center, Topsurface peripheral and Bottom surfaceperipheral. The top-bottom delay in theresponse was noted for wave velocity. Theresponse was recorded at topsurface-centerposition and bottom-surface-center position forabout 1.6 s after application of impact. Theanalysis of impulse response was doneaccording to the method described earlier.
The loading function
( )( )2200( ) exp 40000 0.4F t t
π= × − × −
The results of impulse response analysisare as shown in Figures 4 and 5.
Harmonic Response Analysis
Harmonic loading was administered at thesame 4 loading locations as for impact loadingand the response was studied at the samesensor locations. The transfer function graphswere obtained in the frequency range 0-100Hz. The results are shown in Figure 6.
Figure 3: (A) Pier Model As Constructed (B) Loaded Telescope PierFor Impact Testing (C) The Coordinate System Used

5
Int. J. Struct. & Civil Engg. Res. 2013 Pradip Gatkine and Brijesh Kumar, 2013
Figure 4: FFT of After-Impact Time-Domain Signa:a) Signal in X-Direction b) Signal in Z Direction c) Signal in Y Direction
Figure 5: Time-Freq representation of After-Impact Time-Domain Signal: a) Signalin X-Direction b) Signal in Z Direction c) Signal in Y Direction
Note: Red: Highest Amplitude, Blue: Least amplitude
Figure 6: Harmonic Response in Simulation: a) X-Direction b) Z- Direction c) Y- Direction
On-site Testing using 3CGeophones
This was executed by applying impact loadsat various locations on pier and simultaneouslyobserving the response at fixed sensorlocations. The impact load was provided by a
nylon attenuator coated hammer. The mass ofthe hammer used was 10 kg. Each 3-Component Geophone sensor measuresresponse along 3 orthogonal directions X-Y-Z. The sensors were employed at Pier-topsurface-center and Pier-bottom-surface-

6
Int. J. Struct. & Civil Engg. Res. 2013 Pradip Gatkine and Brijesh Kumar, 2013
center. The impact was applied at 4 mainlocations which are top-surface-center,bottom-surface-center, top-surface-north(peripheral) and top-surface-east (peripheral).Also, the time taken for vibrations to travel frombottom surface to top surface was measuredto give a measure of wave-velocity.
Impulse Response Analysis
The analysis of impulse response was doneaccording to the method described earlier inmethodology. The results are summarized inFigures 7, 8, and 9.
Testing Using PiezoelectricTransducers
Figure 7: FFT of After-Impact Time-Domain Signal for Testing:a) Signal in X-Direction b) in Z Direction c) in Y Direction
Figure 8: Time-Freq representation of After-Impact Time-Domain Signal for Testing:a) in X-Direction b) in Z Direction c) in Y Direction
Figure 9: Harmonic Response in 3C-GeophoneTesting:a) X-Direction b) Z- Direction c) Y- Direction

7
Int. J. Struct. & Civil Engg. Res. 2013 Pradip Gatkine and Brijesh Kumar, 2013
Test Setup
The Piezoelectric transducers generatevoltage across its terminals when it is deformeddue to a vibration or force. A piezoelectricceramic disk diaphragm manufactured byMurata Manufacturing Co. Ltd. was used forvibration testing of pier. The block diagram andthe sensor are shown in Figure 10. This is afamily of low cost pressure transducers. Theseare active transducers and hence thesensitivity and linearity are not affected by inputvoltage fluctuations. The piezoelectric sensorshave a flat frequency response curve up toaround 100 Hz and the resonance frequency
is 2.8 kHz, thus it is possible to measure theresponse at low frequencies without significantdistortion. The phase-distortions during noisefiltering are eliminated by applying an IIR filterto a signal twice, once forwards and oncebackwards. The acquired data is analyzed inthe computer using a python code. Impulseresponse test was performed using this setup.Only X and Y directions were studied usingpiezoelectric sensors since it was found that Xand Z directions have similar responses. Theimpact was administered at Pier bottom surfacecenter and the setup was also firmly fixed at adistance of about 30 cm from impact location.
Figure 10: a) Piezoelectric Sensor Block Diagram B) Setup Using 2 Piezo SensorsC) Interfacing Circuitry
Figure 11: FFT of Y-Direction Responsein Piezoelectric Sensor Based Impact
RESULTS
Analysis of the pier response is performedusing wavelet based decomposition toeliminate sensor characteristics. We use sym8scaling function for the decomposition anddecompose the signal into 9 levels. From thedecomposition, it is observed that the lowfrequency range of interest has significantenergy contribution in the response and ismainly concentrated in 6th and 7th levels ofdecomposition for longer durations. FFT of 11dB to 17 dB window is performed to comparethe results with 3C geophones. The FFT for Y-direction signal is shown in Figure 11. The

8
Int. J. Struct. & Civil Engg. Res. 2013 Pradip Gatkine and Brijesh Kumar, 2013
various levels of decomposition are shown inFigure 12.
Comparison with Analytical Results
For Shear Mode
From the time-frequency representation of bothtesting and simulation signals show that the22-24 Hz signal survives for the longest times,
which in turn means that it is the principal modeof vibration for the pier. This is also expectedfrom the analysis of time taken for the signalto travel from Top surface to bottom. Top-Bottom time delay = 0.0105 s; height of Pier =wavelength/4 = 8.66 m. Hence, velocity of thewave is 822.86 m/s. The frequency is thuscalculated to be 23.9 Hz.
Figure 12: Wavelet Decomposition of Impact ResponseObtained using Piezoelectric Setup
Figure 13: Illustrations of a) Shear Mode b) Vertical Mode of Vibration
9
Int. J. Struct. & Civil Engg. Res. 2013 Pradip Gatkine and Brijesh Kumar, 2013
For Vertical Mode
The circular base and top circular surfacevibrates up and down. Hence the critical lengthis the diameter of the surface. Diameter of freesurface is 5 m with 1 m additional thicknesson both sides. Taking an end correction of 0.5m in the radial direction, we get half of thewavelength = 6 m. Thus the calculatedfrequency is thus 66.7 Hz. This frequency ispredicted by the simulations, though theenergy content is two orders of magnitudelower than shear mode.
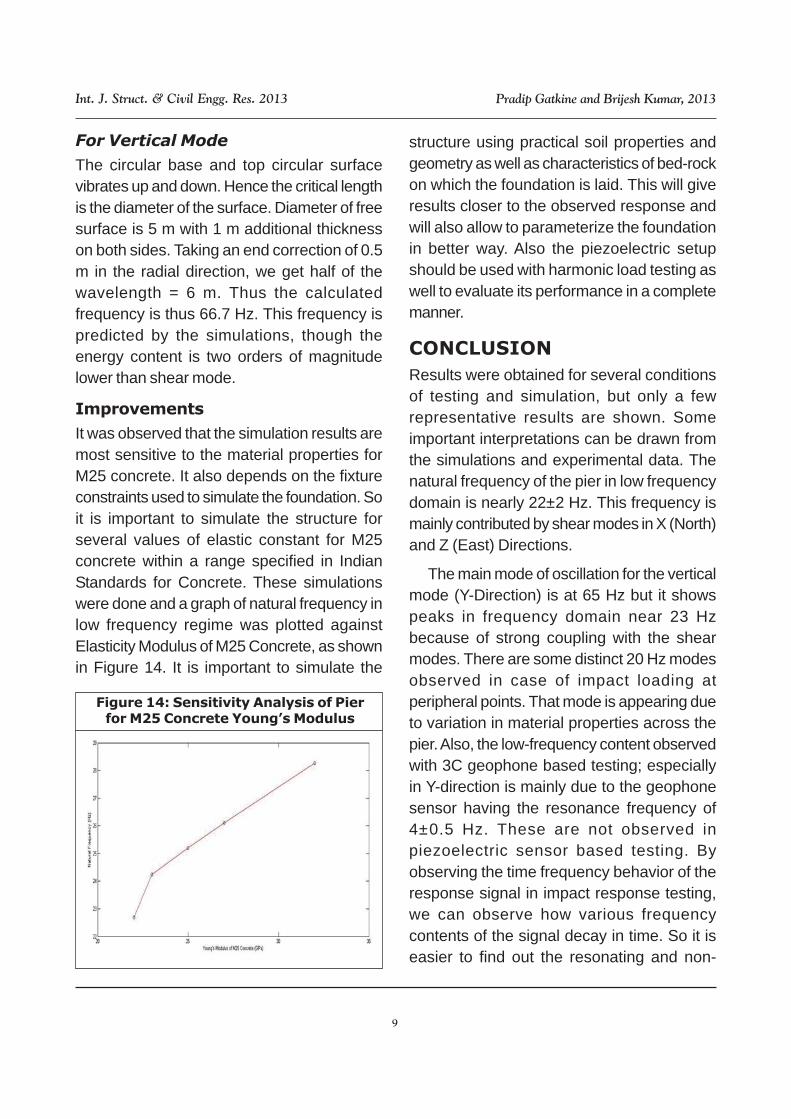
Improvements
It was observed that the simulation results aremost sensitive to the material properties forM25 concrete. It also depends on the fixtureconstraints used to simulate the foundation. Soit is important to simulate the structure forseveral values of elastic constant for M25concrete within a range specified in IndianStandards for Concrete. These simulationswere done and a graph of natural frequency inlow frequency regime was plotted againstElasticity Modulus of M25 Concrete, as shownin Figure 14. It is important to simulate the
structure using practical soil properties andgeometry as well as characteristics of bed-rockon which the foundation is laid. This will giveresults closer to the observed response andwill also allow to parameterize the foundationin better way. Also the piezoelectric setupshould be used with harmonic load testing aswell to evaluate its performance in a completemanner.
CONCLUSION
Results were obtained for several conditionsof testing and simulation, but only a fewrepresentative results are shown. Someimportant interpretations can be drawn fromthe simulations and experimental data. Thenatural frequency of the pier in low frequencydomain is nearly 22±2 Hz. This frequency ismainly contributed by shear modes in X (North)and Z (East) Directions.
The main mode of oscillation for the verticalmode (Y-Direction) is at 65 Hz but it showspeaks in frequency domain near 23 Hzbecause of strong coupling with the shearmodes. There are some distinct 20 Hz modesobserved in case of impact loading atperipheral points. That mode is appearing dueto variation in material properties across thepier. Also, the low-frequency content observedwith 3C geophone based testing; especiallyin Y-direction is mainly due to the geophonesensor having the resonance frequency of4±0.5 Hz. These are not observed inpiezoelectric sensor based testing. Byobserving the time frequency behavior of theresponse signal in impact response testing,we can observe how various frequencycontents of the signal decay in time. So it iseasier to find out the resonating and non-
Figure 14: Sensitivity Analysis of Pierfor M25 Concrete Young’s Modulus
10
Int. J. Struct. & Civil Engg. Res. 2013 Pradip Gatkine and Brijesh Kumar, 2013
resonating modes. Thus a reliable test setupand procedure is developed for dynamicalanalysis of telescope pier.
A proof of concept is demonstrated forImpulse response based method to determinenatural frequencies of large and multi-degreeof freedom structures. Also, a proof of conceptfor the piezoelectric test setup is established.Usefulness of wavelet based study in findingthe natural modes of a system is alsodescribed.
ACKNOWLEDGMENT
We extend our gratitude towards NagadiConsultants, who promptly delivered the 3Cgeophone based testing and shared the dataand results with us in respectable time. Wealso thank all the team members of 3.6 mDevasthal Optical Telescope Project for theirvaluable suggestions and comments. We alsothank the staff at ARIES Electrical andMechanical workshop for their help and co-operation.
REFERENCES
1. Indian Standard Plain and Reinforced
Concrete - Code of Practice, 2000 (FourthRevision).
2. John M Reynolds (2011), An Introductionto Applied and EnvironmentalGeophysics, Second edition, WileyBlackwell, p. 170.
3. Murata Manufacturing Company,Piezoelectric sensor datasheet: http://www.symmetron.ru/suppliers/murata/sensors/p19e6.pdf
4. Pandey A K, Shukla V, Bangia T, RaskarR D, Kulkarni R R. and Ghanti A S (2012),Proc.SPIE 8444, Ground-based andAirborne Telescopes IV, 844441
5. Pierre Y Bely (2003), The Design andConstruction of Large Telescopes, A &A Library, Springer
6. Ram Sagar, Brijesh Kumar and AmiteshOmar, arXiv:1304.0235 [astro-ph.IM]
7. van Hoof J F A M (1994), One and TwoDimensional Wave Propagation inSolids, WFW reportnr. 94-055.