research open access understanding the process of
TRANSCRIPT

Tessema et al. Agricultural and Food Economics 2013, 1:13http://www.agrifoodecon.com/content/1/1/13
RESEARCH Open Access
Understanding the process of adaptation toclimate change by small-holder farmers: the caseof east Hararghe Zone, EthiopiaYibekal A Tessema1*, Chanyalew S Aweke2 and Getachew S Endris2
* Correspondence:[email protected] of Agricultural Economicsand Agribusiness, HaramayaUniversity, Dire Dawa, EthiopiaFull list of author information isavailable at the end of the article
©Am
Abstract
This study examined smallholder farmers’ level of perception about climate change,source of information on climate change, types of adaptation strategies, factorsinfluencing adaptation choices and barriers to adaptation in Eastern Hararghe Zone,Ethiopia. The surveyed farm households in the study area perceived at least oneaspect of climate change primarily through their life experience. Planting trees is themajor adaptation measure and 89.1 percent of the farmers took this adaptationstrategy. Most farmers (96 percent) believe that deforestation is the main cause ofclimate change and the choice of farmers to plant trees as an adaptation strategymay be partly a mitigation strategy. However, the majority (49.6 percent) of thehouseholds employed at least one adaptation response on top of tree planting. Theother adaptation strategies include: early planting, terracing, irrigation and waterharvesting. The main source of information for these adaptation strategies for 58.4percent of the respondents is from extension advice. Results of a multinomial logitmodel showed that non-farm income, farmer- to-farmer extension, access to credit,distance to selling markets, distance to purchasing markets, and income affect thechoice of adaptation strategies. Finally, the study identified lack of information as themost important barrier to climate change adaptation. The other barriers include: lackof farm inputs, shortage of land, lack of money, lack of water and shortage of labor.
Keywords: Climate change; Ethiopia; Perception; Adaptation; Multinomial logitmodel
BackgroundClimate change has adversely affected the livelihoods of people in developing countries
where a large proportion of the population is heavily dependent on agriculture. Similarly, cli-
mate change has exacerbated poverty, food insecurity and vulnerability of agrarian commu-
nities in Sub-Saharan Africa (Akponikpè et al. 2010; Bryan et al. 2009). Ethiopia, a country
located in the Horn of Africa, where the agricultural sector accounts for about 52 percent of
the GDP and 85 percent of the foreign exchange earnings, and employs about 80 percent of
the population (CSA Central Statistics Authority 2004) could be a typical example of the im-
pact of climate change on the vulnerable rural communities in the developing world.
A recent mapping on vulnerability and poverty in Africa has positioned Ethiopia as
one of the most vulnerable countries in the continent with the least adaptive capacity
to climate change. In fact, the country has suffered from at least five major national
Tessema et al.; licensee Springer. This is an open access article distributed under the terms of the Creative Commonsttribution License (http://creativecommons.org/licenses/by/2.0), which permits unrestricted use, distribution, and reproduction in anyedium, provided the original work is properly cited.
2013

Tessema et al. Agricultural and Food Economics Page 2 of 172013, 1:13http://www.agrifoodecon.com/content/1/1/13
droughts since 1980, not mentioning numerous local droughts all over the country. In
the years between 1999 and 2004 alone, more than half of all households in the country
faced at least one major drought. These cycles of drought have effectively kept the
population in vicious poverty nullifying the endeavors of the population in creating as-
sets and increasing its food security status (ILRI 2006; Stige et al. 2006; ACCCA 2010).
However, the impact of climate change is not limited to the occurrence of droughts
(Lautze et al. 2003). Other important climatic variables are also changing implying the
multiple repercussions of the change in climate. Over the past decade, average mini-
mum and maximum temperatures of the country have increased by around 0.25°C and
0.1°C respectively. Further, it is expected that in the year 2050, mean temperature will
increase by 1.7-2.1°C (Tadege 2007). Most climate models support this increase in
temperature. However, there is a contradiction as to the change in precipitation, where
both increase and decrease in precipitation are forecasted depending on the climate
models employed (Strzepek and Mccluskey 2006). Nevertheless, high variability in pre-
cipitation is observed in the country over the past decade (Deressa et al. 2011).
The change in climate is inevitable, at least in the near future, and Ethiopian farmers
are now faced with adapting to this inevitable change in climate. Following IPCC
(2001), adaptation to climate change refers to the “adjustment in natural or human sys-
tems in response to actual or expected climatic stimuli or their effects, which moder-
ates harm or exploits beneficial opportunities”. Adaptation could be effected at
different scales: individual or farm-level, and national or international level. Even
though there will be some autonomous adaptation at farm-level, this adaptation is inad-
equate and needs the intervention of institutions like governmenet (Maddison 2007;
Smit and Pilifosova 2001). Adaptation actions at national or international level, how-
ever, entail an understanding of the process of autonomous adaptations at farm-level
(Bryan et al. 2009).
Adaptation at farm-level involves two stages: perceiving the change in climate, and
deciding whether to adapt or not, or which adaptation strategy to choose (Maddison
2007). There are still important questions on perception that need to be addressed,
such as: Are farmers able to perceive the change in climate in the long run? Which
changes are they able to perceive? What economic, social and institutional factors influ-
ence their level and speed of perception (Vedwan and Rhoades 2001; Falco et al. 2011;
Deressa et al. 2009)? Perception is not, however, an adequate condition for adaptation.
Farmers who have perceived the change in climate may not adapt or the nature of their
adaptaion respones may vary as a result of a complex interplay between social, econmic
and institutional factors (Maddison 2007; Maharjan et al. 2011; Bryan et al. 2009).
There is a large deficit of information on the process of adaptation in the developing
world including Ethiopia (Smit and Pilifosova 2001; McSweeney et al. 2010). There are
currently few research outputs in Ethiopia, almost all focused only to the Nile Basin of
the country. Deressa et al. (2009), Deressa et al. (2011) and Falco et al. (2011) studied
the perception and adaptation process in the Nile Basin of Ethiopia. They were able to
identify factors that affect perception, adaptation decisions, and also highlighted the
main barriers to adaptation in the study areas. On the other hand, Maddison (2007)
and Bryan et al. (2009) compared the adaptation process in Ethiopia with other
African countries, again based on the survey in the Nile basin of Ethiopia. All the stud-
ies carried out in the Nile Basin of Ethiopia were dependent on a single survey made

Tessema et al. Agricultural and Food Economics Page 3 of 172013, 1:13http://www.agrifoodecon.com/content/1/1/13
during 2004/2005 on 1,000 farmers. However, ACCCA (2010) studied the nature of
adaptation in the drought prone areas of Tigray, northern Ethiopia, based on a survey
of 160 farmers.
The studies carried out so far are only limited to the Nile Basin of Ethiopia. There is
a need to study the other parts of the country: the southern and eastern parts. There
are regions in the country which could provide new insights on the adaptation process
at farm-level. East Hararghe Zone of Oromia regional state could be a very good ex-
ample in this respect. The Zone is characterized by farmers with very small average
landholdings, even compared to the national and regional average, and follows a mixed
crop-livestock production system consisting of cash crops (such as Khat and coffee)
and cereals, unlike most of the areas in the Nile Bain. The Zone is also one of the food
insecure areas of the country having a large population with frequent need for emer-
gency food aid (Niemistö 2011). Hence, a study on adaptation to climate change in this
area could supplement the current knowledge on the adaptation process in the country
and could subtantially contribute to plan development interventions in the Zone.
Moreover, it seems that most studies (Deressa et al. 2011; Deressa et al. 2009; Falco
et al. 2011; Bryan et al. 2009) assumed that farmers have perceived climate change
gradually by themselves and did not explicitly ask the source of their perception on cli-
mate change, which could be training given by extension agents. Unlike many studies,
this study also seprately considers distance to selling markets and distane to purchasing
markets as determinants of adaptation decisions.
This study, therefore, investigated the whole adaptation process starting from percep-
tion to adaptation responses in Eastern Hararghe Zone. It examined the process and
degree of smallholder farmers’ perception and adaptation to climate change in the
study area. It also identified factors governing smallholder farmers adaptation responses
and the most important barriers to adaptation.
Methods
Study area, sampling and data collection
The study area is East Hararghe Zone, Oromia National Regional State, Ethiopia. It is
located in the eastern part of the regional state and the country. Following the national
census in 2007, the Zone with an area of 17,930 km2 has a total population of 2,723,
850 and 580,735 households (CSA 2007).
The study employed a multistage sampling technique. In the first stage, out of the 18
Woredas (districts) in the Zone, three Woredas were purposively selected to include differ-
ent attributes of Eastern Hararghe Zone with respect to agro-ecological zones (traditional
typology of agro-ecological zones in the country), and agricultural production systems.
The selected Woredas are Haramaya, Kersa and Babile. Haramaya Woreda has an area of
561.6 km2 and a rural population of 154,690 and is found in the northern central part of
the Zone. Kersa is located in the northern part of East Hararghe Zone and has an area
of 544.9 km2 that is home to about 119,542 rural inhabitants. Both Haramaya and Kersa
are characterized predominantly by Woinadega (middle land 1500–2500 m.a.s.l.) agro-
ecology and mixed crop-livestock farming is the dominant production system. On the
other hand, Babile Woreda is found in the eastern part of the study area with an area of
3,022 km2 and with a rural population of 42,858. The largest part of this Woreda falls
under Kolla (lowland, 500-1500 m.a.s.l) agro-ecological zone. In addition to the mixed

Tessema et al. Agricultural and Food Economics Page 4 of 172013, 1:13http://www.agrifoodecon.com/content/1/1/13
crop-livestock farming, the agro-pastoral production system is an important characteristic
of the Woreda (ONRSPO n.d.).
From the selected Woredas, 2 Kebeles (the smallest administrative unit) were ran-
domly selected and from each Kebele 20 households for Haramaya and Kersa, and 15
households from Babile were randomly selected and included in the study. A smaller
sample size was allocated to Babile as it represents a relatively smaller proportion of
the population in East Hararghe Zone (ONRSPO n.d.). Hence, a total of 110 farm
households were included in the study and the survey was carried out in 2012. How-
ever, during data processing, we dropped one of the questionnaires as it had missing
values. The non-missing variables of the questionnaire were examined and no peculiar
characteristics were found justifying the decision for list wise deletion, which is the best
option under such situations (Allison 2002).
To collect the data, a semi-structured interview schedule was employed. Enumerators
were trained for one day to familiarize them with the issues of climate change, farm-
level adaptation to climate change, the significance of research on climate change adap-
tation, and the basic concepts in sampling, interviewing and processing data.
Data analysis
This study employed both qualitative and quantitative analysis techniques. The qualitative
analyses used interpretations, comparisons and arguments. The quantitative analyses
made use of both descriptive and inferential statistical techniques. The descriptive statis-
tical techniques applied in the study include percentages and graphs. Inferences are made
using a multinomial logit model (MNL). MNL is widely employed in climate change adap-
tation (e.g., Deressa et al. 2009; Sofoluwe et al. 2011; Gbetibouo 2009) and technology
adoption (e.g., Uaiene et al. 2009; Paudel et al. 2011; Jariko et al. 2011) studies. It is
employed when the dependent variable has more than two outcomes or, in our case, more
than one adaptation response to climate change (Madalla 1983; Greene 2003).
To describe the MNL model, let y denote a random variable taking on the values
{0;1;…..;J} where J is a positive integer and x denote a set of conditioning variables. In
our study, y would be adaptation measures taken by households whereas x represents
the explanatory variables hypothesized to influence the choice of the available adapta-
tion options. The MNL model is employed to show how ceteris paribus changes in the
elements of x influence the response probabilities, P (y = j|x), j = 0, 1,…, J. P (y = j|x) is
known after determining the probabilities for j = 0,1,2,…,J, which must sum to unity.
The MNL model has response probabilities given as Equation (1):
P y ¼ j1xð Þ ¼ exp xβjð Þ1þ
Xi≠jexp xβjð Þ ; j ¼ 1;…; J ð1Þ
The parameter estimates of the MNL model only show the direction of the relationship
between the dependent and independent variables. Therefore, to determine the actual
magnitude of change or probabilities, the marginal effect of the explanatory variables,
Equation 1 is differentiated over the explanatory variables to give Equation (2):
∂P y ¼ jlxð Þ∂xk
¼ P y ¼ jlxð Þ βik −
Xi ≥ 1
βikexp Xβið Þ1þ
Xi≥ 1
exp Xβið Þ
" #ð2Þ

Tessema et al. Agricultural and Food Economics Page 5 of 172013, 1:13http://www.agrifoodecon.com/content/1/1/13
The MNL, however, works under the assumption of the Independent Irrelevant Alterna-
tives (IIA). Following this assumption, the odds of any two outcomes are independent of
the remaining outcomes available. Hence, omitting or adding outcomes should not affect
the odds of the remaining outcomes (Long and Freese 2001). The fitted MNL model was
first checked to make sure that it does not violate this assumption.
Empirical specification of model variables
The dependent variable is farmers’ choice of no adaptation, tree planting as a sole re-
sponse, and tree planting and at least one additional measure. Farmers usually adopt
more than one adaptation strategy at a time and the dependent variable is defined in a
way that provides mutually exclusive outcomes. Farmers’ choice of adaptation strategies
is made in the context of households’ socio-economic characteristics, institutions, and
agro-ecological settings. Hypothesized factors are discussed below and the description
of each explanatory variable is given in Table 1.
The agro-ecological settings of farmers such as climate and soil are expected to influence
their adaptation to climate change. Evidence shows that farmers in drier and hotter climate
are more likely to respond to climate change than farmers in cooler and wetter areas
(Deressa et al. 2009). In Ethiopia, according to the country’s traditional agro-ecological
zones, areas categorized as Kolla (lowland, 500-1500 m.a.s.l) are characterized by relatively
hotter and drier climate whereas Woinadega (middle land 1500–2500 m.a.s.l.) and Dega
(highland, 2500–3500 m a.s.l.) are wetter and cooler (Deressa et al. 2009). In our study the
sampled Kebeles fall under either Kolla or Woinadega. Hence, it is hypothesized that
farmers living in Kolla are more likely to adapt to climate change than in Woinadega.
Access to water for irrigation is hypothesized to negatively affect farmers’ adaptation
to climate change. This is based on the argument that farmers who have access to irri-
gation water are more resilient to climate change and are less likely to take adaptation
measures (Gbetibouo 2009).
Female-headed households in Ethiopia in general and in East Hararghe in particular
are expected to be less likely to adapt due to their limited access to land, information,
inputs and institutions as a result of traditional social barriers (Wilson and Getnet
2011). However, Nhemachena and Hassan (2007) found that female-headed households
are more likely to take up adaptation measures than male-headed households. The au-
thors explain that females are engaged in more farm activities than males and have bet-
ter farm experience and information. Although this finding has sound grounds, our
study proposes that the argument in the contrary is more probable to prevail in the
study area (Wilson and Getnet 2011) and hypothesized that male-headed households
are more likely to adapt to climate change.
Farmers with more years of farming experience are more capable of assessing the avail-
able technologies and making adaptation decisions (Gbetibouo 2009). On the contrary,
more experienced or older farmers tend to be risk-averse and lag behind in adoption deci-
sions. There is no final consensus on how age affects adoption decisions (Adesina and
Baidu-Forson 1995). The more a farmer is educated, the more likely he/she is to access
information, perceive and adapt to climate change (Adesina and Baidu-Forson 1995;
Maddison 2007). Hence, a positive relationship between level of education and adaptation
decisions is expected.
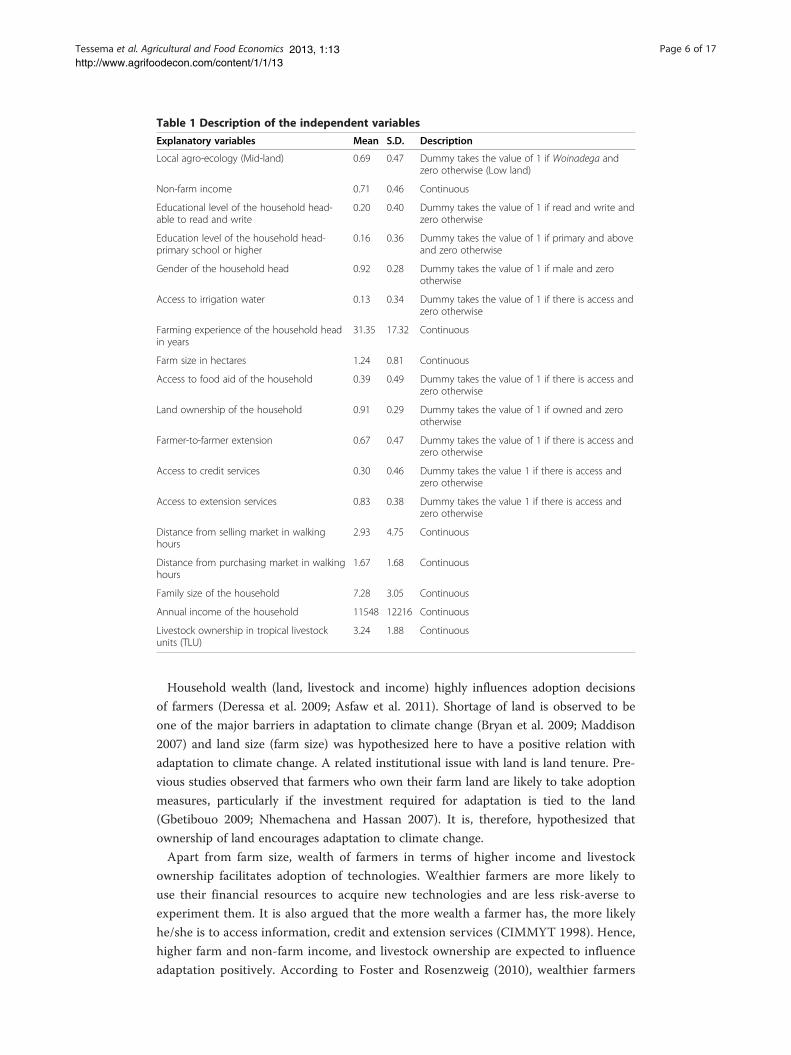
Table 1 Description of the independent variables
Explanatory variables Mean S.D. Description
Local agro-ecology (Mid-land) 0.69 0.47 Dummy takes the value of 1 if Woinadega andzero otherwise (Low land)
Non-farm income 0.71 0.46 Continuous
Educational level of the household head-able to read and write
0.20 0.40 Dummy takes the value of 1 if read and write andzero otherwise
Education level of the household head-primary school or higher
0.16 0.36 Dummy takes the value of 1 if primary and aboveand zero otherwise
Gender of the household head 0.92 0.28 Dummy takes the value of 1 if male and zerootherwise
Access to irrigation water 0.13 0.34 Dummy takes the value of 1 if there is access andzero otherwise
Farming experience of the household headin years
31.35 17.32 Continuous
Farm size in hectares 1.24 0.81 Continuous
Access to food aid of the household 0.39 0.49 Dummy takes the value of 1 if there is access andzero otherwise
Land ownership of the household 0.91 0.29 Dummy takes the value of 1 if owned and zerootherwise
Farmer-to-farmer extension 0.67 0.47 Dummy takes the value of 1 if there is access andzero otherwise
Access to credit services 0.30 0.46 Dummy takes the value 1 if there is access andzero otherwise
Access to extension services 0.83 0.38 Dummy takes the value 1 if there is access andzero otherwise
Distance from selling market in walkinghours
2.93 4.75 Continuous
Distance from purchasing market in walkinghours
1.67 1.68 Continuous
Family size of the household 7.28 3.05 Continuous
Annual income of the household 11548 12216 Continuous
Livestock ownership in tropical livestockunits (TLU)
3.24 1.88 Continuous
Tessema et al. Agricultural and Food Economics Page 6 of 172013, 1:13http://www.agrifoodecon.com/content/1/1/13
Household wealth (land, livestock and income) highly influences adoption decisions
of farmers (Deressa et al. 2009; Asfaw et al. 2011). Shortage of land is observed to be
one of the major barriers in adaptation to climate change (Bryan et al. 2009; Maddison
2007) and land size (farm size) was hypothesized here to have a positive relation with
adaptation to climate change. A related institutional issue with land is land tenure. Pre-
vious studies observed that farmers who own their farm land are likely to take adoption
measures, particularly if the investment required for adaptation is tied to the land
(Gbetibouo 2009; Nhemachena and Hassan 2007). It is, therefore, hypothesized that
ownership of land encourages adaptation to climate change.
Apart from farm size, wealth of farmers in terms of higher income and livestock
ownership facilitates adoption of technologies. Wealthier farmers are more likely to
use their financial resources to acquire new technologies and are less risk-averse to
experiment them. It is also argued that the more wealth a farmer has, the more likely
he/she is to access information, credit and extension services (CIMMYT 1998). Hence,
higher farm and non-farm income, and livestock ownership are expected to influence
adaptation positively. According to Foster and Rosenzweig (2010), wealthier farmers

Tessema et al. Agricultural and Food Economics Page 7 of 172013, 1:13http://www.agrifoodecon.com/content/1/1/13
are advantageous in adoption particularly due to lack of well-developed credit and in-
surance institutions. Thus, better access to credit hastens adoption (CIMMYT 1998)
and it is hypothesized here to facilitate adaptation to climate change.
Household size can influence adaptation because of its association with labor en-
dowment. It is argued that a larger household size enables the adoption of technolo-
gies by availing the necessary labour force in one hand (Croppenstedt et al. 2003) and
enabling the generation of additional income from extra labor invested in off-farm ac-
tivities (Yirga 2007). It is, therefore, expected to positively influence adaptation to cli-
mate change. Extension services foster adaptation through enhancing farmers’
awareness of climate change and knowledge on adaptation measures (Falco et al.
2011; Doss 2003; Nhemachena and Hassan 2007). In this study, both formal (public)
and informal (farmer-to-farmer) extension services are hypothesized to facilitate
adaptation to climate change. Farmer-to-farmer extension is also used here to serve
as a proxy for social capital. Enhanced social capital ensures better access to informa-
tion, credit, and facilitates cooperation for actions that have positive externalities
which are not internalized at the level of individual decision makers (Hogset 2005
cited in Katungi 2007). Isham (2000) and Abodi et al. (2007) showed the importance
of this variable in encouraging adoption of technologies by farmers. Thus, the positive
relation of farmer-to-farmer extension with adaptation is further supported in relation
to social capital.
Markets serve as a means of sharing and exchanging information (Maddison 2007)
and also enhance the returns from technology (Jack 2011). As a result, farmers close
to input and output markets are in a better position to take adaptation measures, and
distance to input and output markets is expected to be inversely related with adapta-
tion. A final factor that is included in this study is food aid. Food aid has an insurance
effect (Barrett 2006) and may encourage farmers to adopt new technologies. For ex-
ample, Bryan et al. (2009) have shown that food aid increases the probability of adapta-
tion among the poorest farmers. This study, therefore, expects that food aid enhances
adaptive capacity to climate change.
Results and discussionPerception of climate change
There are differences among farmers in how they perceive changes in temperature and
precipitation (Figures 1 and 2). 91.2 percent of the respondents perceived an increase in
temperature over the last 20 years while 5.3 and 3.5 perceived no change and decrease in
temperature respectively. On the other hand, 90.3 percent of respondents perceived de-
crease in precipitation while 6.2 and 2.6 percent perceived no change and increase in pre-
cipitation respectively. Besides, 0.9 percent indicated precipitation is variable rather than
agreeing either on an increase or decrease of rainfall. However, all the farmers have per-
ceived at least one aspect of the change in climate indicating a high level of perception
among farmers in the study area. A Heckman selection test was run to see whether
farmers perceiving no temperature or precipitation change introduce selection bias in our
analyses. The inverse Mills ratio term is statistically not different from zero at 10 percent
level of significance (p = 0.2985 and p = 0.2318 for perceiving no precipitation and no
temperature change respectively), indicating no statistically significant indication of selec-
tion bias.

91.2%
3.5%5.3%
Increased
Decreased
No change
Figure 1 Farmers’ perception of change in temperature due to climate change. The chart showspercent of respondents who perceived the different changes.
Tessema et al. Agricultural and Food Economics Page 8 of 172013, 1:13http://www.agrifoodecon.com/content/1/1/13
Sources of information on the existence of climate change
Farmers were explicitly asked how they first come to know about climate change
(Figure 3). The majority of farmers (90 percent) perceived climate change through their
life experience while 3.7 percent were informed by extension services. This result indicates
that farmers are still heavily dependent on their gradual perception of climate change.
If Bayesian updating is assumed, this would mean that there is lack of information from
extension services to update the perception of the farmers or the farmers attach less cred-
ibility (or probability of being true) to the information provided by extension staff.
Types of adaptation strategies
The majority of farmers (49.6 percent) adopted tree planting with at least one add-
itional measure while 39.5 percent took tree planting as a sole response to climate
change (Figure 4). A survey in the Nile Basin of Ethiopia (Deressa et al. 2011; Deressa
et al. 2009) also found planting trees as the most common adaptation strategy. Planting
trees has diverse ecological and economic benefits, which bring about adaptation to cli-
mate change. However, the responses of farmers to climate change can also be driven
by their understanding of the causes of climate change. The majority (96 percent) of
the households in this survey believe that the main cause for climate change is deforest-
ation. Fosu-Mensah et al. (2010) also observed a similar understanding in Ghana.
Therefore, planting trees may also be taken by the farmers partly as a mitigation strat-
egy in addition to adaptation. Even though deforestation is one of the causes of climate
change, it is known that carbon emission from industrialized countries is the main
cause (IPCC 2007). Hence, the result shows the existing gap in the understanding of
farmers on the main causes of climate change and a potential misconception on the
performance of their major adaptation strategy- planting trees.
Although Figure 4 groups adaptation responses into three, there are actually 8 types of
adaptation measures identified in the study area (Figure 5). The majority of farmers (89.1
percent) planted trees as an adaptation measure. Early planting, terracing, irrigation, and
water harvesting follow tree planting as the next common adaptation strategies in the
order they are listed. Praying was mentioned by 9.2 percent of the respondents as an adap-
tation strategy. Taking praying as a major adaptation measure may arise from associating

2.6%
90.3%
6.2%0.9%
Increased
Decreased
No change
Variable
Figure 2 Farmers’ perception of change in precipitation due to climate change. The chart showspercent of respondents who perceived the different changes.
Tessema et al. Agricultural and Food Economics Page 9 of 172013, 1:13http://www.agrifoodecon.com/content/1/1/13
climate issues to supernatural forces, which is usually the case in religious societies like
Ethiopia (Nzeadibe et al. 2011). The use of early maturing plants and non-farm activity
are rare responses to climate change in the study area. Generally, the adaptation measures
taken by the farmers are similar to other findings in Ethiopia (Maddison 2007; Deressa
et al. 2009; Deressa et al. 2011; Falco et al. 2011).
Source of information on adaptation strategies
Conley and Udry (2001) contend that farmers learn about new innovations from exten-
sion advice, from their own experimentation and from their neighbors’ experimenta-
tion. In our survey, farmers were asked about their source of information on
adaptation strategies. It was learned that extension advice took the lion’s share (about
58.4%) followed by own experimentation, which accounts 23.9% (Figure 6). Further-
more, 17% of the framers interviewed used neighbors’ experimentation and advice as a
source of information for adaptation. The results indicate the importance of extension
services in influencing farmers’ adaptation decisions. The dominance of tree planting as
88.9%
3.7%
0.9%6.5%
Experience
Extension
Both Experience and Extension
Others
Figure 3 Source of information about climate change. The percent of respondents who mentioned thevarious sources of information is depicted in the figure.
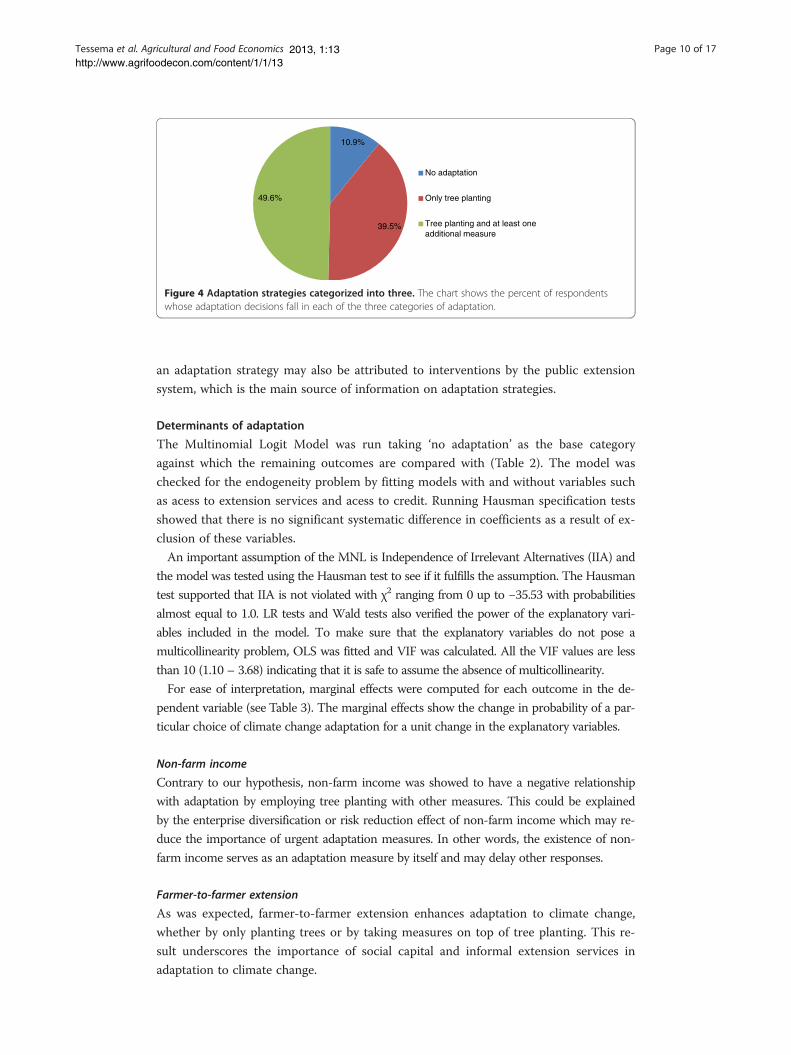
10.9%
39.5%
49.6%
No adaptation
Only tree planting
Tree planting and at least one additional measure
Figure 4 Adaptation strategies categorized into three. The chart shows the percent of respondentswhose adaptation decisions fall in each of the three categories of adaptation.
Tessema et al. Agricultural and Food Economics Page 10 of 172013, 1:13http://www.agrifoodecon.com/content/1/1/13
an adaptation strategy may also be attributed to interventions by the public extension
system, which is the main source of information on adaptation strategies.
Determinants of adaptation
The Multinomial Logit Model was run taking ‘no adaptation’ as the base category
against which the remaining outcomes are compared with (Table 2). The model was
checked for the endogeneity problem by fitting models with and without variables such
as acess to extension services and acess to credit. Running Hausman specification tests
showed that there is no significant systematic difference in coefficients as a result of ex-
clusion of these variables.
An important assumption of the MNL is Independence of Irrelevant Alternatives (IIA) and
the model was tested using the Hausman test to see if it fulfills the assumption. The Hausman
test supported that IIA is not violated with χ2 ranging from 0 up to −35.53 with probabilities
almost equal to 1.0. LR tests and Wald tests also verified the power of the explanatory vari-
ables included in the model. To make sure that the explanatory variables do not pose a
multicollinearity problem, OLS was fitted and VIF was calculated. All the VIF values are less
than 10 (1.10 – 3.68) indicating that it is safe to assume the absence of multicollinearity.
For ease of interpretation, marginal effects were computed for each outcome in the de-
pendent variable (see Table 3). The marginal effects show the change in probability of a par-
ticular choice of climate change adaptation for a unit change in the explanatory variables.
Non-farm income
Contrary to our hypothesis, non-farm income was showed to have a negative relationship
with adaptation by employing tree planting with other measures. This could be explained
by the enterprise diversification or risk reduction effect of non-farm income which may re-
duce the importance of urgent adaptation measures. In other words, the existence of non-
farm income serves as an adaptation measure by itself and may delay other responses.
Farmer-to-farmer extension
As was expected, farmer-to-farmer extension enhances adaptation to climate change,
whether by only planting trees or by taking measures on top of tree planting. This re-
sult underscores the importance of social capital and informal extension services in
adaptation to climate change.

Figure 5 Adaptation strategies. The X-axis shows the different adaptation strategies taken by farmerswhile the heights of the bars correspond to the percent of respondents taking each measure.
Tessema et al. Agricultural and Food Economics Page 11 of 172013, 1:13http://www.agrifoodecon.com/content/1/1/13
Access to credit
Regardless of the expectations, households with better access to credit were found to be less
probable to adapt to climate change by tree planting as the only response for adaptation. Al-
though not significant, the coefficient for adaptation by employing tree planting plus other
measures is also negative. This could be explained by the fact that farmers accessing credit
are likely to be already engaged in different farm investment activities which improves their
adaptive capacity and thereby delaying adaptation measures.
Distance to selling market
As was hypothesized, as distance from selling market increases the likelihood of adap-
tation by tree planting trees and taking at least one additional measure decreases by
13.5 percent. Even though not statistically significant, it has the same negative relation-
ship with adaptation by only tree planting.
58.4%23.9%
17.7%
Extension advise
Own experimentation
Neighbors’ experimentation
Figure 6 Source of information on adaptation strategy. The figure depicts the percent of respondentswho use the different sources of information.

Table 2 Parameter estimates of the multinomial logit model
Explanatory variables Only tree planting Tree planting andother(s)
Coefficient P > |z| Coefficient P > |z|
Local agro-ecology (Mid-land) −1.636667 0.281 -.3587958 .807
Non-farm income −2.708249 0.145 −3.288332 0.072*
Educational level of the household head-able to read and write .0207302 0.989 -.5278419 0.723
Education level of the household head-primary school or higher 1.285579 0.479 1.445039 0.374
Gender of the household head −1.903161 0.305 -.2514557 0.884
Access to irrigation water 2.221507 0.674 2.151656 0.683
Farming experience of the household head -.0242545 0.539 -.0402274 0.287
Farm size in hectares .9027755 0.410 .3203822 0.766
Access to food aid 1.694316 0.289 1.665551 0.288
Land ownership −1.185355 0.806 −1.316571 0.783
Farmer to farmer extension 4.930387 0.013** 4.291278 0.027**
Access to credit services −3.473911 0.070* −2.471363 0.186
Access to extension services .9831508 0.526 -.9210263 0.498
Distance from selling market -.375467 0.135 -.9231534 0.003***
Distance from purchasing market 2.185086 0.058* 3.196014 0.007***
Family size -.1358245 0.587 -.2319416 0.344
Annual income .0002782 0.066* .0002397 0.109
Livestock ownership (TLU) -.2087889 0.549 -.2593202 0.444
constant 1.568256 0.811 4.27316 0.508
Number of observations = 109
LR chi2(36) = 79.39
Prob > chi2 = 0.0000***
Log likelihood = −65.931038
Pseudo R2 = 0.3758
No adaptation is the base outcome
***, **, * Significant at 1%, 5% and 10% significance level respectively.
Tessema et al. Agricultural and Food Economics Page 12 of 172013, 1:13http://www.agrifoodecon.com/content/1/1/13
Distance to purchasing market
Despite the expectations, the probability of higher level of adaptation increases with an
increase in the distance of purchasing markets. With the increase in distance from pur-
chasing markets, farmers are more probable (by 25.3 percent) to adapt by planting trees
on top of at least one additional measure. It is also positively related with adaptation by
only tree planting. The implication of this result is that farmers travelling further to
purchasing markets may access larger markets where they are likely to be introduced
with diverse inputs or technologies. The result further indicates that the markets from
which distance is measured are not homogeneous, and underscores the need to verify
the same while using the varibale as a measure for market access.
Income
In line with the hypothsis, income was found to be postively related with adaptation ei-
ther by tree planting alone or by employing additional measures. Adaptation by tree
planting plus at least one additional measure is, however, slightly insignificant (p = 0.109).

Table 3 Marginal effects from the multinomial logit model
Explanatoryvariables
Only treeplanting
Tree planting andother(s)
No adaptation
Coefficient P > |z| Coefficient P > |z| Coefficient P > |z|
Local agro-ecology (Mid-land) -.3091525 0.053* .304948 0.055* .0042045 0.561
Non-farm income .1317173 0.326 -.1437625 0.285 .0120452 0.455
Educational level of the household head-able to read and write
.1339774 0.454 -.1355246 0.447 .0015472 0.861
Education level of the household head-primary school or higher
-.0363438 0.870 .0411828 0.852 -.004839 0.505
Gender of the household head -.3808178 0.041** .3768494 0.042** .0039684 0.532
Access to irrigation water .0196342 0.941 -.0135092 0.959 -.006125 0.562
Farming experience of the household head .0037983 0.398 -.0039727 0.376 .0001744 0.522
Farm size in hectares .1424019 0.096* -.139461 0.104 -.0029409 0.691
Access to food aid .0104187 0.943 -.0022303 0.988 -.0081885 0.499
Land ownership .0298371 0.899 -.034039 0.884 .0042019 0.711
Farmer to farmer extension .1825314 0.228 -.0853452 0.598 -.0971861 0.354
Access to credit services -.2390714 0.139 .2052233 0.218 .0338481 0.480
Access to extension services .369668 0.005*** -.3712651 0.005*** .0015971 0.774
Distance from selling market .1312373 0.013** -.1348426 0.011** .0036053 0.443
Distance from purchasing market -.2389762 0.025** .2533942 0.019** -.014418 0.407
Family size .0228787 0.354 -.0238753 0.333 .0009966 0.550
Annual income 9.89e-06 0.189 −8.56e-06 0.256 −1.33e-06 0.418
Livestock ownership (TLU) .0117275 0.763 -.0129662 0.739 .0012387 0.536
***, **, * Significant at 1%, 5% and 10% significance level respectively.
Tessema et al. Agricultural and Food Economics Page 13 of 172013, 1:13http://www.agrifoodecon.com/content/1/1/13
Barriers to adaptation
Adaptation to climate change has many stumbling blocks. During the survey, farmers
mentioned a number of barriers to adaptation emanating from different social, eco-
nomic and institutional situations (Figure 7). The most important factor mentioned as
barrier to adaptation by the surveyed farmers is lack of information (which accounts
22.5%) about climate change and adaptation strategies. This is attributed to various fac-
tors including lack of institutional support mechanisms and failure to mainstream the
issue of climate change in the public extension system of the country. Lack of informa-
tion was also identified as the main barrier to adaptation by a survey in the Nile Basin
of Ethiopia (Deressa et al. 2009). Lack of farm inputs including seed (20.7 percent),
chemical fertilizer (3.6 percent) and oxen (8.1%) are mentioned by the respondents as
the second most important impediments. Out of the three farm inputs mentioned by
the framers, the problem emerging from lack of seed (20.7 percent) outweighs the other
two while the problem from lack of drought oxen rests as the second most important
barrier. According to 17.1 percent of the sampled respondents, shortage of land plays a
key role in diminishing their potential to adapt to climate change. An independent
sample t-test showed that these respondents have significantly (p < 0.05) lower average
land size compared to the rest of the respondents who did not mention shortage of
land as a major barrier. The surveyed farmers also mentioned lack of money (14.4 per-
cent) as another important climate change adaptation barrier. This result further

Figure 7 Barriers to adaptation. The X-axis shows the different barriers to adaptation faced by farmerswhile the heights of the bars correspond to the percent of respondents who mentioned each barrier.
Tessema et al. Agricultural and Food Economics Page 14 of 172013, 1:13http://www.agrifoodecon.com/content/1/1/13
signifies the importance of financial resources in adaptation to climate change. The
other barriers mentioned by the farmers include: lack of water, lack of labor, inse-
cure land tenure and lack of market access. In general, the findings are similar to
other studies in the country (Deressa et al. 2009; Deressa et al. 2011; Bryan et al.
2009; Maddison 2007).
ConclusionsThe research was carried out in three districts in East Hararghe Zone of Ethiopia
where 110 farm households were randomly considered for the study. All of the
surveyed farm households observed at least one type of climate change over the
last 20 years primarily based on their life experience. Planting trees was found to
be the single most common adaptation strategy in the study area. The majority of
farmers (89.1 percent) adapted to climate change either by planting trees as a sole
response or by taking at least one adaptation measure on top of it. Apart from tree
planting, the main adaptation strategies taken by the households include: early
planting, terracing, irrigation, water harvesting and praying. The majority of
farmers learned about their adaptation strategies from extension services. Hence,
the dominance of tree planting as an adaptation measure may be associated with
the interventions of the extension system. Moreover, most farmers misconceived
that the major cause of climate change is deforestation, which may indicate tree
planting decisions could have been taken by the farmers partly as a mitigation
strategy. There is a need to provide information to farmers and extension workers
on the basics of climate change including its causes and what they should expect
from tree planting as an adaptation strategy.
An MNL model was fitted on the data where the choices of adaptation to climate
change make the dependent variable. Different socioeconomic, institutional and

Tessema et al. Agricultural and Food Economics Page 15 of 172013, 1:13http://www.agrifoodecon.com/content/1/1/13
agro-ecological variables were hypothesized to influence adaptation decisions and
were included in the model. Households with higher access to farmer-to-farmer ex-
tension, a proxy for social capital and access to informal extension services showed
higher probability of taking adaptation responses. Farm households with higher in-
come and better access to selling markets are more likely in taking adaptation mea-
sures. However, farmers tend to adapt more when they use purchasing markets
located further. Farmers travelling to further input markets may be advantageous in
being introduced with various technologies or inputs which increases their chance of
adopting more adaptation strategies. This result also emphasizes the need to assess
the homogeneity of markets before taking distance from markets as an indicator for
market access.
With more non-farm income and credit, farmers will adapt less to climate change.
Farmers with higher non-farm income may be slow in taking more adaptation mea-
sures as non-farm activities by themselves act as adaptation measures. Households who
have access to credit may also be already engaged in different farm investments that
improve their adaptive capacity to climate change, making less likely adaptive measures
taken for climate change.
The surveyed farmers were asked about the most important barriers they face in
adapting to climate change. The most frequently mentioned barrier is lack of informa-
tion followed by lack of seed, shortage of land, lack of money, lack of oxen, lack of
water, shortage of labor, lack of fertilizer, insecure land tenure and lack of market ac-
cess, listed according to their importance. The result underscores the need for strength-
ening the extension system of the country in providing information on adaptation
strategies and supplying agricultural inputs and particularly improved seeds. Enhancing
the capacity of rural credit institutions is also an important element in supporting au-
tonomous climate change adaptations at farm level.
In a nutshell, the study results indicate an information gap in the public extension
system and among farmers about the causes of climate change, adaptation strategies
and their performance. Planting trees as an adaptation measure should not be
overemphasized and the extension system should introduce diverse adaptation options
to climate change. Interventions that enhance income, access to finance, access to
farm inputs, access to market and diversification of enterprises should be an integral
part of climate change adaptation policies and strategies. It is also recommended that
social capital should be utilized in national or regional interventions towards climate
change adaptation of smallholder farmers.
Competing interestsThe authors declare that they have no competing interests.
Authors’ contributionYAT came up with the initial idea for the research project and has been highly involved in data collection, analysis,interpretation and write up of the manuscript. CSA contributed ideas in the research proposal and has been alsoinvolved in data collection and write up of the manuscript. GSE contributed ideas in the research proposal and hasbeen also involved in data collection and write up of the manuscript. All authors read and approved the finalmanuscript.
AcknowledgementThe authors are grateful for the valuable comments of three anonymous reviewers.
Author details1School of Agricultural Economics and Agribusiness, Haramaya University, Dire Dawa, Ethiopia. 2Department of RuralDevelopment and Agricultural Extension, Haramaya University, Dire Dawa, Ethiopia.

Tessema et al. Agricultural and Food Economics Page 16 of 172013, 1:13http://www.agrifoodecon.com/content/1/1/13
Received: 11 December 2012 Accepted: 8 October 2013Published:
References
21 Oct 2013
Abodi PN, et al. (2007) An Economic Assessment of Banana Genetic Improvement and Innovation in the Lake VictoriaRegion of Uganda and Tanzania. In: Smale M, Tushemereirwe WK (ed). International Food Policy Research Institute,Washington, D.C
ACCCA (2010) Farm – Level Climate change Perception and Adaptation in Drought Prone Areas of Tigray, NorthernEthiopia. Improving decision-making capacity of smallholder farmers in response to climate risk adaptation in threedrought-prone districts of Tigray, northern Ethiopia Vol 3. Advancing capacity to Support Climate ChangeAdaptation (ACCCA), Mekelle
Adesina AA, Baidu-Forson J (1995) Farmers’ perceptions and adoption of new agricultural technology: evidence fromanalysis in Burkina Faso and Guinea, West Africa. Agric Econ 13:1–9
Akponikpè PBI, Johnston P, Agbossou EK (2010) Farmers’ perception of climate change and adaptation strategies inSub-Saharan West-Africa. In: 2nd International Conference: Climate. Sustainability and Development in Semi-aridRegions, Fortaleza - Ceará, Brazil. ICID + 18
Allison P (2002) Sage Monograph on Missing Data, Sage paper # 136. Sage, USAAsfaw S, Shiferaw B, Simtowe F, Haile MG (2011) Agricultural technology adoption, seed access constraints and
commercialization in Ethiopia. J Dev Agri Econ 3(9):436–447Barrett CB (2006) Food Aid’s Intended and Unintended Consequences. FAO, RomeBryan E, Deressa TT, Gbetibouo GA, Ringler C (2009) Adaptation to climate change in Ethiopia and South Africa:
options and constraints. Environ Sci Policy 12:413–426CIMMYT (1998) The Adoption of Agricultural Technology: A Guide for Survey Design. CIMMYT, Mexico, DFConley T, Udry C (2001) Social learning through networks: The adoption of new agricultural technologies in Ghana. Am
J Agric Econ 83:668–673Croppenstedt A, Demeke M, Meschi MM (2003) Technology adoption in the presence of constraints: the case of
fertilizer demand in Ethiopia. Rev Dev Econ 7(1):58–70CSA (2007) Statistical Tables for the 2007 Population and Housing Census of Ethiopia. Central Statistical Agency, Addis
AbabaCSA (Central Statistics Authority) (2004) The Federal Democratic Republic of Ethiopia Statistical abstract for 2003. CSA,
Addis AbabaDeressa TT, Hassan RM, Ringler C, Alemu T, d MY (2009) Determinants of farmers’ choice of adaptation methods to
climate change in the Nile Basin of Ethiopia. Global Environ Change 19:248–255Deressa TT, Hassan RM, Ringler C (2011) Perception of an adaptation to climate change by farmers in the Nile basin of
Ethiopia. J Agri Sci 149:23–31. 10.1017/S0021859610000687Doss CR (2003) Understanding Farm-level Technology Adoption: Lessons Learned from CIMMYT’s Micro Surveys in
Eastern Africa. Economics Working Paper 03–07. CIMMYT, Mexico, DFFalco SD, Yesuf M, Kohlin G (2011) What Adaptation to Climate Change? Evidence from the Nile Basin, Ethiopia. In:
International Conference on Economics of Adaptation to Climate Change in Low-Income Countries. EthiopianDevelopment Research Institute and International Food Policy Research Institute, Washington, DC
Foster AD, Rosenzweig MR (2010) Microeconomics of Technology Adoption,Center Discussion Paper NO.984. YaleUniversity, Newhaven, USA
Fosu-Mensah BY, et al. (2010) Farmers’ Perception and Adaptation to Climate Change; A Case Study of SekyedumaseDistrict in Ghana. World Food System — A Contribution from Europe, Zurich, Swizerland, Tropentag, InternationalResearch on Food Security, Natural Resource Management and Rural Development, Tropentag
Gbetibouo GA (2009) Understanding Farmers’ Perceptions and Adaptations to Climate Change and Variability: The Caseof the Limpopo Basin, South Africa (trans: Division EaPT). IFPRI–wide Discussion Paper. International Food PolicyResearch Institute, South Africa
Greene WH (2003) Econometric Analysis. Prentice-Hall, Upper Saddle RiverNJILRI (2006) Mapping Climate Vulnerability and Poverty in Africa. International Livestock Research Institute, Nairobi, KenyaIPCC (2001) Climate Change 2001: Synthesis Report. A Contribution of Working Groups I, II, III to the Third Assessment
Report of the Intergovernmental Panel on Climate Change. R. T. Watson and the Core Team, Cambridge and NewYork, p 398
IPCC (2007) Climate Change 2007: The Physical Science Basis. Contribution of Working Group I to the FourthAssessment Report of the Intergovernmental Panel on Climate Change, Cambridge, United Kingdom and NewYork, NY, USA
Isham J (2000) The Effect of Social Capital on Technology Adoption: Evidence from Rural Tanzania. Opportunities inAfrica: Micro-evidence on Firms and Households. The Centre for the Study of African Economies, University ofOxford, Oxford
Jack (2011) Constraints on the adoption of agricultural technologies in developing countries. White paper, AgriculturalTechnology Adoption Initiative. J-PAL (MIT) and CEGA, UC Berkeley
Jariko GA, Junejo MA, Rahpoto MS, Shah MZ (2011) Socioeconomic factors affecting adoption of sunflower varieties inSindh. Pak J Commer Soc Sci 5(1):192–201
Katungi EM (2007) Social Capital and Technology Adoption on Small Farms: The Case of Banana ProductionTechnology in Uganda. PhD Dessertation. Department of Agricultural Econmics, Extension and Rural Development,University of Pretoria, Pretoria
Lautze S, Aklilu Y, Raven-Roberts A, Young H, Kebede G, Leaning J (2003) Risk and Vulnerability in Ethiopia: Learningfrom the Past, Responding to the Present. Preparing for the Future, Addis Ababa
Long JS, Freese J (2001) Regression Models for Categorical Dependent Variables Using Stata. A Stata Press Publication,STATA Corporation, College Station, Texas
Madalla G (1983) Limited Dependent and Qualitative Variables in Econometrics. Cambridge University Press, Cambridge

Tessema et al. Agricultural and Food Economics Page 17 of 172013, 1:13http://www.agrifoodecon.com/content/1/1/13
Maddison D (2007) The Perception of an Adaptation to Climate Change in Africa. Policy Research Working Paper. TheWorld Bank, Development Research Group, Sustainable Rural and Urban Development Team, Pretoria, South Africa
Maharjan SK, Sigdel ER, Sthapit BR, Regmi4 BR (2011) Tharu community’s perception on climate changes and theiradaptive initiations to withstand its impacts in Western Terai of Nepal. Int NGO J 6(2):35–42
McSweeney C, Lizcano G, New M, Lu X (2010) The UNDP Climate Change Country Profiles. Available via http://journals.ametsoc.org/doi/abs/10.1175/2009BAMS2826.1. Accessed 26 Nov 2012)
Nhemachena C, Hassan RM (2007) Micro-Level Analysis of Farmers’ Adaptation to Climate Change in Southern Africa.IFPRI Discussion Paper No. 714, vol 15–7. International Food Policy Research Institute, Washington, DC
Niemistö N (2011) The resilience of rural Ethiopian livelihoods, a case study from Hararghe zone. University of Jyväskylä,Eastern Ethiopia
Nzeadibe TC, Egbule CL, Chukwuone NA, Agu VC (2011) Climate Change Awareness and Adaptation in the Niger DeltaRegion of Nigeria. African Technology Policy Studies Network, Nairobi
ONRSPO (n.d) Socio-economic Profile of East Hararghe. Oromia National Reginal State President Office. Available viahttp://www.oromiyaa.com/index.php?option = com_content&view = category&layout = blog&id = 114&Itemid = 788.Accessed 10 Dec 2012
Paudel K, Pandit M, Mishra A, Segarra E (2011) Why Don’t Farmers Adopt Precision Farming Technologies in CottonProduction? In: Agricultural & Applied Economics Association’s 2011 AAEA & NAREA Joint Annual Meeting.Agricultural and Applied Economics Association, Pittsburgh, Pennsylvania
Smit B, Pilifosova O (2001) Adaptation to Climate Change in the Context of Sustainable Development and Equity.Contribution of the Working Group to the Third Assessment Report of the Intergovernmental Panel on ClimateChange. Cambridge University Press, Cambridge, UK, pp 879–912
Sofoluwe NA, Tijani AA, Baruwa OI (2011) Farmers’ perception and adaptation to climate change in Osun State, Nigeria.Afr J Agri Res 6(20):4789–4794
Stige LC, Stave J, Chan K, Ciannelli L, Pattorelli N, Glantz M, Herren H, Stenseth N (2006) The effect of climate variationon agro-pastoral production in Africa. PNAS 103:3049–3053
Strzepek K, Mccluskey A (2006) District Level Hydro-climatic Time Series and Scenario Analysis to Assess the Impacts ofClimate Change on Regional Water Resources and Agriculture in Africa. CEEPA Discussion Paper No. 13, Pretoria,South Africa
Tadege A (2007) Climate Change National Adaptation Program of Action (NAPA) of Ethiopia. NMS (NationalMeteorological Agency), Federal Democratic Republic of Ethiopia Addis Ababa
Uaiene RN, CA, Masters WA (2009) Determinants of Agricultural Technology Adoption in Mozambique. Ministry ofPlanning and Development, Republic of Mozambique
Vedwan N, Rhoades RE (2001) Climate change in the Western Himalayas of India: a study of local perception andresponse. Climate Res 19:109–117
Wilson K, Getnet M (2011) Investigating how development interventions increase community-level adaptive capacity inEthiopia. In the New Voices, Different Perspectives: Proceedings of the AfricaAdapt Climate Change Symposium2011. Addis Ababa, Ethiopia
Yirga CT (2007) The dynamics of soil degradation and incentives for optimal management in Central Highlands ofEthiopia. University of Pretoria, Pretoria, South Africa
Cite this article as: Tessema et al.: Understanding the process of adaptation to climate change by small-holderfarmers: the case of east Hararghe Zone, Ethiopia. Agricultural and Food Economics
10.1186/2193-7532-1-13
2013, 1:13
Submit your manuscript to a journal and benefi t from:
7 Convenient online submission
7 Rigorous peer review
7 Immediate publication on acceptance
7 Open access: articles freely available online
7 High visibility within the fi eld
7 Retaining the copyright to your article
Submit your next manuscript at 7 springeropen.com