research open access suitability analysis for rice growing
TRANSCRIPT
a SpringerOpen Journal
Kihoro et al. SpringerPlus 2013, 2:265http://www.springerplus.com/content/2/1/265
RESEARCH Open Access
Suitability analysis for rice growing sites using amulticriteria evaluation and GIS approach in greatMwea region, KenyaJoseph Kihoro*, Njoroge J Bosco and Hunja Murage
Abstract
Land suitability analysis is a prerequisite to achieving optimum utilization of the available land resources. Lack ofknowledge on best combination of factors that suit production of rice has contributed to the low production. Theaim of this study was to develop a suitability map for rice crop based on physical and climatic factors of productionusing a Multi-Criteria Evaluation (MCE) & GIS approach. The study was carried out in Kirinyaga, Embu and Mbereecounties in Kenya. Biophysical variables of soil, climate and topography were considered for suitability analysis.All data were stored in ArcGIS 9.3 environment and the factor maps were generated. For MCE, Pairwise ComparisonMatrix was applied and the suitable areas for rice crop were generated and graduated. The current land cover mapof the area was developed from a scanned survey map of the rice growing areas. According to the present landcover map, the rice cultivated area was 13,369 ha. Finally, we overlaid the land cover map with the suitability mapto identify variances between the present and potential land use. The crop-land evaluation results of the presentstudy showed that, 75% of total area currently being used was under highly suitable areas and 25% was undermoderately suitable areas. The results showed that the potential area for rice growing is 86,364 ha and out of thisonly 12% is under rice cultivation. This research provided information at local level that could be used by farmers toselect cropping patterns and suitability.
Keywords: Rice production area; Bio-physical Factors; Climatic factors; GIS; Land use variance;Land suitability analysis
IntroductionRice is rapidly becoming a major food in much ofsub-Saharan Africa and is set to overtake maize, cassava,sorghum, and other cereals in the near future. The de-mand is driven as much by population growth as byurbanization. In addition, the high cost of fuel makesrice attractive as it can be prepared quickly and with lessenergy requirement (Mati and Nyamai 2009). WithinKenya, the demand for rice continues to grow as moreKenyans make changes in their eating habits, and asurban population increases. Rice is currently the thirdmost important cereal crop after maize and wheat. Riceis gaining popularity among the rural folk as well andconsumption has risen dramatically over the last threeyears to stand at 300,000 metric tons per annum. But
* Correspondence: [email protected] Kenyatta University of Agriculture and Technology, 62000 – 00200,Nairobi, Kenya
© 2013 Kihoro et al.; licensee Springer. This is aAttribution License (http://creativecommons.orin any medium, provided the original work is p
the annual ranges between 40,000 and 80,000 t. The def-icit is met through imports (Mati et al. 2011).Optimizing rice production can be achieved through
sustainable agriculture or farming. The concept of sus-tainable agriculture or farming involves producing qual-ity products in an environmentally benign, sociallyacceptable and economically efficient way (Addeo et al.2001), ensuring optimum utilization of the available nat-ural resource for efficient agricultural production. Inorder to comply with these principles of sustainable agri-culture, one has to grow the crops where they suit bestand for which first and the foremost requirement is tocarry out land suitability analysis (Nisar Ahamed et al.2000). Suitability is a function of crop requirements andland characteristics (Mustafa et al. 2011). Matching theland characteristics with the crop requirements gives thesuitability. So, ‘Suitability is a measure of how well the qual-ities of a land unit match the requirements of a particular
n Open Access article distributed under the terms of the Creative Commonsg/licenses/by/2.0), which permits unrestricted use, distribution, and reproductionroperly cited.
Kihoro et al. SpringerPlus 2013, 2:265 Page 2 of 9http://www.springerplus.com/content/2/1/265
form of land use’. (FAO 1976). Land suitability analysis hasto be carried out in such a way that local needs and condi-tions are reflected well in the final decisions (Prakash2003).Multi-Criteria Evaluation (MCE) approaches and
GIS is useful because various production variables canbe evaluated and each weighted according to theirrelative importance on the optimal growth conditionsfor crops (Perveen et al. 2007). However, the overlay
KIRINYAGA
37
37
37°20'0"E
37°20'0"E
37°10'0"E
37°10'0"E
0°10'0"S
0°20'0"S
0°30'0"S
0°40'0"S
0°50'0"S
43°0'0"E
43°0'0"E
41°0'0"E
41°0'0"E
39°0'0"E
39°0'0"E
37°0'0"E
37°0'0"E
35°0'0"E
35°0'0"E
33°0'0"E
33°0'0"E
5°0'0"N 5°0'0"N
4°0'0"N 4°0'0"N
3°0'0"N 3°0'0"N
2°0'0"N 2°0'0"N
1°0'0"N 1°0'0"N
0°0'0" 0°0'0"
1°0'0"S 1°0'0"S
2°0'0"S 2°0'0"S
3°0'0"S 3°0'0"S
4°0'0"S 4°0'0"S
5°0'0"S 5°0'0"S
DIVISI
G
G
M
M
M
M
N
R
S
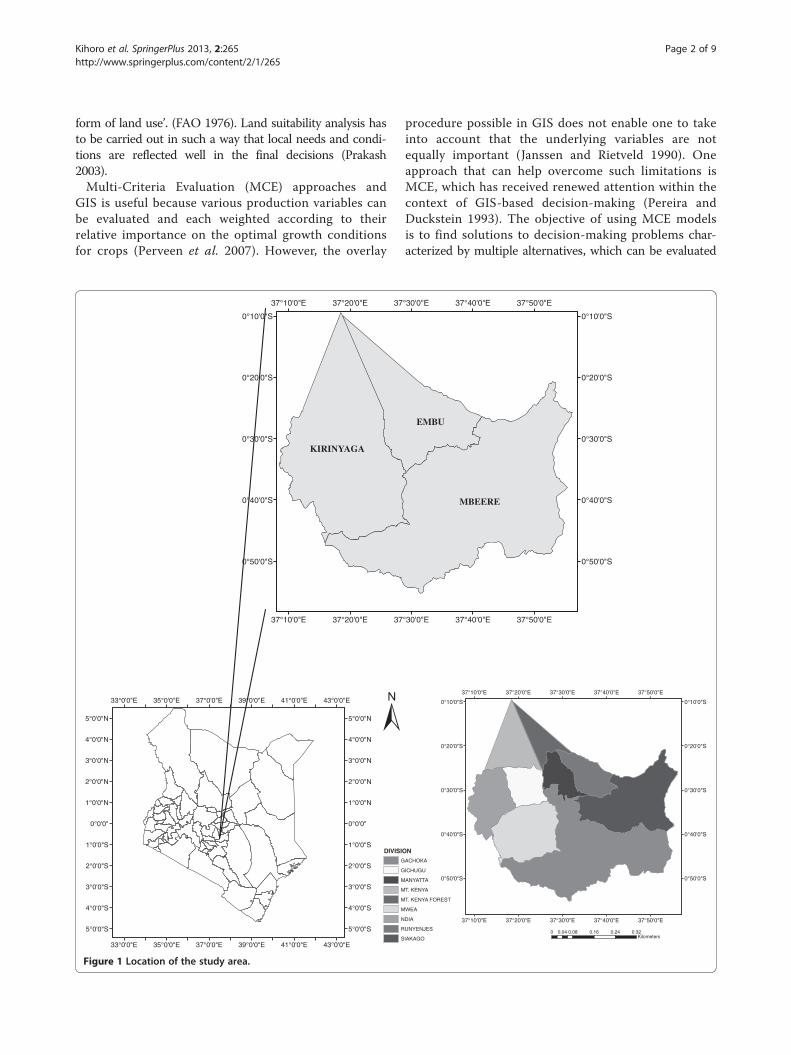
Figure 1 Location of the study area.
procedure possible in GIS does not enable one to takeinto account that the underlying variables are notequally important (Janssen and Rietveld 1990). Oneapproach that can help overcome such limitations isMCE, which has received renewed attention within thecontext of GIS-based decision-making (Pereira andDuckstein 1993). The objective of using MCE modelsis to find solutions to decision-making problems char-acterized by multiple alternatives, which can be evaluated
MBEERE
EMBU
37°50'0"E
37°50'0"E
37°40'0"E
37°40'0"E
°30'0"E
°30'0"E
0°10'0"S
0°20'0"S
0°30'0"S
0°40'0"S
0°50'0"S
ON
ACHOKA
ICHUGU
ANYATTA
T. KENYA
T. KENYA FOREST
WEA
DIA
UNYENJES
IAKAGO0 0.08 0.16 0.24 0.320.04
Kilometers
37°50'0"E
37°50'0"E
37°40'0"E
37°40'0"E
37°30'0"E
37°30'0"E
37°20'0"E
37°20'0"E
37°10'0"E
37°10'0"E
0°10'0"S 0°10'0"S
0°20'0"S 0°20'0"S
0°30'0"S 0°30'0"S
0°40'0"S 0°40'0"S
0°50'0"S 0°50'0"S
Climate data Soil map Elevation
Decide which datasets are needed as inputs
Step 1
Derive datasets. Create data from existing data to gain new information
Step 2
Humidity Temperature Soil texture Soil pH Soil drainage Slope
Step 3
Reclassify Reclassify Reclassify Reclassify Reclassify Reclassify
Reclassification of Maps
Pairwise Comparison (CR<0.1) Weighed of each
element in the hierarchy
Standardization of Suitability classes
Development of Hierarchy structure
Assign the score to each class
Suitability map
Present Land use Suitability map
Potential sites
Overlaying (Weighted sum)
Step 4
Apply MCEStep 5
Integrating MCE with GIS
Step 6p
Overlay Present Land use and the Suitability Map
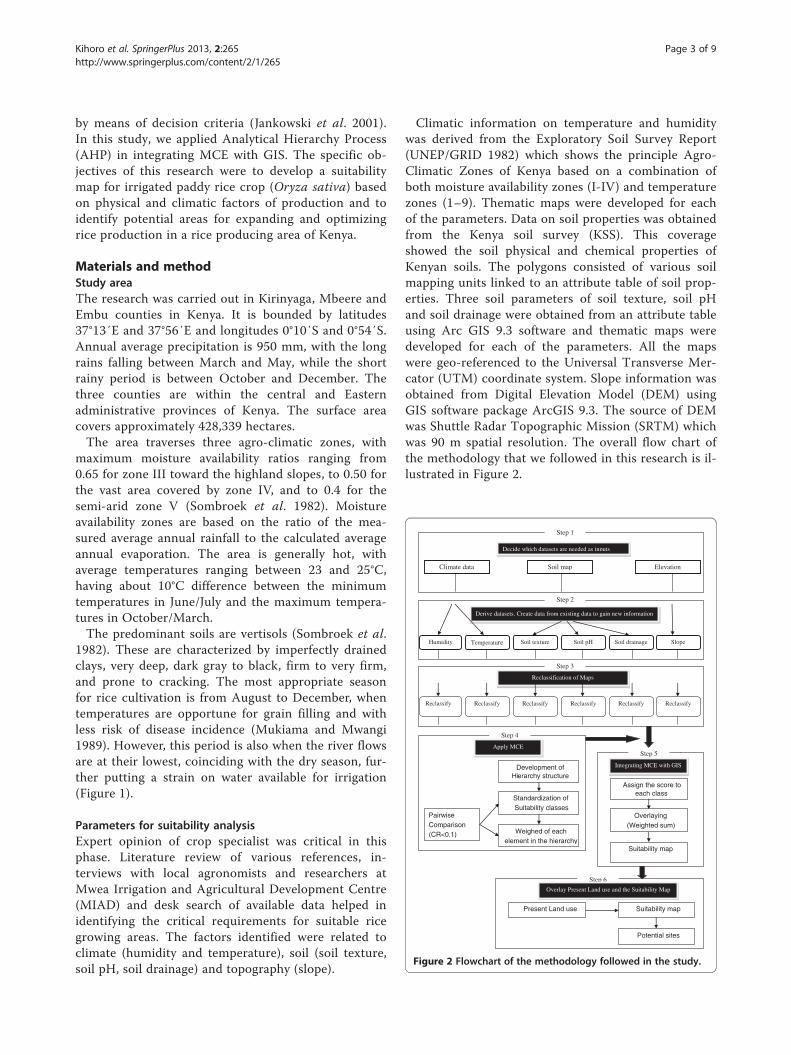
Figure 2 Flowchart of the methodology followed in the study.
Kihoro et al. SpringerPlus 2013, 2:265 Page 3 of 9http://www.springerplus.com/content/2/1/265
by means of decision criteria (Jankowski et al. 2001).In this study, we applied Analytical Hierarchy Process(AHP) in integrating MCE with GIS. The specific ob-jectives of this research were to develop a suitabilitymap for irrigated paddy rice crop (Oryza sativa) basedon physical and climatic factors of production and toidentify potential areas for expanding and optimizingrice production in a rice producing area of Kenya.
Materials and methodStudy areaThe research was carried out in Kirinyaga, Mbeere andEmbu counties in Kenya. It is bounded by latitudes37°13′E and 37°56′E and longitudes 0°10′S and 0°54′S.Annual average precipitation is 950 mm, with the longrains falling between March and May, while the shortrainy period is between October and December. Thethree counties are within the central and Easternadministrative provinces of Kenya. The surface areacovers approximately 428,339 hectares.The area traverses three agro-climatic zones, with
maximum moisture availability ratios ranging from0.65 for zone III toward the highland slopes, to 0.50 forthe vast area covered by zone IV, and to 0.4 for thesemi-arid zone V (Sombroek et al. 1982). Moistureavailability zones are based on the ratio of the mea-sured average annual rainfall to the calculated averageannual evaporation. The area is generally hot, withaverage temperatures ranging between 23 and 25°C,having about 10°C difference between the minimumtemperatures in June/July and the maximum tempera-tures in October/March.The predominant soils are vertisols (Sombroek et al.
1982). These are characterized by imperfectly drainedclays, very deep, dark gray to black, firm to very firm,and prone to cracking. The most appropriate seasonfor rice cultivation is from August to December, whentemperatures are opportune for grain filling and withless risk of disease incidence (Mukiama and Mwangi1989). However, this period is also when the river flowsare at their lowest, coinciding with the dry season, fur-ther putting a strain on water available for irrigation(Figure 1).
Parameters for suitability analysisExpert opinion of crop specialist was critical in thisphase. Literature review of various references, in-terviews with local agronomists and researchers atMwea Irrigation and Agricultural Development Centre(MIAD) and desk search of available data helped inidentifying the critical requirements for suitable ricegrowing areas. The factors identified were related toclimate (humidity and temperature), soil (soil texture,soil pH, soil drainage) and topography (slope).
Climatic information on temperature and humiditywas derived from the Exploratory Soil Survey Report(UNEP/GRID 1982) which shows the principle Agro-Climatic Zones of Kenya based on a combination ofboth moisture availability zones (I-IV) and temperaturezones (1–9). Thematic maps were developed for eachof the parameters. Data on soil properties was obtainedfrom the Kenya soil survey (KSS). This coverageshowed the soil physical and chemical properties ofKenyan soils. The polygons consisted of various soilmapping units linked to an attribute table of soil prop-erties. Three soil parameters of soil texture, soil pHand soil drainage were obtained from an attribute tableusing Arc GIS 9.3 software and thematic maps weredeveloped for each of the parameters. All the mapswere geo-referenced to the Universal Transverse Mer-cator (UTM) coordinate system. Slope information wasobtained from Digital Elevation Model (DEM) usingGIS software package ArcGIS 9.3. The source of DEMwas Shuttle Radar Topographic Mission (SRTM) whichwas 90 m spatial resolution. The overall flow chart ofthe methodology that we followed in this research is il-lustrated in Figure 2.
Kihoro et al. SpringerPlus 2013, 2:265 Page 4 of 9http://www.springerplus.com/content/2/1/265
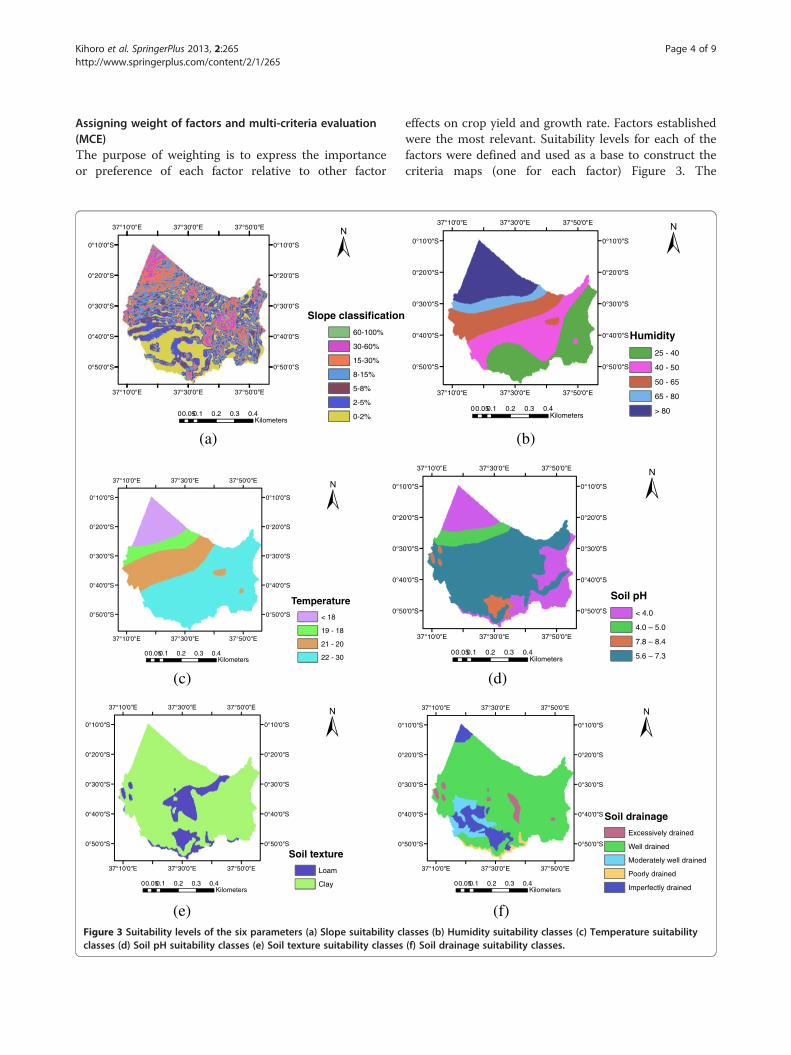
Assigning weight of factors and multi-criteria evaluation(MCE)The purpose of weighting is to express the importanceor preference of each factor relative to other factor
0 0.1 0.2 0.3 0.40.05Kilometers
Slope classification
60-100%
30-60%
15-30%
8-15%
5-8%
2-5%
0-2%
37°50'0"E
37°50'0"E
37°30'0"E
37°30'0"E
37°10'0"E
37°10'0"E
0°10'0"S 0°10'0"S
0°20'0"S 0°20'0"S
0°30'0"S 0°30'0"S
0°40'0"S 0°40'0"S
0°50'0"S 0°50'0"S
Temperature
< 18
19 - 18
21 - 20
22 - 300 0.1 0.2 0.3 0.40.05
Kilometers
37°50'0"E
37°50'0"E
37°30'0"E
37°30'0"E
37°10'0"E
37°10'0"E
0°10'0"S 0°10'0"S
0°20'0"S 0°20'0"S
0°30'0"S 0°30'0"S
0°40'0"S 0°40'0"S
0°50'0"S 0°50'0"S
0°1
0°2
0°3
0°4
0°5
Soil texture
Loam
Clay0 0.1 0.2 0.3 0.40.05Kilometers
37°50'0"E
37°50'0"E
37°30'0"E
37°30'0"E
37°10'0"E
37°10'0"E
0°10'0"S 0°10'0"S
0°20'0"S 0°20'0"S
0°30'0"S 0°30'0"S
0°40'0"S 0°40'0"S
0°50'0"S 0°50'0"S
0°
0°
0°
0°
0°
(c)
(a)
(e)Figure 3 Suitability levels of the six parameters (a) Slope suitability cclasses (d) Soil pH suitability classes (e) Soil texture suitability classes
effects on crop yield and growth rate. Factors establishedwere the most relevant. Suitability levels for each of thefactors were defined and used as a base to construct thecriteria maps (one for each factor) Figure 3. The
Humidity
25 - 40
40 - 50
50 - 65
65 - 80
> 80
37°50'0"E
37°50'0"E
37°30'0"E
37°30'0"E
37°10'0"E
37°10'0"E
0°10'0"S 0°10'0"S
0°20'0"S 0°20'0"S
0°30'0"S 0°30'0"S
0°40'0"S 0°40'0"S
0°50'0"S 0°50'0"S
0 0.1 0.2 0.3 0.40.05Kilometers
Soil pH
< 4.0
4.0 – 5.0
7.8 – 8.4
5.6 – 7.30 0.1 0.2 0.3 0.40.05Kilometers
37°50'0"E
37°50'0"E
37°30'0"E
37°30'0"E
37°10'0"E
37°10'0"E
0'0"S 0°10'0"S
0'0"S 0°20'0"S
0'0"S 0°30'0"S
0'0"S 0°40'0"S
0'0"S 0°50'0"S
Soil drainage
Excessively drained
Well drained
Moderately well drained
Poorly drained
Imperfectly drained0 0.1 0.2 0.3 0.40.05
Kilometers
37°50'0"E
37°50'0"E
37°30'0"E
37°30'0"E
37°10'0"E
37°10'0"E
10'0"S 0°10'0"S
20'0"S 0°20'0"S
30'0"S 0°30'0"S
40'0"S 0°40'0"S
50'0"S 0°50'0"S
(b)
(d)
(f)lasses (b) Humidity suitability classes (c) Temperature suitability(f) Soil drainage suitability classes.
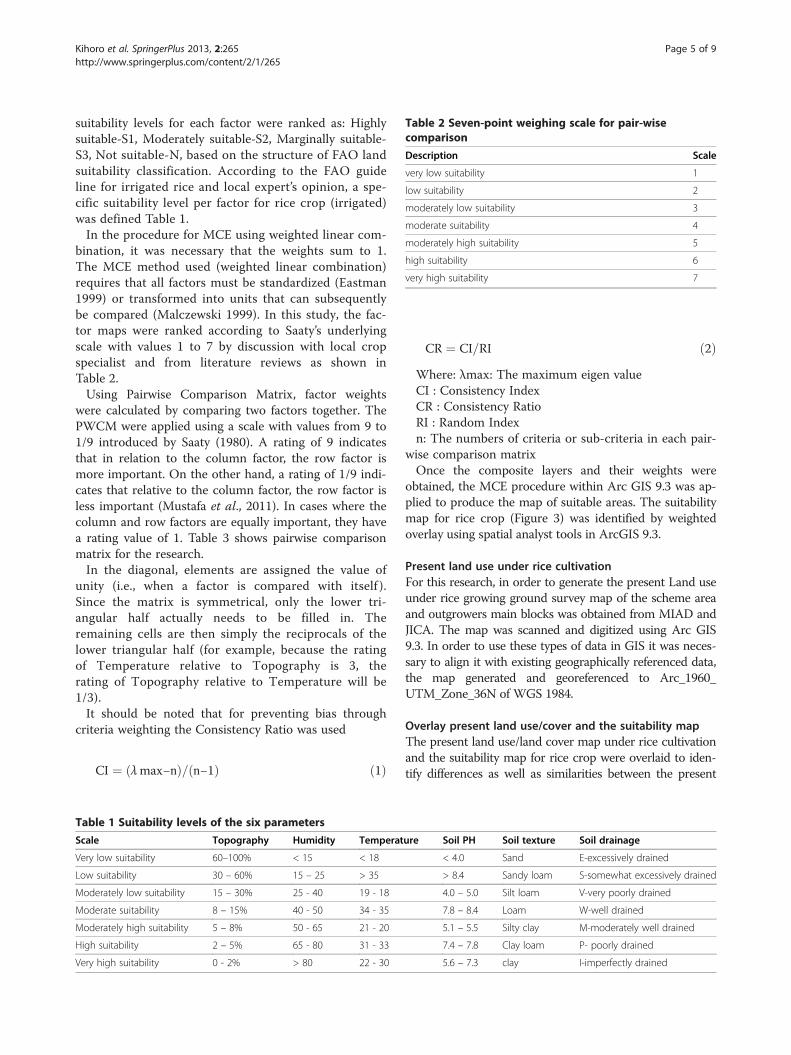
Table 2 Seven-point weighing scale for pair-wisecomparison
Description Scale
very low suitability 1
low suitability 2
moderately low suitability 3
moderate suitability 4
moderately high suitability 5
high suitability 6
very high suitability 7
Kihoro et al. SpringerPlus 2013, 2:265 Page 5 of 9http://www.springerplus.com/content/2/1/265
suitability levels for each factor were ranked as: Highlysuitable-S1, Moderately suitable-S2, Marginally suitable-S3, Not suitable-N, based on the structure of FAO landsuitability classification. According to the FAO guideline for irrigated rice and local expert’s opinion, a spe-cific suitability level per factor for rice crop (irrigated)was defined Table 1.In the procedure for MCE using weighted linear com-
bination, it was necessary that the weights sum to 1.The MCE method used (weighted linear combination)requires that all factors must be standardized (Eastman1999) or transformed into units that can subsequentlybe compared (Malczewski 1999). In this study, the fac-tor maps were ranked according to Saaty’s underlyingscale with values 1 to 7 by discussion with local cropspecialist and from literature reviews as shown inTable 2.Using Pairwise Comparison Matrix, factor weights
were calculated by comparing two factors together. ThePWCM were applied using a scale with values from 9 to1/9 introduced by Saaty (1980). A rating of 9 indicatesthat in relation to the column factor, the row factor ismore important. On the other hand, a rating of 1/9 indi-cates that relative to the column factor, the row factor isless important (Mustafa et al., 2011). In cases where thecolumn and row factors are equally important, they havea rating value of 1. Table 3 shows pairwise comparisonmatrix for the research.In the diagonal, elements are assigned the value of
unity (i.e., when a factor is compared with itself ).Since the matrix is symmetrical, only the lower tri-angular half actually needs to be filled in. Theremaining cells are then simply the reciprocals of thelower triangular half (for example, because the ratingof Temperature relative to Topography is 3, therating of Topography relative to Temperature will be1/3).It should be noted that for preventing bias through
criteria weighting the Consistency Ratio was used
CI ¼ λmax−nð Þ= n−1ð Þ ð1Þ
Table 1 Suitability levels of the six parameters
Scale Topography Humidity Temperat
Very low suitability 60–100% < 15 < 18
Low suitability 30 – 60% 15 – 25 > 35
Moderately low suitability 15 – 30% 25 - 40 19 - 18
Moderate suitability 8 – 15% 40 - 50 34 - 35
Moderately high suitability 5 – 8% 50 - 65 21 - 20
High suitability 2 – 5% 65 - 80 31 - 33
Very high suitability 0 - 2% > 80 22 - 30
CR ¼ CI=RI ð2ÞWhere: λmax: The maximum eigen valueCI : Consistency IndexCR : Consistency RatioRI : Random Indexn: The numbers of criteria or sub-criteria in each pair-
wise comparison matrixOnce the composite layers and their weights were
obtained, the MCE procedure within Arc GIS 9.3 was ap-plied to produce the map of suitable areas. The suitabilitymap for rice crop (Figure 3) was identified by weightedoverlay using spatial analyst tools in ArcGIS 9.3.
Present land use under rice cultivationFor this research, in order to generate the present Land useunder rice growing ground survey map of the scheme areaand outgrowers main blocks was obtained from MIAD andJICA. The map was scanned and digitized using Arc GIS9.3. In order to use these types of data in GIS it was neces-sary to align it with existing geographically referenced data,the map generated and georeferenced to Arc_1960_UTM_Zone_36N of WGS 1984.
Overlay present land use/cover and the suitability mapThe present land use/land cover map under rice cultivationand the suitability map for rice crop were overlaid to iden-tify differences as well as similarities between the present
ure Soil PH Soil texture Soil drainage
< 4.0 Sand E-excessively drained
> 8.4 Sandy loam S-somewhat excessively drained
4.0 – 5.0 Silt loam V-very poorly drained
7.8 – 8.4 Loam W-well drained
5.1 – 5.5 Silty clay M-moderately well drained
7.4 – 7.8 Clay loam P- poorly drained
5.6 – 7.3 clay I-imperfectly drained
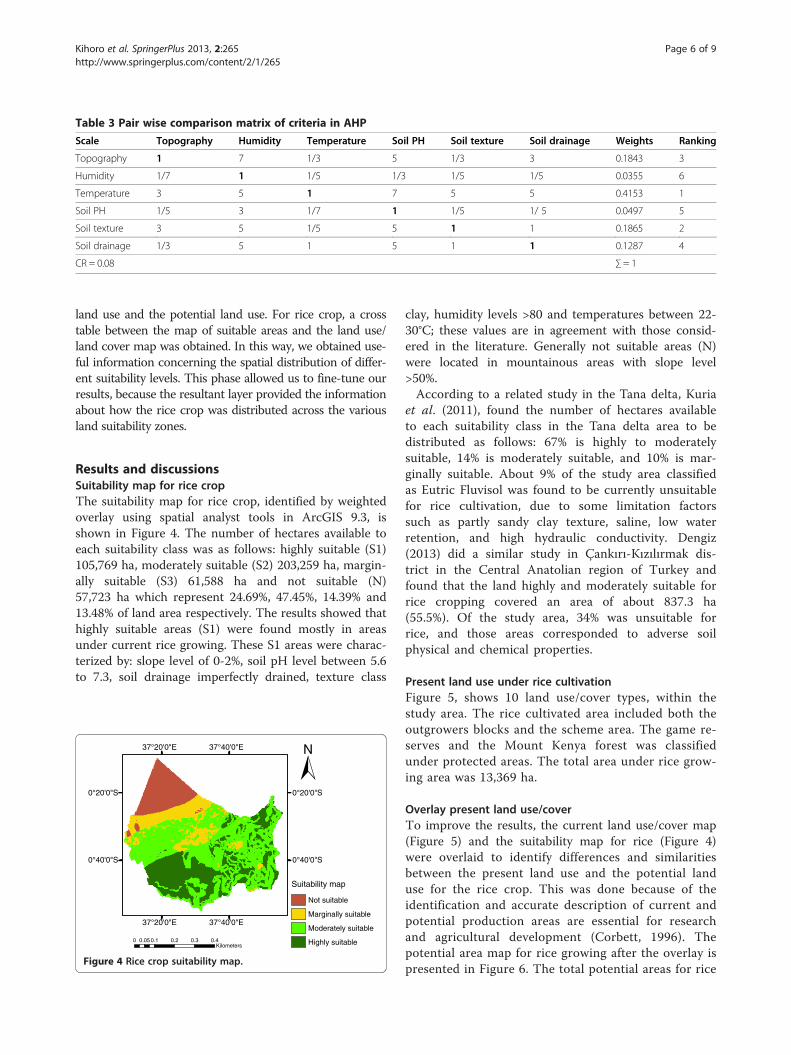
Table 3 Pair wise comparison matrix of criteria in AHP
Scale Topography Humidity Temperature Soil PH Soil texture Soil drainage Weights Ranking
Topography 1 7 1/3 5 1/3 3 0.1843 3
Humidity 1/7 1 1/5 1/3 1/5 1/5 0.0355 6
Temperature 3 5 1 7 5 5 0.4153 1
Soil PH 1/5 3 1/7 1 1/5 1/ 5 0.0497 5
Soil texture 3 5 1/5 5 1 1 0.1865 2
Soil drainage 1/3 5 1 5 1 1 0.1287 4
CR = 0.08 ∑ = 1
Kihoro et al. SpringerPlus 2013, 2:265 Page 6 of 9http://www.springerplus.com/content/2/1/265
land use and the potential land use. For rice crop, a crosstable between the map of suitable areas and the land use/land cover map was obtained. In this way, we obtained use-ful information concerning the spatial distribution of differ-ent suitability levels. This phase allowed us to fine-tune ourresults, because the resultant layer provided the informationabout how the rice crop was distributed across the variousland suitability zones.
Results and discussionsSuitability map for rice cropThe suitability map for rice crop, identified by weightedoverlay using spatial analyst tools in ArcGIS 9.3, isshown in Figure 4. The number of hectares available toeach suitability class was as follows: highly suitable (S1)105,769 ha, moderately suitable (S2) 203,259 ha, margin-ally suitable (S3) 61,588 ha and not suitable (N)57,723 ha which represent 24.69%, 47.45%, 14.39% and13.48% of land area respectively. The results showed thathighly suitable areas (S1) were found mostly in areasunder current rice growing. These S1 areas were charac-terized by: slope level of 0-2%, soil pH level between 5.6to 7.3, soil drainage imperfectly drained, texture class
0 0.1 0.2 0.3 0.40.05Kilometers
Suitability map
Not suitable
Marginally suitable
Moderately suitable
Highly suitable
37°40'0"E
37°40'0"E N
37°20'0"E
37°20'0"E
0°20'0"S 0°20'0"S
0°40'0"S 0°40'0"S
Figure 4 Rice crop suitability map.
clay, humidity levels >80 and temperatures between 22-30°C; these values are in agreement with those consid-ered in the literature. Generally not suitable areas (N)were located in mountainous areas with slope level>50%.According to a related study in the Tana delta, Kuria
et al. (2011), found the number of hectares availableto each suitability class in the Tana delta area to bedistributed as follows: 67% is highly to moderatelysuitable, 14% is moderately suitable, and 10% is mar-ginally suitable. About 9% of the study area classifiedas Eutric Fluvisol was found to be currently unsuitablefor rice cultivation, due to some limitation factorssuch as partly sandy clay texture, saline, low waterretention, and high hydraulic conductivity. Dengiz(2013) did a similar study in Çankırı-Kızılırmak dis-trict in the Central Anatolian region of Turkey andfound that the land highly and moderately suitable forrice cropping covered an area of about 837.3 ha(55.5%). Of the study area, 34% was unsuitable forrice, and those areas corresponded to adverse soilphysical and chemical properties.
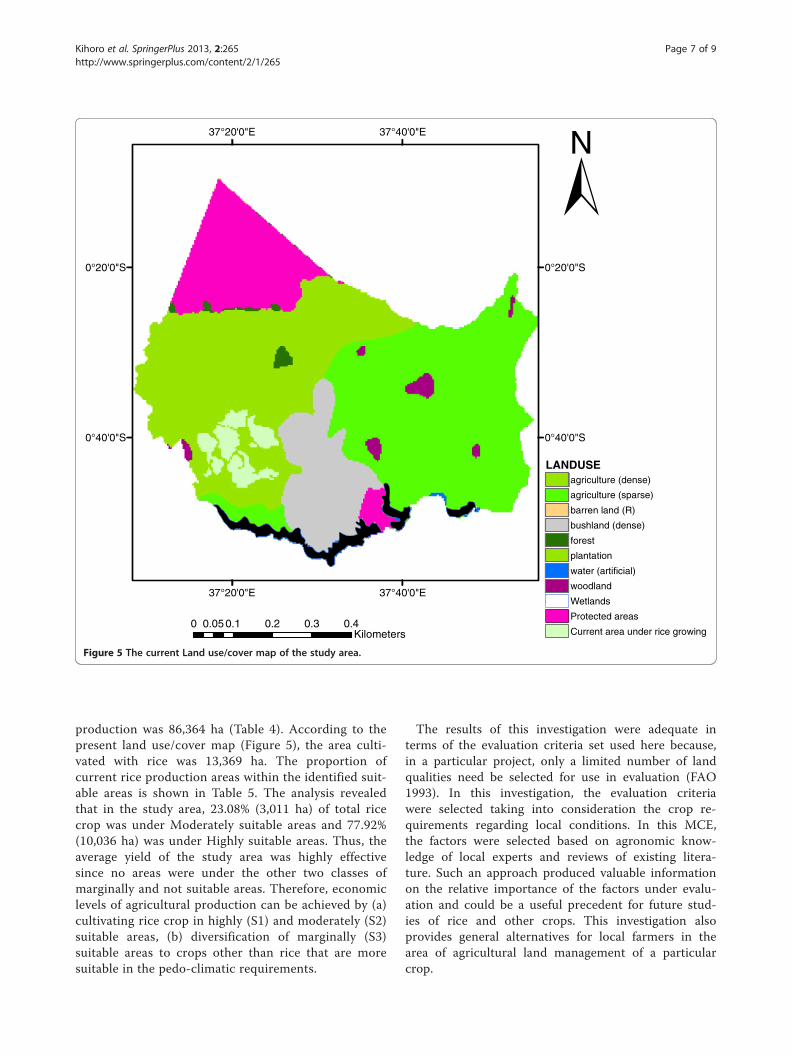
Present land use under rice cultivationFigure 5, shows 10 land use/cover types, within thestudy area. The rice cultivated area included both theoutgrowers blocks and the scheme area. The game re-serves and the Mount Kenya forest was classifiedunder protected areas. The total area under rice grow-ing area was 13,369 ha.
Overlay present land use/coverTo improve the results, the current land use/cover map(Figure 5) and the suitability map for rice (Figure 4)were overlaid to identify differences and similaritiesbetween the present land use and the potential landuse for the rice crop. This was done because of theidentification and accurate description of current andpotential production areas are essential for researchand agricultural development (Corbett, 1996). Thepotential area map for rice growing after the overlay ispresented in Figure 6. The total potential areas for rice
0 0.1 0.2 0.3 0.40.05Kilometers
LANDUSEagriculture (dense)
agriculture (sparse)
barren land (R)
bushland (dense)
forest
plantation
water (artificial)
woodland
Wetlands
Protected areas
Current area under rice growing
37°40'0"E
37°40'0"E
37°20'0"E
37°20'0"E
0°20'0"S 0°20'0"S
0°40'0"S 0°40'0"S
N
Figure 5 The current Land use/cover map of the study area.
Kihoro et al. SpringerPlus 2013, 2:265 Page 7 of 9http://www.springerplus.com/content/2/1/265
production was 86,364 ha (Table 4). According to thepresent land use/cover map (Figure 5), the area culti-vated with rice was 13,369 ha. The proportion ofcurrent rice production areas within the identified suit-able areas is shown in Table 5. The analysis revealedthat in the study area, 23.08% (3,011 ha) of total ricecrop was under Moderately suitable areas and 77.92%(10,036 ha) was under Highly suitable areas. Thus, theaverage yield of the study area was highly effectivesince no areas were under the other two classes ofmarginally and not suitable areas. Therefore, economiclevels of agricultural production can be achieved by (a)cultivating rice crop in highly (S1) and moderately (S2)suitable areas, (b) diversification of marginally (S3)suitable areas to crops other than rice that are moresuitable in the pedo-climatic requirements.
The results of this investigation were adequate interms of the evaluation criteria set used here because,in a particular project, only a limited number of landqualities need be selected for use in evaluation (FAO1993). In this investigation, the evaluation criteriawere selected taking into consideration the crop re-quirements regarding local conditions. In this MCE,the factors were selected based on agronomic know-ledge of local experts and reviews of existing litera-ture. Such an approach produced valuable informationon the relative importance of the factors under evalu-ation and could be a useful precedent for future stud-ies of rice and other crops. This investigation alsoprovides general alternatives for local farmers in thearea of agricultural land management of a particularcrop.
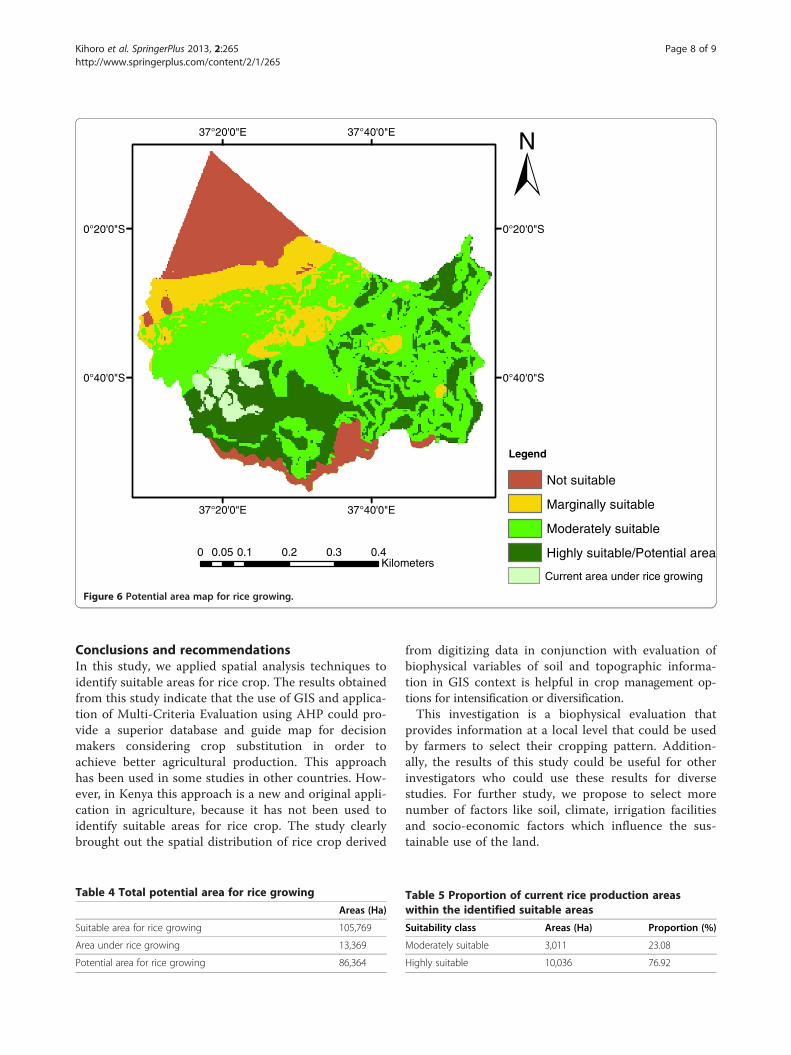
0 0.1 0.2 0.3 0.40.05Kilometers
Current area under rice growing
Legend
Not suitable
Marginally suitable
Moderately suitable
Highly suitable/Potential area
37°40'0"E
37°40'0"E
37°20'0"E
37°20'0"E
0°20'0"S 0°20'0"S
0°40'0"S 0°40'0"S
N
Figure 6 Potential area map for rice growing.
Kihoro et al. SpringerPlus 2013, 2:265 Page 8 of 9http://www.springerplus.com/content/2/1/265
Conclusions and recommendationsIn this study, we applied spatial analysis techniques toidentify suitable areas for rice crop. The results obtainedfrom this study indicate that the use of GIS and applica-tion of Multi-Criteria Evaluation using AHP could pro-vide a superior database and guide map for decisionmakers considering crop substitution in order toachieve better agricultural production. This approachhas been used in some studies in other countries. How-ever, in Kenya this approach is a new and original appli-cation in agriculture, because it has not been used toidentify suitable areas for rice crop. The study clearlybrought out the spatial distribution of rice crop derived
Table 4 Total potential area for rice growing
Areas (Ha)
Suitable area for rice growing 105,769
Area under rice growing 13,369
Potential area for rice growing 86,364
from digitizing data in conjunction with evaluation ofbiophysical variables of soil and topographic informa-tion in GIS context is helpful in crop management op-tions for intensification or diversification.This investigation is a biophysical evaluation that
provides information at a local level that could be usedby farmers to select their cropping pattern. Addition-ally, the results of this study could be useful for otherinvestigators who could use these results for diversestudies. For further study, we propose to select morenumber of factors like soil, climate, irrigation facilitiesand socio-economic factors which influence the sus-tainable use of the land.
Table 5 Proportion of current rice production areaswithin the identified suitable areas
Suitability class Areas (Ha) Proportion (%)
Moderately suitable 3,011 23.08
Highly suitable 10,036 76.92
Kihoro et al. SpringerPlus 2013, 2:265 Page 9 of 9http://www.springerplus.com/content/2/1/265
AbbreviationsAHP: Analytical Hierarchy Process; GIS: Geographic Information System;MCDA: Multi Criteria Decision Analysis; MCDM: Multi-criteria Decision Making;MCE: Multi-Criteria Evaluation; PWCM: Pairwise Comparison Matrix;SRTM: Shuttle Radar Topographic Mission; UTM: Universal TransverseMercator.
Competing interestsThe authors declare that they have no competing interests.
Authors’ contributionsAll the authors read and approved the final manuscript.
AcknowledgementsThe authors would like to show sincere gratitude to African Association ofRemote Sensing of Environment (AARSE) for awarding me the travelfellowship to attend the recent 9th international conference where thisresearch was presented during the conference. Lots of thanks to the samplefarmers (interviewees) who willingly accepted the interview. We are alsograteful for Mwea Irrigation and Agricultural Development Centre (MIAD)agronomist, National Irrigation Board (NIB) and Water User’s Association(WUA) who helps us arranged the interview and the provision of the datarequired for this study. Thanks a lot to Faith maina for the guidance andmoral support during the paper writing. The last but not the least is theresearch financiers JKUAT-RPE/NCST.
Received: 20 February 2013 Accepted: 12 June 2013Published: 17 June 2013
ReferencesAddeo G, Guastadisegni G, Pisante M (2001) Land and water quality for
sustainable and precision farming. I World Congress on ConservationAgriculture, Madrid
Corbett JD (1996) GIS and Environmental Modeling: Progress Research Issues.GIS World Book, Fort Collins, pp 117–122
Dengiz O (2013) Land suitability assessment for rice cultivation based on GISmodeling. Turkish J Agr Forestry 37:1–9
Eastman JR, IDRISI 32 (1999) Guide to GIS and image processing. Clark Labs,Clark University, Worcester, MA, USA
FAO (1976) A framework for land evaluation: soils bulletin 32. Food andAgriculture Organization of the United Nations, Rome, Italy
FAO (1993) Guidelines for land-use planning. Food and Agriculture Organizationof the United Nations, Rome
Jankowski P, Andrienko N, Andrienko G (2001) Map-centered exploratoryapproach to multiple criteria spatial decisionmaking. Int J Geogr Inf Sci 15(2):101–127
Janssen R, Rietveld P (1990) Multicriteria analysis and geographical informationsystems: an application to agricultural land use in the Netherlands. In:Scholten HJ, Stillwell JCH (ed) Geographical information systems for urbanand regional planning. Kluwer Academic, Dordrecht, The Netherlands,pp 129–139
Kuria D, Ngari D, Waithaka E (2011) Using geographic information system (GIS) todetermine land suitability for rice crop growing in the tana delta. J GeographRegion Plan 4:525–532
Malczewski J (1999) GIS and multi-criteria decision analysis. Wiley, New York, USAMati BM, Nyamai M (2009) Promoting the system of rice intensification in Kenya,
Growing more with less water. http://imawesa.info/wp-content/uploads/2011/07/IMAWESA-Training-Manual-5-SRI-Notes.pdf. (accessed 15 Feb. 2012)
Mati BM, Wanjogu R, Odongo B, Home PG (2011) Introduction of the system ofrice intensification in Kenya: experiences from mwea irrigation scheme.Springer-Verlag 2011
Mukiama TK, Mwangi RW (1989) Field studies of larval anopheles arabiensisPatton of mwea irrigation scheme, Kenya. Insect Sci Appl 10:55–62
Mustafa AA, Man S, Sahoo RN, Nayan A, Manoj K, Sarangi A, Mishra AK (2011)Land suitability analysis for different crops. A multi criteria decision makingapproach using remote sensing and GIS. Indian Agricultural ResearchInstitute, New Delhi-110 012
Nisar Ahamed TR, Gopal Rao K, Murthy JSR (2000) GIS-based fuzzy membershipmodel for crop-land suitability analysis. Agr Syst 63(2):75–95
Pereira JMC, Duckstein L (1993) A multiple criteria decision-making approach toGIS-based land suitability evaluation. Int J Geogr Inf Sci 7(5):407–424
Perveen F, Ryota N, Imtiaz U, Hossain KMD (2007) Crop land suitability analysis usinga multicriteria evaluation and GIS approach, 5th International Symposium onDigital Earth. The University of California, Berkeley, USA, pp 1–8
Prakash TN (2003) Land Suitability Analysis for Agricultural Crops: A FuzzyMulticriteria Decision Making Approach. International Institute forGeo-information Science and Earth observation Enschede, the Netherlands,pp 6–13
Saaty TL (1980) The analytic hierarchy process. Planning, priority setting, resourceallocation. McGraw Hill, New York, USA
Sombroek WG, Braun HMH, van der Pouw BJA (1982) The exploratory soil map ofKenya and agroclimatic zone map of Kenya scale 1: 1million. Exploratory soilsurvey report No. E1. Kenya Soil Survey, Nairobi
UNEP/GRID (1982) Database derived from the exploratory soil survey reportnumber E1. Kenya Soil survey, Nairobi
doi:10.1186/2193-1801-2-265Cite this article as: Kihoro et al.: Suitability analysis for rice growing sitesusing a multicriteria evaluation and GIS approach in great Mwea region,Kenya. SpringerPlus 2013 2:265.
Submit your manuscript to a journal and benefi t from:
7 Convenient online submission
7 Rigorous peer review
7 Immediate publication on acceptance
7 Open access: articles freely available online
7 High visibility within the fi eld
7 Retaining the copyright to your article
Submit your next manuscript at 7 springeropen.com