research inst bethesda md navy air decompression … · 7 -a09 11 naval medical research inst...
TRANSCRIPT

7 -A09 11 NAVAL MEDICAL RESEARCH INST BETHESDA MD F/6 6/19
..U.S. NAVY AIR DECOMPRESSION SCHEDULE RISK ANALYSIS. (U)
I JAN G0 T E BERGHAGE. D DURMAN
LWCLAssrFIED NMRI-80-1NL
I ffflfflfflfflfflfflf

LE EL:NAVAL MEDICAL RESEARCH INSTITUTE
BETHESDA, MARYLAND
0
80-1U.S. NAVY AIR DECOMPRESSION
SCHEDULE RISK ANALYSIS
T.E. Berghage and D. Durman
-DTIC.0 llELECTE flC W. F. Miner, CAPT, MC, USN JAN 30 1981
Commanding Officer UL Naval Medical Research Institute D
NAVAL MEDICAL RESEARCH AND DEVELOPMENT COMMAND
Approved for public release; 1 30 004-' pstriutionUnlimited

UNCLASSIFIEDSECURITY CL ' SIFICATION OF T-iS PAGE (ien D.:* Entered)
REPORT DOCUMENTATION PAGE READ INSTRUCTIONSBEFORE COMPLETING FORM
Z t-6QT - E2 GOVT ACCESSION No. 3. RECIPIENT'S CATALOG NUMBER
4. TITLE (and Subtitle) a FEfov-OVVEREDMedica es arch)
.S. NAVY AIR DECOMPRESSIONC NCHEDAMA RISK ANALYSTIS ProgressIOepTA40 r o W 11a am
---- - -. s. PERFORGmo oG. R3I00TtdUMiER
7. AuTI4OR(e) S. CONTRACT OR GRANT NUMBER(&)
Naval Sea Systems WorkT. E.kerghage -nd _D4 Duf~ Request N000247 Wr?9Cl44 "
I. PERFORMING ORGANIZATION NAME AND ADDRESS 10 PROGRAM ELEMENT, PROJECT, TASK
Naval Medical Research InstituteBethesda, Maryland 20014 90 DN 001.1190 renort 1
It. CONTROLLING OFFICE NAME AND ADDRESS 12. REPORT DATE
Naa Mdcl eeac ndDveomntCm Ad,/
Bureau of Medicine and SurgeryDepartmenit of the Navy -*- - UNCLASSIFIEDWashington, D.C. 20372 . / ItA.Jq SCHEDULE I CATION/DOWNGRADING
16. "DISTRIBUTION STATEMENT (of this Report)
Approved for public release and sale; distribution unlimited.
17. DISTRIBUTION STATEMENT (of the abetract entered In Block 20, I different from Report)
IS. SUPPLEMENTARY NOTES
19. KEY WORDS (Continue on reverse aide if neceeery and identify by block number)
Diving; Decompression Tables; Decompression ScheduLes; Decompression Sickness
20. ABSTRACT (Continue on reveree side if neceesry and Identify by block number)
The purpose of this report is to provide the diving community with an estimateof the risk associated with the use of the U.S. Navy's air decompression tablesA search of the diving data bank of the U.S. Navy Safety Center for the years1971 to 1978 revealed 16,170 dives in which an air decompression schedule wasused. These dives were sorted and tabulated by decompression schedule anddecompression outcome. From these data, estimates of the incidence of decom-pression sickness associated with each schedule were derived. The overall-
DD FOR173 1473 EDITION OF I NOV4 IS ISOLETE UNCLASSIFaEDS/N 0102-LF-014.6601 i 1112RilY CLASSIFICATION Of TWIS PAGE (When DAN. abfi) )
i. - T I- " . .
UNCLASSIFIED
r s a c U R I TY' C L A S S I F I C A T I O N O F T H I S P A G E ( h e n D u na a uEn W 9 .
incidence rate for the air decompression schedules was 1.25%; the incidence
rate for individual schedules having more than 50 dives ranged from 0% to 4.8%.Only 43 of the 295 U.S. Navy air decompression schedules were used 100 times ormore during the past 7 years. Over one-half of the available schedules werenot used at all during this 7-year period. Although the Navy's experience withlindividual air decompression schedules is restricted, there is little evidencethat the same incidence rate would not hold for all schedules in the airdecompression table.
NTIS GRAS.,
Unarn:ouncbid
_Distri1~ticl/_ D T IC
-it r JAN 3O 0 9 1
ii UNCLASSIFIEDSECURITY CLASIPICAION OF THIS PAGa(Uaa, Dow Sotemeg
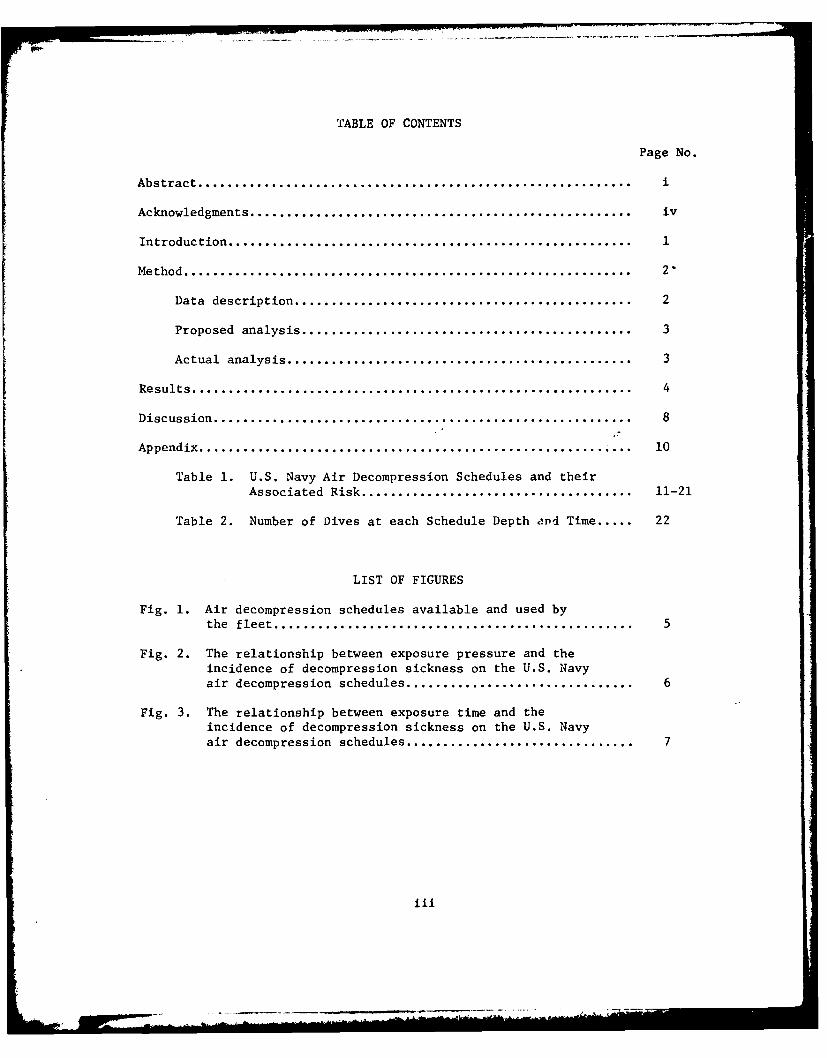
TABLE OF CONTENTS
Page No.
Abstract ........................................................... i
Acknowledgments .................................................... iv
Introduction ....................................................... 1
Method ............................................................. 2*
Data description .............................................. 2
Proposed analysis ............................................. 3
Actual analysis ............................................... 3
Results ............................................................ 4
Discussion ......................................................... 8
Appendix ........................................................... 10
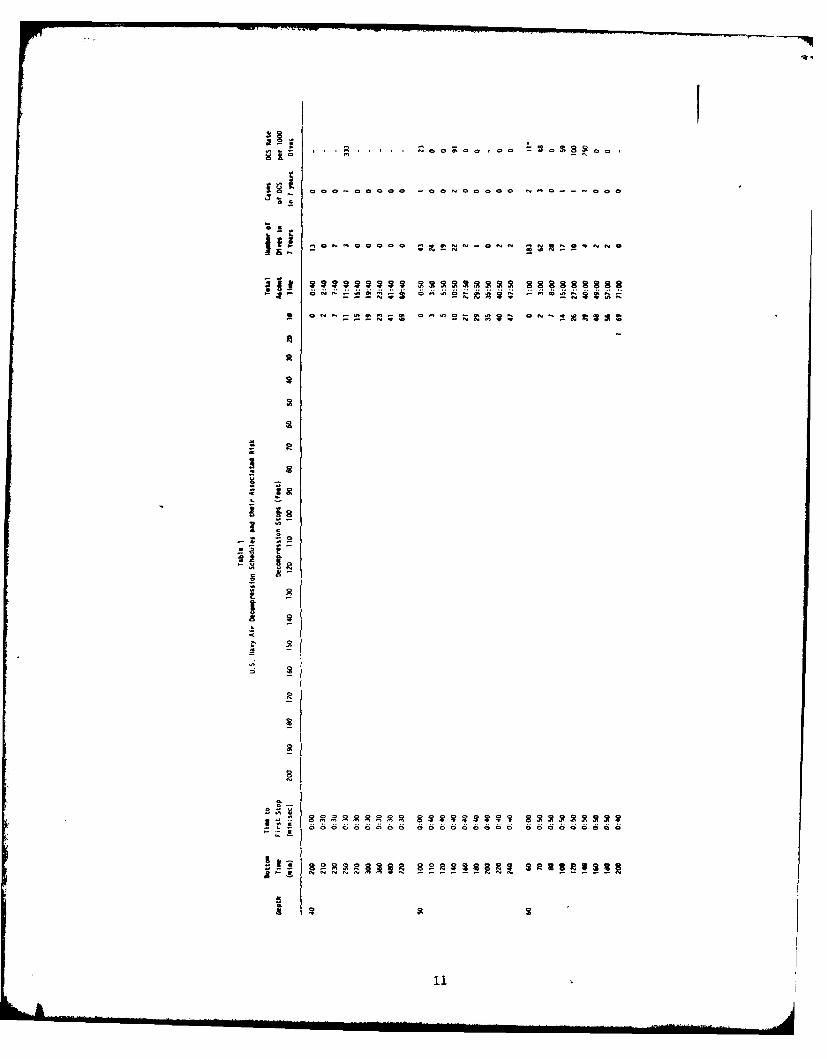
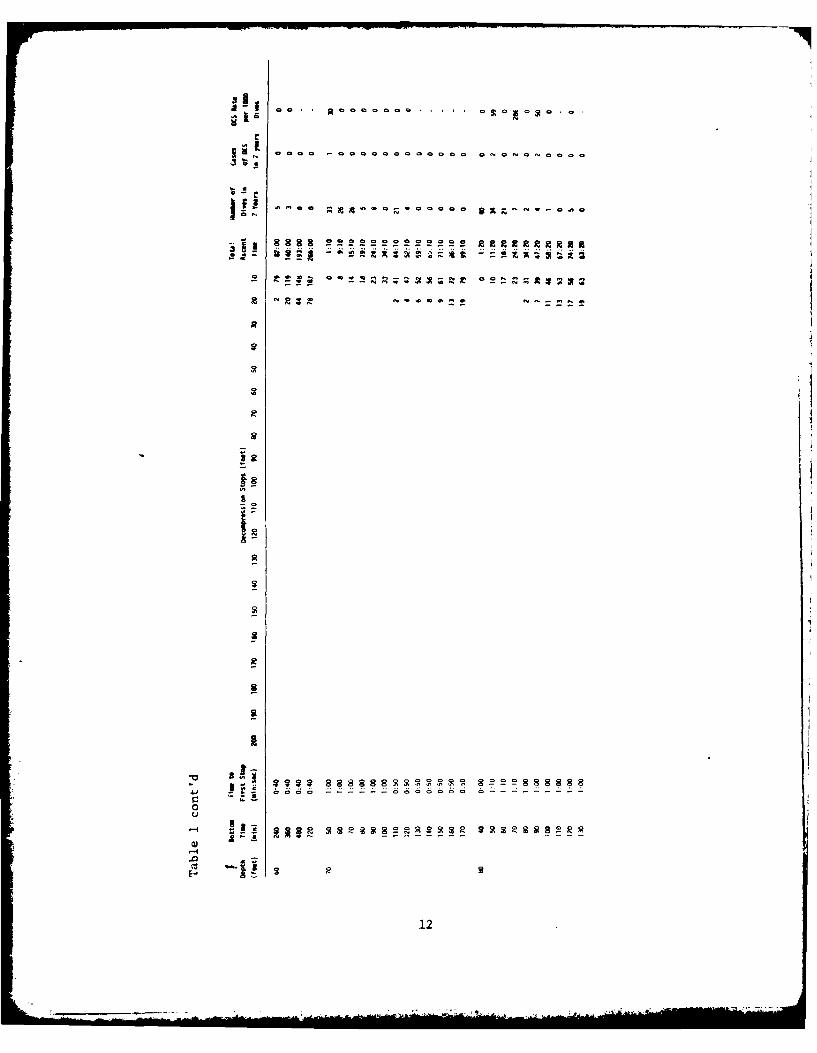
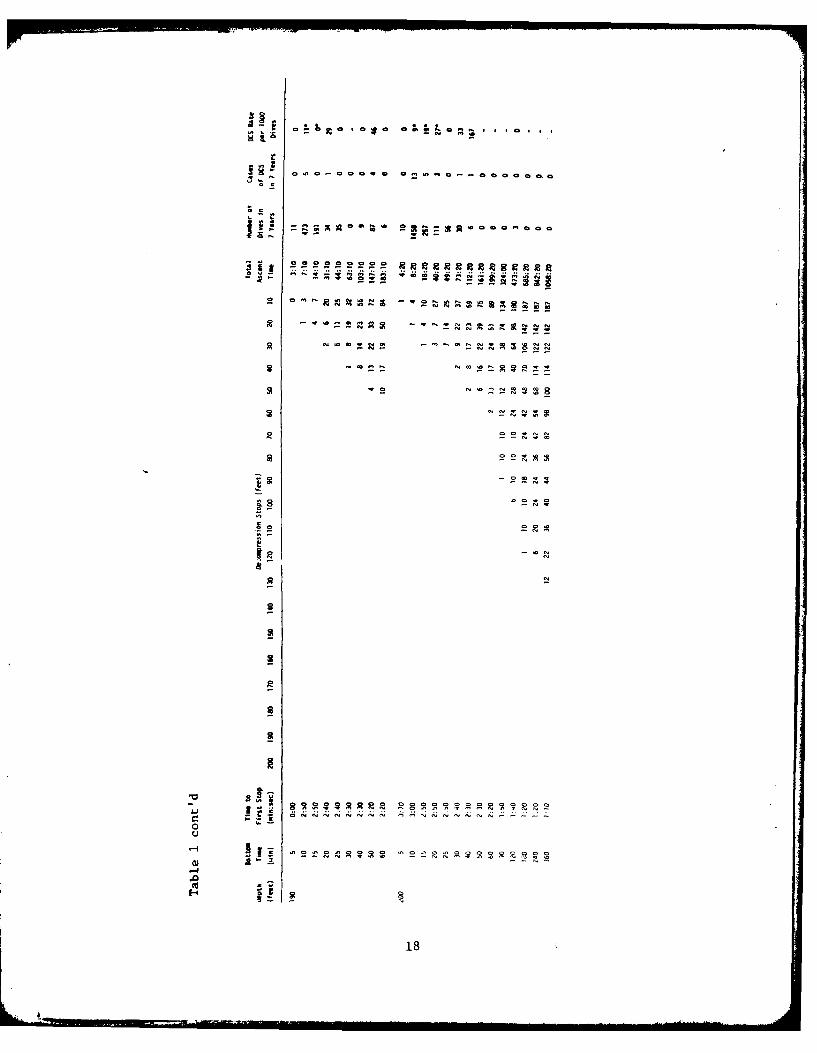
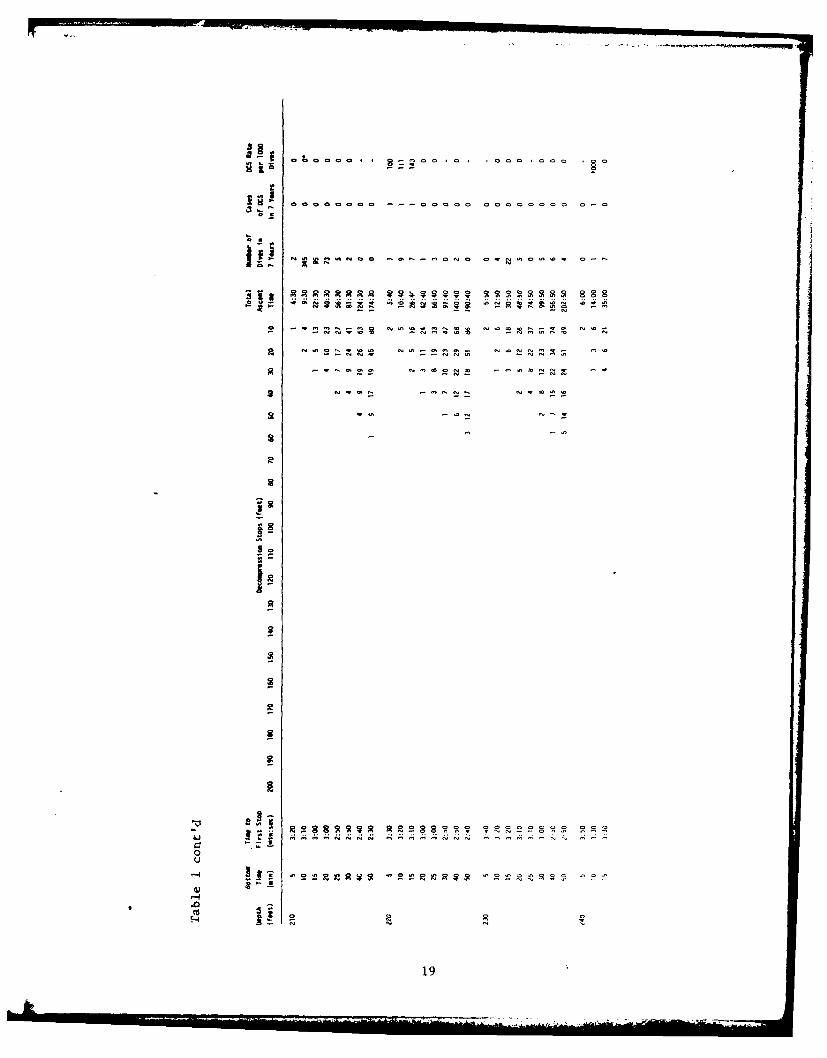
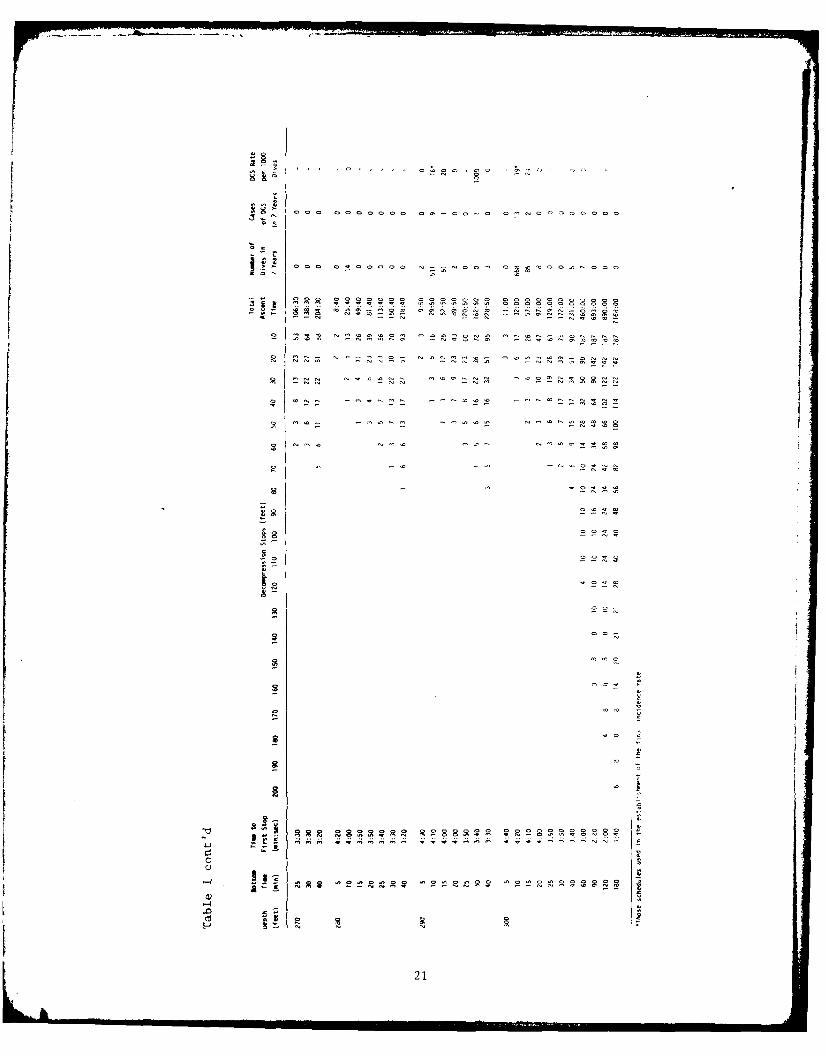
Table 1. U.S. Navy Air Decompression Schedules and their
Associated Risk ..................................... 11-21
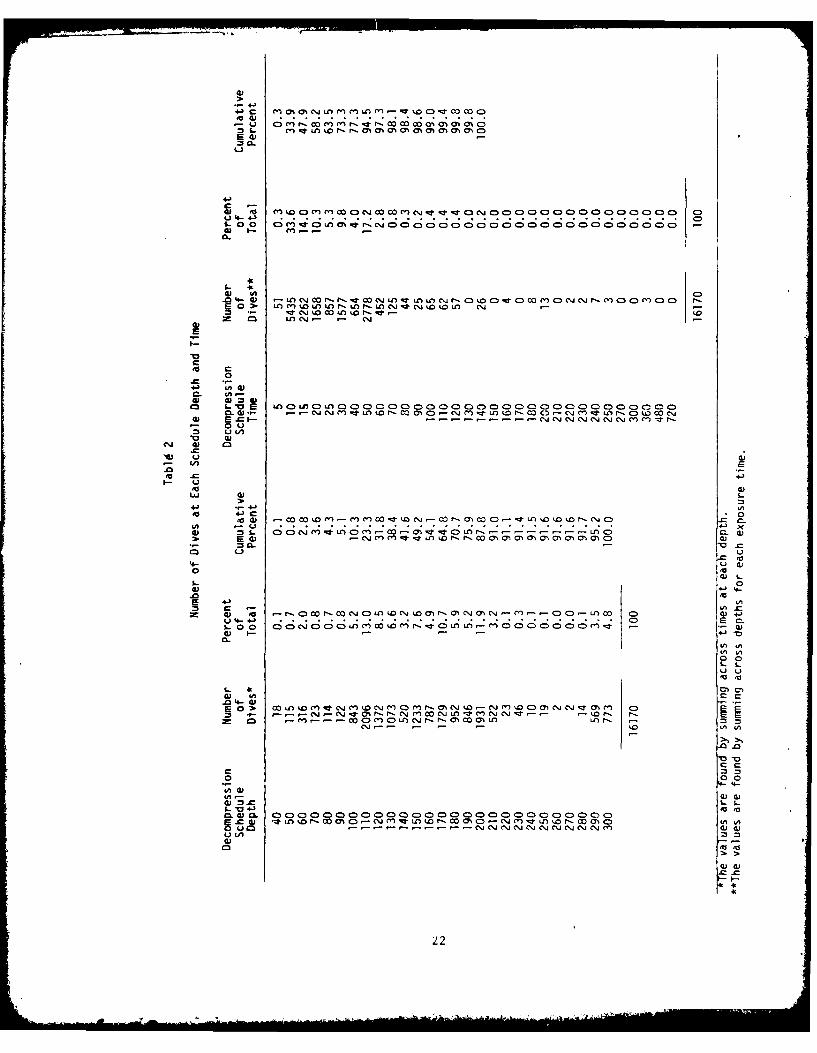
Table 2. Number of Dives at each Schedule Depth and Time ..... 22
LIST OF FIGURES
Fig. 1. Air decompression schedules available and used bythe fleet ................................................. . 5
Fig. 2. The relationship between exposure pressure and theincidence of decompression sickness on the U.S. Navyair decompression schedules ............................... 6
Fig. 3. The relationship between exposure time and theincidence of decompression sickness on the U.S. Navyair decompression schedules ................................ 7
iil

Acknowledgments
This research was conducted for and funded by the Supervisor ofNavy Diving, Naval Sea Systems Command.
Naval Medical Research and Development Command, Work UnitNo. M0099.PN.O01.1190. The opinions and assertions contained herein
are the private ones of the writers and are not to be construed asofficial or reflecting the views of the Navy Department or the Naval
Service at large.
The authors wish to express their appreciation to Doris N. Auerfor her assistance in the preparation of this manuscript.
iv

Introduction
Within the diving community sea stories have persisted for years
concerning the risks associated with various decompression schedules.
It has generally been accepted that the decompression schedule for the
160 foot-30 minute exposure produces a high incidence of decompression
sickness. The current statistical support for this and other similar
assertions is weak at best, and at the time they were originally proposed
it was nonexistent.
The anecdotal information that is the basis for our concern with
individual decompression schedules has served the purpose of focusing
attention on decompression safety. It has made fleet personnel aware
of the risk associated with decompression even when the U.S. Navy air
decompression schedules are accurately followed. Rather than basing
this safety education on anecdotal information, however, it would be
better to have the actual statistics. Information based upon actual
data is much more effective in persuading people to change their behavior.
The systematic collection and analysis of diving data did not start
until the Navy Safety Center initiated its program in 1970. Even today,
however, it is far from complete. Many shallow working dives are not
recorded and the data on other dives is suspect due to high error rates
in data recording. Despite these shortcomings the data at the Navy
Safety Center is the best that is presently available. Although we
know that not all of the fleet dives are recorded, it is less likely
that the dives requiring decompression are omitted than it is for the
more routine shallow "no-de" dives. Based upon this naive optimism
the authors set out to construct a risk analysis table for the U.S. Navy

Air Decompression Schedules. The objective of the analysis was twofold:
(1) determination of the risk of decompression sickitess associated
with each of the U.S. Navy's air decompression schedules, and (2)
evaluation of the impact of exposure time and pressure on the incidence
of decompression sickness.
Method
Data Description
The data for this analysis were obtained from the U.S. Navy
Safety Center in Norfolk, Virginia. All of the air decompression dives
conducted and recorded by the U.S. Navy during the period between
1 October 1971 and 30 November 1978 were used to calculate risk statistics.
For each dive on a given depth/time schedule the following information
was obtained:
Dive Log Item Description
21-24 Decompression Schedule Depth
25-28 Decompression Schedule Time
42-45 Actual Dive Depth
46-52 Actual Bottom Time
54 Decompression Schedule Followed
56 Type of Work
70 Number of Dives
51-53 Bottom Water Temperature
27 Diving Dress
28 Supplemental Heat Used
54 Dive Outcome
65 Type of Accident

Proposed Analysis
Using the data shown on page 2, we intended to construct a risk
analysis table similar to the following:
Decompression Conservative Designed Overextended OverallSchedule Used Use Use Use
RATE % RATE % RATE RATE %
160/30 0/400 0 1/300 .33 4/100 4.0 5/800 .625
The dives done on each of the 295 air decompression schedules were to
be evaluated as to the appropriateness of the schedule used. A three-category
classification was to be employed to differentiate the risk associated with
conservative, designed, and overextended use of the schedules. Assignment of
dives to a given category was to be based upon dive depth, bottom time,
exercise level, water temperature, and the use of supplemental heat.
Actual Analysis
Because of the relatively small number of decompression dives done in
the U.S. Navy and the high incidence of recording error, it became apparent
that to subdivide the fleet dives into three categories would remove all hope
of gleaning meaningful information from the analysis. Even restricting the
statistics to a single overall incidence rate for each decompression schedule
stretches the data very thin in several places. Despite these limits we have
calculated the incidence of decompression sickness for each air decompression
schedule. These statistics are the best possible given the data presently
available. We have also attempted to evaluate the effects of exposure pressure
and time on decompression risk by grouping data.
3
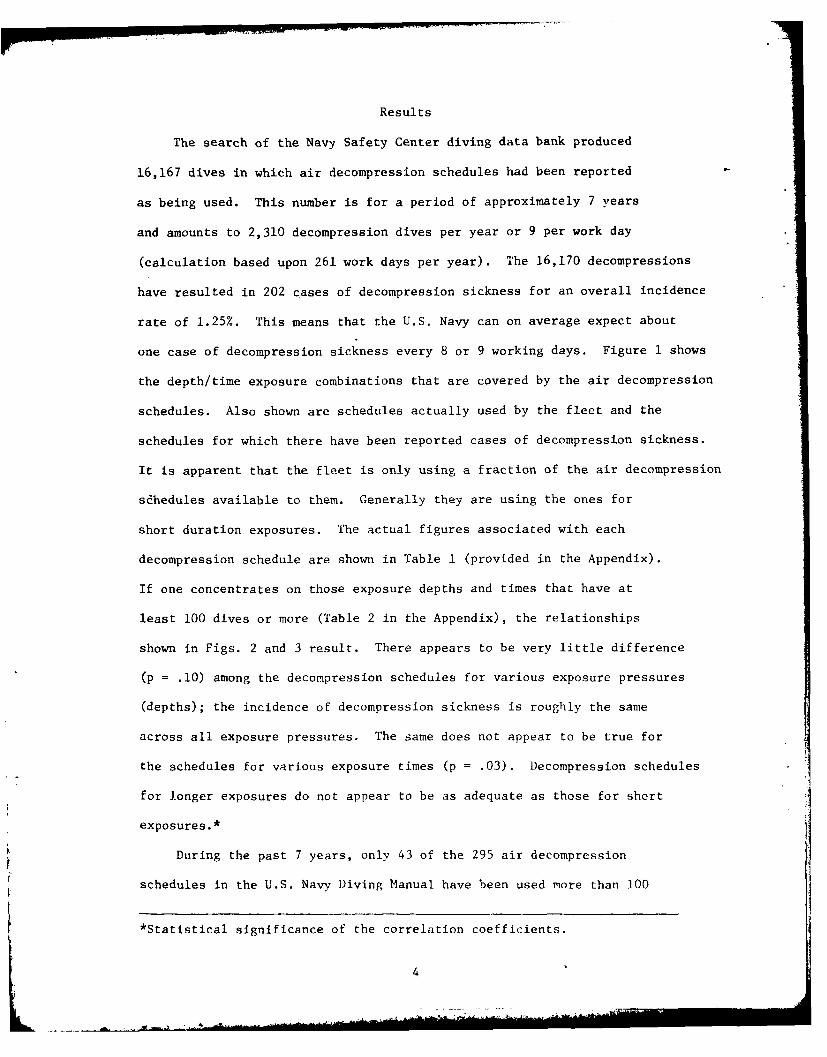
Results
The search of the Navy Safety Center diving data bank produced
16,167 dives in which air decompression schedules had been reported
as being used. This number is for a period of approxintely 7 years
and amounts to 2,310 decompression dives per year or 9 per work day
(calculation based upon 261 work days per year). The 16,170 decompressions
have resulted in 202 cases of decompression sickness for an overall incidence
rate of 1.25%. This means that the U.S. Navy can on average expect about
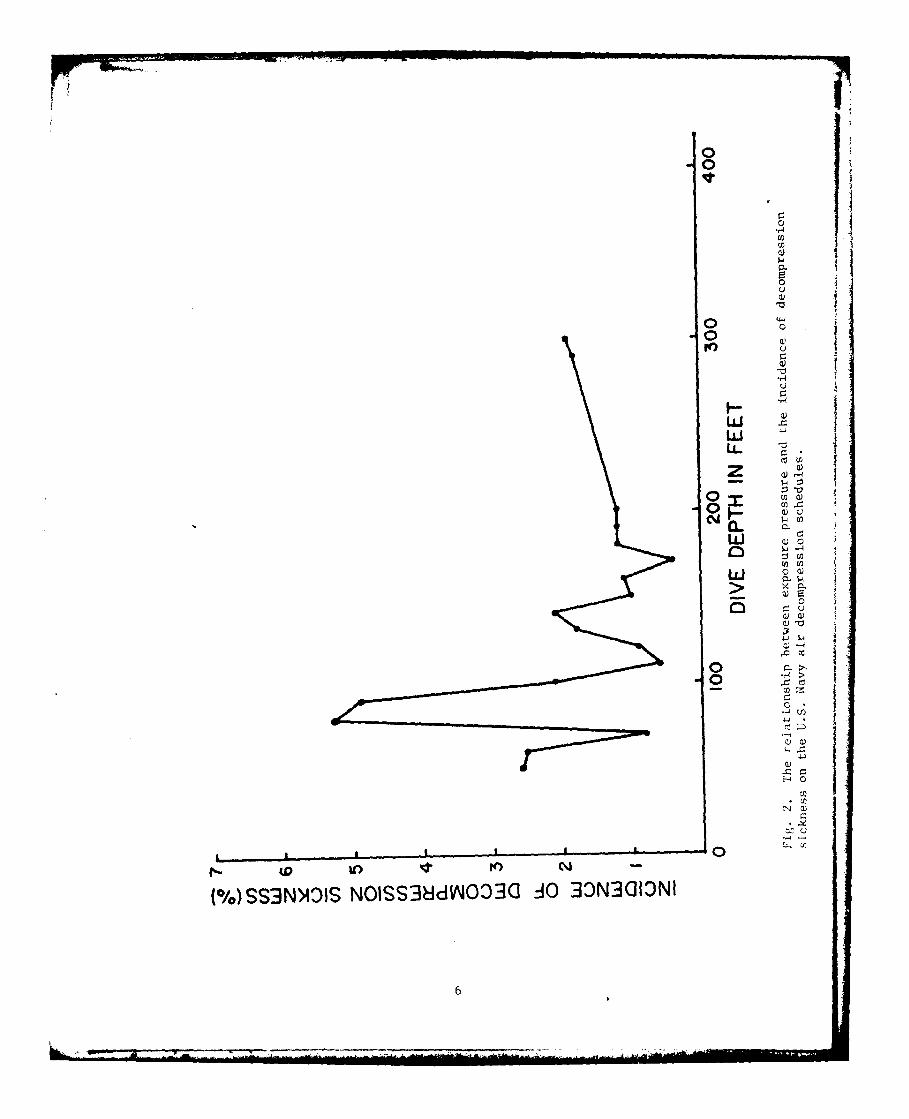
one case of decompression sickness every 8 or 9 working days. Figure 1 shows
the depth/time exposure combinations that are covered by the air decompression
schedules. Also shown are schedules actually used by the fleet and the
schedules for which there have been reported cases of decompression sickness.
It is apparent that the fleet is only using a fraction of the air decompression
sdhedules available to them. Generally they are using the ones for
short duration exposures. The actual figures associated with each
decompression schedule are shown in Table 1 (provided in the Appendix).
If one concentrates on those exposure depths and times that have at
least 100 dives or more (Table 2 in the Appendix), the relationships
shown in Figs. 2 and 3 result. There appears to be very little difference
(p = .10) among the decompression schedules for various exposure pressures
(depths); the incidence of decompression sickness is roughly the same
across all exposure pressures. The same does not appear to be true for
the schedules for various exposure times (p = .03). Decompression schedules
for longer exposures do not appear to be as adequate as those for short
exposures.*
During the past 7 years, only 43 of the 295 air decompression
schedules in the U.S. Navy Diving Manual have been used more than 100
*Statistical significance of the correlation coefficients.
4

.-J
w w0 0
W OD 0WCw C.. 0 U
wz U zoWfl (n' < 4 1
z V) w V) C)- mU) W _ w
0-Z
z W' 0
CL C) 0-U LJ 4J 4- U
0 0
0> 0
w U
00
u >~
0-, -- 1 u
OLcr "7j
-1U
CY to OD 0 -4 to4D-c
N N N~ N N ti
133:1 NI Hid3G
5
0 #-0
ci,
o L
0
C-)
V) ci)
25 u
0 C- >
.0
A 10
(D K
(%)SS3N>IOIS~~C-> NOS3dNO3 O303IN
06'-
Aim moo

'A 7
0
z0i- 5Co)Cl)
C-)
0
03
U-
023
zW
0 20 40 60 80 100 200BOTTOM TIME INi MINUTES
Fig. 3. The relationship between exposure time Mnd the incidence of
decompression sickness on the U.S. Navv air decompression schedules.

times (marked by asterisk in Table 1). The average incidence of decom-
pression sickness on these 43 schedules is 1.1%, slightly less than the
overall incidence. The highest incidence level (4.8%) is for the 100 ft
for 60 min table. If we confine our analysis to these 43 decompression
schedules and calculate our statistics based upon the total number of
dives actually made on all of these schedules together, we obtain what is
probably the best picture of the adequacy of the U.S. Navy's air
decompression procedures.
Discussion
It is apparent that the majority of the U.S. Navy's experience
with air decompression is for short duration exposures (Table 2). This
type of exposure is generally adequate for the routine type of diving now
being done. For a major salvage job or underwater construction project,
however, long exposures will be needed. Results of this analysis suggest
that we might have some difficulty with these longer exposures. The statis-
tics are sketchy and the experience limited, but the trend toward a higher
incidence of decompression sickness with longer exposures is there (Fig. 3).
Four air decompression schedules appear to be producing a statistically
significant (p .05) higher incidence of decompression sickness than
what might be expected by chance. The four tables are:
Depth/Time Incidence (%) p
100/60 4.8 .001130/20 3.9 .007140/30 3.1 .038150/15 3.4 .021
These schedules have been evaluated, but there does not appear to be
anything unique about them. They all have substantial initial ascents
to the first stop, but so do a lot of other schedules. There is a slight
relationship between the number of dives done on a schedule and the
8

incidence of decompression sickness. Because the number of dives done
on these four schedules is relatively low the significant results may be
nothing more than a function of small sample size.
The results of this analysis leave one with two distinct impressions:
1) there are a very limited number of air decompression schedules
that are actually being used with any regularity; and 2) the overall
incidence of decompression sickness on the U.S. Navy's air decompression
tables is very low. The only consistent trend that has been identified
is the increase in "bends" incidence associated with exposure time.
If this trend persists it might be worth exploring in more detail through
the medical research program.
9
awas"

APPENDIX
Table 1. U.S. Navy Air Decompression Schedules and theirAssociated Risk
Table 2. Number of Dives at each Schedule Depth and Time
10
.. ..' .. .. .. .. o ,2
* •
o$- O C O O O O N - - e
@0
11122 22322 3883
ts
I . a a a a a s a a g s
21
k .... & ,
a- .. . .. .. . .. . a° o . .
& ! 0000 ............. ...... f...
-! ~ C ~ Q 0 0 8 C 0 ,333 O a OO!~ 228
O 88 008*2
ao
8! . . . . . . a ~ a
a ]
a1

If
I000000 00~ 000 00%0 0000
0000000 --. ~OO0o 000
~2~2222 .
- :~~22~* 0-0~)
2 ~ -- ~~
2 0
2
2
2
a
pg
p0
a
2
2
2
2
2q22 222~~U 8282222 2~22000000
-- U0U
-4 2222~8~ a2222328222 ~22222S28
-4.0
a S
13 b

- -- - - -
-
.. .. . . 14
o f b 00 00 0
co c e w , eo 0 0 0 0

U!
1 0 0 ..
00 0 N N 0 0 00 0 0 . . N 0
- 22
I;3
S1

*E I '' 000,, , 000 ~O
Igo ~ 0W,-r0 00000 00 0-n- 0
000-0000 0 0
00000 0
8 _
2
a
,.
PA-
8
2
a
S-i
S0 ~ -~
0U
-4 Iii
-4.0 -~
16
~m4

3.-
3117
CU 0 0 0 0fl C 0II00
&f 0 0 O 0O 0.
2s R
2 4;ZZ ZZZw
21
0 0000 0 - - 00 0- -0 0 - -
-9A9 -V!
00A0D0 0 0 0 0 0 0 0
C4 O A 00 C
19 2 0 0

-a-- ~..
~k;~ §~ 000~,O
tiC- oo--e O000-ooooo ON 0000000 0000
5C0 00--c ~00NO0000oo 00N00 00 ON 00
00000000000 0000000 000
0 t)-~ Pieeair-0 r-000N00000.-Ci ,-~CiNC-Ci00 ONCOOar- 000- -N0-,-.Ci~orio ~00CiNCi N
* N N000 --
~ 0000 N N 000 N
~00 NO~- N NO 00000 - N N NO - N
0 00000 000C Ci000N~ NO 0CiCi NO Ci
Ci - NO - -
o rio o 00 - tor-Noto:: NO 000
0 ~0N 0 N00i0O0~g ~N0~ N
0 NO 000000 NO0 - N N C Ci
0 - 00000 -
0 0 0 N 0N00
000 N N
0 0 0 0
0 N
00000 000000000000 000~~~O ~
4-I ~ ~NNNNNNNNNNN ONNONNN 00~N
aC-)
-4 tC0~ 090 000000000090 ~ 0000~ ~NOri0 0CiN.~~0 -- N
20
4.
--- -------- -00 00 0 0 00 0 0 00 0 0 -0~ooo oooo-oo oC 0000000 000 00 O0
0 000 00 000 C Q 000 0000 000
N~ 2zo c I
21
a,
41' c m1 1 ! DO 1 l 199 1:C9 9
4.)
u 4-
;t 0- u o M~ - O -or rt
a- (A
(%J a,.
4- r- E
C ' a ,
4.4)
4J.a, : r DLO0Nt ML r- M C-li M v- 17CD 4a
0 0. 8 Li C l ;L;U C )c m6C Dm-I
Ln 'ALM 'n
a, I.
~ C - C r-.0 a, - cu a
-LOO : Y -r"0 OOLO0 0u -m 0 0 00 c C. c . - E. a,
a, '- - -4-
a)
I.. (N . . \ CiCJ )4
IV
a)
a, ~ L22

~LJ'