research designs. review review -- research general types of research – descriptive (“what”)...
TRANSCRIPT

Research Designs

REVIEW

Review -- research
• General types of research– Descriptive (“what”)– Exploratory (find out enough
to ask “why”)– Explanatory (“why”)
• Unit of analysis: “object, entityor process” under study– Contains the variables
being measured– Case: A single instance
of a unit of analysis

Review - variable• Any characteristic of a unit of analysis that is not fixed, meaning it can
differ or change– How were officers accidentally killed– During which period (pre- or post-Ceasefire) were Boston youths shot
dead• Any concept that can be divided into subcategories or values
• Only limitation is that a variable must be able to have different values, scores or levels
– Must be conceptually free to change
– Number of officers accidentally killed each year
– How officers were killed
– Mean number of Boston youth shot dead each month
– Period when Boston youth were shot dead (pre- or post-Ceasefire)
• Coding– Assigning a measurement to a variable

Review - distributions• An arrangement of cases in a sample or population according to their values or scores on one or more
variables
• Statistics – mean, median, mode, range, standard deviation – summarize distributions

Review - association and causation• Association means that the
values of two or more variableschange together – In Boston, the number of
youth shot dead appearsto be associated with thestudy period
– After invoking Ceasefirethe mean number of youths slain by gunfiredrops
• Causation means that changesin one variable cause corresponding changes in another variable.
• The causal variable is called the “independent” variable (here it’s the time period)
• The effect variable is called the “dependent” variable (here it’s the mean number of monthly deaths)
• So, did Ceasefire cause the reduction?

RESEARCH DESIGNS –NON-EXPERIMENTAL

Principles of non-experimental designs• Begin with a hypothesis
– Changes in independent variables(s) changes in dependent variable(s)
– Lower income more crime• Assess the hypothesis by collecting data on variables of interest.
– Data usually reflects the values of variables at one point in time– Data can also be collected in “waves,” at succeeding points in
time– In non-experimental designs investigators only collect data -
they do nothing that might affect the values of the variables • Data sources
– Field observations– Surveys– Official sources (public records, census, etc.)
Non
-exp
erim
enta
l des
ign
s

Data source: field observations• Research question: do police officers take harsher legal measures if youths display a
bad attitude?• Hypothesis: worse demeanor harsher disposition • Researchers rode along with cops to observe their interactions with youths• Researchers did NOT intervene -- they
let things be• Researchers coded...
– Independent variable:youth’s demeanor
– Dependent variable:officer disposition
• At a later time they used statisticaltechniques to assess whether youth’sdemeanor was associated withofficer disposition in the hypothesizeddirection (the worse the demeanor, theharsher the disposition)
• Depending on the strength of this association they might conclude:– There is a cause-and-effect
relationship between the variables: hypothesis confirmed– The association does not go beyond what could be obtained by chance:
hypothesis rejected
Non
-exp
erim
enta
l des
ign
s

Non
-exp
erim
enta
l des
ign
sData source: surveys
Panel1
Panel6
Panel4
Non
-exp
erim
enta
l des
ign
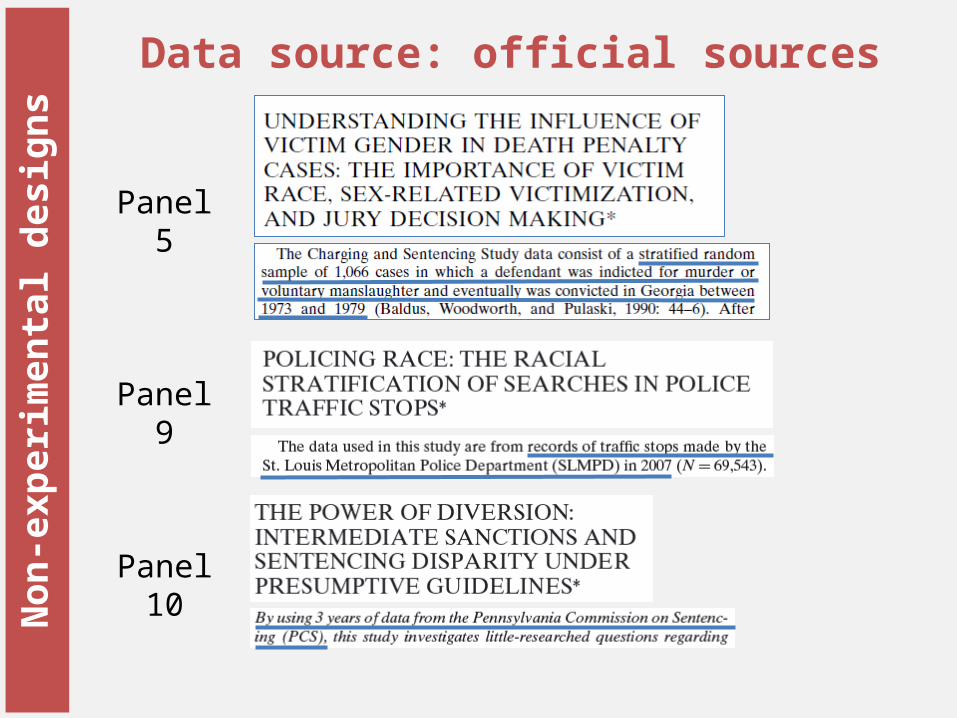
sData source: official sources
Panel5
Panel9
Panel10

Data sources: surveys + officialN
on-e
xper
imen
tal d
esig
ns
Panel2
Panel3

• Causal order: Did the change in the independent variable precede (come before) the change in the dependent variable?
Poverty crime OR Crime poverty
• Intervening variables: Could lack of education or living in a violent area be the more proximate (closer) cause of crime?
Poverty poor education crime
Here poverty is still the cause, but it affects crime through intervening variable education, which is the more proximate cause
• Spurious relationship: What seems to be a relationship is bogus
― Often caused by a strong association between the independent variable of interest (e.g., poverty) and another independent variable (e.g., poor social controls) which turn out to be the real cause
Poor social controls crime
Poverty
Issues in non-experimental designsN
on-e
xper
imen
tal d
esig
ns

RESEARCH DESIGNS –EXPERIMENTAL

Principles of experimental designs• Purposes–Eliminate other possible “causes” (e.g., that it’s education, not poverty)–Set the causal order (e.g., know you are testing crime poverty)
• Method1.Randomly assign cases to two or more groups. Random assignment insures that the mean values of the independent variable(s) will be about the same for each group. 2.Designate one or more groups as “experimental” and one as “control”3.Measure the dependent variable (time 1) for each group 4.Intervene in the experimental group by adjusting the level of the independent variable of interest5.Post-measure dependent variable (time 2) for each group. If the differences between experimental and control groups are “statistically significant” they can be attributed to the intervention.
• Simple experiment
intervention
( X ) DVt1…IV….DVt2
( C ) DVt1…..……DVt2 (no intervention)
Exp
erim
enta
l des
ign
s

Exp
erim
enta
l des
ign
s
Hypothesis: SOCP reduces recidivism
1. Independent (causal) variable: SOCP (yes/no) (categorical/nominal)
2. Dependent (effect) variable: recidivism (rearrest rate, continuous)
3. Randomly assign youths being released to either X or C– Random assignment makes them about equal overall for background
factors such as age, criminal record, disciplinary history, etc.
4. Give X (experimental group) special intensive supervision– This is called an “intervention”
5. C (control group) gets regular supervision
6. Wait two years
7. Compare recidivism (rearrest) rates for both groups– Does the X group have a significantly lower rate?

1973 Kansas City Patrol Experiment• Research question: Does routine patrol deter crime?• Hypothesis: Routine patrol reduces crime
1. Independent (causal) variable: Patrol(categorical/ordinal), with three values:
– C = Same amount of patrol as before– R = Less patrol than before– P = More patrol than before
2. Dependent (effect) variable: crime rate(continuous)
3. Randomly divide an area into 15 beats
4. Measure crime in each beat
5. Randomly assign each a different value of the independent variable
1. Five C (control) beats: same patrol as usual
2. Five experimental beats: less patrol than before (“R”, reactive)
3. Five experimental beats: more patrol than before (“P”, proactive)
6. After one year compare crime rates
Exp
erim
enta
l des
ign
s

Quasi-experimental designs• Experiment that lacks random assignment to groups
– Groups might differ along a key independent variable (“matching” often used to try to make up for this)
• Experiment without a control group
– An extraneous event might be the true cause of the change in the dependent variable
• A non-experimental design thatmimics an experiment
– A known intervention did takeplace (e.g., it’s known that thelevel of the independent variabledid change at a certain time)
– Measures of the dependent variable are available for theperiods before and after theinterventionQ
uas
i-ex
per
imen
tal d
esig
ns

Some issues with experimental designs
• According to the Kansas City experimenters, there was no significant difference in crime rates between the experimental and control groups. – Since neither increasing nor decreasing patrol made a difference, the
hypothesis that random patrol can reduce crime was rejected.• However, the experiment was later criticized:
– Level of the independent variable (amount of patrol) was not sufficiently increased in the proactive beats to be able to demonstrate a statistically significant effect
– Due to contamination by other units, level of patrol was not sufficiently reduced in the reactive beats to be able to demonstrate a statistically significant effect
• Other constraints– Practicality
• Could we experimentally test poverty crime?– Ethics
• Should we experimentally test poverty crime? We really cannot make people poor to see what happens!
Exp
erim
enta
l des
ign
s

PRACTICAL EXERCISE

Class assignmentHypothesis: Higher income persons drive more expensive cars - Income Car Value We test this hypothesis with a non-experimental design •Independent variable: income
– Categorical, nominal: studentor faculty/staff
•Dependent variable: car value– Categorical, ordinal: 1 (cheapest),
2, 3, 4 or 5 (most expensive)– Will also be used, later, as a
continuous variable•Data
– Each team systematically samples10 cars in student lot
– Each team systematically samples10 cars in faculty/staff lot
•Coding– Use operationalized car values to enter values for the dependent variable– Also draw graphs of each distribution by car value– Each student fills in and keeps their own coding sheet (all coding sheets for each team
should be identical, and of course, correct.)
PLEASE BRING THE CODING SHEETS WITH YOU TO EACH CLASS SESSION!