research article open access genome wide exploration … · kingdoms of life: archaebacteria,...
TRANSCRIPT

RESEARCH ARTICLE Open Access
Genome wide exploration of the origin andevolution of amino acidsXiaoxia Liu1, Jingxian Zhang2, Feng Ni1, Xu Dong2, Bucong Han2, Daxiong Han1, Zhiliang Ji1,2*, Yufen Zhao1,3*
Abstract
Background: Even after years of exploration, the terrestrial origin of bio-molecules remains unsolved andcontroversial. Today, observation of amino acid composition in proteins has become an alternative way for a globalunderstanding of the mystery encoded in whole genomes and seeking clues for the origin of amino acids.
Results: In this study, we statistically monitored the frequencies of 20 alpha-amino acids in 549 taxa from threekingdoms of life: archaebacteria, eubacteria, and eukaryotes. We found that the amino acids evolved independentlyin these three kingdoms; but, conserved linkages were observed in two groups of amino acids, (A, G, H, L, P, Q, R,and W) and (F, I, K, N, S, and Y). Moreover, the amino acids encoded by GC-poor codons (F, Y, N, K, I, and M) werefound to “lose” their usage in the development from single cell eukaryotic organisms like S. cerevisiae to H. sapiens,while the amino acids encoded by GC-rich codons (P, A, G, and W) were found to gain usage. These findingsfurther support the co-evolution hypothesis of amino acids and genetic codes.
Conclusion: We proposed a new chronological order of the appearance of amino acids (L, A, V/E/G, S, I, K, T, R/D,P, N, F, Q, Y, M, H, W, C). Two conserved evolutionary paths of amino acids were also suggested: A®G®R®P andK®Y.
BackgroundThe origin of life arising from either proteins or nucleicacids has been argued for nearly half century. Puttingthe “Chicken or Egg” question aside, there exist someunsolved problems. Which amino acid(s) appeared firstin the prebiotic environment? What cause the differentusage of amino acids in modern organisms? To addressthese questions, a number of hypotheses and theories, e.g. mutation drifts and natural selection, have been pro-posed. Multiple factors, such as genetic codes, physico-chemical properties, mutation-selection equilibrium,amino acid biosynthesis, etc, are likely related to thevariation of amino acid usage in organisms [1,2]. Sincethere is no way to trace geological evidence in the wayscientists normally use in chronicling the evolution oforganisms, an alternative path is needed to seek a cluefrom current living organisms.Observation of amino acid composition in proteins
was recently applied as a statistical approach in
facilitating various investigations of the evolution ofgenetic codes [3], the origin of amino acids [1,2,4-6], theco-evolution of amino acids and genetic codes [7], theevolution of protein families [8-10], the conservation ofsubcellular location [11], the prediction of protein sec-ondary structure [12-14], the natural selection of proteincharge [15], the correlation between gene expressionlevel and protein function [16], the kinship of differenttaxa [17], the molecular mechanisms of dinosaur extinc-tion [18], the lifestyles of organisms [19], and even thetracing of the Latest Universal Ancestor (LUA) of life[4-6]. Recently, some research groups have successfullyapplied genomic information on monitoring amino acidcomposition linked with various biological phenomena[1,5,11,17,20]. It is beyond question that an insight intothe evolution of amino acids on a genomic scale canextend our knowledge about molecular evolution andthe origin of life. In this study, 549 genomes from threekingdoms of life were adopted to investigate statisticallythe patterns of amino acid usage during evolution. Also,clues for the origin of amino acids in prebiotic environ-ment and their co-evolution with genetic codes wereexplored.
* Correspondence: [email protected]; [email protected] Key Laboratory for Chemical Biology of Fujian Province, Department ofChemistry, College of Chemistry and Chemical Engineering, XiamenUniversity, Xiamen 361005, Fujian, PR China
Liu et al. BMC Evolutionary Biology 2010, 10:77http://www.biomedcentral.com/1471-2148/10/77
© 2010 Liu et al; licensee BioMed Central Ltd. This is an Open Access article distributed under the terms of the Creative CommonsAttribution License (http://creativecommons.org/licenses/by/2.0), which permits unrestricted use, distribution, and reproduction inany medium, provided the original work is properly cited.
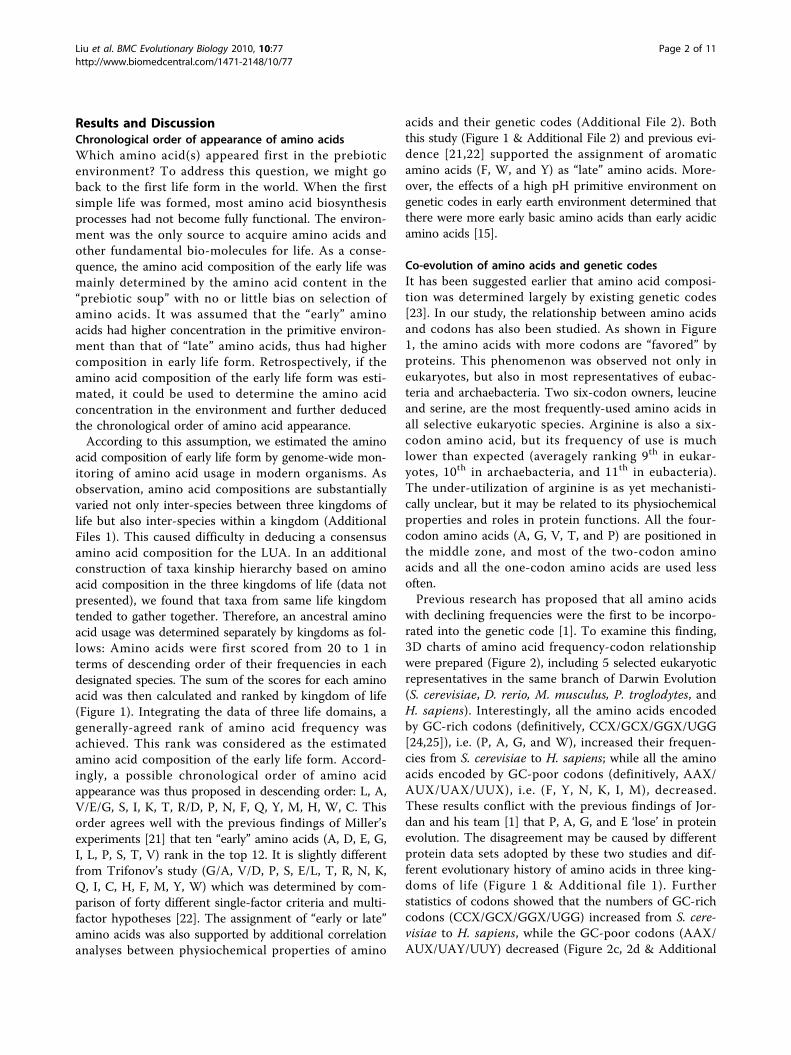
Results and DiscussionChronological order of appearance of amino acidsWhich amino acid(s) appeared first in the prebioticenvironment? To address this question, we might goback to the first life form in the world. When the firstsimple life was formed, most amino acid biosynthesisprocesses had not become fully functional. The environ-ment was the only source to acquire amino acids andother fundamental bio-molecules for life. As a conse-quence, the amino acid composition of the early life wasmainly determined by the amino acid content in the“prebiotic soup” with no or little bias on selection ofamino acids. It was assumed that the “early” aminoacids had higher concentration in the primitive environ-ment than that of “late” amino acids, thus had highercomposition in early life form. Retrospectively, if theamino acid composition of the early life form was esti-mated, it could be used to determine the amino acidconcentration in the environment and further deducedthe chronological order of amino acid appearance.According to this assumption, we estimated the amino
acid composition of early life form by genome-wide mon-itoring of amino acid usage in modern organisms. Asobservation, amino acid compositions are substantiallyvaried not only inter-species between three kingdoms oflife but also inter-species within a kingdom (AdditionalFiles 1). This caused difficulty in deducing a consensusamino acid composition for the LUA. In an additionalconstruction of taxa kinship hierarchy based on aminoacid composition in the three kingdoms of life (data notpresented), we found that taxa from same life kingdomtended to gather together. Therefore, an ancestral aminoacid usage was determined separately by kingdoms as fol-lows: Amino acids were first scored from 20 to 1 interms of descending order of their frequencies in eachdesignated species. The sum of the scores for each aminoacid was then calculated and ranked by kingdom of life(Figure 1). Integrating the data of three life domains, agenerally-agreed rank of amino acid frequency wasachieved. This rank was considered as the estimatedamino acid composition of the early life form. Accord-ingly, a possible chronological order of amino acidappearance was thus proposed in descending order: L, A,V/E/G, S, I, K, T, R/D, P, N, F, Q, Y, M, H, W, C. Thisorder agrees well with the previous findings of Miller’sexperiments [21] that ten “early” amino acids (A, D, E, G,I, L, P, S, T, V) rank in the top 12. It is slightly differentfrom Trifonov’s study (G/A, V/D, P, S, E/L, T, R, N, K,Q, I, C, H, F, M, Y, W) which was determined by com-parison of forty different single-factor criteria and multi-factor hypotheses [22]. The assignment of “early or late”amino acids was also supported by additional correlationanalyses between physiochemical properties of amino
acids and their genetic codes (Additional File 2). Boththis study (Figure 1 & Additional File 2) and previous evi-dence [21,22] supported the assignment of aromaticamino acids (F, W, and Y) as “late” amino acids. More-over, the effects of a high pH primitive environment ongenetic codes in early earth environment determined thatthere were more early basic amino acids than early acidicamino acids [15].
Co-evolution of amino acids and genetic codesIt has been suggested earlier that amino acid composi-tion was determined largely by existing genetic codes[23]. In our study, the relationship between amino acidsand codons has also been studied. As shown in Figure1, the amino acids with more codons are “favored” byproteins. This phenomenon was observed not only ineukaryotes, but also in most representatives of eubac-teria and archaebacteria. Two six-codon owners, leucineand serine, are the most frequently-used amino acids inall selective eukaryotic species. Arginine is also a six-codon amino acid, but its frequency of use is muchlower than expected (averagely ranking 9th in eukar-yotes, 10th in archaebacteria, and 11th in eubacteria).The under-utilization of arginine is as yet mechanisti-cally unclear, but it may be related to its physiochemicalproperties and roles in protein functions. All the four-codon amino acids (A, G, V, T, and P) are positioned inthe middle zone, and most of the two-codon aminoacids and all the one-codon amino acids are used lessoften.Previous research has proposed that all amino acids
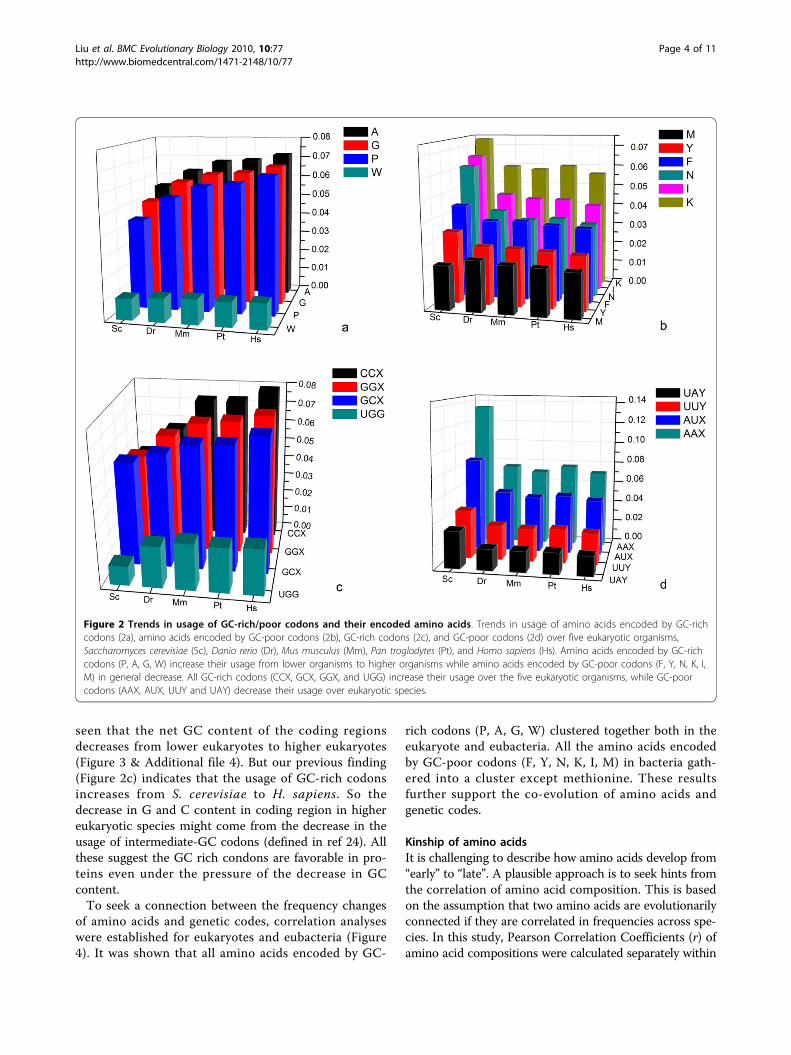
with declining frequencies were the first to be incorpo-rated into the genetic code [1]. To examine this finding,3D charts of amino acid frequency-codon relationshipwere prepared (Figure 2), including 5 selected eukaryoticrepresentatives in the same branch of Darwin Evolution(S. cerevisiae, D. rerio, M. musculus, P. troglodytes, andH. sapiens). Interestingly, all the amino acids encodedby GC-rich codons (definitively, CCX/GCX/GGX/UGG[24,25]), i.e. (P, A, G, and W), increased their frequen-cies from S. cerevisiae to H. sapiens; while all the aminoacids encoded by GC-poor codons (definitively, AAX/AUX/UAX/UUX), i.e. (F, Y, N, K, I, M), decreased.These results conflict with the previous findings of Jor-dan and his team [1] that P, A, G, and E ‘lose’ in proteinevolution. The disagreement may be caused by differentprotein data sets adopted by these two studies and dif-ferent evolutionary history of amino acids in three king-doms of life (Figure 1 & Additional file 1). Furtherstatistics of codons showed that the numbers of GC-richcodons (CCX/GCX/GGX/UGG) increased from S. cere-visiae to H. sapiens, while the GC-poor codons (AAX/AUX/UAY/UUY) decreased (Figure 2c, 2d & Additional
Liu et al. BMC Evolutionary Biology 2010, 10:77http://www.biomedcentral.com/1471-2148/10/77
Page 2 of 11

file 3). Similar results have also been obtained in pre-vious studies using different approaches [26,27].Additionally, we calculated the correlation coefficientsbetween “random” amino acid frequencies followingfrom a uniform usage of codons of the universal geneticcode and amino acid compositions of the modernorganisms (Additional File 1). As in previous findings[17], all eukaryotic representatives showed a higher cor-relation coefficient, indicating the small selection ofamino acid composition of proteins in eukaryotes. How-ever in eubacteria and in archaea, correlation coeffi-cients varied from 0.05 to 0.9, suggesting that some
microbials show a significant selection of amino acidsfor their proteins. The substantial variety of selectionpressure in microbials may be explained by factors suchas particular living environments, frequent mutation,rapid generation, etc. To have an overview of how GCcontent could affect amino acid usage, we compared theGC% of both coding regions and non-coding regions inthe whole genomes of eight organisms. Statistically, thecoding regions in lower eukaryotes have rather highernet GC content than the non-coding regions, but this ismanifestly reversed in higher organisms (A. mellifera, D.rerio, M. musculus, and H. sapiens), where it can be
Figure 1 Rankings of amino acid composition in three kingdoms of life. Frequency rankings for 20 alpha amino acids in eubacteria,archaebacteria and 10 selected eukaryotic representatives: Saccharomyces cerevisiae (Sc), Abrabidopsis thaliana (At), Caenorhaditis elegans (Ce),Drosophila melanogaster (Dm), Apis mellifera (Am), Danio rerio (Dr), Gullus gallus (Gg), Mus musculus (Mm), Pan troglodytes (Pt), and Homo sapiens(Hs). The status of genome was labeled as: (a) complete annotation, (b) draft assembly, (c) in progress. The numbers of genomes from the threelife kingdoms of archaebacteria, eubacteria and eukaryotes are presented after the kingdom names. For each taxa or life kingdom, the aminoacids were ranked in descending order of their frequencies in the whole proteome. Amino acids are colored by the number of codons: red,orange, green, blue, and gray stands for 6, 4, 3, 2, and 1 codons respectively. An amino acid is marked with “√ “ if it was detected by Miller’sspark tube experiments, otherwise, marked with “-”.
Liu et al. BMC Evolutionary Biology 2010, 10:77http://www.biomedcentral.com/1471-2148/10/77
Page 3 of 11
seen that the net GC content of the coding regionsdecreases from lower eukaryotes to higher eukaryotes(Figure 3 & Additional file 4). But our previous finding(Figure 2c) indicates that the usage of GC-rich codonsincreases from S. cerevisiae to H. sapiens. So thedecrease in G and C content in coding region in highereukaryotic species might come from the decrease in theusage of intermediate-GC codons (defined in ref 24). Allthese suggest the GC rich condons are favorable in pro-teins even under the pressure of the decrease in GCcontent.To seek a connection between the frequency changes
of amino acids and genetic codes, correlation analyseswere established for eukaryotes and eubacteria (Figure4). It was shown that all amino acids encoded by GC-
rich codons (P, A, G, W) clustered together both in theeukaryote and eubacteria. All the amino acids encodedby GC-poor codons (F, Y, N, K, I, M) in bacteria gath-ered into a cluster except methionine. These resultsfurther support the co-evolution of amino acids andgenetic codes.
Kinship of amino acidsIt is challenging to describe how amino acids develop from“early” to “late”. A plausible approach is to seek hints fromthe correlation of amino acid composition. This is basedon the assumption that two amino acids are evolutionarilyconnected if they are correlated in frequencies across spe-cies. In this study, Pearson Correlation Coefficients (r) ofamino acid compositions were calculated separately within
Figure 2 Trends in usage of GC-rich/poor codons and their encoded amino acids. Trends in usage of amino acids encoded by GC-richcodons (2a), amino acids encoded by GC-poor codons (2b), GC-rich codons (2c), and GC-poor codons (2d) over five eukaryotic organisms,Saccharomyces cerevisiae (Sc), Danio rerio (Dr), Mus musculus (Mm), Pan troglodytes (Pt), and Homo sapiens (Hs). Amino acids encoded by GC-richcodons (P, A, G, W) increase their usage from lower organisms to higher organisms while amino acids encoded by GC-poor codons (F, Y, N, K, I,M) in general decrease. All GC-rich codons (CCX, GCX, GGX, and UGG) increase their usage over the five eukaryotic organisms, while GC-poorcodons (AAX, AUX, UUY and UAY) decrease their usage over eukaryotic species.
Liu et al. BMC Evolutionary Biology 2010, 10:77http://www.biomedcentral.com/1471-2148/10/77
Page 4 of 11

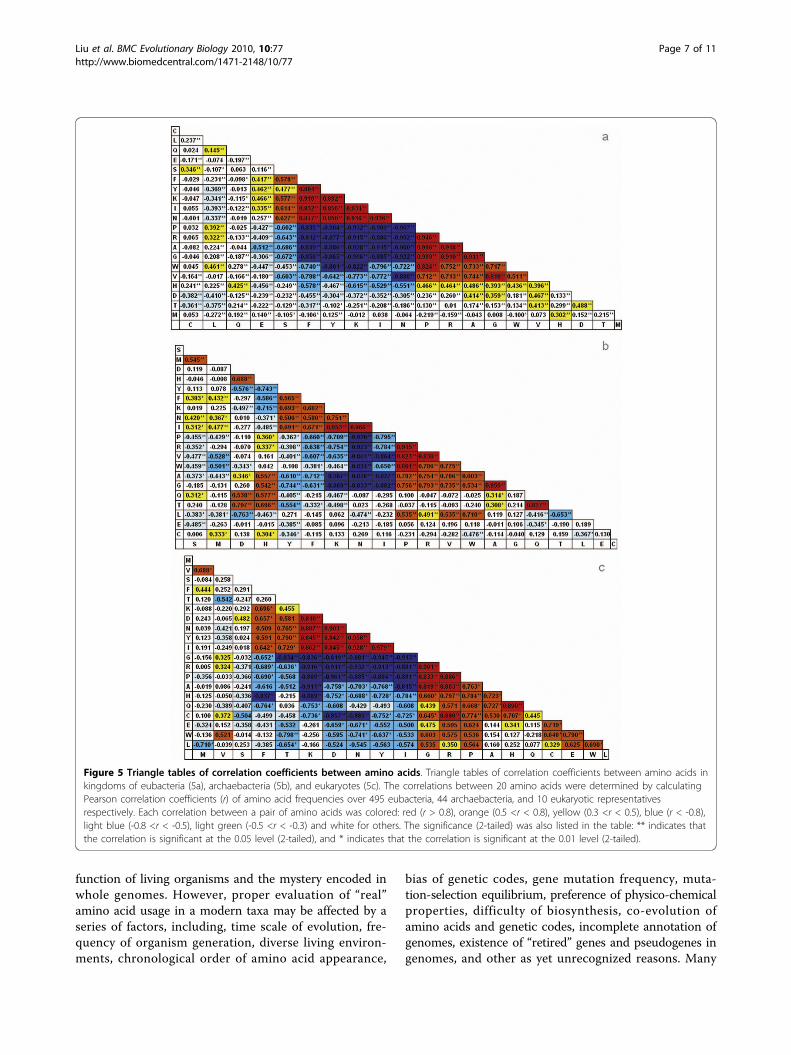
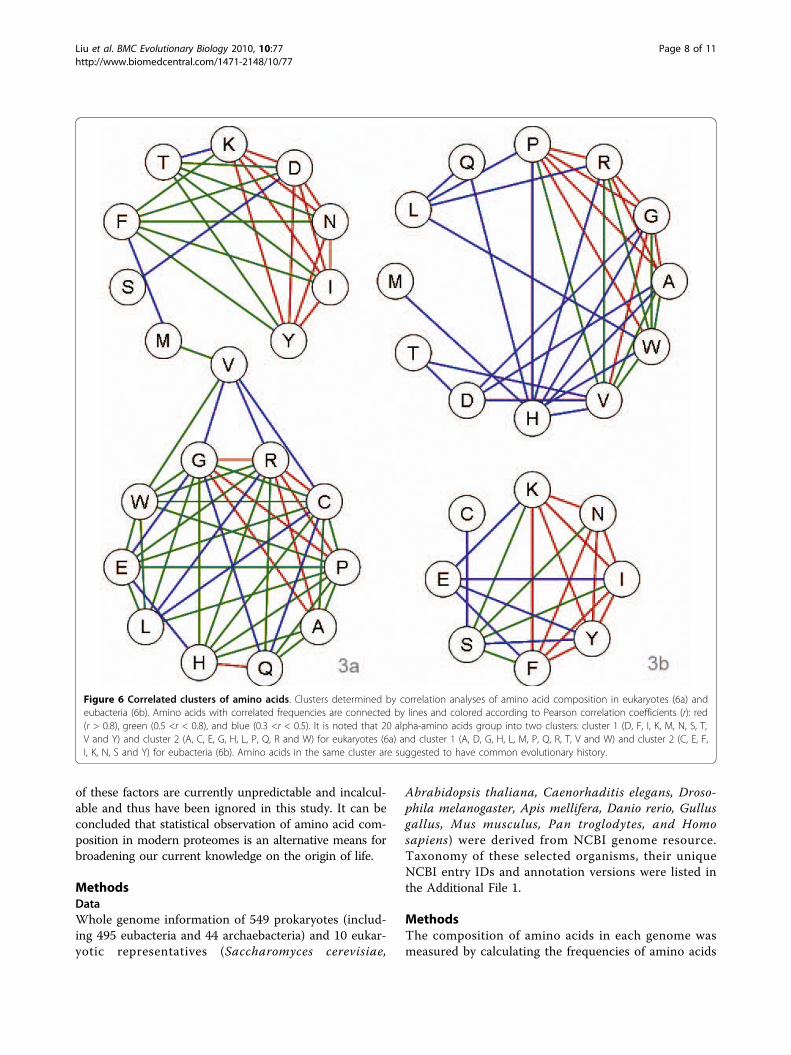
three kingdoms of life, and the results were arranged andpresented in triangular tables (Figure 5). It was observedthat amino acids were gathered into several zones: twozones of (A, G, P, R) and (K, I, N, Y) in eubacteria (Figure5a), two zones of (P, R, V) and (N, I, K) in archaebacteria(Figure 5b), and two zones of (D, K, I, N, Y) and (A, G, P,R) in eukaryotes (Figure 5c). Within a zone, the aminoacid pairs show highly positive or negative correlation(colored in red or deep blue, respectively) in frequency.The correlations was further analyzed and illustrated inkinship maps (Figure 6a and Figure 6b). As illustration, 20alpha-amino acids were assigned into two distinct clusters:(cluster 1 (D, F, I, K, M, N, S, T, V and Y) and cluster 2(A, C, E, G, H, L, P, Q, R and W)) for eukaryotes and clus-ter 1 (A, D, G, H, L, M, P, Q, R, T, V and W) and cluster 2(C, E, F, I, K, N, S and Y) for eubacteria. The amino acidsare connected by lines of different correlations. It is evi-dent that the positively correlated amino acids normallylocate in the same cluster, which suggests a common evo-lutionary history or functional connection. In contrast,those negatively correlated amino acids were separatedinto different clusters. It indicates a distinct evolutionaryhistory or functional competition. As the evolution ofamino acids may have proceeded independently in thethree kingdoms of life, it is understandable that aminoacids show different kinships in eukaryote and eubacteria.
However, conserved linkages were observed that someamino acids are always gathered together: (A, G, H, L, P,Q, R, W) and (F, I, K, N, S, Y). This suggests that aminoacids may have evolved mainly in two separate paths.It was also found (Figure 2) that amino acids with
similar codons are inclined towards having similar usageduring evolution, e.g. P/R, and N/I/Y. These aminoacids may have a common evolutionary origin. Accord-ingly, the potential evolutional paths of amino acidswere drawn using the following criteria. Firstly, aminoacids with a Pearson correlation coefficient above 0.8were designated as lineal consanguinity, either paternityor fraternity. Secondly, the assignment of kinship shouldagree with the chronological order of amino acids.Thirdly, the transition between amino acids is favoredby one-codon mutation, especially the last codon in thecodon triplet. These results are illustrated in Figure 7. Itcan be seen that the evolutionary paths of amino acidsin eukaryotes and eubacteria are not always coincident.However, two independent and conserved evolutionalpaths were found: A®G®R®P and K®Y.
ConclusionOur study agrees with previous research that statisticalanalysis of amino acid composition in proteins is a feasi-ble route to global understanding of the physiological
Figure 3 Comparison of GC% in coding regions and non-coding regions. The GC% of both coding regions and non-coding regions in thewhole genomes of eight organisms (S. cerevisiae, A. thaliana, C. elegans, D. melanogaster, A. mellifera, D. rerio, M. musculus, and H. sapiens) werecompared. The GC% in the coding regions is higher than that of the non-coding regions in lower organisms, while reversed in higherorganisms.
Liu et al. BMC Evolutionary Biology 2010, 10:77http://www.biomedcentral.com/1471-2148/10/77
Page 5 of 11
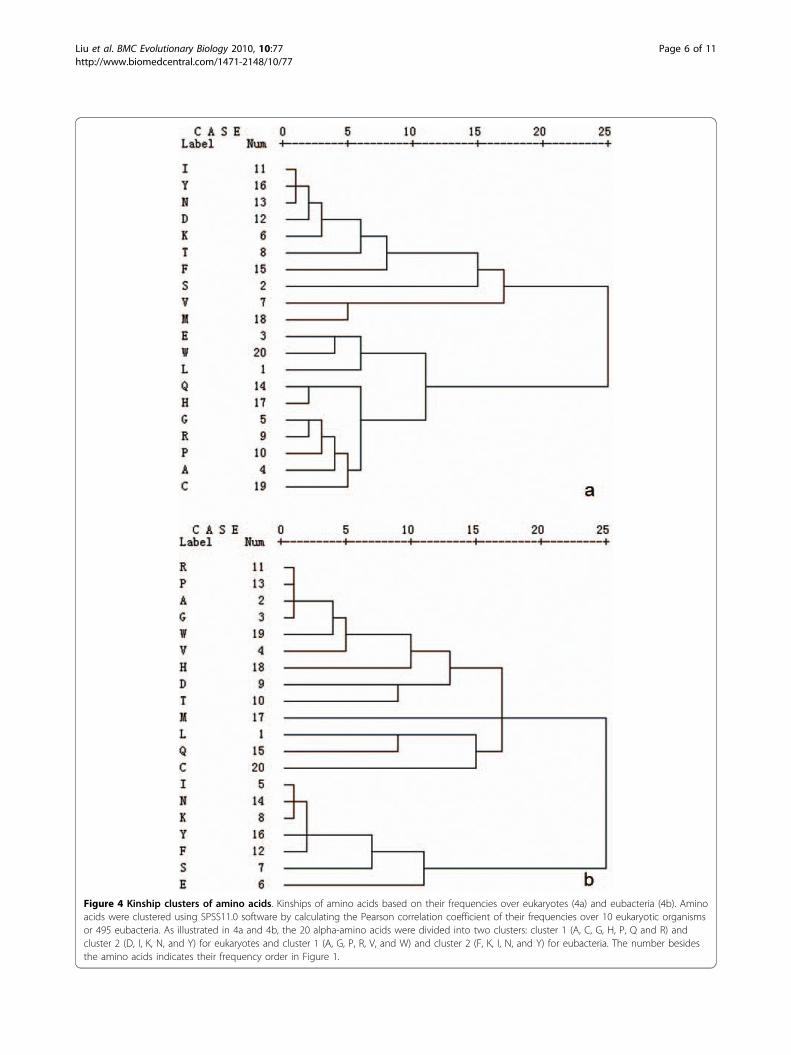
Figure 4 Kinship clusters of amino acids. Kinships of amino acids based on their frequencies over eukaryotes (4a) and eubacteria (4b). Aminoacids were clustered using SPSS11.0 software by calculating the Pearson correlation coefficient of their frequencies over 10 eukaryotic organismsor 495 eubacteria. As illustrated in 4a and 4b, the 20 alpha-amino acids were divided into two clusters: cluster 1 (A, C, G, H, P, Q and R) andcluster 2 (D, I, K, N, and Y) for eukaryotes and cluster 1 (A, G, P, R, V, and W) and cluster 2 (F, K, I, N, and Y) for eubacteria. The number besidesthe amino acids indicates their frequency order in Figure 1.
Liu et al. BMC Evolutionary Biology 2010, 10:77http://www.biomedcentral.com/1471-2148/10/77
Page 6 of 11
function of living organisms and the mystery encoded inwhole genomes. However, proper evaluation of “real”amino acid usage in a modern taxa may be affected by aseries of factors, including, time scale of evolution, fre-quency of organism generation, diverse living environ-ments, chronological order of amino acid appearance,
bias of genetic codes, gene mutation frequency, muta-tion-selection equilibrium, preference of physico-chemicalproperties, difficulty of biosynthesis, co-evolution ofamino acids and genetic codes, incomplete annotation ofgenomes, existence of “retired” genes and pseudogenes ingenomes, and other as yet unrecognized reasons. Many
Figure 5 Triangle tables of correlation coefficients between amino acids. Triangle tables of correlation coefficients between amino acids inkingdoms of eubacteria (5a), archaebacteria (5b), and eukaryotes (5c). The correlations between 20 amino acids were determined by calculatingPearson correlation coefficients (r) of amino acid frequencies over 495 eubacteria, 44 archaebacteria, and 10 eukaryotic representativesrespectively. Each correlation between a pair of amino acids was colored: red (r > 0.8), orange (0.5 <r < 0.8), yellow (0.3 <r < 0.5), blue (r < -0.8),light blue (-0.8 <r < -0.5), light green (-0.5 <r < -0.3) and white for others. The significance (2-tailed) was also listed in the table: ** indicates thatthe correlation is significant at the 0.05 level (2-tailed), and * indicates that the correlation is significant at the 0.01 level (2-tailed).
Liu et al. BMC Evolutionary Biology 2010, 10:77http://www.biomedcentral.com/1471-2148/10/77
Page 7 of 11
of these factors are currently unpredictable and incalcul-able and thus have been ignored in this study. It can beconcluded that statistical observation of amino acid com-position in modern proteomes is an alternative means forbroadening our current knowledge on the origin of life.
MethodsDataWhole genome information of 549 prokaryotes (includ-ing 495 eubacteria and 44 archaebacteria) and 10 eukar-yotic representatives (Saccharomyces cerevisiae,
Abrabidopsis thaliana, Caenorhaditis elegans, Droso-phila melanogaster, Apis mellifera, Danio rerio, Gullusgallus, Mus musculus, Pan troglodytes, and Homosapiens) were derived from NCBI genome resource.Taxonomy of these selected organisms, their uniqueNCBI entry IDs and annotation versions were listed inthe Additional File 1.
MethodsThe composition of amino acids in each genome wasmeasured by calculating the frequencies of amino acids
Figure 6 Correlated clusters of amino acids. Clusters determined by correlation analyses of amino acid composition in eukaryotes (6a) andeubacteria (6b). Amino acids with correlated frequencies are connected by lines and colored according to Pearson correlation coefficients (r): red(r > 0.8), green (0.5 <r < 0.8), and blue (0.3 <r < 0.5). It is noted that 20 alpha-amino acids group into two clusters: cluster 1 (D, F, I, K, M, N, S, T,V and Y) and cluster 2 (A, C, E, G, H, L, P, Q, R and W) for eukaryotes (6a) and cluster 1 (A, D, G, H, L, M, P, Q, R, T, V and W) and cluster 2 (C, E, F,I, K, N, S and Y) for eubacteria (6b). Amino acids in the same cluster are suggested to have common evolutionary history.
Liu et al. BMC Evolutionary Biology 2010, 10:77http://www.biomedcentral.com/1471-2148/10/77
Page 8 of 11

Figure 7 Putative evolutionary paths of amino acids. Putative evolutionary paths of amino acids based on data of eukaryotes (7a) andeubacteria (7b). Each block contains an amino acid, its ranking of frequency (the number beside the amino acid), and first two characters of itscodons. The continuous arrow indicates the direction of evolution and the dotted arrow indicates more than one possible direction of evolution.It seems that new amino acids tend to derive from “parent” amino acids by one-base codon change. It is noted that evolutionary paths ofamino acids in eukaryotes (7a) and eubacteria (7b) are not exactly the same, however, conserved evolutionary paths are observed: A®G®R®Pand K®Y.
Liu et al. BMC Evolutionary Biology 2010, 10:77http://www.biomedcentral.com/1471-2148/10/77
Page 9 of 11

against all open reading frames (ORFs) in the wholegenome. The frequency of each amino acid was deter-mined by
F NN
i itotal
(1)
where Ni is the number of amino acid i in genomeORFs, and Ntotal is the sum of all 20 amino acids ingenome ORFs. This calculation is subjected to theassumption that the ORF assignments in selected gen-omes are correct. The Pearson correlation coefficients(r) of amino acids frequency data from the three king-doms was computed by Bivariate Correlations procedureof software SPSS 13.0, at significance level 0.01 and 0.05.
X Y
X Y
X Y
E X X Y YX Y
,cov( , ) (( )( ))
(2)
Where X and Y are the two random amino acids; rX,Y is the correlation coefficient between X and Y; μX andμY are expected values; sX and sY are standard devia-tions; E is the expected value operator; cov meanscovariance.
Additional file 1: Table S1. Frequencies of 20 alpha-amino acids in 495eubacteria, 44 archaebacteria and 10 eukaryotic representatives. Thearchaebacteria were prefixed with “*”. NCBI entry IDs and annotationversions were provided with taxa names. The correlation coefficientsbetween “random” amino acid frequencies following from uniformcodon usage and amino acid compositions of the modern organismswere also given.
Additional file 2: Table S2. Average frequencies of genetic codes forbasic or acidic amino acids in three kingdoms of life. Averagefrequencies of genetic codes for basic or acidic amino acids in kingdomsof archaebacteria, eubacteria, and eukaryotes respectively. The basicamino acids are Histidine (H), Lysine (K), and Arginine (R), and the acidicamino acids are Aspartic acid (D) and Glutamic acid (E). AFGC stands forAverage frequency of genetic codes.
Additional file 3: Table S3. Frequencies of 64 genetic codes in 495eubacteria, 44 archaebacteria and 10 eukaryote representatives.
Additional file 4: Table S4. The GC% of both coding regions and non-coding regions in the whole genomes of eight organisms (S. cerevisiae, A.thaliana, C. elegans, D. melanogaster, A. mellifera, D. rerio, M. musculus,and H. sapiens).
AcknowledgementsThe project is supported by the National Natural Science Foundation ofChina (NO. 20572061 and No.20732004). Support from the Program for NewCentury Excellent Talents in University (NCET) of MOE (2006 to Ji ZL) isgratefully acknowledged.
Author details1The Key Laboratory for Chemical Biology of Fujian Province, Department ofChemistry, College of Chemistry and Chemical Engineering, XiamenUniversity, Xiamen 361005, Fujian, PR China. 2School of Life Science, XiamenUniversity, Xiamen 361005, Fujian, PR China. 3The Key Laboratory forBioorganic Phosphorus Chemistry and Chemical Biology, Ministry ofEducation, Department of Chemistry, School of Life Sciences andEngineering, Tsinghua University, Beijing 100084, PR China.
Authors’ contributionsZJ is the designer and supervisor of this project. YZ is the co-supervisor ofthis project and helped to revise the manuscript. XL is the major researcherand prepared the manuscript. JZ, FN, XD, BH, DH were involved in datacollection and analyses at different stages of this project. All authors haveread and approved the final manuscript.
Received: 15 February 2009 Accepted: 15 March 2010Published: 15 March 2010
References1. Jordan IK, Kondrashov FA, Adzhubei IA, Wolf YI, Koonin EV, Kondrashov AS,
Sunyaev S: A universal trend of amino acid gain and loss in proteinevolution. Nature 2005, 433(7026):633-638.
2. Hurst LD, Feil EJ, Rocha EP: Protein evolution: causes of trends in amino-acid gain and loss. Nature 2006, 442(7105):E11-12, discussion E12.
3. Swire J, Judson OP, Burt A: Mitochondrial genetic codes evolve to matchamino acid requirements of proteins. J Mol Evol 2005, 60(1):128-139.
4. Brooks DJ, Fresco JR, Lesk AM, Singh M: Evolution of amino acidfrequencies in proteins over deep time: inferred order of introductionof amino acids into the genetic code. Mol Biol Evol 2002,19(10):1645-1655.
5. Brooks DJ, Fresco JR, Singh M: A novel method for estimating ancestralamino acid composition and its application to proteins of the LastUniversal Ancestor. Bioinformatics 2004, 20(14):2251-2257.
6. Brooks DJ, Fresco JR: Increased frequency of cysteine, tyrosine, andphenylalanine residues since the last universal ancestor. Mol CellProteomics 2002, 1(2):125-131.
7. Biro JC, Benyo B, Sansom C, Szlavecz A, Fordos G, Micsik T, Benyo Z: Acommon periodic table of codons and amino acids. Biochemical andbiophysical research communications 2003, 306(2):408-415.
8. Graur D: Amino acid composition and the evolutionary rates of protein-coding genes. J Mol Evol 1985, 22(1):53-62.
9. Tourasse NJ, Li WH: Selective constraints, amino acid composition, andthe rate of protein evolution. Mol Biol Evol 2000, 17(4):656-664.
10. Chirpich TP: Rates of protein evolution: a function of amino acidcomposition. Science 1975, 188(4192):1022-1023.
11. Julenius K, Pedersen AG: Protein evolution is faster outside the cell. MolBiol Evol 2006, 23(11):2039-2048.
12. Chou KC: Using pair-coupled amino acid composition to predict proteinsecondary structure content. J Protein Chem 1999, 18(4):473-480.
13. Pilizota T, Lucic B, Trinajstic N: Use of variable selection in modeling thesecondary structural content of proteins from their composition ofamino acid residues. J Chem Inf Comput Sci 2004, 44(1):113-121.
14. Lee S, Lee BC, Kim D: Prediction of protein secondary structure contentusing amino acid composition and evolutionary information. Proteins2006, 62(4):1107-1114.
15. Jukes TH, Holmquist R, Moise H: Amino acid composition of proteins:Selection against the genetic code. Science 1975, 189(4196):50-51.
16. Raghava GP, Han JH: Correlation and prediction of gene expression levelfrom amino acid and dipeptide composition of its protein. BMCBioinformatics 2005, 6:59.
17. Bogatyreva NS, Finkelstein AV, Galzitskaya OV: Trend of amino acidcomposition of proteins of different taxa. J Bioinform Comput Biol 2006,4(2):597-608.
18. Wang GZ, Ma BG, Yang Y, Zhang HY: Unexpected amino acidcomposition of modern Reptilia and its implications in molecularmechanisms of dinosaur extinction. Biochem Biophys Res Commun 2005,333(4):1047-1049.
19. Tekaia F, Yeramian E, Dujon B: Amino acid composition of genomes,lifestyles of organisms, and evolutionary trends: a global picture withcorrespondence analysis. Gene 2002, 297(1-2):51-60.
20. Cutter AD, Wasmuth JD, Blaxter ML: The evolution of biased codon andamino acid usage in nematode genomes. Mol Biol Evol 2006,23(12):2303-2315.
21. Miller SL: A production of amino acids under possible primitive earthconditions. Science 1953, 117(3046):528-529.
22. Trifonov EN: Consensus temporal order of amino acids and evolution ofthe triplet code. Gene 2000, 261(1):139-151.
23. Ota T, Kimura M: Amino acid composition of proteins as a product ofmolecular evolution. Science 1971, 174(5):150-153.
Liu et al. BMC Evolutionary Biology 2010, 10:77http://www.biomedcentral.com/1471-2148/10/77
Page 10 of 11
24. Gu X, Hewett-Emmett D, Li WH: Directional mutational pressure affectsthe amino acid composition and hydrophobicity of proteins in bacteria.Genetica 1998, 102-103(1-6):383-391.
25. Banerjee T, Gupta SK, Ghosh TC: Role of mutational bias and naturalselection on genome-wide nucleotide bias in prokaryotic organisms.Biosystems 2005, 81(1):11-18.
26. Jimenez-Sanchez A: On the origin and evolution of the genetic code.Journal of molecular evolution 1995, 41(6):712-716.
27. Ikehara K, Omori Y, Arai R, Hirose A: A novel theory on the origin of thegenetic code: a GNC-SNS hypothesis. Journal of molecular evolution 2002,54(4):530-538.
doi:10.1186/1471-2148-10-77Cite this article as: Liu et al.: Genome wide exploration of the originand evolution of amino acids. BMC Evolutionary Biology 2010 10:77.
Submit your next manuscript to BioMed Centraland take full advantage of:
• Convenient online submission
• Thorough peer review
• No space constraints or color figure charges
• Immediate publication on acceptance
• Inclusion in PubMed, CAS, Scopus and Google Scholar
• Research which is freely available for redistribution
Submit your manuscript at www.biomedcentral.com/submit
Liu et al. BMC Evolutionary Biology 2010, 10:77http://www.biomedcentral.com/1471-2148/10/77
Page 11 of 11