research article open access a validated ... · formation using experimental design asmaa ahmed...
TRANSCRIPT

El-Zaher and Mahrouse Chemistry Central Journal 2013, 7:90http://journal.chemistrycentral.com/content/7/1/90
RESEARCH ARTICLE Open Access
A validated spectrofluorimetric method for thedetermination of nifuroxazide through coumarinformation using experimental designAsmaa Ahmed El-Zaher and Marianne Alphonse Mahrouse*
Abstract
Background: Nifuroxazide (NF) is an oral nitrofuran antibiotic, having a wide range of bactericidal activity against grampositive and gram negative enteropathogenic organisms. It is formulated either in single form, as intestinal antisepticor in combination with drotaverine (DV) for the treatment of gastroenteritis accompanied with gastrointestinal spasm.Spectrofluorimetry is a convenient and sensitive technique for pharmaceutical quality control. The new proposedspectrofluorimetric method allows its determination either in single form or in binary mixture with DV. Furthermore,experimental conditions were optimized using the new approach: Experimental design, which has many advantagesover the old one, one variable at a time (OVAT approach).
Results: A novel and sensitive spectrofluorimetric method was designed and validated for the determination of NFin pharmaceutical formulation. The method was based upon the formation of a highly fluorescent coumarincompound by the reaction between NF and ethylacetoacetate (EAA) using sulfuric acid as catalyst. Thefluorescence was measured at 390 nm upon excitation at 340 nm. Experimental design was used to optimizeexperimental conditions. Volumes of EAA and sulfuric acid, temperature and heating time were considered thecritical factors to be studied in order to establish an optimum fluorescence. Each two factors were co-tried at threelevels. Regression analysis revealed good correlation between fluorescence intensity and concentration over the range20–400 ng ml-1. The suggested method was successfully applied for the determination of NF in pure and capsuleforms. The procedure was validated in terms of linearity, accuracy, precision, limit of detection and limit ofquantification. The selectivity of the method was investigated by analysis of NF in presence of the co-mixed drug DVwhere no interference was observed. The reaction pathway was suggested and the structure of the fluorescentproduct was proposed. Statistical comparison between the presented method and a reported spectrophotometric onewas carried out on pure and pharmaceutical formulation and revealed no significant difference.
Conclusion: The proposed method was considered economic, accurate, precise and highly sensitive. It could be easilyapplied in laboratory quality control for the analysis of NF in pure form and in pharmaceutical dosage form.
Keywords: Nifuroxazide, Spectrofluorimetry, Experimental design, Coumarin, Ethylacetoacetate
BackgroundNifuroxazide (NF, Scheme 1a), chemically designated as4-hydroxy-N'-[(5-nitrofuran-2-yl) methylidene] benzohydrazide[1], is a nitrofuran derivative with wide range of bacteri-cidal activity against gram positive and gram negativeenteropathogenic organisms. It is poorly absorbed fromthe gastrointestinal tract and is extensively used as an
* Correspondence: [email protected] Chemistry Department, Faculty of Pharmacy, Cairo University,Kasr El-Aini St, Cairo 11562, Egypt
© 2013 El-Zaher and Mahrouse; licensee Chemthe Creative Commons Attribution License (hdistribution, and reproduction in any medium
intestinal antiseptic in the treatment of colitis, acute andchronic diarrhea and gastroenteritis [2]. NF is an officialdrug in the British Pharmacopoeia [3] which recommendsa potentiometric titration for its determination in pharma-ceutical formulation. Various analytical techniques werereported for the analysis of NF including colorimetry [4,5],spectrophotometry [5-8], near IR [9], TLC [10] and HPLC[5,11]. Electrochemical methods, such as polarography[6,7,12-15] and voltammetry [14,16,17] were also applied.Only a single spectrofluorimetric method was reported forthe determination of NF using the native fluorescence of
istry Central Ltd. This is an Open Access article distributed under the terms ofttp://creativecommons.org/licenses/by/2.0), which permits unrestricted use,, provided the original work is properly cited.

ON+
-ON NH
OOH
ONH
O
O
O
O
(a) (b)Scheme 1 Chemical structures of NF (a) and DV (b).
El-Zaher and Mahrouse Chemistry Central Journal 2013, 7:90 Page 2 of 12http://journal.chemistrycentral.com/content/7/1/90
its alkaline degradate [18]. Pharmaceutical dosage formcontaining a binary mixture of NF and drotaverine (DV,Scheme 1b), is well established as an intestinal antiseptic -antispasmodic formulation. Spectrophotometric, TLC andHPLC [19-21] methods were developed for the simultan-eous determination of NF and DV in capsules.Two drawbacks were found in the reported spectro-
fluorimetric method. First, the method could not be ap-plied for the determination of NF in presence of DV,since the alkaline conditions required would lead to deg-radation of DV [22]. Second, the optimization of theprocedure conditions was performed one variable at atime (OVAT approach) which does not guarantee at allthat the real optimum will be reached. This approachwould be valid only if the variables to be optimized weretotally independent from each other [23]. In addition,OVAT approach requires a vast number of experimentsto establish optimum levels and therefore, is time andbudget consuming. These limitations can be eliminatedby using experimental design (DOE) which is considereda more efficient systematic optimization technique. Ithas attracted attention as a multivariate optimizing ap-proach as it takes into account the interaction amongrelevant factors affecting any chemical reaction. More-over, this approach offers distinct advantages over OVATapproach, such as, the use of minimum number of ex-periments and feasibility of generating data that may beanalyzed statistically to provide valuable information onthe interactions among experimental parameters [24,25].Based on the aforementioned observations, the main
objective of this work was to develop and optimize anew spectrofluorimetric method for the determinationof NF, based on the formation of a highly fluorescentcoumarin via Von Pechmann - Duisberg condensationreaction. The optimum spectrofluorimetric conditionswere estimated by a face centered composite (FCC) de-sign using both mathematical and graphical globaloptimization approaches. The coumarin product wasisolated and its structure was identified by IR, 1H-NMRand mass spectroscopy. The proposed method wastested for linearity, accuracy, intraday and interday pre-cision. Finally, the selectivity of the suggested method
was checked by the analysis of NF in presence of the co-mixed drug DV.
ExperimentalInstrumentationAll fluorescence measurements were carried out using aShimadzu RF – 1501 Spectrofluorophotometer (ShimadzuKyoto, Japan), with excitation and emission band pass of5 nm using 1 cm quartz cell. Sonication was performedon ultrasonic processor; Soniclean 120T, 220/240v, 50/60Hz, 60W (Thebarton SA, Australia). Experimentalmatrices, three dimensional (3D) surface plots and con-tour curves were generated using Minitab (Version 15)statistical software, State College, Pennsylvania, USA. IRand MS analysis were performed at micro-analyticalcenter, Faculty of Science, Cairo University. IR spectrawere recorded using potassium bromide discs onShimadzu IR-435 spectrometer (Shimadzu, Kyoto, Japan).Mass spectra were recorded on a Hewlett Packard 5988AGC/MS system (70ev) spectrometer (USA). 1H-NMRspectra were performed at national research center, on JeolNMR Varian Gemini 500 MHZ spectrometer (Jeol, Tokyo,Japan, Varian, PaloAito, CA, USA).
Materials and reagentsAll chemicals and solvents were of analytical reagentgrade. NF pure sample was kindly supplied by AmounPharmaceutical Co., El-Obour City, Egypt. Its purity waschecked according to spectrophotometric method [19]and was found to be 99.28 ± 0.745. Pharmaceutical dos-age form containing NF was purchased from the localmarket. AntinalW capsules (Batch No. 112463) were la-beled to contain 200 mg NF/capsule and drotazideW cap-sules (Batch No. 012034) were labeled to contain 200mg NF and 40 mg DV /capsule. The two pharmaceuticalpreparations were manufactured by Amoun Pharma-ceutical Co., El-Obour City, Egypt. Ethyl acetoacetate(Merck, Germany), labeled to be 98%, was used asfreshly prepared 2% (v/v) solution in absolute ethanol(Sigma –Aldrich, Germany) and the solutions werediscarded regularly every day. Sulfuric acid (Fischer,UK), labeled to be > 95% v/v, was used all over the work.Methanol (Riedel – de Haën, Germany) was HPLCgrade. Methylene chloride (El-Nasr PharmaceuticalChemicals, Egypt) was of analytical reagent grade.
Preparation of the standard solutionsStock solution NF stock solution was prepared by ac-curately weighing 10 mg of NF and dissolving in 20 mlabsolute ethanol with the aid of sonication for 15 mi-nutes in a 100 ml volumetric flask. The volume wascompleted to the mark with the same solvent to give afinal concentration of 100 μg ml-1 of NF. The solution

El-Zaher and Mahrouse Chemistry Central Journal 2013, 7:90 Page 3 of 12http://journal.chemistrycentral.com/content/7/1/90
was wrapped in aluminum foil [26] and was stable for atleast 7 days if kept in the refrigerator.
Working standard solution A solution of final concen-tration of 1 μg ml-1 was prepared by diluting 1 ml of thestandard stock solution to 100 ml using absolute ethanol.
Experimental design for spectrofluorimetric methodoptimizationTo optimize the critical factors affecting the reactionand explore their effects on the response, a three-levelFCC design was applied. Two experimental matrices,each of 11 experiments, were designed, then experimen-tally performed and the corresponding fluorescence in-tensities were measured. The factors chosen werevolume of ethyl acetoacetate (EAA), volume of sulfuricacid, temperature and heating time. Each factor wastried at three levels. Experimental matrix which containsthe coded levels and experimental plan which reportstheir real values are revealed in Table 1.The FCC design supports the building of a polynomial
equation which takes into account the individual, inter-active (usually the interaction among more than twoterms are not taken into account) and quadratic termsaccording to the following mathematical second-ordermodel [27,28]:
Y ¼ b0 þ b1X1 þ b2X2 þ b12X1X2 þ b11X21 þ b22X
22
Where Y is the response, b0 is the arithmetic mean re-sponse, b1 and b2 are the regression coefficients of thefactors X1 and X2, respectively and b12, b11 and b22 areinteraction and square regression coefficients terms, re-spectively. The terms b1X1 and b2X2 are the individualeffects of each factor, b12X1X2 indicates the interaction
Table 1 Experimental matrix and experimental plan of the fa
Number ofexperiments
Experimental variables
X1 X2 X3 X4 VolumEAA (
1 1 0 −1 −1 0.3
2 0 1 1 1 0.2
3 1 −1 −1 1 0.3
4 0 0 0 0 0.2
5 −1 1 0 −1 0.1
6 −1 0 −1 0 0.1
7 0 0 0 0 0.2
8 0 −1 1 0 0.2
9 1 1 1 −1 0.3
10 −1 −1 0 1 0.1
11 0 0 0 0 0.2
among the factors and the terms b11X12, b22X2
2 takes intoaccount a possible non-linear (quadratic) effects of somefactors.Response surface and contour plots were constructed
to evaluate the optimum conditions for the response.Plots of residuals and a lack of fit test with the analysisof variance (ANOVA) model were conducted to assurethe adequacy of the model.
Construction of calibration graphTo a set of 10 ml volumetric flasks, different aliquotsequivalent to (200 - 4000 ng) from the working standardsolution of the drug were quantitatively transferred andthen were evaporated to dryness on a boiling water bath.The flasks were then left to cool to room temperature.EAA solution (0.1 ml, 2% v/v) was added to each flaskfollowed by cautious dropwise addition of sulfuric acid(2.5 ml). The flasks were heated in a water bath adjustedat 40°C for 20 minutes, left to cool to room temperatureand then the volume was completed to the mark withmethanol. The fluorescence intensities of the resultingsolutions were measured at 390 nm after excitation at340 nm. The calibration graph was obtained by plottingthe fluorescence intensities versus the corresponding con-centrations and the regression equation was computed.
Analysis of pharmaceutical dosage formAccurate weights of the mixed contents of either 20AntinalW capsules or drotazideW capsules equivalent to10 mg of NF were transferred quantitatively to two 100ml volumetric flasks and about 50 ml of absolute ethanolwere added to each flask. The content of each flask wassonicated for 15 minutes, completed to volume with thesame solvent, filtered and then, the first portion of the
ce centered composite design
e ofml)
Volume ofH2SO4 (ml)
Temperature (°C) Heatingtime (min)
1.5 25 10
2.5 55 30
0.5 25 30
1.5 40 20
2.5 40 10
1.5 25 20
1.5 40 20
0.5 55 20
2.5 55 10
0.5 40 30
1.5 40 20

El-Zaher and Mahrouse Chemistry Central Journal 2013, 7:90 Page 4 of 12http://journal.chemistrycentral.com/content/7/1/90
filtrate was rejected. Further dilution was done in orderto obtain a working standard solution of 1 μg ml-1 usingabsolute ethanol. Different aliquots of the workingstandard solution were analyzed using the procedurementioned under "Construction of calibration graph".
Method validationThe newly developed method was validated in terms oflinearity, accuracy, precision, selectivity, limit of detec-tion (LOD) and limit of quantification (LOQ), accordingto the International Conference on Harmonization(ICH) Q2 (R1) guidelines [29].
Linearity and rangeThe linearity of the method was checked by analyzingfive different solutions of NF over the concentrationrange 20 – 400 ng ml-1. Each solution was prepared andanalyzed in triplicate. Calibration curve was constructedas fluorescence intensity versus the concentration of thedrug and the linear relationship was determined.
AccuracyThe accuracy of the method was tested by analyzing so-lutions of the drug in triplicate at concentrations 50,150, 250 and 350 ng ml-1 by using the previously men-tioned experimental conditions and comparing mea-sured and calculated values. Percentage recoveries, themean recovery and the standard deviation (SD) were cal-culated. In addition, accuracy and validity of the methodwas determined by standard addition technique in whichthe recoveries of known amounts of NF, added to the sam-ple solution of known concentration, were calculated.
PrecisionThe repeatability (intraday precision) was determined byreplicate analysis (n=3) of standard solutions at low andhigh concentration levels (100 and 350 ng ml-1). Theintermediate precision (interday precision) was con-ducted by repeating the analysis over a period of threeconsecutive working days. The overall precision of themethod was expressed as percentage relative standarddeviations (% RSD).
SelectivitySelectivity was investigated by analyzing NF inpharmaceutical dosage form containing binary mix-ture of NF and DV. Percentage recoveries of NF werecalculated.
Limit of detection and limit of quantificationLOD and LOQ of the developed method for the analysisof NF were established according to (ICH) Q2 (R1)guidelines, based on the standard deviation of the
response and the slope, using the following equation:
LOD ¼ 3:3� SD=slope⋯⋯⋯LOQ ¼ 10� SD=slope
Results and discussionCompared to absorption spectroscopic methods, themost attractive features of spectrofluorimetric analysisare high sensitivity and high selectivity. Its sensitivity isone to three orders of magnitude better than absorptionspectroscopy while its greater selectivity is based on thefact that fewer substances fluoresce than absorb radi-ation [30,31]. Another advantage is the large linear con-centration range of spectrofluorimetric methods whichis greater than those encountered in absorption spec-troscopy [32].
Optimization of reaction conditionsOVAT approach, which was traditionally employed formethod development, generally requires a large numberof experimental runs. In addition, it does not includeinteraction term and thus it does not depict the collect-ive effects of various factors on the response [33]. Toovercome this problem, the optimal reaction conditionswere defined by applying DOE, in which factors are var-ied together. It is a statistical technique for quickly opti-mizing performance of systems, with two general issues,first, designing an optimal experiment and second, ana-lyzing its results [24,28].
Preliminary study and factor selectionSome studies were carried out prior to the optimi-zation by DOE. Excitation and emission wavelengthswere optimized by searching the maximum fluores-cence intensity by means of the recorded spectra. Theexcitation and emission optimal wavelengths were 340nm and 390 nm, respectively. Several solvents weretested for the fluorescent measurements (methanol,ethanol, acetonitrile and water) and maximumfluorescence intensity was obtained with methanol.Preliminary investigations reveal that four factorscould be relevant and affect the reaction. Volumes ofEAA (X1), volume of sulfuric acid (X2), temperature(X3) and heating time (X4) were considered the crit-ical factors to be studied in order to establish anoptimum fluorescence.
Face centered composite designFactorial design, in which factors are set at two levels,assumes that the effect of factors on the response islinear (first-order factor effects). Since the yield ofthe chemical reaction is a function of time andtemperature which are usually related in a curvilinearfashion to the resultant yield, center-point (the mean

Figure 1 Interaction plots for the effect of volume of EAA andvolume of H2SO4 (a) and the effect of temperature and heatingtime (b) on fluorescence intensity.
El-Zaher and Mahrouse Chemistry Central Journal 2013, 7:90 Page 5 of 12http://journal.chemistrycentral.com/content/7/1/90
value of a factor) should be added in the center ofthe design, resulting in star design. The face centeredcomposite design (FCC) is a special case of centralcomposite design and is composed by a factorial de-sign and a star design. It was utilized to evaluate themain, interaction and quadratic effects of the studiedfactors on the response [23,28].Experimental matrix of FCC was built using each two
factors at three levels. The number of experimental runswas 2K + 2K + 1, where K was the number of factors.The first 2K runs were the same as factorial design, thenext 2K axial experiments were symmetrically spaced at± 1 along each variable axis and at least one centralpoint. Two to five center repetitions were generally car-ried out in order to know the experimental variance andto test the predictive validity of the model [34]. There-fore, a two- factor FCC design required 11 runs (withtwo center repetitions) while a four-factor FCC designrequired 27 runs. For this reason, in order to decreasenumber of experiments, the four critical factors of thereaction were divided into two separate models. Eachtwo factors were chosen based on the interaction plots,Figure 1, where the relative slopes of the lines depictedthe presence of interaction between (X1 , X2) and (X3 ,X4). The factors were tried at three levels and levels werecoded for simplification, -1 for the minimum value, +1for the maximum value and 0 for the central one. Ac-cordingly, two experimental matrices, each of 11 experi-ments, were designed and all experiments wereperformed in randomized order to minimize any bias onthe response due to uncontrolled factors [24]. Experi-mental matrix and plan were reported in Table 1.The coefficients of the second–order polynomial model
were computed and the following equation models wereobtained:
Y ¼ 159:48−75:37X1
þ145:62X2−88:28X1X2 þ 42:99X21
þ132:56X22
ð1Þ
Y ¼ 701:72þ 193:67X32 2
þ 47:41 X4−34:58X3X4−203:80X3−2:75X4 ð2ÞWhere Y is the fluorescence intensity, X1, X2, X3, andX4 are volume of EAA, volume of sulfuric acid,temperature and heating time, respectively. By simply re-placing X1, X2, X3, and X4, it will be possible to predictthe response for any possible setting, even for those ex-periments that have not been actually performed.Equations (1, 2) reveal that the fluorescence intensity
is inversely related to the volume of EAA. While the in-crease in volume of sulfuric acid and temperature sig-nificantly increases the fluorescence intensity. However,
the highly significant quadratic terms ( X22 and X2
3 )
indicate a possible curvature and non-linear correlationbetween the factor and the output of the equation. Theindividual effects of temperature and heating time arepositive and their quadratic effects are negative thus in-dicating that the fluorescence intensity increases with in-creasing of the factor up to a critical threshold afterwhich a further increase results in a decrease of the re-sponse (0 level of X3 and X4 were chosen). In addition,the significant interaction between volumes of EAA andsulfuric acid and that of temperature and heating timedecreases the fluorescence. Another interesting idea canbe inferred from the interactive terms, where the nega-tive sign suggests that each two factors act in a negativeway each other, i.e. to increase the response, volume ofEAA is maintained at low level while increasing that ofsulfuric acid. Regression Table 2 reveals the values of re-gression coefficients and their associated p-values, whichare used to determine which of the effects in the modelare statistically significant. It was observed that all thefour factors and X1 X2 interaction significantly affect the
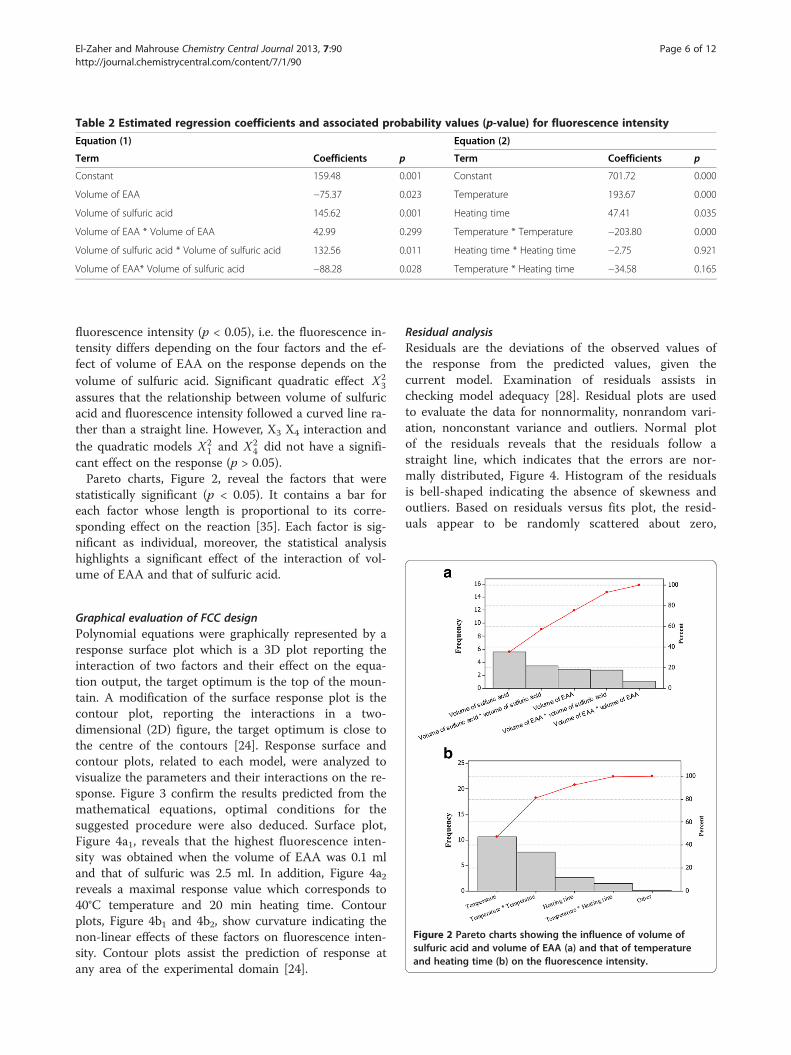
Table 2 Estimated regression coefficients and associated probability values (p-value) for fluorescence intensity
Equation (1) Equation (2)
Term Coefficients p Term Coefficients p
Constant 159.48 0.001 Constant 701.72 0.000
Volume of EAA −75.37 0.023 Temperature 193.67 0.000
Volume of sulfuric acid 145.62 0.001 Heating time 47.41 0.035
Volume of EAA * Volume of EAA 42.99 0.299 Temperature * Temperature −203.80 0.000
Volume of sulfuric acid * Volume of sulfuric acid 132.56 0.011 Heating time * Heating time −2.75 0.921
Volume of EAA* Volume of sulfuric acid −88.28 0.028 Temperature * Heating time −34.58 0.165
El-Zaher and Mahrouse Chemistry Central Journal 2013, 7:90 Page 6 of 12http://journal.chemistrycentral.com/content/7/1/90
fluorescence intensity (p < 0.05), i.e. the fluorescence in-tensity differs depending on the four factors and the ef-fect of volume of EAA on the response depends on thevolume of sulfuric acid. Significant quadratic effect X2
3
assures that the relationship between volume of sulfuricacid and fluorescence intensity followed a curved line ra-ther than a straight line. However, X3 X4 interaction andthe quadratic models X2
1 and X24 did not have a signifi-
cant effect on the response (p > 0.05).Pareto charts, Figure 2, reveal the factors that were
statistically significant (p < 0.05). It contains a bar foreach factor whose length is proportional to its corre-sponding effect on the reaction [35]. Each factor is sig-nificant as individual, moreover, the statistical analysishighlights a significant effect of the interaction of vol-ume of EAA and that of sulfuric acid.
Figure 2 Pareto charts showing the influence of volume ofsulfuric acid and volume of EAA (a) and that of temperatureand heating time (b) on the fluorescence intensity.
Graphical evaluation of FCC designPolynomial equations were graphically represented by aresponse surface plot which is a 3D plot reporting theinteraction of two factors and their effect on the equa-tion output, the target optimum is the top of the moun-tain. A modification of the surface response plot is thecontour plot, reporting the interactions in a two-dimensional (2D) figure, the target optimum is close tothe centre of the contours [24]. Response surface andcontour plots, related to each model, were analyzed tovisualize the parameters and their interactions on the re-sponse. Figure 3 confirm the results predicted from themathematical equations, optimal conditions for thesuggested procedure were also deduced. Surface plot,Figure 4a1, reveals that the highest fluorescence inten-sity was obtained when the volume of EAA was 0.1 mland that of sulfuric was 2.5 ml. In addition, Figure 4a2reveals a maximal response value which corresponds to40°C temperature and 20 min heating time. Contourplots, Figure 4b1 and 4b2, show curvature indicating thenon-linear effects of these factors on fluorescence inten-sity. Contour plots assist the prediction of response atany area of the experimental domain [24].
Residual analysisResiduals are the deviations of the observed values ofthe response from the predicted values, given thecurrent model. Examination of residuals assists inchecking model adequacy [28]. Residual plots are usedto evaluate the data for nonnormality, nonrandom vari-ation, nonconstant variance and outliers. Normal plotof the residuals reveals that the residuals follow astraight line, which indicates that the errors are nor-mally distributed, Figure 4. Histogram of the residualsis bell-shaped indicating the absence of skewness andoutliers. Based on residuals versus fits plot, the resid-uals appear to be randomly scattered about zero,

Figure 3 Response surface plots (a) and contour plots (b) showing the effect of volume of EAA, volume of sulfuric acid (a1, b1) andtemperature and heating time (a2, b2) on fluorescence intensity.
El-Zaher and Mahrouse Chemistry Central Journal 2013, 7:90 Page 7 of 12http://journal.chemistrycentral.com/content/7/1/90
therefore, there is no evidence of nonconstant vari-ance. The residuals in the residuals versus order plotfluctuate in a random pattern around the center lineand hence no evidence exists that the error terms arecorrelated with one another [25], Figure 4. Therefore,residual analysis supports the fact that the model fitsthe data adequately.
Statistical analysis of the modelAlong with the polynomial equation, the main outputsof a FCC design are some statistical parameters thatmeasure the goodness of fitting of the proposed equa-tion. The model was validated by ANOVA, Table 3. InANOVA analysis, a significant model and a non signifi-cant lack of fit are desired as a model that fits the data isessential for optimization studies [25]. The regressionmodels are significant (p = 0.002, 0.000), that is, at leastone of the terms in the regression equation makes a sig-nificant impact on the mean response. The p-value forthe squared effects is less than 0.05. Therefore, there is asignificant quadratic effect, that is, the relationship be-tween X2
2 and X23 and yield does not follow a straight line
but rather a curved line. The p-value of 0.028 for thevolume of EAA by volume of sulfuric acid interactionimplies a significant interaction effect, that is, the effectof volume of EAA on reaction yield depends on volumeof sulfuric acid. On the other hand, temperature andheating time interaction is non-significant (p = 0.165).Although the model exhibits highly significant factor ef-fects, Lack-of-fit is also highly significant. Such a situ-ation often arises if the model fits the data well and if
the measurement process is highly precise [27]. There-fore, the models that have been developed can be usedto predict the fluorescence intensity of NF within thelimits of the experiment [25].
Reaction mechanismUpon optimization of the factors affecting the fluores-cence intensity, the spectrofluorimetric method was ap-plied to the determination of NF in pure form and incapsules. The procedure consists in condensation of thephenolic derivative with β-ketoester in presence of excessacid as catalyst, leading to the formation of a β-hydroxyester [36]. By analogy to previous reports, the re-action was proposed to proceed as shown in Scheme 2.NF (bearing a phenolic group) readily coupled with EAA,in presence of sulfuric acid as dehydrating agent, produ-cing a yellow highly fluorescent coumarin compound,which exhibited a fluorescence maximum at 390 nm whenexcited at 340 nm, Figure 5. The coumarin derivative wasformed immediately and was stable for at least two hours.The Von Pechmann-Duisberg condensation proved to beefficient and simple reaction used to produce fluorescentcoumarins. It was found that addition of EAA and sulfuricacid to different aliquots of NF working standard solutionin absolute ethanol leads to non reproducible results. Itwas thought that variation of volume of absolute etha-nol from one aliquot to another was the reason for thenon reproducibility. Therefore, the aliquots were evap-orated to dryness on a boiling water bath and then,cooled before adding EAA and sulfuric acid, thus lead-ing to reproducible results.

Figure 4 Normal probability plot, histogram, residuals versus fits and residuals versus order for fluorescence intensity, model 1 (a) andmodel 2 (b).
Table 3 Analysis of variance (ANOVA) results forfluorescence intensity
Model (1) Model (2)
Source p Source p
Regression 0.002 Regression 0.000
Linear 0.001 Linear 0.000
Square 0.010 Square 0.000
Interaction 0.028 Interaction 0.165
Residual error Residual error
Lack-of-fit 0.000 Lack-of-fit 0.000
El-Zaher and Mahrouse Chemistry Central Journal 2013, 7:90 Page 8 of 12http://journal.chemistrycentral.com/content/7/1/90
Isolation and identification of the coumarin productTo 0.5 gm NF, EAA (3 ml) and sulfuric acid (10 ml)were added. The mixture was heated in a water bath at40°C for 20 min. The reaction mixture was cooled, thenpoured on crushed ice and stirred for 15 minutes. Theproduct was extracted from the reaction mixture twicewith methylene chloride (50 x 2). After extraction, theorganic layer was left to evaporate and the obtained con-centrated extract was collected. The assignment of theformed coumarin was based on the comparison of theIR and 1H NMR spectral data with those of the intactdrug. The IR spectrum of the coumarin product revealedthe disappearance of the phenolic band at 3361.32 cm-1
in the IR spectrum of NF, meanwhile, the appearance ofthe lactone C=O band at 1729.8 cm-1. The 1H-NMRspectrum of the coumarin product revealed the

Scheme 2 Suggested pathway for the reaction between NF and EAA/ H2SO4.
Table 4 Assay parameters and method validationobtained by applying spectrofluorimetric method for thedetermination of NF
Parameter NF
Excitation wavelength 340 nm
Emission wavelength 390 nm
Range of linearity 20 - 400 ng ml-1
Regression equation y = 1448.447x + 101.590
Correlation coefficient (r) 0.9997
Sb 14.185
Sa 3.477
Confidence limit of the slope 1448.447 ± 45.137
El-Zaher and Mahrouse Chemistry Central Journal 2013, 7:90 Page 9 of 12http://journal.chemistrycentral.com/content/7/1/90
appearance of a singlet signal at δ 2.1387 ppm, inte-grated for three protons due to CH3 group and a singletsignal at δ 6.1112 ppm, integrated for one proton due toCH of the lactone ring. Moreover, the molecular weightof the coumarin product was confirmed by mass spectrumwhich revealed the molecular ion peak (M+) at 341.
Method validationThe optimized spectrofluorimetric method was validatedaccording to (ICH) Q2 (R1) guidelines [29].
Linearity and rangeApplying the procedure mentioned under constructionof a calibration graph, the relationship between NF con-centration and fluorescence intensity was found to belinear. The good linear relationship was revealed by thehigh value of the correlation coefficient. Descriptive sta-tistics of the regression line showed low values of stand-ard error of estimation, standard error of slope (Sb) andthat of intercept (Sa) which revealed high accuracy withminimum deviations and low scattering of the calibra-tion points, Table 4.
AccuracyAccuracy of the analytical procedure is the closeness ofagreement between a true value and the value obtained.
Figure 5 Excitation and emission spectra of the coumarinproduct produced by reaction between 350 ng ml-1 of NF andEAA in methanol ( ____ ) and reagent blank (− − − -) (λex = 340nm, λem = 390 nm ).
Table 5 reveals that the SD values for all the samples wereless than 1% suggesting that the method was accurate.Furthermore, standard addition technique showed sat-
isfactory results as the percentage recoveries achievedranged between 98.38 and 100.97% and the correspond-ing SD were well below 1%, indicating that the methodwas accurate and valid, Table 6.
PrecisionResults for the determination of repeatability and inter-mediate precision are displayed in Table 4. Low values of
Confidence limit of the intercept 101.590 ± 11.064
Standard error of the estimation 4.310
LODa 0.01 ng ml-1
LOQa 0.03 ng ml-1
Intradayb
% RSD 0.692 – 0.598
Interdayc
% RSD 0.688 – 0.395a Limits of detection and quantification are determined via calculations [29]:LOD= 3.3×SD/slope LOQ= 10×SD/slope, where SD is standard deviationof response.b The intraday (n = 3), average of two concentrations of NF (100, 350 ng ml−1),repeated three times within the day.c The interday (n = 3), average of two concentrations of NF (100, 350 ng ml−1),repeated three times in three successive days.

Table 5 Application of the proposed spectrofluorimetricmethod for the determination of NF in pure samples
Claimed taken (ng ml-1) Claimed found (ng ml-1) % Recoverya
50 49.991 99.98
150 150.009 100.07
250 250.896 100.36
350 347.552 99.30
Mean 99.93
± SD 0.449a Average of three determinations.
Table 7 Statistical analysis of the results obtained byapplying the proposed spectrofluorimetric method andthe reference method
NF Item Spectrofluorimetry Referencemethod [19]
Pure form Mean 99.93 99.28
SD 0.449 0.745
RSD 0.449 0.750
n 4 5
Variance 0.201 0.555
t-value 0.05 (2.365)*
F-value 2.761 (9.12)*
AntinalW capsules Mean 99.93 100.49
SD 0.524 0.955
El-Zaher and Mahrouse Chemistry Central Journal 2013, 7:90 Page 10 of 12http://journal.chemistrycentral.com/content/7/1/90
% RSD confirmed that the suggested method was pre-cise, has good repeatability and hence, was satisfactoryfor quality control measurements.
RSD 0.524 0.950
n 3 5
Variance 0.275 0.912
t-value 1.07 (2.447)*
F-value 3.316 (19.25)*
* Figures in parentheses are the corresponding theoretical t -and F-values atp = 0.05.
SelectivitySelectivity is the ability of the analytical method tomeasure the analyte response in presence of interfer-ences. It was ascertained by applying the method tothe pharmaceutical dosage form containing the co-formulated drug DV. Results in Table 6 reveal that nointerference was observed either from DV or from thefrequently encountered excipients, indicating that theproposed method was highly selective for the analysis ofNF. Moreover, results close to 100% were obtained forthe determination of NF in dosage form, Table 6. Theseresults confirm the selectivity of the method.
Limit of detection and limit of quantificationThe LOD obtained with the developed method was 0.01ng ml-1, as shown in Table 4. Therefore, the proposedmethod was found to be more sensitive than the
Table 6 Determination of NF in capsules by the proposed speaddition technique
AntinalW capsules
Claimed(ng ml-1)
% Recoverya Pure NF added(ng ml-1)
% Recoverya
100 99.70 80 100.11
100 100.80
120 100.68
150 100.53 120 100.11
150 100.34
170 99.90
200 99.56 160 98.38
180 99.72
200 99.42
Mean 99.93 99.94
± SD 0.524 0.730a Average of three different determinations.
reported spectrofluorimetric one for the determinationof NF [18] whose LOD was 0.008 μg ml-1.
Statistical analysisA reference spectrophotometric method was adopted forthe analysis of NF in pure form and in pharmaceuticalpreparation [19]. Statistical comparison of the resultsobtained by the proposed and reported methods isshown in Table 7. The calculated t- and F- values areless than the theoretical ones indicating that there
ctrofluorimetric method and application of standard
DrotazideWcapsules
Claimed(ng ml-1)
% Recoverya Pure NF added(ng ml-1)
% Recoverya
100 99.01 80 100.97
100 98.73
120 99.53
150 100.07 120 100.11
150 100.80
170 99.50
200 100.25 160 100.11
180 100.87
200 99.42
99.78 100.00
0.670 0.773

El-Zaher and Mahrouse Chemistry Central Journal 2013, 7:90 Page 11 of 12http://journal.chemistrycentral.com/content/7/1/90
is no significant difference between the proposedmethod and the reported one with respect to accur-acy and precision.
ConclusionA systematic and practical approach was employed todevelop an efficient and selective spectrofluorimetricmethod to quantify NF in pure and capsule forms. Ex-perimental design was successfully applied to effectivelyevaluate the main effects of factors that significantly af-fected the fluorescence intensity and to determine theirinteractions and quadratic effects with the least numberof runs. The application of response surface method-ology with face centered composite design to modelingand optimizing the performance of the suggestedmethod proved to be an economic approach forextracting large amount of information while saving timeand cost. After optimization, all the performed responsesurface, contour plots, plots of residuals, lack of fit testand ANOVA results support each other and confirm theadequacy of the model. The method was validated andthe obtained results indicate good linearity and reprodu-cibility. The method was further compared with areported UV method and proved to be more sensitiveand selective. The proposed method is accurate, specific,and sensitive so can be applied for the routine analysisof NF in pure form and in pharmaceutical dosage form,either alone or in presence of DV.
AbbreviationsNF: Nifuroxazide; DV: Drotaverine; OVAT: One variable at a time;DOE: Experimental design; FCC design: Face centered composite design;EAA: Ethylacetoacetate; ANOVA: Analysis of variance; ICH: The InternationalConference on Harmonization; SD: Standard deviation; RSD: Relative standarddeviation; LOD: Limit of detection; LOQ: Limit of quantification.
Competing interestsThe authors declare that they have no conflict of interests.
Authors’ contributionsAAZ collected the literature review, proposed and explained theexperimental design work, revised the manuscript critically, participated inthe results, assay validation and discussion. MAM proposed the analyticalmethod, helped in understanding DOE, performed the experimental designwork using Minitab software, analyzed the data statistically and prepared thedraft version of the manuscript. Both authors conducted the optimization ofthe assay conditions, carried out the analytical experimental work, read andapproved the final manuscript.
Received: 19 January 2013 Accepted: 8 May 2013Published: 23 May 2013
References1. O’Neil MJ, Heckelman PE, Koch CB, Roman KJ, Kenny CM, D'Arecca MR: The
Merck Index, An Encyclopedia of Chemicals, Drugs and Biologicals. 14thedition. Whitehouse Station, NJ, USA: Merck Research laboratories Divisionof Merck & Co., Inc; 2006:1130.
2. Sweetman SC: Martindale, The Complete Drug Reference. 35th edition. London,Chicago: The Pharmaceutical Press; 2007. 274.
3. The British Pharmacopoeia. London, UK: Her Majesty's Stationary Office;2010:1508.
4. Khier AA, Elhenawee MM, Elmasry MS: Spectrophotometric method forthe determination of some drugs using fast red B salt. E-J Chem 2008,5(S2):1087–1097.
5. Emara KM, Refaat IH, Abdelmageed OH: HPLC and spectrophotometricdetermination of nifuroxazide and its pharmaceutical formulations.Egyptian J Pharm Sci 1994, 35(1–6):313–324.
6. Szuminska E, Cisak A: Polarographic and spectrophotometric determinationof nifuroxazide in pharmaceuticals. I. Nifuroxazide determination incapsules. Acta Pol Pharm 1988, 45(6):551–558.
7. Szuminska E, Cisak A: Polarographic and spectrophotometric determinationof nifuroxazide in pharmaceuticals. II. Determination of nifuroxazide insuspensions. Acta Pol Pharm 1990, 47(1–2):1–2.
8. Toral MI, Paine M, Leyton P, Richter P: Determination of attapulgite andnifuroxazide in pharmaceutical formulations by sequential digital derivativespectrophotometry. J AOAC Int 2004, 87(6):1323–1328.
9. Sobanska AW: Rapid determination of nifuroxazide in tablets by near-infraredspectroscopy. Chemia Analityczna (Warsaw, Poland) 2009, 54(5):1021–1033.
10. Berezkin VG, Onuchak LA, Evtyugina EN: Capillary thin-layer chromatographyof antibacterial nitrofuran derivatives. Russ J Appl Chem 2009, 82(2):312–316.
11. Guinebault PR, Broquaire M, Braithwaite RA: Determination of nifuroxazidein biological fluids by automated high-performance liquid chromatographywith large-volume injection. J Chromatogr 1981, 204:329–333.
12. Squella JA, Lemus I, Lonza G, Nunez-Vergara LJ: Electrochemical study ofnifuroxazide and its analytical determination in tablets. Boletin de laSociedad Chilena de Quimica 1991, 36(2):109–116.
13. Radi A, El-Laban S, Kenawy IMM: Determination of nifuroxazide incapsules by differential pulse polarography. Anal Sci 1998, 14(3):607–608.
14. Buchberger W, Niessner G, Bakry R: Determination of nifuroxazide withpolarography and adsorptive stripping voltammetry at mercury andcarbon paste electrodes. Fresenius J Anal Chem 1998, 362(2):205–208.
15. Sreedhar NY, Samatha KR, Reddy PRK: Electrochemical reduction behaviorand analysis of nifuroxazide in formulations and urine samples. IndianDrugs 1999, 36(8):509–512.
16. Radi A, El Ries MA: Determination of nifuroxazide in human serum byadsorptive stripping voltammetry. Anal Sci 1999, 15(4):385–388.
17. Radi A: Voltammetric study of nifuroxazide at unmodified and Sephadex-modified carbon paste electrodes. Fresenius J Anal Chem 1999, 364(6):590–594.
18. Belal TS: A simple and sensitive spectrofluorimetric method for analysisof some nitrofuran drugs in pharmaceutical preparations. J Fluoresc 2008,18(5):771–780.
19. Metwally FH, Abdelkawy M, Naguib IA: Determination of nifuroxazide anddrotaverine hydrochloride in pharmaceutical preparations by threeindependent analytical methods. J AOAC Int 2006, 89(1):78–87.
20. Ayad MM, Youssef NF, Abdellatif HE, Soliman SM: A comparative study onvarious spectrometries with thin layer chromatography for simultaneousanalysis of drotaverine and nifuroxazide in capsules. Chem Pharm Bull2006, 54(6):807–813.
21. Metwally FH: Simultaneous determination of Nifuroxazide and Drotaverinehydrochloride in pharmaceutical preparations by bivariate and multivariatespectral analysis. Spectrochim Acta A Mol Biomol Spectrosc 2008, 69A(2):343–349.
22. Azhlwar S, Ravi TK: Stability indicating HPLC method for simultaneousdetermination of drotaverine and aceclofenac. Int J Pharm Pharm Sci 2011,3(1):245–250.
23. Leardi R: Experimental design in chemistry: A tutorial. Anal Chim Acta 2009,652:161–172.
24. Miller JN, Miller JC: Statistics and Chemometrics for Analytical Chemistry. 6thedition. England: Pearson education Limited; 2010:186–216.
25. Khamanga SM, Walker RB: The use of experimental design in thedevelopment of an HPLC-ECD method for the analysis of captopril. Talanta2011, 83:1037–1049.
26. Boussac N, Galmier MJ, Dauphin G, Madesclaire M, Lartigue C: Nifuroxazidephotodecomposition: Identification of the (Z)-isomer by 1H-NMR Study.Mikrochim Acta 2003, 141(3–4):179–181.
27. Deming SN, Morgan SL: Experimental Design: A Chemometric Approach.2nd edition. Amsterdam, London, New York, Tokyo: Elsevier Publishers;1993:227–274. 151–169.
28. Montgomery DC: Design and Analysis of Experiments. 7th edition. Asia: JohnWiley & Sons, Inc; 2009:207–263. 1–22, 60–114.
29. Q2 (R1) Validation of analytical procedures, Proceedings of the InternationalConference on Harmonisation (ICH). Geneva: Commission of the EuropeanCommunities; 2005.
El-Zaher and Mahrouse Chemistry Central Journal 2013, 7:90 Page 12 of 12http://journal.chemistrycentral.com/content/7/1/90
30. Patnaik P: Dean’s Analytical Chemistry Handbook. 2nd edition. New York,London, Toronto: McGraw-Hill; 2004:648.
31. Kellner R, Mermet JM, Otto M, Valcárcel M, Widmer HM: Analytical Chemistry.Weinheim: Wiley-VCH Verlay GmbH & Co. KGaA; 2004. 746.
32. Skoog DA, West DM, Holler FJ, Crouch SR: Fundamentals of AnalyticalChemistry. 8th edition. Australia, United States: Brooks/Cole, a division ofThomson learning, Inc; 2004:825.
33. Cagigal E, González L, Alonso RM, Jiménez RM: Experimental designmethodologies to optimize the spectrofluorimetric determination oflosartan and valsartan in human urine. Talanta 2001, 54:1121–1133.
34. Srinubabu G, Raju CAI, Sarath N, Kumar PK, Rao JVLNS: Development andvalidation of a HPLC method for the determination of voriconazole inpharmaceutical formulation using an experimental design. Talanta 2007,71:1424–1429.
35. Awotwe-Otoo D, Agarabi C, Faustino PJ, Habib MJ, Lee S, Khan MA, ShahRB: Application of quality by design elements for the development andoptimization of an analytical method for protamine sulfate. J PharmBiomed Anal 2012, 62:61–67.
36. Belal F, Al-Shaboury S, Al-Tamrah AS: Spectrophotometric determinationof labetolol in pharmaceutical preparations and spiked human urinethrough the formation of coumarin derivative. J Pharm Biomed Anal 2002,30:1191–1196.
doi:10.1186/1752-153X-7-90Cite this article as: El-Zaher and Mahrouse: A validatedspectrofluorimetric method for the determination of nifuroxazidethrough coumarin formation using experimental design. ChemistryCentral Journal 2013 7:90.
Open access provides opportunities to our colleagues in other parts of the globe, by allowing
anyone to view the content free of charge.
Publish with ChemistryCentral and everyscientist can read your work free of charge
W. Jeffery Hurst, The Hershey Company.
available free of charge to the entire scientific communitypeer reviewed and published immediately upon acceptancecited in PubMed and archived on PubMed Centralyours you keep the copyright
Submit your manuscript here:http://www.chemistrycentral.com/manuscript/