research article numerical simulation and response of...
TRANSCRIPT

Research ArticleNumerical Simulation and Response of Stiffened PlatesSubjected to Noncontact Underwater Explosion
Elsayed Fathallah12 Hui Qi1 Lili Tong1 and Mahmoud Helal13
1 College of Aerospace and Civil Engineering Harbin Engineering University No 145 Nantong StreetNangang District Harbin Heilongjiang 150001 China
2 Civil Engineering Department MTC Kobry Elkobba Cairo 11787 Egypt3 Production and Mechanical Design Department Faculty of Engineering Mansoura University Mansoura 35516 Egypt
Correspondence should be addressed to Lili Tong tonglilihrbeueducn
Received 2 March 2014 Accepted 1 August 2014 Published 28 August 2014
Academic Editor Rui Zhang
Copyright copy 2014 Elsayed Fathallah et al This is an open access article distributed under the Creative Commons AttributionLicense which permits unrestricted use distribution and reproduction in any medium provided the original work is properlycited
A numerical simulation has been carried out to examine the response of steel plates with different arrangement of stiffenersand subjected to noncontact underwater explosion (UNDEX) with different shock loads Numerical analysis of the underwaterexplosion phenomena is implemented in the nonlinear finite element code ABAQUSExplicit The aim of this work is to enhancethe dynamic response to resist UNDEX Special emphasis is focused on the evolution of mid-point displacements Furtherinvestigations have been performed to study the effects of including material damping and the rate-dependant material propertiesat different shock loads The results indicate that stiffeners configurations and shock loads affect greatly the overall performanceof steel plates and sensitive to the materials data Also the numerical results can be used to obtain design guidelines of floatingstructures to enhance resistance of underwater shock damage since explosive tests are costly and dangerous
1 Introduction
The dynamic responses of floating and submerged structuressubjected to noncontact underwater explosion have receivedattention as a concerned topic for a national defense sincethe 1950s When a naval ship is attacked by an underwaterexplosion (UNDEX) the ship can be severely damaged byshock waves and gas bubble pulse Predicting the shockresponse of ships to noncontact UNDEX from underwaterweapon is of great importance for the warhead design ofunderwater weapon
The design and analysis of structure subjected to UNDEXrequire a detailed understanding of explosion phenomenaand the dynamic response of various structural elements [1]UNDEX structural damage depends on standoff distance andexplosion weight The most important way to reduce thedamages due to UNDEX is to provide sufficient standoff dis-tance between the structure and explosion source in order todecrease the effect of the UNDEX wave so that the structureis not highly damaged To accomplish these objectives it is
necessary to do various scenarios to evaluate the behaviorof the ship structure to blast loading These scenarios shouldinclude studying such aspects (explosive magnitude distancefrom source of explosion structure scantling complex fluid-structure interaction phenomena structure geometry etc)[2]
Rajendran [3] carried a numerical simulation ofunderwater explosion experiments on plane plates usingANSYSLS-DYNA for elastic and inelastic response ofcircular and rectangular plates Gupta et al [4] predictedthe failure modes of stiffened and unstiffened square platessubjected to underwater explosion using an elastoplasticmodel with isotropic hardening strain rate effects andfracture criterion Qiankun and Gangyi [5] predict the shockresponse of a ship section to noncontact UNDEX usingABAQUS The results showed that the size of fluid meshand the fluid thickness from the wetted surface to the outerboundary of fluid is of great importance for improvingnumerical accuracy Rajendran and Narasimhan [6] studiedthe damage prediction of clamped circular plates subjected
Hindawi Publishing CorporationAdvances in Materials Science and EngineeringVolume 2014 Article ID 752586 17 pageshttpdxdoiorg1011552014752586
2 Advances in Materials Science and Engineering
to contact underwater explosion Jacinto et al [7] studied alinear dynamic analysis of the plate models under explosiveloading using ABAQUS
Zhang et al [8] developed a procedure which employsthe finite element method coupled with the DAA methodto study the transient dynamic response of a surface shipmodel subjected to an underwater explosion bubble Andthey found that the ship modelrsquos vertical response subjectedto an underwater explosion bubble is mainly the globalresponse which is composed of two parts rigid-bodymotionand elastic deformation
When a charge of high explosive is detonated belowthe surface of water the sudden release of energy fromunderwater explosions generates a shockwave propagate ina spherical pattern at very high speed The explosive alsoforms highly compressed gas bubble in the surroundingwater which are very long compared with the times forshock passage Of the total energy released from a 1500-lbTNT underwater explosion approximately 53 goes into theshockwave and 47 goes into bubble pulsation Most casesdemonstrate that the damage done tomarine structures suchas the surface of ships and submarines occurs early and is dueto the primary shockwaves This investigation only considersthe effects of the shockwaves as demonstrated in [9]
Zhang et al [10] calculated the dynamic bendingmomentof bubble acting on hulls based on the underwater explosionbubble theory And he found that underwater explosionbubble will cause general longitudinal bending of ship andlead to hogging and sagging damage of ship
Forghani et al [11] studied the modeling of damagedevelopment in blast loaded composite laminates to blastloads It was shown that the tie-break interface option in LS-DYNAcan be used successfully in simulating cohesive cracksChirica and Boazu [2] studied the response of ship hulllaminated plates to blast loads using finite-element computercodeCOSMOSMVarious scenarios to evaluate the behaviorof the ship structure laminated plate to blast loading arestudied like explosive magnitude distance from source ofexplosion and plate thickness
Jen [12] used finite element softwareABAQUS to simulateand analyze the transient dynamic response of a midgetsubmersible vehicle (MSV) pressure hull that experiencesloading by an acoustic pressure shock wave resulting froman underwater explosion (UNDEX)The results showed thatthe local cavitations formed on the fluidndashstructure interfaceafter the shockwave hit the midget submersible vehicle Theaim of this work is to enhance the dynamic response to resistUNDEX and obtain the optimal configuration for stiffenedplates to resist underwater shock loading
2 The UNDEX Loading
Noncontact underwater explosion is the major source ofthreat to ships and submarines The responses and damagesof submerged structures are divided into two categoriesnear-field explosion and far-field explosion depending on thedistance between the explosive charge and the target (standoffdistance) [12]
Figure 1 shows the different events occurring during theUNDEX event in a pressure against time history plot [13]Theloading mechanisms due to underwater explosion includeincident shock wave free surface reflection wave bottomreflection wave gas bubble oscillation bubble-pulse loadingand bulk and hull cavitations [14]The reflection of the shockwave from the bottom of the ocean is a compression wavethat adds additional load to the structure The reflection ofthe shock wave from free ocean surface causes a reduction inthe pressure produced by the shock wave [11 15]The incidentwave is the shock wave produced by the UNDEX chargeThe scattered wave is the acoustic field generated by theinteraction of the incident wave and the submerged structureThe initial shock wave is modeled as a spherical incidentshock wave applied as a transient load active on both theacoustic and structural meshes at their common surfaces (thewetted interface)The distribution of this shockwave onto theplate is obtained using the incident pressure wave equationsas demonstrated in [16] The pressure history 119875(119905) of theshockwave at a fixed location starts with an instantaneouspressure peak 119875max followed by a decline which is usuallyapproximated by an exponential function The empiricallydetermined equation of the pressure profile [9 12 17] has thefollowing form
119875 (119905) = 119875max119890minus((119905minus119905
1)120579)
(MPa) 119905 ge 1199051
(1)
where 119905 is the time elapsed after the detonation of chargein (msec) 119905
1
is the arrival time of shock wave to the targetafter the detonation of charge in (msec) 119875max is the peakpressure magnitude (MPa) at the shock wave front and 120579is the time decay constant which describes the exponentialdecay in (msec) and is equal to the time taken by the peakpressure to fall to 1119890 times its initial valueThe peak pressureand decay constant depend upon the size of the explosion andthe standoff distance from this charge at which pressure ismeasuredThe peak pressure119875max and decay constant 120579 canbe expressed as follows [18]
119875max = 1198701 (11988213
119877)
119860
1
(MPa)
120579 = 1198702
11988213
(11988213
119877)
119860
2
(millisecond (msec))
(2)
In case of TNT charge the maximum bubble radii of explo-sive gas 119877max and first pulsation periods 119879 are expressed as[19]
119877max = 338(119882
(119863 + 103))
13
(m)
119879 = 2111988213
(119863 + 103)56
(sec)
(3)
where 1198701
1198702
and 1198601
1198602
are constants that depend onexplosive charge type when different explosives are usedThese input constants are as stated in Table 1 [20] 119882 isthe weight of the explosive charge in (Kg) 119863 is a charge
Advances in Materials Science and Engineering 3
Shock wave
Surface cut-off
Bottom reflection
Under pressure
Pres
sure
00
Time
Bubble pulse
(a)
Pres
sure
Time
Primary shock wave
Pulsating +migrating bubble
1st bubble pulse2nd bubble pulse
3rd bubble pulse
(b)
Figure 1 Phenomenon of the UNDEX shock wave and high pressure bubble [13]
Table 1 Shock wave parameters for various explosive charges
Constants Explosive material typeHBX-1 TNT PETN Nuclear
K1 5351 5212 5621 1061198644
A1 1144 1180 1194 113K2 0092 00895 0086 3627A2 minus0247 minus0185 minus0257 minus022
depth in (m) and 119877 is the distance between the explosivecharge and target in (m) Also Cole [9] provided furtherinformation regarding the systematic presentation of physicaleffects associated with underwater explosions
When pressure from an underwater explosion impingesupon a flexible surface such as the hull of surface ship thereflected pressure on the fluid-structure interaction surfacecan be reasonably and accurately predicted using Taylorrsquosplate theory [12 15] For an air backed plate of mass perunit area (m) subjected to an incident plane shockwave 119875
119894
(119905)a reflection wave of pressure 119875
119903
(119905) leaves the plate whichis moving at velocity V
119901
(119905) Using Newtonrsquos second law ofmotion
119898 sdot
119889V119901
119889119905= 119875119894
+ 119875119903
(4)
The fluid particle velocities behind the incident andreflected shockwave are V
119894
(119905) and V119903
(119905) respectively thus thevelocity of the plate becomes
V119901
(119905) = V119894
(119905) minus V119903
(119905) (5)
The incidence and reflective shockwave pressures are119875119894
=
120588119891
119888V119894
and119875119903
(119905) = 120588119891
119888V119903
respectively where 120588119891
is fluid densityand 119888 is the acoustic velocity By substituting the pressure into(4) and solving with (1) 119875
119903
(119905) becomes
119875119903
(119905) = 119875119894
(119905) minus 120588119891
119888V119901
= 119875max119890minus((119905minus119905
1)120579)
minus 120588119891
119888V119901
(6)
Equation (4) can then be rewritten as
119898 sdot
119889V119901
119889119905+ 120588119891
119888V119901
= 2119875max119890minus((119905minus119905
1)120579)
(7)
Differentiating (7) yields the following expression forplate velocity where120595 = 120588
119891119862120579
119898 and 119905 gt 0The total pressureon the plate is
119875119905
(119905) = 2119875119894
(119905) minus 120588119891
119888V119901
=2119875max1 minus 120595
[119890minus((119905minus119905
1)120579)
minus 120595119890minus120595(119905minus119905
1)120579
]
(8)
A shock factor (SF) which is proportional to the energydensity of the shockwave arriving at a structure due tovarious combinations of charge weight and standoff distanceis derived by
SF = 045radic119908119877
(Kg12
m) (9)
3 Models Description
Six different steel plates are considered using three-dimensional parts with an extruded shell base featureavailable in ABAQUSExplicit version 610 All the plates are20mm in thickness and 3000 times 3000mm2 with rectangularstiffeners 30mm in thickness and 100mm in heightStiffeners are created by adding an extruded shell featurewhich implies perfect connection without any additionalconstraint Care is taken not to overlap the material of thestiffener by offsetting its reference surface from mid-surfacethus avoiding the possibility of additional stiffness at thejunction in real fabrication Figure 2 shows the differentstiffener configurations used in the numerical study
4 Advances in Materials Science and Engineering
Model 1 Model 2 Model 3
Model 4 Model 5 Model 6
Figure 2 Geometrical configurations of stiffened plates
4 Numerical Model of the Plates
The nonlinear finite element program ABAQUSExplicit isused to undertake a three-dimensional (3D) analysis of theproblem
41 Models Geometry ABAQUSExplicit offers an elementlibrary for a wide range of geometric models In the presentstudy the fourth node shell element (S4R-6 DOF at eachnode) with reduced integration and hourglass control wasused to model the geometry of the plates and stiffenersSix different models consisting of grids of shell elementsof size 0075m were used as shown in the Figure 2 Thefluid region of the model is represented by an assemblageof 4-node acoustic tetrahedral elements (AC3D4) In explicitdynamic analysis the shortest wavelength can be estimatedusing the highest frequency in theUNDEX load or prescribedboundary conditions [21] Since the acoustic wave lengthdecreases with increasing frequency there exists a highestfrequency for a given acoustic domain mesh Based oninequality
119891max lt119888
119899min119871max (10)
where 119891max is the upper frequency range of the shockwave119871max represent the maximum internodal interval of an ele-ment in a mesh 119899min is the number of internodal intervalsper acoustic wavelength (119899min ge 10 is recommended) 119862 =radic119870119891
120588119891
is the acoustic speed of the fluid 119896119891
and 120588119891
are thebulk modulus of the acoustic medium and its density
Artificial bulk viscosity is activated to properly representpropagation of the induced compressive stress wave byemploying quadratic and linear functions of volumetric strainrates with default values of 12 and 006 respectively [21]Theouter boundary of the external fluid is represented by halfcylindrical surface as shown in Figure 3
Free surface
Outer surface
X
Y
ZRP-2
RP-1
Figure 3 The outer and free surface used in fluid model
Table 2 Plastic material properties for steel [27]
True stress (Pa) True plastic strain300 times 106 0000350 times 106 0025375 times 106 0100394 times 106 0200400 times 106 0350
42 Boundary Conditions and Fluid-Structure Coupling Thepanel on the shiprsquos frame is typically stiffened by beams orstringers thus the panel can be divided into many smallpanelsThe restrainingmoment of the borders of these panelsis the torsion rigidity of a girder of stringer During analysisfully clamped boundary conditions are imposed on the foursides of the panels
The boundaries of the fluid may cause shockwave refrac-tion or reflection resulting in its superposition or can-cellation by the incident wave [21 22] To prevent thisphenomenon the boundary condition of the fluid elementis set as a nonreflective boundary during analysis except
Advances in Materials Science and Engineering 5
000 005 010 015 020 025000
002
004
006
008
010
012
Cen
tral
poi
nt d
ispla
cem
ent (
m)
Time (s)
Fine meshMedium meshCoarse mesh
Figure 4 Displacement distribution at the plate central point
0
2
4
6
8
10
12
14
16
Disp
lace
men
t (cm
)
Model 1Model 2Model 3
Model 4Model 5Model 6
SF = 02 SF = 0238 SF = 027
(a) Max displacement at the center of the plates
05
10152025303540455055
Impr
ovem
ent r
atio
()
Model 2Model 3Model 4
Model 5Model 6
SF = 02 SF = 0238 SF = 027
(b) Improvement ratio
Figure 5 Max displacement and improvement ratio for all models
for the free surface where zero pressure boundary condi-tion was applied to it as shown in Figure 3 The acoustic-structural interaction between the wet surfaces of the platand the acoustic interaction surfaces (the wetted interface)was implemented by use of a surface-based ldquotierdquo constraintThe location of the charge and the stand-off point defined asreference points prior to the interaction and the effect of theUNDEX event are transferred to the structure by means ofthe incident wave loading feature [16]
43 Material Properties The stiffened panel is made of mildsteel The numerical model uses the constitutive law for
elasticplasticmaterials tomodel the stiffenedpanel Isotropichardening rules are adopted in the hardening model Theparameters of steel used in the numerical model are asfollows Poisson ratio is equal to 03 andmass density is equalto 78000 kgm3 The initial yield stress is 300MPa and theyield stress increases to 400MPa at a plastic strain of 35Table 2 shows the plastic material properties for steel used inthis study
When the material sustains momentary dynamic loadingthe effect of the strain rate causes the materialrsquos dynamicstrength to exceed the strength during a static experimentThus the effect of strain rate must be considered during the
6 Advances in Materials Science and Engineering
analysis tomatch actual situations As recommended by Jones[23] this study adopts the Cowper-Symonds strain ratemodeas follows
120590dy = 120590119910 [1 +1003816100381610038161003816100381610038161003816
120598
119863
1003816100381610038161003816100381610038161003816
1119902
] (11)
where 120590dy is the materialrsquos dynamic yielding stress 120590119910
is thematerialrsquos static yielding stress 120598 is strain rate and119863 and 119902 arematerial parameters whose values are normally 119863 = 40 sminus1and q = 5 accepted values for steel respectively
The fluid region of the model is represented by the acous-tic fluid domain Its properties are the bulk modulus anddensity In this numerical investigation commonly acceptedvalues for the sea water were stated in [16]The bulk modulusis 21404MPa and the density of the sea water is 1000 kgm3
44 Convergence Study To verify the accuracy of analyticalfindings a convergence study has been carried out to choosethe optimum mesh for the model The finite element meshcontains one variable (119899) (number of divisions along theplate side) that affects the number of elements in the modelVarying the number (119899) affects the accuracy of the resultsTheelements throughout the convergence study have aspect ratio1 1
The steel plate of model (1) has been used to performthe convergence study on it This plate is a square steelplate with fixed sides of side length 3000mm and thickness20mm Three different models consisting of grids of shellelements of size 00375m 0075m and 015m representingfine medium and coarse meshes respectively were used toverify the accuracy of the finite element models of the platesThe plate is loaded due to the UNDEX with charge mass 7 kgTNT at standoff distance of 5m from the central point of theplate For eachmesh considered the maximum displacementin the middle is compared
The results of the convergence study show that themaximum displacement for the model consisting of gridsof shell elements size of 015m is 1142 cm For the modelconsisting of grids of shell elements size of 0075m themaximum displacement is 1172 cm It can be noted that thedifference is 256 Also the maximum displacement formodel consisting of grids of shell elements size of 00375mis 118 cm and the difference is only 067 Consequently themesh with elements size of 0075m is chosen to perform thewhole analysis since all displacement are less than 1differentfrom the results for the case of elements size 00375mand giveminimum possible element size and analysis time Figure 4shows the displacement distribution at the central point ofthe plate of the three different models with time
5 Results and Discussions
This study is based on the platersquos performance improvementratio 119868
119877
which can be expressed as the ratio between theperformances of unstiffened to stiffened plate for a specifiedcase All models are subjected to UNDEX with differentamounts of explosives (5 7 and 9 kg) at standoff distancethat is equal to (119877 = 5m) representing SF (02 0238
and 027) The parameters that play an effective influenceon improving the platersquos performance include the stiffenersconfigurations damping effect strain rate sensitivity and thestructural integrity
51 Effect of Stiffeners Configurations The submerged orfloating structure within the vicinity of an UNDEX will besubjected to loading fromboth the shockwave and the bubblepulse pressure waves and its performance according to thestrength of these waves and the resilience of the structure
Figure 5(a) shows the maximum central-point displace-ment under SF of (02 0238 and 027) Generally it can benoticed that themaximumcentral-point displacement for themodels increase with the increase of SF for each model Thisis axiomatic because of increasing the explosive chargeweightwith fixed standoff distance
As shown in Figure 5(a) at shock factor equal to 02the maximum displacement for model 1 is 9969mm Theintroduction of one simple stiffener results in decreasingthe peak central point displacement to 6937 as in model 2while for models 3 4 5 and 6 the maximum central-pointdisplacement is 70mm 5782mm 558mm and 6293mmrespectively Similar trend of results is observed for all othermodels at SF equal to 0238 The maximum displacementfor all models is greater than the maximum displacement atshock factor equal to 02 The maximum displacement formodel 1 is 1172mm while for models 2 3 4 5 and 6 themaximum central-point displacement is 865mm 86mm74mm 702mm and 762mm respectively
At SF equal to 027 themaximumdisplacement formodel1 is 1327mm while for models 2 3 4 5 and 6 the maximumcentral-point displacement is 106mm 1005mm 877mm824mm and 873mm respectively From the above resultit can be found that at low SF the maximum central-pointdisplacement of model 2 is better than model 3 and byincreasing the SF until 027 the maximum central-pointdisplacement of model 3 becomes better than model 2 Alsothe minimum displacement occurs at model 5 Thereforethe configurations of stiffeners have an important influenceon the response of the stiffened plates and leads to betterresponse of the plates to different shock waves this result ismatching to the results reported in [24ndash26]
Figure 5(b) shows the improvement ratio (119868119877
) for allmodels As shock factor (SF) increases the 119868
119877
decreases at SFequal to 02 119868
119877
for model 2 is 3041 while for models 3 4 5and 6 the 119868
119877
is 2978 42 4403 and 3687 respectivelyThe best 119868
119877
is for model 5 and the lowest 119868119877
is for model3 By increasing the SF to 0238 it can be found that thebest 119868
119877
is 4007 for model 5 and the lowest 119868119877
is 2619for model 2 When the SF increases to 027 119868
119877
is 20122427 3393 3794 and 3421 for models 2 3 4 5and 6 respectivelyThis indicates that the stiffened steel platewith one cross stiffener configuration (model 5) exhibits thehighest response reduction Also the lowest 119868
119877
is 2012 formodel 2
For better understanding and evaluating the performanceof the plates to the shock loading the displacement of thecenter point of all platersquosmodels ismonitoredwith time under
Advances in Materials Science and Engineering 7
000 005 010 015 020 025000
002
004
006
008
010
012
014
Disp
lace
men
t (m
)
Time (s)Model 1
Model 3 Model 4
Model 2
000 005 010 015 020 025000001002003004005006007008009010011
Disp
lace
men
t (m
)
Time (s)
000 005 010 015 020 025000001002003004005006007008009010011
Disp
lace
men
t (m
)
Time (s) Time (s)000 005 010 015 020 025
000001002003004005006007008009
Disp
lace
men
t (m
)
000 005 010 015 020 025000001002003004005006007008009
Disp
lace
men
t (m
)
Time (s)000 005 010 015 020 025
000001002003004005006007008009
Disp
lace
men
t (m
)
Time (s)
000 005 010 015 020 025000002004006008010012014
Disp
lace
men
t (m
)
Time (s)
Model 1Model 2Model 3
Model 4Model 5Model 6
Model 1Model 2Model 3
Model 4Model 5Model 6
000 005 010 015 020 025000002004006008010012014016018
Disp
lace
men
t (m
)
Time (s)
Model 5 Model 6
All models at SF = 0238 All models at SF = 027
SF = 02
SF = 0238
SF = 027
SF = 02
SF = 0238
SF = 027
Figure 6 Displacement-time history of the center point of all models at different SFs
8 Advances in Materials Science and Engineering
00 02 04 06 08 10 12 14000
001
002
003
004
005
006
Disp
lace
men
t (m
)
Distance from edge (m)
(a) All models at SF = 02 (125msec)
00 02 04 06 08 10 12 14000
002
004
006
008
010
012
Disp
lace
men
t (m
)
Distance from edge (m)
(b) All models at SF = 0237 (125msec)
00 02 04 06 08 10 12 14000
002
004
006
008
010
012
014
Disp
lace
men
t (m
)
Distance from edge (m)
(c) All models at SF = 027 (125msec)
00 02 04 06 08 10 12 14000
002
004
006
008D
ispla
cem
ent (
m)
Distance from edge (m)
(d) All models at SF = 02 (15msec)
00 02 04 06 08 10 12 14000
002
004
006
008
010
012
Disp
lace
men
t (m
)
Distance from edge (m)
Model 1Model 2Model 3
Model 4Model 5Model 6
(e) All models at SF = 0238 (15msec)
00 02 04 06 08 10 12 14000
002
004
006
008
010
012
014
Disp
lace
men
t (m
)
Distance from edge (m)
Model 1Model 2Model 3
Model 4Model 5Model 6
(f) All models at SF = 027 (15msec)
Figure 7 The transverse center-line deformation
Advances in Materials Science and Engineering 9
00 02 04 06 08 10 12 14000
002
004
006
008
010
012
014
Disp
lace
men
t (m
)
Distance from edge (m)00 02 04 06 08 10 12 14
000001002003004005006007008009010011
Disp
lace
men
t (m
)
Distance from edge (m)
00 02 04 06 08 10 12 14000
001
002
003
004
005
006
007
008
009
010
Disp
lace
men
t (m
)
Distance from edge (m)00 02 04 06 08 10 12 14
000
001
002
003
004
005
006
007
008
009
010
Disp
lace
men
t (m
)
Distance from edge (m)
00 02 04 06 08 10 12 14000
001
002
003
004
005
006
007
008
009
Disp
lace
men
t (m
)
Distance from edge (m)00 02 04 06 08 10 12 14
000
001
002
003
004
005
006
007
008
009
Disp
lace
men
t (m
)
Distance from edge (m)
Model 1 at (15ms)
Model 3 at (15ms)
Model 5 at (15ms) Model 6 at (15ms)
Model 4 at (15ms)
Model 2 at (15ms)
SF = 02
SF = 0238
SF = 027
SF = 02
SF = 0238
SF = 027
Figure 8 The transverse center-line deformation for all models at different SFs
10 Advances in Materials Science and Engineering
Model 1 Model 2
Model 3 Model 4
Model 5 Model 6
U m
agni
tude
U m
agni
tude
U m
agni
tude
+5722e minus 02+5245e minus 02+4768e minus 02+4291e minus 02+3814e minus 02+3338e minus 02+2861e minus 02+2384e minus 02+1907e minus 02+1430e minus 02+9536e minus 03+4768e minus 03+0000e + 00
U m
agni
tude
U m
agni
tude
U m
agni
tude
+5526e minus 02+5065e minus 02+4605e minus 02+4144e minus 02+3684e minus 02+3223e minus 02+2763e minus 02+2302e minus 02+1842e minus 02+1381e minus 02+9210e minus 03+4605e minus 03+0000e + 00
+5954e minus 02+5458e minus 02+4962e minus 02+4465e minus 02+3969e minus 02+3473e minus 02+2977e minus 02+2481e minus 02+1985e minus 02+1488e minus 02+9923e minus 03+4962e minus 03+0000e + 00
+4760e minus 02+4363e minus 02+3966e minus 02+3570e minus 02+3173e minus 02+2777e minus 02+2380e minus 02
+1587e minus 02+1983e minus 02
+1190e minus 02+7933e minus 03+3966e minus 03+0000e + 00
+4655e minus 02+4267e minus 02+3879e minus 02+3491e minus 02+3103e minus 02+2715e minus 02+2327e minus 02+1940e minus 02+1552e minus 02+1164e minus 02+7758e minus 03+3879e minus 03+0000e + 00
+6293e minus 02+5769e minus 02+5244e minus 02+4720e minus 02+4195e minus 02+3671e minus 02+3147e minus 02+2622e minus 02+2098e minus 02+1573e minus 02+1049e minus 02+5244e minus 03+0000e + 00
Figure 9 Displacement distribution for all models at 1E-2 sec and SF equal 02
the effect of different shock loads as shown in Figure 6 It canbe further noted that the time it takes for eachmodel to reachmaximum displacement at the same position is roughly thesame
Also the transverse center-line deformation of all modelsis recorded as shown in Figure 7 It can be noted that themaximum deformation occurs at the center of the platesand reduced gradually towards the fixed boundaries FromFigure 7(a) model 2 has the maximum deformation untilthe distances are equal to 11m after that it decreasestowards the center of the plates Model 6 has the minimumdisplacement from distance equaling 09m to 11m after thatthe displacement increases rapidly towards the center of theplate Also model 5 has the minimum displacement
Figures 7(b) 7(c) 7(d) and 7(f) show the transversecenter-line deformationModel 1 has themaximumdeforma-tion and this deformation increases linearly as the distancefrom the edge of the plate increases and reaches themaximumvalue at the center of the plate Also model 5 has thebest performance at all SFs Figure 8 shows the transversecenter-line deformation for all models at different SFs Thedisplacement distribution contours with time are presentedin Figure 9
52 Strain Rate Sensitivity In order to investigate the strainrate sensitivity on the platersquos performance under the effectof different shock loading the analysis has been first carriedout ignoring this effect after that the strain-rate effect isincluded by adjusting the material dynamic yield stress ateach Gauss point according to the Cowper-Symonds strainrate mode as mentioned in (11) In this investigation thematerial parameters defined as D = 40 sminus1 and q = 5 beingthe commonly accepted values for steel have been used asrecommended by Jones [23]
Figure 10 shows the displacement history of the centralnode for both with and without rate dependant for allmodels at different SFs It shows the effect of inclusion ofthe strain rate on the performance of the different platesThematerial with rate dependant analysis leads to decreasingthe maximum displacement which assures that the resultsare very sensitive to the material data Figure 11 shows themaximum displacement values of the central node for bothwithwithout rate dependant analysis and the improving ratio119868119877
at SF equal to 02 0238 and 027 respectivelyIt can be concluded that for model 1 the maximum dis-
placement decrease from 9969mm 1172mm and 1327mmto 8488mm 101mm and 1147mm at SF equal to 02 0238and 027 respectively For model 2 the maximum mid-point
Advances in Materials Science and Engineering 11
000 005 010 015 020 025000
002
004
006
008
010
012
014
016
018
Disp
lace
men
t (m
)
Time (s)Model 1
Model 3
Model 5 Model 6
Model 4
Model 2
000 005 010 015 020 025000001002003004005006007008009010011012013014
Disp
lace
men
t (m
)
Time (s)
000 005 010 015 020 025000001002003004005006007008009010011012013
Disp
lace
men
t (m
)
Time (s)000 005 010 015 020 025
000001002003004005006007008009010011
Disp
lace
men
t (m
)
Time (s)
000 005 010 015 020 025000
001
002
003
004
005
006
007
008
009
Disp
lace
men
t (m
)
Time (s)000 005 010 015 020 025
000
001
002
003
004
005
006
007
008
009
010
Disp
lace
men
t (m
)
Time (s)
Without rate dependant (SF = 02)With rate dependant (SF = 02)Without rate dependant (SF = 0238)With rate dependant (SF = 0238)Without rate dependant (SF = 027)With rate dependant (SF = 027)
Without rate dependant (SF = 02)With rate dependant (SF = 02)Without rate dependant (SF = 0238)With rate dependant (SF = 0238)Without rate dependant (SF = 027)With rate dependant (SF = 027)
Figure 10 Rate dependant effect on the displacement in the central node
12 Advances in Materials Science and Engineering
0
2
4
6
8
10
12
14
16
18D
ispla
cem
ent (
m)
Model 1 without rate dependantModel 1 with rate dependantModel 2 without rate dependantModel 2 with rate dependantModel 3 without rate dependantModel 3 with rate dependantModel 4 without rate dependantModel 4 with rate dependantModel 5 without rate dependantModel 5 with rate dependantModel 6 without rate dependantModel 6 with rate dependant
SF = 02 SF = 0238 SF = 027
(a) Max displacement at the center of the plates
05
10152025303540455055606570
Impr
ovem
ent r
atio
()
Model 2Model 3Model 4
Model 5Model 6
SF = 02 SF = 0238 SF = 027
(b) Improvement ratio
Figure 11 Max displacement at the central node and the improvement ratio for plats withwithout rate dependant
displacement without strain rate is 6937mm 865mm and106mm and with strain rate are 608mm 7467mm and8706mm with 119868
119877
equal to 39 3628 and 3439 at SFequal to 02 0238 and 027 respectively
For model 3 the maximummid-point displacement withstrain rate is 6088mm 7316mm and 8473mm with 119868
119877
equal to 389 3757 and 3615 at SF equal to 02 0238and 027 respectively
For model 4 the maximummid-point displacement withstrain rate is 4989mm 6271mm and 7393mm with 119868
119877
equal to 4995 4649 and 4428 at SF equal to 02 0238and 027 respectively
Model 5 has the least deformation and the material withrate dependant analysis leads to decreasing the maximumdisplacement to 474mm 5967mm and 6961mm with 119868
119877
equal to 5245 4908 and 4754 at SF equal to 02 0238and 027 respectively
For model 6 the material with rate dependant analysisleads to decreasing the maximum displacement to 527mm644mm and 741mm with 119868
119877
equal to 4713 4505 and4416 at SF equal to 02 0238 and 027 respectively
Finally it can be concluded that the best 119868119877
is 5245 formodel 5 and the lowest 119868
119877
is 3893 for model 3 at SF equal to02 By increasing the SF the 119868
119877
decreases the best 119868119877
is 4908also for model 5 and the lowest 119868
119877
is 3628 for model 2 at SFequal to 0238 At SF equal to 027 the best 119868
119877
is 4754 formodel 5 and the lowest 119868
119877
is 3439 for model 2 The results
show that at low SF the performance of model 2 is better thanmodel 3 and by increasing the SF the performance of model3 is better than model 2 which refers to the importance ofdifferent SFs in this analysis
The results show that when the strain-rate effect is takeninto account the yield stress increases because the elasticmodulus is higher than the plastic modulus It is noted thatthe analysis with strain rate will be much stiffer resulting in adecrease in the mid-point displacement as in [26ndash28]
53 Damping Effect Under the effect of load applyingthe undamped structures continue to vibrate with constantamplitude A constant amplitude vibration is not the responsethat would be expected in practice since the vibrations inthis type of structure would tend to die out over time andeffectively disappear The energy loss typically occurs bya variety of mechanisms so it is needed to consider thepresence of damping in the analysis tomodel this energy lossThe results of the damped analysis clearly show the effect ofmass proportional damping
Figure 12 shows the displacement history of the centralnode for both the damped and undamped material for allmodels at different SFs It show that the material with damp-ing analysis leads to decreasing the maximum displacementFor model 1 the maximum displacement decrease from9969mm 1172mm and 1327mm to 937mm 1101mm and
Advances in Materials Science and Engineering 13
000 005 010 015 020 025000
002
004
006
008
010
012
014
016
018
020
Disp
lace
men
t (m
)
Time (s) Time (s)Model 1
Time (s)
Model 3
Model 5
Time (s)
Model 4
Model 2
000 005 010 015 020 025000001002003004005006007008009010011012013014015
Disp
lace
men
t (m
)
000 005 010 015 020 025000001002003004005006007008009010011012013
Disp
lace
men
t (m
)
000 005 010 015 020 025000001002003004005006007008009010011
Disp
lace
men
t (m
)
000 005 010 015 020 025000
001
002
003
004
005
006
007
008
009
010
Disp
lace
men
t (m
)
Time (s)Model 6Time (s)
000 005 010 015 020 025000001002003004005006007008009010011
Disp
lace
men
t (m
)
Without damping (SF = 02)
With damping (SF = 02)
Without damping (SF = 0238)
With damping (SF = 0238)
Without damping (SF = 027)
With damping (SF = 027)
Without damping (SF = 02)
With damping (SF = 02)
Without damping (SF = 0238)
With damping (SF = 0238)
Without damping (SF = 027)
With damping (SF = 027)
Figure 12 Damping effect on the displacement in the central node
14 Advances in Materials Science and Engineering
02468
10121416182022
Disp
lace
men
t (m
)
Model 1 without dampingModel 1 with dampingModel 2 without dampingModel 2 with dampingModel 3 without dampingModel 3 with damping
Model 4 without dampingModel 4 with dampingModel 5 without dampingModel 5 with dampingModel 6 without dampingModel 6 with damping
SF = 02 SF = 0238 SF = 027
(a) Max displacement at the center of the plates
05
1015202530354045505560
Impr
ovem
ent r
atio
()
Model 2Model 3Model 4
Model 5Model 6
SF = 02 SF = 0238 SF = 027
(b) Improvement ratioFigure 13 Damping effect on the plates performance
Model 1 Model 2
Model 3 Model 4
Model 5 Model 6
PEEQSNEG (fraction = minus10)
SNEG (fraction = minus10)
SNEG (fraction = minus10) SNEG (fraction = minus10)
SNEG (fraction = minus10)
SNEG (fraction = minus10)(avg 75)
PEEQ
(avg 75)
PEEQ
(avg 75)
PEEQ
(avg 75)
PEEQ
(avg 75)
PEEQ
(avg 75)+2212e minus 02+2028e minus 02+1844e minus 02+1659e minus 02+1475e minus 02+1291e minus 02+1106e minus 02+9219e minus 03+7375e minus 03+5531e minus 03+3687e minus 03+1844e minus 03+0000e + 00
+5832e minus 02+5346e minus 02+4860e minus 02+4374e minus 02+3888e minus 02+3402e minus 02+2916e minus 02+2430e minus 02+1944e minus 02+1458e minus 02+9719e minus 03+4860e minus 03+0000e + 00
+4905e minus 02+4497e minus 02+4088e minus 02+3679e minus 02+3270e minus 02+2861e minus 02+2453e minus 02+2044e minus 02+1635e minus 02+1226e minus 02+8176e minus 03+4088e minus 03+0000e + 00
+5355e minus 02+4909e minus 02+4462e minus 02+4016e minus 02+3570e minus 02+3124e minus 02+2677e minus 02+2231e minus 02+1785e minus 02+1339e minus 02+8925e minus 03+4462e minus 03+0000e + 00
+4170e minus 02+3823e minus 02+3475e minus 02+3128e minus 02+2780e minus 02+2433e minus 02+2085e minus 02+1738e minus 02+1390e minus 02+1043e minus 02+6951e minus 03+3475e minus 03+0000e + 00
+2740e minus 02+2512e minus 02+2284e minus 02+2055e minus 02+1827e minus 02+1599e minus 02+1370e minus 02+1142e minus 02+9135e minus 03+6851e minus 03+4567e minus 03+2284e minus 03+0000e + 00
Figure 14 Contour plot of accumulated equivalent plastic strain (PEEQ)
Advances in Materials Science and Engineering 15
Model 1 Model 2
Model 3 Model 4
Model 5 Model 6
S MisesSNEG (fraction = minus10)
(avg 75)
S Mises
(avg 75)
S Mises
(avg 75)
S Mises
(avg 75)
S Mises
(avg 75)
S Mises
(avg 75)
+3003e + 08+2764e + 08+2525e + 08+2286e + 08+2047e + 08+1808e + 08+1568e + 08+1329e + 08+1090e + 08+8508e + 07+6116e + 07+3724e + 07+1333e + 07
+2164e + 08+1992e + 08+1821e + 08+1650e + 08+1478e + 08+1307e + 08+1136e + 08+9642e + 07+7928e + 07+6215e + 07+4501e + 07+2788e + 07+1074e + 07
+3134e + 08+2883e + 08+2633e + 08+2382e + 08+2132e + 08+1881e + 08+1630e + 08+1380e + 08+1129e + 08+8789e + 07+6283e + 07+3778e + 07+1273e + 07
+2611e + 08+2402e + 08+2194e + 08+1985e + 08+1776e + 08+1567e + 08+1358e + 08+1149e + 08+9406e + 07+7318e + 07+5230e + 07+3141e + 07+1053e + 07
+2519e + 08+2322e + 08+2125e + 08+1927e + 08+1730e + 08+1533e + 08+1335e + 08+1138e + 08+9407e + 07+7434e + 07+5460e + 07+3487e + 07+1513e + 07
+2857e + 08+2629e + 08+2401e + 08+2173e + 08+1945e + 08+1717e + 08+1489e + 08+1261e + 08+1033e + 08+8049e + 07+5769e + 07+3489e + 07+1209e + 07
SNEG (fraction = minus10)
SNEG (fraction = minus10) SNEG (fraction = minus10)
SNEG (fraction = minus10)
SNEG (fraction = minus10)
Figure 15 Contour plot of von Mises stress at the end of the analysis
1254mm at SF equal to 02 0238 and 027 respectively AlsoFigure 12 shows that the time it takes for all the models toreachmaximumdisplacement at the same position is roughlythe same
Figure 13(a) shows the values of maximum central dis-placement in case of damped and undamped material andat SF equal to 02 the best performance is model 5 whichhas the least deformationThematerial with damping analysisleads to decreasing the maximum displacement up to 4797(model 5) 4635 (model 4) 4031 (model 6) 3545(model 2) and 34 in model 3 These values are based onthe comparison to the value obtained from model 1 withoutdamping Figure 13(b) shows the improving ratio 119868
119877
in caseof damped material analysis based on the comparison tothe value obtained from model 1 with damping It can benoted that as the SF increases the 119868
119877
decreases and the bestperformance is model 5 with 119868
119877
of 446 4053 and 387
at SF equal to 02 0238 and 027 respectively This confirmsthat the proposal with stiffeners can help the structure tosustain shock loads resulting from an underwater explosionand this result is matching the one in [27] So it can beconcluded that the damping properties play a very importantrole in the response prediction due to underwater shock load
54 Structural Integrity Structural integrity is one of themajor concerns of such analysis The equivalent plastic strainin a material (PEEQ) is a scalar variable that is used torepresent the materialrsquos inelastic deformation If this variableis greater than zero the material has yielded [17] Figure 14shows a contour plot of accumulated PEEQ for allmodels andpermanent deformations are monitored which emphasizethat the largest permanent deformation is obtained onmodel1 and model 6 The FE analysis predicts the central peak
16 Advances in Materials Science and Engineering
observed and permanent deformations which first occurredat the middle of the sides of the plates and then pro-gressed towards the corners according to experimental resultsreported in [24ndash26] The lowest permanent deformation isobtained on model 2 model 4 and model 5 Figure 15 showsa contour plot of von Mises stress at the end of the analysisThe regions of high stress concentration are analyzed whichconfirm that model 5 offered greater resistance and its 119868
119877
is 1613 It is found that 119868119877
for models 4 and 6 is 1305and 486 respectively The lowest 119868
119877
is for model 3 whichmatches the experimental results reported in [24 25 29]
6 Conclusions
From the numerical simulation of stiffened plates subjectedto noncontact underwater explosion the following can beconcluded
The displacement-time histories under different shockloadings are presented which will be used in designingstiffened panels to enhance resistance to underwater shockdamage The effect of stiffener configurations is very impor-tant since it can drastically affect the overall behavior ofthe plates as indicated The proposal with special dampingsystem can help the structure to sustain shock loads resultingfrom an underwater explosion Model 5 offered greaterresistance to UNDEX load than all models which assure thatstiffener location influenced the plate responseThe inclusionof strain-rate effect and the proposal with special dampingsystem results in lower mid-point displacement Thus thedamping and the strain-rate effect should be taken intoaccount when analyzing structures subjected to underwatershock loading The inclusion of strain-rate effect is moreeffective than the proposal with special damping system toreduce the displacement of the plate
Conflict of Interests
The authors declare that there is no conflict of interest isregarding the publication of this paper
Authorsrsquo Contribution
Professor Lili Tong andDrMahmoudHelal have contributedequally to this work
References
[1] Z Zong Y Zhao and H Li ldquoA numerical study of wholeship structural damage resulting from close-in underwaterexplosion shockrdquoMarine Structures vol 31 pp 24ndash43 2013
[2] I Chirica D Boazu and E Beznea ldquoResponse of ship hulllaminated plates to close proximity blast loadsrdquo ComputationalMaterials Science vol 52 no 1 pp 197ndash203 2012
[3] R Rajendran ldquoNumerical simulation of response of plane platessubjected to uniform primary shock loading of non-contactunderwater explosionrdquo Materials amp Design vol 30 no 4 pp1000ndash1007 2009
[4] N K Gupta P Kumar and S Hegde ldquoOn deformation andtearing of stiffened and un-stiffened square plates subjected to
underwater explosion-a numerical studyrdquo International Journalof Mechanical Sciences vol 52 no 5 pp 733ndash744 2010
[5] J Qiankun andD Gangyi ldquoA finite element analysis of ship sec-tions subjected to underwater explosionrdquo International Journalof Impact Engineering vol 38 no 7 pp 558ndash566 2011
[6] R Rajendran and K Narasimhan ldquoDamage prediction ofclamped circular plates subjected to contact underwater explo-sionrdquo International Journal of Impact Engineering vol 25 no 4pp 373ndash386 2001
[7] A C Jacinto R D Ambrosini and R F Danesi ldquoExperimentaland computational analysis of plates under air blast loadingrdquoInternational Journal of Impact Engineering vol 25 no 10 pp927ndash947 2001
[8] N Zhang Z Zong and W Zhang ldquoDynamic response of asurface ship structure subjected to an underwater explosionbubblerdquoMarine Structures vol 35 pp 26ndash44 2014
[9] R H Cole Underwater Explosions Princeton University PressPrinceton NJ USA 1948
[10] A Zhang L Zeng X Cheng S Wang and Y Chen ldquoTheevaluation method of total damage to ship in underwaterexplosionrdquo Applied Ocean Research vol 33 no 4 pp 240ndash2512011
[11] A Forghani C McGregor S McClennan et al ldquoModellingof damage development in blast loaded composite panelsrdquo inProceedings of the 16th International Conference on CompositeMaterials pp 1ndash8 Kyoto-Japan July 2007
[12] C Y Jen ldquoCoupled acoustic-structural response of optimizedring-stiffened hull for scaled down submerged vehicle subjectto underwater explosionrdquo Theoretical and Applied FractureMechanics vol 52 no 2 pp 96ndash110 2009
[13] A M Zhang X L Yao and J Li ldquoThe interaction of anunderwater explosion bubble and an elastic-plastic structurerdquoApplied Ocean Research vol 30 no 3 pp 159ndash171 2008
[14] Y S Shin ldquoShip shock modeling and simulation for far-fieldunderwater explosionrdquo Computers and Structures vol 82 no23-26 pp 2211ndash2219 2004
[15] R Kalavalapally R Penmetsa and R Grandhi ldquoMultidisci-plinary optimization of a lightweight torpedo structure sub-jected to an underwater explosionrdquo Finite Elements in Analysisand Design vol 43 no 2 pp 103ndash111 2006
[16] KHibbitt and I SorensenAbaqusTutorial Version 610 ExampleProblems Manual 2010
[17] C F Hung B J Lin J J Hwang-Fuu and P Y Hsu ldquoDynamicresponse of cylindrical shell structures subjected to underwaterexplosionrdquoOcean Engineering vol 36 no 8 pp 564ndash577 2009
[18] Y S Shin Naval Ship Shock and Design Analysis Course Notesfor Underwater Shock Analysis Naval Postgraduate SchoolMonterey Calif USA 2006
[19] N Zhang and Z Zong ldquoThe effect of rigid-body motions onthe whipping response of a ship hull subjected to an underwaterbubblerdquo Journal of Fluids and Structures vol 27 no 8 pp 1326ndash1336 2011
[20] C Liang and Y Tai ldquoShock responses of a surface ship subjectedto noncontact underwater explosionsrdquo Ocean Engineering vol33 no 5-6 pp 748ndash772 2006
[21] KHibbitt and I SorensenAbaqusVersion 610 AbaqusAnalysisUserrsquos Manual 2010
[22] C Y Jen and Y S Tai ldquoDeformation behavior of a stiffenedpanel subjected to underwater shock loading using the non-linear finite element methodrdquoMaterials and Design vol 31 no1 pp 325ndash335 2010
Advances in Materials Science and Engineering 17
[23] N D Jones Structural Impact Cambridge University PressCambridge UK 1997
[24] S C K Yuen and G N Nurick ldquoExperimental and numericalstudies on the response of quadrangular stiffened plates Part Isubjected to uniform blast loadrdquo International Journal of ImpactEngineering vol 31 no 1 pp 55ndash83 2005
[25] G S Langdon S C K Yuen and G N Nurick ldquoExperimentalandnumerical studies on the response of quadrangular stiffenedplates Part II localised blast loadingrdquo International Journal ofImpact Engineering vol 31 no 1 pp 85ndash111 2005
[26] K RamajeyathilagamC PVendhan andV B Rao ldquoNon-lineartransient dynamic response of rectangular plates under shockloadingrdquo International Journal of Impact Engineering vol 24 no10 pp 999ndash1015 2000
[27] K Hibbitt and I Sorensen ldquoAbaqus Tutorial Version 101Getting Started with ABAQUS Interactive Editionrdquo USA 2010
[28] A Kadid ldquoStiffened plates subjected to uniform blast loadingrdquoJournal of Civil Engineering and Management vol 14 no 3 pp155ndash161 2008
[29] C Yong Y Wang P Tang and H X Hua ldquoImpact charac-teristics of stiffened plates penetrated by sub-ordnance velocityprojectilesrdquo Journal of Constructional Steel Research vol 64 no6 pp 634ndash643 2008
Submit your manuscripts athttpwwwhindawicom
ScientificaHindawi Publishing Corporationhttpwwwhindawicom Volume 2014
CorrosionInternational Journal of
Hindawi Publishing Corporationhttpwwwhindawicom Volume 2014
Polymer ScienceInternational Journal of
Hindawi Publishing Corporationhttpwwwhindawicom Volume 2014
Hindawi Publishing Corporationhttpwwwhindawicom Volume 2014
CeramicsJournal of
Hindawi Publishing Corporationhttpwwwhindawicom Volume 2014
CompositesJournal of
NanoparticlesJournal of
Hindawi Publishing Corporationhttpwwwhindawicom Volume 2014
Hindawi Publishing Corporationhttpwwwhindawicom Volume 2014
International Journal of
Biomaterials
Hindawi Publishing Corporationhttpwwwhindawicom Volume 2014
NanoscienceJournal of
TextilesHindawi Publishing Corporation httpwwwhindawicom Volume 2014
Journal of
NanotechnologyHindawi Publishing Corporationhttpwwwhindawicom Volume 2014
Journal of
CrystallographyJournal of
Hindawi Publishing Corporationhttpwwwhindawicom Volume 2014
The Scientific World JournalHindawi Publishing Corporation httpwwwhindawicom Volume 2014
Hindawi Publishing Corporationhttpwwwhindawicom Volume 2014
CoatingsJournal of
Advances in
Materials Science and EngineeringHindawi Publishing Corporationhttpwwwhindawicom Volume 2014
Smart Materials Research
Hindawi Publishing Corporationhttpwwwhindawicom Volume 2014
Hindawi Publishing Corporationhttpwwwhindawicom Volume 2014
MetallurgyJournal of
Hindawi Publishing Corporationhttpwwwhindawicom Volume 2014
BioMed Research International
MaterialsJournal of
Hindawi Publishing Corporationhttpwwwhindawicom Volume 2014
Nano
materials
Hindawi Publishing Corporationhttpwwwhindawicom Volume 2014
Journal ofNanomaterials
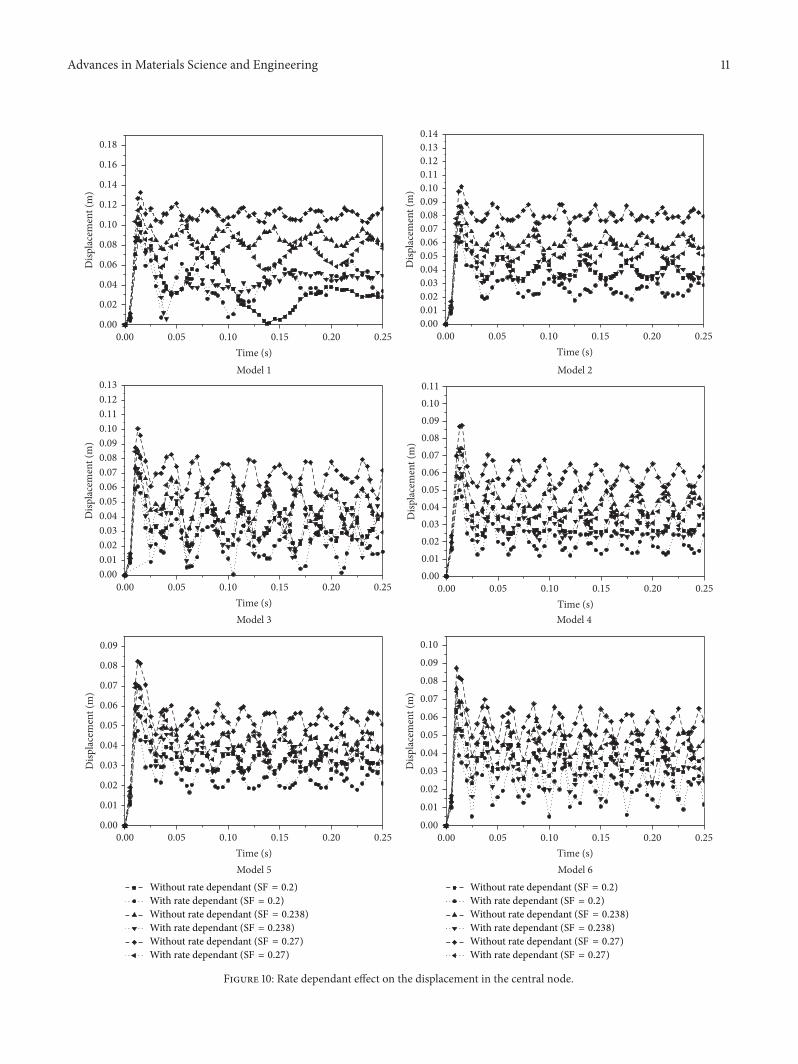