numerical simulation of inelastic cyclic response …
TRANSCRIPT

Advanced Steel Construction Vol. 10, No. 4, pp. 442-462 (2014) 442
NUMERICAL SIMULATION OF INELASTIC CYCLIC RESPONSE OF HSS BRACES UPON FRACTURE
Lucia Tirca1,* and Liang Chen2
1 Department of Building, Civil and Environmental Engineering, Concordia University, Montreal, Canada
2 Department of Civil, Geological, and Mining Engineering, Ecole Polytechnique, Montreal, Canada
*(Corresponding author: E-mail: [email protected])
Received: 21 April 2013; Revised: 27 August 2013; Accepted: 13 September 2013 ABSTRACT: Concentrically braced frames (CBFs) with a tension-compression bracing system dissipate hysteretic energy when braces yield in tension and buckle in compression, whereas the hysteretic response of hallow structural section (HSS) braces varies with brace slenderness, width-to-thickness ratio, and yield strength. Modelling the nonlinear response of braces upon the fracture requires an assigned brace fracture model and implicitly calibrated input material parameters. The selected brace fracture models are those that are compatible to nonlinear analysis and fiber-based elements formulation suited to OpenSees framework. To replicate the brace response, nonlinear beam-column elements that encompass distributed plasticity and discretized fiber cross-sections were used, whereas to simulate brace fracture, the strain fatigue model was considered. In this study, in order to predict the failure strain for a single reversal value that is required as input parameter in the strain fatigue model, regression analysis was employed and the proposed equation was given for square HSS braces and validated against experimental test results for a wide range of brace slenderness ratios, 50 kL/r 150 and types of displacement loading history. The predicted failure strain value is expressed in terms of slenderness ratio, width-to-thickness ratio and yield strength of steel. Comparisons to existing brace fracture models, such as the strain-range and end-rotation of braces at fracture, are provided. All aforementioned brace fracture models were evaluated against experimental tests results, while replicating fourteen specimens that were found in the literature. Keywords: HSS braces, brace fracture models, inelastic response, strain, buckling, yielding, fracture, fatigue material
1. INTRODUCTION Concentrically braced frames (CBFs) with a tension-compression bracing system dissipate hysteretic energy when braces yield in tension and buckle in compression, whereas the hysteretic response of hallow structural section (HSS) braces varies with brace slenderness, width-to- thickness ratio, and yield strength. Accordingly, slender braces dissipate less hysteresis energy in compression than do stocky braces, although the latter are prone to low-cycle fatigue failure. To prevent the occurrence of local buckling and to maintain the plastic moment capacity through sufficient rotation, the CSA/S16-2009 standard [1] requires braces to comply to Class 1 sections. In addition, the slenderness ratio of HSS bracing members, kL/r, shall not exceed 200 and not be less than 70 when the CBF building is located in seismic area, whereas the short period spectral acceleration ratio is greater than 0.75 (e.g. Vancouver, BC, Canada). Although the seismic response of braces dominates the behaviour of CBFs, the out-of-plane rotation capacity of gusset plate connections that provide boundary conditions to steel HSS braces impacts on their strain life [2]. To preserve the integrity of the gravity-load carrying capacity system during large earthquakes, researchers have agreed that the tensile fracture of HSS braces is the desired failure mode of a ductile CBF system [3]. Prior experimental research has been conducted on the behaviour of HSS braces in order to assess their post-buckling capacity, axial deformation and fracture life [4-10]. To emphasize the effect of
443 Numerical Simulation of Inelastic Cyclic Response of HSS Braces upon Fracture
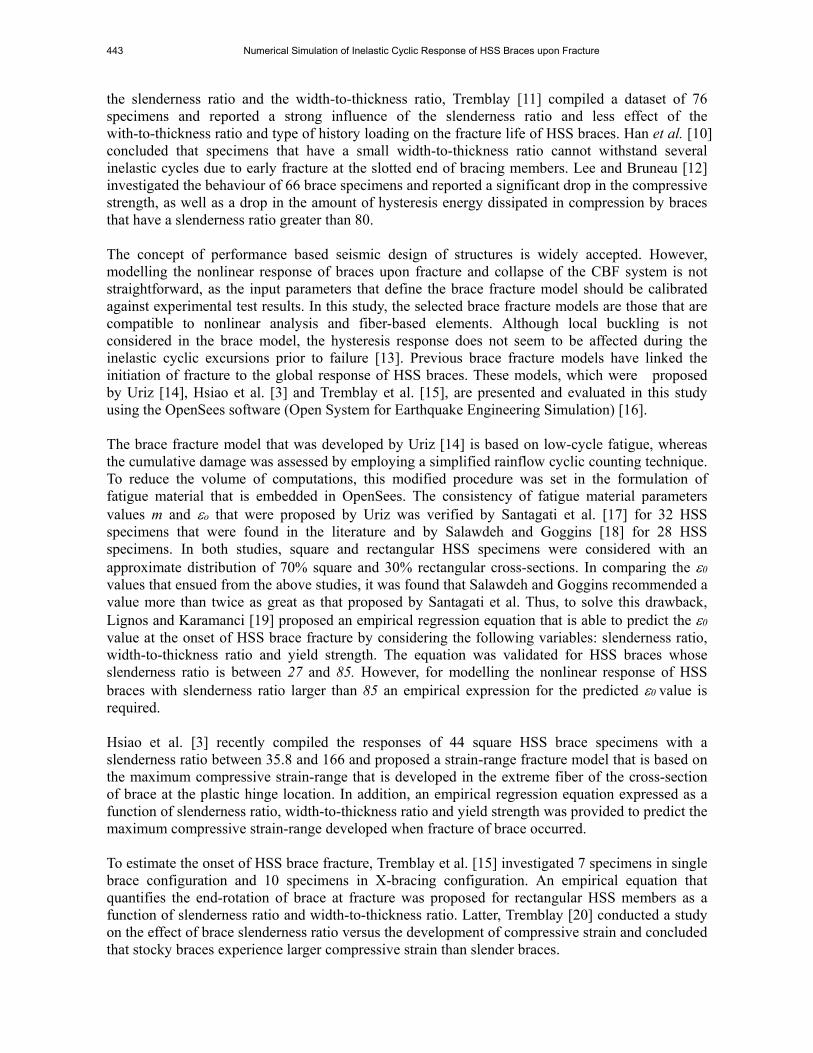
the slenderness ratio and the width-to-thickness ratio, Tremblay [11] compiled a dataset of 76 specimens and reported a strong influence of the slenderness ratio and less effect of the with-to-thickness ratio and type of history loading on the fracture life of HSS braces. Han et al. [10] concluded that specimens that have a small width-to-thickness ratio cannot withstand several inelastic cycles due to early fracture at the slotted end of bracing members. Lee and Bruneau [12] investigated the behaviour of 66 brace specimens and reported a significant drop in the compressive strength, as well as a drop in the amount of hysteresis energy dissipated in compression by braces that have a slenderness ratio greater than 80. The concept of performance based seismic design of structures is widely accepted. However, modelling the nonlinear response of braces upon fracture and collapse of the CBF system is not straightforward, as the input parameters that define the brace fracture model should be calibrated against experimental test results. In this study, the selected brace fracture models are those that are compatible to nonlinear analysis and fiber-based elements. Although local buckling is not considered in the brace model, the hysteresis response does not seem to be affected during the inelastic cyclic excursions prior to failure [13]. Previous brace fracture models have linked the initiation of fracture to the global response of HSS braces. These models, which were proposed by Uriz [14], Hsiao et al. [3] and Tremblay et al. [15], are presented and evaluated in this study using the OpenSees software (Open System for Earthquake Engineering Simulation) [16]. The brace fracture model that was developed by Uriz [14] is based on low-cycle fatigue, whereas the cumulative damage was assessed by employing a simplified rainflow cyclic counting technique. To reduce the volume of computations, this modified procedure was set in the formulation of fatigue material that is embedded in OpenSees. The consistency of fatigue material parameters values m and o that were proposed by Uriz was verified by Santagati et al. [17] for 32 HSS specimens that were found in the literature and by Salawdeh and Goggins [18] for 28 HSS specimens. In both studies, square and rectangular HSS specimens were considered with an approximate distribution of 70% square and 30% rectangular cross-sections. In comparing the 0
values that ensued from the above studies, it was found that Salawdeh and Goggins recommended a value more than twice as great as that proposed by Santagati et al. Thus, to solve this drawback, Lignos and Karamanci [19] proposed an empirical regression equation that is able to predict the 0
value at the onset of HSS brace fracture by considering the following variables: slenderness ratio, width-to-thickness ratio and yield strength. The equation was validated for HSS braces whose slenderness ratio is between 27 and 85. However, for modelling the nonlinear response of HSS braces with slenderness ratio larger than 85 an empirical expression for the predicted 0 value is required. Hsiao et al. [3] recently compiled the responses of 44 square HSS brace specimens with a slenderness ratio between 35.8 and 166 and proposed a strain-range fracture model that is based on the maximum compressive strain-range that is developed in the extreme fiber of the cross-section of brace at the plastic hinge location. In addition, an empirical regression equation expressed as a function of slenderness ratio, width-to-thickness ratio and yield strength was provided to predict the maximum compressive strain-range developed when fracture of brace occurred. To estimate the onset of HSS brace fracture, Tremblay et al. [15] investigated 7 specimens in single brace configuration and 10 specimens in X-bracing configuration. An empirical equation that quantifies the end-rotation of brace at fracture was proposed for rectangular HSS members as a function of slenderness ratio and width-to-thickness ratio. Latter, Tremblay [20] conducted a study on the effect of brace slenderness ratio versus the development of compressive strain and concluded that stocky braces experience larger compressive strain than slender braces.

Lucia Tirca and Liang Chen 444
Thus, the purpose of this study is two-fold: i) to propose an empirical regression equation for square HSS braces whose slenderness ratio is between 50 and 150 that is able to quantify the predicted failure strain for a single reversal value at the onset of brace fracture, 0,pred, and ii) to compare the responses of HSS braces when fracture models, such as the strain-range and end-rotation of braces at fracture, are considered versus the strain fatigue model that employs as input the computed 0,pred value. Then, the strain-range, the end-rotation of braces at fracture and the proposed strain fatigue model are evaluated against experimental test results. 2. EXISTING BRACE FRACTURE MODELS Existing approaches that are used to define the fracture model of brace members subjected to cyclic loading are based either on the strain fatigue model and strain-range model or on the end-rotation of braces at fracture model. In all cases, it has been assumed that the crack is initiated at the brace mid-length after the plastic hinge is formed. These brace fracture models are compatible with the OpenSees environment, where braces are modelled as beam-column elements with distributed plasticity and fiber-based formulation [21]. The first brace fracture model embedded in the OpenSees framework was developed by Uriz [14] and was based on low-cycle fatigue of constant plastic strain amplitude, which used an accumulative strain to predict damage in agreement with the Miner’s rule [22]. To quantify the accumulation of plastic damage, a damage index, DI, was estimated by computing the sum of all contributing cycles i starting from j =1 until failure was reached (j = n):
DI =∑ 1
In Eq. 1, n(i) is the current number of cycles at strain amplitude i and Nf (i) is the number of life cycles that a given brace member may sustain before failure. As shown in Eq. 1, the damage index is the ratio of the current plastic strain and total plastic deformability [23]. However, under seismic loading, the strain may not have constant amplitude [13]. Manson [24] and Coffin [25] conducted independent research on the matter of fatigue and concluded that the relationship between plastic strain amplitude, i, that is experienced by each cycle i, and the number of fatigue cycles to failure, Nf, is linear on the log-log domain, while the slope is equal to m (Eq. 2). i =o(Nf)m (2) In Eq. 2, m and o are known as the fatigue ductility exponent and fatigue ductility coefficient, respectively. The damage index, DI, varies from zero for an undamaged material to 1.0 at failure [14]. To consider the accumulation of damage and to reduce the volume of computations, the modified rainflow cyclic counting method that records only the four most recent peaks of strain reversals at any given time was implemented in the formulation of fatigue material embedded in OpenSees [13, 14]. Thus, when a fiber of the element cross-section reached its fatigue life (ID 1), its stress and stiffness fell to zero. Since the model does not account for local buckling, the strain in the model does not reflect the strain developed in the member [26]. By considering this accumulated strain approach and the experimental tests performed by Yang [8], Uriz proposed the following set of fatigue material parameters value for HSS brace members: o = 0.095 and m = -0.5. When different experimental tests were used by researchers to validate the consistency of material parameters value [17,18] the following sets were recommended: o = 0.07; m= -0.45 [17] and o=
0.19; m = -0.5 [18]. As from above, the largest recommended o value (0.19) is more than twice than the smaller value (0.07). Also, in some cases, it was reported differences between the number
(1)

445 Numerical Simulation of Inelastic Cyclic Response of HSS Braces upon Fracture
of life cycles experienced by the model and that exhibited by the physical brace. To solve this drawback, Lignos and Karamanci [19] proposed the following regression equation to predict the material parameter value, o,pred:
0 . 0.2910.484 0.613 0.3
(3) where, kL/r is the slenderness ratio, w/t is the width-to-thickness ratio, and Fy and E are the yield strength of braces and Young’s modulus, respectively. The value of fatigue ductility exponent, m = -0.3, is treated as constant. By using m = -0.3 and o,pred as resulted from Eq. 3, a good match between predicted and calibrated o value was reported, while o varied between 0.05 and 0.10 with a mean of approximately 0.064. Eq. 3 was validated for HSS braces that had a slenderness ratio between 27 and 85. To capture the crack initiation, Hsiao et al. [3] proposed the strain-range brace fracture model. In this model, the main parameter is the maximum strain-range that is developed in the extreme compressive fiber of the HSS brace cross-section at the location of plastic hinge formation. However, the true strain deformation at the onset of cupping due to local buckling cannot be captured when fiber-based elements are considered. Based on a regression analysis comprising the responses of 44 square HSS brace specimens expressed in terms of simulated strain-range through the entire loading history, the following equation was proposed to predict the maximum strain-range:
. , . 0.14350.3 0.4 0.2
(4) where, kL/r; w/t and E/Fy are the same parameters as in Eq. 3. Among the 44 square HSS specimens that were considered in the study that was reported by Hsiao et al. [3], 43 had a slenderness ratio that was less than 82.7 and the simulated maximum strain-range value, max.rg,sim value varied between 0.025 and 0.069. It may be noted that the literature contains relatively few experimental studies conducted on square HSS braces with kL/r larger than 85. To predict the onset of fracture of rectangular HSS braces, Tremblay et al. [15] considered the brace end-rotation parameter, which is defined as a function of displacement ductility of braces and brace length. As a result of compiling 17 experimental tests conducted on pin-ended square and rectangular HSS brace members with kL/r varying between 60 and 140, the following equation that measures the maximum end-rotation corresponding to brace fracture is proposed:
, . 0.0910.3
0.1
(5)
where bo and do are the brace dimensions computed to verify the Class of sections for HSS braces (bo=b-4t and do=d-4t). Thus, the maximum end-rotation of a brace at fracture depends mainly on the slenderness ratio and width-to-thickness ratio. 3. EXPERIMENTAL DATA SELECTION To validate the numerical simulation of HSS brace fracture models that were developed in the

Lucia Tirca and Liang Chen 446
OpenSees framework and the consistency of proposed material parameters values, the following criteria were considered for the selection of existing experimental test results: i) tests conducted on full-scale square HSS brace members that were subjected to quasi-static cycling loading applied first in compression; ii) specimens that exhibited brace fracture; iii) at least one selected specimen was subjected to different types of displacement loading history; iv) at least one selected brace was subjected to the same displacement loading history applied first in compression and first in tension; v) the selected experimental tests provide sufficient information about geometry, material properties and loading history. Thus, 14 full-scale HSS brace specimens with slenderness ratios between 52.4 and 143.5 were selected from three different studies reported by Archambault [5], Shaback [6] and Lee and Goel [4]. Twelve of the selected specimens [5,6] were made of steel G40.21-350W and two from study [4] were made of steel A500 grade B. All of them reached fracture failure while buckling out-of-plane. To emphasize on the effect of displacement loading history on brace response, two identical specimens (S1B and S1QB) were selected from study [5] despite their rectangular HSS cross-section. Data including the test ID, the area of brace cross-section, Ag, the yield strength of steel, Fy, the Young’s modulus of elasticity, E, the clear length of brace measured between the gusset plates, Lb, the length between the expected hinges in gusset plates, LH, the slenderness parameter, , and the yield axial deformation, δy are given in Table 1 and the geometrical scheme of the test setup is shown in Figure 1. The slenderness parameter: = (KL/r)(Fy/2E)0,5 where r is the radius of gyration, is computed in agreement with the CSA/S16 standard [1] requirements. The tensile, Tr, and compressive resistance, Cr, computed with =1.0 are: Tr = AgFy and Cr = AgFy(1+2n)-1/n, where n=1.34. In accordance with the CSA/S16 standard, the probable postbuckling strength of braces, Cu’, is computed as: Cu’ = 0.2AgRyF with Ry = 1.1. The probable tensile Tu and compressive resistance Cu are computed by multiplying Tr and Cr (calculated with =1.0) by Ry. For CBFs that are located in moderate-to- high seismic zones, the b0/t limit prescribed in the CSA/S16 standard is given as a function of brace slenderness ratio, KL/r, while b0 = b-4t. Thus, to be classified as Class 1 sections, the HSS braces
Table 1. Properties of Selected Brace Specimens St. Test no. HSS size Ag
mm2
Lb
mm
LH
mm
Fy
MPa
E
GPa
Tr
kN
Cr
kN
Cu’
kN
Cr/Tr y
mm
1 S1Ba) 76x127x4.8 1790 4007 4610 353 189 1.319 632 272 139 0.430 7.92
S1QB a) 76x127x4.8 1790 4009 4610 353 189 1.319 632 272 139 0.430 7.92
S3B 76x 76x4.8 1310 4179 4610 332 187 1.991 435 98 96 0.225 8.13
S3A 76x 76x4.8 1310 4179 4610 332 187 1.991 435 98 96 0.225 8.13
2 1B 127x127x8.0 3620 3350 3450 421 191 0.788 1524 1111 335 0.729 7.05
2A 152x152x8.0 4430 3950 4040 442 202 0.794 1958 1419 431 0.724 8.30
2B 152x152x9.5 5210 3950 4028 442 196 0.792 2303 1672 506 0.726 8.60
3A a) 127x127x6.4 2960 4350 4446 421 191 0.968 1246 690 274 0.554 10.0
3B 127x127x8.0 3620 4350 4446 421 191 0.983 1524 924 335 0.606 9.16
3C 127x127x9.5 4240 4350 4446 421 191 0.921 1785 1036 393 0.580 10.0
4A 152x152x8.0 4430 4850 4946 461 191 0.993 2042 1103 449 0.540 10.7
4B 152x152x9.5 5210 4850 4946 461 191 0.934 2402 1376 528 0.573 10.7
3 Lee-1 a) 5x5x0.188 2271 2946 3429 426 200 0.864 967 658 213 0.681 6.27
Lee-5 4x4x0.250 2316 3099 3454 510 200 1.230 1181 556 260 0.471 7.90
Study 1: Archambault et al. [5]; Study 2: Shaback [6]; Study 3: Lee and Goel [4]. a) Width-to-thickness ratio does not satisfy the current CSA/S16 requirements.

447 Numerical Simulation of Inelastic Cyclic Response of HSS Braces upon Fracture
with KL/r 100 must show a maximum b0/t limit that is less than 330/Fy0.5 and braces with KL/r =
200 must show the b0/t limit as 420/Fy0.5. For HSS braces with 100< KL/r < 200, the
width-to-thickness ratio is computed by a linear interpolation between 330/Fy0.5 and 420/Fy
0.5. For the HSS braces given in Table 1, the b0/t ratio varies between 9.4 for 3C and 15 for 4A. The normalized b0/t ratio with respect to b0/t limit varies between 0.45 (S3B, S3A) and 0.98 for 4A, whereas for specimens such as, S1B, S1QB, 3A and Lee-1, the b0/t ratio does not satisfy the current standard requirements.
The four selected specimens from Study 1 [5] and two from Study 3 [4] were tested in a single bracing frame configuration as pin-ended members (Figure 1a), whereas the eight selected specimens from Study 2 [6] were tested as independent pin-ended members (Figure 1b). The effective slenderness ratio of braces was evaluated in the buckling plan, while taking into account the applicable end conditions. The S1B and S3B specimens that were selected from Study 1, were tested under a cyclic quasi-static displacement protocol H1, that is illustrated in Figures 2a and 2b,
Figure 1. Geometrical Schemes of Brace Specimens: a) Test Setup as per Study 1; b) Test Setup as per Study 2.
Figure 2. Types of Loading Histories: a) H1 - S1B; b) H1 - S3B; c) Q – S1QB; d) H2 - 2A.
900kN Actuator
4877
3658 LH
Lb
LH
Lb
a) b)
Actuator

Lucia Tirca and Liang Chen 448
respectively. The S3A specimen was subjected to a loading similar to that of the S3B, but was first loaded in tension [11], whereas the S1QB was tested under the displacement history Q, shown in Figures 2c. The cyclic quasi-static displacement loading sequence H1 shows a symmetrical displacement pattern with stepwise increasing deformation cycles, while the Q sequence was developed on the basis of results recorded from nonlinear dynamic time-history analyses conducted on typical two and three storey buildings that were subjected to several ground motions. All brace specimens belonging to Study 2 are stocky members and were first loaded in compression under the asymmetric cyclic quasi-static displacement protocol, H2, which is shown in Figure 2d [6,11]. Both selected specimens from Study 3 were subjected to asymmetric loading history applied in compression. Thus, the Lee-1 brace was subjected to loading type 1, which is defined in [4], whereas the Lee-5 specimen was subjected to loading type 2 that was developed on the basis of the displacement history of a 2nd storey brace within a 6-storey CBF building that had been subjected to a large earthquake. 4. THE EFFECT OF MODELLING PARAMETERS ON THE BRACE RESPONSE
4.1 Fiber-Based Brace Model
The fiber-based brace model that was formulated in OpenSees consists of nonlinear beam-column elements with distributed plasticity along the element’s length. Its nonlinear behaviour is embedded in the assigned Giuffre-Menegotto-Pinto steel material with isotropic strain hardening that is based on the Menegotto-Pinto function, which was defined to express stresses as a function of strain.
∗ ∗ 1 ∗
1 ∗1
(6)
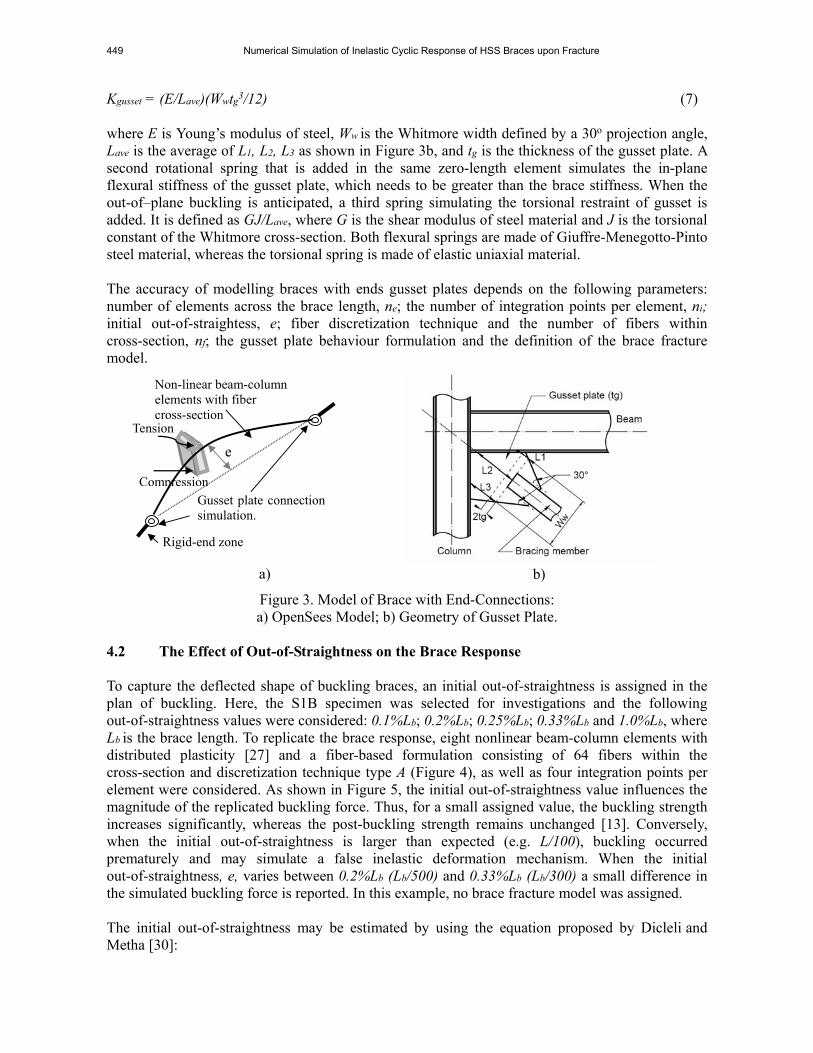
In Eq. 6, σ* and ε* are the effective stress and strain depending on the unload/reload interval, b is the ratio of the final to initial tangent stiffness and R is a material parameter that defines the shape of the unload curve. In the elastic range, the stress-strain relation is linear and the initial tangent stiffness Et is equal to the elastic stiffness E. Along the yielding plateau, the strain increases from yielding strain εy to strain hardening εsh, whereas the stress σy is constant. The Giuffre-Menegotto- Pinto model is able to account for the accumulated plastic deformation at each point of load reversal. This implies that each hysteresis loop follows the previous loading path for a new reloading curve, while deformations are accumulated. In this study, all parameters that define the transition from the elastic to the plastic response of Giuffre-Menegotto-Pinto steel material are identical to those considered by Aguero et al. [26]. To simulate the brace inelastic response in OpenSees, the brace member is divided into n-number of nonlinear beam-column elements with fiber formulation and distributed plasticity as illustrated in Figure 3a. The model uses the corotational geometric transformation approach and the consideration of a sinusoidal pattern deformation at the onset of buckling, as well as the Gauss-Lobatto integration rule for distributed plasticity. For an accurate representation of curvature distribution along the element, at least three integration points are required, although four to six are recommended [27]. After the occurrence of buckling, the brace experiences large cycles of out-of-plane deformation and one may anticipate hinging of gusset plates [28]. To simulate the behaviour of gusset plate connection, two rotational springs and one torsional spring are defined in the zero-length element that connects each end of the brace to a rigid link. To replicate the out-of-plane flexural stiffness of the gusset plate, Kgusset, Hsiao et al. [21] recommended the following equation:
449 Numerical Simulation of Inelastic Cyclic Response of HSS Braces upon Fracture
Kgusset = (E/Lave)(Wwtg3/12) (7)
where E is Young’s modulus of steel, Ww is the Whitmore width defined by a 30o projection angle, Lave is the average of L1, L2, L3 as shown in Figure 3b, and tg is the thickness of the gusset plate. A second rotational spring that is added in the same zero-length element simulates the in-plane flexural stiffness of the gusset plate, which needs to be greater than the brace stiffness. When the out-of–plane buckling is anticipated, a third spring simulating the torsional restraint of gusset is added. It is defined as GJ/Lave, where G is the shear modulus of steel material and J is the torsional constant of the Whitmore cross-section. Both flexural springs are made of Giuffre-Menegotto-Pinto steel material, whereas the torsional spring is made of elastic uniaxial material.
The accuracy of modelling braces with ends gusset plates depends on the following parameters: number of elements across the brace length, ne; the number of integration points per element, ni; initial out-of-straightess, e; fiber discretization technique and the number of fibers within cross-section, nf; the gusset plate behaviour formulation and the definition of the brace fracture model.
Figure 3. Model of Brace with End-Connections: a) OpenSees Model; b) Geometry of Gusset Plate.
4.2 The Effect of Out-of-Straightness on the Brace Response To capture the deflected shape of buckling braces, an initial out-of-straightness is assigned in the plan of buckling. Here, the S1B specimen was selected for investigations and the following out-of-straightness values were considered: 0.1%Lb; 0.2%Lb; 0.25%Lb; 0.33%Lb and 1.0%Lb, where Lb is the brace length. To replicate the brace response, eight nonlinear beam-column elements with distributed plasticity [27] and a fiber-based formulation consisting of 64 fibers within the cross-section and discretization technique type A (Figure 4), as well as four integration points per element were considered. As shown in Figure 5, the initial out-of-straightness value influences the magnitude of the replicated buckling force. Thus, for a small assigned value, the buckling strength increases significantly, whereas the post-buckling strength remains unchanged [13]. Conversely, when the initial out-of-straightness is larger than expected (e.g. L/100), buckling occurred prematurely and may simulate a false inelastic deformation mechanism. When the initial out-of-straightness, e, varies between 0.2%Lb (Lb/500) and 0.33%Lb (Lb/300) a small difference in the simulated buckling force is reported. In this example, no brace fracture model was assigned. The initial out-of-straightness may be estimated by using the equation proposed by Dicleli and Metha [30]:
b)
Compression
a)
Gusset plate connection simulation.
Tension
e
Non-linear beam-column elements with fiber cross-section
Rigid-end zone

Lucia Tirca and Liang Chen 450
12
12
(8) where, Mpb is the reduced plastic moment of the brace that corresponds to the Pb compression force and both Mpb and Pb parameters are mapped on the surface bordered by the defined P-M interaction curve. The remaining parameters L, E and I are the length of the brace, the modulus of elasticity and the moment of inertia of the brace about its axis of buckling. For example, in the case of specimen 2A, the computed out-of-straightness value, e = 8.9mm, is equivalent to Lb/500. This ratio is in agreement with that proposed by Ziemian [31] for HSS braces.
a) b) c) Figure 4. Fiber Discretization Techniques Developed for the HSS Brace Cross-Section:
a) Type A, 4n(1+m) fibers; b) Type B, 4n(n+m) fibers; c) Type C, 4n(k+m) fibers.
Figure 5. The Effect of Out-of-Straightness on the Buckling Strength of S1B Specimen.
4.3 The Effect of Number of Fibers within Brace Cross-Section and Discretization
Technique
The number of fibers within a brace cross-section along with the applied discretization technique has an impact on the hysteretic response of HSS braces. Three types of existing fiber discretization techniques that are reported in the literature are labelled herein as types A, B, and C and are illustrated in Figure 4. Thus, type A consists of 4n(1+m) fibers displayed as follows: (n x 1.0) fibers

451 Numerical Simulation of Inelastic Cyclic Response of HSS Braces upon Fracture
are concentrated at each HSS corner and 4(n x m) fibers are distributed at equal distances across the webs and flanges of the HSS cross-section. The type B discretization technique consists of 4n(n + m) fibers with (n x n) fibers concentrated at each cross-sectional corner, and 4(n x m) fibers distributed as per type A. Although type C fiber discretization displays the same number of fibers as type B, it differs by replacing the distributed line fibers that are located at HSS corners with rounded fibers that are assigned in parallel to the cross-sectional radius [20]. The effect of the number of fibers and the type of discretization technique on the inelastic brace response is illustrated for the S1B specimen in Figure 6a. In this example, the brace model consists of eight non-linear beam-column elements with four integration points per element and an out-of-straightness of Lb/500 that was assigned out-of-plane. The number of fibers within the HSS cross-section was set at 64 for discretization technique type A and at 500 (m = 20 fibers and n = 5 fibers) for types B and C. Although the cross-sectional area is unchanged, a difference in the behaviour of the brace under tensile force was observed when discretization technique type C was employed. As illustrated in Figure 6a, when using meshing technique type B, the tensile force is overestimated and the compressive force is slightly larger than that obtained from the experimental test. Thus, to match the test results, while avoiding converging problems and disturbance in the force-displacement hysteresis loops, fiber discretization technique type C is recommended. To summarize, the number of fibers used to mesh the HSS brace cross-section influences its hysteresis response, whereas, in the case of highly nonlinear behaviour, using a finer meshing discretization improves the chance of convergence although increasing the computation time. Thus, mesh refinement “is not important for the global response of the brace but plays a significant role in the determination of the inelastic deformations at the critical brace sections” [13].
a) b) Figure 6. The Effect of Modelling Parameters on the Hysteresis Response of an S1B Specimen:
a) Types of Fiber Discretization Technique; b) Number of Elements. 4.4 The Effect of the Number of Elements and Integration Points To emphasize the importance of the number of distributed nonlinear beam-column elements along the HSS brace length, ne, in this study, a suit of 4, 8, 10 and 20 elements with 4 integration points per element and fiber discretization technique type C are considered in order to simulate the brace response. Here, 500 fibers were assigned within the HSS cross-section and the out-of-straightness was set at Lb/500. As illustrated in Figure 6b, the number of elements selected to replicate the nonlinear response of S1B brace specimen has a small effect on the buckling force prediction and the global brace response. When the brace model is not loaded to failure, the use of eight nonlinear beam-column elements with four integration points per element and fiber discretization technique type C is sufficient to capture the fitted curvature during the nonlinear response, while the model

Lucia Tirca and Liang Chen 452
requires less computation time. Nonetheless, to capture the brace fracture, a minimum of 16 elements are required [3], although 20 are recommended [13] when the strain fatigue model is employed. However, by increasing the number of beam-column elements, the computation time increases as well. The number of integration points is not a sensitive parameter, but a minimum of three integration points per element are recommended [13,20,26]. 4.5 The Effect of Fatigue Material Parameters on Brace Strain Life The strain fatigue model that was proposed by Uriz [13] is based on cumulative damage. To reduce the volume of computations, a simplified rainflow cyclic counting technique was set in the formulation of fatigue material, which requires the calibrated value of material parameters as input. To validate the consistency of recommended constant values: 0 = 0.095 and m = -0.5, all specimens illustrated in Table 1 were replicated and assessed against the test results. Here, braces were modelled with 20 nonlinear beam-column elements with distributed plasticity, 4 integration points per element, fiber discretization technique type C with 500 fibers within the HSS cross-section and an initial out-of-straightness of Lb/500. Each end-gusset plate was simulated by two rotational and one torsional spring that were assigned in the zero-length element. Fatigue material was wrapped around the Giuffre-Menegoto-Pinto steel material assigned to brace and defined with 1% strain hardening for all braces, except one, the S1QB specimen for which a 5% strain hardening, was considered. In this study, m = -0.5 was treated as constant, whereas 0 was calibrated against experimental test results. To do this, its value varied until the simulated test had undergone the same number of cycles upon fracture as the experimental tests. The demanded failure strain for a single reversal, 0 that was required as input parameter in the definition of fatigue material and calibrated to match the experimental test results, is noted here 0,sim and is provided for all specimens in Table 2. To understand the variation of accumulated strain at brace fracture, the behaviour of four HSS brace specimens given in Table 1 that were subjected at different displacement loading histories, and are characterized by different slenderness ratios and width-to-thickness ratios is displayed in Figure 7. In this regard, the consistency of material parameters that were proposed by Uriz was investigated against experimental test results. Thus, by modelling the response of specimen S1B under displacement loading H1, it was observed that the OpenSees model failed before the physical test, whereas the last four simulated cycles showed unstable loops as illustrated in Figure 7a. To match the experimental test response, the 0,sim value was increased from 0.095 to 0.13, whereas the fatigue ductility exponent m =-0.5 remained constant. Conversely, when Uriz’s fatigue material parameters’ values [13] were used to replicate the response of the S1QB specimen, the OpenSees model did not fail during the last cycle and was able to undergo two more cycles of maximum amplitude that were fictitiously added to extend the initial loading history Q (Figure 7b). To match the experimental test, the o,sim value was decreased from 0.095 to 0.0665. The difference between the two demanded failure strain values (0.13 for S1B and 0.0665 for S1QB) is explained by the effect of the loading history on the brace response, which influences the development of strain in the cross-sectional fibers of the HSS brace at the plastic hinge location, although both specimens S1B and S1QB have the same slenderness ratio and width-to-thickness ratio. In the second example, the effect of brace slenderness ratio on the demanded failure strain for a single reversal value, 0,sim is emphasized. Thus, in case of specimens 2A and S3B, the slenderness ratio varies by a factor of 2.7 (53.3 for 2A versus 143.5 for S3B), whereas the width-to-thickness ratio shows a 20% variation (Table 2). By using 0 = 0.095 as input, the simulated S3B model was able to exhibit a lower number of cycles than the experimental test. In order to display the same number of cycles, a value that was twice as large (0,sim = 0.19) was required. However, when 0 = 0.095 was considered to define the fatigue material assigned to specimen 2A, the simulated

453 Numerical Simulation of Inelastic Cyclic Response of HSS Braces upon Fracture
response did not reach failure. Although two more virtual cycles of the same amplitude as the last cycle were added to the loading history, the simulated brace response showed strength degradation in tension and compression, without reaching failure. The last two hysteresis loops are depicted by a blue dashed-line in Figure 7d. To exhibit the same number of hysteresis cycles upon fracture as in the experimental test, the required value was 0,sim = 0.067. Thus, the demanded failure strain for a single reversal is larger for slender braces and decreases for stocky braces. It was noted that the S3B specimen was subjected to a smooth symmetric quasi-static cyclic loading, whereas specimen 2A was loaded to an asymmetric displacement history with large amplitudes in compression as shown in Figure 2d.
Figure 7. The Influence of Fatigue Material Parameters Values on Brace Response:
a) S1B specimen, b) S1QB specimen, c) S3B specimen, d) 2A specimen. In the third example, the effect of width-to-thickness ratio on the brace response is presented. Herein, specimens 3A, 3B and 3C were selected because of their similar slenderness ratios (an average of 64) and different width-to-thickness ratios. Although, specimen 3A is non Class 1 (b0/t > (b0/t)limit by 11%) it has a width-to-thickness ratio that is about twice as large as than that of specimen 3C (Table 2). To match the experimental test results, the demanded 0,sim value is 129% larger for 3C than that for 3B and about 198% larger than that of 3A as illustrated in Table 2. These results are in agreement with Eq. 3, which shows a positive power for b0/t. Thus, the failure strain for a single reversal parameter, o, is sensitive to the slenderness ratio and width-to-thickness ratio, as well as the type of applied loading and steel strength. Using a smaller o value than required may result in a conservative response (the model fails before the physical test), whereas using a larger value, the model dissipates more energy than the physical test.
Failure of physical test.
Failure of OpenSees
e0 = 0.095 the model experiences 2 more cycles (dashed
b
c d
)
) )

Lucia Tirca and Liang Chen 454
5. BRACE FRACTURE MODELS 5.1 Predicted Material Parameters Values for the Strain Fatigue Model In this study, Uriz’s strain fatigue model is considered to simulate brace fracture in OpenSees, when the set of values assigned to material parameters m and o are -0.5 and o,pred. To find the expression of predicted strain for a single reversal, o,pred is the main objective. By analyzing the variation tendency of 0,sim that is seen for all specimens in Table 2, an ascendent demand with respect to slenderness ratio was observed. Thus, for square HSS specimens with similar width-to-thickness ratios (e.g., b0/t ~ 12.00 and about 80% of (b0/t)limit) and different slenderness ratios, such as: 141.8 for S3B, 77 for Lee-5, 65.8 for 3B, 59.7 for 4B and 52.4 for 2B, the demanded 0,sim value decreases from 0.19 for the slender specimen, S3B, to 0.077 for the stocky specimen, 2B. However, for square HSS specimens with (b0/t) ~ (b0/t)limit (e.g., 2A and 4A) or those non Class 1 (e.g., Lee-1 and 3A), the slenderness ratio seems to have a small effect on the demanded failure strain for a single reversal value, o,sim. In addition, the E/Fy ratio that is shown in Table 2, also has a slight effect on the brace fracture life. For all 12 square HSS specimens that appear in Table 2, the variation in the design parameters bo/t, kL/r and E/Fy is expressed by the coefficient of variation and the resulted values are: 41.69% for kL/r, 24.83% for bo/t and 11.38% for E/Fy. Table 2. Brace Properties, Cumulative Strain, Strain-range and End-rotation at the Onset of Fracture
Test no.
Size bo/t kL/r E/Fy e0sim e0sim/ e0pred(Eq10)
maxergsim maxergsim./
maxergpred. f, sim. f,sim./
f, pred. S1B 76x127x4.8 22.45 93.0 535.4 0.131 1.535 0.059 1.537 0.186 0.915
S1QB 76x127x4.8 22.45 93.2 535.4 0.067 0.784 0.040 1.092 0.175 0.864
S3B 76 x 76x4.8 11.83 141.8 563.3 0.190 1.049 0.102 2.456 0.265 1.078
S3A 76 x 76x4.8 11.83 143.5 565.3 0.180 0.984 0.072 1.741 0.233 0.947
1B 127x127x8.0 11.88 53.9 453.7 0.090 1.181 0.046 0.865 0.206 1.123
2A 152x152x8.0 15.00 53.3 457.0 0.067 1.015 0.041 0.837 0.193 1.109
2B 152x152x9.5 12.00 52.4 443.4 0.077 1.033 0.043 0.810 0.212 1.170
3A 127x127x6.4 17.80 64.8 414.3 0.058 0.778 0.035 0.786 0.191 1.045
3B 127x127x8.0 11.88 65.8 453.7 0.089 0.974 0.037 0.740 0.203 1.041
3C 127x127x9.5 9.40 61.6 414.4 0.115 1.165 0.038 0.710 0.234 1.168
4A 152x152x8.0 15.00 63.5 432.1 0.066 0.857 0.035 0.759 0.180 0.980
4B 152x152x9.5 12.00 59.7 432.1 0.078 0.938 0.037 0.736 0.211 1.120
Lee-1 5x5x0.188 22.40 58.0 469.0 0.056 1.000 0.041 0.997 0.135 0.816
Lee-5 4x4x0.250 11.88 77.0 392.0 0.124 1.269 0.064 1.428 0.234 1.145
Mean (12 specimens)* 13.57 74.6 457.5 0.099 1.020 0.049 1.072 0.208 1.061
Standard deviation 3.37 31.1 52.02 0.043 0.131 0.019 0.496 0.0315 0.100
St. dev./ Mean % 24.83 41.69 11.38 43.63 12.84 39.47 46.26 15.14 9.42
*Only the 12 square HSS specimens are considered. Based on the foregoing, in this study, the following regression equation is proposed in order to predict the failure strain for a single reversal value that is available for square HSS braces whose slenderness ratio vary from 50 to 150:
0,sim 0,sim / 0,pred(Eq9) maxrg,sim
maxrg,sim / maxrg,pred f,sim Size b0/t KL/r E/Fy Test no.

455 Numerical Simulation of Inelastic Cyclic Response of HSS Braces upon Fracture
0, . 0.0060.859 0.6 0.1
(9)
In comparison to Eq. 3, which was provided for HSS braces with KL/r < 85, the slenderness ratio in the above equation was considered to have a positive power, whereas a similar weight was maintained by E/Fy and with-to-thickness ratio. The series of 0,pred values is illustrated in Figure 8 versus the simulated values, 0,sim, whereas the 0,sim/0,pred ratio is given for all specimens in Table 2. Thus, a good match was observed for braces with a square HSS cross-section, but for braces with a rectangular HSS cross-section, the addition of a 4th parameter do/t to negative power is required. To validate the predicted failure strain for a single reversal value, 0,pred, computed from Eqs. 3 and 9, the simulated hysteresis loops that resulted for specimens 2A and 3B are depicted in Figures 9a and 9b, respectively, versus the experimental test results. Here, the 0,pred computed from Eq. 3 is 0.051 for specimen 2A and 0.052 for 3B, whereas m = -0.3, was constant. As depicted, both sets of predicted material parameters value: (m = -0.3 and o,pred-Eq.3) and (m = -0.5 and o,pred-Eq.9) that were used as input in the assigned fatigue material are able to simulate the brace response when tensile fracture occurs. However, when the simulated response of 3B specimen that displays a 24% larger slenderness ratio than of the 2A specimen was investigated, a better match was obtained when the o,pred-Eq.9 was employed. Conversely, using m = -0.3 and o,pred-Eq.3 caused the replicated response to be underestimated by two cycles as shown in Figure 9b.
Figure 8. Simulated versus Predicted Strain for a Single Reversal against the Slenderness Ratio.
a) b) Figure 9. Brace Fracture Simulation Based on the Strain Predicted from Eqs. 10 and 3 vs.
Experimental Test Results: a) 2A specimen; b) 3B specimen.
HSS 76x127x4.8
ee
m = -0.5
0

Lucia Tirca and Liang Chen 456
5.2 Comparisons with the Existing Strain-Range and End-Rotation Brace Fracture Models
The simulated tensile and compressive strain history, recorded at two extreme fibers of the HSS corner cross-section, located at the brace’s mid-length and schematically illustrated in Figure 3a, is plotted in Figure 10 for S1B, S1QB and 2A specimens. As depicted, the tensile fibers have accumulated a limited range of tensile strains per cycle, whereas the compressive fibers experienced a greater accumulated strain-range, as well as a greater maximum strain-range throughout the loading history. Based on this observation, Hsiao et al. [3] proposed the strain-range brace fracture model, where the maximum strain-range developed during the loading history in the compressive fiber of the HSS corner cross-section located at the brace’s mid-length is recorded. For all specimens, the simulated maximum strain-range value, max.rg that is obtained throughout the loading history is shown in Table 2, as well as the ratio of simulated to the predicted maximum strain-range that was computed from Eq. 4. Furthermore, Figure 11a illustrates both series of simulated and predicted maximum strain ranges throughout the loading history at the onset of brace fracture against the slenderness ratio of given specimens. As shown, a good match is observed for the predicted max.rg.value computed for stocky braces, while for slender braces, such as S3A and Lee-5, the ratio maxrg,sim./ maxrg,pred is 1.741 and 1.428, respectively. For slender braces, the simulated strain-range magnitude is close to the predicted value obtained from Eq. 4, when the
Figure 10. Strain History of Tensile and Compression Fibers Recorded at the HSS Corner of the
Braces’s Mid-Length Cross-Section: a) S1B; b) S1QB; c) 2A.
a) b)
Figure 11. Simulated vs. Predicted Strain-Range Against Slenderness Ratio: a) Maximum Strain- Range; b) Strain-Range of Cycle Prior Failure.
a) b) c)
tensile fiber
compression fiber
et,max.
ec,max. ec,max.
et,max. et,max.
ec,max.
erg erg
erg
erg
erg erg

457 Numerical Simulation of Inelastic Cyclic Response of HSS Braces upon Fracture
cycle prior failure is considered, instead of the whole strain-range history (Figure 11b). As illustrated in Figures 10a and 10b, the development of strain history and, implicitly, the strain life of brace members vary with the type of applied loading history. To link the strain history to the maximum out-of-plane brace deformation, e, Figures 12a and 12b illustrate the simulated deformation response of specimens S1B and S1QB. Although, both braces are able to undergo similar out-of-plane deflection, the strain developed in the extreme compression fiber of the HSS corner cross-section shows a different strain history path. This effect is explained by the microplastic deformation that is induced by the cyclic plastic strain in the steel material, whereas the changes affecting the mechanical properties of material have secondary influence [32]. In addition, the compressive stress relaxation that is contributed by strain reversal inhibits the crack nucleation. As seen in Figures 10 and 12, the strain in the extreme compression fiber of HSS corner cross-section varies for each cycle, i, between (c)i and (t)i. When the total strain per cycle ((c)i +
(t)i) remains in compression for several adjacent cycles, as is the case of specimens 2A (Figures 10c and 12d) and S1QB (Figures 10b and 12b), the strain life is reduced. For example, the ratio of the accumulated strain in compression (c)i to the accumulated strain in tension (t)i, that is developed in the extreme compression fiber is 1.82 for the S1B specimen and 2.78 for the S1QB specimen. When compared, the slender braces (e.g., S3B, S3A) show light development of compression strain, especially in the first part of the applied loading history (Figure 12c). After that, the compression strain that is developed is inhibited by tensile strain and the specimen experiences a longer strain life.
Figure 12. Simulated Out-of-Plane Deformation vs. Tensile (light, dashed line) and Compression (dark, solid line) Strain Developed in Braces: a) S1B; b) S1QB; c) S3B; d) 2A.
Furthermore, brace members that are subjected to a loading history applied first in tension (e.g., S3A vs. S3B) exhibit reduced residual lateral displacement. Thus, a correlation of maximum brace deformation at the onset of fracture and the accumulated strain or maximum strain-range computed in the compressive fiber of the HSS brace cross-section is observed.
a) b)
c) d)

Lucia Tirca and Liang Chen 458
The simulated time-history series of maximum out-of-plane brace deformation, e, is plotted for specimens S1B and S3B against the interstorey drift, Δ (Figure 13). Although local buckling is not considered in the model, the out-of-plane brace deflection versus interstorey drift, which is expressed as Δ/H% where H is the storey height, does not seem to be affected during the inelastic cyclic excursions prior to failure [20]. By replicating the specimens behaviour with and without the consideration of fatigue material, small differences are observed in the magnitude of brace deflection. However, the failure of the brace at the onset of fracture is strongly influenced by the value of material parameters that are used as input in the definition of fatigue material. Based on the displacement ductility of HSS braces, Tremblay et al. [15] proposed the end-rotation of brace causing fracture model, where the end-rotation is measured at the onset of brace fracture, f,pred., as per Eq. 5. The simulated end-rotation value, f,sim, together with the ratio f,sim/f,pre., are given in Table 2. Both series of simulated and predicted end-rotation of brace at fracture versus slenderness ratios are illustrated for all specimens in Figure 14. A good match is seen.
Figure 13. Simulated Out-of-Plane Deformation vs. Interstorey Drift: a) S1B; b) S3B.
Figure 14. Simulated vs. Predicted End-Rotation of Braces at Fracture Against
Slenderness Ratio.
To summarize, statistical results such as the mean, the standard deviation and the coefficient of variation are calculated in order to evaluate the ratio of simulated to predicted values that is obtained by employing the strain fatigue, strain-range and end-rotation brace fracture models. Due to the large variation in design parameters, especially in the slenderness ratio that showed a variation of 41.69%, the demanded strain for a single reversal parameter that fits the experimental tests, 0,sim, exhibits a coefficient of variation in the same range, 43.63%. A similar coefficient of variation, 39.47%, was obtained for the fitted maximum strain-range parameter, maxrg,sim. By
~
~
a) b)

459 Numerical Simulation of Inelastic Cyclic Response of HSS Braces upon Fracture
using the predicted failure strain computed from the equation proposed in this study (Eq. 9) or the predicted end-rotation of brace at fracture resulted from the equation proposed by Tremblay et al. [15] a good match was obtained. Thus, for the 12 selected square HSS brace specimens, the coefficient of variation is 12.84% and 9.42% for the ratios 0,sim/0,pred and f,sim/f,pred, respectively. As seen in Table 2, there is a large difference between the coefficient of variation of 15.14% calculated for the simulated end-rotation of brace at fracture, f,sim and that of 46.63% computed for the failure strain 0,sim. However, for the strain-range fracture model, the coefficient of variation is 46.26%. This brace fracture model gives a greater dispersion for slender braces, such as S3A and S3B. In this regard, the coefficient of variation dropped to 26.66% when both slender specimens were removed. By using 44 specimens from the literature with a mean slenderness ratio of 67.6 and 19.8% coefficient of variation, Hsiao et al. [3] reported a coefficient of variation of 15.7% for the strain-range fracture model employed. In Figure 11 there seems to be a slight negative trend of strain-range for specimens with kL/r < 65. However, this trend becomes ascendent for specimens that have a larger slenderness ratio. 6. CONCLUSIONS To analyze the nonlinear seismic response of concentrically braced frame building structures, an accurate brace fracture model prior to and beyond fracture is required. According to the CSA/S16-2009 standard, HSS braces behaving in tension/compression should be Class 1 sections and respond to a slenderness ratio kL/r that is lower than 200, but not less than 70 for braces of CBF buildings that are located in seismic areas, whereas the short period spectral acceleration ratio is equal to or greater than 0.75. When using the strain fatigue model to simulate HSS brace fracture in OpenSees, the failure strain for a single reversal value is required as input parameter. Thus, in this study, a regression equation was proposed to compute the predicted failure strain value for square HSS braces whose slenderness ratio is between 50 and 150. For calibration, 14 experimental test results found in the literature that have experienced failure fracture under large out-of-plane displacement were replicated. All selected specimens correspond to a wide range of brace parameters and types of loading history. The brace member was modelled here using nonlinear beam-column elements with spread plasticity and discretized fiber formulation. In this study, the impact of modelling parameters on the nonlinear response of braces is also discussed. Comparisons with existing brace fracture models such as strain-range and end-rotation of brace are also provided. The conclusions of this research are as follows:
The strain fatigue model that was implemented by Uriz in the formulation of fatigue material is able to simulate the brace response at the onset of fracture. In this study, the assigned fatigue material parameters m and o receive as values -0.5 and o,pred, respectively. To predict the value of failure strain for a single reversal parameter, o,pred, a regression equation, developed for square HSS braces whose slenderness ratio is between 50 and 150 was proposed. The variables in the equation are: slenderness ratio, width-to-thickness ratio and yield strength. By compiling the results from 12 experimental tests conducted on pin-ended square HSS brace members, a coefficient of variation of 12.84% for the ratio 0,sim/0,pred was obtained. For Class 1 specimens, the 0,sim value varies from 0.066 to 0.19 with a mean of 0.099 that is close to the recommended Uriz’s value (0.095). For non Class 1 specimens the simulated failure strain dropped to 0.056.
Based on the same strain fatigue model, the set of material parameters value that were proposed by Lignos and Karamanci (m = -0.3 and o,pred) for HSS braces whose slenderness ratio is between 27 and 85 was evaluated. A good prediction for braces with a slenderness ratio that is less than 65 was achieved. For those with larger slenderness ratios, the predicted strain for a single reversal value is underestimated by one or two cycles.

Lucia Tirca and Liang Chen 460
From comparisons with the existing end-rotation of brace fracture model, the coefficient of variation is slightly larger (12.84% versus 9.42%). This is explained by the large difference between the coefficient of variation of 15.14% calculated for the simulated end-rotation of brace at fracture, f,sim and that of 46.63% computed for the simulated failure strain 0,sim.
The existing strain-range brace fracture model is based on the maximum strain range of compressive fiber throught the entire history. This model shows larger dispersion for slender HSS braces and a good correlation for stocky braces, especially for those with a slenderness ratio that is lower than 65. However, for slender braces a good match was obtained when the strain range of the cycle prior failure was recorded. The coefficient of variation computed for the ratio maxrg,sim./ maxrg,pred dropped to 26.66% after the slender specimens, S3A and S3B, were removed.
The effect of loading history type on the strain life of braces is explained by the microplastic deformations that are induced by the cyclic plastic strain in the steel material, while the changes affecting the mechanical properties of material have a secondary influence. In addition, the compressive stress relaxation that was contributed by strain reversal inhibits the crack nucleation. Meanwhile, brace members that are subjected to the loading history applied first in tension (e.g. S3A) exhibit reduced residual lateral displacement. However, the strain life of HSS brace members subjected to cyclic axial deformations is highly influenced by the slenderness ratio. Thus, braces with larger slenderness ratios and lower width-to-thickness ratios have a longer strain life because are able to avoid the initiation of premature fracture.
ACKNOWLEDGMENTS The authors would like to thank Professors Robert Tremblay and Tom Brown for providing their experimental test results. The financial support provided by the Natural Sciences and Engineering Research Council of Canada is gratefully acknowledged. REFERENCES [1] CSA. CAN/CSA-S16-09, “Limit States Design of Steel Structures”, Rexdale, Ontario,
Canadian Standard Association, 2009. [2] Lehman, D.E., Roeder, C. W., Herman, D., Johnson, S., Kotulka, B., “Improved Seismic
Performance of Gusset Plate Connections”, Journal of Structural Eng., ASCE, 2008, Vol. 134, No. 6, pp. 890-901.
[3] Hsiao, P.C., Lehman, D., Roeder, C., “A Model to Simulate Special Concentrically Braced Frames Beyond Brace Fracture”, Journal of Earthquake Engineering and Structural Dynamics, 2013, Vol. 42, pp. 182-200.
[4] Lee, S. and Goel, S.C., “Seismic Behavior of Hollow and Concrete-filled Square Tubular Bracing Members”, Research Report UMCE 87–11, Department of Civil Engineering, University of Michigan, Ann Arbor, MI, 1987.
[5] Archambault, M.H., “Etude du Comportement Seismique des Contreventements Ductile en X avec Profiles Tubulaires en Acier”, Report no. EPM/GCS-1995-09, Montreal, Canada, Ecole Polytechnique, 1995.
[6] Shaback, B. “Behaviour of Square HSS Braces with end Connections under Reversed Cyclic Axial Loading”, Master thesis in the Dep. of Civil Eng., University of Calgary, Calgary, 2001.
[7] Shaback, B. and Brown, T., “Behaviour of Square Hollow Structural Steel Braces with end Connections under Reversed Cyclic Axial Loading”, Canadian J. of Civil Engineering,

461 Numerical Simulation of Inelastic Cyclic Response of HSS Braces upon Fracture
2003, Vol. 30, No. 4, pp. 745-753. [8] Yang, T.Y. and Mahin, S., “Limiting Net Section Fracture in Slotted Tube Braces”, Steel
Tips, Structural Steel Education Council, Orinda, Ca., 2005. [9] Fell, B.V., Kanvinde, A.M., Deierleine, G.G., Myers, A.M., Fu, X., “Backling and Fracture
of Concentric Braces under Inelastic Loading”, Steel Tips, Tehnical Information and Product Service, Structural Steel Education Concil, Moroga, CA., 2006.
[10] Han, S.M., Kim, W.T., Foutch, D.A., “Seismic Behaviour of HSS Bracing Members According to Width-thickness Ratio under Symmetric Cyclic Loading”, J. Struct. Eng., 2007, Vol. 133, No. 2, pp. 264-273.
[11] Tremblay, R., “Inelastic Seismic Response of Steel Bracing Members”, Journal of Constructional Steel Research, 2002, Vol. 58, pp. 665-701.
[12] Lee, K. and Bruneau, M., “Energy Dissipation of Compression Members in Concentrically Braced Frames: Review of Experimental Data”, Journal of Structural Engineering, ASCE, 2005, Vol. 131, No. 4, pp. 552-559.
[13] Uriz, P. and Mahin, S., “Toward Earthquake Resistant Design of Concentrically Braced Steel Frame Structures”, PEER Report 2008/08.
[14] Uriz, P., “Towards Earthquake Resistant Design of Concentrically Braced Steel Buildings”, Ph.D. Dissertation, University of California, Berkeley, 2005.
[15] Tremblay, R., Archambault, M.H., Filiatrault. A., “Seismic Response of Concentrically Braced Steel Frames Made with Rectangular Hollow Bracing Members”, Journal of Structural Eng., ASCE, 2003, Vol. 129, No. 12, pp.1626-1636.
[16] Mazzoni, S., McKenna, F., Scott, M., Fenves, G. et al., “OpenSees User Manual”, 2007, opensees.berkeley.edu/OpenSees/manuals/usermanual/OpenSeesCommandLanguageManu
[17] Santagati, S., Bolognini, D., Nascimbene, R., “Strain Life Analysis at Low-cycle Fatigue on Concentrically Braced Steel Structures with RHS Shape Braces”, J. Earthquake Eng., 2012, Vol.16 (S1), pp. 107-137.
[18] Salawdeh, S. and Goggins, J., “Numerical Simulation for Steel Brace Members Incorporating a Fatigue Model”, Engineering Structures, 2013, Vol. 46, pp. 332-349.
[19] Lignos, D. and Karamanci, E., “Predictive Equations for Modelling Cyclic Buckling and Fracture of Steel Braces”, 10th International Conference on Urban Earthquake Engineering, March 1-2, 2013, Tokyo Institute of Technology, Tokyo, Japan, 2013.
[20] Tremblay, R., “Influence of Brace Slenderness on the Fracture Life of Rectangular Tubular Steel Bracing Members Subjected to Seismic Inelastic Loading”, Proc. 2008 ASCE Structures Congress, Vancouver, BC., 2008.
[21] Hsiao, P.C., Lehman, D., Roeder, C., “Improved Analytical Model for Special Concentrically Braced Frames”, Journal of Constructional Steel Research, 2012, Vol. 73, pp.80-94.
[22] ASTM. ASTM E 1049–85,” Standard Practices for Cycle Counting in Fatigue Analysis”, West Conshohocken, PA, 2003.
[23] Xue, L., “A Unified Expression for Low Cycle Fatigue and Extremely Low Cycle Fatigue and its Implication for Monotonic Loading”, International Journal of Fatigue 2008, Vol. 30 (10–11), pp. 1691–1698.
[24] Manson, S., “Fatigue: A complex Subject - some Simple Approximations”, Experimental Mechanics, 1965, Vol. 5, No. 7, pp. 193-226.
[25] Coffin, L., “A Study of the Effect of Cyclic Thermal Stresses on a Ductile Metal”, Trans ASME, 1954, Vol. 1954, No. 76, pp. 931–950.
[26] Uriz, P., Filippou, F.C., Mahin, S., “Model for Cyclic Inelastic Buckling of Steel Braces”, Journal of Structural Engineering, ASCE, 2008, pp. 619-628.
[27] Aguero, A., Izvernari, C., Tremblay, R., “Modelling of the Seismic Response of Concentrically Braced Steel Frames Using the OpenSees Analysis Environment”, International Journal of Advanced Steel Construction, 2006, Vol. 2-3, pp. 242-274.

Lucia Tirca and Liang Chen 462
[28] Scot, M.H. and Fenves, G.L., “Plastic Hinge Integration Methods for Force-based Beam-column Elements”, Journal of Structural Engineering, 2006, Vol. 132, No. 2, pp. 244-252.
[29] Yoo, J.H., Lehman, D., Roeder, C., “Influence of Gusset Plate Parameters on the Seismic Resistance of Braced Frames”, J. of Constructional Steel Research, 2008, Vol. 64, pp. 607-623.
[30] Dicleli, M. and Mehta, A., “Simulation of Inelastic Cyclic Buckling Behaviour of Steel Box Sections”, Computer and Structures Journal, 2007, pp. 446-457.
[31] Ziemian, R., “Guide to Stability Design Criteria for Metal Structures”, J. Wiley & Sons, 2010.
[32] Li, S.J., Cui, T.C., Hao, Y.L., Yang, R., “Fatigue Properties of a Metastable b-type Titanium Alloy with Reversible Phase Transformation”, Acta Biomaterialia Journal, Elsevier, 2008,
Vol. 4, pp. 305-317.