research article fermentation process modeling with...
TRANSCRIPT

Research ArticleFermentation Process Modeling with Levenberg-MarquardtAlgorithm and Runge-Kutta Method on Ethanol Production bySaccharomyces cerevisiae
Dengfeng Liu1 Ling Xu12 Weili Xiong1 Hong-Tao Zhang3 Chi-Chung Lin3
Lihua Jiang1 and Baoguo Xu1
1 Key Laboratory of Industrial Advanced Process Control for Light Industry Ministry of EducationJiangnan University Wuxi 214122 China
2 School of Internet of Things Technology Wuxi Institute of Commerce Wuxi 214153 China3 Key Laboratory of Industrial Biotechnology Ministry of Education Jiangnan University Wuxi 214122 China
Correspondence should be addressed to Baoguo Xu xbgjiangnaneducn
Received 19 February 2014 Accepted 8 April 2014 Published 19 June 2014
Academic Editor Zhijun Zhang
Copyright copy 2014 Dengfeng Liu et al This is an open access article distributed under the Creative Commons Attribution Licensewhich permits unrestricted use distribution and reproduction in any medium provided the original work is properly cited
The core of the Chinese rice wine making is a typical simultaneous saccharification and fermentation (SSF) process In order tocontrol and optimize the SSF process of Chinese rice wine brewing it is necessary to construct kineticmodel and study the influenceof temperature on the Chinese rice wine brewing process An unstructured kinetic model containing 12 kinetics parameters wasdeveloped and used to describe the changing of kinetic parameters in Chinese rice wine fermentation at 22 26 and 30∘C Theeffects of substrate and product inhibitions were included in the model and four variable including biomass ethanol sugar andsubstrate were considered The R-square values for the model are all above 095 revealing that the model prediction values couldmatch experimental data very well Our model conceivably contributes significantly to the improvement of the industrial processfor the production of Chinese rice wine
1 Introduction
Chinese rice wine is an important alcoholic beverage madefromwhole steamed sticky rice (also known as glutinous rice)in China with a long history At this time the productionof Chinese rice wine has reached 14 million tons per yearThus far traditionally the rice wine fermentation process isstill manually controlled by technicians based on their expe-rience This caused variability of the flavour for each batch ofChinese rice wine Hitherto how tomaintain and standardizethe flavour of all batches of rice wine is still an unsolved issueTo achieve optimal automatic bioreactor control in the ricewine fermentation production process is expected to resolvesuch problem Development of a robust mathematical modelon the optimal automatic control fermentation system forChinese rice wine production is absolutely necessary [1ndash3]Whole sticky rice and Chinese wheat qu are the two keyraw materials used for Chinese rice wine brewing Chinese
wheat qu is a starter culture containing predominately thefungus Aspergillus oryzae and enzymes as saccharifying andfermenting agents To make Chinese wheat qu the wheatgrain is milled mixed with natural water and pressed into astarter cake It is subsequently incubated at 28minus30∘C for 48 hand dried at 45∘C until the moisture is lower than 12 (ww)[4 5] The Chinese rice wine brewing process can be dividedinto two stages as follows whole rice was soaked first andthen steamed Finally the steamed sticky rice Chinese wheatqu and tap water were mixed at an appropriate ratio andnaturally fermented at lower than 33∘Ccondition for 96 h (themain stage)The resulting brothwas pumped into a fermentortank at 15∘C for another 45 days (the second stage) In all theprocesses of Chinese rice wine brewing the first stage is thekey step for acquiring high Chinese wine quality and yieldConsequently we focused on developing an unstructuredmodel to describe themain stage of the fermentation process
Hindawi Publishing CorporationMathematical Problems in EngineeringVolume 2014 Article ID 289492 10 pageshttpdxdoiorg1011552014289492
2 Mathematical Problems in Engineering
Themain-stage fermentation process of ricewine produc-tion is typically simultaneous saccharification and fermen-tation (SSF) process It is divided into two stages the firststage is enzymatic saccharification andmicrobial growth andthe second stage is enzymatic saccharification and microbialfermentation (ethanol production) During the enzymaticsaccharification process the polysaccharides from wholesteamed sticky rice are hydrolyzed into reducing sugar andoligosaccharides for the fermentation process The reducingsugar is converted into ethanol and flavour agent through theChinese rice wine fermentation production process
There are several kinetic models in industrial alcoholicbeverage fermentation to describe the SSF process of ethanolproduction with different materials such as corn flour [6 7]wheat flour [8 9] and some cellulosic substrates [10ndash15]Hitherto these SSF models are mainly classified as two typesunstructured model and cybernetic model In cyberneticmodeling the core parts are the description of the synthesisrates of key enzymes and the metabolic flux balance of theequation of the enzymes in the Chinese wheat qu As thesaccharification process of Chinese rice wine was conductedwith Chinese wheat qu containing enzymes cyberneticmodeling cannot explain this situation Kroumov et al[16] developed an unstructured model for simultaneoussaccharification and fermentation of starch to ethanol withthe recombinant strain of S cerevisiae YPB-G In this case Scerevisiae YPB-G can produce both saccharification enzymesand ethanol Therefore new saccharification enzymes wereinduced in the fermentation process It is different from thatof Chinese rice wine brewing during which saccharificationenzymes are not induced endogenously Chavan et al [17]modeled the SSF process from starch to flavour compoundsPodkaminer et al [11] found ethanol concentration canpartly inactivate the enzyme and then developed a kineticmodel to model this phenomenon for thermophilic SSF at50∘C with Thermoanaero saccharolyticum ALK2 These SSFkinetic models provided useful information for developingthe kinetic models to describe the SSF process in Chinese ricewine fermentation
There are many kinetic models to describe the SSFprocesses However all existing models cannot apply to theconditions of Chinese rice wine brewing Chinese wheat quand sticky rice are the main raw materials for producingreducing sugar The Chinese wheat qumainly contains amy-loglucosidase and 120572-amylase which hydrolyze the starch inthe sticky rice to reducing sugar [5] Saccharomyces cerevisiaeyeast was used to convert the reducing sugar into ethanol[18] In the Chinese rice wine fermentation productionthere are several factors which are different from other SSFprocesses (1) whole steamed rice instead of starch flour isused as source to supply starch which is then hydrolyzedto reducing sugar (2) in the Chinese rice wine brewingprocess Chinese wheat qu which contains 120572-amylase andamyloglucosidase is used to complete the saccharification ofrice (3) variable temperatures are used up to 33∘C (4) Theconcentration of sugars can reach as high as 150 g Lminus1 (5)final ethanol concentration in Chinese rice wine brewing canreach as high as 21 (vv)The brewing process condition forChinese rice wine is different from the alcohol fermentation
process Therefore we cannot directly apply the alcoholfermentation kinetic models to describe the Chinese ricewine fermentation process It is necessary to develop a newand specific SSF model to describe the Chinese rice winebrewing process In addition although temperature is thekey factor affecting the Chinese rice wine the Chinese wheatqu quality and yield are also very important Hitherto thereare only limited publications on the study of the effect oftemperature for Chinese rice wine fermentation production
Consequently we focused on (1) analyzing of the effectof various temperatures on Chinese rice wine fermentation(2) formulating the kinetic model on reducing sugar andethanol production during Chinese rice wine fermentation(3) validating the model with experimental data of the SSFprocess in Chinese rice wine fermentation using the Chinesewheat qu sticky rice Saccharomyces cerevisiae to developmodel parameters from our experimental data at varioustemperatures using the least-squares algorithm
2 Material and Methods
21 Microorganisms for Fermentation The yeast Saccha-romyces cerevisiae EC1118 (Lallemand Australia Pty LtdUnderadale SA Australia) was used in this study and storedat 4∘CThe Chinese wheat qu used in this study was suppliedby the Shaoxing Nu1015840er Hong RiceWine Company (ZhejiangChina) and stored at room temperature Sticky (glutinous)rice purchased from a local store in Columbia MO (productof Thailand distributed by Walong Marketing Inc BuenaPark CA USA) was used in this study
22 Fermentation and Sample Preparation To analyze thesaccharification process steamed rice Chinese wheat quand water at the ratio of 10 2 30 was prepared underthree different temperatures (22 26 and 30∘C) [18] At thepredetermined time samples of 5mL cultures were takenfrom the fermentor and for analyses Reducing sugar and pHwere recorded with pH meter (S220 SevenCompact pHIon)and UV spectrometer (Thermo Scientific Spectronic Gensys5 UV Spectrometer) at 600 nm
The Chinese rice wine fermentation experiments werecarried out in 1000mL shake flask (600mL working volume)at 22 26 and 30∘C without pH control Samples of 5mL ofthe fermentation broth were taken for analyses of reducingsugar [19] and pH 20mL of broth was taken for analyzing theethanol concentration The Chinese rice wine fermentationwas conducted with the medium containing steamed riceChinese wheat qu and water at the ratio of 10 2 30 Saccha-romyces cerevisiae EC118 was added to water and heated to40∘C for 20min at the ratio of 500 g 5 L water Subsequently20mL of the resulting broth was added to each flask
As theChinese ricewine fermentation is at half-solid stateand half-liquid process and the sticky rice is always in thefermentation broth it is difficult to determine the biomass ofSaccharomyces cerevisiae for which 20mL of Saccharomycescerevisiae EC118 was added to the fermentation mediumunder three different temperatures (22 26 and 30∘C) for 96 hAll the cultureswere taken out at various times (see Section 3)
Mathematical Problems in Engineering 3
andwere analyzed in the following sectionThismediumonlycontains glucose with concentration at 150 g Lminus1
23 Analytical Methods
231 Determination of Biomass For biomass determination5mL of fermentation mash was taken out and centrifuged at6000 g for 4min The cells were suspended in 5mL distilledwaterThe optical density was determined at 600 nmwith theUV spectrometer If the OD
600is above 1 the sample was
diluted and then tested until the DO600
is less than 1 Drycell weight (X) was determined with cell pellet dried at 80∘Cin an oven for 48 h The standard curve of cell biomass wasobtained as below based on the linear relation of OD value(y) and dry cell weight (X)
119883 = 0668119910 minus 00062 (119877
2
= 0996) (1)
where X is dry cell weight and g Lminus1 OD600
is optical densityat 600 nm
232 Determination of the Quantity of Reducing Sugar inthe ChineseWine Fermentation Broth For the determinationof the reducing sugar (G) concentration the fermentationbroth was taken and centrifuged and then 20120583L was dilutedto 2mL with distilled water and mixed with 15mL 35-dinitrosalic acid reagent [19] After it was heated to 100∘C for10min samples were diluted to 25mL and then determinedwith UV spectrometer at 520 nm The standard curve ofreducing sugar was obtained as described below based on thelinear relation of OD
520value (z) and reducing sugar (G)
119866 = 07294119911 + 00344 (119877
2
= 0999) (2)
where G is reducing sugar concentration g Lminus1 OD520
isoptical density at 520 nm from UV spectrometer
233 Determination of the Concentration of Ethanol Anebulliometer (Napa CA USA) was used to determinethe alcohol content in the Chinese rice wine (httpwwwdujardin-salleroncomsocieteindexphplangue=2)The test is based on the difference between the boiling pointsof water and wineThe procedure is as follows (1) determinethe boiling point of water (2) dilute the wine sample so thatthe boiling point of the diluted wine is within 4∘C of theboiling point of water (3) calculate the concentration of thewine with the standards value indicated by the instrument
24 Curve Fitting and Parameter Identification ProcedureBased on model there are 12 parameters which need tobe estimated with data from the experiments under vari-ous temperatures in this work They are 119896
1 119896
2 119896
3 119896
4 119884
119909119904
119884
119901119904 119896
0 119896
119904 119896
1199041 119896ps1 119896pi1 119896119898 They can be expressed with the
following equation
119862 = 119891 (119896
1 119896
2 119896
3 119896
4 119884
119909119904 119884
119901119904 119896
0 119896
119904 119896s1 119896ps1 119896pi1 119896119898)
(3)
To obtain an ideal kinetic model the optimization andreoptimization steps of the identification procedures were
performed using the Levenberg-Marquardt method and thefourth-order Runge-KuttamethodThe objective function (e)was used
119890 = sum
119894
(119883
119894minus
119883
119894)
2
119883
2
119894
+sum
119894
(119864
119894minus
119864
119894)
2
119864
2
119894
+sum
119894
(119866
119894minus
119866
119894)
2
119866
2
119894
(4)
where 119883119894 119864119894 119866119894are the experimental values of the dry cell
weight biomass ethanol and reducing sugar respectivelyOn the contrary 119883
119894 119864119894 and
119866
119894are the values predicted
by the model Parameters estimate and identification of themodel were realized through minimizing 119890 value of (4)The nonlinear regression analysis in accordance with theLevenberg-Marquardt method [20] was used to minimizethe objective function (e) which has been successfully usedin the optimization parameters in the other kinetic models[21ndash24] The model was solved by using the fourth-orderRunge-Kutta method ode 45 with the MATLAB R2009asoftware Both the fourth-order Runge-Kuttamethod and theLevenberg-Marquardt method were also applied to optimizethe estimated parameters with theMATLABR2009a software[20]
3 Results and Discussion
During the Chinese rice wine fermentation temperatureplays important role in the reducing sugar ethanol produc-tion and its flavour formation Consequently it is necessaryto study the kinetic of yeast growth and production ofSaccharomyces cerevisiae under various temperatures Theeffect of temperature on ethanol production has been studiedabove 30∘C [25 26] However as the temperature in theChinese rice wine fermentation process is lower than 31∘C itis necessary to explore the effect of temperature under 30∘C
31 Cell Growth at Various Temperatures Saccharomyces cer-evisiae cell growth showed a classical cell growth trend undervarious temperatures (Figure 1) The batch fermentation pro-cess of Chinese rice wine can be separated into differentstagesThefirst stage is the lag phase In this stage the biomassincreased slowly and then the biomass increased faster inthe subsequent exponential growth phase Finally 52 g Lminus1of biomass was attained at 26∘C in the stationary phase Thehighest cell biomass was achieved at 26∘C which is mostsuitable for yeast growth Reducing sugar formation began toform as soon as the fermentation started However ethanolproduction was initiated when the yeast cells reached theexponential phase and cell growth occurred simultaneouslySimilar phenomenon has been reported [25]
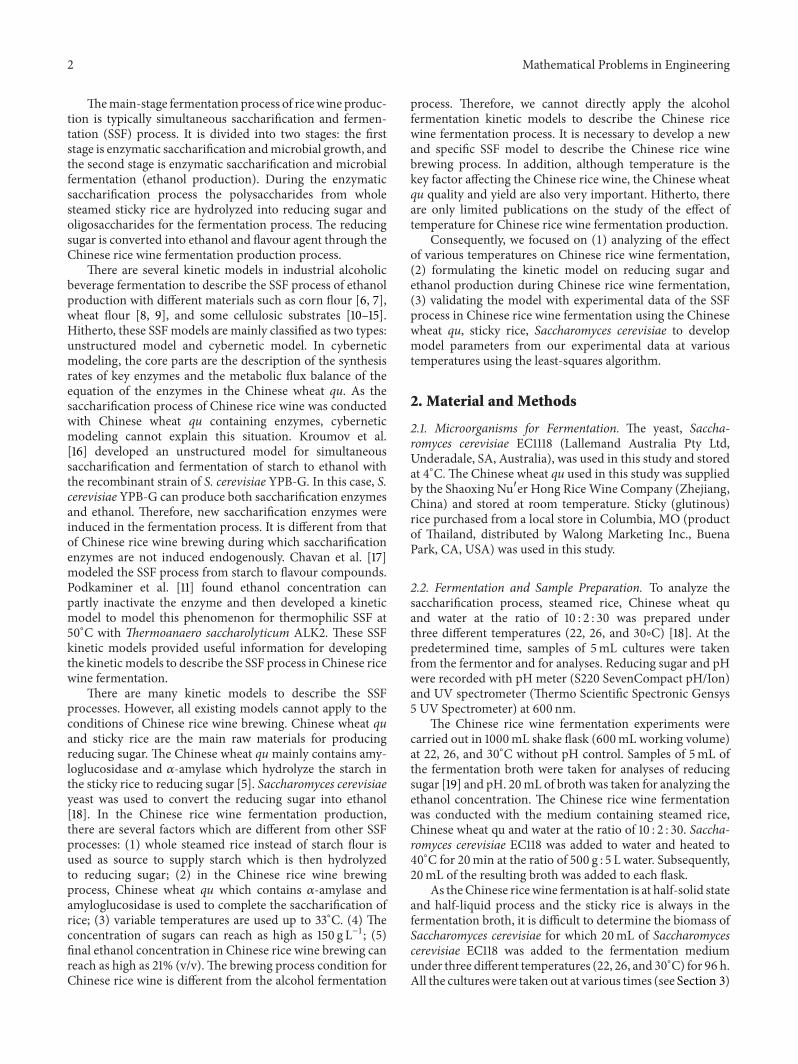
32 Reducing Sugar Formation and Consumption at VariousTemperatures To evaluate the reducing sugar production atvarious temperatures fermentation process only with theChinese wheat qu treatment was performed Figure 2(a)shows that reducing sugar increased with the fermentationtime However the improvement of reducing sugar forma-tion at 30∘C was higher than that at other temperatures
4 Mathematical Problems in Engineering
as well as from 2 h to 25 h Reducing sugar formation declineduntil 60 h Thereafter the reducing sugar concentration wassharply lower It suggested the Aspergillus oryzae fungus inthe Chinese wheat qu also consumed the reducing sugar butdid not affect the Saccharomyces cerevisiae yeast which usedthe reducing sugar to produce ethanol
Figure 2(b) shows the reducing sugar profile under vari-ous temperatures Amaximum reducing sugar concentrationof 140 g Lminus1 was accumulated in the fermentation broth at22 h under 30∘C The profile of the reducing sugar indicatesthat during the initial stage the saccharification rate washigher than the fermentation rate leading to the accumulationof the reducing sugar The yeast was in the lag phase withlower consumption of reducing sugar for cell growth Subse-quently the yeast entered the exponential stage during whichreducing sugar was consumedThemaximum reducing sugarconcentrations in the broth were 130 g Lminus1 130 g Lminus1 and140 g Lminus1 at 22 26 and 30∘C respectivelyThe reducing sugarconcentration reached the peak at 30∘C higher than that at26∘C The reducing sugar concentration that reached peaklevel at 22∘C nearly 10 h later than that at 26 or 30∘C Theseresults suggested that at the saccharification stage (0 to 50 h)higher temperature facilitated reducing sugar formation
High temperature can provide positive effect on thecell biomass growth and ethanol production at first 50 hAfter 50 h low temperature is better for cell maintenanceand enzymatic activity which enhance ethanol productionTherefore ideal rice wine fermentation can be improvedby a two-stage temperature control strategy to increase theethanol production level and reduce organic acid production
33 Ethanol Production and pH at Various TemperaturesEthanol production by Saccharomyces cerevisiae showed atypical trend at various temperature levels (Figure 3(a)) Thehighest cell biomass was achieved at 26∘C However highestethanol production was at 22∘C The levels of ethanol andcell biomass were compared from 0 to 40 h The cell biomassat 30∘C attained the highest level of 6 g Lminus1 The ethanolproduction at 30∘Cat first 50 h is at the highest comparedwithother conditions However the ethanol production at 22∘Cincreased quickly after 50 h and the ethanol concentrationaccumulation at 22∘C reached the highest value of 11 (vv)These results suggest that both ethanol production and cellgrowth were affected by temperature During the first 50 hhigher temperature was suitable for cell growth and ethanolproduction However after 50 h the lower temperature wasbetter for ethanol production Temperature which can affectthe production of ethanol was also observed by other relatedresearches [27 28]
For pH values similar changing profiles were observedat different temperature (Figure 3(b)) which shows that pHdecreased dramatically during the first 40 h under 26 and30∘C conditions It suggests that high temperatures willenhance the organic acid production and will cause pH todrop more quickly than that at low temperatures
0 20 40 60 80 1000
1
2
3
4
5
6
Biom
ass (
gL)
Fermentation time (h)
30∘C
26∘C
22∘C
Figure 1 Kinetic model of SSF process in rice wine fermentation
34 Model Development The system considered by theunstructured model is composed of four main variablesstarch (S) reducing sugar (G) dry cell weight (X) andethanol concentrations (E) The chemical reactions for thisprocess are shown in Figure 4
341 Saccharification of Starch to Reducing Sugar DuringChinese rice wine fermentation the reducing sugar from theenzymatic hydrolyzed starch was used to produce ethanolandor maintain cell growth The net reducing sugar accu-mulation rate is
119889119866
119889119905
= 119903
119891minus 119903
119906
(5)
where 119903119891is reducing sugar formation and 119903
119906is reducing sugar
consumption used for fermentation with Saccharomyces cere-visiae
The Michelis-Menten kinetics including competitiveinhibition of reducing sugar was used to describe the enzy-matic saccharification of starch to reducing sugar in Chineserice wine fermentation process Thus
119903
119904= 119896
1
119878
119896
119898(1 + (119866119896
0)) + 119878
(6)
The assumed model in the saccharification level is basedon the model to describe starch saccharification [16] In thismodel the Saccharomyces cerevisiae EC118 was used forthe fermentation and Chinese wheat qu was used for thesaccharification
Reducing sugar was used to evaluate the sugar con-centration in fermentation broth of rice wine fermentationprocess In this work the reducing sugar was considered asglucose
As for the exact ratio of 120572-amylase and amyloglucosidasein the Chinese wheat qu 120572-amylase and amyloglucosidase
Mathematical Problems in Engineering 5
0 20 40 60 80 1000
40
80
120
160
200
Fermentation time (h)
Redu
cing
suga
r (g
L)
30∘C
26∘C
22∘C
(a)
0 20 40 60 80 1000
20
40
60
80
100
120
140
Fermentation time (h)
Redu
cing
suga
r (g
L)
30∘C
26∘C
22∘C
(b)
Figure 2 Experimental residue reducing sugar curve of the batch fermentation at various temperatures (a) only added Chinese wheat quand (b) added Chinese wheat qu and S cerevisiae
0 20 40 60 80 1000
20
40
60
80
100
Fermentation time (h)
Etha
nol (
gL)
30∘C
26∘C
22∘C
(a)
0 20 40 60 80 10035
40
45
50
55
60
65
70
Fermentation time (h)
pH
30∘C
26∘C
22∘C
(b)
Figure 3 Experimental residue reducing sugar curve of the batch fermentation at various temperatures (a) only added Chinese wheat quand (b) added Chinese wheat qu and S cerevisiae
were considered as a ldquocomplex enzymerdquo For simplification ofthe model the concentration of enzyme was considered asconstant The enzymatic affinity to the starch is independentof enzyme concentration
The mass transfer limitations and conformationalchanges of the enzyme structure were not considered in themodel
Ethanol was considered as the main products otherflavour compounds were not considered in this work
342 Microbial Growth Part of the sugar was consumed bythe cells for growth The specific growth rate of yeast wasdescribed as the Monod equation with substrate inhibitionbelow
120583 = 119896
2
119866
119896
119904+ 119866
(7)
6 Mathematical Problems in Engineering
Enzyme+
starchReducingsugar
Ethanol
Cell growth
Cell maintenance
SSF
Saccharification of starch to reducing sugar
Fermentation of reducing sugar to ethanol
k1
k3
k2
k4
(1)
(2)
Figure 4 Kinetic model of SSF process in rice wine fermentation
The growth rate of yeast cell was assumed to be directlyproportional to the dry cell weight so the growth rate of cellsis written as
119889119883
119889119905
= 120583119883
(8)
where 119883 is the dry cell weight and 119866 is reducing sugarconcentration119870s is the inhibition coefficient
Some of the sugar was consumed by cells for cellularmaintenance The sugar needed was directly proportional tothe dry cell weight It is described in
119903
119898= 119896
3119883 (9)
343 Fermentation of Reducing Sugar to Ethanol Ethanolwas the metabolic product of Saccharomyces cerevisiae fer-mentation Ethanol is assumed to be directly proportionalto the dry cell weight and substrate as well as reducingsugar concentration The effects of the reducing sugar andmetabolic product ethanol inhibitions were considered in thefermentation process from reducing sugar to ethanol Theformation rate of ethanol from reducing sugar is written asfollows
119903
119864= 119896
4
1
(119896
1199041+ 119866)
1
(119896ps1 + 119864 + (1198642
119896pi1))119866119883 (10)
where 1(1198961199041+119866) is the substrate inhibition and 1(119896ps1 +119864+
(119864
2
119896pi1)) is the product inhibition
344 Model of the SSF Process The model of SSF process isdescribed as follows based on (5)ndash(10)
Starch balance
119889119878
119889119905
= minus119896
1
119878
119896
119898(1 + (119866119896
0)) + 119878
(11)
Biomass balance
119889119883
119889119905
= 119896
2
119866
119896
119904+ 119866
119883 (12)
Ethanol balance
119889119864
119889119905
= 119903
119864
(13)
Reducing sugar balance
119889119866
119889119905
= 119903
119891minus 119903
119906
(14)
where
119903
119891= 111119896
1
119878
119896
119898(1 + (119866119896
0)) + 119878
(15)
119903
119906=
1
119884
119909119904
119889119883
119889119905
+ 119903
119898+
1
119884
119901119904
119889119864
119889119905
(16)
345 SolvingModel Since the kinematic model of the SSF inricewine fermentation is nonlinear therefore only numericalsolution is available but not analytical solution In this workthe Runge-Kutta method was used to get the numericalsolution for themodelThe initial conditionwas set as 119909
0 and
119909
119894was achieved as numerical solution by recursive relation
equation
119909
119894+1119895= 119909
119894119895+
1
6
(119887
1119895+ 2119887
2119895+ 2119887
3119895+ 119887
4119895) + 119874 (ℎ
5
)
119887
1119895= ℎ119891
119895(119905
119894 119909
1198941 119909
1198942 119909
119894119899)
119887
2119895= ℎ119891
119895(119905
119894+
ℎ
2
119909
1198941+
119887
11
2
119909
1198942+
119887
12
2
119909
119894119899+
119887
1119899
2
)
119887
3119895= ℎ119891
119895(119905
119894+
ℎ
2
119909
1198941+
119887
21
2
119909
1198942+
119887
22
2
119909
119894119899+
119887
2119899
2
)
119887
4119895= ℎ119891
119895(119905
119894+ ℎ 119909
1198941+ 119887
31 119909
1198941+ 119887
32 119909
119894119899+ 119887
3119899)
(13
1015840
)
35 Validating and Estimating Parameters of UnstructuredModel for Chinese Rice Wine Fermentation Several modelsand parameters related to only starch hydrolysis have beenconstructed and evaluated with 120572-amylase [29] and amy-loglucosidase [30] However no study on the effect of varioustemperatures on ethanol fermentation was undertaken withtheir models Therefore it is interesting to analyze the effectof a series of temperatures on ethanol production To acquirekinetic parameters of the kinetic model for Chinese rice winefermentation under various temperatures the simulated Chi-nese rice wine fermentation process at different temperaturesin a scale-down level was done considering the temperaturein Chinese rice wine brewing was controlled below 33∘CAccordingly 22 26 and 30∘C were chosen and controlled forthe simulated Chinese rice wine fermentation The data andsimulation are shown in Figures 5(a) 5(b) and 5(d)The dataare presented in data points and simulation is presented withsolid lines for reducing sugar (G) biomass (X) and ethanol(E) respectively
All the optimized parameters were calculated and fittedthe modeling data with the experimental data at 22 26 and30∘C The R-square value was used to evaluate the modelfitting The 1198772 value more close to 1 the model fitting isconsidered to be better The R-square values of the modelunder different temperatures which are calculated by1198772 = 1minus
Mathematical Problems in Engineering 7
0 20 40 60 80 1000
1
2
3
4
5
6
Fermentation time (h)
Biom
ass (
gL)
30∘C
30∘C
26∘C 26
∘C22
∘C
22∘C
(a)
0
20
40
60
80
100
Etha
nol (
gL)
0 20 40 60 80 100Fermentation time (h)
30∘C
30∘C
26∘C 26
∘C22
∘C
22∘C
(b)
0
50
100
150
200
250
Star
ch (g
L)
0 20 40 60 80 100Fermentation time (h)
30∘C
26∘C
22∘C
(c)
20
40
60
80
100
120
140
Redu
cing
suga
r (g
L)
30∘C
30∘C
26∘C 26
∘C22
∘C
22∘C
0020 40 60 80 100
Fermentation time (h)
(d)
Figure 5 Experimental data and simulated data for batch experiments at 22 26 and 30∘C (a) Cell mass concentration (b) Ethanolconcentration (c) Starch concentration (d) Reducing sugar concentration
Table 1 R-square value for the model
State varible Temperature22∘C 26∘C 30∘C
Reducing Sugar 096 097 095Cell mass 098 099 098Ethanol 099 099 099
(sum(119909
119894minus 119909
119894)
2
sum(119909
119894minus 119909
119894)
2
) are shown as Table 1 The R-squarevalues of reducing sugar are 096 at 22∘C 097 at 26∘C and
095 at 30∘C respectively The R-square values of cell massunder the temperatures from 22 to 30∘C are 099 098 and099 respectively The R-square values of ethanol are all 099at all three different temperatures The plot figures (Figure 5)and R-square values show that the model fit the data verywell The model thus is very useful to describe the Chineserice wine fermentation process
The kinetic parameters at all temperatures are shownin Table 2 The maximum rate of saccharification (119896
1) was
increased from 6772 g Lminus1 hminus1 at 22∘C to 7721 g Lminus1 hminus1 at30∘C with the temperature increasing Maximum specific
8 Mathematical Problems in Engineering
Table 2 Kinetic and stoichiometric parameters values and initial conditions of the model
Evaluated parameter Temperature22∘C 26∘C 30∘C Units
119896
1
6772 7099 7721 g Lminus1 hminus1
119896
2
0110 0120 0127 g Lminus1 hminus1
119896
3
0001 0001 0001 hminus1
119896
4
99399 105383 135393 g Lminus1 hminus1
119896
119898
31856 31809 32436 g Lminus1
119896
0
139959 139964 139887 g Lminus1 hminus1
119884
119909119904
0894 0882 0651 g gminus1
119896
119904
116533 104533 104596 g Lminus1
119884
119901119904
0254 0244 0257 g gminus1
119896
1199041
60984 60984 61344 g Lminus1
119896ps1 56256 56287 56176 g Lminus1
119896pi1 170778 170779 170756 g Lminus1
growth rate (1198962) was increased from 0110 at 22∘C to 0127
at 30∘C Consumption coefficient for cell maintenance (1198963)
contains the same value 0001 hminus1 under various tempera-tures The maximum ethanol production rate (119896
4) increased
from 99399 g Lminus1 hminus1 at 22∘C to 135393 at 30∘C also Glu-cose inhibition constant for saccharification (119896
0) saturation
growth constant (1198961199041) substrate growth inhibition constant
(119896ps1) substrate production inhibition term (119896pi1) and yieldcoefficient of product (119884
119901119904) all only have little fluctuation
under various temperatures However the yield coefficient ofcell growth (119884
119909119904) was decreased from 0894 g gminus1 at 22∘C to
0651 g gminus1 at 30∘CThe model of biomass is quite accurate and there was no
drastic mismatch between the experimental and simulationdata (Figure 5(a)) The effect of intermediate products ofreducing sugar from starch hydrolysis on cell growth andethanol production can be very significant The Chineserice wine fermentation is a typical SSF process in whichat the initial stage the reducing sugar concentration is lowbut the starch concentration is higher In this model totalreducing sugar was used as sugar contents The computa-tion model for reducing sugar concentration and ethanolproduction fits very well to the profile of experimental data(Figures 5(b) and 5(d)) It is to be noted that the computationmodel for ethanol production cannot fit very well at 22∘Cfrom 0 to 60 h (Figure 5(b))The utilization of glucose at 22∘Cis lower than the other conditions but the glucose formationis similar to the other conditions and ethanol concentrationreached the highest value The pH values at low temperaturewere higher than that at high temperature (Figure 3(b))because organic acid produced more at higher temperaturein the fermentation broth All the results suggested that hightemperature enhanced glucose to produce organic acid butnot ethanol
In addition high temperature can increase the valuesof maximum rate of saccharification maximum specificgrowth rate and maximum ethanol production rate How-ever yield coefficient for cell growth and saturation growth
constant are decreased with the temperature increasingIt is to be noted that the parameters values of yieldcoefficient of product saturation growth constant sub-strate growth inhibition constant and substrate produc-tion inhibition term cannot be affected apparently by thetemperature
Overall exploring the fermentation process providesvery useful information for industrial ethanol fermentationto reduce power consumption and increases productionAt present kinetic modeling is an indispensable step inexploring and developing a better fermentation process sincethe models can be used to determine an optimal operationalcondition for the production of a target metabolite Howeveran unstructured kinetic model to study the temperatureon ethanol production in Chinese rice wine fermentationis still not available until now Therefore our new modelsuitable for ricewine fermentation and analysis of the effect oftemperatures on ethanol production contributes significantlyto the improvement of the industrial production process forChinese rice wine
4 Conclusion
SSF is an essential industrial technology for converting biore-sources into useful products such as lactic acid and ethanol[31ndash35] As ethanol can be used as biofuel producing ethanolfrom bioresource is becoming very important bioprocess toresolve the energy crisis [36 37] and several models havebeen developed to describe the SSF process from wood cornflower and starch [38 39] The SSF process uses whole riceand Chinese wheat qu which contains mostly 120572-amylase andamyloglucosidase to produce reducing sugar and ethanolwith Saccharomyces cerevisiae Additionally ethanol produc-tion achieved as high as 21 (vv) compared to only 11concentration in industrial ethanol fermentation Further-more the temperature is limited to below 31∘C [18 40] inthis process Consequently exploring the fermentation pro-cess provides very useful information for industrial ethanol
Mathematical Problems in Engineering 9
fermentation to reduce power consumption and increasesproduction At present kinetic modeling is an indispensablestep in exploring and developing a better fermentationprocess since the models can be used to determine anoptimal operational condition for the production of a targetmetabolite However an unstructured kinetic model to studythe temperature on ethanol production in Chinese rice winefermentation is still not available until now Therefore ournewmodel suitable for rice wine fermentation and analysis ofthe effect of temperatures on ethanol production contributessignificantly to the improvement of the industrial productionprocess for Chinese rice wine
Nomenclature
S Starch concentration (g Lminus1)G Reducing sugar concentration (g Lminus1)X Biomass concentration (g Lminus1)E Ethanol concentration (g Lminus1)120583 Specific growth rate of yeast (hminus1)119903
119898 Consumption rate for cell maintenance
(g Lminus1 hminus1)119903
119864 Formation rate of ethanol from reducing
sugar (g Lminus1 hminus1)119903
119891 Reducing sugar formation rate (g Lminus1 hminus1)
119903
119906 Reducing sugar utilization rate (g Lminus1 hminus1)
119896
1 Maximum rate of saccharification
(g Lminus1 hminus1)119896
2 Maximum specific growth rate (g Lminus1 hminus1)
119896
3 Consumption coefficient for cell
maintenance (per h)119896
4 Maximum of ethanol production rate
(g Lminus1 hminus1)119884
119901119904 Yield coefficient of product (g gminus1)
119884
119909119904 Yield coefficient of cell growth (g gminus1)
119896
0 Glucose inhibition constant for
saccharification (g Lminus1)119896
119898 Inhibition constant for saccharification
(g Lminus1)119896
119904 Saturation growth constant (g Lminus1)
119896
119864 Ethanol inhibition constant (g Lminus1)
119896s1 Saturation growth constant (g Lminus1)119896ps1 Substrate growth inhibition constant
(g Lminus1)119896pi1 Substrate production inhibition term
(g Lminus1)
Conflict of Interests
The authors declare that they have no conflict of interestsregarding the publication of this paper
Acknowledgments
The authors thank Drs Feng Ding Ya Guo Ti Zhang and RuDai and Ms Connie Liu and Mr Lakdas Fernando for their
technical assistance Shaoxing Nverhong Rice Wine Com-pany is acknowledged for thematerial supportThis workwassupported in part by National Science Foundation of China(21276111 and 21206053) Zhejiang Science and TechnologyProject (2011C12033) 111 Project (B12018) China ScholarshipCouncil (no 2010679023) and Jiangnan University PhDResearch Fund (no JUDCF10062)
References
[1] V Lavric I D Ofiteru and A Woinaroschy ldquoContinuoushybridoma bioreactor sensitivity analysis and optimal controlrdquoBiotechnology andApplied Biochemistry vol 44 no 2 pp 81ndash922006
[2] D A Gee andW F Ramirez ldquoOptimal temperature control forbatch beer fermentationrdquoBiotechnology and Bioengineering vol31 no 3 pp 224ndash234 1988
[3] M Kawohl T Heine and R King ldquoModel based estimationand optimal control of fed-batch fermentation processes for theproduction of antibioticsrdquoChemical Engineering and ProcessingProcess Intensification vol 46 no 11 pp 1223ndash1241 2007
[4] L Yu FDing andHYe ldquoAnalysis of characteristic flavour com-pounds in Chinese rice wines and representative fungi in wheatQu samples from different regionsrdquo Journal of the Institute ofBrewing vol 118 no 1 pp 114ndash119 2012
[5] X Mo Y Xu and W Fan ldquoCharacterization of aroma com-pounds in Chinese rice wineQu by solvent-assisted flavor evap-oration and headspace solid-phase microextractionrdquo Journal ofAgricultural and Food Chemistry vol 58 no 4 pp 2462ndash24692010
[6] G S Murthy D B Johnston K D Rausch M E Tumblesonand V Singh ldquoA simultaneous saccharification and fermenta-tion model for dynamic growth environmentsrdquo Bioprocess andBiosystems Engineering vol 35 no 4 pp 519ndash534 2012
[7] D K Apar and B Ozbek ldquo120572-Amylase inactivation by tempera-ture during starch hydrolysisrdquo Process Biochemistry vol 39 no9 pp 1137ndash1144 2004
[8] C Akerberg K Hofvendahl B Hahn-Hagerdal and G ZacchildquoModelling the influence of pH temperature glucose and lacticacid concentrations on the kinetics of lactic acid production byLactococcus lactis ssp lactis ATCC 19435 in whole-wheat flourrdquoApplied Microbiology and Biotechnology vol 49 no 6 pp 682ndash690 1998
[9] K Manikandan and T Viruthagiri ldquoSimultaneous sacchari-fication and fermentation of wheat bran flour into ethanolusing coculture of amyloticAspergillus niger and thermotolerantKluyveromycesmarxianusrdquo Frontiers of Chemical Engineering inChina vol 3 no 3 pp 240ndash249 2009
[10] J M van Zyl E van Rensburg W H van Zyl T M Harms andL R Lynd ldquoA kinetic model for simultaneous saccharificationand fermentation of avicel with Saccharomyces cerevisiaerdquoBiotechnology and Bioengineering vol 108 no 4 pp 924ndash9332011
[11] K K Podkaminer X Shao D A Hogsett and L R Lynd ldquoEnz-yme inactivation by ethanol and development of a kineticmodelfor thermophilic simultaneous saccharification and fermen-tation at 50∘C with Thermoanaerobacterium saccharolyticumALK2rdquo Biotechnology and Bioengineering vol 108 no 6 pp1268ndash1278 2011
10 Mathematical Problems in Engineering
[12] C J A de Souza D A Costa M Q R B Rodrigues et al ldquoTheinfluence of presaccharification fermentation temperature andyeast strain on ethanol production from sugarcane bagasserdquoBioresource Technology vol 109 pp 63ndash69 2012
[13] A M Badawi A A Fahmy K A Mohamed M R Noor El-Din and M G Riad ldquoEnhancement of ethanol production bysimultaneous saccharification and fermentation (SSF) of ricestraw using ethoxylated span 20rdquo Preparative Biochemistry andBiotechnology vol 42 no 1 pp 44ndash59 2012
[14] B C Saha N N Nichols N Qureshi and M A Cotta ldquoCom-parison of separate hydrolysis and fermentation and simulta-neous saccharification and fermentation processes for ethanolproduction from wheat straw by recombinant Escherichia colistrain FBR5rdquo Applied Microbiology and Biotechnology vol 92no 4 pp 865ndash874 2011
[15] J Shen and F A Agblevor ldquoThe operable modeling of simulta-neous saccharification and fermentation of ethanol productionfrom celluloserdquo Applied Biochemistry and Biotechnology vol160 no 3 pp 665ndash681 2010
[16] A D Kroumov A NModenes andM C D A Tait ldquoDevelop-ment of new unstructured model for simultaneous saccharifi-cation and fermentation of starch to ethanol by recombinantstrainrdquo Biochemical Engineering Journal vol 28 no 3 pp 243ndash255 2006
[17] A R Chavan A Raghunathan and K V Venkatesh ldquoModelingand experimental studies on intermittent starch feeding andcitrate addition in simultaneous saccharification and fermen-tation of starch to flavor compoundsrdquo Journal of IndustrialMicrobiology and Biotechnology vol 36 no 4 pp 509ndash5192009
[18] Y Xu D Wang W Fan X Mu and J Chen ldquoTranditional Chi-nese biotechnologyrdquo in Biotechnology in China II ChemicalsEnergy and Environment G T Tsao P Ouyang and J ChenEds vol 122 Springer Berlin Germany 2010
[19] G L Miller ldquoUse of dinitrosalicylic acid reagent for determina-tion of reducing sugarrdquo Analytical Chemistry vol 31 no 3 pp426ndash428 1959
[20] A Constantinides and N Mostoufi Numerical Methods forChemical Engineers with MATLAB Applications Prentice HallUpper Saddle River NJ USA 1999
[21] N Rajagopalan C Mala M Sridevi and R H PrasathldquoOptimized channel allocation using genetic algorithm andartificial neural networksrdquo in Proceedings of the InternationalConference on Soft Computing for Problem Solving (SocProS rsquo11)pp 645ndash655 Springer 2011
[22] J C M Pires B Goncalves F G Azevedo et al ldquoOptimizationof artificial neural network models through genetic algorithmsfor surface ozone concentration forecastingrdquo EnvironmentalScience and Pollution Research vol 19 no 8 pp 3228ndash32342012
[23] Y Guo and J Tan ldquoA kinetic model structure for delayed fluore-scence from plantsrdquo BioSystems vol 95 no 2 pp 98ndash103 2009
[24] YGuo and J Tan ldquoModeling and simulation of the initial phasesof chlorophyll fluorescence from Photosystem IIrdquo BioSystemsvol 103 no 2 pp 152ndash157 2011
[25] M Phisalaphong N Srirattana and W TanthapanichakoonldquoMathematical modeling to investigate temperature effect onkinetic parameters of ethanol fermentationrdquo Biochemical Engi-neering Journal vol 28 no 1 pp 36ndash43 2006
[26] E C Rivera A C Costa D I P Atala F Maugeri M R WMaciel and RM Filho ldquoEvaluation of optimization techniquesfor parameter estimation application to ethanol fermentationconsidering the effect of temperaturerdquo Process Biochemistry vol41 no 7 pp 1682ndash1687 2006
[27] D B Hughes N J Tudroszen and C J Moye ldquoThe effect oftemperature on the kinetics of ethanol production by a ther-motolerant strain of Kluveromyces marxianusrdquo BiotechnologyLetters vol 6 no 1 pp 1ndash6 1984
[28] M L Cazetta M A P C Celligoi J B Buzato and I S Scar-mino ldquoFermentation ofmolasses byZymomonasmobilis effectsof temperature and sugar concentration on ethanol productionrdquoBioresource Technology vol 98 no 15 pp 2824ndash2828 2007
[29] D W S Wong G H Robertson C C Lee and K WagschalldquoSynergistic action of recombinant120572-amylase and glucoamylaseon the hydrolysis of starch granulesrdquo Protein Journal vol 26 no3 pp 159ndash164 2007
[30] H Tatsumi and H Katano ldquoKinetics of the surface hydrolysisof raw starch by glucoamylaserdquo Journal of Agricultural and FoodChemistry vol 53 no 21 pp 8123ndash8127 2005
[31] A B M S Hossain A A Saleh S Aishah A N Boyce P PChowdhury and M Naqiuddin ldquoBioethanol production fromagricultural waste biomass as a renewable bioenergy resourcein biomaterialsrdquo in Proceedings of the 4th Kuala LumpurInternational Conference on Biomedical Engineering (Biomedrsquo08) pp 300ndash305 Springer June 2008
[32] Y Koike M-Z An Y-Q Tang et al ldquoProduction of fuelethanol andmethane from garbage by high-efficiency two-stagefermentation processrdquo Journal of Bioscience and Bioengineeringvol 108 no 6 pp 508ndash512 2009
[33] Y S Hong and H H Yoon ldquoEthanol production from foodresiduesrdquo Biomass and Bioenergy vol 35 no 7 pp 3271ndash32752011
[34] Y Lin and S Tanaka ldquoEthanol fermentation from biomassresources current state and prospectsrdquo Applied Microbiologyand Biotechnology vol 69 no 6 pp 627ndash642 2006
[35] R A Davis ldquoParameter estimation for simultaneous saccharifi-cation and fermentation of foodwaste into ethanol usingMatlabSimulinkrdquo Applied Biochemistry and Biotechnology vol 147 no1ndash3 pp 11ndash21 2008
[36] A Demirbas and G Arin ldquoAn overview of biomass pyrolysisrdquoEnergy Sources vol 24 no 5 pp 471ndash482 2002
[37] M F Demirbas and M Balat ldquoRecent advances on the produc-tion and utilization trends of bio-fuels a global perspectiverdquoEnergy Conversion andManagement vol 47 no 15-16 pp 2371ndash2381 2006
[38] P O Petterson R Eklund and G Zacchi ldquoModeling simulta-neous saccharification and fermentation of softwoodrdquo AppliedBiochemistry and Biotechnology A Enzyme Engineering andBiotechnology vol 98ndash100 pp 733ndash746 2002
[39] K Ohgren R Bura G Lesnicki J Saddler and G ZacchildquoA comparison between simultaneous saccharification andfermentation and separate hydrolysis and fermentation usingsteam-pretreated corn stoverrdquo Process Biochemistry vol 42 no5 pp 834ndash839 2007
[40] X Mo W Fan and Y Xu ldquoChanges in volatile compounds ofChinese rice wine wheat Qu during fermentation and storagerdquoJournal of the Institute of Brewing vol 115 no 4 pp 300ndash3072009
Submit your manuscripts athttpwwwhindawicom
Hindawi Publishing Corporationhttpwwwhindawicom Volume 2014
MathematicsJournal of
Hindawi Publishing Corporationhttpwwwhindawicom Volume 2014
Mathematical Problems in Engineering
Hindawi Publishing Corporationhttpwwwhindawicom
Differential EquationsInternational Journal of
Volume 2014
Applied MathematicsJournal of
Hindawi Publishing Corporationhttpwwwhindawicom Volume 2014
Probability and StatisticsHindawi Publishing Corporationhttpwwwhindawicom Volume 2014
Journal of
Hindawi Publishing Corporationhttpwwwhindawicom Volume 2014
Mathematical PhysicsAdvances in
Complex AnalysisJournal of
Hindawi Publishing Corporationhttpwwwhindawicom Volume 2014
OptimizationJournal of
Hindawi Publishing Corporationhttpwwwhindawicom Volume 2014
CombinatoricsHindawi Publishing Corporationhttpwwwhindawicom Volume 2014
International Journal of
Hindawi Publishing Corporationhttpwwwhindawicom Volume 2014
Operations ResearchAdvances in
Journal of
Hindawi Publishing Corporationhttpwwwhindawicom Volume 2014
Function Spaces
Abstract and Applied AnalysisHindawi Publishing Corporationhttpwwwhindawicom Volume 2014
International Journal of Mathematics and Mathematical Sciences
Hindawi Publishing Corporationhttpwwwhindawicom Volume 2014
The Scientific World JournalHindawi Publishing Corporation httpwwwhindawicom Volume 2014
Hindawi Publishing Corporationhttpwwwhindawicom Volume 2014
Algebra
Discrete Dynamics in Nature and Society
Hindawi Publishing Corporationhttpwwwhindawicom Volume 2014
Hindawi Publishing Corporationhttpwwwhindawicom Volume 2014
Decision SciencesAdvances in
Discrete MathematicsJournal of
Hindawi Publishing Corporationhttpwwwhindawicom
Volume 2014 Hindawi Publishing Corporationhttpwwwhindawicom Volume 2014
Stochastic AnalysisInternational Journal of
2 Mathematical Problems in Engineering
Themain-stage fermentation process of ricewine produc-tion is typically simultaneous saccharification and fermen-tation (SSF) process It is divided into two stages the firststage is enzymatic saccharification andmicrobial growth andthe second stage is enzymatic saccharification and microbialfermentation (ethanol production) During the enzymaticsaccharification process the polysaccharides from wholesteamed sticky rice are hydrolyzed into reducing sugar andoligosaccharides for the fermentation process The reducingsugar is converted into ethanol and flavour agent through theChinese rice wine fermentation production process
There are several kinetic models in industrial alcoholicbeverage fermentation to describe the SSF process of ethanolproduction with different materials such as corn flour [6 7]wheat flour [8 9] and some cellulosic substrates [10ndash15]Hitherto these SSF models are mainly classified as two typesunstructured model and cybernetic model In cyberneticmodeling the core parts are the description of the synthesisrates of key enzymes and the metabolic flux balance of theequation of the enzymes in the Chinese wheat qu As thesaccharification process of Chinese rice wine was conductedwith Chinese wheat qu containing enzymes cyberneticmodeling cannot explain this situation Kroumov et al[16] developed an unstructured model for simultaneoussaccharification and fermentation of starch to ethanol withthe recombinant strain of S cerevisiae YPB-G In this case Scerevisiae YPB-G can produce both saccharification enzymesand ethanol Therefore new saccharification enzymes wereinduced in the fermentation process It is different from thatof Chinese rice wine brewing during which saccharificationenzymes are not induced endogenously Chavan et al [17]modeled the SSF process from starch to flavour compoundsPodkaminer et al [11] found ethanol concentration canpartly inactivate the enzyme and then developed a kineticmodel to model this phenomenon for thermophilic SSF at50∘C with Thermoanaero saccharolyticum ALK2 These SSFkinetic models provided useful information for developingthe kinetic models to describe the SSF process in Chinese ricewine fermentation
There are many kinetic models to describe the SSFprocesses However all existing models cannot apply to theconditions of Chinese rice wine brewing Chinese wheat quand sticky rice are the main raw materials for producingreducing sugar The Chinese wheat qumainly contains amy-loglucosidase and 120572-amylase which hydrolyze the starch inthe sticky rice to reducing sugar [5] Saccharomyces cerevisiaeyeast was used to convert the reducing sugar into ethanol[18] In the Chinese rice wine fermentation productionthere are several factors which are different from other SSFprocesses (1) whole steamed rice instead of starch flour isused as source to supply starch which is then hydrolyzedto reducing sugar (2) in the Chinese rice wine brewingprocess Chinese wheat qu which contains 120572-amylase andamyloglucosidase is used to complete the saccharification ofrice (3) variable temperatures are used up to 33∘C (4) Theconcentration of sugars can reach as high as 150 g Lminus1 (5)final ethanol concentration in Chinese rice wine brewing canreach as high as 21 (vv)The brewing process condition forChinese rice wine is different from the alcohol fermentation
process Therefore we cannot directly apply the alcoholfermentation kinetic models to describe the Chinese ricewine fermentation process It is necessary to develop a newand specific SSF model to describe the Chinese rice winebrewing process In addition although temperature is thekey factor affecting the Chinese rice wine the Chinese wheatqu quality and yield are also very important Hitherto thereare only limited publications on the study of the effect oftemperature for Chinese rice wine fermentation production
Consequently we focused on (1) analyzing of the effectof various temperatures on Chinese rice wine fermentation(2) formulating the kinetic model on reducing sugar andethanol production during Chinese rice wine fermentation(3) validating the model with experimental data of the SSFprocess in Chinese rice wine fermentation using the Chinesewheat qu sticky rice Saccharomyces cerevisiae to developmodel parameters from our experimental data at varioustemperatures using the least-squares algorithm
2 Material and Methods
21 Microorganisms for Fermentation The yeast Saccha-romyces cerevisiae EC1118 (Lallemand Australia Pty LtdUnderadale SA Australia) was used in this study and storedat 4∘CThe Chinese wheat qu used in this study was suppliedby the Shaoxing Nu1015840er Hong RiceWine Company (ZhejiangChina) and stored at room temperature Sticky (glutinous)rice purchased from a local store in Columbia MO (productof Thailand distributed by Walong Marketing Inc BuenaPark CA USA) was used in this study
22 Fermentation and Sample Preparation To analyze thesaccharification process steamed rice Chinese wheat quand water at the ratio of 10 2 30 was prepared underthree different temperatures (22 26 and 30∘C) [18] At thepredetermined time samples of 5mL cultures were takenfrom the fermentor and for analyses Reducing sugar and pHwere recorded with pH meter (S220 SevenCompact pHIon)and UV spectrometer (Thermo Scientific Spectronic Gensys5 UV Spectrometer) at 600 nm
The Chinese rice wine fermentation experiments werecarried out in 1000mL shake flask (600mL working volume)at 22 26 and 30∘C without pH control Samples of 5mL ofthe fermentation broth were taken for analyses of reducingsugar [19] and pH 20mL of broth was taken for analyzing theethanol concentration The Chinese rice wine fermentationwas conducted with the medium containing steamed riceChinese wheat qu and water at the ratio of 10 2 30 Saccha-romyces cerevisiae EC118 was added to water and heated to40∘C for 20min at the ratio of 500 g 5 L water Subsequently20mL of the resulting broth was added to each flask
As theChinese ricewine fermentation is at half-solid stateand half-liquid process and the sticky rice is always in thefermentation broth it is difficult to determine the biomass ofSaccharomyces cerevisiae for which 20mL of Saccharomycescerevisiae EC118 was added to the fermentation mediumunder three different temperatures (22 26 and 30∘C) for 96 hAll the cultureswere taken out at various times (see Section 3)
Mathematical Problems in Engineering 3
andwere analyzed in the following sectionThismediumonlycontains glucose with concentration at 150 g Lminus1
23 Analytical Methods
231 Determination of Biomass For biomass determination5mL of fermentation mash was taken out and centrifuged at6000 g for 4min The cells were suspended in 5mL distilledwaterThe optical density was determined at 600 nmwith theUV spectrometer If the OD
600is above 1 the sample was
diluted and then tested until the DO600
is less than 1 Drycell weight (X) was determined with cell pellet dried at 80∘Cin an oven for 48 h The standard curve of cell biomass wasobtained as below based on the linear relation of OD value(y) and dry cell weight (X)
119883 = 0668119910 minus 00062 (119877
2
= 0996) (1)
where X is dry cell weight and g Lminus1 OD600
is optical densityat 600 nm
232 Determination of the Quantity of Reducing Sugar inthe ChineseWine Fermentation Broth For the determinationof the reducing sugar (G) concentration the fermentationbroth was taken and centrifuged and then 20120583L was dilutedto 2mL with distilled water and mixed with 15mL 35-dinitrosalic acid reagent [19] After it was heated to 100∘C for10min samples were diluted to 25mL and then determinedwith UV spectrometer at 520 nm The standard curve ofreducing sugar was obtained as described below based on thelinear relation of OD
520value (z) and reducing sugar (G)
119866 = 07294119911 + 00344 (119877
2
= 0999) (2)
where G is reducing sugar concentration g Lminus1 OD520
isoptical density at 520 nm from UV spectrometer
233 Determination of the Concentration of Ethanol Anebulliometer (Napa CA USA) was used to determinethe alcohol content in the Chinese rice wine (httpwwwdujardin-salleroncomsocieteindexphplangue=2)The test is based on the difference between the boiling pointsof water and wineThe procedure is as follows (1) determinethe boiling point of water (2) dilute the wine sample so thatthe boiling point of the diluted wine is within 4∘C of theboiling point of water (3) calculate the concentration of thewine with the standards value indicated by the instrument
24 Curve Fitting and Parameter Identification ProcedureBased on model there are 12 parameters which need tobe estimated with data from the experiments under vari-ous temperatures in this work They are 119896
1 119896
2 119896
3 119896
4 119884
119909119904
119884
119901119904 119896
0 119896
119904 119896
1199041 119896ps1 119896pi1 119896119898 They can be expressed with the
following equation
119862 = 119891 (119896
1 119896
2 119896
3 119896
4 119884
119909119904 119884
119901119904 119896
0 119896
119904 119896s1 119896ps1 119896pi1 119896119898)
(3)
To obtain an ideal kinetic model the optimization andreoptimization steps of the identification procedures were
performed using the Levenberg-Marquardt method and thefourth-order Runge-KuttamethodThe objective function (e)was used
119890 = sum
119894
(119883
119894minus
119883
119894)
2
119883
2
119894
+sum
119894
(119864
119894minus
119864
119894)
2
119864
2
119894
+sum
119894
(119866
119894minus
119866
119894)
2
119866
2
119894
(4)
where 119883119894 119864119894 119866119894are the experimental values of the dry cell
weight biomass ethanol and reducing sugar respectivelyOn the contrary 119883
119894 119864119894 and
119866
119894are the values predicted
by the model Parameters estimate and identification of themodel were realized through minimizing 119890 value of (4)The nonlinear regression analysis in accordance with theLevenberg-Marquardt method [20] was used to minimizethe objective function (e) which has been successfully usedin the optimization parameters in the other kinetic models[21ndash24] The model was solved by using the fourth-orderRunge-Kutta method ode 45 with the MATLAB R2009asoftware Both the fourth-order Runge-Kuttamethod and theLevenberg-Marquardt method were also applied to optimizethe estimated parameters with theMATLABR2009a software[20]
3 Results and Discussion
During the Chinese rice wine fermentation temperatureplays important role in the reducing sugar ethanol produc-tion and its flavour formation Consequently it is necessaryto study the kinetic of yeast growth and production ofSaccharomyces cerevisiae under various temperatures Theeffect of temperature on ethanol production has been studiedabove 30∘C [25 26] However as the temperature in theChinese rice wine fermentation process is lower than 31∘C itis necessary to explore the effect of temperature under 30∘C
31 Cell Growth at Various Temperatures Saccharomyces cer-evisiae cell growth showed a classical cell growth trend undervarious temperatures (Figure 1) The batch fermentation pro-cess of Chinese rice wine can be separated into differentstagesThefirst stage is the lag phase In this stage the biomassincreased slowly and then the biomass increased faster inthe subsequent exponential growth phase Finally 52 g Lminus1of biomass was attained at 26∘C in the stationary phase Thehighest cell biomass was achieved at 26∘C which is mostsuitable for yeast growth Reducing sugar formation began toform as soon as the fermentation started However ethanolproduction was initiated when the yeast cells reached theexponential phase and cell growth occurred simultaneouslySimilar phenomenon has been reported [25]
32 Reducing Sugar Formation and Consumption at VariousTemperatures To evaluate the reducing sugar production atvarious temperatures fermentation process only with theChinese wheat qu treatment was performed Figure 2(a)shows that reducing sugar increased with the fermentationtime However the improvement of reducing sugar forma-tion at 30∘C was higher than that at other temperatures
4 Mathematical Problems in Engineering
as well as from 2 h to 25 h Reducing sugar formation declineduntil 60 h Thereafter the reducing sugar concentration wassharply lower It suggested the Aspergillus oryzae fungus inthe Chinese wheat qu also consumed the reducing sugar butdid not affect the Saccharomyces cerevisiae yeast which usedthe reducing sugar to produce ethanol
Figure 2(b) shows the reducing sugar profile under vari-ous temperatures Amaximum reducing sugar concentrationof 140 g Lminus1 was accumulated in the fermentation broth at22 h under 30∘C The profile of the reducing sugar indicatesthat during the initial stage the saccharification rate washigher than the fermentation rate leading to the accumulationof the reducing sugar The yeast was in the lag phase withlower consumption of reducing sugar for cell growth Subse-quently the yeast entered the exponential stage during whichreducing sugar was consumedThemaximum reducing sugarconcentrations in the broth were 130 g Lminus1 130 g Lminus1 and140 g Lminus1 at 22 26 and 30∘C respectivelyThe reducing sugarconcentration reached the peak at 30∘C higher than that at26∘C The reducing sugar concentration that reached peaklevel at 22∘C nearly 10 h later than that at 26 or 30∘C Theseresults suggested that at the saccharification stage (0 to 50 h)higher temperature facilitated reducing sugar formation
High temperature can provide positive effect on thecell biomass growth and ethanol production at first 50 hAfter 50 h low temperature is better for cell maintenanceand enzymatic activity which enhance ethanol productionTherefore ideal rice wine fermentation can be improvedby a two-stage temperature control strategy to increase theethanol production level and reduce organic acid production
33 Ethanol Production and pH at Various TemperaturesEthanol production by Saccharomyces cerevisiae showed atypical trend at various temperature levels (Figure 3(a)) Thehighest cell biomass was achieved at 26∘C However highestethanol production was at 22∘C The levels of ethanol andcell biomass were compared from 0 to 40 h The cell biomassat 30∘C attained the highest level of 6 g Lminus1 The ethanolproduction at 30∘Cat first 50 h is at the highest comparedwithother conditions However the ethanol production at 22∘Cincreased quickly after 50 h and the ethanol concentrationaccumulation at 22∘C reached the highest value of 11 (vv)These results suggest that both ethanol production and cellgrowth were affected by temperature During the first 50 hhigher temperature was suitable for cell growth and ethanolproduction However after 50 h the lower temperature wasbetter for ethanol production Temperature which can affectthe production of ethanol was also observed by other relatedresearches [27 28]
For pH values similar changing profiles were observedat different temperature (Figure 3(b)) which shows that pHdecreased dramatically during the first 40 h under 26 and30∘C conditions It suggests that high temperatures willenhance the organic acid production and will cause pH todrop more quickly than that at low temperatures
0 20 40 60 80 1000
1
2
3
4
5
6
Biom
ass (
gL)
Fermentation time (h)
30∘C
26∘C
22∘C
Figure 1 Kinetic model of SSF process in rice wine fermentation
34 Model Development The system considered by theunstructured model is composed of four main variablesstarch (S) reducing sugar (G) dry cell weight (X) andethanol concentrations (E) The chemical reactions for thisprocess are shown in Figure 4
341 Saccharification of Starch to Reducing Sugar DuringChinese rice wine fermentation the reducing sugar from theenzymatic hydrolyzed starch was used to produce ethanolandor maintain cell growth The net reducing sugar accu-mulation rate is
119889119866
119889119905
= 119903
119891minus 119903
119906
(5)
where 119903119891is reducing sugar formation and 119903
119906is reducing sugar
consumption used for fermentation with Saccharomyces cere-visiae
The Michelis-Menten kinetics including competitiveinhibition of reducing sugar was used to describe the enzy-matic saccharification of starch to reducing sugar in Chineserice wine fermentation process Thus
119903
119904= 119896
1
119878
119896
119898(1 + (119866119896
0)) + 119878
(6)
The assumed model in the saccharification level is basedon the model to describe starch saccharification [16] In thismodel the Saccharomyces cerevisiae EC118 was used forthe fermentation and Chinese wheat qu was used for thesaccharification
Reducing sugar was used to evaluate the sugar con-centration in fermentation broth of rice wine fermentationprocess In this work the reducing sugar was considered asglucose
As for the exact ratio of 120572-amylase and amyloglucosidasein the Chinese wheat qu 120572-amylase and amyloglucosidase
Mathematical Problems in Engineering 5
0 20 40 60 80 1000
40
80
120
160
200
Fermentation time (h)
Redu
cing
suga
r (g
L)
30∘C
26∘C
22∘C
(a)
0 20 40 60 80 1000
20
40
60
80
100
120
140
Fermentation time (h)
Redu
cing
suga
r (g
L)
30∘C
26∘C
22∘C
(b)
Figure 2 Experimental residue reducing sugar curve of the batch fermentation at various temperatures (a) only added Chinese wheat quand (b) added Chinese wheat qu and S cerevisiae
0 20 40 60 80 1000
20
40
60
80
100
Fermentation time (h)
Etha
nol (
gL)
30∘C
26∘C
22∘C
(a)
0 20 40 60 80 10035
40
45
50
55
60
65
70
Fermentation time (h)
pH
30∘C
26∘C
22∘C
(b)
Figure 3 Experimental residue reducing sugar curve of the batch fermentation at various temperatures (a) only added Chinese wheat quand (b) added Chinese wheat qu and S cerevisiae
were considered as a ldquocomplex enzymerdquo For simplification ofthe model the concentration of enzyme was considered asconstant The enzymatic affinity to the starch is independentof enzyme concentration
The mass transfer limitations and conformationalchanges of the enzyme structure were not considered in themodel
Ethanol was considered as the main products otherflavour compounds were not considered in this work
342 Microbial Growth Part of the sugar was consumed bythe cells for growth The specific growth rate of yeast wasdescribed as the Monod equation with substrate inhibitionbelow
120583 = 119896
2
119866
119896
119904+ 119866
(7)
6 Mathematical Problems in Engineering
Enzyme+
starchReducingsugar
Ethanol
Cell growth
Cell maintenance
SSF
Saccharification of starch to reducing sugar
Fermentation of reducing sugar to ethanol
k1
k3
k2
k4
(1)
(2)
Figure 4 Kinetic model of SSF process in rice wine fermentation
The growth rate of yeast cell was assumed to be directlyproportional to the dry cell weight so the growth rate of cellsis written as
119889119883
119889119905
= 120583119883
(8)
where 119883 is the dry cell weight and 119866 is reducing sugarconcentration119870s is the inhibition coefficient
Some of the sugar was consumed by cells for cellularmaintenance The sugar needed was directly proportional tothe dry cell weight It is described in
119903
119898= 119896
3119883 (9)
343 Fermentation of Reducing Sugar to Ethanol Ethanolwas the metabolic product of Saccharomyces cerevisiae fer-mentation Ethanol is assumed to be directly proportionalto the dry cell weight and substrate as well as reducingsugar concentration The effects of the reducing sugar andmetabolic product ethanol inhibitions were considered in thefermentation process from reducing sugar to ethanol Theformation rate of ethanol from reducing sugar is written asfollows
119903
119864= 119896
4
1
(119896
1199041+ 119866)
1
(119896ps1 + 119864 + (1198642
119896pi1))119866119883 (10)
where 1(1198961199041+119866) is the substrate inhibition and 1(119896ps1 +119864+
(119864
2
119896pi1)) is the product inhibition
344 Model of the SSF Process The model of SSF process isdescribed as follows based on (5)ndash(10)
Starch balance
119889119878
119889119905
= minus119896
1
119878
119896
119898(1 + (119866119896
0)) + 119878
(11)
Biomass balance
119889119883
119889119905
= 119896
2
119866
119896
119904+ 119866
119883 (12)
Ethanol balance
119889119864
119889119905
= 119903
119864
(13)
Reducing sugar balance
119889119866
119889119905
= 119903
119891minus 119903
119906
(14)
where
119903
119891= 111119896
1
119878
119896
119898(1 + (119866119896
0)) + 119878
(15)
119903
119906=
1
119884
119909119904
119889119883
119889119905
+ 119903
119898+
1
119884
119901119904
119889119864
119889119905
(16)
345 SolvingModel Since the kinematic model of the SSF inricewine fermentation is nonlinear therefore only numericalsolution is available but not analytical solution In this workthe Runge-Kutta method was used to get the numericalsolution for themodelThe initial conditionwas set as 119909
0 and
119909
119894was achieved as numerical solution by recursive relation
equation
119909
119894+1119895= 119909
119894119895+
1
6
(119887
1119895+ 2119887
2119895+ 2119887
3119895+ 119887
4119895) + 119874 (ℎ
5
)
119887
1119895= ℎ119891
119895(119905
119894 119909
1198941 119909
1198942 119909
119894119899)
119887
2119895= ℎ119891
119895(119905
119894+
ℎ
2
119909
1198941+
119887
11
2
119909
1198942+
119887
12
2
119909
119894119899+
119887
1119899
2
)
119887
3119895= ℎ119891
119895(119905
119894+
ℎ
2
119909
1198941+
119887
21
2
119909
1198942+
119887
22
2
119909
119894119899+
119887
2119899
2
)
119887
4119895= ℎ119891
119895(119905
119894+ ℎ 119909
1198941+ 119887
31 119909
1198941+ 119887
32 119909
119894119899+ 119887
3119899)
(13
1015840
)
35 Validating and Estimating Parameters of UnstructuredModel for Chinese Rice Wine Fermentation Several modelsand parameters related to only starch hydrolysis have beenconstructed and evaluated with 120572-amylase [29] and amy-loglucosidase [30] However no study on the effect of varioustemperatures on ethanol fermentation was undertaken withtheir models Therefore it is interesting to analyze the effectof a series of temperatures on ethanol production To acquirekinetic parameters of the kinetic model for Chinese rice winefermentation under various temperatures the simulated Chi-nese rice wine fermentation process at different temperaturesin a scale-down level was done considering the temperaturein Chinese rice wine brewing was controlled below 33∘CAccordingly 22 26 and 30∘C were chosen and controlled forthe simulated Chinese rice wine fermentation The data andsimulation are shown in Figures 5(a) 5(b) and 5(d)The dataare presented in data points and simulation is presented withsolid lines for reducing sugar (G) biomass (X) and ethanol(E) respectively
All the optimized parameters were calculated and fittedthe modeling data with the experimental data at 22 26 and30∘C The R-square value was used to evaluate the modelfitting The 1198772 value more close to 1 the model fitting isconsidered to be better The R-square values of the modelunder different temperatures which are calculated by1198772 = 1minus
Mathematical Problems in Engineering 7
0 20 40 60 80 1000
1
2
3
4
5
6
Fermentation time (h)
Biom
ass (
gL)
30∘C
30∘C
26∘C 26
∘C22
∘C
22∘C
(a)
0
20
40
60
80
100
Etha
nol (
gL)
0 20 40 60 80 100Fermentation time (h)
30∘C
30∘C
26∘C 26
∘C22
∘C
22∘C
(b)
0
50
100
150
200
250
Star
ch (g
L)
0 20 40 60 80 100Fermentation time (h)
30∘C
26∘C
22∘C
(c)
20
40
60
80
100
120
140
Redu
cing
suga
r (g
L)
30∘C
30∘C
26∘C 26
∘C22
∘C
22∘C
0020 40 60 80 100
Fermentation time (h)
(d)
Figure 5 Experimental data and simulated data for batch experiments at 22 26 and 30∘C (a) Cell mass concentration (b) Ethanolconcentration (c) Starch concentration (d) Reducing sugar concentration
Table 1 R-square value for the model
State varible Temperature22∘C 26∘C 30∘C
Reducing Sugar 096 097 095Cell mass 098 099 098Ethanol 099 099 099
(sum(119909
119894minus 119909
119894)
2
sum(119909
119894minus 119909
119894)
2
) are shown as Table 1 The R-squarevalues of reducing sugar are 096 at 22∘C 097 at 26∘C and
095 at 30∘C respectively The R-square values of cell massunder the temperatures from 22 to 30∘C are 099 098 and099 respectively The R-square values of ethanol are all 099at all three different temperatures The plot figures (Figure 5)and R-square values show that the model fit the data verywell The model thus is very useful to describe the Chineserice wine fermentation process
The kinetic parameters at all temperatures are shownin Table 2 The maximum rate of saccharification (119896
1) was
increased from 6772 g Lminus1 hminus1 at 22∘C to 7721 g Lminus1 hminus1 at30∘C with the temperature increasing Maximum specific
8 Mathematical Problems in Engineering
Table 2 Kinetic and stoichiometric parameters values and initial conditions of the model
Evaluated parameter Temperature22∘C 26∘C 30∘C Units
119896
1
6772 7099 7721 g Lminus1 hminus1
119896
2
0110 0120 0127 g Lminus1 hminus1
119896
3
0001 0001 0001 hminus1
119896
4
99399 105383 135393 g Lminus1 hminus1
119896
119898
31856 31809 32436 g Lminus1
119896
0
139959 139964 139887 g Lminus1 hminus1
119884
119909119904
0894 0882 0651 g gminus1
119896
119904
116533 104533 104596 g Lminus1
119884
119901119904
0254 0244 0257 g gminus1
119896
1199041
60984 60984 61344 g Lminus1
119896ps1 56256 56287 56176 g Lminus1
119896pi1 170778 170779 170756 g Lminus1
growth rate (1198962) was increased from 0110 at 22∘C to 0127
at 30∘C Consumption coefficient for cell maintenance (1198963)
contains the same value 0001 hminus1 under various tempera-tures The maximum ethanol production rate (119896
4) increased
from 99399 g Lminus1 hminus1 at 22∘C to 135393 at 30∘C also Glu-cose inhibition constant for saccharification (119896
0) saturation
growth constant (1198961199041) substrate growth inhibition constant
(119896ps1) substrate production inhibition term (119896pi1) and yieldcoefficient of product (119884
119901119904) all only have little fluctuation
under various temperatures However the yield coefficient ofcell growth (119884
119909119904) was decreased from 0894 g gminus1 at 22∘C to
0651 g gminus1 at 30∘CThe model of biomass is quite accurate and there was no
drastic mismatch between the experimental and simulationdata (Figure 5(a)) The effect of intermediate products ofreducing sugar from starch hydrolysis on cell growth andethanol production can be very significant The Chineserice wine fermentation is a typical SSF process in whichat the initial stage the reducing sugar concentration is lowbut the starch concentration is higher In this model totalreducing sugar was used as sugar contents The computa-tion model for reducing sugar concentration and ethanolproduction fits very well to the profile of experimental data(Figures 5(b) and 5(d)) It is to be noted that the computationmodel for ethanol production cannot fit very well at 22∘Cfrom 0 to 60 h (Figure 5(b))The utilization of glucose at 22∘Cis lower than the other conditions but the glucose formationis similar to the other conditions and ethanol concentrationreached the highest value The pH values at low temperaturewere higher than that at high temperature (Figure 3(b))because organic acid produced more at higher temperaturein the fermentation broth All the results suggested that hightemperature enhanced glucose to produce organic acid butnot ethanol
In addition high temperature can increase the valuesof maximum rate of saccharification maximum specificgrowth rate and maximum ethanol production rate How-ever yield coefficient for cell growth and saturation growth
constant are decreased with the temperature increasingIt is to be noted that the parameters values of yieldcoefficient of product saturation growth constant sub-strate growth inhibition constant and substrate produc-tion inhibition term cannot be affected apparently by thetemperature
Overall exploring the fermentation process providesvery useful information for industrial ethanol fermentationto reduce power consumption and increases productionAt present kinetic modeling is an indispensable step inexploring and developing a better fermentation process sincethe models can be used to determine an optimal operationalcondition for the production of a target metabolite Howeveran unstructured kinetic model to study the temperatureon ethanol production in Chinese rice wine fermentationis still not available until now Therefore our new modelsuitable for ricewine fermentation and analysis of the effect oftemperatures on ethanol production contributes significantlyto the improvement of the industrial production process forChinese rice wine
4 Conclusion
SSF is an essential industrial technology for converting biore-sources into useful products such as lactic acid and ethanol[31ndash35] As ethanol can be used as biofuel producing ethanolfrom bioresource is becoming very important bioprocess toresolve the energy crisis [36 37] and several models havebeen developed to describe the SSF process from wood cornflower and starch [38 39] The SSF process uses whole riceand Chinese wheat qu which contains mostly 120572-amylase andamyloglucosidase to produce reducing sugar and ethanolwith Saccharomyces cerevisiae Additionally ethanol produc-tion achieved as high as 21 (vv) compared to only 11concentration in industrial ethanol fermentation Further-more the temperature is limited to below 31∘C [18 40] inthis process Consequently exploring the fermentation pro-cess provides very useful information for industrial ethanol
Mathematical Problems in Engineering 9
fermentation to reduce power consumption and increasesproduction At present kinetic modeling is an indispensablestep in exploring and developing a better fermentationprocess since the models can be used to determine anoptimal operational condition for the production of a targetmetabolite However an unstructured kinetic model to studythe temperature on ethanol production in Chinese rice winefermentation is still not available until now Therefore ournewmodel suitable for rice wine fermentation and analysis ofthe effect of temperatures on ethanol production contributessignificantly to the improvement of the industrial productionprocess for Chinese rice wine
Nomenclature
S Starch concentration (g Lminus1)G Reducing sugar concentration (g Lminus1)X Biomass concentration (g Lminus1)E Ethanol concentration (g Lminus1)120583 Specific growth rate of yeast (hminus1)119903
119898 Consumption rate for cell maintenance
(g Lminus1 hminus1)119903
119864 Formation rate of ethanol from reducing
sugar (g Lminus1 hminus1)119903
119891 Reducing sugar formation rate (g Lminus1 hminus1)
119903
119906 Reducing sugar utilization rate (g Lminus1 hminus1)
119896
1 Maximum rate of saccharification
(g Lminus1 hminus1)119896
2 Maximum specific growth rate (g Lminus1 hminus1)
119896
3 Consumption coefficient for cell
maintenance (per h)119896
4 Maximum of ethanol production rate
(g Lminus1 hminus1)119884
119901119904 Yield coefficient of product (g gminus1)
119884
119909119904 Yield coefficient of cell growth (g gminus1)
119896
0 Glucose inhibition constant for
saccharification (g Lminus1)119896
119898 Inhibition constant for saccharification
(g Lminus1)119896
119904 Saturation growth constant (g Lminus1)
119896
119864 Ethanol inhibition constant (g Lminus1)
119896s1 Saturation growth constant (g Lminus1)119896ps1 Substrate growth inhibition constant
(g Lminus1)119896pi1 Substrate production inhibition term
(g Lminus1)
Conflict of Interests
The authors declare that they have no conflict of interestsregarding the publication of this paper
Acknowledgments
The authors thank Drs Feng Ding Ya Guo Ti Zhang and RuDai and Ms Connie Liu and Mr Lakdas Fernando for their
technical assistance Shaoxing Nverhong Rice Wine Com-pany is acknowledged for thematerial supportThis workwassupported in part by National Science Foundation of China(21276111 and 21206053) Zhejiang Science and TechnologyProject (2011C12033) 111 Project (B12018) China ScholarshipCouncil (no 2010679023) and Jiangnan University PhDResearch Fund (no JUDCF10062)
References
[1] V Lavric I D Ofiteru and A Woinaroschy ldquoContinuoushybridoma bioreactor sensitivity analysis and optimal controlrdquoBiotechnology andApplied Biochemistry vol 44 no 2 pp 81ndash922006
[2] D A Gee andW F Ramirez ldquoOptimal temperature control forbatch beer fermentationrdquoBiotechnology and Bioengineering vol31 no 3 pp 224ndash234 1988
[3] M Kawohl T Heine and R King ldquoModel based estimationand optimal control of fed-batch fermentation processes for theproduction of antibioticsrdquoChemical Engineering and ProcessingProcess Intensification vol 46 no 11 pp 1223ndash1241 2007
[4] L Yu FDing andHYe ldquoAnalysis of characteristic flavour com-pounds in Chinese rice wines and representative fungi in wheatQu samples from different regionsrdquo Journal of the Institute ofBrewing vol 118 no 1 pp 114ndash119 2012
[5] X Mo Y Xu and W Fan ldquoCharacterization of aroma com-pounds in Chinese rice wineQu by solvent-assisted flavor evap-oration and headspace solid-phase microextractionrdquo Journal ofAgricultural and Food Chemistry vol 58 no 4 pp 2462ndash24692010
[6] G S Murthy D B Johnston K D Rausch M E Tumblesonand V Singh ldquoA simultaneous saccharification and fermenta-tion model for dynamic growth environmentsrdquo Bioprocess andBiosystems Engineering vol 35 no 4 pp 519ndash534 2012
[7] D K Apar and B Ozbek ldquo120572-Amylase inactivation by tempera-ture during starch hydrolysisrdquo Process Biochemistry vol 39 no9 pp 1137ndash1144 2004
[8] C Akerberg K Hofvendahl B Hahn-Hagerdal and G ZacchildquoModelling the influence of pH temperature glucose and lacticacid concentrations on the kinetics of lactic acid production byLactococcus lactis ssp lactis ATCC 19435 in whole-wheat flourrdquoApplied Microbiology and Biotechnology vol 49 no 6 pp 682ndash690 1998
[9] K Manikandan and T Viruthagiri ldquoSimultaneous sacchari-fication and fermentation of wheat bran flour into ethanolusing coculture of amyloticAspergillus niger and thermotolerantKluyveromycesmarxianusrdquo Frontiers of Chemical Engineering inChina vol 3 no 3 pp 240ndash249 2009
[10] J M van Zyl E van Rensburg W H van Zyl T M Harms andL R Lynd ldquoA kinetic model for simultaneous saccharificationand fermentation of avicel with Saccharomyces cerevisiaerdquoBiotechnology and Bioengineering vol 108 no 4 pp 924ndash9332011
[11] K K Podkaminer X Shao D A Hogsett and L R Lynd ldquoEnz-yme inactivation by ethanol and development of a kineticmodelfor thermophilic simultaneous saccharification and fermen-tation at 50∘C with Thermoanaerobacterium saccharolyticumALK2rdquo Biotechnology and Bioengineering vol 108 no 6 pp1268ndash1278 2011
10 Mathematical Problems in Engineering
[12] C J A de Souza D A Costa M Q R B Rodrigues et al ldquoTheinfluence of presaccharification fermentation temperature andyeast strain on ethanol production from sugarcane bagasserdquoBioresource Technology vol 109 pp 63ndash69 2012
[13] A M Badawi A A Fahmy K A Mohamed M R Noor El-Din and M G Riad ldquoEnhancement of ethanol production bysimultaneous saccharification and fermentation (SSF) of ricestraw using ethoxylated span 20rdquo Preparative Biochemistry andBiotechnology vol 42 no 1 pp 44ndash59 2012
[14] B C Saha N N Nichols N Qureshi and M A Cotta ldquoCom-parison of separate hydrolysis and fermentation and simulta-neous saccharification and fermentation processes for ethanolproduction from wheat straw by recombinant Escherichia colistrain FBR5rdquo Applied Microbiology and Biotechnology vol 92no 4 pp 865ndash874 2011
[15] J Shen and F A Agblevor ldquoThe operable modeling of simulta-neous saccharification and fermentation of ethanol productionfrom celluloserdquo Applied Biochemistry and Biotechnology vol160 no 3 pp 665ndash681 2010
[16] A D Kroumov A NModenes andM C D A Tait ldquoDevelop-ment of new unstructured model for simultaneous saccharifi-cation and fermentation of starch to ethanol by recombinantstrainrdquo Biochemical Engineering Journal vol 28 no 3 pp 243ndash255 2006
[17] A R Chavan A Raghunathan and K V Venkatesh ldquoModelingand experimental studies on intermittent starch feeding andcitrate addition in simultaneous saccharification and fermen-tation of starch to flavor compoundsrdquo Journal of IndustrialMicrobiology and Biotechnology vol 36 no 4 pp 509ndash5192009
[18] Y Xu D Wang W Fan X Mu and J Chen ldquoTranditional Chi-nese biotechnologyrdquo in Biotechnology in China II ChemicalsEnergy and Environment G T Tsao P Ouyang and J ChenEds vol 122 Springer Berlin Germany 2010
[19] G L Miller ldquoUse of dinitrosalicylic acid reagent for determina-tion of reducing sugarrdquo Analytical Chemistry vol 31 no 3 pp426ndash428 1959
[20] A Constantinides and N Mostoufi Numerical Methods forChemical Engineers with MATLAB Applications Prentice HallUpper Saddle River NJ USA 1999
[21] N Rajagopalan C Mala M Sridevi and R H PrasathldquoOptimized channel allocation using genetic algorithm andartificial neural networksrdquo in Proceedings of the InternationalConference on Soft Computing for Problem Solving (SocProS rsquo11)pp 645ndash655 Springer 2011
[22] J C M Pires B Goncalves F G Azevedo et al ldquoOptimizationof artificial neural network models through genetic algorithmsfor surface ozone concentration forecastingrdquo EnvironmentalScience and Pollution Research vol 19 no 8 pp 3228ndash32342012
[23] Y Guo and J Tan ldquoA kinetic model structure for delayed fluore-scence from plantsrdquo BioSystems vol 95 no 2 pp 98ndash103 2009
[24] YGuo and J Tan ldquoModeling and simulation of the initial phasesof chlorophyll fluorescence from Photosystem IIrdquo BioSystemsvol 103 no 2 pp 152ndash157 2011
[25] M Phisalaphong N Srirattana and W TanthapanichakoonldquoMathematical modeling to investigate temperature effect onkinetic parameters of ethanol fermentationrdquo Biochemical Engi-neering Journal vol 28 no 1 pp 36ndash43 2006
[26] E C Rivera A C Costa D I P Atala F Maugeri M R WMaciel and RM Filho ldquoEvaluation of optimization techniquesfor parameter estimation application to ethanol fermentationconsidering the effect of temperaturerdquo Process Biochemistry vol41 no 7 pp 1682ndash1687 2006
[27] D B Hughes N J Tudroszen and C J Moye ldquoThe effect oftemperature on the kinetics of ethanol production by a ther-motolerant strain of Kluveromyces marxianusrdquo BiotechnologyLetters vol 6 no 1 pp 1ndash6 1984
[28] M L Cazetta M A P C Celligoi J B Buzato and I S Scar-mino ldquoFermentation ofmolasses byZymomonasmobilis effectsof temperature and sugar concentration on ethanol productionrdquoBioresource Technology vol 98 no 15 pp 2824ndash2828 2007
[29] D W S Wong G H Robertson C C Lee and K WagschalldquoSynergistic action of recombinant120572-amylase and glucoamylaseon the hydrolysis of starch granulesrdquo Protein Journal vol 26 no3 pp 159ndash164 2007
[30] H Tatsumi and H Katano ldquoKinetics of the surface hydrolysisof raw starch by glucoamylaserdquo Journal of Agricultural and FoodChemistry vol 53 no 21 pp 8123ndash8127 2005
[31] A B M S Hossain A A Saleh S Aishah A N Boyce P PChowdhury and M Naqiuddin ldquoBioethanol production fromagricultural waste biomass as a renewable bioenergy resourcein biomaterialsrdquo in Proceedings of the 4th Kuala LumpurInternational Conference on Biomedical Engineering (Biomedrsquo08) pp 300ndash305 Springer June 2008
[32] Y Koike M-Z An Y-Q Tang et al ldquoProduction of fuelethanol andmethane from garbage by high-efficiency two-stagefermentation processrdquo Journal of Bioscience and Bioengineeringvol 108 no 6 pp 508ndash512 2009
[33] Y S Hong and H H Yoon ldquoEthanol production from foodresiduesrdquo Biomass and Bioenergy vol 35 no 7 pp 3271ndash32752011
[34] Y Lin and S Tanaka ldquoEthanol fermentation from biomassresources current state and prospectsrdquo Applied Microbiologyand Biotechnology vol 69 no 6 pp 627ndash642 2006
[35] R A Davis ldquoParameter estimation for simultaneous saccharifi-cation and fermentation of foodwaste into ethanol usingMatlabSimulinkrdquo Applied Biochemistry and Biotechnology vol 147 no1ndash3 pp 11ndash21 2008
[36] A Demirbas and G Arin ldquoAn overview of biomass pyrolysisrdquoEnergy Sources vol 24 no 5 pp 471ndash482 2002
[37] M F Demirbas and M Balat ldquoRecent advances on the produc-tion and utilization trends of bio-fuels a global perspectiverdquoEnergy Conversion andManagement vol 47 no 15-16 pp 2371ndash2381 2006
[38] P O Petterson R Eklund and G Zacchi ldquoModeling simulta-neous saccharification and fermentation of softwoodrdquo AppliedBiochemistry and Biotechnology A Enzyme Engineering andBiotechnology vol 98ndash100 pp 733ndash746 2002
[39] K Ohgren R Bura G Lesnicki J Saddler and G ZacchildquoA comparison between simultaneous saccharification andfermentation and separate hydrolysis and fermentation usingsteam-pretreated corn stoverrdquo Process Biochemistry vol 42 no5 pp 834ndash839 2007
[40] X Mo W Fan and Y Xu ldquoChanges in volatile compounds ofChinese rice wine wheat Qu during fermentation and storagerdquoJournal of the Institute of Brewing vol 115 no 4 pp 300ndash3072009
Submit your manuscripts athttpwwwhindawicom
Hindawi Publishing Corporationhttpwwwhindawicom Volume 2014
MathematicsJournal of
Hindawi Publishing Corporationhttpwwwhindawicom Volume 2014
Mathematical Problems in Engineering
Hindawi Publishing Corporationhttpwwwhindawicom
Differential EquationsInternational Journal of
Volume 2014
Applied MathematicsJournal of
Hindawi Publishing Corporationhttpwwwhindawicom Volume 2014
Probability and StatisticsHindawi Publishing Corporationhttpwwwhindawicom Volume 2014
Journal of
Hindawi Publishing Corporationhttpwwwhindawicom Volume 2014
Mathematical PhysicsAdvances in
Complex AnalysisJournal of
Hindawi Publishing Corporationhttpwwwhindawicom Volume 2014
OptimizationJournal of
Hindawi Publishing Corporationhttpwwwhindawicom Volume 2014
CombinatoricsHindawi Publishing Corporationhttpwwwhindawicom Volume 2014
International Journal of
Hindawi Publishing Corporationhttpwwwhindawicom Volume 2014
Operations ResearchAdvances in
Journal of
Hindawi Publishing Corporationhttpwwwhindawicom Volume 2014
Function Spaces
Abstract and Applied AnalysisHindawi Publishing Corporationhttpwwwhindawicom Volume 2014
International Journal of Mathematics and Mathematical Sciences
Hindawi Publishing Corporationhttpwwwhindawicom Volume 2014
The Scientific World JournalHindawi Publishing Corporation httpwwwhindawicom Volume 2014
Hindawi Publishing Corporationhttpwwwhindawicom Volume 2014
Algebra
Discrete Dynamics in Nature and Society
Hindawi Publishing Corporationhttpwwwhindawicom Volume 2014
Hindawi Publishing Corporationhttpwwwhindawicom Volume 2014
Decision SciencesAdvances in
Discrete MathematicsJournal of
Hindawi Publishing Corporationhttpwwwhindawicom
Volume 2014 Hindawi Publishing Corporationhttpwwwhindawicom Volume 2014
Stochastic AnalysisInternational Journal of
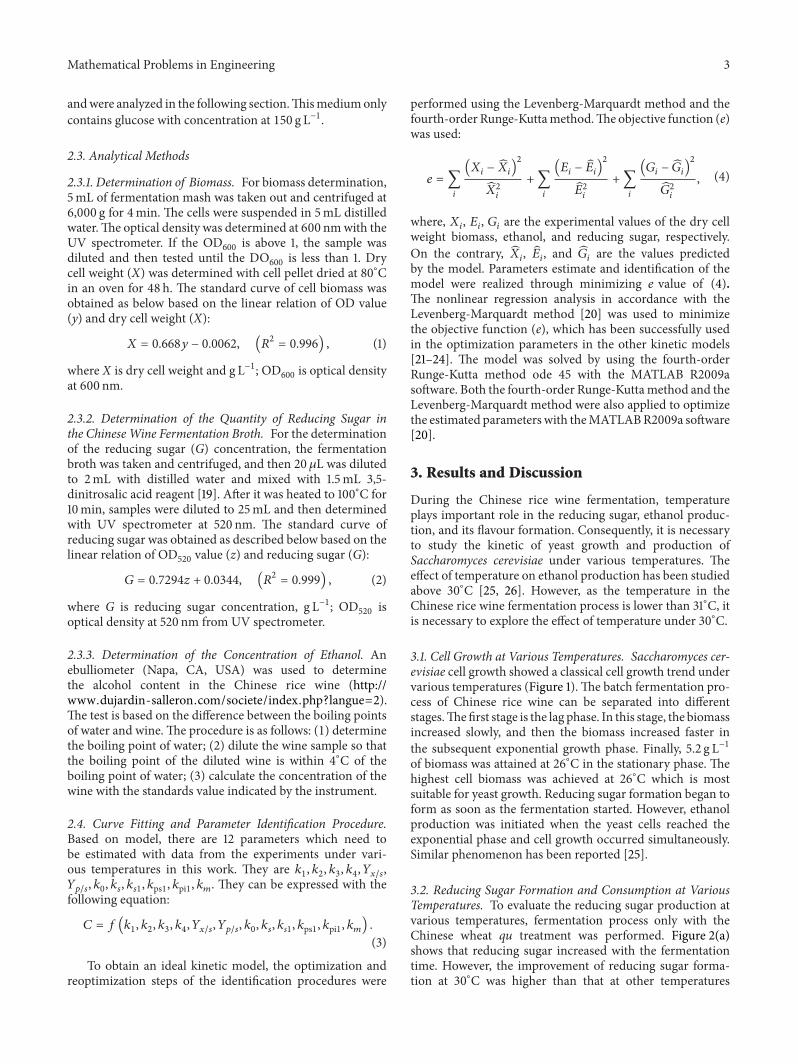
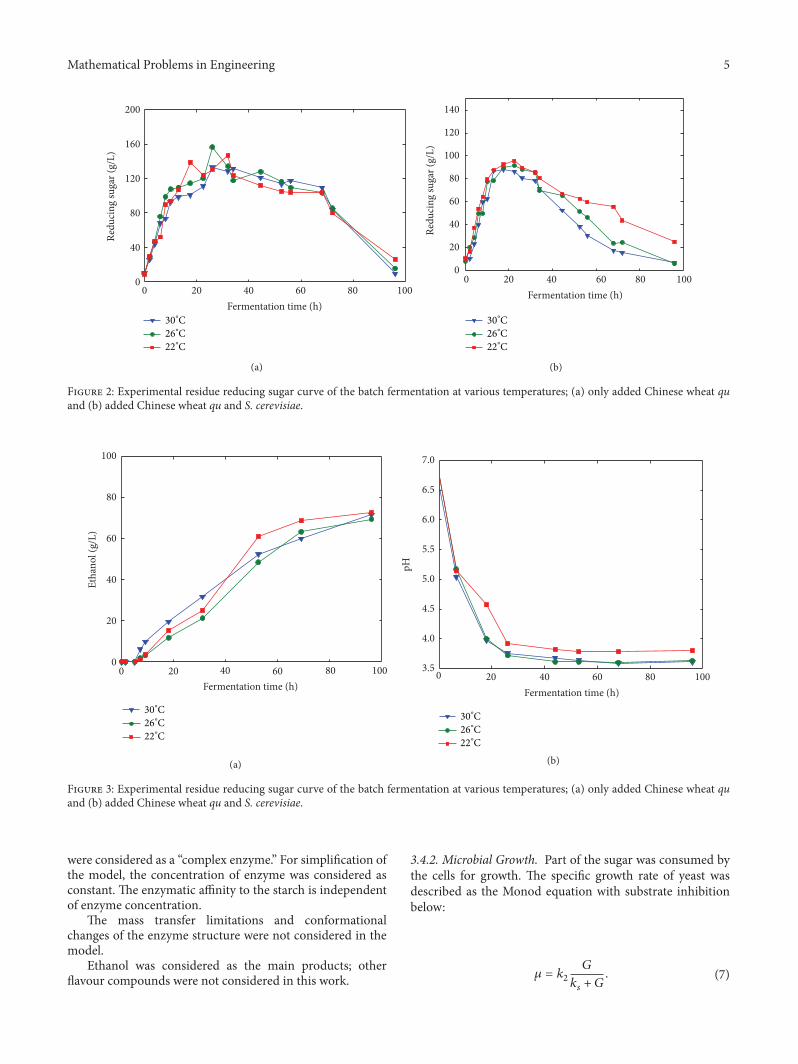
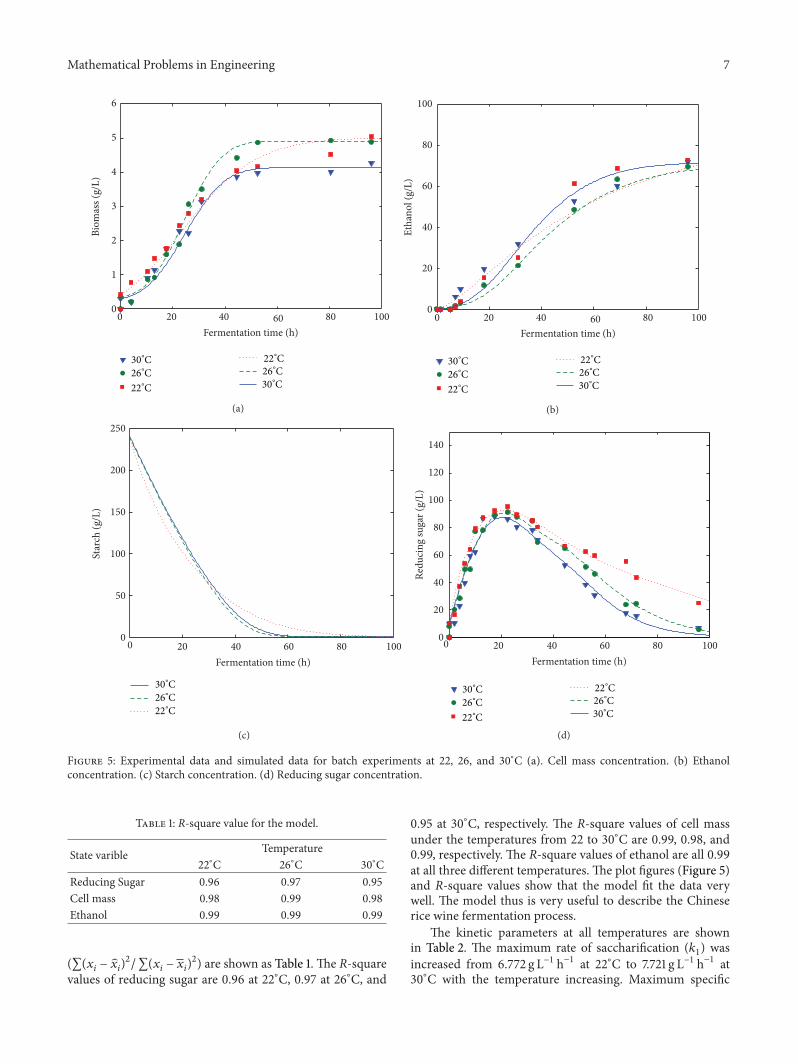