modeling of isoamyl acetate production by fermentation
TRANSCRIPT
HAL Id: hal-01624572https://hal.archives-ouvertes.fr/hal-01624572
Submitted on 26 Oct 2017
HAL is a multi-disciplinary open accessarchive for the deposit and dissemination of sci-entific research documents, whether they are pub-lished or not. The documents may come fromteaching and research institutions in France orabroad, or from public or private research centers.
L’archive ouverte pluridisciplinaire HAL, estdestinée au dépôt et à la diffusion de documentsscientifiques de niveau recherche, publiés ou non,émanant des établissements d’enseignement et derecherche français ou étrangers, des laboratoirespublics ou privés.
Modeling of isoamyl acetate production by fermentationwith Pichia fermentans in an aerated system coupled to
in situ extractionAna Karen Sánchez Castañeda, Violaine Athès, Marwen Moussa, Javier López
Miranda, Jesús Bernardo Páez Lerma, Ioan Cristian Trelea
To cite this version:Ana Karen Sánchez Castañeda, Violaine Athès, Marwen Moussa, Javier López Miranda, JesúsBernardo Páez Lerma, et al.. Modeling of isoamyl acetate production by fermentation with Pichiafermentans in an aerated system coupled to in situ extraction. Process Biochemistry, Elsevier, 2018,65, pp.11-20. �10.1016/j.procbio.2017.10.010�. �hal-01624572�
1
Modeling of isoamyl acetate production by fermentation with Pichia fermentans
in an aerated system coupled to in situ extraction
Ana Karen Sánchez Castañedaa,b, Violaine Athèsa,, Marwen Moussaa, Javier López
Mirandab, Jesús Bernardo Páez Lermab, Nicolás Óscar Soto Cruzb; Ioan Cristian
Treleaa*.
aUMR 782 Génie et Microbiologie des Procédés Alimentaires (GMPA),
AgroParisTech, INRA, Université Paris-Saclay, F-78850, Thiverval-Grignon
bTecnológico Nacional de México, Instituto Tecnológico de Durango, Departamento
de Ingenierías Química-Bioquímicas. Blvd. Felipe Pescador 1830 Ote. Col Nueva
Vizcaya. Durango, Dgo. 34080, México.
Authors e-mail: [email protected], [email protected],
[email protected], [email protected],
[email protected], [email protected].
*Corresponding author:
Ioan Cristian Trelea
Tel: +33 1 30 81 54 90. Fax: +33 1 30 81 55 97.
E-mail address: [email protected]

2
Abstract
This study deals with the production of isoamyl acetate (IAA) by fermentation of
sugar cane molasses with the strain Pichia fermentans ITD00165, using L-leucine as
precursor. A mathematical model that describes the experimental data from
fermentation was developed for its use as a tool for further process optimization. The
fermentation system was constantly aerated and coupled to liquid-liquid in situ
extraction with decane as the recovery solvent. Thus, the model integrates the
biological production of IAA, its partition coefficient in the two liquid phase system
and the stripping effect of aeration. A productivity of 26-mg-L-1-h-1 was obtained with
addition of 4-g-L-1 of L-leucine at 12-h of fermentation. The use of the model for
process optimization was explored. According to it, the maximum theoretical
productivity that can be obtained is 63-mg-L-1-h-1. The model was used to determine
that 1.6-g-L-1 is the minimum concentration of L-leucine that can be added without
significantly reducing IAA production. Also, it makes possible to propose an
adequate decane/culture medium ratio, to have a desired final concentration and
amount of recovered IAA. This value can be adjusted based on the needs of further
purification steps and is useful to define a global economic optimum of the process.
Keywords: Aroma production, fermentation kinetics, partition coefficient, simulation,
natural flavoring substance.
Chemical compounds studied in this article
3
Isoamyl acetate (PubChem CID: 31276); Decane (PubChem CID: 15600); L-leucine
(PubChem CID: 6106).

4
Introduction 1
Esters of short-chain fatty acids are important flavor and fragrance compounds 2
widely used in the food and beverage industries. Isoamyl acetate (IAA) is 3
characterized by its strong smell of banana which gives it a very important place in 4
food, pharmaceutical and perfumery industries with a demand of 75 tons per year in 5
USA alone in 2010 [1–3], increasing over the years. This substance is obtained by 6
chemical synthesis, extraction from natural sources, or fermentation [4]. 7
In recent years, the interest towards the production of flavor compounds through 8
white biotechnology processes over traditional methods has increased. Principal 9
reasons are that chemical synthesis often consists in an environmentally unfriendly 10
production process, with important drawbacks such as poor reactions selectivity 11
resulting in racemic mixtures, low yields, and high downstream costs [5,6]. Also, 12
consumers have developed an apprehensive attitude towards these synthetic 13
compounds, especially if the products are related to food or domestic usage. 14
Moreover, the extraction of flavoring compounds from natural sources gives very low 15
yields and has potential difficulties with obtaining the raw material [3,4,7]. Contrary 16
to chemical synthesis, flavors obtained by fermentation can have the “natural 17
flavoring substance" classification by the European (EC No 1334/2008) and U.S. 18
(21CFR101.22) regulations, which allows using them safely as an additive in food 19
and beverages. This has been the main reason for developing biochemical processes 20
over the years, but presently, after years of research, the inherent advantages of white 21
biotechnology processes are the driving force for its application: operation under mild 22
5
and more environmentally friendly conditions, as well as chemical and stereo 23
specificity of the obtained compounds, are the most important ones [8]. 24
There are several published studies focused on IAA biological production. They 25
include enzymatic synthesis using lipases and esterases [1,3,9–15] and fermentation 26
process by microorganisms, especially yeasts strains [6,16–20]. Whole cell 27
fermentation can be a more economical method than enzymatic systems and easier to 28
scale up to industrial level. There are some encouraging studies with interesting IAA 29
productivities in the literature; for example, Yilmaztekin et al. [6] used a Williopsis 30
saturnus strain in a medium composed of beet molasses and fusel alcohols as a source 31
of isoamyl alcohol (IAOH), a precursor of the ester. A productivity of 2.46 mg L-1 h-1 32
was obtained by adding 1% of fusel alcohol at 72 h. Quilter et al. [19], obtained 1.16 33
mg L-1 h-1 using a mutant strain of Saccharomyces cerevisiae and testing several 34
fermentation conditions. However, these values are not high enough to make the 35
process attractive at industrial level and further optimization is needed. 36
In fermentative processes, the production of IAA is strongly affected by the medium 37
composition, fermentation conditions and the microorganism used [6,18,19]. 38
However, a very important factor to consider is physical behavior of IAA in 39
fermentation medium once produced. IAA is a very volatile compound and its 40
production presents some difficulties including phase separation and challenging 41
product recovery. Moreover, IAA production could be favored by chemical 42
equilibrium shift through in situ extraction. A way to improve the performance of 43
fermentative processes is the direct recovery of the desired product, also called In Situ 44
Product Recovery (ISPR). This technique can overcome the inhibition by product 45
6
accumulation and also decreases the loss of cellular viability caused by product 46
toxicity [21,22]. Liquid-liquid extraction with organic solvents is a promising method 47
for IAA recovery, since IAA is more soluble in them than in aqueous solutions. For 48
the same reasons, lipase-catalyzed esterification is carried out in solvent systems 49
[12,14,15,23]. 50
Modeling and simulation has become the most used tool for processes optimization, 51
since it makes possible to explore a wider range of parameter values at a minimum 52
price, compared to experimental approach. Thus, the aim of this work is to develop a 53
model able to describe the production and extraction of IAA from sugar cane 54
molasses, with L-leucine added as precursor, by fermentation with the strain Pichia 55
fermentans ITD00165. The model includes the behavior of IAA in an aerated 56
fermentation system coupled to an in situ extraction with a solvent (decane). As the 57
aeration factor affects the retention of IAA in the system due to a stripping effect, the 58
model is useful as an optimization tool to find the conditions in which the highest 59
amount of IAA could be produced and recovered. 60
Materials and methods 61
1.1. Fermentations 62
1.1.1. Yeast strain 63
The strain Pichia fermentans ITD00165 was used. It was one of the strains isolated 64
from a spontaneous fermentation of Agave duranguensis obtained from the Microbial 65
Biotechnology Lab’s Culture Collection at the Durango Institute of Technology. It 66
was chosen because of its high IAA production capacity [24]. 67
7
1.1.2. Isoamyl acetate production 68
Fermentations were carried out in 1 L glass containers with a diameter/height ratio of 69
1:2, where 600 mL of culture medium were inoculated with an initial concentration of 70
1×10⁷ cells mL-1 of a 24 h pre-grown culture. The pre-culture was inoculated in 100 71
mL of the sugar cane molasses medium in 250 mL Erlenmeyer flasks, with agitation 72
of 120 rpm at 28°C. In order to retain the IAA produced, 150 mL of decane (Sigma-73
Aldrich, USA) was put at the top of the culture medium, creating an in situ 74
entrapping system. Compressed air was fed into the medium with a flow rate of 600 75
mL min-1 (1 VVM) at the bottom of the vessel, in order to provide oxygen to the cells 76
and to agitate the culture medium. No other agitation system was used, thus liquid 77
phases were not mixed, only a slight local dispersion at liquid/liquid interface was 78
observed. The temperature was maintained at 28 °C and the fermentation was 79
monitored during 24 h. In fermentations, the effect of addition of the amino acid L-80
leucine (Sigma-Aldrich, USA) as a precursor of IAA was tested. Therefore, three 81
experiments were carried out: 1) Fermentation with no addition of L-leucine, 2) The 82
addition of 4 g L-1 of L-leucine at the beginning of fermentation (t0) and 3) adding 4 g 83
L-1 after 12 h of fermentation (t12). All experiments were performed in duplicate. 84
1.1.3. Process monitoring 85
Samples of 1 mL of medium and decane phases were taken for 24 hours, every 4 86
hours for experiments 1 and 3, and every 2 hours for experiment 2. Monitoring 87
consisted in measurements of biomass by staining viable count with methylene blue 88
in a Neubauer chamber and dry weight; reducing sugars by DNS technique [25]; L-89
leucine and the nitrogen (N) source in molasses by a colorimetric method with 90
8
ninhydrin [26]; and IAA production measured in the decane phase by gas 91
chromatography on a Gas Chromatograph 6890N (Agilent Technologies, USA) 92
equipped with a flame ionization detector (FID) and a HP-Innowax column (Hewlett-93
Packard, USA) (length, 30 m; inside diameter, 0.25 mm; film thickness, 0.25 µm). 94
Temperatures were as used by Rojas et al.[20] with some modifications: injector 95
block and detector 220 and 300 °C, respectively. The oven temperature was 96
programmed as follows: equilibrated at 60°C for 10 min, followed by a ramp of 20°C 97
min-1, up to 250°C. Ethanol and IAOH were analyzed in culture medium by gas 98
chromatography with a method designed for alcohols [27]: injector block and 99
detector 250 and 300°C, respectively; 1:10 split ratio; oven temperature equilibrated 100
at 40°C for 5 min, followed by a ramp of 10°C min-1, up to 260°C. 101
1.2. Aeration effect on retention of isoamyl acetate in decane 102
Experiments were carried out in the same conditions as fermentations but without cell 103
inoculation. Instead, IAA was added to the system at a concentration of 1 g L-1 in two 104
different conditions: 1) Adding IAA into the culture medium and 2) the same amount 105
of IAA was added into the decane phase. Samples of decane were taken periodically 106
and were analyzed by gas chromatography as mentioned before. All experiments 107
were performed in duplicate. 108
1.3. Molasses medium analysis by HPLC 109
A sample of fermentation medium, consisting in molasses diluted at 100 g L-1 with 110
distilled water was analyzed by HPLC in order to determine the sugars and 111
aminoacids content. Sugars were analyzed using a column Biorad Aminex with a 112

9
stationary phase of sulfonated divinyl benzene-styrene (HPX-87H, 300 mm x 7.8 mm 113
x 9µm), at a temperature of 35°C, UV detection was made at 210 nm. For 114
aminoacids, anAccQ-Fluor Reagent Kit was injected in a Waters column (ACCQ-115
TAG, 150mm x 3.9 x 4µm), at a temperature of 34°C, and fluorescent UV detection 116
was made at 250 nm for excitation and 395 nm for emission. 117
1.4. Determination of partition coefficients 118
1.4.1. Gas-liquid partition coefficient (𝐾𝑔𝑞) 119
The Phase Ratio Variation (PRV) method was used as described by Morakul et al., 120
[28]. In order to evaluate the effect of the changes in medium composition during 121
fermentation, 8 different solutions of IAA at 1 g L-1 were prepared in different 122
aqueous matrices, simulating different stages of fermentation during IAA production: 123
1) water, 2) sucrose 100 g L-1, 3) ethanol 10 g L-1, 4) sucrose 150 g L-1, 5) ethanol 15 124
g L-1, 6) sucrose 50 g L-1 + ethanol 5 g L-1, 7) sucrose 25 g L-1 + ethanol 7.5 g L-1, and 125
8) sugar cane molasses 100 g L-1. These conditions were proposed considering a 126
maximum production of ethanol of 15 g L-1 and a maximum sugar concentration of 127
100 g L-1 in the fermentation medium during the process. Aliquots of 50 µL to 2 mL 128
from each solution were introduced into four different headspace vials (22 mL, 129
Chromacol, France) closed with Teflon/silicone septa in metallic caps, giving volume 130
ratios between gas and liquid phases (β) of 10 to 439. The vials were then 131
equilibrated at 28°C for at least 1 h (the time required to reach equilibrium in static 132
conditions). Once equilibrium was reached, a 500 µL sample of headspace gas was 133
taken with a gastight syringe, preheated to 40 °C, in an automatic headspace sampler 134
CTC Pal and injected with a 100 µL s-1 rate to a gas chromatograph (Agilent 135
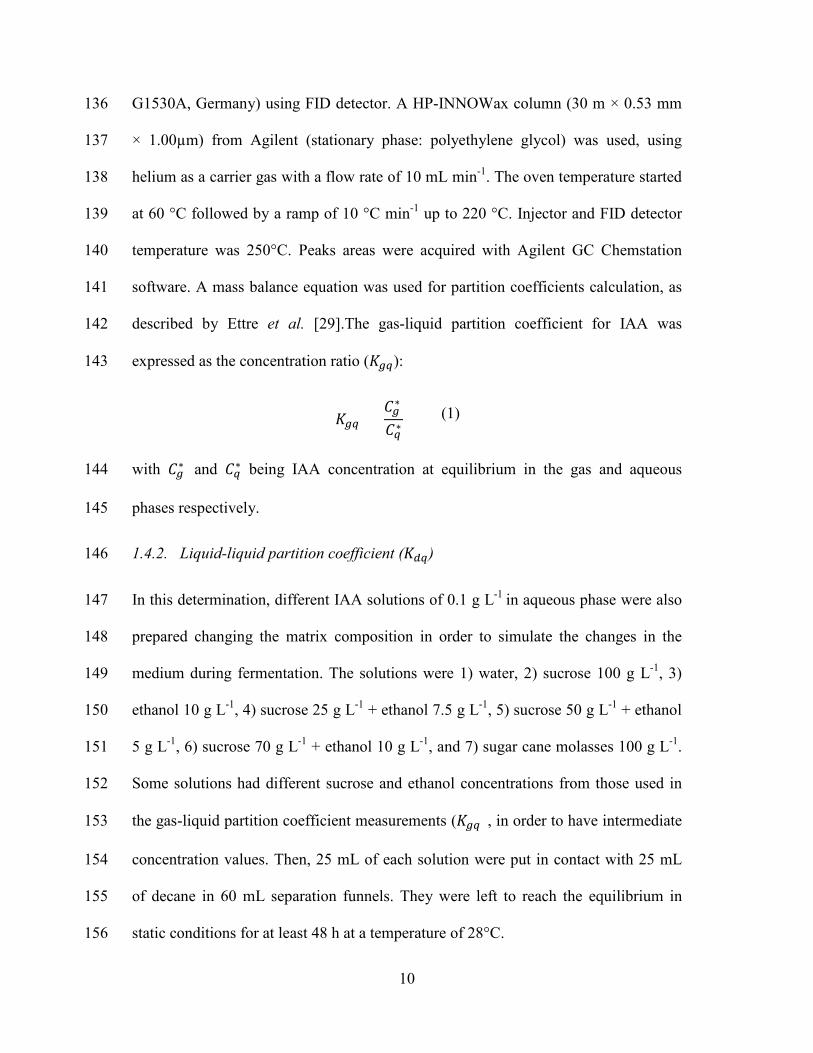
10
G1530A, Germany) using FID detector. A HP-INNOWax column (30 m × 0.53 mm 136
× 1.00µm) from Agilent (stationary phase: polyethylene glycol) was used, using 137
helium as a carrier gas with a flow rate of 10 mL min-1. The oven temperature started 138
at 60 °C followed by a ramp of 10 °C min-1 up to 220 °C. Injector and FID detector 139
temperature was 250°C. Peaks areas were acquired with Agilent GC Chemstation 140
software. A mass balance equation was used for partition coefficients calculation, as 141
described by Ettre et al. [29].The gas-liquid partition coefficient for IAA was 142
expressed as the concentration ratio (𝐾𝑔𝑞): 143
𝐾𝑔𝑞 = 𝐶𝑔∗
𝐶𝑞∗ (1)
with 𝐶𝑔∗ and 𝐶𝑞∗ being IAA concentration at equilibrium in the gas and aqueous 144
phases respectively. 145
1.4.2. Liquid-liquid partition coefficient (𝐾𝑑𝑞) 146
In this determination, different IAA solutions of 0.1 g L-1 in aqueous phase were also 147
prepared changing the matrix composition in order to simulate the changes in the 148
medium during fermentation. The solutions were 1) water, 2) sucrose 100 g L-1, 3) 149
ethanol 10 g L-1, 4) sucrose 25 g L-1 + ethanol 7.5 g L-1, 5) sucrose 50 g L-1 + ethanol 150
5 g L-1, 6) sucrose 70 g L-1 + ethanol 10 g L-1, and 7) sugar cane molasses 100 g L-1. 151
Some solutions had different sucrose and ethanol concentrations from those used in 152
the gas-liquid partition coefficient measurements (𝐾𝑔𝑞), in order to have intermediate 153
concentration values. Then, 25 mL of each solution were put in contact with 25 mL 154
of decane in 60 mL separation funnels. They were left to reach the equilibrium in 155
static conditions for at least 48 h at a temperature of 28°C. 156
11
After equilibrium was reached, 1.5 mL samples of aqueous and decane phase were 157
taken in 2 mL vials closed with Teflon/silicone septa in metallic caps and stored in 158
the tray at 4°C. A sample of 1 µL was taken from each vial with a water-tight syringe, 159
in an automatic headspace sampler CTC Pal and injected with a 5 µL s-1 rate to the 160
gas chromatograph (G 1530A, Germany), equipped with the same column. For the 161
analysis method, oven temperature started at 35 °C followed by a ramp of 5°C min-1 162
to 60 °C and another one of 15°C min-1 up to 220 °C. Injector and FID detector 163
temperature was set to 250 °C. 164
IAA concentrations in both phases were determined using adequate calibration 165
curves. Partition coefficient 𝐾𝑑𝑞was calculated as the ratio at equilibrium of IAA in 166
decane 𝐶𝑑∗ and in aqueous solution 𝐶𝑞∗: 167
𝐾𝑑𝑞 = 𝐶𝑑∗
𝐶𝑞∗ (2)
1.4.3. Statistical analysis 168
Partition coefficient values were compared with a One Way Analysis of Variance 169
(ANOVA) and the Fisher Least Significant Difference (LSD) post-hoc test with the 170
program Statistica version 7.0 (StatSoft, USA). 171
1.5. Dynamic model 172
The equations of the mathematical model were implemented in a program written 173
under Matlab 2013b (The Matworks Inc, Natick, MA). The parameters were 174
identified by linear and nonlinear regression, using the Statistic Toolbox. 175
1.5.1. Modeling partition coefficients 176
12
The values of gas-liquid and liquid-liquid partition coefficients were fitted to a 177
statistical model that accounts for dependence on the medium composition (at 178
constant temperature), as described by Mouret et al. [30]. Sugar and ethanol 179
concentrations, their interaction and the effect of molasses were considered: 180
log𝐾𝑑𝑞 = 𝑝𝑎+ 𝑝𝑏𝑆𝑡 + 𝑝𝑐𝐸 + 𝑝𝑑𝑆𝑡𝐸 + 𝑝𝑒𝑀 (3)
log𝐾𝑔𝑞 = 𝑝1 + 𝑝2𝑆𝑡 + 𝑝3𝐸 + 𝑝4𝑆𝑡𝐸 + 𝑝5𝑀 (4)
where 𝐾𝑔𝑞 and 𝐾𝑑𝑞 are the gas-liquid and liquid-liquid partition coefficients 181
respectively, 𝐸 is the ethanol concentration (g L-1), 𝑆𝑡 is the sugar concentration (g L-182
1), and 𝑀 is the presence of molasses (0 or 1) in aqueous phase. Model parameters 183
𝑝1 … 𝑝5 and 𝑝𝑎 … 𝑝𝑒 are constants depending on the considered compound and 184
temperature, in this case IAA at 28°C. Parameter values were determined by stepwise 185
descending linear regression, starting with the complete model and removing 186
statistically not significant terms one by one, starting with the ones with the largest 187
coefficient of variation. 188
1.5.2. Modeling the isoamyl acetate loss in gas phase by stripping 189
IAA transfer in the system was considered as follows: it is transferred from the 190
aqueous medium (𝑞), where it is synthesized by the cells, simultaneously to 1) the 191
decane phase (𝑑); and 2) to the gas phase (𝑔). Also, a fraction of the IAA in decane 192
phase is transferred to the gas phase. Medium and decane phases are very little 193
dispersed into each other, so the transfer to the gas phase is different in each liquid 194
phase. The IAA transferred to the air fed in the fermentation system was considered 195
as lost due to a stripping effect. Therefore, this could be described by the model 196
13
developed by Marin et al.[31] with some modifications (Equation 5), considering 197
IAA present in both decane and fermentation medium, and the removal by the air 198
flow passing through the system. The global mass balance between the liquids, 199
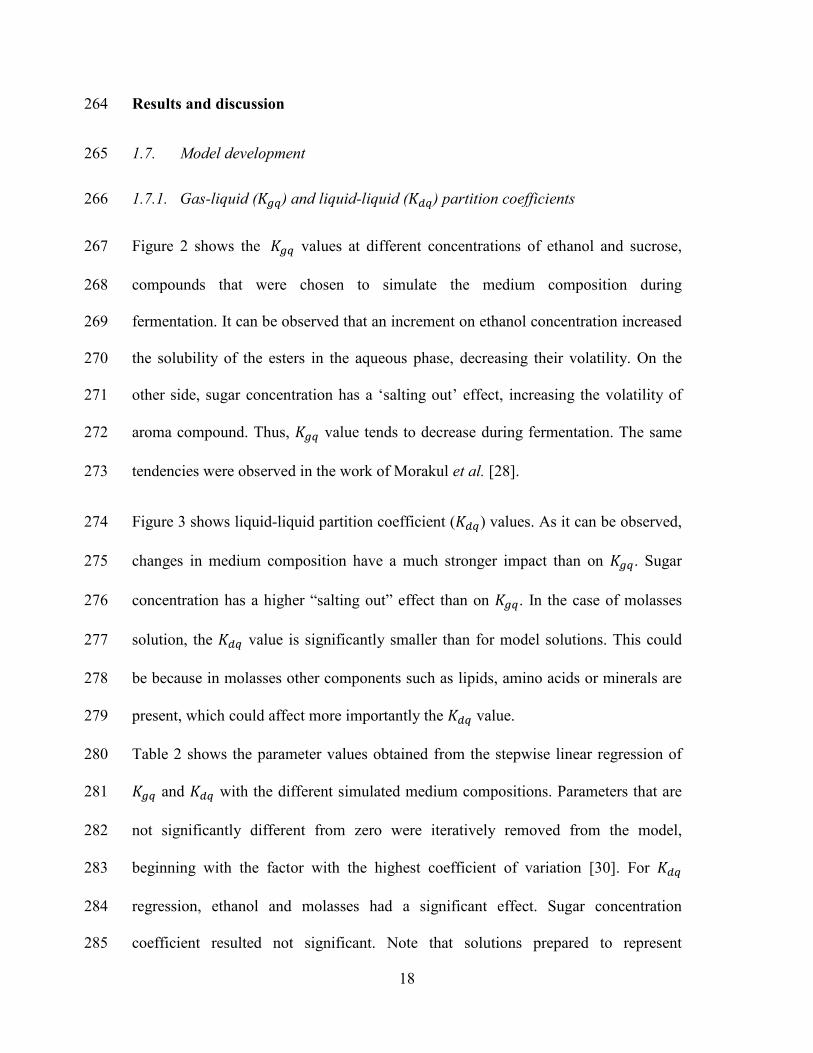
namely decane (𝑑) + aqueous medium (𝑞) and the stripping gas (𝑔) was written as: 200
𝑑(𝐶𝑑𝑉𝑑 + 𝐶𝑞𝑉𝑞)𝑑𝑡
= −𝐶𝑔 ∙ 𝑄𝑔 (5)
where 𝐶𝑑, 𝐶𝑞 and 𝐶𝑔 are IAA concentration in decane, aqueous and gas phase 201
respectively, 𝑉𝑑 and 𝑉𝑞 are the volumes (mL) of decane and aqueous phase 202
respectively, and 𝑄𝑔 is the air flow rate through the system (mL h-1). It was assumed 203
that the liquid and gas phases were not in equilibrium, and the expression of mass 204
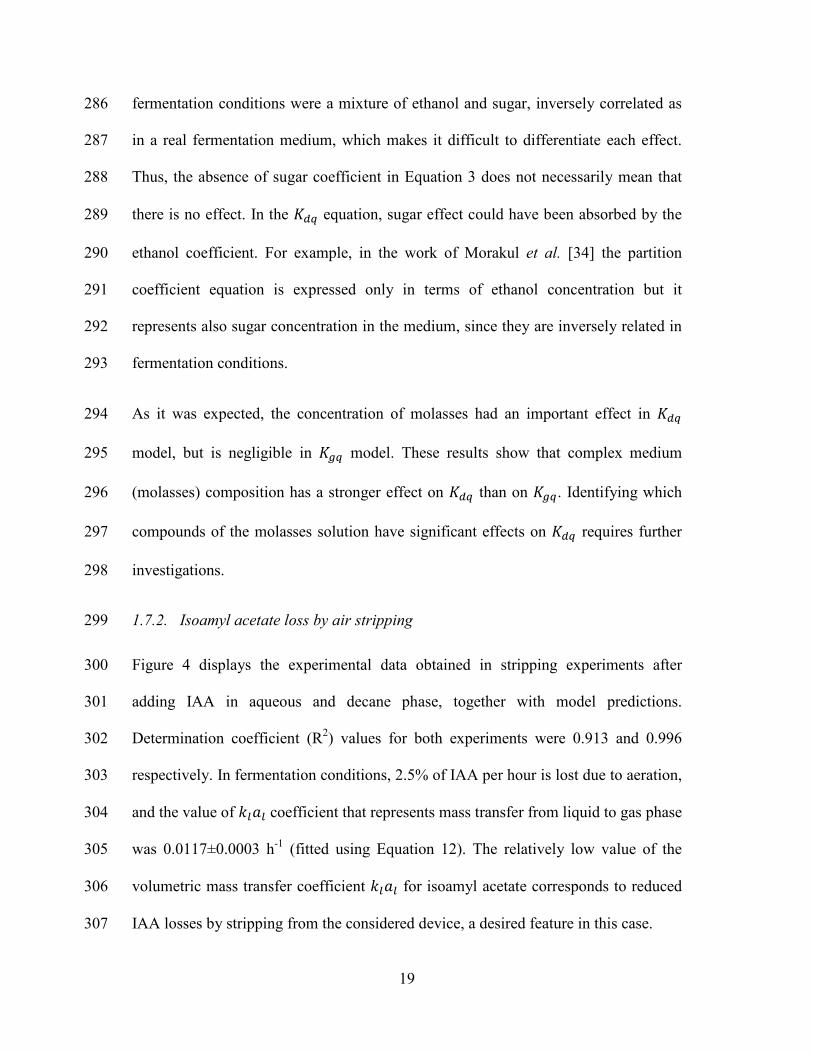
transfer from the two liquid phases (𝑑, 𝑞) to the air flow (gas phase, 𝑔) is: 205
𝐶𝑔 ∙ 𝑄𝑔 = 𝑘𝑞𝐴𝑞 �𝐶𝑞 − 𝐶𝑔𝐾𝑔𝑞
� + 𝑘𝑑𝐴𝑑 �𝐶𝑑 −𝐶𝑔𝐾𝑔𝑑
� (6)
Here 𝑘𝑞 and 𝑘𝑑 are the overall mass transfer coefficients of IAA between the gas and 206
the aqueous and decane phases respectively, and 𝐴𝑞 and 𝐴𝑑 are the interfacial areas 207
of each phase with air bubbles [31]. 𝐾𝑔𝑑 is the partition coefficient between the gas 208
and decane phases determined from Equations 1 and 2 according to Equation 7. 209
𝐾𝑔𝑑 ≝𝐶𝑔∗
𝐶𝑑∗=
𝐾𝑔𝑞𝐾𝑑𝑞
(7)
At time scale of IAA production process by fermentation (12 h), equilibrium was 210
considered between the aqueous phase and decane: 211

14
𝐶𝑞 = 𝐶𝑑𝐾𝑑𝑞
(8)
After substituting 𝐶𝑞 from Equation 8, equation 6 was solved for 𝐶𝑔, giving: 212
𝐶𝑔 = 𝑘𝑙𝑎𝑙
�𝐷𝑔 + 𝑘𝑙𝑎𝑙𝐾𝑔𝑑
� ∙ 𝐶𝑑 (9)
where 213
𝑘𝑙𝑎𝑙 =�𝑘𝑞𝐴𝑞𝐾𝑑𝑞
+ 𝑘𝑑𝐴𝑑�
𝑉𝑞 and 𝐷𝑔 = 𝑄𝑔
𝑉𝑞 (10)
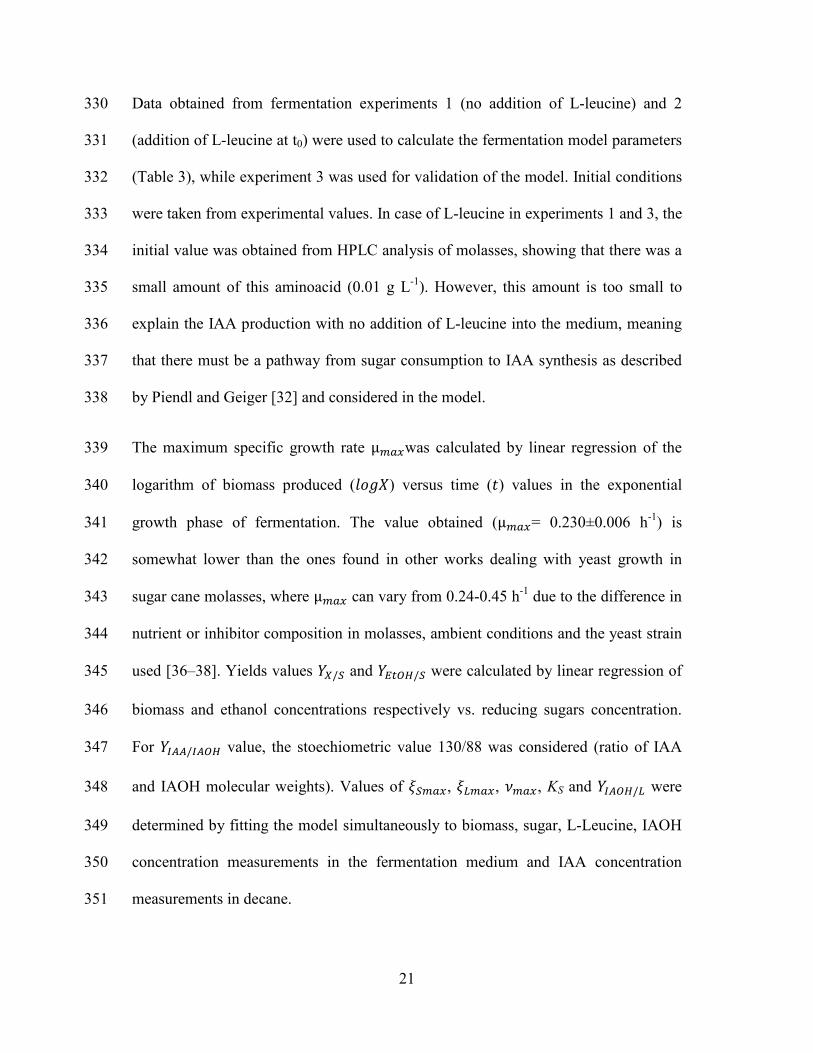
The product 𝑘𝑙𝑎𝑙 is a volumetric mass transfer coefficient which characterizes 214
transfer between the liquid phase (decane + aqueous medium) as a whole and the gas 215
phase and 𝐷𝑔 is the specific aeration rate of the medium. 216
Substituting Equation 9 in 5, the loss rate of IAA, considering decane as the reference 217
medium, is obtained: 218
𝑑𝐶𝑑𝑑𝑡
= −𝑘𝑙𝑎𝑙 ∙ 𝐷𝑔
�𝐷𝑔 + 𝑘𝑙𝑎𝑙𝐾𝑔𝑑
� �𝑉𝑑𝑉𝑞
+ 1𝐾𝑑𝑞
�∙ 𝐶𝑑 (11)
Equation (11) can be solved easily assuming 𝐾𝑖, 𝑘𝑖, 𝐴𝑖 and 𝑉𝑖 to be constant in 219
isothermal conditions, leading to Equation 12 that gives the residual concentration of 220
IAA in decane considering the stripping effect of the air fed into the system: 221
15
𝐶𝑑 = 𝐶𝑑0𝑒𝑥𝑝�−𝑘𝑙𝑎𝑙 ∙ 𝐷𝑔
�𝐷𝑔 + 𝑘𝑙𝑎𝑙𝐾𝑔𝑑
� �𝑉𝑑𝑉𝑞
+ 1𝐾𝑑𝑞
�𝑡� (12)
222
The only unknown parameter in this equation is the volumetric mass transfer 223
coefficient (𝑘𝑙𝑎𝑙). In order to verify the assumption that liquid phases are not in 224
equilibrium with the gas phase and IAA stripping is limited by mass transfer, a 225
variant of the model considering equilibrium between the gas and the liquid phases 226
was also considered for comparison, corresponding to a very large 𝑘𝑙𝑎𝑙 value. In that 227
situation, Equation 12 reduces to Equation 13: 228
𝐶𝑑 = 𝐶𝑑0𝑒𝑥𝑝 �−𝐾𝑔𝑑 ∙ 𝐷𝑔
�𝑉𝑑𝑉𝑞
+ 1𝐾𝑑𝑞
�𝑡� (13)
1.6. Modeling the isoamyl acetate production by fermentation 229
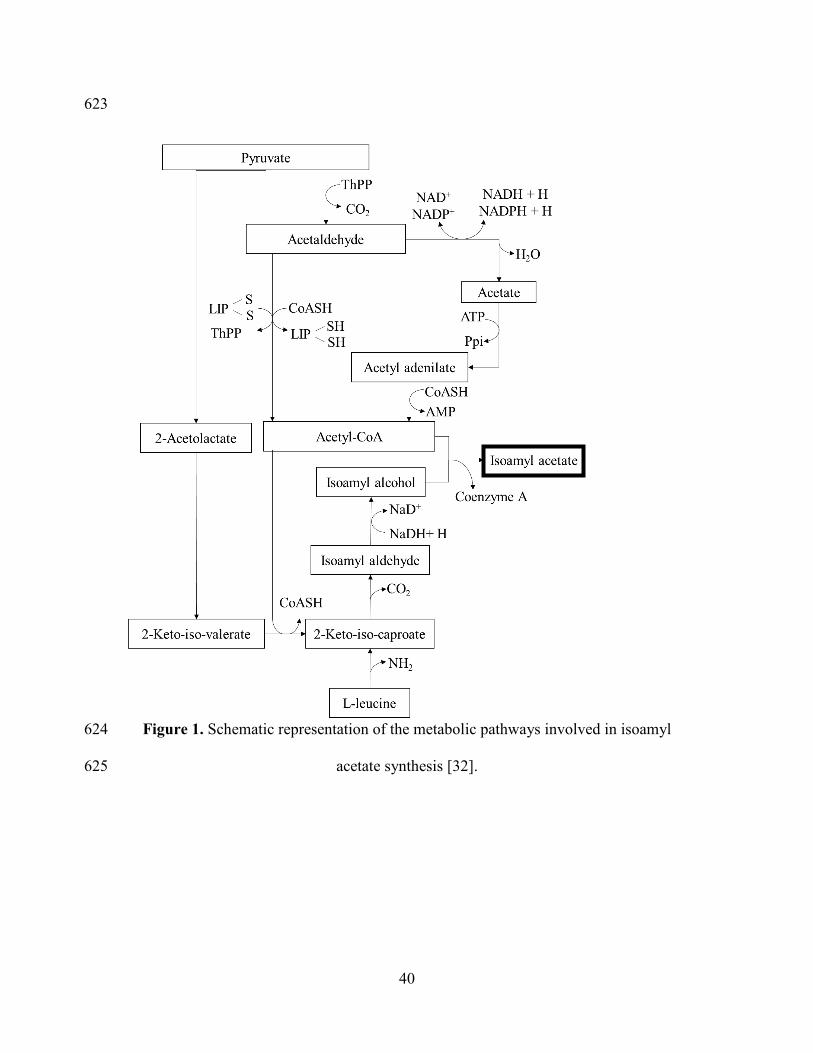
To develop the fermentation model, the metabolic pathway involved in IAA synthesis 230
by yeast was considered (Figure 1) [32]. IAA is formed from esterification of IAOH 231
and the acetyl group from acetyl coenzyme A. Depending on medium composition, 232
IAOH could be produced de novo from sugars consumption or by a catabolic 233
pathway from degradation of the aminoacid L-leucine, called Ehrlich pathway [33]. 234
The acetyl-CoA formed during metabolism comes mainly from sugar consumption 235
and is used in several other reactions like biosynthesis of lipids, amino acids, fatty 236
acids, and is also involved in the tricarboxylic acids cycle [32]. 237

16
Table 1 shows the equations used to describe the production and consumption of the 238
compounds considered in the fermentation model, without considering extraction by 239
decane and losses by stripping. Biomass, ethanol, IAOH and IAA are the produced 240
compounds, while fermentable reducing sugar, L-leucine and IAOH as well, are the 241
consumed ones. To describe biomass production, the Monod equation was used 242
(Equations 14 and 20). In that case biomass production is proportional to fermentable 243
sugars consumption. Therefore, fermentable sugars consumption was described by 244
Equation 18, 𝑌𝑋/𝑆 being the yield of biomass production related to sugar 245
consumption. Ethanol production was also considered to be proportional to sugar 246
consumption (Equation 15), using the corresponding yield (𝑌𝐸𝑡𝑂𝐻/𝑆). 247
According to the metabolic pathway (Figure 1), IAOH is formed from both sugars 248
and L-leucine consumption, with the corresponding specifics production rates 𝜉𝑆 and 249
𝜉𝐿 and is consumed for IAA synthesis with yield 𝑌𝐼𝐴𝐴/𝐼𝐴𝑂𝐻 (Equation 16). For IAA 250
production from IAOH, an analogous of the Monod equation was used, considering 251
both fermentable sugars and IAOH as limiting substrates (Equations 17 and 23). L-252
leucine consumption is described by Equation 19, the specific consumption rate also 253
involving fermentable sugar as limiting substrate (Equation 22). 254
1.6.1. Coupled model 255
In order to represent the IAA retained in the fermentation system with decane and 256
stripping, the mass balance equation for IAA production from the fermentation model 257
(Equation 17) was modified to include IAA partition between the fermentation 258

17
medium and decane as well as IAA losses by stripping (Equation 11) leading to 259
equation 24: 260
𝑑𝐶𝑑𝑑𝑡
= 𝜈𝑋𝑉𝑞
𝑉𝑑 + 𝑉𝑞𝐾𝑑𝑞
−𝑘𝑙𝑎𝑙 ∙ 𝐷𝑔
�𝐷𝑔 + 𝑘𝑙𝑎𝑙𝐾𝑔𝑑
� �𝑉𝑑𝑉𝑞
+ 1𝐾𝑑𝑞
�𝐶𝑑 (24)
The result was expressed in terms of IAA concentration in decane (assuming 261
equilibrium between fermentation medium and decane, Equation 8) because all 262
concentration measurements were performed in this phase. 263
18
Results and discussion 264
1.7. Model development 265
1.7.1. Gas-liquid (𝐾𝑔𝑞) and liquid-liquid (𝐾𝑑𝑞) partition coefficients 266
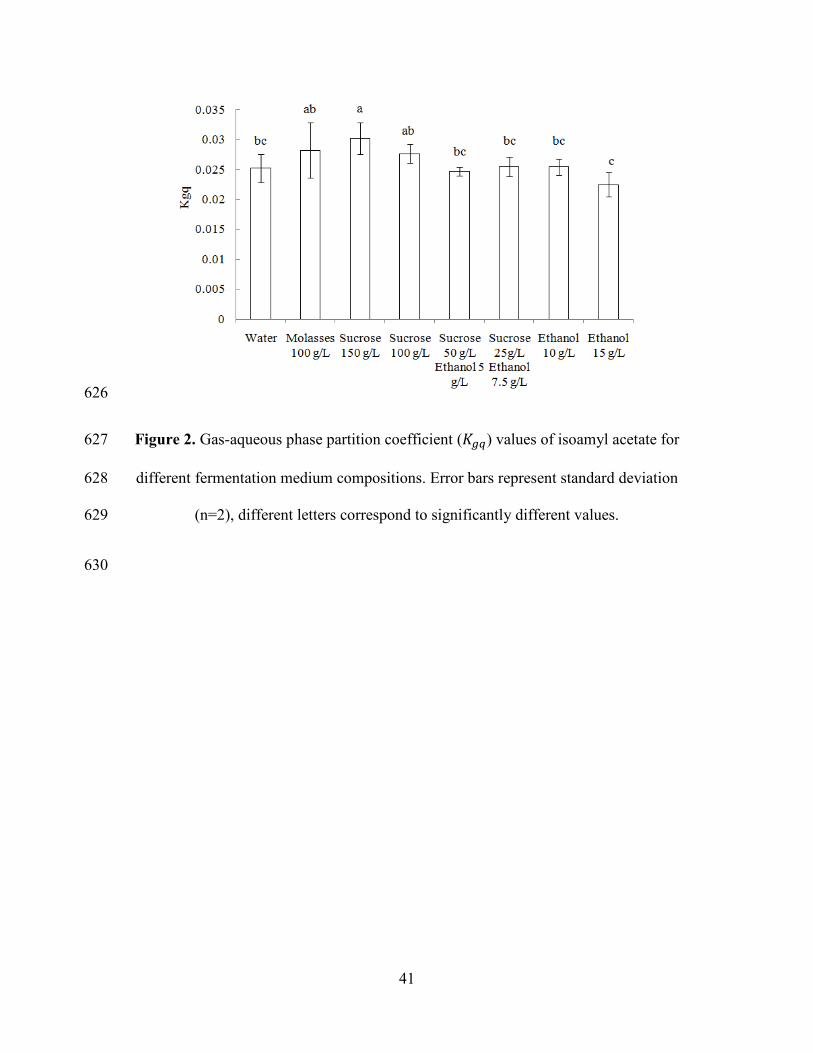
Figure 2 shows the 𝐾𝑔𝑞 values at different concentrations of ethanol and sucrose, 267
compounds that were chosen to simulate the medium composition during 268
fermentation. It can be observed that an increment on ethanol concentration increased 269
the solubility of the esters in the aqueous phase, decreasing their volatility. On the 270
other side, sugar concentration has a ‘salting out’ effect, increasing the volatility of 271
aroma compound. Thus, 𝐾𝑔𝑞 value tends to decrease during fermentation. The same 272
tendencies were observed in the work of Morakul et al. [28]. 273
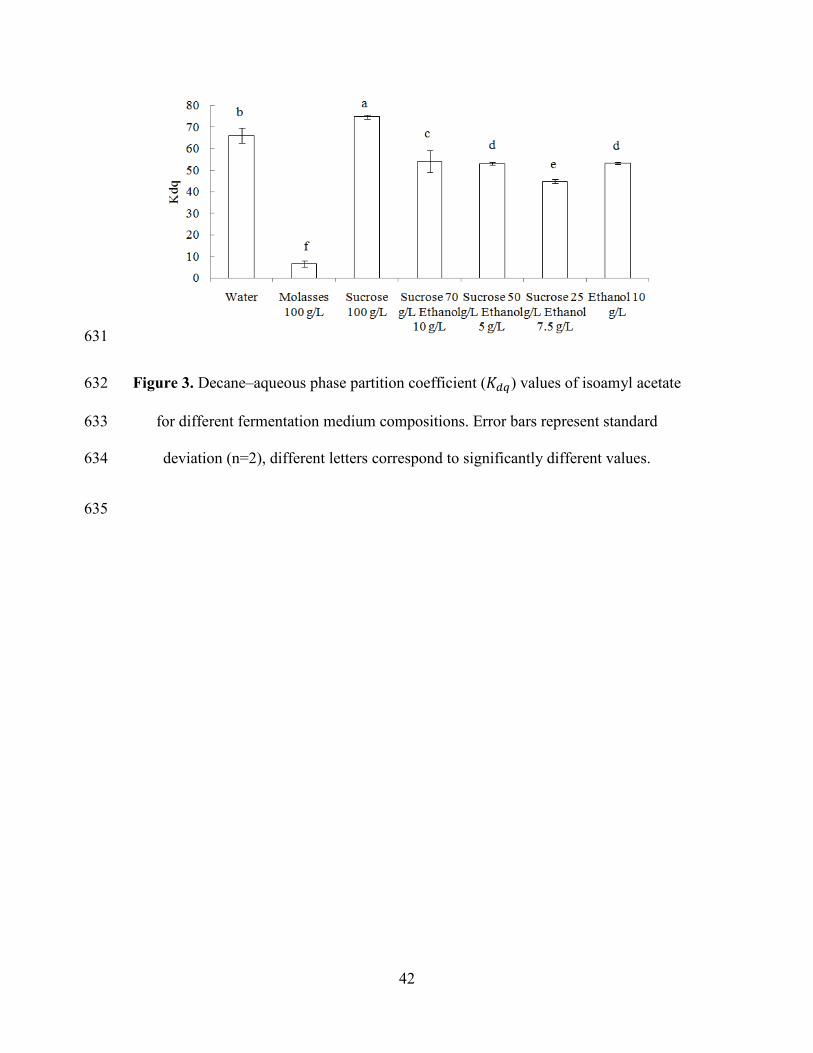
Figure 3 shows liquid-liquid partition coefficient (𝐾𝑑𝑞) values. As it can be observed, 274
changes in medium composition have a much stronger impact than on 𝐾𝑔𝑞. Sugar 275
concentration has a higher “salting out” effect than on 𝐾𝑔𝑞. In the case of molasses 276
solution, the 𝐾𝑑𝑞 value is significantly smaller than for model solutions. This could 277
be because in molasses other components such as lipids, amino acids or minerals are 278
present, which could affect more importantly the 𝐾𝑑𝑞 value. 279
Table 2 shows the parameter values obtained from the stepwise linear regression of 280
𝐾𝑔𝑞 and 𝐾𝑑𝑞 with the different simulated medium compositions. Parameters that are 281
not significantly different from zero were iteratively removed from the model, 282
beginning with the factor with the highest coefficient of variation [30]. For 𝐾𝑑𝑞 283
regression, ethanol and molasses had a significant effect. Sugar concentration 284
coefficient resulted not significant. Note that solutions prepared to represent 285
19
fermentation conditions were a mixture of ethanol and sugar, inversely correlated as 286
in a real fermentation medium, which makes it difficult to differentiate each effect. 287
Thus, the absence of sugar coefficient in Equation 3 does not necessarily mean that 288
there is no effect. In the 𝐾𝑑𝑞 equation, sugar effect could have been absorbed by the 289
ethanol coefficient. For example, in the work of Morakul et al. [34] the partition 290
coefficient equation is expressed only in terms of ethanol concentration but it 291
represents also sugar concentration in the medium, since they are inversely related in 292
fermentation conditions. 293
As it was expected, the concentration of molasses had an important effect in 𝐾𝑑𝑞 294
model, but is negligible in 𝐾𝑔𝑞 model. These results show that complex medium 295
(molasses) composition has a stronger effect on 𝐾𝑑𝑞 than on 𝐾𝑔𝑞. Identifying which 296
compounds of the molasses solution have significant effects on 𝐾𝑑𝑞 requires further 297
investigations. 298
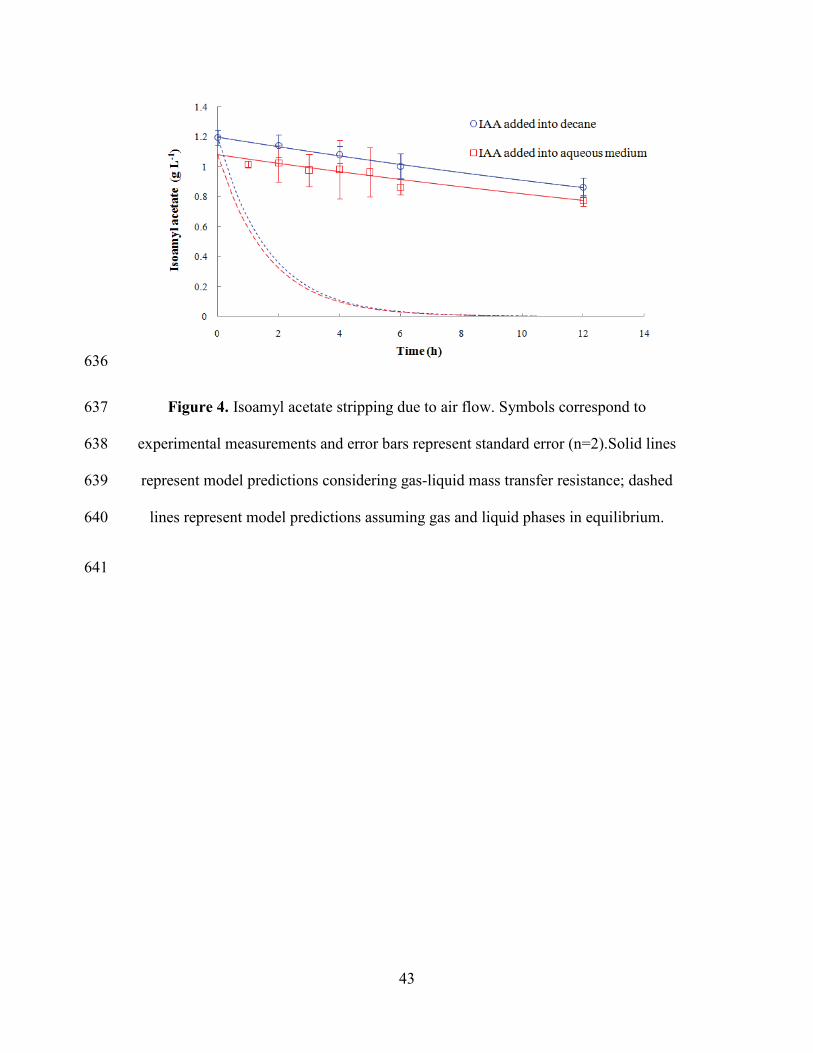
1.7.2. Isoamyl acetate loss by air stripping 299
Figure 4 displays the experimental data obtained in stripping experiments after 300
adding IAA in aqueous and decane phase, together with model predictions. 301
Determination coefficient (R2) values for both experiments were 0.913 and 0.996 302
respectively. In fermentation conditions, 2.5% of IAA per hour is lost due to aeration, 303
and the value of 𝑘𝑙𝑎𝑙 coefficient that represents mass transfer from liquid to gas phase 304
was 0.0117±0.0003 h-1 (fitted using Equation 12). The relatively low value of the 305
volumetric mass transfer coefficient 𝑘𝑙𝑎𝑙 for isoamyl acetate corresponds to reduced 306
IAA losses by stripping from the considered device, a desired feature in this case. 307

20
Although aeration has an important effect on IAA loss from fermentation system, 308
Rojas et al. [20] observed that its production by non-Saccharomyces strains is 309
improved in highly aerobic culture conditions (shaking at 120 rpm), compared with 310
minimally aerobic conditions (without shaking). From all the strain tested, Pichia 311
anomala had the best IAA production and it had a 21 fold increase in aerobic 312
conditions. Also, Inoue et al. [35] reported a large amount of IAA produced by a 313
Hansenula mrakii strain in aerobic conditions. 314
For modeling purposes, it was assumed that decane and aqueous phase were in 315
equilibrium at the fermentation time scale. This assumption appears to be verified by 316
the experimental data shown in Figure 4. The experiment of IAA added into the 317
culture medium shows that after 1 h of aeration, IAA transferred into decane phase, 318
and in the following measurements a decrease of concentration due to aeration can be 319
observed. Thus, it appeared that within 1 h, equilibrium between the two phases was 320
reached. 321
Figure 4 also shows in dashed lines the calculated loss of IAA with the assumption 322
that liquid and gaseous phases are in equilibrium (Equation 13). IAA losses are 323
clearly overestimated, meaning that the equilibrium between gas and liquid phases is 324
far from being reached, probably because the residence time of the air bubbles fed in 325
the system is very short. This corroborates the assumption that the stripping 326
phenomenon due to air feed is limited by mass transfer between liquid and gas phase, 327
and validates the model built on that basis. 328
1.7.3. Parameter estimation for the fermentation model 329
21
Data obtained from fermentation experiments 1 (no addition of L-leucine) and 2 330
(addition of L-leucine at t0) were used to calculate the fermentation model parameters 331
(Table 3), while experiment 3 was used for validation of the model. Initial conditions 332
were taken from experimental values. In case of L-leucine in experiments 1 and 3, the 333
initial value was obtained from HPLC analysis of molasses, showing that there was a 334
small amount of this aminoacid (0.01 g L-1). However, this amount is too small to 335
explain the IAA production with no addition of L-leucine into the medium, meaning 336
that there must be a pathway from sugar consumption to IAA synthesis as described 337
by Piendl and Geiger [32] and considered in the model. 338
The maximum specific growth rate µ𝑚𝑎𝑥was calculated by linear regression of the 339
logarithm of biomass produced (𝑙𝑜𝑔𝑋) versus time (𝑡) values in the exponential 340
growth phase of fermentation. The value obtained (µ𝑚𝑎𝑥= 0.230±0.006 h-1) is 341
somewhat lower than the ones found in other works dealing with yeast growth in 342
sugar cane molasses, where µ𝑚𝑎𝑥 can vary from 0.24-0.45 h-1 due to the difference in 343
nutrient or inhibitor composition in molasses, ambient conditions and the yeast strain 344
used [36–38]. Yields values 𝑌𝑋/𝑆 and 𝑌𝐸𝑡𝑂𝐻/𝑆 were calculated by linear regression of 345
biomass and ethanol concentrations respectively vs. reducing sugars concentration. 346
For 𝑌𝐼𝐴𝐴/𝐼𝐴𝑂𝐻 value, the stoechiometric value 130/88 was considered (ratio of IAA 347
and IAOH molecular weights). Values of 𝜉𝑆𝑚𝑎𝑥, 𝜉𝐿𝑚𝑎𝑥, 𝜈𝑚𝑎𝑥, KS and 𝑌𝐼𝐴𝑂𝐻/𝐿 were 348
determined by fitting the model simultaneously to biomass, sugar, L-Leucine, IAOH 349
concentration measurements in the fermentation medium and IAA concentration 350
measurements in decane. 351
22
In the case of 𝐾𝑆𝐼𝐴, 𝐾𝐿 and 𝐾𝐼𝐴𝑂𝐻 values, it was found that in a range from 0 to 0.05 g 352
L-1 their value had a minor effect on the model predictions. It was not possible to 353
determine exact values for these parameters with the experimental data available, 354
because experiments were performed in batch mode and corresponding substrates 355
(sugar, L-leucine, IAOH) were rate limiting during too short time periods. These 356
parameters were thus fixed to 0.02 g L-1. For 𝐾𝑆, a value of 6.41 ± 0.57 g L-1 was 357
found. This value depends on numerous factors such as environmental conditions, 358
composition of the medium and the strain used, so the range of values found in the 359
literature is quite extensive. For example Das et al. [38] determined a 𝐾𝑆 of 1.53g L-1 360
in fermentation with Pichia fermentans in sugar cane bagasse extract, Ponce et al. 361
[37] determined a value of 4.1 g L-1 for Saccharomyces cerevisiae in fermentation of 362
sugar cane molasses. However, the value obtained in the present study is higher than 363
the works mentioned before, which confirms that substrate limitation coefficients 364
cannot be reliably determined in batch fermentations. Other micronutrients might 365
become limiting before complete sugar exhaustion. 366
1.8. Model validation 367
Once all model parameters were determined, data obtained from Experiment 3 368
(addition of L-leucine at t12) was used for model validation. Figure 5 shows the model 369
predictions compared to experimental data. In general, it was obtained a good 370
agreement for all considered compounds. Sugar consumption was quite well 371
described by the model (R2=0.986). The amount of the fermentable sugars was taken 372
as a fixed fraction of the total sugar concentration present in molasses, determined as 373
35% in Experiments 1 and 2. Biomass and ethanol are produced proportionally to the 374
23
sugar consumption, in agreement with the modeling assumptions; ethanol production 375
was well described by the model (R2=0.977). However, biomass is slightly 376
underestimated by about 13% (R2=0.917), which means that the growth rate µ𝑚𝑎𝑥 377
and yield 𝑌𝑋/𝑆 values were slightly higher in Experiment 3 than in Experiments 1 and 378
2. 379
Figure 5 shows that before 12 h of fermentation, IAOH was produced from sugars at 380
a low specific rate ξS, and almost entirely converted to IAA. After L-leucine addition, 381
the production rate of IAOH increased significantly since the Ehrlich pathway 382
participated to the synthesis with a higher specific rate 𝜉𝐿. This is consistent with 383
parameter values reported in Table 3, where 𝜉𝐿𝑚𝑎𝑥 > 𝜉𝑆𝑚𝑎𝑥. Most of IAOH produced 384
was converted to IAA at a specific rate ν, which is consistent with νmax > ξLmax in 385
Table 3. However, it can be observed that there is a fraction of IAOH accumulated in 386
the fermentation medium, also described by the model (R2=0.819). 387
IAOH accumulation is an important point to pay attention, since it has been proved 388
that this compound has an inhibitory effect on yeast cells growth. Saccharomyces 389
cerevisiae growth is slower at a concentration of about 4 g L-1 [39,40]; and Williopsis 390
saturnus growth is inhibited at concentrations of fusel oil greater than 2% (about 8 g 391
L-1 of IAOH). In this study, IAOH concentration determined in all the experiments 392
was less than 0.74 g L-1, a small value compared to those found in the literature. This 393
is an advantage of maintaining a low IAA concentration in fermentation medium by 394
ISPR, which accelerates IAOH esterification, reducing its accumulation. 395

24
The accumulation of IAA was quite well described by the model (R2=0.952) which 396
also calculated its actual production without losses by stripping (Figure 5). Model 397
calculations indicate an amount of about 17% of IAA lost by stripping in these 398
fermentation conditions. The highest IAA productivity obtained in experimental 399
conditions was 26 mg L-1 h-1 with addition of 4 g L-1 of L-leucine at 12 h of 400
fermentation, which is higher than other values reported in the literature obtained by 401
yeast fermentation without in situ extraction [6,41]. 402
1.9. Improvement strategies for isoamyl acetate production and retention 403
The developed model can be used as a tool to simulate the process of IAA production 404
in different conditions in order to find those that results in a better IAA production 405
and retention, with a more efficient use of L-leucine and decane. Key conditions that 406
can be modified in order to improve production and retention in the system are: i) the 407
time and amount of L-leucine addition, and ii) the decane to culture medium volume 408
ratio in fermentation system. 409
L-leucine was added to the medium at a concentration of 4 g L-1, however, 410
experimental data shows that it was not completely consumed by the cells, either 411
added from the beginning of fermentation or after 12 h. The model was used to test 412
different initial concentrations of L-leucine and simulate resulting IAA concentration 413
in decane. It was found that at concentrations of 1.6 g L-1 of L-leucine or higher, the 414
IAA final concentration is not significantly different from IAA production with 4 g L-415
1 of L-leucine, as shown in Figure 6. 416
25
Figure 7a shows IAA distribution in the fermentation-extraction system at different 417
decane/medium ratios. It can be observed that the amount of IAA recovered in decane 418
phase increases by increasing the decane volume, as one may expect. A better 419
extraction percentage from the fermentation medium and lower losses by air stripping 420
are obtained. Although the amount of product retained increases with the amount of 421
decane used, final concentration of IAA tends to decrease as shown in Figure 7b, 422
which means obtaining an increasingly diluted solution and higher costs of 423
subsequent product purification. The model is thus a useful decision making tool to 424
determine the appropriate amount of decane, taking into account losses, the retained 425
IAA fraction and the type of downstream process to be used for purification. In order 426
to have an idea of the maximum potential production of the process, a simulation was 427
performed with a very high decane to culture medium ratio (100:1), assuming that 428
there will be no significant IAA loss in this condition. According to the model, with 429
1.6 g L-1 of L-leucine one can obtain a maximum theoretical productivity of 63 mg L-430
1 h-1, based on IAA recovered in decane data. The actual value of solvent/medium 431
ratio has to be selected considering the need for further purification steps. The model 432
is thus a useful tool to perform an economic evaluation of the process, in order to 433
optimize costs. 434
26
Conclusion 435
A model able to describe isoamyl acetate (IAA) production from sugar cane molasses 436
and L-leucine as precursor, by the strain Pichia fermentans ITD00165 was developed 437
and successfully used to predict the ester production indifferent conditions. It 438
reproduces quite well the coupled phenomena of the in situ production/extraction 439
process, and allows identifying the key points that can be improved to increase 440
production. The in situ extraction with decane resulted in several advantages: it 441
increased IAA production by decreasing product inhibition and IAOH accumulation 442
in the medium, which has been proven to inhibit yeast cell growth. Decane had a 443
good biocompatibility with the strain used. Moreover, it has a good affinity with IAA 444
which is very volatile and poorly soluble in water, so it decreased the loss of IAA by 445
stripping. In addition, thanks to the model it is easier to monitor IAA production from 446
a single measurement in the decane phase and to calculate the total amount produced. 447
The model describes not only the biological production of IAA, but also includes the 448
physical distribution of the ester according to key factors, like aeration, medium 449
composition changes through fermentation and volume ratio of both liquid phases. It 450
provides a more complete panorama of the process, allowing to test different 451
configurations and find the best compromise between fermentation conditions and 452
IAA retention to get the highest possible amount of product at acceptable purification 453
costs. 454
Further investigation is needed in order to better understand the whole process. For 455
example, aeration is a very important factor for IAA production, but it also increases 456

27
the loss by stripping, so it is a key process factor that has to be controlled. The 457
developed model is able to determine the rate of isoamyl acetate loss due to aeration, 458
and it could be further extended to include the effect of different air flow rates on 459
IAA production and thus indicate the best compromise. After testing model 460
predictions in a wide range of situations of practical interest, its implementation in 461
industrial processes could make it a valuable tool for process optimization and 462
provide a solid basis for choosing and developing a suitable product recovery 463
strategy. 464
465
28
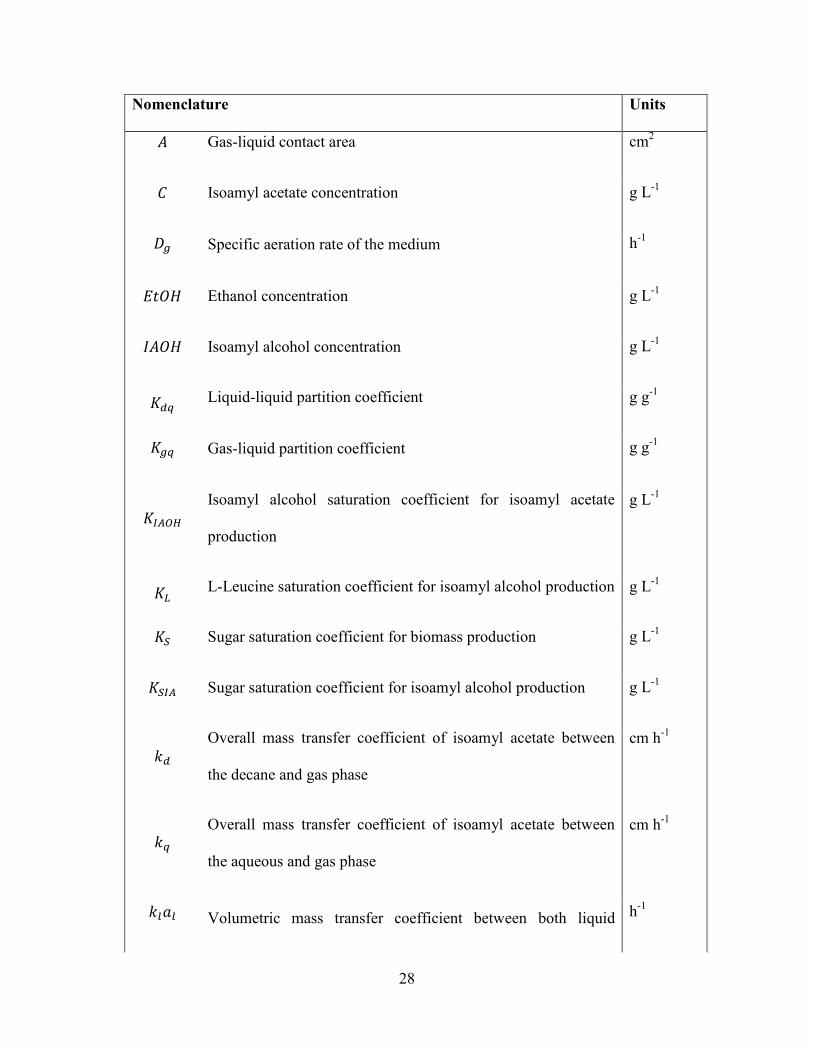
Nomenclature Units
𝐴 Gas-liquid contact area cm2
𝐶 Isoamyl acetate concentration g L-1
𝐷𝑔 Specific aeration rate of the medium h-1
𝐸𝑡𝑂𝐻 Ethanol concentration g L-1
𝐼𝐴𝑂𝐻 Isoamyl alcohol concentration g L-1
𝐾𝑑𝑞 Liquid-liquid partition coefficient g g-1
𝐾𝑔𝑞 Gas-liquid partition coefficient g g-1
𝐾𝐼𝐴𝑂𝐻 Isoamyl alcohol saturation coefficient for isoamyl acetate
production
g L-1
𝐾𝐿 L-Leucine saturation coefficient for isoamyl alcohol production g L-1
𝐾𝑆 Sugar saturation coefficient for biomass production g L-1
𝐾𝑆𝐼𝐴 Sugar saturation coefficient for isoamyl alcohol production g L-1
𝑘𝑑 Overall mass transfer coefficient of isoamyl acetate between
the decane and gas phase
cm h-1
𝑘𝑞 Overall mass transfer coefficient of isoamyl acetate between
the aqueous and gas phase
cm h-1
𝑘𝑙𝑎𝑙 Volumetric mass transfer coefficient between both liquid h-1
29
phases as a whole and the gas phase
𝐿 L-leucine concentration g L-1
𝑝1 … 𝑝5 Parameters of isoamyl acetate K𝑑𝑞 model -
𝑝𝑎 … 𝑝𝑒 Parameters of isoamyl acetate K𝑔𝑞 model -
𝑄𝑔 Aeration flowrate mL h-1
𝑆 Sugar concentration g L-1
𝑋 Biomass concentration g L-1
𝑌𝐸𝑡𝑂𝐻/𝑆 Ethanol yield per sugar consumption g g-1
𝑌𝐼𝐴𝐴/𝐼𝐴𝑂𝐻 Isoamyl acetate yield per isoamyl alcohol consumption g g-1
𝑌𝐼𝐴𝑂𝐻/𝐿 Isoamyl alcohol yield per L-leucine consumption g g-1
𝑌𝑋/𝑆 Biomass yield per sugar consumption g g-1
µ𝑚𝑎𝑥 Maximum specific cellular growth rate h-1
𝜈𝑚𝑎𝑥 Maximum specific isoamyl acetate production rate h-1
𝜉𝐿𝑚𝑎𝑥 Maximum specific isoamyl alcohol production rate (from L-
leucine)
h-1
𝜉𝑆𝑚𝑎𝑥 Maximum specific isoamyl alcohol production rate (from
sugars)
h-1
30
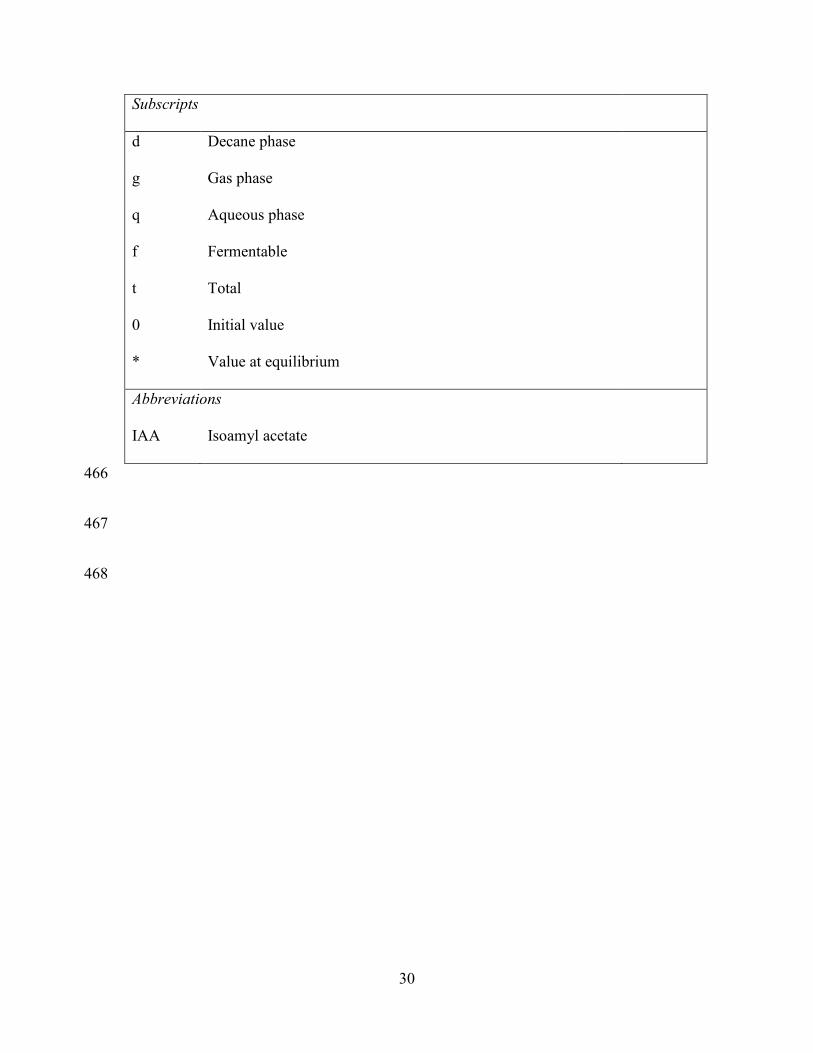
Subscripts
d Decane phase
g Gas phase
q Aqueous phase
f Fermentable
t Total
0 Initial value
* Value at equilibrium
Abbreviations
IAA Isoamyl acetate
466
467
468
31
REFERENCES 469
[1] S. Torres, M.D. Baigorí, S.L. Swathy, A. Pandey, G.R. Castro, Enzymatic 470
synthesis of banana flavour (isoamyl acetate) by Bacillus licheniformis S-86 esterase, 471
Food Res. Int. 42 (2009) 454–460. 472
[2] W. Osorio-Viana, H.N. Ibarra-Taquez, I. Dobrosz-Gómez, M.Á. Gómez-473
García, Hybrid membrane and conventional processes comparisonfor isoamyl acetate 474
production, Chem. Eng. Process. 76 (2014) 70–82. 475
[3] N. Mhetras, S. Patil, D. Gokhale, Lipase of Aspergillus niger NCIM 1207: A 476
Potential Biocatalyst for Synthesis of Isoamyl Acetate, Indian J Microbiol. 50 (2010) 477
432–437. 478
[4] M. Asunción, M. Sanromán, Production of Food Aroma Compounds: 479
Microbial and Enzymatic Methodologies, Food Technol Biotechnol. (2006) 335–353. 480
[5] N. Ben Akacha, M. Gargouri, Microbial and enzymatic technologies used for 481
the production of natural aroma compounds: Synthesis, recovery modeling, and 482
bioprocesses, Food Bioprod. Process. 94 (2015) 675–706. 483
doi:10.1016/j.fbp.2014.09.011. 484
[6] M. Yilmaztekin, H. Erten, T. Cabaroglu, Enhanced production of isoamyl 485
acetate from beet molasses with addition of fusel oil by Williopsis saturnus var. 486
saturnus, Food Chem. 112 (2009) 290–294. 487
[7] U. Krings, R.G. Berger, Biotechnological production of flavours and 488
fragrances, Appl Microbiol Biotechnol. 49 (1998) 1–8. 489
32
[8] J. Schrader, M.M.W. Etschmann, D. Sell, J.-M. Hilmer, J. Rabenhorst, 490
Applied biocatalysis for the synthesis of natural flavour compounds – current 491
industrial processes and future prospects, Biotechnol. Lett. 26 (2004) 463–472. 492
doi:10.1023/B:BILE.0000019576.80594.0e. 493
[9] M. Cvjetko, J. Vorkapić-Furač, P. Žnidaršič-Plazl, Isoamyl acetate synthesis 494
in imidazolium-based ionic liquids using packed bed enzyme microreactor, Process 495
Biochem. 47 (2012) 1344–1350. doi:10.1016/j.procbio.2012.04.028. 496
[10] M.J. Eisenmenger, J.I. Reyes-De-Corcuera, Enhanced synthesis of isoamyl 497
acetate using an ionic liquid–alcohol biphasic system at high hydrostatic pressure, J. 498
Mol. Catal. B Enzym. 67 (2010) 36–40. doi:10.1016/j.molcatb.2010.07.002. 499
[11] E. Fehér, V. Illeová, I. Kelemen-Horváth, K. Bélafi-Bakó, M. Polakovič, L. 500
Gubicza, Enzymatic production of isoamyl acetate in an ionic liquid–alcohol biphasic 501
system, J. Mol. Catal. B Enzym. 50 (2008) 28–32. 502
doi:10.1016/j.molcatb.2007.09.019. 503
[12] S.H. Krishna, S. Divakar, S.. Prapulla, N.. Karanth, Enzymatic synthesis of 504
isoamyl acetate using immobilized lipase from Rhizomucor miehei, J. Biotechnol. 87 505
(2001) 193–201. doi:10.1016/S0168-1656(00)00432-6. 506
[13] M.D. Romero, L. Calvo, C. Alba, A. Daneshfar, H.S. Ghaziaskar, Enzymatic 507
synthesis of isoamyl acetate with immobilized Candida antarctica lipase in n-hexane, 508
Enzyme Microb. Technol. 37 (2005) 42–48. doi:10.1016/j.enzmictec.2004.12.033. 509
33
[14] M.D. Romero, L. Calvo, C. Alba, M. Habulin, M. Primožič, ž. Knez, 510
Enzymatic synthesis of isoamyl acetate with immobilized Candida antarctica lipase 511
in supercritical carbon dioxide, J. Supercrit. Fluids. 33 (2005) 77–84. 512
doi:10.1016/j.supflu.2004.05.004. 513
[15] P. Žnidaršič-Plazl, I. Plazl, Modelling and experimental studies on lipase-514
catalyzed isoamyl acetate synthesis in a microreactor, Process Biochem. 44 (2009) 515
1115–1121. doi:10.1016/j.procbio.2009.06.003. 516
[16] T. Asano, T. Inoue, N. Kurose, N. Hiraoka, S. Kawakita, Improvement of 517
Isoamyl Acetate Productivity in Sake Yeast by Isolating Mutants Resistant to 518
Econazole, J. Biosci. Bioeng. 87 (1999) 697–699. 519
[17] K. Hirooka, Y. Yamamoto, N. Tsutsui, T. Tanaka, Improved production of 520
isoamyl acetate by a sake yeast mutant resistant to an isoprenoid analog and its 521
dependence on alcohol acetyltransferase activity, but not on isoamyl alcohol 522
production, J. Biosci. Bioeng. 99 (2005) 125–129. doi:10.1263/jbb.99.125. 523
[18] C. Plata, J.C. Mauricio, C. Millán, J.M. Ortega, Influence of glucose and 524
oxygen on the production of ethyl acetate and isoamyl acetate by a Saccharomyces 525
cerevisiae strain during alcoholic fermentation, World J. Microbiol. Biotechnol. 00 526
(2004) 1–7. 527
[19] M.G. Quilter, J.C. Hurley, F.J. Lynch, M.G. Murphy, The production of 528
isoamyl acetate from amyl alcohol by Saccharomyces cerevisiae, J. Inst. Brew. 109 529
(2003) 34–40. 530
34
[20] V. Rojas, J.V. Gil, F. Piñaga, P. Manzanares, Studies on acetate ester 531
production by non-Saccharomyces wine yeasts, Int. J. Food Microbiol. 70 (2001) 532
283–289. 533
[21] T. Lamer, H.E. Spinnler, I. Souchon, A. Voilley, Extraction of benzaldehyde 534
from fermentation broth by pervaporation, Process Biochem. 31 (1996) 533–542. 535
doi:10.1016/0032-9592(95)00098-4. 536
[22] A. Freeman, J.M. Woodley, M.D. Lilly, In Situ Product Removal as a Tool for 537
Bioprocessing, Nat Biotech. 11 (1993) 1007–1012. doi:10.1038/nbt0993-1007. 538
[23] S.H. Krishnaa, B. Manoharb, S. Divakara, S.G. Prapullaa, N.G. Karanth, 539
Optimization of isoamyl acetate production by using immobilized lipase from Mucor 540
miehei by response surface methodology, Enzyme Microb. Technol. 26 (2000) 131–541
136. 542
[24] G. Hernández-Carbajal, O.M. Rutiaga-Quiñones, A. Pérez-Silva, G. Saucedo-543
Castañeda, A. Medeiros, C.R. Soccol, N.Ó. Soto-Cruz, Screening of native yeast 544
from Agave duranguensis fermentation for isoamyl acetate production, Braz. Arch. 545
Biol. Technol. 56 (2013) 357–363. doi:10.1590/S1516-89132013000300002. 546
[25] G.L. Miller, R. Blum, W.E. Glennon, A.L. Burton, Measurement of 547
carboxymethylcellulase activity, Anal. Biochem. 1 (1960) 127–132. 548
[26] S. Yokoyama, J.-I. Hiramatsu, A Modified Ninhydrin Reagent Using Ascorbic 549
Acid Instead of Potassium Cyanide, J. Biosci. Bioeng. 95 (2003) 204–205. 550
[27] Agilent Technologies, Agilent J&W. GC Column Selection Guide, (2007). 551

35
[28] S. Morakul, V. Athes, J.-R. Mouret, J.-M. Sablayrolles, Comprehensive Study 552
of the Evolution of Gas-Liquid Partitioning of Aroma Compounds during Wine 553
Alcoholic Fermentation, J. Agric. Food Chem. 58 (2010) 10219–10225. 554
[29] L. Ettre, C. Welter, B. Kolb, Determination of gas-liquid partition coefficients 555
by automatic equilibrium headspace-gas chromatography utilizing the phase ratio 556
variation method, Chromatographia. (1993) 73–84. 557
[30] J.R. Mouret, V. Farines, J.M. Sablayrolles, I.C. Trelea, Prediction of the 558
production kinetics of the main fermentative aromas in winemaking fermentations, 559
Biochem. Eng. J. 103 (2015) 211–218. doi:10.1016/j.bej.2015.07.017. 560
[31] M. Marin, I. Baek, A.J. Taylor, Volatile Release from Aqueous Solutions 561
under Dynamic Headspace Dilution Conditions, J. Agric. Food Chem. 47 (1999) 562
4750–4755. 563
[32] A. Piendl, E. Geiger, Technological factors in the formation of esters during 564
fermentation, Brew. Dig. 55 (1980) 26–35. 565
[33] S. Derrick, P.J. Large, Activities of the enzimes of the Ehrlich pathway and 566
formation of branched-chain alcohols in Saccharomyces cerevisiae and Candida 567
utilis grown in continous cuture on valine or amonium as sole nitrogen source, J. 568
Gen. Microbiol. 139 (1993) 2783–2792. 569
[34] S. Morakul, J.-R. Mouret, P. Nicolle, I.C. Trelea, J.-M. Sablayrolles, V. Athes, 570
Modelling of the gas–liquid partitioning of aroma compounds during wine alcoholic 571
36
fermentation and prediction of aroma losses, Process Biochem. 46 (2011) 1125–1131. 572
doi:10.1016/j.procbio.2011.01.034. 573
[35] Y. Inoue, S. Trevanichi, K. Fukuda, S. Izawa, Y. Wakai, A. Kimura, Roles of 574
Esterase and Alcohol Acetyltransferase on Production of Isoamyl Acetate in 575
Hansenula mrakii, J. Agric. Food Chem. 45 (1997) 644–649. doi:10.1021/jf960648o. 576
[36] A. Dourado, G. Goma, U. Albuquerque, Y. Sevely, Modeling and static 577
optimization of the ethanol production in a cascade reactor. I. Modeling, Biotechnol. 578
Bioeng. 29 (1987) 187–194. doi:10.1002/bit.260290208. 579
[37] G.H.S.F. Ponce, J. Moreira Neto, S.S. De Jesus, J.C. de C. Miranda, R. Maciel 580
Filho, R.R. de Andrade, M.R. Wolf Maciel, Sugarcane molasses fermentation with in 581
situ gas stripping using low and moderate sugar concentrations for ethanol 582
production: Experimental data and modeling, Biochem. Eng. J. 110 (2016) 152–161. 583
doi:10.1016/j.bej.2016.02.007. 584
[38] D. Das, D. Charumathi, N. Das, Combined effects of sugarcane bagasse 585
extract and synthetic dyes on the growth and bioaccumulation properties of Pichia 586
fermentans MTCC 189, J. Hazard. Mater. 183 (2010) 497–505. 587
doi:10.1016/j.jhazmat.2010.07.051. 588
[39] C. Martinez-Anaya, In yeast, the pseudohyphal phenotype induced by isoamyl 589
alcohol results from the operation of the morphogenesis checkpoint, J. Cell Sci. 116 590
(2003) 3423–3431. doi:10.1242/jcs.00634. 591

37
[40] K. Kern, C. Nunn, A. Pichova, J. Dickinson, Isoamyl alcohol-induced 592
morphological change in involves increases in mitochondria and cell wall chitin 593
content, FEMS Yeast Res. 5 (2004) 43–49. doi:10.1016/j.femsyr.2004.06.011. 594
[41] M.G. Quilter, J.C. Hurley, F.J. Lynch, M.G. Murphy, The production of 595
isoamyl acetate from amyl alcohol by Saccharomyces cerevisiae, J. Inst. Brew. 109 596
(2003) 34–40. 597
598
38
Figure legends 599
Figure 1. Schematic representation of the metabolic pathways involved in isoamyl 600
acetate synthesis [32]. 601
Figure 2. Gas-aqueous phase partition coefficient (𝐾𝑔𝑞) values of isoamyl acetate for 602
different fermentation medium compositions. Error bars represent standard deviation 603
(n = 2), different letters correspond to significantly different values. 604
Figure 3. Decane–aqueous phase partition coefficient (𝐾𝑑𝑞) values of isoamyl acetate 605
for different fermentation medium compositions. Error bars represent standard 606
deviation (n=2), different letters correspond to significantly different values. 607
Figure 4. Isoamyl acetate stripping due to air flow. Symbols correspond to 608
experimental measurements and error bars represent standard error (n = 2). Solid 609
lines represent model predictions considering gas-liquid mass transfer resistance; 610
dashed lines represent model predictions assuming gas and liquid phases in 611
equilibrium. 612
Figure 5. Comparison between model predictions and measured data in the validation 613
experiment, with L-leucine addition at 12 hours of fermentation. Symbols: 614
experimental measurements, solid lines: model predictions, dotted line: produced 615
isoamyl acetate without considering losses by air stripping. 616
Figure 6. Final isoamyl acetate concentration in decane at different concentrations of 617
L-leucine. 618

39
Figure 7.a) Isoamyl acetate distribution in the fermentation-extraction system and 619
losses by stripping for different decane/medium ratios, b) Isoamyl acetate recovery 620
and final concentration in decane at different decane/medium ratios. Results obtained 621
from model simulations. 622
40
623
Figure 1. Schematic representation of the metabolic pathways involved in isoamyl 624
acetate synthesis [32]. 625
41
626
Figure 2. Gas-aqueous phase partition coefficient (𝐾𝑔𝑞) values of isoamyl acetate for 627
different fermentation medium compositions. Error bars represent standard deviation 628
(n=2), different letters correspond to significantly different values. 629
630
42
631
Figure 3. Decane–aqueous phase partition coefficient (𝐾𝑑𝑞) values of isoamyl acetate 632
for different fermentation medium compositions. Error bars represent standard 633
deviation (n=2), different letters correspond to significantly different values. 634
635
43
636
Figure 4. Isoamyl acetate stripping due to air flow. Symbols correspond to 637
experimental measurements and error bars represent standard error (n=2).Solid lines 638
represent model predictions considering gas-liquid mass transfer resistance; dashed 639
lines represent model predictions assuming gas and liquid phases in equilibrium. 640
641
44
642
643
Figure 5. Comparison between model predictions and measured data in the validation 644
experiment, with L-leucine addition at 12 hours of fermentation. Symbols: 645
experimental measurements, solid lines: model predictions, dotted line: produced 646
isoamyl acetate without considering losses by air stripping. 647
648
45
649
Figure 6. Final isoamyl acetate concentration in decane predicted by the model for 650
different initial concentrations of L-leucine. 651
46
652
Figure 7. a) Isoamyl acetate distribution in the fermentation-extraction system and 653
losses by stripping for different decane/medium ratios, b) Isoamyl acetate recovery 654
and final concentration in decane at different decane/medium ratios. Results obtained 655
from model simulations. 656
657
47
Table 1. Mass balance and kinetic equations for the fermentation model, without considering
isoamyl acetate extraction by decane and losses by stripping
Compounds Equations
Biomass 𝑑𝑋𝑑𝑡
= 𝜇𝑋 (14)
Ethanol 𝑑𝐸𝑡𝑂𝐻𝑑𝑡
=𝑌𝐸𝑡𝑂𝐻/𝑆
𝑌𝑋/𝑆𝜇𝑋 (15)
Isoamyl alcohol 𝑑𝐼𝐴𝑂𝐻𝑑𝑡
= 𝜉𝑆𝑋 + 𝜉𝐿𝑋 −1
𝑌𝐼𝐴𝐴/𝐼𝐴𝑂𝐻𝜈𝑋 (16)
Isoamyl acetate 𝑑𝐶𝑑𝑡
= 𝜈𝑋 (17)
Fermentable reducing sugars 𝑑𝑆𝑓𝑑𝑡
= −1𝑌𝑋/𝑆
𝜇𝑋 (18)
Leucine 𝑑𝐿𝑑𝑡
= −1
𝑌𝐼𝐴𝑂𝐻/𝐿𝜉𝐿𝑋 (19)
Kinetic parameters Equations
Specific growth rate 𝜇 = 𝜇𝑚𝑎𝑥𝑆𝑓
𝐾𝑆 + 𝑆𝑓 (20)
Specific isoamyl alcohol
production rate (with sugar
consumption)
𝜉𝑆 = 𝜉𝑆𝑚𝑎𝑥𝑆𝑓
𝐾𝑆𝐼𝐴 + 𝑆𝑓 (21)
Specific isoamyl alcohol
production rate (with L-leucine
consumption)
𝜉𝐿 = 𝜉𝐿𝑚𝑎𝑥𝐿
𝐾𝐿 + 𝐿𝑆𝑓
𝐾𝑆𝐼𝐴 + 𝑆𝑓 (22)
Specific isoamyl acetate
production rate 𝜈 = 𝜈𝑚𝑎𝑥
𝐼𝐴𝑂𝐻𝐾𝐼𝐴𝑂𝐻 + 𝐼𝐴𝑂𝐻
𝑆𝑓𝐾𝑆𝐼𝐴 + 𝑆𝑓
(23)
658
659
48
Table 2. Parameter values for isoamyl acetate partition coefficient in the fermentation system.
Partition coefficient Parameter Factor Value ± standard error
Gas-liquid
𝑝1 - -3.716 ±0.026
𝑝2 𝑆𝑡 0.0014±0.0004
𝑝3 𝐸 0
𝑝4 𝑆𝑡𝐸 0
𝑝5 𝑀 0
Liquid-liquid
𝑝𝑎 - 4.211± 0.083
𝑝𝑏 𝑆𝑡 0
𝑝𝑐 𝐸 -0.031± 0.012
𝑝𝑑 𝑆𝑡𝐸 0
𝑝𝑒 𝑀 -2.326± 0.145
660
661
49
Table 3. Model parameters and experimental initial conditions
Parameters Value± standard error Unit
µ𝑚𝑎𝑥 0.230 ±0.006 h-1
𝜉𝑆𝑚𝑎𝑥 0.0013± 0.0003 h-1
𝜉𝐿𝑚𝑎𝑥 0.0046± 0.0005 h-1
𝜈𝑚𝑎𝑥 0.0062 ± 0.0004 h-1
𝑌𝑋/𝑆 0.854 ± 0.050 g g-1
𝑌𝐸𝑡𝑂𝐻/𝑆 0.373 ± 0.020 g g-1
𝑌𝐼𝐴𝑂𝐻/𝐿 0.452 ± 0.055 g g-1
𝑌𝐼𝐴𝐴/𝐼𝐴𝑂𝐻 130/88 g g-1
𝐾𝑆 6.41± 0.57 g L-1
𝐾𝑆𝐼𝐴 0.02 g L-1
𝐾𝐿 0.02 g L-1
𝐾𝐼𝐴𝑂𝐻 0.02 g L-1
𝑘𝑙𝑎𝑙 0.0117 ± 0.0003 h-1
Initial conditions 1) No addition 2) Addition at 𝑡0 3) Addition at 𝑡12
𝑋0 0.86± 0.12 0.89± 0.04 1.01± 0.01 g L-1
𝑆0 35.18± 0.53 32.24± 1.88 36.40± 1.03 g L-1
𝐿0 0.0093 4.03± 0.02 0.0093 g L-1
𝐸𝑡𝑂𝐻0 0.21± 0.03 0.17± 0.02 0.23± 0.05 g L-1
𝐼𝐴𝑂𝐻0 0 0 0 g L-1
𝐶𝑑0 0 0 0 g L-1
662