research article determinants of attrition to follow-up in
TRANSCRIPT
Hindawi Publishing CorporationEpidemiology Research InternationalVolume 2013, Article ID 936365, 9 pageshttp://dx.doi.org/10.1155/2013/936365
Research ArticleDeterminants of Attrition to Follow-Up in a Multicentre CohortStudy in Children-Results from the IDEFICS Study
Sabrina Hense,1 Hermann Pohlabeln,2 Nathalie Michels,3 Staffan Mårild,4
Lauren Lissner,5 Eva Kovacs,6 Luis A. Moreno,7 Charalampos Hadjigeorgiou,8
Toomas Veidebaum,9 Licia Iacovello,10 Yannis Pitsiladis,11 Lucia Reisch,12
Alfonso Siani,13 and Wolfgang Ahrens14
1 Department of Clinical Epidemiology, Leibniz Institute for Prevention Research and Epidemiology, BIPS, Germany2Department of Biometry and Data Management, Leibniz Institute for Prevention Research and Epidemiology, BIPS, Germany3Department of Public Health, Faculty of Medicine and Health Sciences, Ghent University, Belgium4Department of Paediatrics, Institute of Clinical Sciences, Sahlgrenska Academy at University of Gothenburg, Sweden5 Department of Public Health and Community Medicine, University of Gothenburg, Sweden6Department of Pediatrics, Medical Faculty, University of Pecs, Hungary7 GENUD Research Group, Facultad de Ciencias de la Salud, University of Zaragoza, Spain8 Research and Education Institute of Child Health, Cyprus9National Institute for Health Development, Estonia10Fondazione di Ricerca e Cura Giovanni Paolo II, Universita Cattolica, Campobasso, Italy11College of Medicine, Veterinary & Life Sciences, Institute of Cardiovascular & Medical Sciences, University of Glasgow, UK12Department of Intercultural Communication and Management, Copenhagen Business School, Denmark13Unit of Epidemiology & Population Genetics, Institute of Food Sciences, National Research Council, Avellino, Italy14Department of Epidemiological Methods and Etiologic Research, Leibniz Institute for Prevention Research and Epidemiology,BIPS, University of Bremen, 28359, Germany
Correspondence should be addressed to Wolfgang Ahrens; [email protected]
Received 10 January 2013; Accepted 13 April 2013
Academic Editor: Demosthenes Panagiotakos
Copyright © 2013 Sabrina Hense et al. This is an open access article distributed under the Creative Commons Attribution License,which permits unrestricted use, distribution, and reproduction in any medium, provided the original work is properly cited.
Cohort participant retention is a crucial element and may depend on several factors. Based on data from a multicentre cohort ofEuropean children, the effect of baseline participation on attrition and the association with and the impact of single determinantsin relation to the extent of attrition were investigated. Data was available for 16,225 children from the IDEFICS baseline survey(2007/2008). Attrition was defined as nonparticipation in the first follow-up examination (2009/2010). Determinants of attritionwere analysed by logistic regression. The statistical significance level was set at 𝛼 = 0.01 to account for the large sample size.The strongest associations were seen for baseline item non-response, especially when information on migration background(odds ratio (OR) = 1.55; 99% confidence interval (CI): 1.04, 2.31), single parenthood (OR = 1.37; 99% CI: 1.12, 1.67), or well-being(OR = 1.46; 99% CI: 1.19, 1.79) was lacking. Drop-out proportion rose with the number of missing items. Overweight, loweducation, single parenthood and low well-being scores were independent determinants of attrition. Baseline participation, andthe individual determinant effects seemed unrelated to the variation of the extent of attrition between study centres. A high levelof item nonresponse as well as overweight and disadvantageous sociodemographic conditions were identified as main attritiondeterminants, suggesting the consideration of these aspects in conduct and analysis of cohort studies in childhood obesity research.
1. Introduction
In longitudinal studies, participant adherence is a crucialelement of study organisation that requires considerable
effort and time. However, attrition is an inevitable problemin almost every epidemiological cohort study, which leadsto a loss of power and potentially introduces selection biaswhen drop-out is related to the exposures or outcomes of
2 Epidemiology Research International
interest. The most commonly reported types of attrition arenoncontact or refusal [1]. In fact, the motivation of studyparticipants to remain involved in the study activities maydecline over time andwill depend on several factors. To applyappropriate analysis strategies and to allow for a correct inter-pretation of the results from longitudinal studies, knowledgeon the determinants of attrition is important. Additionally,information about factors affecting attrition is crucial toimprove retention of cohort participants. One aspect thathas been reported to affect attrition is baseline response andconcomitant recruitment efforts [2]. With regard to longi-tudinal studies in children and adolescents, where parentalconsent is commonly required, low parental education level,migration background, and single parenthood have beensuggested tomainly determine attrition rates [3, 4]. However,there is little experience regarding the effects of differentdeterminants of attrition in a multicentre study where thesame standardized study protocols are applied. Such datawould facilitate the comparison between study centres thathave different attrition proportions and baseline responsesand the extent of potential selection effects.
This report presents results regarding the proportionateattrition from baseline (T0) to the first follow-up examina-tion (T1) of the multi-centre IDEFICS (identification andprevention of dietary- and lifestyle-induced health effectsin children and infants) study. We investigated systematicdrop-out related to weight status as well as to known obesityrisk factors, such as low educational level and migrationbackground. Also, behavioural factors that have been identi-fied as determinants of overweight, such as screen time [5],sleep duration [6], or dietary behaviour [7, 8], and certainpsychosocial aspects [9] were examined as possible attritiondeterminants. Selective drop-out with regard to these factorsmight affect the interpretability of results in longitudinalstudies of obesity research. Additionally, allocation to eitherthe intervention or the control region (see the followingfor more details) might play a role in this context and wastherefore another determinant of interest in the present study.
In this paper we (1) assess determinants of attrition andevaluate whether (2) the baseline participation in the studycentres is associatedwith attrition and (3) whether the impactof attrition determinants is stronger in centres with a highproportionate attrition.
2. Methods
2.1. Study Population. The IDEFICS project is a population-based multicentre intervention study which included chil-dren aged 2 to 9 years from eight European countries.
Between September 2007 and May 2008, 31 543 childrenfrom schools and preschools in selected regions in Italy, Esto-nia, Cyprus, Belgium, Sweden, Hungary, Germany, and Spainwere asked to participate in the baseline survey (T0) based ona two-stage random sampling strategy with schools present-ing the first and classes presenting the second level of sampl-ing units. Of those children 16864 (53.4%) accepted the invi-tation, with 16225 (51.4%) providing the parental question-naire and measurement of weight and height [10]. They thusfulfilled the preset inclusion criteria and were eligible for
the present analysis. The baseline survey was followed by acommunity- and setting-based intervention program con-cerning diet, physical activity, and stress coping, which wasimplemented in intervention regions in each of the partici-pating countries, while no intervention was offered in thecontrol regions [11]. Two years later, every child who hadparticipated in the T0 survey was automatically reinvited totake part in the T1 survey (September 2009 to June 2010).Both, T0 and T1 involved a similarly extensive study proto-col including anthropometric examinations, collection ofbiosamples (urine, saliva, blood), fitness, and sensory testsas well as questionnaires on diet, psychosocial, behavioural,and environmental factors to be filled in by the parents. Moredetailed information on the study protocol and procedurescan be found elsewhere [12].
Two age groups were defined with one group includingchildren aged 2 to<6 years (preschool children) and the othergroup including children aged 6 to 9 years (school children)at baseline.
In each country, the participating centres obtained ethicalapproval by their responsible authority. All children andtheir parents provided oral and written informed consent,respectively, for all examinations and/or the collection ofsamples, subsequent analysis, and storage of personal dataand collected samples. More detailed information on thestudy design, applied instruments, and measurements as wellas baseline response rates with regard to the respective studymodules has been presented elsewhere [10].
2.2. Measurements
2.2.1. Attrition. The outcome measure was a dichotomousvariable for attrition at two-year follow-up (T1 participantversus T1 nonparticipant). The amount of attrition per studycentre was expressed as a percentage of the number of base-line participants.
2.2.2. Baseline Characteristics. All measurements were con-ducted according to a manual of standardized proceduresin all centres. Body height was measured without shoes bytrained staff using a portable stadiometer (SECA225).Weightwas measured by means of an adapted version of electronicscale TANITA BC 420 SMA, wearing only underwear. BMIwas calculated and then categorized according to the criteriaof the International Obesity Task Force [13]. Our referencecategory included normal and underweight children. Dataon personal, social, environmental, and behavioural factorsof each child, such as parental education level, family status,migration background, time spent in front of a TV or PCscreen (screen time), and well-being was collected by meansof a standardized parental self-completion questionnaire.Education level was categorized according to the Interna-tional Standard Classification of Education (ISCED). Fourlevels of education (low versus medium-low versus medium-high versus high) were created out of the six ISCED levels,with ISCED levels 0–2 being defined as low education, level3 being defined medium-low, level 4 being defined as med-ium-high, and level 5 and higher being defined as high edu-cation. Migration background was defined as either mother
Epidemiology Research International 3
or father of the child or both parents being born in a foreigncountry. Family statuswas defined as single versus two-parentfamilies.
A well-being scale was developed, including informationon emotional well-being, self-esteem, family, and friends.Though the scale itself was not validated, these questionswere based on the respective subscales from the Kiddy-KINDLR for parents of children aged 4–7 years, a validatedquestionnaire for measuring health-related quality of life inchildren [14]. Answers were given according to a 4-pointLikert scale (never, rarely, sometimes, often/all the time),that was adapted to the original 5-point Likert scale of theKINDLR. Since the IDEFICS parental questionnaire did notcomprise the whole subscale set from KINDLR (questions onphysical well-being and everyday functioning were excludedin IDEFICS) no total instrument score, but only sum scoresbased on the included subscales were created as proposed bythe authors of the original instrument [15]. Based on thesescores we created four well-being categories (low, medium-low, medium-high, and high). More detailed information onthe KINDLR scores can be found at http://www.kindl.org/[15].
Information on dietary habits was obtained from a vali-dated standardized Food Frequency Questionnaire (CEHQ-FFQ) [16, 17]. A variable representing the weekly consump-tion of junk food (including sweetened drinks, chocolate ornut based spreads, snacks) was created based on this data.Furthermore, the parents were asked if soft drinks wereavailable during meals (yes versus no).
Sleep duration was assessed using a 24-hour dietary recall(SACINA). SACINA is a computer-based instrument thatwas filled out by parents or guardian of each participatingchild and contained questions on the time at which thechild got up in the morning and went to bed on theprevious day. Nocturnal sleep duration was calculated asthe difference between bed and get-up time in the SACINAinterview resulting in a continuous variable. More detailedinformation on the sleep duration assessment in IDEFICS isgiven elsewhere [6, 18]. Two sleep duration categories werecreated (≤11 hours of sleep versus >11 hours of sleep).
A “non-response-score” was developed, taking intoaccount the amount of item non-response per participantwith regard to the variables of the baseline survey, resultingin four categories: none (no item non-response); low (1 itemnon-response); medium (2 or more item non-responses).
Baseline participation rate was included in the analysis asa dichotomous variable per study centre with the categorieslow (<50%) versus high (≥50%).
2.3. Statistical Analysis. Descriptive analyses describe attri-tion proportion and sample characteristics in the participat-ing study centres (countries). Chi square statistics were usedfor comparison of categorical variables. To analyse the associ-ation between potential determinants and individual attrition(as a dichotomous dependant variable) we used separatelogistic regression models. More precisely, we applied theprocedure GLIMMIX (SAS Institute, Cary, North Carolina,USA) and included adjustments for the second-level random
67.481.880.1
77.573.2
68.864.4
55.448.5
32.618.219.9
22.526.8
31.235.6
44.651.5
0 20 40 60 80 100
AllSweden
SpainEstoniaCyprus
ItalyBelgium
GermanyHungary
(%)
Follow-upNo follow-up
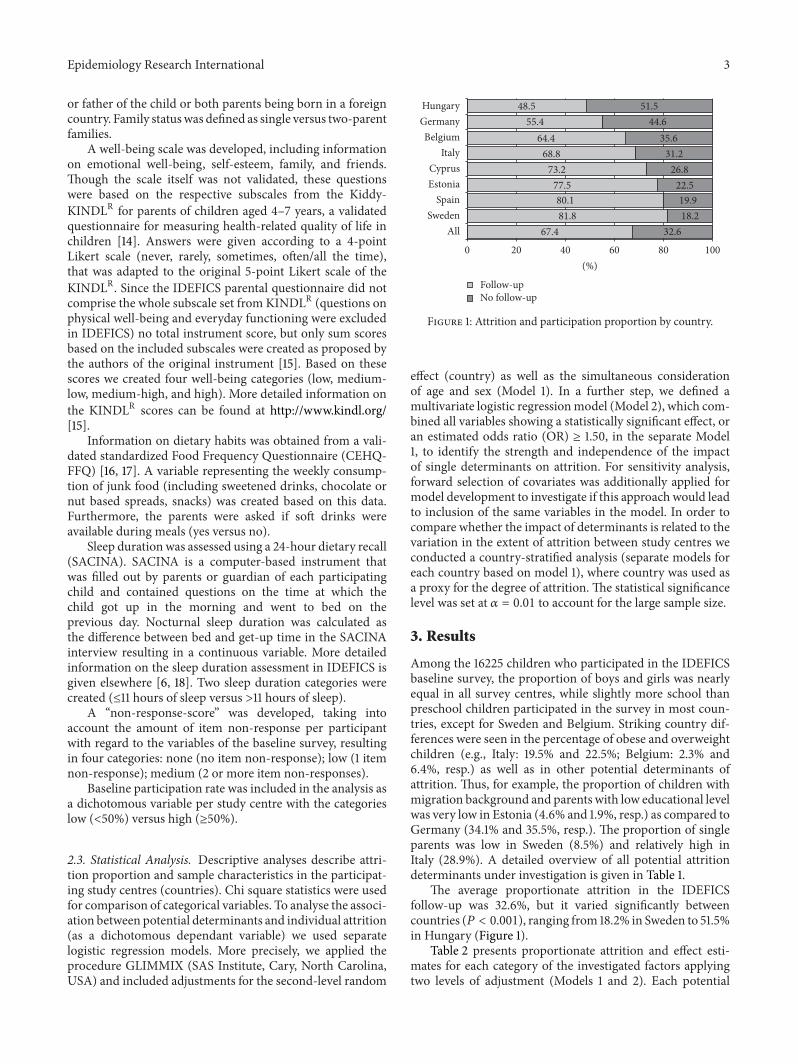
Figure 1: Attrition and participation proportion by country.
effect (country) as well as the simultaneous considerationof age and sex (Model 1). In a further step, we defined amultivariate logistic regressionmodel (Model 2), which com-bined all variables showing a statistically significant effect, oran estimated odds ratio (OR) ≥ 1.50, in the separate Model1, to identify the strength and independence of the impactof single determinants on attrition. For sensitivity analysis,forward selection of covariates was additionally applied formodel development to investigate if this approach would leadto inclusion of the same variables in the model. In order tocompare whether the impact of determinants is related to thevariation in the extent of attrition between study centres weconducted a country-stratified analysis (separate models foreach country based on model 1), where country was used asa proxy for the degree of attrition. The statistical significancelevel was set at 𝛼 = 0.01 to account for the large sample size.
3. Results
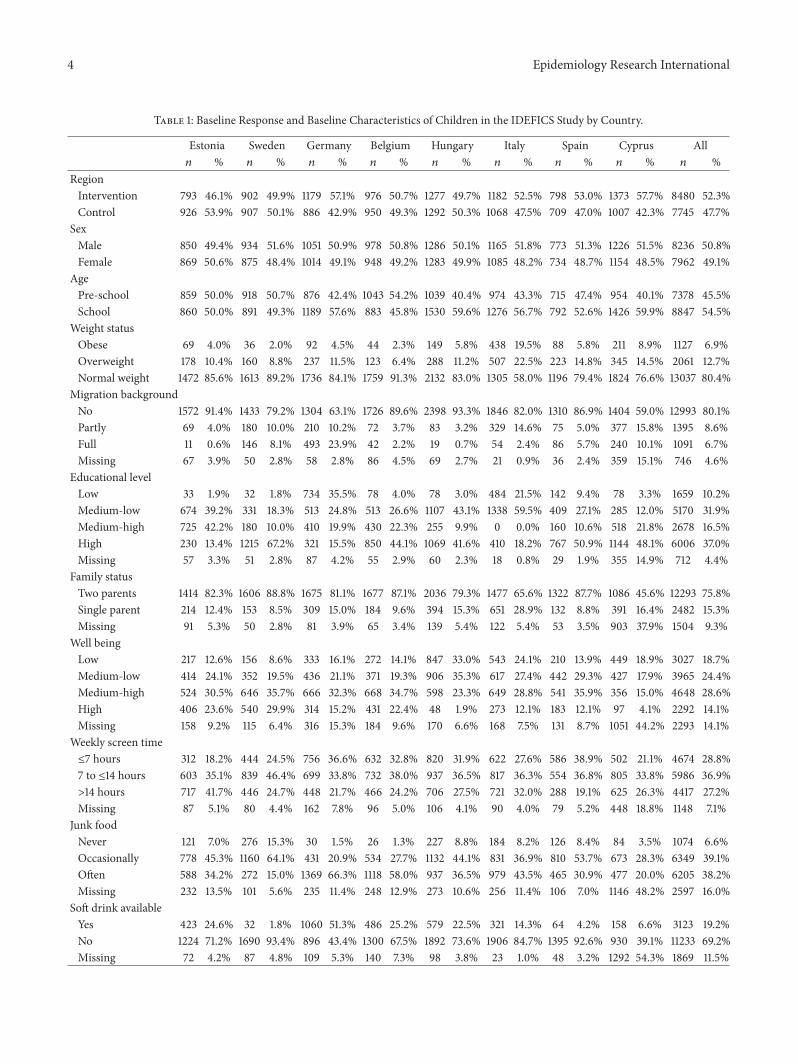
Among the 16225 children who participated in the IDEFICSbaseline survey, the proportion of boys and girls was nearlyequal in all survey centres, while slightly more school thanpreschool children participated in the survey in most coun-tries, except for Sweden and Belgium. Striking country dif-ferences were seen in the percentage of obese and overweightchildren (e.g., Italy: 19.5% and 22.5%; Belgium: 2.3% and6.4%, resp.) as well as in other potential determinants ofattrition. Thus, for example, the proportion of children withmigration background and parents with low educational levelwas very low in Estonia (4.6% and 1.9%, resp.) as compared toGermany (34.1% and 35.5%, resp.). The proportion of singleparents was low in Sweden (8.5%) and relatively high inItaly (28.9%). A detailed overview of all potential attritiondeterminants under investigation is given in Table 1.
The average proportionate attrition in the IDEFICSfollow-up was 32.6%, but it varied significantly betweencountries (𝑃 < 0.001), ranging from 18.2% in Sweden to 51.5%in Hungary (Figure 1).
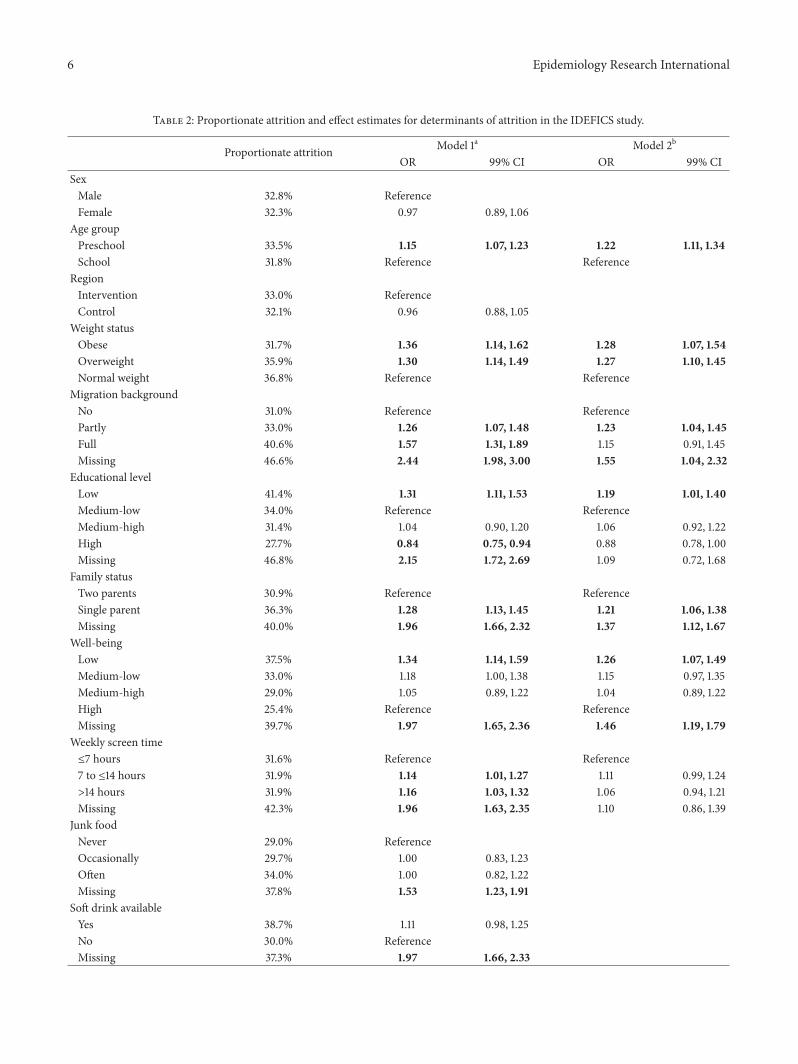
Table 2 presents proportionate attrition and effect esti-mates for each category of the investigated factors applyingtwo levels of adjustment (Models 1 and 2). Each potential
4 Epidemiology Research International
Table 1: Baseline Response and Baseline Characteristics of Children in the IDEFICS Study by Country.
Estonia Sweden Germany Belgium Hungary Italy Spain Cyprus All𝑛 % 𝑛 % 𝑛 % 𝑛 % 𝑛 % 𝑛 % 𝑛 % 𝑛 % 𝑛 %
RegionIntervention 793 46.1% 902 49.9% 1179 57.1% 976 50.7% 1277 49.7% 1182 52.5% 798 53.0% 1373 57.7% 8480 52.3%Control 926 53.9% 907 50.1% 886 42.9% 950 49.3% 1292 50.3% 1068 47.5% 709 47.0% 1007 42.3% 7745 47.7%
SexMale 850 49.4% 934 51.6% 1051 50.9% 978 50.8% 1286 50.1% 1165 51.8% 773 51.3% 1226 51.5% 8236 50.8%Female 869 50.6% 875 48.4% 1014 49.1% 948 49.2% 1283 49.9% 1085 48.2% 734 48.7% 1154 48.5% 7962 49.1%
AgePre-school 859 50.0% 918 50.7% 876 42.4% 1043 54.2% 1039 40.4% 974 43.3% 715 47.4% 954 40.1% 7378 45.5%School 860 50.0% 891 49.3% 1189 57.6% 883 45.8% 1530 59.6% 1276 56.7% 792 52.6% 1426 59.9% 8847 54.5%
Weight statusObese 69 4.0% 36 2.0% 92 4.5% 44 2.3% 149 5.8% 438 19.5% 88 5.8% 211 8.9% 1127 6.9%Overweight 178 10.4% 160 8.8% 237 11.5% 123 6.4% 288 11.2% 507 22.5% 223 14.8% 345 14.5% 2061 12.7%Normal weight 1472 85.6% 1613 89.2% 1736 84.1% 1759 91.3% 2132 83.0% 1305 58.0% 1196 79.4% 1824 76.6% 13037 80.4%
Migration backgroundNo 1572 91.4% 1433 79.2% 1304 63.1% 1726 89.6% 2398 93.3% 1846 82.0% 1310 86.9% 1404 59.0% 12993 80.1%Partly 69 4.0% 180 10.0% 210 10.2% 72 3.7% 83 3.2% 329 14.6% 75 5.0% 377 15.8% 1395 8.6%Full 11 0.6% 146 8.1% 493 23.9% 42 2.2% 19 0.7% 54 2.4% 86 5.7% 240 10.1% 1091 6.7%Missing 67 3.9% 50 2.8% 58 2.8% 86 4.5% 69 2.7% 21 0.9% 36 2.4% 359 15.1% 746 4.6%
Educational levelLow 33 1.9% 32 1.8% 734 35.5% 78 4.0% 78 3.0% 484 21.5% 142 9.4% 78 3.3% 1659 10.2%Medium-low 674 39.2% 331 18.3% 513 24.8% 513 26.6% 1107 43.1% 1338 59.5% 409 27.1% 285 12.0% 5170 31.9%Medium-high 725 42.2% 180 10.0% 410 19.9% 430 22.3% 255 9.9% 0 0.0% 160 10.6% 518 21.8% 2678 16.5%High 230 13.4% 1215 67.2% 321 15.5% 850 44.1% 1069 41.6% 410 18.2% 767 50.9% 1144 48.1% 6006 37.0%Missing 57 3.3% 51 2.8% 87 4.2% 55 2.9% 60 2.3% 18 0.8% 29 1.9% 355 14.9% 712 4.4%
Family statusTwo parents 1414 82.3% 1606 88.8% 1675 81.1% 1677 87.1% 2036 79.3% 1477 65.6% 1322 87.7% 1086 45.6% 12293 75.8%Single parent 214 12.4% 153 8.5% 309 15.0% 184 9.6% 394 15.3% 651 28.9% 132 8.8% 391 16.4% 2482 15.3%Missing 91 5.3% 50 2.8% 81 3.9% 65 3.4% 139 5.4% 122 5.4% 53 3.5% 903 37.9% 1504 9.3%
Well beingLow 217 12.6% 156 8.6% 333 16.1% 272 14.1% 847 33.0% 543 24.1% 210 13.9% 449 18.9% 3027 18.7%Medium-low 414 24.1% 352 19.5% 436 21.1% 371 19.3% 906 35.3% 617 27.4% 442 29.3% 427 17.9% 3965 24.4%Medium-high 524 30.5% 646 35.7% 666 32.3% 668 34.7% 598 23.3% 649 28.8% 541 35.9% 356 15.0% 4648 28.6%High 406 23.6% 540 29.9% 314 15.2% 431 22.4% 48 1.9% 273 12.1% 183 12.1% 97 4.1% 2292 14.1%Missing 158 9.2% 115 6.4% 316 15.3% 184 9.6% 170 6.6% 168 7.5% 131 8.7% 1051 44.2% 2293 14.1%
Weekly screen time≤7 hours 312 18.2% 444 24.5% 756 36.6% 632 32.8% 820 31.9% 622 27.6% 586 38.9% 502 21.1% 4674 28.8%7 to ≤14 hours 603 35.1% 839 46.4% 699 33.8% 732 38.0% 937 36.5% 817 36.3% 554 36.8% 805 33.8% 5986 36.9%>14 hours 717 41.7% 446 24.7% 448 21.7% 466 24.2% 706 27.5% 721 32.0% 288 19.1% 625 26.3% 4417 27.2%Missing 87 5.1% 80 4.4% 162 7.8% 96 5.0% 106 4.1% 90 4.0% 79 5.2% 448 18.8% 1148 7.1%
Junk foodNever 121 7.0% 276 15.3% 30 1.5% 26 1.3% 227 8.8% 184 8.2% 126 8.4% 84 3.5% 1074 6.6%Occasionally 778 45.3% 1160 64.1% 431 20.9% 534 27.7% 1132 44.1% 831 36.9% 810 53.7% 673 28.3% 6349 39.1%Often 588 34.2% 272 15.0% 1369 66.3% 1118 58.0% 937 36.5% 979 43.5% 465 30.9% 477 20.0% 6205 38.2%Missing 232 13.5% 101 5.6% 235 11.4% 248 12.9% 273 10.6% 256 11.4% 106 7.0% 1146 48.2% 2597 16.0%
Soft drink availableYes 423 24.6% 32 1.8% 1060 51.3% 486 25.2% 579 22.5% 321 14.3% 64 4.2% 158 6.6% 3123 19.2%No 1224 71.2% 1690 93.4% 896 43.4% 1300 67.5% 1892 73.6% 1906 84.7% 1395 92.6% 930 39.1% 11233 69.2%Missing 72 4.2% 87 4.8% 109 5.3% 140 7.3% 98 3.8% 23 1.0% 48 3.2% 1292 54.3% 1869 11.5%

Epidemiology Research International 5
Table 1: Continued.
Estonia Sweden Germany Belgium Hungary Italy Spain Cyprus All𝑛 % 𝑛 % 𝑛 % 𝑛 % 𝑛 % 𝑛 % 𝑛 % 𝑛 % 𝑛 %
Sleep duration≤11 hours 1289 75.0% 848 46.9% 937 45.4% 209 10.9% 865 33.7% 1578 70.1% 464 30.8% 908 38.2% 7098 43.7%>11 hours 42 2.4% 366 20.2% 649 31.4% 199 10.3% 36 1.4% 64 2.8% 40 2.7% 45 1.9% 1441 8.9%Missing 388 22.6% 595 32.9% 479 23.2% 1518 78.8% 1668 64.9% 608 27.0% 1003 66.6% 1427 60.0% 7686 47.4%
Item nonresponseNone 1490 86.7% 1644 90.9% 1649 79.9% 1628 84.5% 2276 88.6% 1907 84.8% 1299 86.2% 1150 48.3% 13043 80.4%Low 159 9.2% 104 5.7% 296 14.3% 204 10.6% 214 8.3% 295 13.1% 163 10.8% 249 10.5% 1684 10.4%High 70 4.1% 61 3.4% 120 5.8% 94 4.9% 79 3.1% 48 2.1% 45 3.0% 981 41.2% 1498 9.2%
Baseline response 54.5% 65.6% 48.2% 58.3% 43.7% 60.0% 41.4% 49.9% 51.4%
determinant variable includes a category which representsthe missing values (non-response) for the respective item.Attrition proportions in the single categories of possibledeterminants ranged from 27.7% (children from highly edu-cated parents) to 46.8% (children whose parents did notreport their educational level). After control for country, age,and sex, the strongest impact on attrition was observed whenbaseline variable values were missing and children with non-response to certain items in T0 were about two times aslikely to drop out of follow-up as children with informationon these aspects. Thus, a high combined non-response scoreshowed the highest impact of all potential determinantsunder investigation with a clear dose-effect relationship (lowscore: OR= 1.45; 99% confidence interval (CI): 1.26, 1.68; highscore: OR = 2.63; 99% CI: 2.10; 3.29).
Other, in particular sociodemographic and psychosocialfactors were attributed to attrition as well. Hence, childrenfrom families where both parents were born in a foreigncountry were more likely to drop out as were children withparents of low educational background, while children fromhighly educated families showed a particularly high proba-bility to participate in T1 (Table 2). Effects on attrition couldbe revealed also for some psychosocial aspects such as a lowwell-being score or a long screen time. Similarly, overweightand obese children participated less often in the follow-up examinations than normal weight children. In Model2, age group, overweight/obesity, parental education level,migration background, family status, well-being, screen time,and the baseline proportionate participation were included.The non-response score variable was omitted from Model2 to avoid overadjustment, since a missing category wasalready included for each of the variables in the model.The strongest effect on attrition was found for non-responseregarding the itemsmigration background, family status, andwell-being. Generally, most of the effects (except for screentime) observed in model 1 persisted as statistically significantafter multivariate adjustment although the associations weresomewhat attenuated. Of note, sex, allocation in interventionor control region, dietary behaviour (junk food consumptionand availability of soft drinks), sleep duration, and partici-pation rate at baseline were not related to attrition in thesemodels. Also considering baseline response as a continuousvariable in sensitivity analysis, no correlation was found with
proportionate attrition (Pearson’s 𝑟 = −0.37; 𝑃 = 0.36).Sensitivity analysis for model development applying forwardselection of covariates resulted in the inclusion of the samevariables as in the model based on the originally used selec-tion procedure. The hierarchy for inclusion of the selectedcovariates was as follows: country, migration background,family status, well-being of the child, socioeconomic status,age group, and overweight.
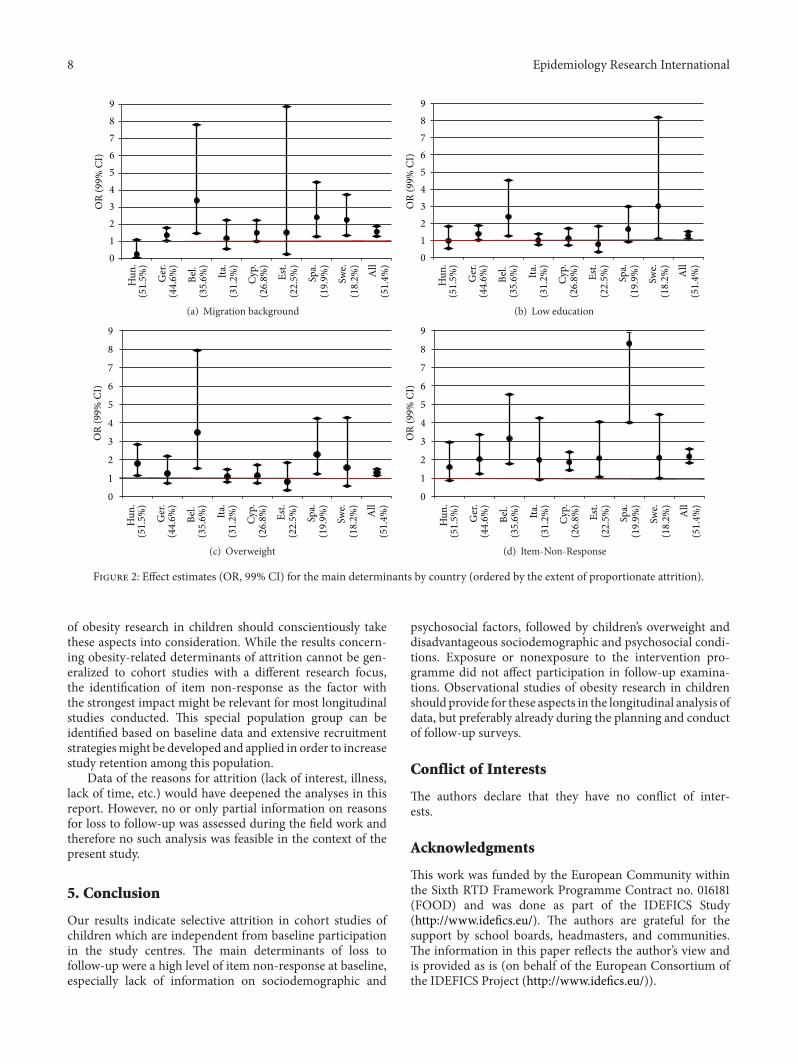
Country-stratified comparisons regarding the maindeterminants for drop-out are given in Figure 2. No specificpatterns or clustering of the determinants of attrition in thedifferent countries were identified, indicating that the impactof determinants is not substantially stronger in centres witha high attrition proportion.
4. Discussion
Our results confirmed the hypothesis that overweight/obesityand factors related to obesity risk affect attrition to follow-upin a cohort study of children. This association was indepen-dent from differences in baseline proportionate participationand attrition to follow-up.The strongest effects in the adjustedmodels were seen for overweight/obesity and for item non-response at baseline, the latter especially with regard tomigration background, family status, and well-being. Adose-effect relationship was found within the study centresbetween the numbers of item non-responses and the drop-out. Generally, the extent of attrition does not seem to berelated to the size of specific determinants for drop-out. Thesuggestion that selective drop-out due to a differential loss ofindividuals with specific patterns of obesity-related factors isstronger in study centres with high attrition proportions wasthus not confirmed by our study. Sensitivity analysis exclud-ing data fromSpain andBelgium inModel 1 was conducted toaccount for the extremely high values in these countries withrespect to the item non-response score. However, the resultswere only slightly attenuated but not essentially different (e.g.,high non-response score: OR = 2.15; 99% CI: 1.69, 2.73).
Determinants of attrition in longitudinal population-based studies have been discussed in several publications[3, 19–21]. In studies of young populations, where parentalconsent is usually required, sociodemographic factors, suchas parental education or single parenthood, have been
6 Epidemiology Research International
Table 2: Proportionate attrition and effect estimates for determinants of attrition in the IDEFICS study.
Proportionate attrition Model 1a Model 2b
OR 99% CI OR 99% CISexMale 32.8% ReferenceFemale 32.3% 0.97 0.89, 1.06
Age groupPreschool 33.5% 1.15 1.07, 1.23 1.22 1.11, 1.34School 31.8% Reference Reference
RegionIntervention 33.0% ReferenceControl 32.1% 0.96 0.88, 1.05
Weight statusObese 31.7% 1.36 1.14, 1.62 1.28 1.07, 1.54Overweight 35.9% 1.30 1.14, 1.49 1.27 1.10, 1.45Normal weight 36.8% Reference Reference
Migration backgroundNo 31.0% Reference ReferencePartly 33.0% 1.26 1.07, 1.48 1.23 1.04, 1.45Full 40.6% 1.57 1.31, 1.89 1.15 0.91, 1.45Missing 46.6% 2.44 1.98, 3.00 1.55 1.04, 2.32
Educational levelLow 41.4% 1.31 1.11, 1.53 1.19 1.01, 1.40Medium-low 34.0% Reference ReferenceMedium-high 31.4% 1.04 0.90, 1.20 1.06 0.92, 1.22High 27.7% 0.84 0.75, 0.94 0.88 0.78, 1.00Missing 46.8% 2.15 1.72, 2.69 1.09 0.72, 1.68
Family statusTwo parents 30.9% Reference ReferenceSingle parent 36.3% 1.28 1.13, 1.45 1.21 1.06, 1.38Missing 40.0% 1.96 1.66, 2.32 1.37 1.12, 1.67
Well-beingLow 37.5% 1.34 1.14, 1.59 1.26 1.07, 1.49Medium-low 33.0% 1.18 1.00, 1.38 1.15 0.97, 1.35Medium-high 29.0% 1.05 0.89, 1.22 1.04 0.89, 1.22High 25.4% Reference ReferenceMissing 39.7% 1.97 1.65, 2.36 1.46 1.19, 1.79
Weekly screen time≤7 hours 31.6% Reference Reference7 to ≤14 hours 31.9% 1.14 1.01, 1.27 1.11 0.99, 1.24>14 hours 31.9% 1.16 1.03, 1.32 1.06 0.94, 1.21Missing 42.3% 1.96 1.63, 2.35 1.10 0.86, 1.39
Junk foodNever 29.0% ReferenceOccasionally 29.7% 1.00 0.83, 1.23Often 34.0% 1.00 0.82, 1.22Missing 37.8% 1.53 1.23, 1.91
Soft drink availableYes 38.7% 1.11 0.98, 1.25No 30.0% ReferenceMissing 37.3% 1.97 1.66, 2.33

Epidemiology Research International 7
Table 2: Continued.
Proportionate attrition Model 1a Model 2b
OR 99% CI OR 99% CISleep duration≤11 hours 29.0% 0.86 0.72, 1.03>11 hours 25.5% ReferenceMissing 35.3% 1.08 0.91, 1.29
Item non-responseNo missing 30.8% ReferenceLow 39.0% 1.45 1.26, 1.68High 40.4% 2.18 1.83, 2.58
Baseline participationLow 27.3% 1.50 0.54, 4.16 1.33 0.46, 3.89High 37.3% Reference Reference
CI: confidence interval; OR: odds ratio.aAdjusted for country, sex, and age group.bAdjusted for country, age group, weight status, parental education level, migration background, family status, well-being, screen time, and baseline pro-portionate participation.
reported as the most relevant attrition determinants [4, 22].These reports are in line with our results, where socio-demo-graphic aspects including parental education, single parent-hood, and migration background also affected nonpartici-pation in the follow-up study. This suggests that during theconduct of follow-up studies, special attention has to be paidto these groups in order to optimize their study adherence.
Behavioural factors, such as sedentary behaviour or diet,were not or only weakly associated with attrition, which cor-roborates findings from the Danish Youth Cohort study [3].However, our data revealed an impact of the children’s well-being on attrition. To the authors’ knowledge no such associ-ation has been previously reported in other studies of youngpopulations. The same applies to the impact of item non-response, in particular to the dose-effect relationship betweenthe number of item non-responses and attrition that wasobserved in the analysis. This seems to suggest that parentswho were reluctant to completely answer the questionnaireor to participate in the respective study modules already atbaseline were more likely to not participate after two years. Inthis context, results from a German cohort should be notedwhere late invitation response and the intensity of recruit-ment efforts were determinants of attrition to follow-up [2].The authors suppose that late response is just an indicator forreluctance to participation and thus probably associated witha high value of the item non-response scores. Unfortunately,local variations in the organization of recruitment proceduresin the different study centres and the different settings in eachcountry precluded more detailed analyses of recruitmentefforts. Nevertheless, intensified motivation procedures mayneed to be considered for participants in the cohort panelwhoshow high item non-response scores.
In previous studies it has been discussed that individualsmight select themselves out of studies due to treatment orintervention [23]. Interestingly, no differences in attritionwere seen with regard to being allocated to the interventionor the control region in the present study, whichmay indicate
that the IDEFICS intervention programme was either wellaccepted or so low threshold that the decision to take partin the follow-up was unaffected.
An important aspect in this context is the potential forbiased estimates in longitudinal analyses due to selective attri-tion. Selective attrition threatens to impair the generalizabil-ity of findings and to bias the estimates of associations [24].Although evidence for this is limited and conflicting [2, 19],this aspect needs to be considered in the interpretation of ourresults, in particular regarding how the systematic drop-outin the present study threatens to induce bias in the longitu-dinal analysis of certain outcomes. Particularly the elevatedprobability of drop-out for overweight or obese children,or with factors related to the development of overweight, isof particular concern here. Thus, in a prospective analysisusing the incidence of obesity as a dichotomous outcome,the differential drop-out of children in the overweight (andeven more so in the upper overweight) category, where theprogression to obesity is more likely to occur than in childrenwith a lower BMI, introduces an elevated probability of miss-ing the outcome of interest in the follow-up examinations;thismight lead to a biased estimation of the association underinvestigation. Therefore, alternative analytic approaches, forexample, by using the relative change in BMI, and therebyidentifying changes in the BMI within the whole range of theBMI distribution, as the outcome of interest, could be oneapproach to diminish the observed limitations in this cohort.
Another example, where the selective drop-out mightimpair longitudinal analysis, is the study of the incidence ofsecondary diseases that aremore likely to occur in overweightor obese children, for example, type 2 diabetes [25]. The ele-vated drop-out of children from this group could lead to a rel-evant loss of statistical power as the number of incident casesmay become too low to observe significant effects since theseconditions are generally rare (although increasing) withinthe age group of interest [26]. We suppose that the prospec-tive analysis of observational studies within the context
8 Epidemiology Research International
0123456789
OR
(99%
CI)
Hun
.(5
1.5%
)
Ger
.(4
4.6%
)
Bel.
(35.
6%)
Ita.
(31.
2%)
Cyp.
(26.
8%)
Est.
(22.
5%)
Spa.
(19.
9%)
Swe.
(18.
2%)
All
(51.
4%)
(a) Migration background
0123456789
OR
(99%
CI)
Hun
.(5
1.5%
)
Ger
.(4
4.6%
)
Bel.
(35.
6%)
Ita.
(31.
2%)
Cyp.
(26.
8%)
Est.
(22.
5%)
Spa.
(19.
9%)
Swe.
(18.
2%)
All
(51.
4%)
(b) Low education
OR
(99%
CI)
0
1
2
3
4
5
6
7
8
9
Hun
.(5
1.5%
)
Ger
.(4
4.6%
)
Bel.
(35.
6%)
Ita.
(31.
2%)
Cyp.
(26.
8%)
Est.
(22.
5%)
Spa.
(19.
9%)
Swe.
(18.
2%)
All
(51.
4%)
(c) Overweight
OR
(99%
CI)
0
1
2
3
4
5
6
7
8
9
Hun
.(5
1.5%
)
Ger
.(4
4.6%
)
Bel.
(35.
6%)
Ita.
(31.
2%)
Cyp.
(26.
8%)
Est.
(22.
5%)
Spa.
(19.
9%)
Swe.
(18.
2%)
All
(51.
4%)
(d) Item-Non-Response
Figure 2: Effect estimates (OR, 99% CI) for the main determinants by country (ordered by the extent of proportionate attrition).
of obesity research in children should conscientiously takethese aspects into consideration. While the results concern-ing obesity-related determinants of attrition cannot be gen-eralized to cohort studies with a different research focus,the identification of item non-response as the factor withthe strongest impact might be relevant for most longitudinalstudies conducted. This special population group can beidentified based on baseline data and extensive recruitmentstrategiesmight be developed and applied in order to increasestudy retention among this population.
Data of the reasons for attrition (lack of interest, illness,lack of time, etc.) would have deepened the analyses in thisreport. However, no or only partial information on reasonsfor loss to follow-up was assessed during the field work andtherefore no such analysis was feasible in the context of thepresent study.
5. Conclusion
Our results indicate selective attrition in cohort studies ofchildren which are independent from baseline participationin the study centres. The main determinants of loss tofollow-up were a high level of item non-response at baseline,especially lack of information on sociodemographic and
psychosocial factors, followed by children’s overweight anddisadvantageous sociodemographic and psychosocial condi-tions. Exposure or nonexposure to the intervention pro-gramme did not affect participation in follow-up examina-tions. Observational studies of obesity research in childrenshould provide for these aspects in the longitudinal analysis ofdata, but preferably already during the planning and conductof follow-up surveys.
Conflict of Interests
The authors declare that they have no conflict of inter-ests.
Acknowledgments
This work was funded by the European Community withinthe Sixth RTD Framework Programme Contract no. 016181(FOOD) and was done as part of the IDEFICS Study(http://www.idefics.eu/). The authors are grateful for thesupport by school boards, headmasters, and communities.The information in this paper reflects the author’s view andis provided as is (on behalf of the European Consortium ofthe IDEFICS Project (http://www.idefics.eu/)).

Epidemiology Research International 9
References
[1] F. Lamers, A. W. Hoogendoorn, J. H. Smit, D. R. van, F. G.Zitman, W. A. Nolen et al., “Sociodemographic and psychiatricdeterminants of attrition in theNetherlands study of depressionand anxiety (NESDA),” Comprehensive psychiatry, vol. 53, no. 1,pp. 63–70, 2012.
[2] R. Haring, D. Alte, H. Volzke et al., “Extended recruitmentefforts minimize attrition but not necessarily bias,” Journal ofClinical Epidemiology, vol. 62, no. 3, pp. 252–260, 2009.
[3] M.Vinther-Larsen,M. Riegels,M.H. Rod,M. Schiøtz, T. Curtis,and M. Grønbaek, “The danish youth cohort: characteristicsof participants and non-participants and determinants of attri-tion,” Scandinavian Journal of Public Health, vol. 38, no. 6, pp.648–656, 2010.
[4] P. M. Zook, C. Jordan, B. Adams et al., “Retention strategies andpredictors of attrition in an urban pediatric asthma study,”Clin-ical Trials, vol. 7, no. 4, pp. 400–410, 2010.
[5] J. P. Rey-Lopez, G. Vicente-Rodrıguez, M. Biosca, and L. A.Moreno, “Sedentary behaviour and obesity development inchildren and adolescents,” Nutrition, Metabolism and Cardio-vascular Diseases, vol. 18, no. 3, pp. 242–251, 2008.
[6] S. Hense, H. Pohlabeln, S. DeHenauw et al., “Sleep duration andoverweight in European children: is the associationmodified bygeographic region?” Sleep, vol. 34, no. 7, pp. 885–890, 2011.
[7] L. Johnson, A. P. Mander, L. R. Jones, P. M. Emmett, and S. A.Jebb, “A prospective analysis of dietary energy density at age 5and 7 years and fatness at 9 years among UK children,” Inter-national Journal of Obesity, vol. 32, no. 4, pp. 586–593, 2008.
[8] T. A. McCaffrey, K. L. Rennie, M. A. Kerr et al., “Energy densityof the diet and change in body fatness from childhood to ado-lescence; is there a relation?” American Journal of Clinical Nu-trition, vol. 87, no. 5, pp. 1230–1237, 2008.
[9] J. Williams, M. Wake, K. Hesketh, E. Maher, and E. Waters,“Health-related quality of life of overweight and obese children,”Journal of the American Medical Association, vol. 293, no. 1, pp.70–76, 2005.
[10] W. Ahrens, K. Bammann, A. Siani, K. Buchecker, H. S. de, L.Iacoviello et al., “The IDEFICS cohort: design, characteristicsand participation in the baseline survey,” International Journalof Obesity, vol. 35, supplement 1, pp. S3–S15, 2011.
[11] S. de Henauw, V. Verbstel, S. Marild, G. Barba, K. Bammann, G.Eiben et al., “The IDEFICS community-oriented interventionprogramme: a new model for childhood obesity prevention inEurope?” International Journal of Obesity, vol. 35, supplement 1,pp. S16–S23, 2011.
[12] K. Bammann and W. Ahrens, Measurement Tools for a HealthSurvey on Nutrition, Physical Activity and Lifestyle in Children:the European IDEFICS Study, Springer, New York, NY, USA,2013.
[13] T. J. Cole, M. C. Bellizzi, K. M. Flegal, and W. H. Dietz, “Estab-lishing a standard definition for child overweight and obesityworldwide: international survey,” British Medical Journal, vol.320, no. 7244, pp. 1240–1243, 2000.
[14] M. Bullinger, A. L. Brutt, M. Erhart, and U. Ravens-Sieberer,“Psychometric properties of the KINDL-R questionnaire:results of the BELLA study,” European Child and AdolescentPsychiatry, vol. 17, no. 1, pp. 125–132, 2008.
[15] U. Ravens-Sieberer and M. Bullinger,Measuring Health RelatedQuality of Life in Children and Adolescents, 2000.
[16] S. Bel-Serrat, T. Mouratidou, V. Pala, I. Huybrechts, C. Born-horst, J. M. Fernandez-Alvira et al., “Relative validity of the
children’s eating habits questionnaire-food frequency sectionamong young European children: the IDEFICS study,” PublicHealth Nutrition, pp. 1–11, 2013.
[17] A. Lanfer, A. Hebestreit, W. Ahrens et al., “Reproducibility offood consumption frequencies derived from the children’s eat-ing habits questionnaire used in the IDEFICS study,” Interna-tional Journal of Obesity, vol. 35, supplement 1, pp. S61–S68, 2011.
[18] S. Hense, G. Barba, H. Pohlabeln et al., “Factors that influenceweekday sleep duration in European children,” Sleep, vol. 34, no.5, pp. 633–639, 2011.
[19] C. L. Booker, S. Harding, andM. Benzeval, “A systematic reviewof the effect of retention methods in population-based cohortstudies,” BMC Public Health, vol. 11, article 249, 2011.
[20] S. A. Frojd, R. Kaltiala-Heino, and M. J. Marttunen, “Does pro-blem behaviour affect attrition from a cohort study on adoles-cent mental health?” European Journal of Public Health, vol. 21,no. 3, pp. 306–310, 2011.
[21] I. Moroshko, L. Brennan, and P. O’Brien, “Predictors of dropoutin weight loss interventions: a systematic review of the litera-ture,” Obesity Reviews, vol. 12, pp. 912–934, 2011.
[22] D. Wolke, A. Waylen, M. Samara et al., “Selective drop-out inlongitudinal studies and non-biased prediction of behaviourdisorders,” British Journal of Psychiatry, vol. 195, no. 3, pp. 249–256, 2009.
[23] J. S. Goodman and T. C. Blum, “Assessing the non-randomsampling effects of subject attrition in longitudinal research,”Journal of Management, vol. 22, no. 4, pp. 627–652, 1996.
[24] L. Marcellus, “Are we missing anything? Pursuing research onattrition,” Canadian Journal of Nursing Research, vol. 36, no. 3,pp. 82–98, 2004.
[25] S. Dhuper, S. Buddhe, and S. Patel, “Managing cardiovascularrisk in overweight children and adolescents,” Paediatr Drugs. Inpress.
[26] A.D. Liese, R. B.D’Agostino Jr, R. F.Hamman et al., “Theburdenof diabetesmellitus amongUS youth: prevalence estimates fromthe SEARCH for diabetes in youth study,” Pediatrics, vol. 118, no.4, pp. 1510–1518, 2006.

Submit your manuscripts athttp://www.hindawi.com
Stem CellsInternational
Hindawi Publishing Corporationhttp://www.hindawi.com Volume 2014
Hindawi Publishing Corporationhttp://www.hindawi.com Volume 2014
MEDIATORSINFLAMMATION
of
Hindawi Publishing Corporationhttp://www.hindawi.com Volume 2014
Behavioural Neurology
EndocrinologyInternational Journal of
Hindawi Publishing Corporationhttp://www.hindawi.com Volume 2014
Hindawi Publishing Corporationhttp://www.hindawi.com Volume 2014
Disease Markers
Hindawi Publishing Corporationhttp://www.hindawi.com Volume 2014
BioMed Research International
OncologyJournal of
Hindawi Publishing Corporationhttp://www.hindawi.com Volume 2014
Hindawi Publishing Corporationhttp://www.hindawi.com Volume 2014
Oxidative Medicine and Cellular Longevity
Hindawi Publishing Corporationhttp://www.hindawi.com Volume 2014
PPAR Research
The Scientific World JournalHindawi Publishing Corporation http://www.hindawi.com Volume 2014
Immunology ResearchHindawi Publishing Corporationhttp://www.hindawi.com Volume 2014
Journal of
ObesityJournal of
Hindawi Publishing Corporationhttp://www.hindawi.com Volume 2014
Hindawi Publishing Corporationhttp://www.hindawi.com Volume 2014
Computational and Mathematical Methods in Medicine
OphthalmologyJournal of
Hindawi Publishing Corporationhttp://www.hindawi.com Volume 2014
Diabetes ResearchJournal of
Hindawi Publishing Corporationhttp://www.hindawi.com Volume 2014
Hindawi Publishing Corporationhttp://www.hindawi.com Volume 2014
Research and TreatmentAIDS
Hindawi Publishing Corporationhttp://www.hindawi.com Volume 2014
Gastroenterology Research and Practice
Hindawi Publishing Corporationhttp://www.hindawi.com Volume 2014
Parkinson’s Disease
Evidence-Based Complementary and Alternative Medicine
Volume 2014Hindawi Publishing Corporationhttp://www.hindawi.com