research article an economic order quantity …downloads.hindawi.com/archive/2014/340135.pdfchain...
TRANSCRIPT
Research ArticleAn Economic Order Quantity Model withCompletely Backordering and NondecreasingDemand under Two-Level Trade Credit
Zohreh Molamohamadi,1 Rahman Arshizadeh,2 Napsiah Ismail,1 and Amir Azizi3
1Department of Mechanical and Manufacturing Engineering, University Putra Malaysia, 43400 Serdang, Selangor, Malaysia2Department of Computer Engineering, Islamic Azad University, Science and Research Branch, Simon Boulevard,Ashrafi Esfahani Highway, Tehran 1477893855, Iran3Faculty of Manufacturing Engineering, Universiti Malaysia Pahang, 26600 Pekan, Pahang, Malaysia
Correspondence should be addressed to Zohreh Molamohamadi; [email protected]
Received 31 July 2014; Accepted 5 December 2014; Published 31 December 2014
Academic Editor: David Bulger
Copyright © 2014 Zohreh Molamohamadi et al.This is an open access article distributed under the Creative Commons AttributionLicense, which permits unrestricted use, distribution, and reproduction in anymedium, provided the originalwork is properly cited.
In the traditional inventory system, it was implicitly assumed that the buyer pays to the seller as soon as he receives the items. Intoday’s competitive industry, however, the seller usually offers the buyer a delay period to settle the account of the goods. Not onlythe seller but also the buyer may apply trade credit as a strategic tool to stimulate his customers’ demands. This paper investigatesthe effects of the latter policy, two-level trade credit, on a retailer’s optimal ordering decisions within the economic order quantityframework and allowable shortages. Unlike most of the previous studies, the demand function of the customers is considered toincrease with time.The objective of the retailer’s inventory model is to maximize the profit. The replenishment decisions optimallyare obtained using genetic algorithm. Two special cases of the proposed model are discussed and the impacts of parameters onthe decision variables are finally investigated. Numerical examples demonstrate the profitability of the developed two-level supplychain with backorder.
1. Introduction
Since the introduction of the classical economic order quan-tity (EOQ) model by Harris [1], many researchers haveextended it in several ways. One of the discussed issues in thisarea is including delay in payment, as an incentive system,in the EOQ or economic production quantity (EPQ) models[2]. According to Piasecki [3] and Molamohamadi et al. [4],different types of delay in payment can be classified as (1) payas sold, (2) pay as sold during a predefined period, (3) payafter a predefined period, and (4) pay at the next consignmentorder.
In the first type of delay in payment, so-called consign-ment inventory, the buyer defers paying for the items tillthey are sold to the customers. The second type refers tothe case that the buyer pays off as soon as he sells the itemsto the customers during a predefined period. At the end ofthis period, he can either pay for the remaining items in his
stock or return the unsold items to the vendor. According tothe third type of delay in payment, which is known as tradecredit in the literature, the buyer must pay to the vendor atthe end of a predetermined period. During the credit period,the buyer sells the items to his customers and accumulatesrevenue and earns interest. After this period, however, hewould be charged a higher interest if the payment is notsettled. Based on the fourth type, the payment for each orderwould be settled at the time of the next replenishment order.Therefore, there is one replenishment cycle delay for eachreceived order in this type.The advantage of delay in paymentcontract to the buyer is obvious; he does not need to investhis capital in inventory and can earn interest for the itemshe sells. Moreover, the vendor can apply this agreement as asales promotional tool for attracting new buyers and sellingnew and unproven products.
As this paper focuses on the third type of delay in pay-ment, we review the literature related to trade credit (please
Hindawi Publishing CorporationAdvances in Decision SciencesVolume 2014, Article ID 340135, 11 pageshttp://dx.doi.org/10.1155/2014/340135

2 Advances in Decision Sciences
refer to Seifert et al. [5] and Molamohamadi et al. [6]). Goyal[7] presented an EOQ mathematical model for determiningthe economic order quantity where the supplier offers a fixedcredit period to the retailer to settle the account. His paperis the infrastructure for its following studies. Aggarwal andJaggi [8] extended Goyal [7] by considering deteriorationrate and assuming that the customer accumulates the salesrevenue and earns interest during the credit period andbeyond it. Jamal et al. [9] included shortages in the proposedmodel by Aggarwal and Jaggi [8] to generalize it. Teng [10]modified Goyal’s [7] model by distinguishing between theunit purchase cost and the selling price. By applying an EPQmodel, Chung and Huang [11] further developed Goyal [7]by assuming finite replenishment rate. Huang [12] considereda two-level trade credit and deduced Goyal [7] as a specialcase of his research. In a two-level trade credit, not only doesthe vendor offer trade credit to the buyer, but the retailer alsoprovides a credit period to his customers.
Huang [13] investigated the retailer’s inventory policyunder two-level trade credit with unequal selling and pur-chasing prices and extendedTeng [10] andHuang [12] by con-sidering the retailer’s limited storage space. Teng and Goyal[14] complemented the shortcoming of Huang [12]’s modelin calculating the earned interest from the time the retaileris paid by his customers, not from time zero. They furtherextended his paper by relaxing the limitations on the sellingand purchasing prices, as well as retailer and customer’s creditperiods. Huang [15] established an economic order quantitymodel in which the supplier provides the retailer partiallypermissible delay in payment for the order quantities smallerthan a predetermined quantity and offers him completetrade credit otherwise. Huang [16] differentiated betweenthe purchase cost and the selling price and presented anEPQ model under two levels of trade credit to generalizeChung and Huang [11] and Huang [12]. Teng and Chang [17]reformulated Huang’s [16] model by calculating the retailer’searned revenue from the time he is paid by the customers andfurther extended his model by assuming that the customer’scredit period is not inevitably smaller than the retailer’sdelay period. Su [18] developed a supplier-buyer inventorymodel in which the supplier’s selling price is dependent onhis productions cost. He further assumed that the latter isaffected by the market demand and production rates, and theproduction rate is sensitive to the price dependent marketdemand. He finally obtained the optimal pricing, ordering,and inventory decisions of a profit maximizing system undertrade credit contract.
Dye and Ouyang [19] proposed an EOQ mixed-integernonlinear programming model under two levels of tradecredit for deteriorating items with time-varying demandand applied a traditional particle swarm optimization (PSO)algorithm to determine the optimal selling price and replen-ishment policy. Dye [20] applied PSO algorithm to obtain theoptimal replenishment decisions of an EOQmodel with priceand time dependent demand, partially backlogged items, anddeterioration under two-level trade credit policy. Mahata[21] presented a generalization of Goyal [7], Chung andHuang [11], Huang [12], and Huang [16] where an economicproduction quantity model is formulated for exponentially
deteriorating items under two levels of trade credit withthe assumption that the customer’s partial credit period isnot necessarily smaller than the retailer’s complete creditagreement. Lou andWang [22] formulated an EPQ inventorymodel for defective items under two independent levels oftrade credit to extend some of the previous studies includingGoyal [7], Teng [10], Huang [12], and Teng and Goyal [14].
Having applied cuckoo search algorithm,Molamohamadiet al. [23] solved an EPQ model of an exponentially deterio-rating item with price-sensitive demand under trade creditcontract and allowable shortages. Chern et al. [24, 25]formulated a supply chain under trade credit financing withnoncooperative Stackelberg and Nash equilibrium solutions,respectively. Chen and Teng [26] determined the retailer’soptimal cycle time by developing an EOQ model undertrade credit policy for continuously deteriorating items withmaximum lifetime. Chen et al. [27] reformulated Mahata’s[21] proposed model by calculating the earned and paidinterest based on the facts that (i) the retailer earns interestfrom the time he is paid by the customers and (ii) the retailer’sinterest payable must be calculated based on the total itemsin stock, not only on the unsold finished products. Someof the previous models such as Goyal [7] and Teng [10] arementioned as special cases of their proposed model. Chenet al. [28] complemented some shortcomings of Huang’s [15]mathematical expressions and figures and proposed a simplemethod to solve the inventory problem.
Reviewing the literature clarifies that trade credit hasreceived great attention of the researchers, while it has stilloutstanding space for further studies. For instance, it ismostly assumed that the demand rate is constant. However,recently, Teng et al. [29] developed an EOQ inventorymodel under trade credit contract in which demand has anincreasing function of time. Although, their model can beconsidered as a generalization of its preceding studies, it hasgreat potential for further extension. As it is stated in Jamalet al. [9], when delay in payment is assumed, shortages aremore important as they affect the quantity ordered to benefitfrom the delay in payment. Moreover, in practices, not onlydoes the supplier propose a delay period to the retailer, butthe retailer also allows his customers to defer their payment.Thus, considering two levels of trade credit contributes topractical situations.
Considering the gaps in the literature, we extend theproposed model of Teng et al. [29] to the case of backorderand two-level trade credit. It is assumed here that the retailer’scredit period offered by the supplier is greater than thecustomer’s delay period offered by the retailer. The properreplenishment policy and the maximum profit of the retailerare then obtained by applying genetic algorithm (GA). It isfinally deduced that the inventory system of Teng et al. [29]and the traditional inventory system are special cases of ourproposed model and the results obtained in this paper arecompared with these cases.
The rest of this paper is organized as follows. Section 2lays out the notations and assumptions used in the modelingof the problem. The model is formulated in Section 3 andthe two special cases of the presented model presentedare discussed in Section 4. The genetic algorithm, used for

Advances in Decision Sciences 3
solving the model, is described in Section 5. Regarding thenumerical examples of Teng et al. [29], Section 6 providessome numerical examples and the conclusion is finallydiscussed in Section 7.
2. Notations and Assumptions
The following notations and assumptions are used in thispaper.
2.1. Notations
𝐴: ordering cost per order,𝑐: unit purchasing cost,𝑠: unit selling price (with 𝑠 > 𝑐),ℎ: unit stock holding cost per unit of time (excluding
interest charges),𝑐𝑏: unit backorder cost of retailer per unit of time,𝐼𝑒: interest which can be earned per $ per unit of time by
the retailer,𝐼𝑐: interest charges per $ in stocks per unit of time by the
supplier,𝑀: the retailer’s trade credit period offered by supplier in
years,𝑁: the customer’s trade credit period offered by retailer
in years,NP: the net profit of the retailer per unit of time,𝑇: the inventory cycle time,𝑇1: the inventory cycle time with positive stock,𝑄: the retailer’s order quantity,𝑄1: the inventory consumed in 𝑇1.
2.2. Assumptions
(1) The demand is assumed to have an increasing func-tion of time and is defined by𝐷(𝑡) as follows:
𝐷 (𝑡) = 𝑎 + 𝑏𝑡, (1)
where 𝑎 and 𝑏 are nonnegative constants and 𝑡 is thegrowth stage of the product life cycle.
(2) Shortages are allowed and completely backordered.(3) The lead time is zero.(4) The retailer is offered a delay period (𝑀) by the
supplier and provides the customers with a shortercredit period (𝑁). The retailer pays off to the supplierat the end of the credit period (𝑀) and pays forthe interest charges on the remaining items in hisstock with rate 𝐼𝑐 during [𝑀, 𝑇1] if 𝑇1 ≥ 𝑀. Whenthe credit period is greater than the positive-stockreplenishment cycle, the retailerwould not be chargedby any interest after settling the account.
(5) The retailer accumulates revenue and earns interestwith rate 𝐼𝑒 from𝑁 to𝑀.
I(t)
Q1
Q − Q1T1
T
Q
t
Figure 1: Inventory level at the manufacturer from 0 to 𝑇.
3. Mathematical Formulation
According to the notations and assumptions discussed inprevious section, the retailer’s inventory system is depicted inFigure 1 and can be explained as follows. The retailer ordersand receives 𝑄 units of items at time zero and sends thepreviously backlogged orders to the customers immediately.The remaining inventory (𝑄1) depletes gradually due to thecustomers’ demand and becomes zero at time 𝑡 = 𝑇1. From𝑇1 to 𝑇 there is no inventory on hand and the arriving orderswould be backlogged to the next cycle.
Now the inventory level at time 𝑡 can be described by thefollowing differential equation:
𝑑𝐼 (𝑡)
𝑑𝑡= −𝐷 (𝑡) = − (𝑎 + 𝑏𝑡) , 0 ≤ 𝑡 ≤ 𝑇, (2)
with the boundary condition 𝐼(𝑇1) = 0. Therefore, thesolution to (2) would be
𝐼 (𝑡) = 𝑎 (𝑇1 − 𝑡) +1
2𝑏 (𝑇2
1− 𝑡2) . (3)
According to (3), the inventory levels at the beginningand at the end of the replenishment cycle are as (4) and (5),respectively:
𝑄1 = 𝐼 (0) = 𝑎𝑇1 +1
2𝑏𝑇2
1, (4)
𝐼 (𝑇) = 𝑄1 − 𝑄 = 𝑎 (𝑇1 − 𝑇) +1
2𝑏 (𝑇2
1− 𝑇2) . (5)
Since the retailer is encounteredwith backorder during𝑇1to 𝑇, and as 𝑇1 < 𝑇, (5) is smaller than zero. So, the retailer’sorder size per cycle time can be obtained as follows:
𝑄 = 𝐼 (0) + |𝐼 (𝑇)| = 𝑎𝑇 +1
2𝑏𝑇2. (6)
The retailer’s net profit consists of the following elements.(a) The ordering cost = 𝐴.(b) The inventory holding cost excluding interest charges
= ℎ∫𝑇1
0𝐼(𝑡)𝑑𝑡 = ℎ((1/2)𝑎𝑇2
1+ (1/3)𝑏𝑇3
1).
(c) The backorder cost = −𝑐𝑏 ∫𝑇
𝑇1
𝐼(𝑡)𝑑𝑡 = 𝑐𝑏[(1/2)𝑎(𝑇 −
𝑇1)2+ (1/6)𝑏(𝑇3 − 3𝑇𝑇2
1+ 2𝑇31)].
(d) The purchasing cost = 𝑐𝑄 = 𝑐[𝑎𝑇 + (1/2)𝑏𝑇2].
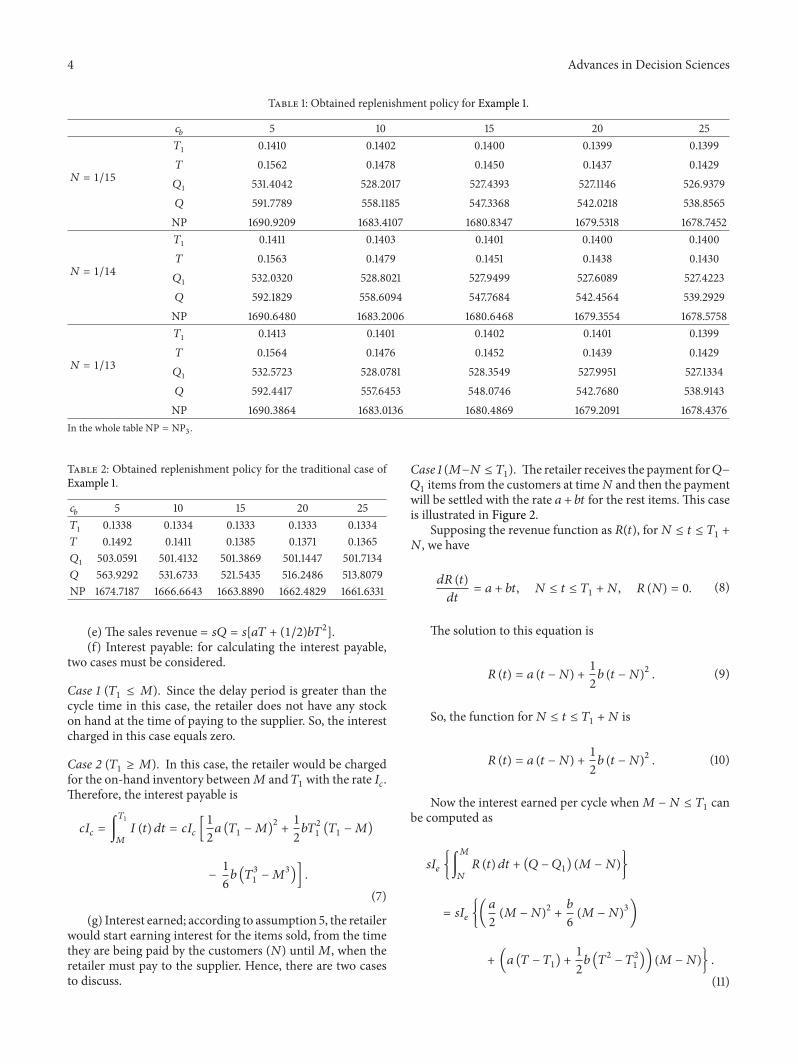
4 Advances in Decision Sciences
Table 1: Obtained replenishment policy for Example 1.
𝑐𝑏
5 10 15 20 25
𝑁 = 1/15
𝑇1
0.1410 0.1402 0.1400 0.1399 0.1399𝑇 0.1562 0.1478 0.1450 0.1437 0.1429𝑄1 531.4042 528.2017 527.4393 527.1146 526.9379𝑄 591.7789 558.1185 547.3368 542.0218 538.8565NP 1690.9209 1683.4107 1680.8347 1679.5318 1678.7452
𝑁 = 1/14
𝑇1 0.1411 0.1403 0.1401 0.1400 0.1400𝑇 0.1563 0.1479 0.1451 0.1438 0.1430𝑄1 532.0320 528.8021 527.9499 527.6089 527.4223𝑄 592.1829 558.6094 547.7684 542.4564 539.2929NP 1690.6480 1683.2006 1680.6468 1679.3554 1678.5758
𝑁 = 1/13
𝑇1 0.1413 0.1401 0.1402 0.1401 0.1399𝑇 0.1564 0.1476 0.1452 0.1439 0.1429𝑄1 532.5723 528.0781 528.3549 527.9951 527.1334𝑄 592.4417 557.6453 548.0746 542.7680 538.9143NP 1690.3864 1683.0136 1680.4869 1679.2091 1678.4376
In the whole table NP = NP3.
Table 2: Obtained replenishment policy for the traditional case ofExample 1.
𝑐𝑏 5 10 15 20 25𝑇1 0.1338 0.1334 0.1333 0.1333 0.1334𝑇 0.1492 0.1411 0.1385 0.1371 0.1365𝑄1
503.0591 501.4132 501.3869 501.1447 501.7134𝑄 563.9292 531.6733 521.5435 516.2486 513.8079NP 1674.7187 1666.6643 1663.8890 1662.4829 1661.6331
(e) The sales revenue = 𝑠𝑄 = 𝑠[𝑎𝑇 + (1/2)𝑏𝑇2].(f) Interest payable: for calculating the interest payable,
two cases must be considered.
Case 1 (𝑇1 ≤ 𝑀). Since the delay period is greater than thecycle time in this case, the retailer does not have any stockon hand at the time of paying to the supplier. So, the interestcharged in this case equals zero.
Case 2 (𝑇1 ≥ 𝑀). In this case, the retailer would be chargedfor the on-hand inventory between𝑀 and 𝑇1 with the rate 𝐼𝑐.Therefore, the interest payable is
𝑐𝐼𝑐 = ∫𝑇1
𝑀
𝐼 (𝑡) 𝑑𝑡 = 𝑐𝐼𝑐 [1
2𝑎 (𝑇1 −𝑀)
2+1
2𝑏𝑇2
1(𝑇1 −𝑀)
−1
6𝑏 (𝑇3
1−𝑀3)] .
(7)
(g) Interest earned; according to assumption 5, the retailerwould start earning interest for the items sold, from the timethey are being paid by the customers (𝑁) until𝑀, when theretailer must pay to the supplier. Hence, there are two casesto discuss.
Case 1 (𝑀−𝑁 ≤ 𝑇1). The retailer receives the payment for𝑄−𝑄1 items from the customers at time𝑁 and then the paymentwill be settled with the rate 𝑎 + 𝑏𝑡 for the rest items. This caseis illustrated in Figure 2.
Supposing the revenue function as 𝑅(𝑡), for𝑁 ≤ 𝑡 ≤ 𝑇1 +
𝑁, we have
𝑑𝑅 (𝑡)
𝑑𝑡= 𝑎 + 𝑏𝑡, 𝑁 ≤ 𝑡 ≤ 𝑇1 + 𝑁, 𝑅 (𝑁) = 0. (8)
The solution to this equation is
𝑅 (𝑡) = 𝑎 (𝑡 − 𝑁) +1
2𝑏 (𝑡 − 𝑁)
2. (9)
So, the function for𝑁 ≤ 𝑡 ≤ 𝑇1 + 𝑁 is
𝑅 (𝑡) = 𝑎 (𝑡 − 𝑁) +1
2𝑏 (𝑡 − 𝑁)
2. (10)
Now the interest earned per cycle when𝑀−𝑁 ≤ 𝑇1 canbe computed as
𝑠𝐼𝑒 {∫𝑀
𝑁
𝑅 (𝑡) 𝑑𝑡 + (𝑄 − 𝑄1) (𝑀 − 𝑁)}
= 𝑠𝐼𝑒 {(𝑎
2(𝑀 −𝑁)
2+𝑏
6(𝑀 −𝑁)
3)
+ (𝑎 (𝑇 − 𝑇1) +1
2𝑏 (𝑇2− 𝑇2
1)) (𝑀 −𝑁)} .
(11)

Advances in Decision Sciences 5
Table 3: Obtained replenishment policy for Example 2.
𝑐𝑏
5 10 15 20 25
𝑁 = 1/15
𝑇1
0.0822 0.0839 0.0846 0.0850 0.0851𝑇 0.0989 0.0924 0.0903 0.0893 0.0886𝑄1 303.8926 310.4945 312.9991 314.6264 315.1490𝑄 367.6386 342.9968 334.8354 331.0722 328.3378NP 1605.1604∗ 1590.9873 1585.8947 1583.2705 1581.6701
𝑁 = 1/14
𝑇1 0.0822 0.0839 0.0846 0.0850 0.0868𝑇 0.0989 0.0924 0.0903 0.0893 0.0903𝑄1 304.0934 310.4480 313.2649 314.7091 321.3629𝑄 367.5960 342.7112 335.0242 331.1502 334.7725NP 1604.7161∗ 1590.6403 1585.5848 1582.9800 1581.3497
𝑁 = 1/13
𝑇1 0.0824 0.0841 0.0847 0.0850 0.0853𝑇 0.0989 0.0926 0.0904 0.0893 0.0887𝑄1 304.6805 311.2158 313.6500 314.7649 315.7399𝑄 367.9643 343.4857 335.3263 331.0772 328.8301NP 1604.2874∗ 1590.3300 1585.3184 1582.7368 1581.1625
∗NP = NP2. For the rest, NP = NP1.
Table 4: Obtained replenishment policy for the traditional case ofExample 2.
𝑐𝑏
5 10 15 20 25𝑇1
0.0785 0.0804 0.0811 0.0819 0.0876𝑇 0.0952 0.0890 0.0869 0.0863 0.0913𝑄1 290.0597 297.2694 299.9274 302.9720 324.4927𝑄 353.7538 329.8431 321.8196 319.5002 338.7249NP 1595.8190 1581.0432 1575.7132 1572.9602 1570.7055
I(t)
Q1
Q − Q1
t
T1 T T1 + NN M
Figure 2: Accumulation of interest earned when𝑀−𝑁 ≤ 𝑇1.
Case 2 (𝑀 − 𝑁 ≥ 𝑇1). According to Figure 3, the retailer’searned interest in this case is
𝑠𝐼𝑒 {∫𝑇1+𝑁
𝑁
𝑅 (𝑡) 𝑑𝑡 +(𝑄 − 𝑄1) (𝑀 − 𝑁) + 𝑄1 (𝑀 − 𝑇1 − 𝑁)}
= 𝑠𝐼𝑒 {(𝑎
2𝑇2
1+𝑏
6𝑇3
1) + (𝑎 (𝑇 − 𝑇1) +
𝑏
2(𝑇2− 𝑇2
1))
× (𝑀 −𝑁) + (𝑎𝑇1 +𝑏
2𝑇2
1) (𝑀 − 𝑇1 − 𝑁)} .
(12)
Based on the charged and earned interests, three generalcases must be considered for modeling the retailer’s net profit
T1 + N
I(t)
Q1
Q − Q1
tT1 TN M
Figure 3: Accumulation of interest earned when𝑀−𝑁 ≥ 𝑇1.
per unit time (NP(𝑇)) which is calculated as (revenue −
ordering cost − purchasing cost − holding cost − backorder-ing cost − interest payable + interest earned)/T:
NP (𝑇1, 𝑇) ={{
{{
{
NP1 (𝑇1, 𝑇) , 𝑀 ≤ 𝑇1
NP2 (𝑇1, 𝑇) , 𝑇1 ≤ 𝑀 ≤ 𝑇1 + 𝑁
NP3 (𝑇1, 𝑇) , 𝑀 ≥ 𝑇1 + 𝑁,
(13)
where
NP1 (𝑇1, 𝑇)
=(𝑠 − 𝑐)
𝑇[𝑎𝑇 +
1
2𝑏𝑇2] −
𝐴
𝑇−ℎ
𝑇(1
2𝑎𝑇2
1+1
3𝑏𝑇3
1)
−𝑐𝑏
𝑇[1
2𝑎 (𝑇 − 𝑇1)
2+1
6𝑏 (𝑇3− 3𝑇𝑇
2
1+ 2𝑇3
1)]
−𝑐𝐼𝑐
𝑇[1
2𝑎 (𝑇1 −𝑀)
2+1
2𝑏𝑇2
1(𝑇1 −𝑀) −
1
6𝑏 (𝑇3
1−𝑀3)]
+𝑠𝐼𝑒
𝑇{(
𝑎
2(𝑀 −𝑁)
2+𝑏
6(𝑀 −𝑁)
3)
+ (𝑎 (𝑇 − 𝑇1) +1
2𝑏 (𝑇2− 𝑇2
1)) (𝑀 −𝑁)} ,

6 Advances in Decision Sciences
Table 5: Obtained replenishment policy for Example 3.
𝑐𝑏
5 10 15 20 25
𝑁 = 1/15
𝑇1
0.1440 0.1445 0.1453 0.1443 0.1443𝑇 0.1597 0.1523 0.1506 0.1483 0.1474𝑄1 542.3339 544.1482 547.5471 543.6133 543.3533𝑄 604.1778 575.0968 568.2234 559.0530 555.6941NP 1694.5580 1686.7691 1684.0872 1682.7359 1681.9173
𝑁 = 1/14
𝑇1 0.1455 0.1450 0.1459 0.1448 0.1448𝑇 0.1613 0.1528 0.1511 0.1487 0.1479𝑄1 548.2020 546.0887 549.6271 545.5131 545.4294𝑄 610.4544 577.0097 570.3747 560.9377 557.7669NP 1693.8558 1686.1022 1683.4340 1682.0905 1681.2763
𝑁 = 1/13
𝑇1 0.1461 0.1451 0.1454 0.1449 0.1458𝑇 0.1618 0.1529 0.1506 0.1487 0.1490𝑄1 550.3455 546.6795 547.6956 545.6541 549.4377𝑄 612.5216 577.4625 568.2460 560.9213 561.8045NP 1693.0960 1685.3898 1682.7439 1681.4036 1680.5950
In the whole table NP = NP1.
Table 6: Obtained replenishment policy for the traditional case ofExample 3.
𝑐𝑏
5 10 15 20 25𝑇1
0.1308 0.1308 0.1310 0.1309 0.1307𝑇 0.1461 0.1384 0.1361 0.1347 0.1337𝑄1 490.6748 490.4136 491.4703 490.7945 490.0092𝑄 550.6563 520.3205 511.4378 505.7431 501.9317NP 1668.1513 1660.1071 1657.3286 1655.9201 1655.0680
NP2 (𝑇1, 𝑇)
=(𝑠 − 𝑐)
𝑇[𝑎𝑇 +
1
2𝑏𝑇2] −
𝐴
𝑇−ℎ
𝑇(1
2𝑎𝑇2
1+1
3𝑏𝑇3
1)
−𝑐𝑏
𝑇[1
2𝑎 (𝑇 − 𝑇1)
2+1
6𝑏 (𝑇3− 3𝑇𝑇
2
1+ 2𝑇3
1)]
+𝑠𝐼𝑒
𝑇{(
𝑎
2(𝑀 −𝑁)
2+𝑏
6(𝑀 −𝑁)
3)
+ (𝑎 (𝑇 − 𝑇1) +1
2𝑏 (𝑇2− 𝑇2
1)) (𝑀 −𝑁)} ,
NP3 (𝑇1, 𝑇)
=(𝑠 − 𝑐)
𝑇[𝑎𝑇 +
1
2𝑏𝑇2] −
𝐴
𝑇−ℎ
𝑇(1
2𝑎𝑇2
1+1
3𝑏𝑇3
1)
−𝑐𝑏
𝑇[1
2𝑎 (𝑇 − 𝑇1)
2+1
6𝑏 (𝑇3− 3𝑇𝑇
2
1+ 2𝑇3
1)]
+ 𝑠𝐼𝑒 {(𝑎
2𝑇2
1+𝑏
6𝑇3
1) + (𝑎 (𝑇 − 𝑇1) +
𝑏
2(𝑇2− 𝑇2
1))
× (𝑀 −𝑁) + (𝑎𝑇1 +𝑏
2𝑇2
1) (𝑀 − 𝑇1 − 𝑁)} .
(14)
Based on these models and according to (13), it can beverified that, in 𝑇1 = 𝑀, NP1(𝑇1, 𝑇) = NP2(𝑇1, 𝑇), and 𝑇1 =𝑀 −𝑁 implies that NP2(𝑇1, 𝑇) = NP3(𝑇1, 𝑇).
Thus, our problem is
Maximize NP (𝑇1, 𝑇)
Subject to 𝑇1 ≤ 𝑇.(15)
This is a nonlinear maximization problem which is goingto be solved to obtain the optimal values of 𝑇1 and 𝑇 andcompute 𝑄1 and 𝑄 accordingly based on (4) and (6).
4. Special Cases
This section discusses the two special cases of the inventorysystem proposed in the last section, the model of Teng et al.[29] and the traditional EOQ model with backorder.
Case 1. Setting𝑁 = 0, 𝑐𝑏 = 0, and𝑇1 = 𝑇, the following resultis achieved:
NP1 (𝑇1, 𝑇)
=(𝑠 − 𝑐)
𝑇[𝑎𝑇 +
𝑏
2𝑇2] −
𝐴
𝑇−ℎ
𝑇(𝑎
2𝑇2+𝑏
3𝑇3)
−𝑐𝐼𝑐
𝑇[𝑎
2(𝑇 −𝑀)
2+𝑏
2𝑇2(𝑇 −𝑀) −
𝑏
6(𝑇3−𝑀3)]
+𝑠𝐼𝑒
𝑇(𝑎
2𝑀2+𝑏
6𝑀3) , 𝑀 ≤ 𝑇,
(16)
NP3 (𝑇1, 𝑇)
=(𝑠 − 𝑐)
𝑇[𝑎𝑇 +
𝑏
2𝑇2] −
𝐴
𝑇−ℎ
𝑇(𝑎
2𝑇2+𝑏
3𝑇3)
Advances in Decision Sciences 7
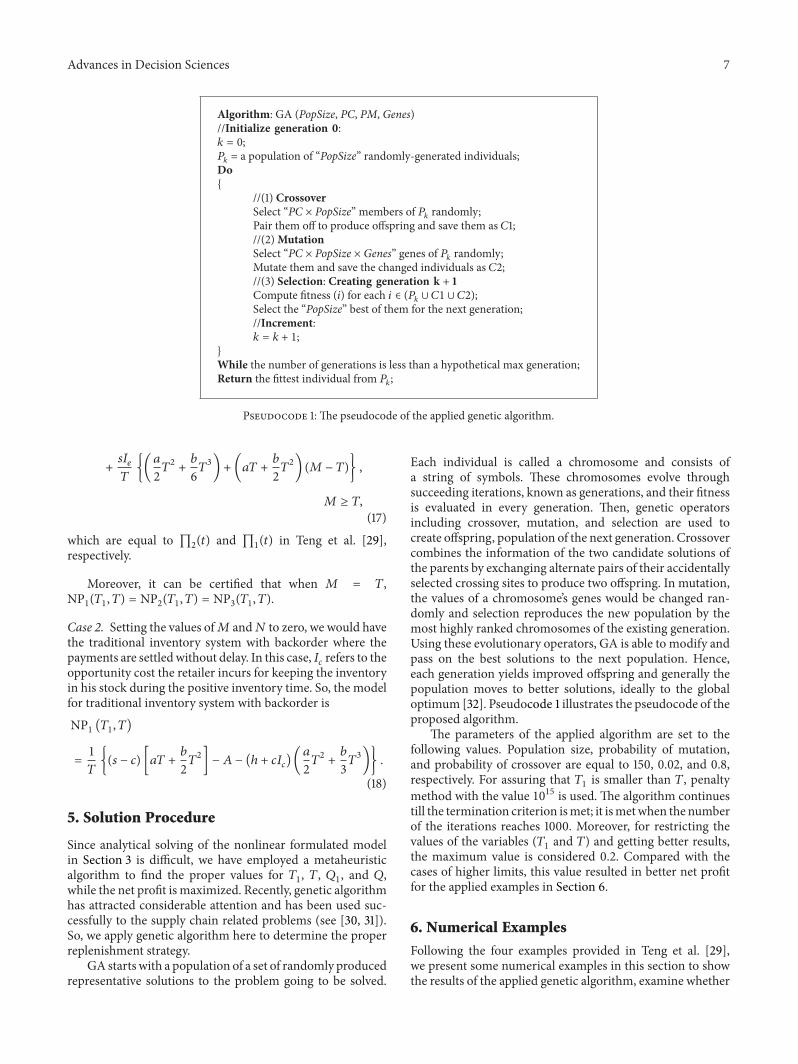
Algorithm: GA (PopSize, PC, PM, Genes)//Initialize generation 0:𝑘 = 0;𝑃𝑘 = a population of “PopSize” randomly-generated individuals;Do{
//(1) CrossoverSelect “PC × PopSize” members of 𝑃𝑘 randomly;Pair them off to produce offspring and save them as 𝐶1;//(2)MutationSelect “PC × PopSize × Genes” genes of 𝑃𝑘 randomly;Mutate them and save the changed individuals as 𝐶2;//(3) Selection: Creating generation k + 1Compute fitness (𝑖) for each 𝑖 ∈ (𝑃𝑘 ∪ 𝐶1 ∪ 𝐶2);Select the “PopSize” best of them for the next generation;//Increment:𝑘 = 𝑘 + 1;
}
While the number of generations is less than a hypothetical max generation;Return the fittest individual from 𝑃𝑘;
Pseudocode 1: The pseudocode of the applied genetic algorithm.
+𝑠𝐼𝑒
𝑇{(
𝑎
2𝑇2+𝑏
6𝑇3) + (𝑎𝑇 +
𝑏
2𝑇2) (𝑀 − 𝑇)} ,
𝑀 ≥ 𝑇,
(17)
which are equal to ∏2(𝑡) and ∏
1(𝑡) in Teng et al. [29],
respectively.
Moreover, it can be certified that when 𝑀 = 𝑇,NP1(𝑇1, 𝑇) = NP2(𝑇1, 𝑇) = NP3(𝑇1, 𝑇).
Case 2. Setting the values of𝑀 and𝑁 to zero, we would havethe traditional inventory system with backorder where thepayments are settledwithout delay. In this case, 𝐼𝑐 refers to theopportunity cost the retailer incurs for keeping the inventoryin his stock during the positive inventory time. So, the modelfor traditional inventory system with backorder isNP1 (𝑇1, 𝑇)
=1
𝑇{(𝑠 − 𝑐) [𝑎𝑇 +
𝑏
2𝑇2] − 𝐴 − (ℎ + 𝑐𝐼𝑐) (
𝑎
2𝑇2+𝑏
3𝑇3)} .
(18)
5. Solution Procedure
Since analytical solving of the nonlinear formulated modelin Section 3 is difficult, we have employed a metaheuristicalgorithm to find the proper values for 𝑇1, 𝑇, 𝑄1, and 𝑄,while the net profit is maximized. Recently, genetic algorithmhas attracted considerable attention and has been used suc-cessfully to the supply chain related problems (see [30, 31]).So, we apply genetic algorithm here to determine the properreplenishment strategy.
GA starts with a population of a set of randomly producedrepresentative solutions to the problem going to be solved.
Each individual is called a chromosome and consists ofa string of symbols. These chromosomes evolve throughsucceeding iterations, known as generations, and their fitnessis evaluated in every generation. Then, genetic operatorsincluding crossover, mutation, and selection are used tocreate offspring, population of the next generation. Crossovercombines the information of the two candidate solutions ofthe parents by exchanging alternate pairs of their accidentallyselected crossing sites to produce two offspring. In mutation,the values of a chromosome’s genes would be changed ran-domly and selection reproduces the new population by themost highly ranked chromosomes of the existing generation.Using these evolutionary operators, GA is able to modify andpass on the best solutions to the next population. Hence,each generation yields improved offspring and generally thepopulation moves to better solutions, ideally to the globaloptimum [32]. Pseudocode 1 illustrates the pseudocode of theproposed algorithm.
The parameters of the applied algorithm are set to thefollowing values. Population size, probability of mutation,and probability of crossover are equal to 150, 0.02, and 0.8,respectively. For assuring that 𝑇1 is smaller than 𝑇, penaltymethod with the value 1015 is used. The algorithm continuestill the termination criterion ismet; it ismetwhen the numberof the iterations reaches 1000. Moreover, for restricting thevalues of the variables (𝑇1 and 𝑇) and getting better results,the maximum value is considered 0.2. Compared with thecases of higher limits, this value resulted in better net profitfor the applied examples in Section 6.
6. Numerical Examples
Following the four examples provided in Teng et al. [29],we present some numerical examples in this section to showthe results of the applied genetic algorithm, examine whether

8 Advances in Decision Sciences
Table 7: Obtained replenishment policy for Example 4.
𝑐𝑏
5 10 15 20 25
𝑁 = 1/15
𝑇1
0.0795 0.0820 0.0841 0.0834 0.0837𝑇 0.0941 0.0895 0.0892 0.0872 0.0867𝑄1 289.9633 299.2573 306.8219 304.4183 305.3441𝑄 343.9493 327.0806 325.8445 318.5614 316.6962NP 1591.4617∗ 1580.4222∗ 1576.4328 1574.4111 1573.1648
𝑁 = 1/14
𝑇1 0.0796 0.0821 0.0829 0.0835 0.0838𝑇 0.0942 0.0896 0.0880 0.0873 0.0868𝑄1 290.4614 299.6770 302.5949 304.7477 305.7191𝑄 344.2597 327.3980 321.2614 318.8368 317.0280NP 1591.0349∗ 1580.0848∗ 1576.1503∗ 1574.1244 1572.8887
𝑁 = 1/13
𝑇1 0.0798 0.0820 0.0831 0.0836 0.0838𝑇 0.0942 0.0894 0.0881 0.0873 0.0869𝑄1 290.9395 299.0856 303.2486 305.0162 305.9744𝑄 344.5000 326.5366 321.8018 319.0373 317.2285NP 1590.6303∗ 1579.7860∗ 1575.8928∗ 1573.8874 1572.6645
∗NP = NP2. For the rest, NP = NP1.
Table 8: Obtained replenishment policy for the traditional case ofExample 4.
𝑐𝑏
5 10 15 20 25𝑇1
0.0754 0.0780 0.0789 0.0794 0.0797𝑇 0.0902 0.0856 0.0840 0.0833 0.0828𝑄1 274.9067 284.2815 287.7354 289.5310 290.6344𝑄 329.5883 312.5334 306.7940 303.9124 302.1825NP 1580.7096 1568.8370 1564.5468 1562.3322 1560.9801
the proposed EOQ model under two-level trade credit withbackorder is profitable to the retailer, test the sensitivityof the model to the changes of the input parameters, andcompare the results with the model of Teng et al. [29] andthe traditional EOQ inventory system with backorder.
Example 1. Suppose that 𝑎 = 3600 units, 𝑏 = 2400,𝑀 = 1/12
year, 𝑠 = $1 per unit, 𝑐 = $0.5 per unit, 𝐴 = $10 per order, ℎ =$0.5 per unit per year, 𝐼𝑐 = $0.155 per year, and 𝐼𝑒 = $0.08 peryear. Applying genetic algorithm, the proper replenishmentpolicy and net profit of the retailer for different values of 𝑁and 𝑐𝑏 are calculated and shown in Table 1.
Special Cases. (i) Example 1 presented in Teng et al. [29] is aspecial case of this example in which𝑁 = 0, 𝑐𝑏 = 0, and 𝑇1 =𝑇. The result of GA for this case is 𝑇 = 0.1340,𝑄 = 503.7677,and NP1 = 1682.7105 which was also obtained in Teng et al.[29].
(ii) Zero values for 𝑀 and 𝑁 leads this example to theconventional inventory system with shortage in which nodelay in payment is assumed. The results of this special caseare shown in Table 2.
Example 2. Considering the second example of Teng et al.[29], we have 𝐷 = 3600 + 2400𝑡 units, 𝑀 = 1/12 year,
𝑠 = $1 per unit, 𝑐 = $0.5 per unit, 𝐴 = $10 per order, ℎ =
$1 per unit per year, 𝐼𝑐 = $0.13 per year, and 𝐼𝑒 = $0.08 peryear. Table 3 shows the solutions obtained for this examplewhen backorder and customers’ trade credit are assumed inthe model.
Special Cases. (i) One of the special cases of this examplewhen 𝑁 = 0, 𝑐𝑏 = 0, and 𝑇1 = 𝑇 reports the same resultsof the second example of Teng et al. [29] as 𝑇 = 0.0823,𝑄 = 304.2236, and NP3 = 1586.6884.
(ii) The results of traditional inventory system withallowable shortages of Example 2 when 𝑀 = 𝑁 = 0 arepresented in Table 4.
Example 3. Suppose that 𝑎 = 3600 units, 𝑏 = 2300, 𝑀 =
1/7.5 year, 𝑠 = $1 per unit, 𝑐 = $0.5 per unit,𝐴 = $10.2278 perorder, ℎ = $0.5 per unit per year, 𝐼𝑐 = $0.17 per year, and 𝐼𝑒 =$0.08 per year.With different values assigned to𝑁 and 𝑐𝑏, thesolutions obtained for this example by GA are demonstratedin Table 5.
Special Cases. (i) Considering zero values for 𝑁 and 𝑐𝑏 andsetting 𝑇1 = 𝑇, the optimal replenishment policy determinedby GA is as 𝑇 = 0.1333, 𝑄 = 500.4455, and NP1 = NP3 =1692.8885 which is identical to the results of Teng et al. [29].
(ii) Table 6 presents the obtained ordering policy forthe case that no delay in payment is assumed to show theconventional inventory system with backorder.
Example 4. Suppose the fourth example of Teng et al. [29] inwhich 𝑎 = 3600 units, 𝑏 = 1200, 𝑀 = 1/12 year, 𝑠 = $1 perunit, 𝑐 = $0.5 per unit,𝐴 = $10 per order, ℎ = $0.9 per unit peryear, 𝐼𝑐 = $0.16 per year, and 𝐼𝑒 = $0.08 per year.The solutionsof this data set, when𝑁 and 𝑐𝑏 are included in the model, arerepresented in Table 7.

Advances in Decision Sciences 9
Table 9: Obtained replenishment policy for Example 5.
𝐼𝑐
ℎ 𝑐𝑏
5 10 15 20 25
0.13 0.9
𝑇1
0.0758 0.0784 0.0792 0.0801 0.0801𝑇 0.0907 0.0860 0.0844 0.0840 0.0832𝑄1 276.4047 285.7800 288.8577 292.1710 292.1543𝑄 331.3114 314.1828 307.9850 306.7559 303.7719NP 1668.4121 1656.4728 1652.1599 1649.9317 1648.5752
0.16 1
𝑇1 0.0711 0.0737 0.0747 0.0751 0.0755𝑇 0.0864 0.0816 0.0800 0.0791 0.0787𝑄1 258.9127 268.4857 272.0984 273.6748 275.1391𝑄 315.5950 297.8718 291.9541 288.5273 287.1792NP 1657.2806 1643.8682 1638.9849 1636.4554 1634.9095
In the whole table NP = NP3.
Table 10: Obtained replenishment policy for the traditional case of Example 5.
𝐼𝑐 ℎ 𝑐𝑏 5 10 15 20 25
0.13 0.9
𝑇1 0.0762 0.0787 0.0796 0.0801 0.0804𝑇 0.0909 0.0863 0.0848 0.0840 0.0835𝑄1 277.8044 287.1020 290.5287 292.3346 293.3977𝑄 332.2228 315.2022 309.4800 306.6227 304.8784NP 1582.4520 1570.7982 1566.5921 1564.4219 1563.0974
0.16 1
𝑇1 0.0707 0.0733 0.0743 0.0748 0.0755𝑇 0.0859 0.0813 0.0797 0.0789 0.0788𝑄1 257.3913 267.2165 270.8610 272.7613 275.2462𝑄 313.7748 296.4620 290.6188 287.6816 287.2915NP 1569.6400 1556.2955 1551.4351 1548.9178 1547.3752
Special Cases. (i) When 𝑁 = 𝑐𝑏 = 0 and 𝑇1 = 𝑇, the fourthexample of Teng et al. [29] is a special case of this example andthe equivalent solutions obtained here by GA are 𝑇 = 0.0810,𝑄 = 295.5996, and NP3 = 1579.7113.
(ii) The results of the traditional inventory system withbackorder for Example 4 are shown in Table 8, when𝑀 and𝑁 are equal to zero.
Example 5. Suppose that 𝑎 = 3600 units, 𝑏 = 1200,𝑀 = 1/2
year,𝑁 = 1/5 year, 𝑠 = $1 per unit, 𝑐 = $0.5 per unit, 𝐴 = $10per order, and 𝐼𝑒 = $0.08 per year.The replenishment policiesfor different values of ℎ, 𝐼𝑐, and 𝑐𝑏 are shown in Table 9.
Special Cases. (i) When 𝑁 = 𝑐𝑏 = 0 and 𝑇1 = 𝑇, Teng et al.[29] is a special case of this example and the solutions foundare the following.
For 𝐼𝑐 = $0.13 and ℎ = 0.9, 𝑇 = 0.0815,𝑄 = 297.5441,and NP3 = 1701.3369.For 𝐼𝑐 = $0.16 and ℎ = 1, 𝑇 = 0.0770, 𝑄 = 280.7654,and NP3 = 1686.8285.
(ii) The results of the traditional inventory system forExample 5 are shown in Table 10, when 𝑀 and 𝑁 are equalto zero.
Comparing the results of the examples for the proposedinventory system with two-level trade credit and allowable
shortages with the results obtained by Teng et al. [29] illus-trates that, for some values of backorder cost, the proposedmodel in this paper is more profitable to the retailer. It isprofitable to the point that the effects of not paying theinventory holding cost and the charged interest during thebackorder period outweigh the cost of shortages. As it isexpected, the examples show that the retailer’s net profitdecreases with the increase of the backorder cost.
Moreover, the net profit earned by the retailer in the two-level trade credit is more than that earned by the same modelwithout delay in payment which is because of the fact that theretailer does not tie up his capital in inventory and can earninterest when the payment is made with delay.
7. Conclusion
For matching the real world inventory systems, this paperextends the model proposed by Teng et al. [29] to the case oftwo-level trade credit with backorder. The formulated modelis then solved by applying genetic algorithm and its validityis proved by solving the same examples reported in Teng etal. [29]. Comparing the results of this paper with that of Tenget al. [29] demonstrates that it can be more profitable whenbackorder cost is smaller than or equal to a specific value.Moreover, comparing with the traditional inventory systemwith backorder, the trade credit, both the model of Teng et al.

10 Advances in Decision Sciences
[29] and the one proposed in this paper, would increase theprofit of the retailer.
The presented inventory model of this paper can beextended in several ways. For example, deteriorating itemscan be considered. Moreover, the system may be generalizedfor partial backlogging shortages. In addition, developing atwo-echelon supply chain inventory system consisting of asupplier and a retailer would be of great research interest.
Conflict of Interests
The authors declare that there is no conflict of interestsregarding the publication of this paper.
Acknowledgment
This research is supported by the University Putra Malaysia.
References
[1] F. W. Harris, “How many parts to make at once,” Factory, TheMagazine of Management, vol. 10, no. 2, pp. 135–136, 1913.
[2] C. H. Glock, E. H. Grosse, and J. M. Ries, “The lot sizingproblem: a tertiary study,” International Journal of ProductionEconomics, vol. 155, pp. 39–51, 2014.
[3] D. Piasecki, Consignment Inventory: What Is It and When DoesIt Make Sense to Use It? White Paper, Inventory OperationsConsulting LLC, 2004.
[4] Z. Molamohamadi, M. Rezaeiahari, and N. Ismail, “Consign-ment inventory: review and critique of literature,” Journal ofBasic and Applied Scientific Research, vol. 3, no. 6, pp. 707–714,2013.
[5] D. Seifert, R. W. Seifert, and M. Protopappa-Sieke, “A review oftrade credit literature: opportunities for research in operations,”European Journal of Operational Research, vol. 231, no. 2, pp.245–256, 2013.
[6] Z. Molamohamadi, N. Ismail, Z. Leman, and N. Zulkifli,“Reviewing the literature of inventory models under tradecredit contact,” Discrete Dynamics in Nature and Society, vol.2014, Article ID 975425, 19 pages, 2014.
[7] S. K. Goyal, “Economic order quantity under conditions ofpermissible delay in payments,” Journal of the OperationalResearch Society, vol. 36, no. 4, pp. 335–338, 1985.
[8] S. P. Aggarwal and C. K. Jaggi, “Ordering policies of deteriorat-ing items under permissible delay in payments,” Journal of theOperational Research Society, vol. 46, no. 5, pp. 658–662, 1995.
[9] A. M. M. Jamal, B. R. Sarker, and S. Wang, “An ordering policyfor deteriorating items with allowable shortage and permissibledelay in payment,” Journal of the Operational Research Society,vol. 48, no. 8, pp. 826–833, 1997.
[10] J.-T. Teng, “On the economic order quantity under conditionsof permissible delay in payments,” Journal of the OperationalResearch Society, vol. 53, no. 8, pp. 915–918, 2002.
[11] K.-J. Chung and Y.-F. Huang, “The optimal cycle time forEPQ inventory model under permissible delay in payments,”International Journal of Production Economics, vol. 84, no. 3, pp.307–318, 2003.
[12] Y.-F. Huang, “Optimal retailer’s ordering policies in the EOQmodel under trade credit financing,” Journal of the OperationalResearch Society, vol. 54, no. 9, pp. 1011–1015, 2003.
[13] Y.-F. Huang, “An inventory model under two levels of tradecredit and limited storage space derived without derivatives,”Applied Mathematical Modelling, vol. 30, no. 5, pp. 418–436,2006.
[14] J.-T. Teng and S. K. Goyal, “Optimal ordering policies for aretailer in a supply chain with up-stream and down-streamtrade credits,” Journal of the Operational Research Society, vol.58, no. 9, pp. 1252–1255, 2007.
[15] Y.-F. Huang, “Economic order quantity under conditionallypermissible delay in payments,”European Journal ofOperationalResearch, vol. 176, no. 2, pp. 911–924, 2007.
[16] Y.-F. Huang, “Optimal retailer’s replenishment decisions in theEPQ model under two levels of trade credit policy,” EuropeanJournal of Operational Research, vol. 176, no. 3, pp. 1577–1591,2007.
[17] J.-T. Teng and C.-T. Chang, “Optimal manufacturer’s replenish-ment policies in the EPQmodel under two levels of trade creditpolicy,” European Journal of Operational Research, vol. 195, no.2, pp. 358–363, 2009.
[18] C.-H. Su, “An integrated supplier-buyer inventory model withconditionally free shipment under permissible delay in pay-ments,” Abstract and Applied Analysis, vol. 2010, Article ID594246, 20 pages, 2010.
[19] C.-Y. Dye and L.-Y. Ouyang, “A particle swarm optimizationfor solving joint pricing and lot-sizing problemwith fluctuatingdemand and trade credit financing,” Computers & IndustrialEngineering, vol. 60, no. 1, pp. 127–137, 2011.
[20] C.-Y. Dye, “A finite horizon deteriorating inventory model withtwo-phase pricing and time-varying demand and cost undertrade credit financing using particle swarm optimization,”Swarm and Evolutionary Computation, vol. 5, pp. 37–53, 2012.
[21] G. C. Mahata, “An EPQ-based inventory model for exponen-tially deteriorating items under retailer partial trade creditpolicy in supply chain,” Expert Systems with Applications, vol.39, no. 3, pp. 3537–3550, 2012.
[22] K.-R. Lou and L. Wang, “Optimal lot-sizing policy for amanufacturer with defective items in a supply chain with up-stream and down-stream trade credits,” Computers & IndustrialEngineering, vol. 66, no. 4, pp. 1125–1130, 2013.
[23] Z. Molamohamadi, R. Arshizadeh, and N. Ismail, “An EPQinventory model with allowable shortages for deterioratingitems under trade credit policy,” Discrete Dynamics in Natureand Society, vol. 2014, Article ID 476085, 10 pages, 2014.
[24] M.-S. Chern, Y.-L. Chan, J.-T. Teng, and S. K. Goyal, “Nashequilibrium solution in a vendor-buyer supply chain modelwith permissible delay in payments,” Computers & IndustrialEngineering, vol. 70, no. 1, pp. 116–123, 2014.
[25] M.-S. Chern, Q. Pan, J.-T. Teng, Y.-L. Chan, and S.-C. Chen,“Stackelberg solution in a vendor-buyer supply chain modelwith permissible delay in payments,” International Journal ofProduction Economics, vol. 144, no. 1, pp. 397–404, 2013.
[26] S.-C. Chen and J.-T. Teng, “Retailer’s optimal ordering policyfor deteriorating items with maximum lifetime under supplier’strade credit financing,”AppliedMathematicalModelling, vol. 38,no. 15-16, pp. 4049–4061, 2014.
[27] S.-C. Chen, J.-T. Teng, and K. Skouri, “Economic productionquantity models for deteriorating items with up-stream fulltrade credit and down-streampartial trade credit,” InternationalJournal of Production Economics, vol. 155, pp. 302–309, 2014.
[28] S.-C. Chen, L. E. Cardenas-Barron, and J.-T. Teng, “Retailer’seconomic order quantity when the supplier offers conditionally

Advances in Decision Sciences 11
permissible delay in payments link to order quantity,” Interna-tional Journal of Production Economics, vol. 155, pp. 284–291,2014.
[29] J.-T. Teng, J. Min, and Q. Pan, “Economic order quantitymodel with trade credit financing for non-decreasing demand,”Omega, vol. 40, no. 3, pp. 328–335, 2012.
[30] X. Chen, W. Wan, and X. Xu, “Modeling rolling batch planningas vehicle routing problem with time windows,” Computers &Operations Research, vol. 25, no. 12, pp. 1127–1136, 1998.
[31] Y.-B. Park, “A hybrid genetic algorithm for the vehicle schedul-ing problem with due times and time deadlines,” InternationalJournal of Production Economics, vol. 73, no. 2, pp. 175–188, 2001.
[32] M. Gen and R. Cheng, Genetic Algorithms and EngineeringDesign, John Wiley & Sons, New York, NY, USA, 1997.

Submit your manuscripts athttp://www.hindawi.com
Hindawi Publishing Corporationhttp://www.hindawi.com Volume 2014
MathematicsJournal of
Hindawi Publishing Corporationhttp://www.hindawi.com Volume 2014
Mathematical Problems in Engineering
Hindawi Publishing Corporationhttp://www.hindawi.com
Differential EquationsInternational Journal of
Volume 2014
Applied MathematicsJournal of
Hindawi Publishing Corporationhttp://www.hindawi.com Volume 2014
Probability and StatisticsHindawi Publishing Corporationhttp://www.hindawi.com Volume 2014
Journal of
Hindawi Publishing Corporationhttp://www.hindawi.com Volume 2014
Mathematical PhysicsAdvances in
Complex AnalysisJournal of
Hindawi Publishing Corporationhttp://www.hindawi.com Volume 2014
OptimizationJournal of
Hindawi Publishing Corporationhttp://www.hindawi.com Volume 2014
CombinatoricsHindawi Publishing Corporationhttp://www.hindawi.com Volume 2014
International Journal of
Hindawi Publishing Corporationhttp://www.hindawi.com Volume 2014
Operations ResearchAdvances in
Journal of
Hindawi Publishing Corporationhttp://www.hindawi.com Volume 2014
Function Spaces
Abstract and Applied AnalysisHindawi Publishing Corporationhttp://www.hindawi.com Volume 2014
International Journal of Mathematics and Mathematical Sciences
Hindawi Publishing Corporationhttp://www.hindawi.com Volume 2014
The Scientific World JournalHindawi Publishing Corporation http://www.hindawi.com Volume 2014
Hindawi Publishing Corporationhttp://www.hindawi.com Volume 2014
Algebra
Discrete Dynamics in Nature and Society
Hindawi Publishing Corporationhttp://www.hindawi.com Volume 2014
Hindawi Publishing Corporationhttp://www.hindawi.com Volume 2014
Decision SciencesAdvances in
Discrete MathematicsJournal of
Hindawi Publishing Corporationhttp://www.hindawi.com
Volume 2014 Hindawi Publishing Corporationhttp://www.hindawi.com Volume 2014
Stochastic AnalysisInternational Journal of