republic of tunisia - oecd · 25 3.5 infant mortality republic of tunisia: country assistance...
TRANSCRIPT

Republic of TunisiaCountry Assistance Evaluation
2004The World Bank
Washington, D.C.
W O R L D B A N K O P E R A T I O N S E V A L U A T I O N D E P A R T M E N T
http://www.worldbank.org/oed
Advance Copy

© 2004 The International Bank for Reconstruction and Development / The World Bank
1818 H Street, NW
Washington, D.C. 20433
Telephone: 202-473-1000
Internet: www.worldbank.org
E-mail: [email protected]
All rights reserved
Manufactured in the United States of America
First edition September 2004
The findings, interpretations, and conclusions expressed here are those of the author(s) and do not necessarily reflect the
views of the Board of Executive Directors of the World Bank or the governments they represent.
The World Bank cannot guarantee the accuracy of the data included in this work. The boundaries, colors,
denominations, and other information shown on any map in the work do not imply on the part of the World Bank any
judgment of the legal status of any territory or the endorsement or acceptance of such boundaries.
Rights and Permissions
The material in this publication is copyrighted. Copying and/or transmitting portions or all of this work without permission
may be a violation of applicable law. The World Bank encourages dissemination of its work and will normally grant
permission promptly.
For permission to photocopy or reprint any part of this work, please send a request with complete information to the
Copyright Clearance Center, Inc., 222 Rosewood Drive, Danvers, MA 01923, USA, telephone 978-750-8400, fax 978-750-4470,
www.copyright.com.
All other queries on rights and licenses, including subsidiary rights, should be addressed to the Office of the Publisher,
World Bank, 1818 H Street NW, Washington, DC 20433, USA, fax 202-522-2422, e-mail [email protected].
Cover photos courtesy of the World Bank Photo Library.
ISBN 0-8213-5974-6
e-ISBN 0-8213-5975-4
Library of Congress Cataloging-in-Publication data have been applied for.
Printed on Recycled Paper
World Bank InfoShop
E-mail: [email protected]
Telephone: 202-458-5454
Facsimile: 202-522-1500
Operations Evaluation Department
Knowledge Programs and Evaluation Capacity
Development (OEDKE)
E-mail: [email protected]
Telephone: 202-458-4497
Facsimile: 202-522-3125
This advance copy of the Tunisia Country Assistance Evaluation is provided for the convenience of the attendees atthe Conference on Effectiveness of Policies and Reforms: What We Have Learned. Although every effort has beenmade to ensure the accuracy of this advance copy, some elements contained herein may be corrected or otherwisealtered in the course of publication. The published evaluation, which will be available next month, remains the docu-ment of record.
i i i
v Acknowledgments
vii Preface, Prefacio, Préface
ix Executive Summary, Résumen, Résumé Analytique
xvii Acronyms and Abbreviations
1 1 Tunisia’s Socioeconomic Development: Progress Achieved and Challenges Ahead 1 Background 3 Poverty and Social Conditions 5 Debt Burden and External Assistance 5 Meeting the Challenges of Globalization
9 2 World Bank Assistance Program9 World Bank Assistance Strategies 10 Economic and Sector Work 13 Lending
17 3 The Development Impact of World Bank Assistance17 Macroeconomic Stabilization, Growth, and Structural Reforms 22 Human Development and Progress toward MDGs 26 Poverty Alleviation and Rural Development 28 Outcome, Sustainability, and Institutional Development
31 4 Contributors’ Performance31 Tunisia’s Own Central Role 32 The World Bank’s Performance 33 Other Development Partners 34 Exogenous Factors
37 5 Recommendations
39 Annexes41 A: Statistical Annexes 79 B: List of People Met on Mission in Tunisia (and World Bank and IMF
Staff Interviewed) 83 C: Guide to OED’s Country Assistance Evaluation Methodology 87 D: Management Action Record
Contents

89 Attachments89 1: Islamic Development Bank—Tunisia Country Assistance Evaluation 93 2: Report from the Committee on Development Effectiveness (CODE)
97 Endnotes
99 References
Boxes7 1.1 Mise à niveau Program (Enterprise Restructuring and Upgrading)11 2.1 World Bank Strategies23 3.1 Tunisia’s Progress in Meeting the Millennium Development Goals
Tables3 1.1 Tunisia’s Export Diversification, 1980–013 1.2 Main Macroeconomic Indicators4 1.3 Poverty and Inequality Trends in Tunisia, 1990–004 1.4 Selected Human Development Indicators in Tunisia and Comparator
Countries6 1.5 Tunisia: Net Receipts of External Financial Resources, 1990–01 13 2.1 Distribution of World Bank Commitments by Sector (FY90–03)14 2.2 IBRD Proposed and Actual Lending, FY97–0214 2.3 OED Evaluation Findings of Recently Evaluated Projects by Value18 3.1 Tunisia and Comparators: Per Capita Income Indicators21 3.2 Privatization by Sector, in million Tunisian Dinar 28 3.3 Northwest Mountainous Areas Development Project: Selected Results
from the 2000 Survey
Figures10 2.1 Bank Commitments, Disbursements, and Transfers21 3.1 Business Climate Indices for Tunisia, MNA, and OECD 25 3.2 Education System Expansion at the Post-Basic Level25 3.3 Net Primary Enrollment25 3.4 Illiteracy25 3.5 Infant Mortality
R E P U B L I C O F T U N I S I A : C O U N T R Y A S S I S TA N C E E VA L U AT I O N
i v

v
Acknowledgments
Fareed M. A. Hassan was the Task Manager for thisreport and acknowledges with thanks the con-tributions by Adil Kanaan and Isabelle Tsakok(Consultants). Ibrahim A. Elbadawi and JorgeGarcia-Garcia reviewed the report. Gonzalo Sali-nas provided statistical information and JaniceJoshi, administrative support.
The evaluation is the second cooperative ef-fort with the Islamic Development Bank, fol-lowing the joint evaluation of the Jordanprogram. The support of Bader Eddine Nouioua,Adviser, Operations Evaluation and Audit, IDB,and Djelloul Al-Saci, Head, Operations Evalua-
tion Office, IDB, is greatly acknowledged. Gre-gory K. Ingram, Director-General, OperationsEvaluation, and Kyle Peters, Senior Manager,OEDCR, provided overall guidance, with substantial input into the formulation of the report.
Special thanks are due to the officials of thegovernment of Tunisia for their valuable assis-tance and to the civil society and donor repre-sentatives interviewed in the country. The reporthas also benefited significantly from helpful andconstructive suggestions from numerous WorldBank, IDB, and IMF staff.
Director-General, Operations Evaluation: Gregory K. IngramDirector, Operations Evaluation Department: Ajay Chhibber
Senior Manager, Country Evaluation & Regional Relations: R. Kyle PetersTask Manager: Fareed M.A. Hassan


PREFACE
This Country Assistance Eval-uation (CAE) on Tunisia is the secondcooperative effort with the OperationsEvaluation Office (OEO) of the IslamicDevelopment Bank, following the jointOED-OEO assessment of the JordanProgram. The two institutions carriedout a joint assessment of Tunisia’s eco-nomic and social development since1990 and the challenges facing thecountry. There will be two separatereports; the assessments of each in-stitution’s assistance program wereprepared in parallel. This report ben-efited from consultations and com-ments from OEO staff, and the twoevaluations generally agree on theiranalysis. The Executive Summary ofthe Islamic Development Bank’s re-port is attached (Attachment 1).
A joint OED-OEO mission visitedTunisia in September 2003. The visitwas facilitated by arrangementsmade by the staff of the TunisianMinistry of Economic Developmentand International Cooperation. Theircooperation and assistance is grate-fully acknowledged.
The report is organized as fol-lows: Chapter 1 assesses Tunisia’ssocioeconomic development and thechallenges ahead. This chapter iscommon to the evaluation reports ofboth the World Bank and the IslamicDevelopment Bank. The subsequentchapters examine the effectiveness ofWorld Bank assistance in addressingthese challenges. The last chaptermakes recommendations.
This Country Assistance Evalua-tion was written by Fareed M.A. Has-
PREFACIO
La presente Evaluación de laAsistencia al País (EAP) para Túnezes la segunda iniciativa en coopera-ción con la Oficina de Evaluación deOperaciones (OEO) del Banco Islámicode Desarrollo (BIsD), tras la evalua-ción conjunta del DEO y la OEO delPrograma para Jordania. Ambas insti-tuciones llevaron a cabo una evalua-ción conjunta del desarrolloeconómico y social de Túnez desde1990, así como de los desafíos que elpaís enfrenta. Se entregarán dos in-formes independientes; las evalua-ciones del programa de asistencia decada institución han sido elaboradasen paralelo. Este informe contó con elaporte de consultas y comentarios delpersonal de la Oficina de Evaluaciónde Operaciones; en términos genera-les, las dos evaluaciones concuerdanen su análisis. Se adjunta la Reseña delinforme del Banco Islámico de Desa-rrollo (Anexo 1).
En septiembre de 2003, una mi-sión conjunta del DEO y la OEO efec-tuó una visita a Túnez. La visita fuepropiciada por las gestiones del per-sonal del Ministerio de DesarrolloEconómico y Cooperación Interna-cional de Túnez, al que debemosnuestro reconocimiento y gratitudpor su cooperación y asistencia.
El informe se organiza como sedetalla a continuación. El Capítulo 1evalúa el desarrollo socioeconómicode Túnez y los desafíos futuros. Esecapítulo es común a los informes deevaluación del Banco Mundial y elBanco Islámico de Desarrollo. Loscapítulos subsiguientes examinan la
PRÉFACE
La présente Évaluation del’aide par pays (CAE) sur la Tunisie estle second effort de collaboration avecle Bureau de l’évaluation des opéra-tions (OEO) de la Banque islamique dedéveloppement, suite à l’évaluationconjointe OED-OEO du Programme jor-danien. Les deux institutions ont menéà bien une évaluation conjointe du dé-veloppement économique et social dela Tunisie depuis 1990 et des défis aux-quels est confronté le pays. Il y auradeux rapports séparés ; l’évaluationdu programme d’aide de chaque insti-tution a été préparée en parallèle. Cerapport a bénéficié des consultationset des commentaires du personnel del’OEO et les deux évaluations concor-dent de manière générale dans leuranalyse. La note de synthèse du rapportde la Banque islamique de dévelop-pement est ci-jointe (Pièce jointe 1).
Une mission conjointe OED-OEOs’est rendue en Tunisie en sep-tembre 2003. Cette visite a été faci-litée par les arrangements effectuéspar le personnel du Ministère tuni-sien du développement économiqueet de la coopération internationale.Nous tenons ici à les remercier deleur coopération et de leur aide.
Le rapport est organisé commesuit : Le chapitre 1 est une évaluationdu développement socioécono-mique de la Tunisie et des défis aux-quels elle va être confrontée. Cechapitre est commun aux deux rap-ports d’évaluation, celui de laBanque mondiale et celui de laBanque islamique de développe-ment. Dans les chapitres suivants
P R E FA C E
v i i
EN
GL
ISH
FR
AN
ÇA
IS
ES
PA
NO
L

san (Task Manager) with con-tributions by Djelloul Al-Saci(IDB); Adil Kanaan, IsabelleTsakok, and Elaine W. Ooi(Consultants). Gonzalo Sali-nas and Janice Joshi providedstatistical analysis and ad-ministrative support.
Ibrahim Elbadawi and Jorge Gar-cia-Garcia peer-reviewed the report.The assistance of peer reviewers inproviding detailed comments on anearlier draft is gratefully acknowl-edged. Those comments, as well asothers, received during OED’s man-agement review meeting, have beentaken into account in the evaluation.
Comments from the RegionalManagement of the Bank have alsobeen reflected in the report. TheRegional response to the Manage-ment Action Record is included asAnnex D. Copies of the draft reportwere sent to the government forreview, and no written commentswere received.
eficacia de la asistencia delBanco Mundial para abordarestos desafíos. El último ca-pítulo presenta recomenda-ciones.
Esta Evaluación de Asis-tencia al País ha sido redac-tada por Fareed M.A. Hassan
(Gerente de tareas), con los aportesde Djelloul Al-Saci (BIsD); Adil Ka-naan, Isabelle Tsakok y Elaine W. Ooi(Consultores). Gonzalo Salinas y Ja-nice Joshi brindaron análisis estadís-ticos y apoyo administrativo.
Ibrahim Elbadawi y Jorge Garcia-Garcia estuvieron a cargo de la revi-sión entre pares del informe.Deseamos destacar nuestro agrade-cimiento a los colegas revisores porla ayuda prestada. Sus comentariosdetallados, así como otros recibidosdurante la reunión de análisis de ges-tión, se han tenido en cuenta en laevaluación.
El informe también refleja las ob-servaciones de los directivos de laOficina Regional del Banco. Se in-cluye, como Anexo D, la respuesta re-gional al Registro de Acción deGestión. Se han enviado al gobiernocopias del informe preliminar para suanálisis, y no se han recibido co-mentarios por escrito.
est examinée l’efficacité del’aide de la Banque mondialedans la façon d’aborder cesdéfis. Dans le dernier cha-pitre sont faites des recom-mandations.
L’Évaluation de l’aide parpays a été rédigée par Fareed
M.A. Hassan (Chef de projet) avec lacontribution de Djelloul Al-Saci(BID), Adil Kanaan, Isabelle Tsakoket Elaine W. Ooi (Consultants). Gon-zalo Salinas et Janice Joshi ont ap-porté les analyses statistiques et lesoutien administratif.
Ibrahim Elbadawi et Jorge Gar-cia-Garcia ont été réviseurs-pairspour ce rapport. Nous tenons à re-mercier les réviseurs-pairs pour avoirapporté leurs commentaires dé-taillés sur une version antérieure dudocument. Il a été tenu compte dansl’évaluation de ces commentaires,ainsi que d’autres commentairesreçus au cours de la réunion de ré-examen de la direction de l’OED.
Il a également été tenu comptedans ce rapport des commentairesde la Direction régionale de laBanque. La réponse régionale aux ré-sultats des mesures de gestion fi-gure à l’Annexe D. Copie du projetde rapport a été adressé au Gou-vernement pour examen et aucuncommentaire écrit n’a été reçu.
R E P U B L I C O F T U N I S I A : C O U N T R Y A S S I S TA N C E E VA L U AT I O N
v i i i
FR
AN
ÇA
IS
ES
PA
NO
L
EN
GL
ISH

RÉSUMÉ ANALYTIQUE
La présente Évaluation del’aide par pays a été préparée en col-laboration avec la Banque islamiquede développement. Le développementsocioéconomique de la Tunisie depuis1990 et les défis auxquels est confrontéle pays ont été évalués conjointement ;le programme d’aide de chaque insti-tution a été évalué en parallèle.
La Tunisie a réussi la transition quil’a fait passer d’exportations fondéessur les ressources, principalement depétrole et de gaz, à celles de produitsmanufacturés et de services. L’éco-nomie est à présent principalementdominée par les exportations textiles,électriques et mécaniques et de trans-formation des aliments, le tourisme etles activités connexes, et la productiond’olives et de céréales. Le taux decroissance réelle du PIB augmentede façon constante, passant de 3 % paran au cours de la période 1985-1990à plus de 5 % par an au cours de la pé-riode 1996-2002. Aujourd’hui, avecun revenu par habitant de 2000 dol-lars US, les Tunisiens disposent d’unrevenu réel deux fois et demie supé-rieur à celui de leurs parents il y atrente ans. La Tunisie a signé un ac-cord d’association avec l’Union eu-ropéenne (AAUE) qui prévoit unlibre-échange pour les produits ma-nufacturés d’ici 2008. L’UE est le prin-cipal partenaire commercial de laTunisie, la région est la source de 67 %des mouvements de capitaux en di-rection de la Tunisie, elle représenteune large part du marché touristiquede la Tunisie, et c’est la région ayantla plus grande communauté de Tuni-
EXECUTIVESUMMARY
This Country Assistance Eval-uation was prepared in collaborationwith the Islamic Development Bank.Tunisia’s socioeconomic developmentsince 1990 and the challenges facingthe country were assessed jointly;each institution’s assistance programwas evaluated in parallel.
Tunisia has successfully shiftedfrom resource-based exports domi-nated by oil and gas to manufac-tures and services. The economy isnow driven mainly by textiles, elec-trical, mechanical, and food pro-cessing exports; tourism and relatedactivities; and production of olivesand cereals. Real GDP growth hasbeen consistently rising, increasingfrom 3 percent annually over 1985-90 to more than 5 percent annuallyover 1996–02. Today, with a percapita income of US$2,000, Tunisiansenjoy more than two-and-a-halftimes the real incomes that theirparents had thirty years ago. Tunisiasigned an association agreementwith the European Union (EUAA)that provides for free trade in man-ufacturing by 2008. The EuropeanUnion (EU) has been Tunisia’s dom-inant trading partner; the region isthe source of 67 percent of capitalflows into Tunisia, accounts for alarge share of Tunisia’s tourism mar-ket, and is the region with the largestcommunity of expatriate Tunisians.As such the economy is vulnerableto adverse developments in the EU.
Rapid growth made possible a re-markable improvement in social in-dicators and a decline in the poverty
RÉSUMEN
Esta Evaluación de Asistenciaal País ha sido preparada en colabo-ración con el Banco Islámico de De-sarrollo. Se llevó a cabo unaevaluación conjunta del desarrollo so-cioeconómico de Túnez desde 1990 yde los desafíos que enfrenta el país; seevaluaron en paralelo los programasde asistencia de cada institución.
Túnez ha realizado con éxito elpaso de exportaciones basadas en re-cursos (principalmente petróleo ygas) a las de manufacturas y servi-cios. En la actualidad, la economíaestá impulsada principalmente porlas exportaciones textiles, electro-mecánicas y las relacionadas con elprocesamiento de alimentos, asícomo por las actividades turísticas yafines y la producción de aceitunas ycereales. El PIB real ha crecido enforma constante, de un 3 por cientoanual entre 1985 y 1990 a más de un5 por ciento anual entre 1996 y 2002.Hoy, con ingresos per cápita de USD2.000, los ingresos reales de los tu-necinos corresponden a dos veces ymedia los que obtenían sus padreshace treinta años. Túnez ha celebradoun acuerdo de asociación con laUnión Europea (EUAA, por sus siglasen inglés) que prevé la implementa-ción del libre comercio de manufac-turas para 2008. La Unión Europea(UE) ha sido el principal socio co-mercial de Túnez; la región es lafuente del 67 por ciento del flujo decapital hacia Túnez, representa unagran proporción del mercado del tu-rismo en ese país y constituye la re-gión con la mayor comunidad de
E X E C U T I V E S U M M A R Y
i x
EN
GL
ISH
FR
AN
ÇA
IS
ES
PA
NO
L
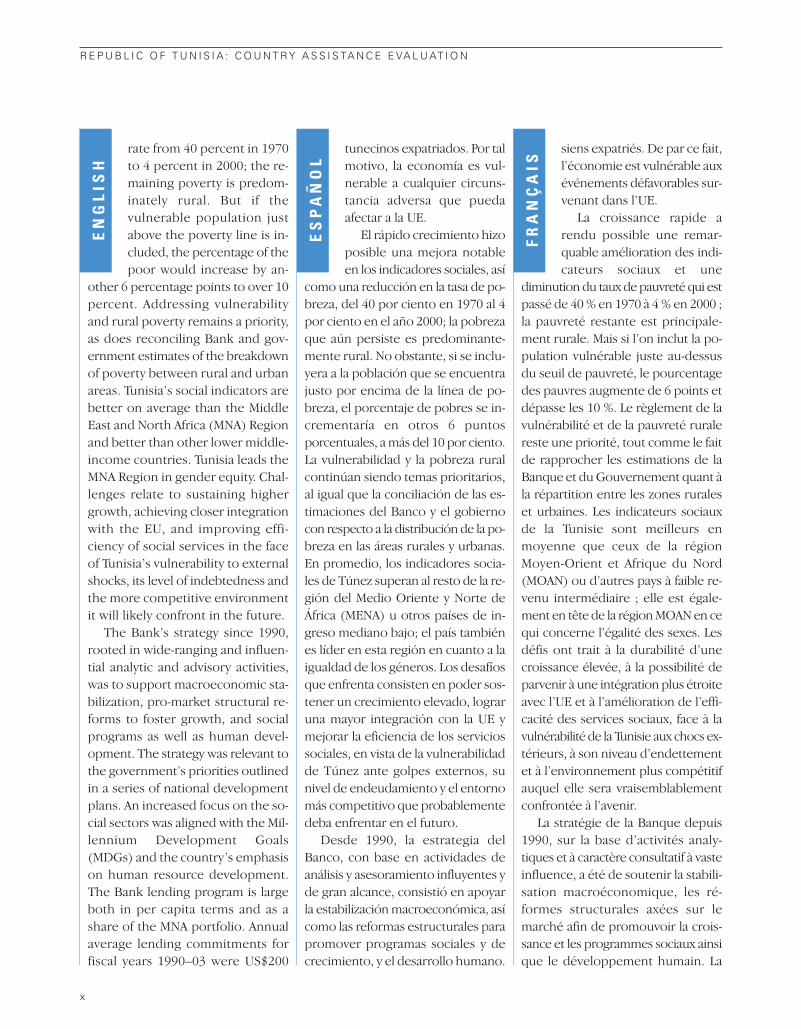
rate from 40 percent in 1970to 4 percent in 2000; the re-maining poverty is predom-inately rural. But if thevulnerable population justabove the poverty line is in-cluded, the percentage of thepoor would increase by an-
other 6 percentage points to over 10percent. Addressing vulnerabilityand rural poverty remains a priority,as does reconciling Bank and gov-ernment estimates of the breakdownof poverty between rural and urbanareas. Tunisia’s social indicators arebetter on average than the MiddleEast and North Africa (MNA) Regionand better than other lower middle-income countries. Tunisia leads theMNA Region in gender equity. Chal-lenges relate to sustaining highergrowth, achieving closer integrationwith the EU, and improving effi-ciency of social services in the faceof Tunisia’s vulnerability to externalshocks, its level of indebtedness andthe more competitive environmentit will likely confront in the future.
The Bank’s strategy since 1990,rooted in wide-ranging and influen-tial analytic and advisory activities,was to support macroeconomic sta-bilization, pro-market structural re-forms to foster growth, and socialprograms as well as human devel-opment. The strategy was relevant tothe government’s priorities outlinedin a series of national developmentplans. An increased focus on the so-cial sectors was aligned with the Mil-lennium Development Goals(MDGs) and the country’s emphasison human resource development.The Bank lending program is largeboth in per capita terms and as ashare of the MNA portfolio. Annualaverage lending commitments forfiscal years 1990–03 were US$200
tunecinos expatriados. Por talmotivo, la economía es vul-nerable a cualquier circuns-tancia adversa que puedaafectar a la UE.
El rápido crecimiento hizoposible una mejora notableen los indicadores sociales, así
como una reducción en la tasa de po-breza, del 40 por ciento en 1970 al 4por ciento en el año 2000; la pobrezaque aún persiste es predominante-mente rural. No obstante, si se inclu-yera a la población que se encuentrajusto por encima de la línea de po-breza, el porcentaje de pobres se in-crementaría en otros 6 puntosporcentuales, a más del 10 por ciento.La vulnerabilidad y la pobreza ruralcontinúan siendo temas prioritarios,al igual que la conciliación de las es-timaciones del Banco y el gobiernocon respecto a la distribución de la po-breza en las áreas rurales y urbanas.En promedio, los indicadores socia-les de Túnez superan al resto de la re-gión del Medio Oriente y Norte deÁfrica (MENA) u otros países de in-greso mediano bajo; el país tambiénes líder en esta región en cuanto a laigualdad de los géneros. Los desafíosque enfrenta consisten en poder sos-tener un crecimiento elevado, lograruna mayor integración con la UE ymejorar la eficiencia de los serviciossociales, en vista de la vulnerabilidadde Túnez ante golpes externos, sunivel de endeudamiento y el entornomás competitivo que probablementedeba enfrentar en el futuro.
Desde 1990, la estrategia delBanco, con base en actividades deanálisis y asesoramiento influyentes yde gran alcance, consistió en apoyarla estabilización macroeconómica, asícomo las reformas estructurales parapromover programas sociales y decrecimiento, y el desarrollo humano.
siens expatriés. De par ce fait,l’économie est vulnérable auxévénements défavorables sur-venant dans l’UE.
La croissance rapide arendu possible une remar-quable amélioration des indi-cateurs sociaux et une
diminution du taux de pauvreté qui estpassé de 40 % en 1970 à 4 % en 2000 ;la pauvreté restante est principale-ment rurale. Mais si l’on inclut la po-pulation vulnérable juste au-dessusdu seuil de pauvreté, le pourcentagedes pauvres augmente de 6 points etdépasse les 10 %. Le règlement de lavulnérabilité et de la pauvreté ruralereste une priorité, tout comme le faitde rapprocher les estimations de laBanque et du Gouvernement quant àla répartition entre les zones ruraleset urbaines. Les indicateurs sociauxde la Tunisie sont meilleurs enmoyenne que ceux de la régionMoyen-Orient et Afrique du Nord(MOAN) ou d’autres pays à faible re-venu intermédiaire ; elle est égale-ment en tête de la région MOAN en cequi concerne l’égalité des sexes. Lesdéfis ont trait à la durabilité d’unecroissance élevée, à la possibilité deparvenir à une intégration plus étroiteavec l’UE et à l’amélioration de l’effi-cacité des services sociaux, face à lavulnérabilité de la Tunisie aux chocs ex-térieurs, à son niveau d’endettementet à l’environnement plus compétitifauquel elle sera vraisemblablementconfrontée à l’avenir.
La stratégie de la Banque depuis1990, sur la base d’activités analy-tiques et à caractère consultatif à vasteinfluence, a été de soutenir la stabili-sation macroéconomique, les ré-formes structurales axées sur lemarché afin de promouvoir la crois-sance et les programmes sociaux ainsique le développement humain. La
R E P U B L I C O F T U N I S I A : C O U N T R Y A S S I S TA N C E E VA L U AT I O N
x
EN
GL
ISH
FR
AN
ÇA
IS
ES
PA
NO
L

million (or US$20 per capitaper year), representing overone quarter of the MNA Re-gional portfolio. Annual av-erage net disbursementswere only US$27 million, andnet transfers were negativefor most of the period. Policy-
based lending, in conjunction withvarious donor programs, accountedfor 40 percent of total lending and ad-dressed trade, financial, and privatesector development. Investmentloans supported mainly rural andhuman development projects. TheBank served as a significant catalystfor mobilizing resources, leveragingnearly US$1 for every IBRD dollar.
With timely and effective supportfrom the Bank and other donors,Tunisia averted a balance of paymentcrisis in the late 1980s, and sincethen has maintained a solid recordof macroeconomic stability and re-markable socioeconomic progress.The main attributes of Tunisia’s suc-cess were ownership and broad po-litical consensus, a well-developedhuman resource base, and a stablemacroeconomic environment. TheBank’s programs successfully pro-moted policy reforms. Substantialfinancial sector reforms wereachieved as well as the removal ofdisincentives for investment and theprivatization of public enterprises.Tariffs have been reduced and theeconomy is now more open to theoutside world. Manufactured exportshave grown steadily, increasing theirshare to 80 percent. The overallsoundness of the banking systemhas improved, as indicated byprogress in prudential ratios. Priva-tization in the banking sector hasalso advanced.
Bank assistance also contributedto significant progress in the rural
Esta estrategia era relevantepara las prioridades del go-bierno, planteadas en unaserie de planes nacionales dedesarrollo. La mayor atencióna los sectores sociales era com-patible con los Objetivos deDesarrollo del Milenio (ODM)
y el énfasis del país en el desarrollo delos recursos humanos. El programa definanciamiento del Banco es impor-tante, tanto en valores per cápitacomo en términos de la proporciónque representa en la cartera para la re-gión de Medio Oriente y Norte deÁfrica. Los compromisos de financia-miento anual promedio para los ejer-cicios fiscales de 1990 a 2003 fueronde USD 200 millones (o USD 20 percápita por año); esto representa másde un cuarto de la cartera regional.Los desembolsos netos anuales pro-medio fueron de sólo USD 27 millo-nes, y las transferencias netas fueronnegativas para la mayor parte del pe-ríodo. El financiamiento basado enpolíticas, conjuntamente con diversosprogramas de donantes, representóun 40 por ciento del financiamientototal y se destinó al desarrollo co-mercial, financiero y del sector pri-vado. Los préstamos para inversión sedestinaron a apoyar principalmenteproyectos de desarrollo rural y hu-mano. El Banco tuvo una importantefunción catalizadora al movilizar re-cursos a razón de USD 1 por cadadólar del BIRF.
A fines de la década de 1980, con unapoyo oportuno y eficaz del Banco yotros donantes, Túnez evitó una crisisde la balanza de pagos, y desde en-tonces ha mantenido un historial só-lido de estabilidad macroeconómica yun notable progreso socioeconómico.Los factores principales del éxito deTúnez han sido la identificación con losprogramas y el amplio consenso polí-
stratégie correspondait auxpriorités du Gouvernementexposées dans une série deplans nationaux de dévelop-pement. La focalisation accruesur les secteurs sociaux étaitdans la lignée des Objectifs dedéveloppement pour le mil-
lénaire (ODM) et de l’accent mis parle pays sur le développement des res-sources humaines. Le programme deprêts de la Banque est important, tantpar habitant qu’en tant que part duportefeuille MOAN. Les engagementsannuels moyens de prêts pour lesexercices 1990 à 2003 étaient de 200millions de dollars US (soit 20 dol-lars US par habitant par an), ce qui re-présente plus d’un quart duportefeuille de la région MOAN. Lesdécaissements annuels moyens netsn’ont été que de 27 millions de dol-lars US et les transferts nets ont été né-gatifs pour la plus grande partie de lapériode. Les prêts fondés sur la poli-tique stratégique, conjointement auxprogrammes de divers bailleurs defonds, ont représenté 40 % du totaldes prêts et ont été destinés au dé-veloppement commercial, financier etdu secteur privé. Les prêts pour pro-jets d’investissement ont soutenuprincipalement des projets ruraux etde développement des ressourceshumaines. La Banque a servi de cata-lyseur notable pour la mobilisationde ressources, obtenant près de 1dollar US pour chaque dollar BIRD.
Grâce au soutien effectif et entemps utile de la Banque et d’autresbailleurs de fonds, la Tunisie a évitéune crise de la balance des paiementsà la fin des années 80 et a depuis réussià maintenir une stabilité macroéco-nomique et un progrès socioécono-mique remarquable. Les principalescaractéristiques du succès de la Tuni-sie ont été sa prise en charge et un
E X E C U T I V E S U M M A R Y
x i
EN
GL
ISH
FR
AN
ÇA
IS
ES
PA
NO
L
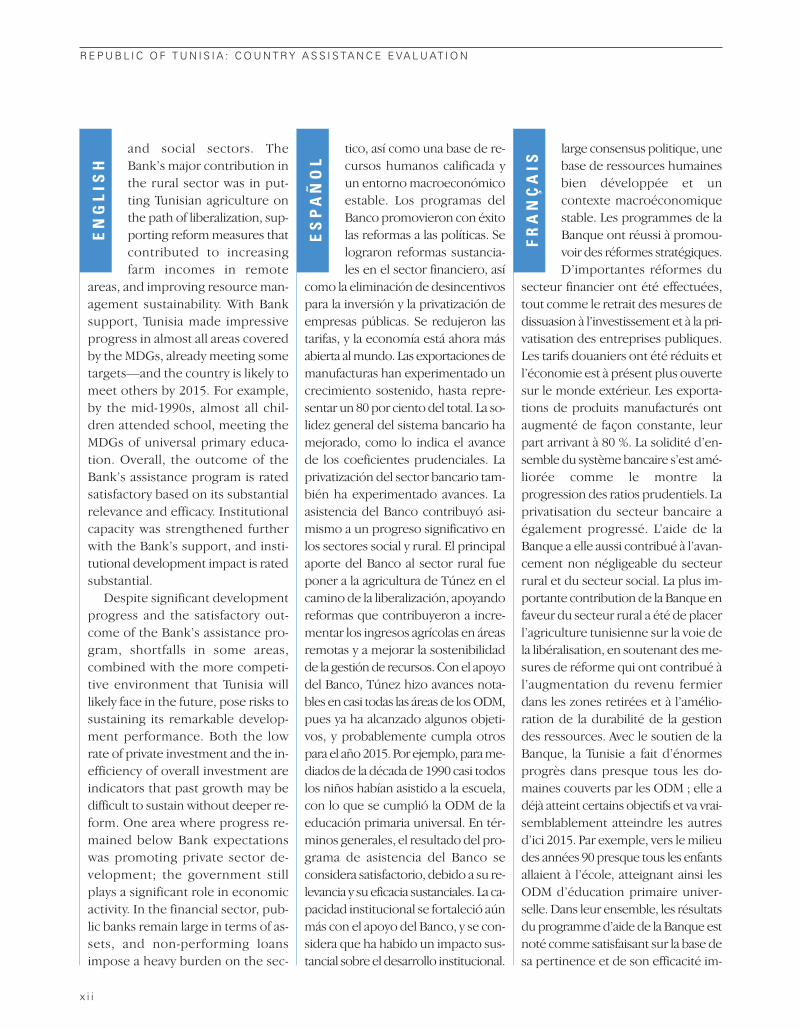
and social sectors. TheBank’s major contribution inthe rural sector was in put-ting Tunisian agriculture onthe path of liberalization, sup-porting reform measures thatcontributed to increasingfarm incomes in remote
areas, and improving resource man-agement sustainability. With Banksupport, Tunisia made impressiveprogress in almost all areas coveredby the MDGs, already meeting sometargets—and the country is likely tomeet others by 2015. For example,by the mid-1990s, almost all chil-dren attended school, meeting theMDGs of universal primary educa-tion. Overall, the outcome of theBank’s assistance program is ratedsatisfactory based on its substantialrelevance and efficacy. Institutionalcapacity was strengthened furtherwith the Bank’s support, and insti-tutional development impact is ratedsubstantial.
Despite significant developmentprogress and the satisfactory out-come of the Bank’s assistance pro-gram, shortfalls in some areas,combined with the more competi-tive environment that Tunisia willlikely face in the future, pose risks tosustaining its remarkable develop-ment performance. Both the lowrate of private investment and the in-efficiency of overall investment areindicators that past growth may bedifficult to sustain without deeper re-form. One area where progress re-mained below Bank expectationswas promoting private sector de-velopment; the government stillplays a significant role in economicactivity. In the financial sector, pub-lic banks remain large in terms of as-sets, and non-performing loansimpose a heavy burden on the sec-
tico, así como una base de re-cursos humanos calificada yun entorno macroeconómicoestable. Los programas delBanco promovieron con éxitolas reformas a las políticas. Selograron reformas sustancia-les en el sector financiero, así
como la eliminación de desincentivospara la inversión y la privatización deempresas públicas. Se redujeron lastarifas, y la economía está ahora másabierta al mundo. Las exportaciones demanufacturas han experimentado uncrecimiento sostenido, hasta repre-sentar un 80 por ciento del total. La so-lidez general del sistema bancario hamejorado, como lo indica el avancede los coeficientes prudenciales. Laprivatización del sector bancario tam-bién ha experimentado avances. Laasistencia del Banco contribuyó asi-mismo a un progreso significativo enlos sectores social y rural. El principalaporte del Banco al sector rural fueponer a la agricultura de Túnez en elcamino de la liberalización, apoyandoreformas que contribuyeron a incre-mentar los ingresos agrícolas en áreasremotas y a mejorar la sostenibilidadde la gestión de recursos. Con el apoyodel Banco, Túnez hizo avances nota-bles en casi todas las áreas de los ODM,pues ya ha alcanzado algunos objeti-vos, y probablemente cumpla otrospara el año 2015. Por ejemplo, para me-diados de la década de 1990 casi todoslos niños habían asistido a la escuela,con lo que se cumplió la ODM de laeducación primaria universal. En tér-minos generales, el resultado del pro-grama de asistencia del Banco seconsidera satisfactorio, debido a su re-levancia y su eficacia sustanciales. La ca-pacidad institucional se fortaleció aúnmás con el apoyo del Banco, y se con-sidera que ha habido un impacto sus-tancial sobre el desarrollo institucional.
large consensus politique, unebase de ressources humainesbien développée et uncontexte macroéconomiquestable. Les programmes de laBanque ont réussi à promou-voir des réformes stratégiques.D’importantes réformes du
secteur financier ont été effectuées,tout comme le retrait des mesures dedissuasion à l’investissement et à la pri-vatisation des entreprises publiques.Les tarifs douaniers ont été réduits etl’économie est à présent plus ouvertesur le monde extérieur. Les exporta-tions de produits manufacturés ontaugmenté de façon constante, leurpart arrivant à 80 %. La solidité d’en-semble du système bancaire s’est amé-liorée comme le montre laprogression des ratios prudentiels. Laprivatisation du secteur bancaire aégalement progressé. L’aide de laBanque a elle aussi contribué à l’avan-cement non négligeable du secteurrural et du secteur social. La plus im-portante contribution de la Banque enfaveur du secteur rural a été de placerl’agriculture tunisienne sur la voie dela libéralisation, en soutenant des me-sures de réforme qui ont contribué àl’augmentation du revenu fermierdans les zones retirées et à l’amélio-ration de la durabilité de la gestiondes ressources. Avec le soutien de laBanque, la Tunisie a fait d’énormesprogrès dans presque tous les do-maines couverts par les ODM ; elle adéjà atteint certains objectifs et va vrai-semblablement atteindre les autresd’ici 2015. Par exemple, vers le milieudes années 90 presque tous les enfantsallaient à l’école, atteignant ainsi lesODM d’éducation primaire univer-selle. Dans leur ensemble, les résultatsdu programme d’aide de la Banque estnoté comme satisfaisant sur la base desa pertinence et de son efficacité im-
R E P U B L I C O F T U N I S I A : C O U N T R Y A S S I S TA N C E E VA L U AT I O N
x i i
EN
GL
ISH
FR
AN
ÇA
IS
ES
PA
NO
L

tor and pose risks to stability.In trade policy, tariff rates re-main above competitors’ lev-els, and more needs to bedone to ensure that discrim-ination against non-EU tradeis eliminated within the over-all framework of the EUAA.
Another area where the govern-ment’s program needs to be en-hanced and the Bank needs to directits attention more than in the past isthe overall efficiency and fiscal sus-tainability of social expenditures, asexpenditures on social services re-main high. Education expansion atthe post-basic level and a decline inbasic education enrollment due todemographic changes will necessi-tate efficiency improvements. In therural sector, addressing issues suchas land tenure, rural finance, non-farm rural development, and re-search and extension will beimportant, as these are areas wherepast Bank assistance programs wereless successful. Finally, past positivedevelopment outcomes have fos-tered a large middle class that willpress for more participation in thedevelopment process. In the past,Tunisia has managed well its eco-nomic and regional political uncer-tainties by maintaining social andmacroeconomic stability, graduallydiversifying its export base, and forg-ing closer relations with the EU.Given its past record, sustainabilityof the achievements is rated likely.
This evaluation recommends thatthe Bank should continue to sup-port improving the environment forprivate sector development and en-hancing competitiveness, as thecountry seeks to integrate more intothe global economy and will con-front an increasingly competitive cli-mate in the next few years. Adopting
Pese a los avances signifi-cativos en el desarrollo y alresultado satisfactorio del pro-grama de asistencia delBanco, las deficiencias en al-gunas áreas, combinadas conel entorno más competitivoque Túnez posiblemente en-
frente en el futuro, plantean riesgospara la sostenibilidad de su desta-cado desarrollo. Tanto la baja tasa deinversión privada como la ineficien-cia de las inversiones en general in-dican que el crecimiento pasadoposiblemente sea difícil de mante-ner si no se profundiza la reforma. Unárea en la que el progreso no satisfizolas expectativas del Banco fue la pro-moción del desarrollo del sector pri-vado; el gobierno continúadesempeñando un papel significa-tivo en la actividad económica. En elsector financiero, los bancos públicossiguen estando sobredimensionadosen términos de activos, y los présta-mos no redituables representan unacarga pesada para el sector, ademásde constituir un riesgo para la esta-bilidad. En materia de política co-mercial, los aranceles siguen estandopor encima de los niveles de los com-petidores, y es necesario tomar másmedidas tendientes a eliminar la dis-criminación contra el comercio pro-veniente de países fuera de la UE,dentro del marco general del EUAA.Otra área en la que es necesario me-jorar el programa del gobierno, y a laque el Banco necesita prestar másatención que en el pasado, es la efi-ciencia general y la sostenibilidad fis-cal del gasto social, pues el gasto enservicios sociales sigue siendo ele-vado. La expansión de la educaciónen el nivel posterior al básico, con-jugada con la declinación en la ins-cripción en la educación básicadebido a cambios demográficos,
portantes. La capacité institu-tionnelle s’est vue renforcéeplus encore grâce au soutiende la Banque et l’impact entermes de développement ins-titutionnel est noté commeimportant.
En dépit de notables pro-grès au niveau du développement etles résultats satisfaisants du pro-gramme d’aide de la Banque, les in-suffisances dans certains domaines,combinées au contexte plus compé-titif auquel la Tunisie sera vraisem-blablement confrontée à l’avenir,posent des risques pour le maintiende ses remarquables performancesau niveau du développement. Tantle faible taux des investissements pri-vés que l’inefficacité globale des in-vestissements sont des indicateursqu’il peut être difficile de soutenir lacroissance passée sans des réformesplus profondes. Un domaine dans le-quel le progrès est resté en deçà desattentes de la Banque est la promo-tion du développement du secteurprivé ; le gouvernement joue encoreun rôle non négligeable dans l’activitééconomique. Dans le secteur finan-cier, les banques publiques demeu-rent importantes en termes de totalde bilan et les créances non produc-tives imposent un lourd fardeau surle secteur et posent des risques entermes de stabilité. Dans le domainede la politique commerciale, les tarifsdouaniers demeurent au dessus du ni-veau des concurrents et il convient defaire plus pour assurer que la discri-mination à l’encontre du commercenon UE soit éliminée dans le cadreglobal de l’AAUE. Un autre domaineoù le programme du gouvernementa besoin d’être amélioré et auquel laBanque doit prêter une plus grandeattention que par le passé, est l’effi-cacité globale et la durabilité fiscale
E X E C U T I V E S U M M A R Y
x i i i
EN
GL
ISH
FR
AN
ÇA
IS
ES
PA
NO
L

a results-based approach,with agreed and monitorableoutput and outcome indica-tors embedded in an im-proved monitoring andevaluation framework, wouldhelp to anchor the Bank’s as-sistance program in the fu-
ture. Specifically, the Bank should(i) help the country pursue tradeopenness with the EU and the restof the world, (ii) help improve thebusiness environment through reg-ulatory and judiciary reforms, in-cluding measures to reduce the flowand stock of non-performing loans,and (iii) promote enterprise and fi-nancial sector privatization. FutureBank programs should also (iv) helpstrengthen rural institutions to sup-port efficient output and input mar-kets (for example, land and ruralfinance) while maintaining socialand political stability through bettertargeted safety nets. After 21 yearswithout a rural sector-wide review,the Bank should undertake one toinform its future programs. Finally,the Bank should also fill the gaps incore diagnostic economic and sec-tor work (ESW) by completing apublic expenditure review (PER), aCountry Financial Accountability As-sessment (CFAA), and a Country Pro-curement Assessment Review(CPAR). In particular, a PER couldhelp build capacity to prioritize pub-lic spending and provide the basisfor measures to efficiently addresseducation expansion.
harán necesaria la imple-mentación de mejoras orien-tadas a la eficiencia. En elsector rural será importanteabordar temas como la te-nencia de tierras, el financia-miento del sector rural, eldesarrollo rural no agrícola y
la investigación y extensión, pues sonáreas en las que los programas deasistencia anteriores del Banco hantenido menos éxito. Por último, losresultados positivos del pasado enel área del desarrollo han promovidola formación de una gran clase mediaque ejercerá presión para lograr unamayor participación en el procesode desarrollo. En el pasado, Túnez hatenido se ha manejado bien ante la in-certidumbre económica y política re-gional, manteniendo la estabilidadsocial y macroeconómica, diversifi-cando gradualmente su base de ex-portaciones y forjando relacionesmás estrechas con la UE. A la luz desus antecedentes, se considera pro-bable que pueda sostener sus logros.
Esta evaluación recomienda que elBanco continúe apoyando las mejo-ras coyunturales para el desarrollodel sector privado y el aumento de lacompetitividad, dado que el país pro-cura profundizar su integración a laeconomía global, y probablementedeba enfrentar un clima cada vez máscompetitivo en los años venideros. Laadopción de un enfoque orientado alos resultados, con indicadores deproductos y resultados acordados enun entorno mejorado de seguimientoy evaluación, ayudaría a forjar unabase firme para el programa de asis-tencia del Banco en el futuro. Espe-cíficamente, el Banco debería (i)ayudar al país a procurar lograr laapertura comercial con la UE y elresto del mundo, (ii) contribuir a me-jorar el entorno comercial mediante
des dépenses sociales, car lesdépenses en matière de ser-vices sociaux demeurent éle-vées. L’expansion del’enseignement au delà del’enseignement de base et ladiminution des inscriptionsau niveau de l’enseignement
de base en raison de changementsdémographiques nécessiteront desaméliorations en termes d’efficacité.Dans le secteur rural, il sera importantd’aborder des questions commecelles de la propriété foncière, du fi-nancement rural, du développement,de la recherche et de la vulgarisationruraux hors exploitations agricoles,car ce sont là des domaines dans les-quels les programmes d’aide de laBanque n’ont pas par le passé aussibien réussi. Enfin, les résultats posi-tifs passés en matière de développe-ment ont favorisé une vaste classemoyenne qui va exiger une plusgrande participation au processus dedéveloppement. Par le passé la Tuni-sie a bien géré ses incertitudes éco-nomiques et de politique régionale enmaintenant une stabilité sociale etmacroéconomique, en diversifiantgraduellement ses exportations et enétablissant des rapports plus étroitsavec l’UE. Compte tenu de ses résul-tats passés, la durabilité de ces résul-tats est jugée comme vraisemblable.
Les recommandations de la pré-sente évaluation sont que la Banquedevrait continuer à soutenir l’amélio-ration de la conjoncture pour le dé-veloppement du secteur privé et unemeilleure compétitivité à mesure quele pays cherche à s’intégrer plus en-core dans l’économie mondiale etsera confrontée dans les prochainesannées à un contexte de plus en plusconcurrentiel. Le fait d’adopter une ap-proche fondée sur les résultats avecdes extrants convenus et contrôlables
R E P U B L I C O F T U N I S I A : C O U N T R Y A S S I S TA N C E E VA L U AT I O N
x i v
EN
GL
ISH
FR
AN
ÇA
IS
ES
PA
NO
L

reformas regulatorias y jurí-dicas, por ejemplo con medi-das para reducir el flujo y lacantidad de préstamos no re-dituables, y (iii) promover laprivatización del sector fi-nanciero y de las empresaspúblicas. Los programas fu-
turos del Banco deberían, además, (iv) ayudar a fortalecer las institu-ciones rurales a fin de dar apoyo a losmercados eficientes de productos einsumos (por ejemplo, el financia-miento rural y de adquisición de tie-rras) manteniendo a la vez laestabilidad social y política a través deredes de seguridad mejor orienta-das. Después de 21 años sin realizarun examen con alcance a todo el sec-tor rural, el Banco debería llevarlo acabo para informar sus futuros pro-gramas. Por último, el Banco tam-bién debería llenar el vacío existenteen materia de trabajos básicos dediagnóstico con estudios económicos y sectoriales, mediante una Revisióndel Gasto Público, una Evaluación dela Capacidad de Gestión Financiera yuna Evaluación de las Contratacio-nes del País. En particular, el estudiodel gasto público podría ayudar a for-talecer las capacidades para priori-zar el gasto público y proporcionar unparámetro de medición para abor-dar con eficiencia la expansión de laeducación.
et des indicateurs de résultatsintégrés dans une démarchede supervision et d’évaluationaiderait à asseoir le pro-gramme d’aide de la Banque àl’avenir. En particulier, laBanque devrait (i) aider le paysà poursuivre l’ouverture de
son commerce avec l’UE et le reste dumonde, (ii) aider à améliorer lecontexte commercial par le biais de ré-formes réglementaires et judiciaires,y compris des mesures visant à ré-duire le flux et les réserves de créancesnon productives, et (iii) promouvoirla privatisation des entreprises et dusecteur financier. Les programmes fu-turs de la Banque devraient égale-ment (iv) aider à renforcer lesinstitutions rurales en soutenant desmarchés d’intrants et d’extrants effi-caces (par exemple le financementfoncier et rural) tout en maintenant lastabilité sociale et politique par le biaisd’une meilleure protection sociale ci-blée. Après 21 ans sans un examende l’ensemble du secteur rural, laBanque devrait en entreprendre unpour transmettre l’information auxprogrammes futurs. Enfin, la Banquedevrait également combler les lacunesdes activités économiques et secto-rielles de base (ESW) en effectuantun examen des dépenses publiques(PER), une évaluation de la respon-sabilisation financière du pays (CFAA)et une revue de la passation des mar-chés du pays (CPAR). Un PER pourraitnotamment aider au renforcementdes capacités visant à établir les prio-rités des dépenses publiques et àfournir la base pour des mesures per-mettant d’aborder de façon efficacel’expansion de l’éducation.
E X E C U T I V E S U M M A R Y
x v
FR
AN
ÇA
IS
ES
PA
NO
L
Gregory K. Ingram Director-General, Operations Evaluation


x v i i
AAA Analytical and advisory activitiesAAL Agricultural Adjustment LoanAFD Agence Française de Développement
French Development AgencyAfDB African Development BankASIL Agricultural Sector Investment LoanBNA Banque Nationale AgricoleBNP Banque Nationale de ParisCAE Country Assistance EvaluationCAS Country Assistance StrategyCEM Country Economic MemorandumCFAA Country Financial Accountability AssessmentCPAR Country Procurement Assessment ReviewECAL Economic Competitiveness Adjustment LoanEFRSL Enterprise and Financial Reform Support LoanEIB European Investment BankESW Economic and sector workEQIP Education Quality Improvement ProgramEU European UnionEUAA European Union Association AgreementFDI Foreign Direct InvestmentFSD Financial sector developmentGDP Gross domestic productGNI Gross national incomeGNP Gross national productGOT Government of TunisiaGSM Global System MobileIBRD International Bank for Reconstruction and DevelopmentIDB Islamic Development BankIMF International Monetary FundINS National Institute of StatisticsITPAL Industry and Trade Policy Adjustment LoanKfW Kreditanstalt für Wiederaufbau (German Agency for Reconstruction) M&E Monitoring and evaluationMDG Millennium Development GoalMEDA Mesures d’accompagnement financiers et techniques à la reforme des
structures économiques et sociales dans le cadre du partenariat euro-méditerranéen
MFA Multifibre Arrangement MM Macroeconomic managementMNA Middle East and North Africa RegionMOA Ministry of AgricultureMOE Ministry of EducationNGO Nongovernmental organizationNPL Nonperforming loansODESYPANO Office du Développement Sylvo-Pastoral du Nord-OuestOECD Organisation for Economic Co-operation and DevelopmentOED Operations Evaluation Department
ACRONYMS AND ABBREVIATIONS
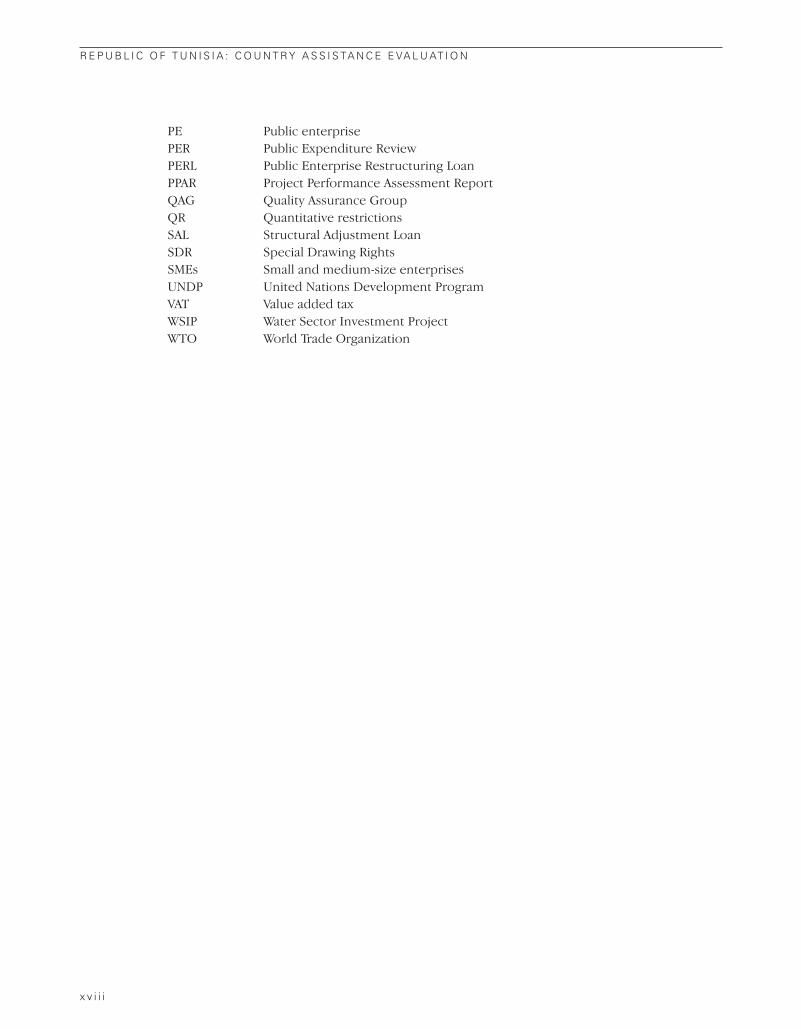
PE Public enterprisePER Public Expenditure Review PERL Public Enterprise Restructuring LoanPPAR Project Performance Assessment ReportQAG Quality Assurance GroupQR Quantitative restrictionsSAL Structural Adjustment LoanSDR Special Drawing RightsSMEs Small and medium-size enterprisesUNDP United Nations Development ProgramVAT Value added taxWSIP Water Sector Investment ProjectWTO World Trade Organization
R E P U B L I C O F T U N I S I A : C O U N T R Y A S S I S TA N C E E VA L U AT I O N
x v i i i

1
Tunisia’s SocioeconomicDevelopment Progress Achieved and Challenges Ahead
This Country Assistance Evaluation (CAE) looks at the effectiveness ofWorld Bank assistance since 1990 from three perspectives: an analysisof the Bank’s assistance program, the Bank’s development impact, and
the contribution of the Bank and its development partners to developmentoutcomes. Annex C describes the methodology. The evaluation is based onbackground studies, internal World Bank reports, and interviews with gov-ernment officials, Bank staff, donors, and civil society. Annex B contains a listof the people interviewed. The CAE was prepared in collaboration with theIslamic Development Bank.
BackgroundTunisia gained its independence from France in1956. As a republic with a strong central author-ity vested in the president, it has since experi-enced political stability at a time when itsneighborhood has been experiencing signifi-cant turmoil. As a moderate Arab country inNorth Africa, it has managed not to beabsorbed within the vortex of the morecomplex Middle Eastern politics, whilemaintaining a good link with its Arabneighbors, often serving as an interlocutor, or apolitical haven. The United States hasannounced the opening in 2004 of a regionaloffice in Tunis of the US–Middle East Partner-ship Initiative. As with its neighbors in North
Africa, much of Tunisia’s land is arid, or semi-arid, with as little as 3 percent of arable landirrigated, while rain-fed agriculture is subject tosevere annual fluctuations in rainfall. In 2002,the population of 9.8 million had a per capitaincome of US$2,000 (annex table A.1).
After independence, the political leadershipopted initially for a dirigiste economic system,with mainly public ownership of manufacturingindustries, banks, and other financial institu-tions. At independence, the country’s mostimportant raw materials were petroleum,natural gas, and phosphates. However, oil andgas production has been decreasing as reserveshave been depleted, and the quality ofphosphate deposits is poor. As an alternative
11

source of income, attention has been given tothe development of manufacturing, tourism,and other services. At the same time, thecountry invested heavily in human resourcedevelopment and paid particular attention towelfare and education. This proved animportant contributor to Tunisia’s economicperformance in subsequent decades.
The oil boom of the 1970s. The multi-fold increasein the price of crude generated high exportrevenues that financed significantly higherlevels of investment (30 percent of GDP),particularly in manufacturing. As a result, realGDP growth averaged 7.4 percent annuallythroughout the 1970s. High oil revenuesallowed the economy to perform well under thedirigiste system. Directive policies controllinginvestment and prices were broadly applied, inthe context of protected trade and generoussubsidies to enterprises. The priority given tohuman resource development continued.
The first half of the 1980s: decline and apprehension.Problems with economic performance startedto emerge in the early 1980s as oil prices andproduction levels declined, while high invest-ment levels and public expenditures weremaintained. Although Tunisia’s Sixth Five-YearPlan (1982–86) proposed stringent policies,unaffordable investment levels and lax policiescontinued, leading to a deterioration in themacroeconomic situation. By 1984, inflationhad risen to 10 percent; the current accountdeficit had grown to almost 11 percent of GDP,external debt to 46 percent of GDP, and thedebt service ratio to 21 percent. By 1985, abalance of payment crisis appeared imminent.
The turning point in the mid-1980s. Faced withgrowing macroeconomic imbalances, thegovernment pursued a program of stabilizationand adjustment supported by the World Bankand the International Monetary Fund (IMF).The reform program proceeded at a gradualbut steady pace, consolidating past progress,although the state continued to keep aprominent position in the economy. The fiscaldeficit and inflation fell, and GDP grew at 4
percent per annum between 1987 and 1994.The fiscal and current account deficits havehovered around 4 percent of GDP since themid-1990s.
A new phase of development by the mid-1990s. GivenTunisia’s limited domestic markets, the govern-ment decided to increase its integration in theworld economy to accelerate higher growth. In1995, Tunisia became the first country in theregion to sign an association agreement with theEU (EUAA). The agreement includes provisionsfor the phased establishment of a free tradezone for manufacturers over a 12-year period(1996–08). Also, Tunisia signed bilateral tradeagreements with Morocco, Jordan, Libya, Iraq,and Syria. The economy is now more open tothe outside world, and imports and exportsconstitute about 90 percent of GDP, up from 70percent in the mid-1980s. This ratio comparesfavorably to other Middle East and North Africa(MNA) countries at similar income level (annextable A.2k).
From oil dominated and volatile to more stable anddiversified economy. Since the mid-1980s,Tunisia’s exports have been successfully diversi-fied, moving away from resource-based exportsdominated by oil and gas to manufactures (table1.1). Export of manufactures has grown ataround 10 percent a year in real terms since1987, increasing the share of manufactures inexports to over 80 percent. Tunisia’s economy isnow driven mainly by textiles, electrical andmechanical equipment, and food processing (inthe manufacturing sector), tourism and relatedactivities (in the services sector), and produc-tion of olives and cereals (in the agriculturalsector). Tunisia’s major exports are now textilesand leather (making up 50 percent of exports).Today, Tunisians enjoy more than two-and-a-halftimes the real incomes that their parents hadthirty years ago. The service sector, whichaccounts for nearly 60 percent of GDP, has beenproviding the largest contribution. Theindustrial sector is the second largest, withabout 28 percent of GDP, and has been fairlydynamic. Agriculture’s contribution to growthfluctuates widely, largely based on weather
2
R E P U B L I C O F T U N I S I A : C O U N T R Y A S S I S TA N C E E VA L U AT I O N
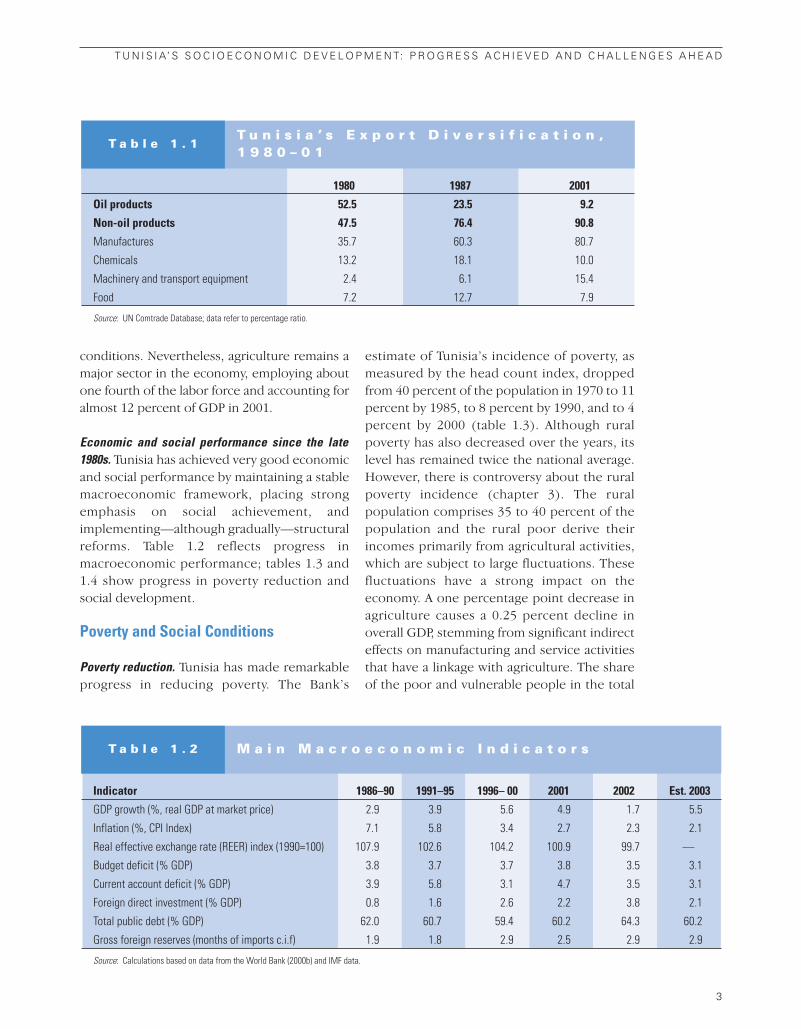
conditions. Nevertheless, agriculture remains amajor sector in the economy, employing aboutone fourth of the labor force and accounting foralmost 12 percent of GDP in 2001.
Economic and social performance since the late1980s. Tunisia has achieved very good economicand social performance by maintaining a stablemacroeconomic framework, placing strongemphasis on social achievement, andimplementing—although gradually—structuralreforms. Table 1.2 reflects progress inmacroeconomic performance; tables 1.3 and1.4 show progress in poverty reduction andsocial development.
Poverty and Social Conditions
Poverty reduction. Tunisia has made remarkableprogress in reducing poverty. The Bank’s
estimate of Tunisia’s incidence of poverty, asmeasured by the head count index, droppedfrom 40 percent of the population in 1970 to 11percent by 1985, to 8 percent by 1990, and to 4percent by 2000 (table 1.3). Although ruralpoverty has also decreased over the years, itslevel has remained twice the national average.However, there is controversy about the ruralpoverty incidence (chapter 3). The ruralpopulation comprises 35 to 40 percent of thepopulation and the rural poor derive theirincomes primarily from agricultural activities,which are subject to large fluctuations. Thesefluctuations have a strong impact on theeconomy. A one percentage point decrease inagriculture causes a 0.25 percent decline inoverall GDP, stemming from significant indirecteffects on manufacturing and service activitiesthat have a linkage with agriculture. The shareof the poor and vulnerable people in the total
T U N I S I A’ S S O C I O E C O N O M I C D E V E L O P M E N T: P R O G R E S S A C H I E V E D A N D C H A L L E N G E S A H E A D
3
1980 1987 2001
Oil products 52.5 23.5 9.2
Non-oil products 47.5 76.4 90.8
Manufactures 35.7 60.3 80.7
Chemicals 13.2 18.1 10.0
Machinery and transport equipment 2.4 6.1 15.4
Food 7.2 12.7 7.9
Source: UN Comtrade Database; data refer to percentage ratio.
T u n i s i a ’ s E x p o r t D i v e r s i f i c a t i o n ,1 9 8 0 – 0 1
T a b l e 1 . 1
Indicator 1986–90 1991–95 1996– 00 2001 2002 Est. 2003
GDP growth (%, real GDP at market price) 2.9 3.9 5.6 4.9 1.7 5.5
Inflation (%, CPI Index) 7.1 5.8 3.4 2.7 2.3 2.1
Real effective exchange rate (REER) index (1990=100) 107.9 102.6 104.2 100.9 99.7 —
Budget deficit (% GDP) 3.8 3.7 3.7 3.8 3.5 3.1
Current account deficit (% GDP) 3.9 5.8 3.1 4.7 3.5 3.1
Foreign direct investment (% GDP) 0.8 1.6 2.6 2.2 3.8 2.1
Total public debt (% GDP) 62.0 60.7 59.4 60.2 64.3 60.2
Gross foreign reserves (months of imports c.i.f) 1.9 1.8 2.9 2.5 2.9 2.9
Source: Calculations based on data from the World Bank (2000b) and IMF data.
M a i n M a c r o e c o n o m i c I n d i c a t o r sT a b l e 1 . 2
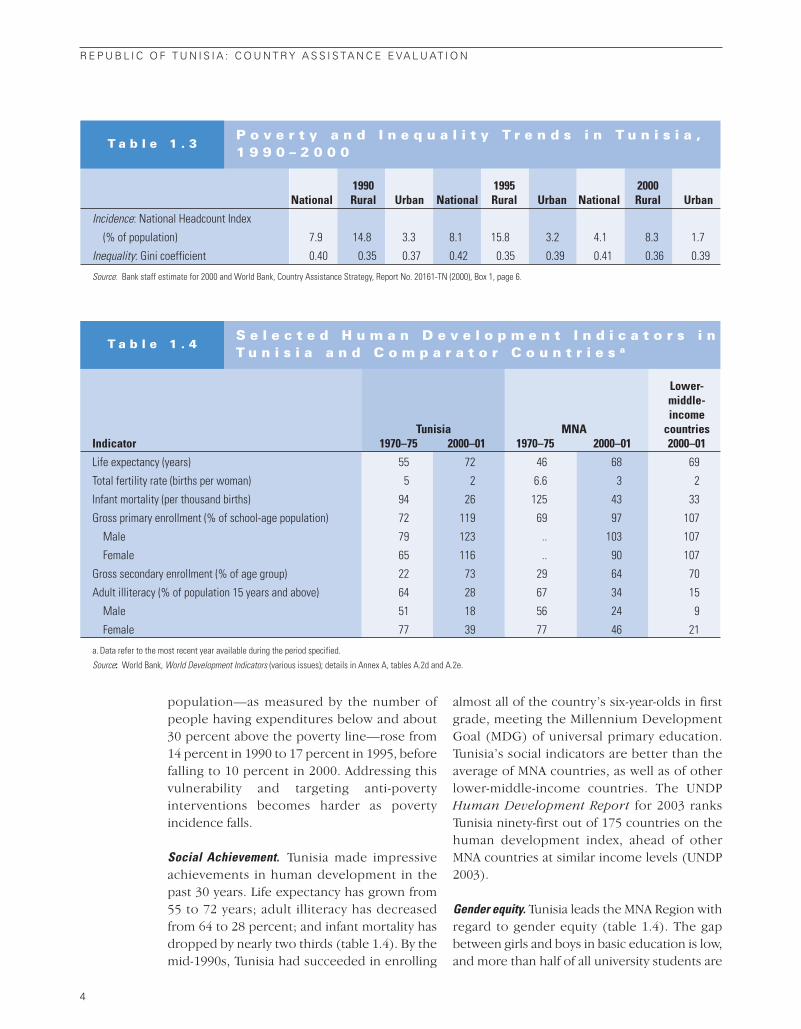
population—as measured by the number ofpeople having expenditures below and about30 percent above the poverty line—rose from14 percent in 1990 to 17 percent in 1995, beforefalling to 10 percent in 2000. Addressing thisvulnerability and targeting anti-povertyinterventions becomes harder as povertyincidence falls.
Social Achievement. Tunisia made impressiveachievements in human development in thepast 30 years. Life expectancy has grown from55 to 72 years; adult illiteracy has decreasedfrom 64 to 28 percent; and infant mortality hasdropped by nearly two thirds (table 1.4). By themid-1990s, Tunisia had succeeded in enrolling
almost all of the country’s six-year-olds in firstgrade, meeting the Millennium DevelopmentGoal (MDG) of universal primary education.Tunisia’s social indicators are better than theaverage of MNA countries, as well as of otherlower-middle-income countries. The UNDPHuman Development Report for 2003 ranksTunisia ninety-first out of 175 countries on thehuman development index, ahead of otherMNA countries at similar income levels (UNDP2003).
Gender equity. Tunisia leads the MNA Region withregard to gender equity (table 1.4). The gapbetween girls and boys in basic education is low,and more than half of all university students are
4
R E P U B L I C O F T U N I S I A : C O U N T R Y A S S I S TA N C E E VA L U AT I O N
1990 1995 2000National Rural Urban National Rural Urban National Rural Urban
Incidence: National Headcount Index
(% of population) 7.9 14.8 3.3 8.1 15.8 3.2 4.1 8.3 1.7
Inequality: Gini coefficient 0.40 0.35 0.37 0.42 0.35 0.39 0.41 0.36 0.39
Source: Bank staff estimate for 2000 and World Bank, Country Assistance Strategy, Report No. 20161-TN (2000), Box 1, page 6.
P o v e r t y a n d I n e q u a l i t y T r e n d s i n T u n i s i a ,1 9 9 0 – 2 0 0 0
T a b l e 1 . 3
Lower-middle-income
Tunisia MNA countries Indicator 1970–75 2000–01 1970–75 2000–01 2000–01
Life expectancy (years) 55 72 46 68 69
Total fertility rate (births per woman) 5 2 6.6 3 2
Infant mortality (per thousand births) 94 26 125 43 33
Gross primary enrollment (% of school-age population) 72 119 69 97 107
Male 79 123 .. 103 107
Female 65 116 .. 90 107
Gross secondary enrollment (% of age group) 22 73 29 64 70
Adult illiteracy (% of population 15 years and above) 64 28 67 34 15
Male 51 18 56 24 9
Female 77 39 77 46 21
a. Data refer to the most recent year available during the period specified.
Source: World Bank, World Development Indicators (various issues); details in Annex A, tables A.2d and A.2e.
S e l e c t e d H u m a n D e v e l o p m e n t I n d i c a t o r s i nT u n i s i a a n d C o m p a r a t o r C o u n t r i e s aT a b l e 1 . 4

women. Compulsory education for girls andboys through ninth grade has helped bridge thegap between female and male school enroll-ment rates. The status of women has improvedsteadily, with rates of female labor force partici-pation that are higher than for other countriesin the Region, but at 32 percent (in 2001), lowcompared with other lower-middle-incomecountries (World Bank data, 2003). Tunisia’sfemale participation rate in the workforceincreased by 4 percentage points during the1990s. Tunisian women received the right tovote immediately after independence in 1957,before many other MNA countries; the propor-tion of seats held by women in the nationalparliament was 12 percent in 2001. Tunisia ranksabove the MNA average on the United NationsGender Development Index (GDI).1 Asindicated earlier, this was due to the directattention given to human resource develop-ment, with particular emphasis on genderequity.
Further progress in the social sectors isrequired to consolidate past gains and prepareTunisia for a more competitive environment inthe twenty-first century. There is still room forenhancing the quality and efficiency of socialachievements. For example, the school systemis still burdened with high dropout and repeti-tion rates in the upper grades. Adult illiteracyrates remain high. Public health resources arenot used efficiently (as evidenced by low ratesof use of public health services), and the qualityof services does not meet the population’sexpectations. Social progress has beenachieved at a high cost relative to comparatorcountries: public expenditures on educationare 7.7 percent of GNP compared to a MNAaverage of 5.2 percent and a lower-middle-income-country average of 4.9 percent (WorldBank 2000b). Similarly, Tunisia’s healthexpenditures of 5.5 percent of GDP are higherthan the MNA average of 4.6 percent (WorldBank data, 2003).
Debt Burden and External Assistance Despite its remarkable economic progress andability to weather past shocks, Tunisia’seconomy remains vulnerable to external
shocks. The ratio of external debt to GDP isrelatively high, hovering around 60 percent(table 1.2), and the U.S. dollar, with a share ofover 40 percent, dominates the currencycomposition of this debt. These factorstogether with the current account and budgetdeficits make the country vulnerable toexternal shocks. Furthermore, foreignexchange reserves have remained low (belowthree months of imports). The economyweathered past shocks well (for example, thecontinued aftermath of September 11, 2001,events and a terrorist attack in Djerba, whichled to a sharp drop in tourism) in terms ofmaintaining macro balances. However, thetransition to greater integration into globalmarkets raises challenges for debt sustainabil-ity due to competitive pressures and increasedexposure to volatility.2 Tunisia has recentlybeen trying to diversify the currency composi-tion of its debt by issuing euro-dominatedsovereign bonds, as it did in July 1999. Also thegovernment is gradually shifting from externalto domestic sources of financing.
Tunisia has received large net financial flows(including grants and private flows), averagingnearly US$700 million annually (3.5 percent ofGDP) over the 1990–01 period (table 1.5). Inper capita terms, Tunisia received an annualaverage of US$70 per capita in net flows, belowthose for other MNA countries at similarincome levels. The Bank has provided signifi-cant assistance to Tunisia, committing US$2.7billion for 40 loans since 1990. With old loansbeing serviced and repaid, the Bank’s share ofnet flows to Tunisia is about 5 percent. Since1996, EU member states have providedincreased assistance to support the implemen-tation of Tunisia’s association agreement in1995. The share of the EU and France nearlydoubled in the 1996–01 period. Also, Tunisia isone of the largest recipients of IslamicDevelopment Bank (IDB) assistance, with $1.2billion in financing since 1976 (or about US$2per capita per year).
Meeting the Challenges of GlobalizationIncreasing competitive pressures. The Tunisianeconomy will face increasing competitive
T U N I S I A’ S S O C I O E C O N O M I C D E V E L O P M E N T: P R O G R E S S A C H I E V E D A N D C H A L L E N G E S A H E A D
5
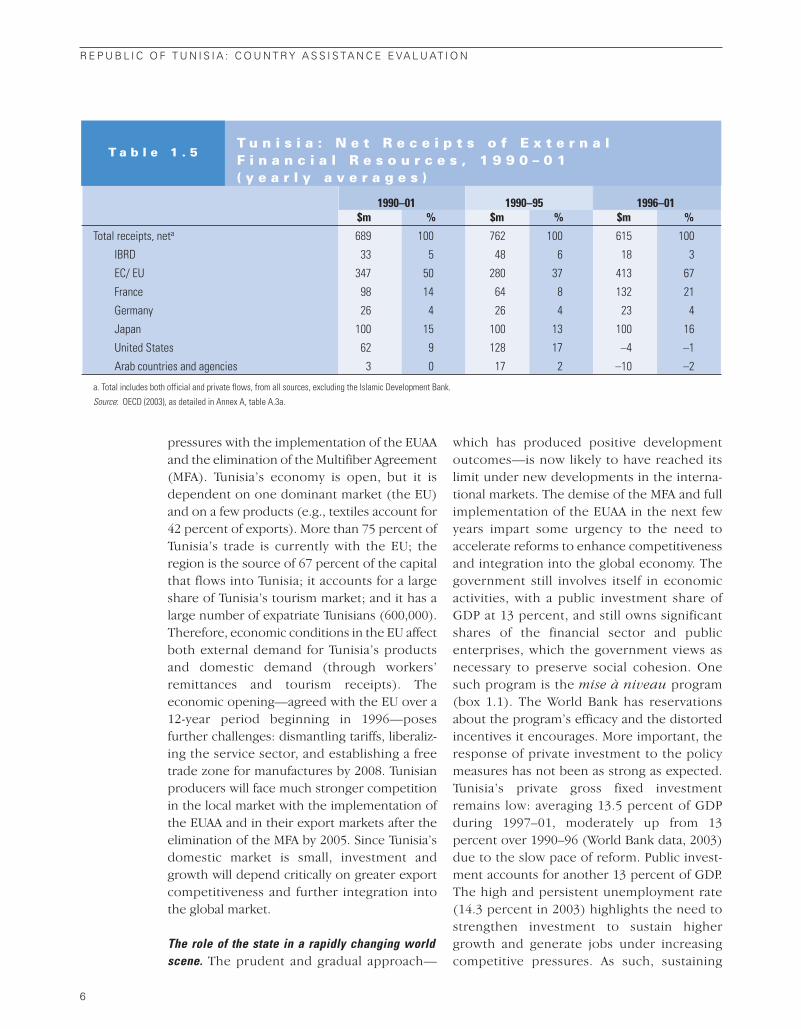
pressures with the implementation of the EUAAand the elimination of the Multifiber Agreement(MFA). Tunisia’s economy is open, but it isdependent on one dominant market (the EU)and on a few products (e.g., textiles account for42 percent of exports). More than 75 percent ofTunisia’s trade is currently with the EU; theregion is the source of 67 percent of the capitalthat flows into Tunisia; it accounts for a largeshare of Tunisia’s tourism market; and it has alarge number of expatriate Tunisians (600,000).Therefore, economic conditions in the EU affectboth external demand for Tunisia’s productsand domestic demand (through workers’remittances and tourism receipts). Theeconomic opening—agreed with the EU over a12-year period beginning in 1996—posesfurther challenges: dismantling tariffs, liberaliz-ing the service sector, and establishing a freetrade zone for manufactures by 2008. Tunisianproducers will face much stronger competitionin the local market with the implementation ofthe EUAA and in their export markets after theelimination of the MFA by 2005. Since Tunisia’sdomestic market is small, investment andgrowth will depend critically on greater exportcompetitiveness and further integration intothe global market.
The role of the state in a rapidly changing worldscene. The prudent and gradual approach—
which has produced positive developmentoutcomes—is now likely to have reached itslimit under new developments in the interna-tional markets. The demise of the MFA and fullimplementation of the EUAA in the next fewyears impart some urgency to the need toaccelerate reforms to enhance competitivenessand integration into the global economy. Thegovernment still involves itself in economicactivities, with a public investment share ofGDP at 13 percent, and still owns significantshares of the financial sector and publicenterprises, which the government views asnecessary to preserve social cohesion. Onesuch program is the mise à niveau program(box 1.1). The World Bank has reservationsabout the program’s efficacy and the distortedincentives it encourages. More important, theresponse of private investment to the policymeasures has not been as strong as expected.Tunisia’s private gross fixed investmentremains low: averaging 13.5 percent of GDPduring 1997–01, moderately up from 13percent over 1990–96 (World Bank data, 2003)due to the slow pace of reform. Public invest-ment accounts for another 13 percent of GDP.The high and persistent unemployment rate(14.3 percent in 2003) highlights the need tostrengthen investment to sustain highergrowth and generate jobs under increasingcompetitive pressures. As such, sustaining
6
R E P U B L I C O F T U N I S I A : C O U N T R Y A S S I S TA N C E E VA L U AT I O N
1990–01 1990–95 1996–01$m % $m % $m %
Total receipts, neta 689 100 762 100 615 100
IBRD 33 5 48 6 18 3
EC/ EU 347 50 280 37 413 67
France 98 14 64 8 132 21
Germany 26 4 26 4 23 4
Japan 100 15 100 13 100 16
United States 62 9 128 17 –4 –1
Arab countries and agencies 3 0 17 2 –10 –2
a. Total includes both official and private flows, from all sources, excluding the Islamic Development Bank.
Source: OECD (2003), as detailed in Annex A, table A.3a.
T u n i s i a : N e t R e c e i p t s o f E x t e r n a l F i n a n c i a l R e s o u r c e s , 1 9 9 0 – 0 1 ( y e a r l y a v e r a g e s )
T a b l e 1 . 5
Tunisia’s positive economic performance in themore competitive environment it is likely toface in the next decade will likely requirereducing the government’s role in economicactivity, as well as continuing to improve thedesign and operational efficiency of the regula-tory and incentives regime, with the objective
of leveling the playing field within the privatesector. Past positive development outcomeshave fostered a large middle class (80 percentof the population) that will press for greaterparticipation in the development processthrough an increased role for civil society andthe private sector in the process.
T U N I S I A’ S S O C I O E C O N O M I C D E V E L O P M E N T: P R O G R E S S A C H I E V E D A N D C H A L L E N G E S A H E A D
7
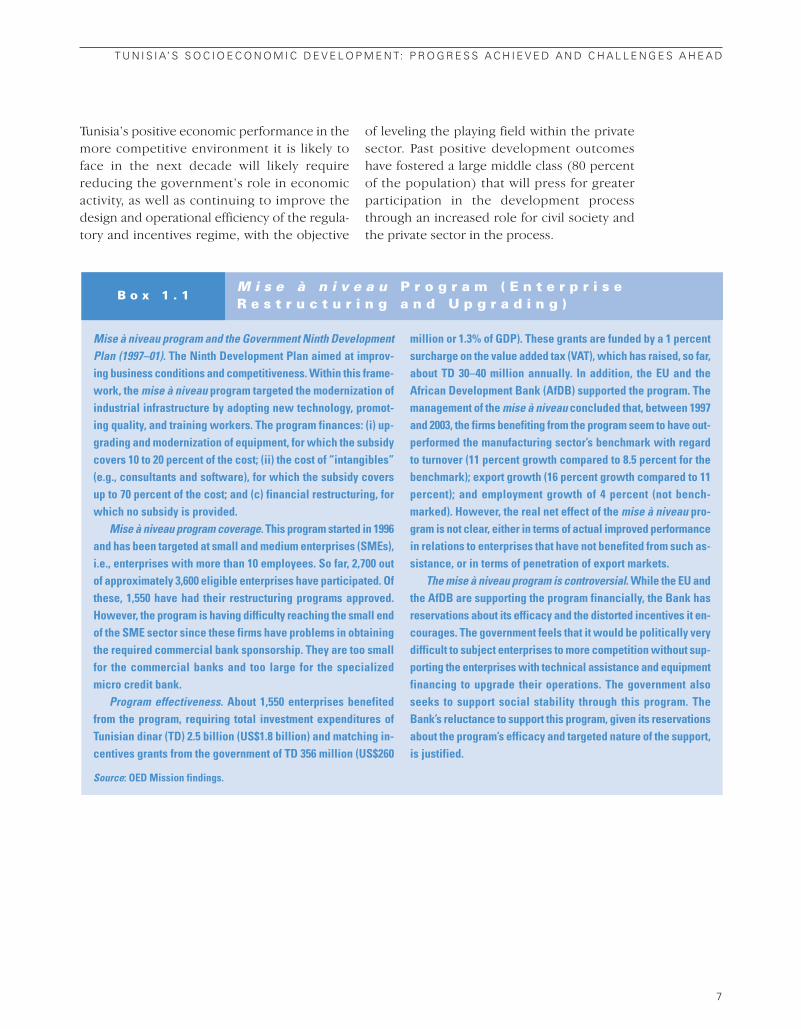
Mise à niveau program and the Government Ninth DevelopmentPlan (1997–01). The Ninth Development Plan aimed at improv-ing business conditions and competitiveness. Within this frame-work, the mise à niveau program targeted the modernization ofindustrial infrastructure by adopting new technology, promot-ing quality, and training workers. The program finances: (i) up-grading and modernization of equipment, for which the subsidycovers 10 to 20 percent of the cost; (ii) the cost of “intangibles”(e.g., consultants and software), for which the subsidy coversup to 70 percent of the cost; and (c) financial restructuring, forwhich no subsidy is provided.
Mise à niveau program coverage. This program started in 1996and has been targeted at small and medium enterprises (SMEs),i.e., enterprises with more than 10 employees. So far, 2,700 outof approximately 3,600 eligible enterprises have participated. Ofthese, 1,550 have had their restructuring programs approved.However, the program is having difficulty reaching the small endof the SME sector since these firms have problems in obtainingthe required commercial bank sponsorship. They are too smallfor the commercial banks and too large for the specializedmicro credit bank.
Program effectiveness. About 1,550 enterprises benefitedfrom the program, requiring total investment expenditures ofTunisian dinar (TD) 2.5 billion (US$1.8 billion) and matching in-centives grants from the government of TD 356 million (US$260
million or 1.3% of GDP). These grants are funded by a 1 percentsurcharge on the value added tax (VAT), which has raised, so far,about TD 30–40 million annually. In addition, the EU and theAfrican Development Bank (AfDB) supported the program. Themanagement of the mise à niveau concluded that, between 1997and 2003, the firms benefiting from the program seem to have out-performed the manufacturing sector’s benchmark with regardto turnover (11 percent growth compared to 8.5 percent for thebenchmark); export growth (16 percent growth compared to 11percent); and employment growth of 4 percent (not bench-marked). However, the real net effect of the mise à niveau pro-gram is not clear, either in terms of actual improved performancein relations to enterprises that have not benefited from such as-sistance, or in terms of penetration of export markets.
The mise à niveau program is controversial. While the EU andthe AfDB are supporting the program financially, the Bank hasreservations about its efficacy and the distorted incentives it en-courages. The government feels that it would be politically verydifficult to subject enterprises to more competition without sup-porting the enterprises with technical assistance and equipmentfinancing to upgrade their operations. The government alsoseeks to support social stability through this program. TheBank’s reluctance to support this program, given its reservationsabout the program’s efficacy and targeted nature of the support,is justified.
M i s e à n i v e a u P r o g r a m ( E n t e r p r i s e R e s t r u c t u r i n g a n d U p g r a d i n g )
B o x 1 . 1
Source: OED Mission findings.


9
World Bank AssistanceProgram
The World Bank has been a large player in Tunisia in terms of both lend-ing and policy influence. Annual average lending commitments for fiscalyears 1990–03 were US$200 million (or US$20 per capita per year), rep-
resenting over one-quarter of the MNA portfolio (figure 2.1). Annual average netdisbursements were US$27 million; however, net transfers were negative for mostof the period, as old loans were being serviced and repaid (the Bank has com-mitted US$5.1 billion for 121 projects since 1958).
The Bank also served as a significant catalystfor mobilizing resources, leveraging US$1 onevery IBRD dollar. The Bank also maintained anactive policy dialogue, and its analytical workpointed out the agenda for reforms and guidedBank strategies and lending.
World Bank Assistance StrategiesIn the 1990s and in 2000, World Bank programswere guided by country strategy documents (box2.1). The overarching strategy objective is growthwith equity. The Bank emphasized support for (i)stability and growth, boosting competitiveness,enhancing outward orientation, and rejuvenatingprivate investment; (ii) human development; and(iii) rural development.
The mid-1990s country strategy was basedon the 1995 Country Economic Memorandum(CEM), which argued for a Bank program inTunisia that would support the country’sefforts to promote economic integration within
the world economy, and particularly that of theEU, while maintaining social stability andenvironmental sustainability (World Bank1995b). The proposed Bank program underthis country strategy emphasized nonlendingservices and, within lending operations, sectorinvestment loans to support targeted sectoralpolicies to modernize key sectors (box 2.1).
The 2000 Country Assistance Strategy (CAS)reaffirmed the main themes and objectives ofits predecessor, reflecting the judgment thatBank assistance to Tunisia should stay thecourse of a strategy that had yielded goodresults so far and was still appropriate. Accord-ingly, the Bank would support Tunisia’s effortsto: increase its outward orientation; develop alarger and more dynamic private sector; furtherstrengthen human resources; and consolidateenvironmental management (box 2.1).
World Bank strategies were relevant andconsonant with Tunisia’s development priorities
22

as outlined in a series of five-year plans. Forexample, the Ninth Development Plan(1997–00) aimed at opening up the economy tocompetition while maintaining macroeconomicstability and strengthening the social agenda andenvironment management. The Tenth Develop-ment Plan (2002–06) also aims to strengthencompetitiveness, embrace the knowledgeeconomy, and meet the jobs challenge. TheBank strategies reflected Tunisia’s developmentpriorities as outlined in its development plans.The increased focus on the social sectors in theBank strategies has been appropriate and isreasonably aligned with the MDGs and thecountry’s emphasis on human resourcedevelopment.
While largely relevant to Tunisia’s develop-ment constraints and priorities, the countrystrategies did not pay sufficient attention to thefiscal sustainability of social policies, withhealth care and social affairs absorbing a fifth ofgovernment spending and general educationanother fifth of the budget. There are seriouseducation sector fiscal issues looming, withdeclining primary student populations andbooming demand for secondary and highereducation.
World Bank strategies developed indicatorsfor monitoring results, but several of these aredifficult to measure effectively since they are
neither quantified nor time-bound. Manyindicators exhibit such weaknesses as vaguewording, input orientation, or no baseline data.For example, in the education sector, the 2000CAS progress indicators include “greater costrecovery in higher education, improvements inteacher training”; in the health sector,“enhance efficiency of public expenditure onhealth.” Despite the declaration about theimportance of monitoring and evaluation(M&E), the commitment to M&E is weak.1 The2000 CAS (p. 33) noted that the indicators weresubject to refinements: “These indicators, to berefined with additional data availability, havebeen designed from available baseline valuesand reasonable medium-term targets.”
Economic and Sector Work Economic and sector work (ESW) was relevant,of high quality, conformed to the Bank’sassistance strategy, and provided a solid basisfor policy dialogue with the government(annex table A.4). Some core diagnostic ESW—including the 1995 Country EconomicMemorandum (CEM), the 2000 Social andStructural Review, and the 1995 Poverty Allevia-tion report—covered macro, social, andsectoral issues, and informed Bank strategiesas discussed below. Other ESW sought toaddress known policy shortcomings in such
1 0
R E P U B L I C O F T U N I S I A : C O U N T R Y A S S I S TA N C E E VA L U AT I O N
–300
–200
–100
0100
200
300
400
500
90 91 92 93 94 95 96 97 98 99 00 01 02 03
US$m
Commitments Net disbursements Net transfers
B a n k C o m m i t m e n t s , D i s b u r s e m e n t s , a n dT r a n s f e r s
F i g u r e 2 . 1

sectors as finance and water, as well as laborand employment issues (annex table A.4). Onthe other hand, the last agricultural sectorreview was undertaken in 1982.
The World Bank’s analytic and advisory activi-ties (AAA) were generally sound but had somenotable omissions, as discussed below. Tunisiais a relatively small country and increasing itsintegration into the global markets wasappropriately emphasized; the high tariff andnon-tariff barriers of the 1980s were distor-tionary, and replacing them with low anduniform tariffs was the right approach. Themain thrust of the 1990 analytical work was toargue the case for a greater openness in theTunisian economy in order to increase competi-tion and thereby the efficiency of investment.The work also emphasized the need to explic-
itly adopt a more aggressive export-orientationpolicy. The recommendations of a subsequenteconomic report in 1991 reinforced those of theearlier work and stressed the need to increasethe efficiency of investment by increasingdomestic and foreign competition.
Similarly the Bank’s analysis and itsrecommendations on private sector develop-ment and privatization were sound. The Bankeconomic report at the beginning of the 1990semphasized the need to strengthen signifi-cantly the role of the private sector and toremove the barriers to domestic competition.The 1994 Private Sector Assessment also madea strong case for a relatively small country likeTunisia to improve its export performance and,to that end, to significantly expand the role ofthe private sector (World Bank 1994b). That,
W O R L D B A N K A S S I S TA N C E P R O G R A M
1 1
Mid-1990s country strategy: An outward-oriented private-sector-led growth strategy
Goals. The objective was to promote rapid and sustainableoutward-oriented and private-sector-based growth, while main-taining social stability and environmental sustainability. Thestrategy to achieve this objective emphasized: (i) deepeningstructural reforms to foster competition; (ii) human capital de-velopment toward middle-income standards; and (iii) modern-ization of key infrastructure services, and environmentalmanagement.
Assistance program. Under the base case scenario, lendingwould average US$240 million per year during FYs 1996–99. Theproposed program would allocate nearly half the portfolio to sec-torwide investment loans with the other half divided betweenpolicy-based loans and traditional investment projects. Thebase case scenario assumed satisfactory implementation ofpolicy reforms and unavailability of other sources of finance (e.g.,EU and AfDB). Triggers for higher lending levels (US$350 millionper year) included a strong acceleration of structural reformsor a shock to the economy. The mid-1990s country strategy en-visaged strategy notes on the role of the state, and on structuralchanges in agriculture, and the general equilibrium model analy-sis of the impact of trade liberalization on the agricultural sec-tor. In addition, the Bank would prepare a seminar on“Cross-Country Lessons from Civil Service Reform.”
2000 CAS: An update of the earlier strategyGoals. The 2000 CAS substantially reiterated the mid-1990s
country strategy objectives, noting that the pace of private in-vestment remained gradual. The strategy to achieve these ob-jectives was similar to that of the earlier period.
Assistance program. The CAS outlined three scenarios for theproposed lending program for FYs 2000-02. Under the base casescenario, the Bank would maintain the level of commitments ofprevious years, averaging about US$200 million per year. The pro-posed program would sustain the change in the mix of instrumentsbegun with the mid-1990s country strategy, emphasizing sectorinvestment loans, policy-based lending, and economic and sec-tor work (ESW). The base case would include one policy-basedoperation (for US$150 million, or 25 percent) focusing on privatesector development and/or the financial sector. Under the low-case program, lending would be scaled back, focusing on oneor two investment-type operations targeted at the social sectors.Triggers for the high-case scenario included: (i) implementa-tion of the free trade agreement with the EU, (ii) a substantial in-crease in privatization proceeds, (iii) further progress in financialsector reforms, and (iv) initiation of social security and labor mar-ket reforms. The level of commitments under the high case sce-nario was not proposed. Planned ESW included 18 reports, sectornotes, and workshops covering trade, private sector development,social conditions, education, transport, water, and agriculture.
W o r l d B a n k S t r a t e g i e sB o x 2 . 1

the report argued, would in turn requirepolicies to increase domestic and externalcompetition and to remove obstacles facing thefunctioning of markets.
The 1995 CEM, Towards the 21st Century,built on the recommendations of these reportsand underpinned the three strategic directionsof the mid-1990s country strategy: (i) the paceof structural reform needed to move forwardmore decisively, particularly to complete tradeliberalization and forcefully open up to privatesector development; (ii) the State needed toredefine its role in the economy and concen-trate on strengthening its role in the provisionof public goods, while opening up much moresignificantly to the domestic and foreignprivate sectors; and (iii) despite good progressso far, the country needed to continue toupgrade human resources and environmentalmanagement to meet the expected increase ininternational competition. The CEM alsoincluded environmental considerations in itsanalysis of growth prospects and the role ofgovernment, and emphasized the need toassess the sustainability of land and waterresources in an integrated fashion.
The 2000 Social and Structural Review(World Bank 2000b) and the 2000 PrivateSector Assessment Update provided the mainstrategic orientation of the 2000 CAS. Thereview, which gave Tunisia high marks oneconomic reforms and achievement since themid-1980s, argued that if the country hoped toachieve a level of development comparable tocountries in the lowest tier of OECD countries,it needed not only to maintain reforms, but alsoto accelerate their pace, in view of theimminent threat of international competitionin general, but particularly within the EU-related economic sphere. The Updaterepresented another piece of good analysisthat utilized a survey of Tunisian enterprises. Itreiterated the main recommendations of theReview, presented a detailed review of privatesector development to date, and maderecommendations for future development.
During the first half of 2001, a sizeable Bank-Fund mission visited Tunisia twice, as part of thejoint IMF-World Bank Financial Sector Assess-
ment Program (FSAP). The overall assessmentwas that the authorities had implementedprudent and appropriate financial policies overthe preceding decade, enabling the country toachieve reasonably high and stable growth withlow inflation. A program to modernize, restruc-ture, and consolidate banking, securitiesmarket, and the insurance industry had beengradually implemented. It had so far includedan overhaul of the legal and accountingframeworks, a strengthening of financialsupervision, and a shift to more market-oriented policies. The assessment systemati-cally examined the whole range of financialreform areas, pointing out where further actionwas needed and concluding with a list of policypriorities for the future.
An internal Bank analytical work tried tohelp the government understand why, despitestrong growth, unemployment remains high, ataround 15 percent. This work provided an in-depth analysis of the employment and labormarket situation and made a number ofrecommendations to improve it. It concludedthat unemployment remains high, partlyreflecting demographic pressures, and partlythe decrease in the employment intensitygrowth. While this analysis argued that themain solution to the employment problem iscontinued growth, it also provided an extensivelist of recommendations to help improveemployment policies and procedures toremove rigidities in the labor market, includingfacilitating exit of private firms.
The analytical reports were of satisfactoryquality. The Quality Assurance Group (QAG)assessed a number of reports, rating them alleither highly satisfactory or satisfactory. Therecommendations were reflected in the 2000CAS. Summary evaluations of key reports areprovided in the forthcoming OED workingpapers (Kanaan; Tsakok) listed in the bibliogra-phy. Omissions in ESW include core diagnosticproducts: public expenditure reviews (PERs),Country Financial Accountability Assessments(CFAAs), and Country Procurement AssessmentReviews (CPARs). Periodic reviews of publicexpenditures would have been of particularimportance to improving the efficiency and fiscal
1 2
R E P U B L I C O F T U N I S I A : C O U N T R Y A S S I S TA N C E E VA L U AT I O N

sustainability of social services while at the sametime preserving social gains.2 Other fiduciarydiagnostic reports—CFAAs and CPARs—are alsoessential to analyze issues related to economicmanagement, governance, and transparency.Because of these omissions, the share ofresources allocated to Tunisia’s ESW—averaging16 percent a year during the 1990s—was belowthe Bankwide average (18 percent) and far belowthe MNA average (21 percent) (annex table A.6).
LendingThe structure of the Bank’s portfolio changedrapidly after 1990, when policy-based lendingwas introduced, with commitments amountingto nearly US$900 million (table 2.1). Economicpolicy, financial, and private sector develop-ment drew the largest amount of Bank supportbetween FY90 and FY03 (39 percent of totalBank commitments), followed by educationand health (21 percent), and rural/agriculture(19 percent). As evident from table 2.1, the
Bank provided support to other sectors;however, the evaluation is confined to theabove-mentioned sectors, constituting 80percent of total commitments.
Resource mobilization. The Bank mobilized—inconjunction with various donor programs—ahigh co-financing ratio for its support. BetweenFY90 and FY03, the Bank attracted US$2,372million in co-financing against US$2,745 millionin IBRD commitments, leveraging nearlyUS$1.00 on every IBRD dollar (table 2.1).3
The Bank’s actual lending volumes wereroughly the same as proposed in the CASs, butthe share of adjustment lending was signifi-cantly higher than planned (table 2.2). Someprojects included in the 2000 CAS base casewere delayed due to low government interestor interventions by other donors, and otherswere reduced in scope.4 The difference wasmade up by increasing the size of plannedpolicy-based loans. Whereas the 2000 CAS base
W O R L D B A N K A S S I S TA N C E P R O G R A M
1 3
No. of Commitments Co-financingSector Projects US$m % US$m %
Economic policy, financial, and private sector development a 8 1,060 39 522 22
Education 7 474 17 362 15
Health, nutrition and population 3 106 4 108 5
Rural sector b 10 525 19 787 33
Energy and mining 1 60 2 39 2
Environment 2 12 0 3 0
Transport 3 139 5 87 4
Urban development 4 250 9 401 17
Water supply and sanitation 2 118 4 100 4
TOTAL 40 2,745 100 2,372 100
Memo items
Adjustment 5 867 32 484 20
Investment 35 1,878 68 1,888 80a. Includes ECAL I-III ($487 m), Economic and Financial Reform Support ($250 m), Public Enterprise Reform ($130 m), Export Development ($35 m), Industry Support ($39 m), and Private
Investment Credit ($120 m).
b. Includes Northwest Mountainous and Forestry ($34 m) and Areas Development ($28 m), Agricultural Support Services ($21m), Water Sector Investment ($103 m), Agricultural Sector
Investment I &II ($162 m), Natural Resource Management ($27 m), National Rural Finance ($65 m), Forestry Development II ($69 m), and Agricultural Research ($17 m).
Source: World Bank data as of September 30, 2002.
D i s t r i b u t i o n o f W o r l d B a n k C o m m i t m e n t sb y S e c t o r ( F Y 9 0 – 0 3 )
T a b l e 2 . 1
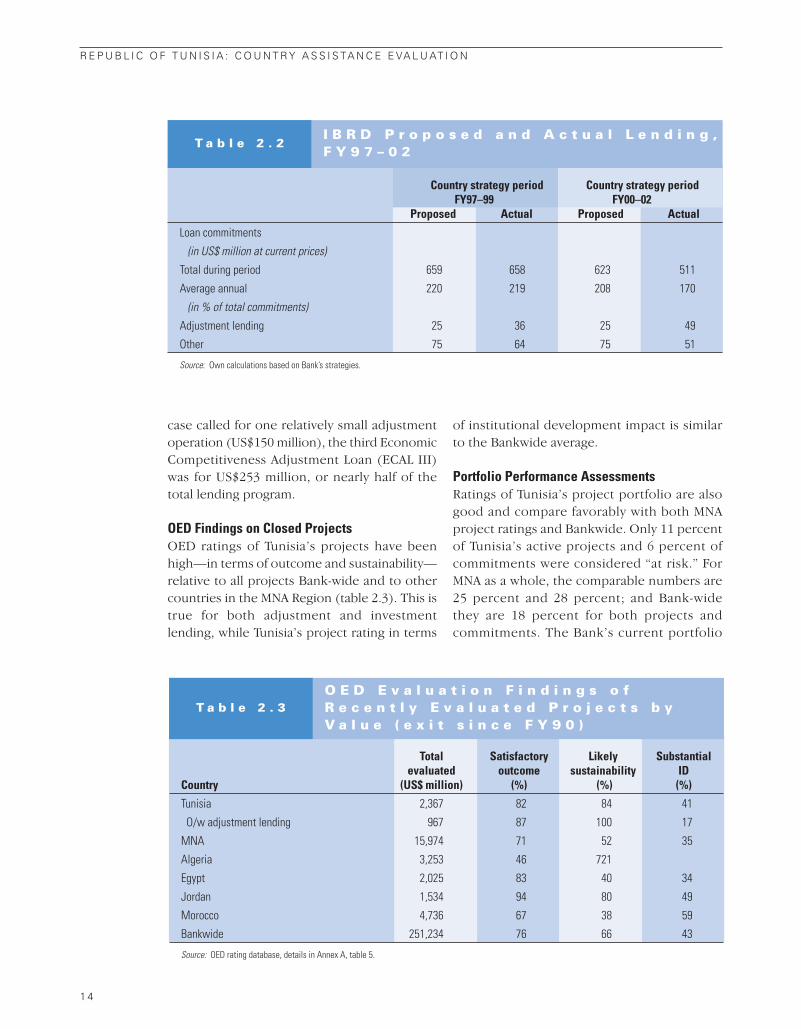
case called for one relatively small adjustmentoperation (US$150 million), the third EconomicCompetitiveness Adjustment Loan (ECAL III)was for US$253 million, or nearly half of thetotal lending program.
OED Findings on Closed ProjectsOED ratings of Tunisia’s projects have beenhigh—in terms of outcome and sustainability—relative to all projects Bank-wide and to othercountries in the MNA Region (table 2.3). This istrue for both adjustment and investmentlending, while Tunisia’s project rating in terms
of institutional development impact is similarto the Bankwide average.
Portfolio Performance AssessmentsRatings of Tunisia’s project portfolio are alsogood and compare favorably with both MNAproject ratings and Bankwide. Only 11 percentof Tunisia’s active projects and 6 percent ofcommitments were considered “at risk.” ForMNA as a whole, the comparable numbers are25 percent and 28 percent; and Bank-widethey are 18 percent for both projects andcommitments. The Bank’s current portfolio
1 4
R E P U B L I C O F T U N I S I A : C O U N T R Y A S S I S TA N C E E VA L U AT I O N
Country strategy period Country strategy periodFY97–99 FY00–02
Proposed Actual Proposed Actual
Loan commitments
(in US$ million at current prices)
Total during period 659 658 623 511
Average annual 220 219 208 170
(in % of total commitments)
Adjustment lending 25 36 25 49
Other 75 64 75 51
Source: Own calculations based on Bank’s strategies.
I B R D P r o p o s e d a n d A c t u a l L e n d i n g ,F Y 9 7 – 0 2
T a b l e 2 . 2
Total Satisfactory Likely Substantial evaluated outcome sustainability ID
Country (US$ million) (%) (%) (%)
Tunisia 2,367 82 84 41
O/w adjustment lending 967 87 100 17
MNA 15,974 71 52 35
Algeria 3,253 46 721
Egypt 2,025 83 40 34
Jordan 1,534 94 80 49
Morocco 4,736 67 38 59
Bankwide 251,234 76 66 43
Source: OED rating database, details in Annex A, table 5.
O E D E v a l u a t i o n F i n d i n g s o f R e c e n t l y E v a l u a t e d P r o j e c t s b yV a l u e ( e x i t s i n c e F Y 9 0 )
T a b l e 2 . 3

comprises 18 operations with commitmentsof over US$1.1 billion. About a third of thecommitments are for financial and privatesector development; another third for urbandevelopment and water supply (building newinfrastructure and tourism development); aquarter for human development projects; andthe remainder for transport and agriculture/rural development.
Efficiency of World Bank AssistanceThe Tunisian country assistance program isrelatively inexpensive (annex table A.6). Theaverage program cost of US$13 per US$1,000 ofnet commitments for satisfactory and non-riskyprojects is lower than the MNA average ofUS$21 and the Bankwide average of US$16 forthe 1990s. Tunisia’s average project size is closeto the Bankwide and MNA averages.
W O R L D B A N K A S S I S TA N C E P R O G R A M
1 5

1 7
The Development Impactof World Bank Assistance
This chapter evaluates World Bank assistance by assessing its contribu-tion to Tunisia’s development outcomes. This is done by examining inmore detail the progress on each of the three areas identified in the
Bank’s strategy: macroeconomic stabilization, growth, and structural reforms,including financial, trade, and private sector development; human resourcedevelopment; and poverty alleviation and rural development.
Macroeconomic Stabilization, Growth,and Structural Reforms The Bank’s strategy has focused on mainte-nance of macroeconomic stability (in conjunc-tion with the IMF) and promoting equitable andsustainable growth, mainly through increasingthe country’s openness to domestic andexternal competition. To promote increasedcompetition, the Bank’s assistance has beendirected at a number of key structural areas,including financial sector reform, trade liberal-ization, enhancing the business environment,and promoting private sector development. Allof the Bank’s policy-based loans—the 1987Industry and Trade Policy Adjustment Loan(ITPAL), the 1988 Structural Adjustment Loan(SAL), the 1991 Enterprise and Financial ReformSupport Loan (EFRSL), and ECAL (1996), ECALII (1999), and ECAL III (2001)—have includedthe maintenance of a stable macroeconomicenvironment as a primary component and,therefore, have supported underlying fiscal,
monetary, and exchange rate policies that havebeen successfully implemented. As discussedbelow, they have also supported structuralreforms in the financial, external, and privatesectors. Tunisia’s prudent macroeconomicmanagement and cautious yet determinedstructural reforms have led to improvedeconomic performance, essentially across theentire spectrum of standard indicators:sustained economic growth; declining inflation;a stable real exchange rate; a sound and stablefiscal position; controlled monetary aggregates;and a stable and manageable balance ofpayments position (table 1.2).
Real GDP growth accelerated from about 3percent over 1986–90, to about 4 percent over1991–95, and to over 5 percent over 1996–02,meeting the country strategy targets (annextable A.7a). Tunisia has been one of the fastestgrowing economies as compared to MNA andother lower-middle-income countries since themid-1980s (table 3.1).
33
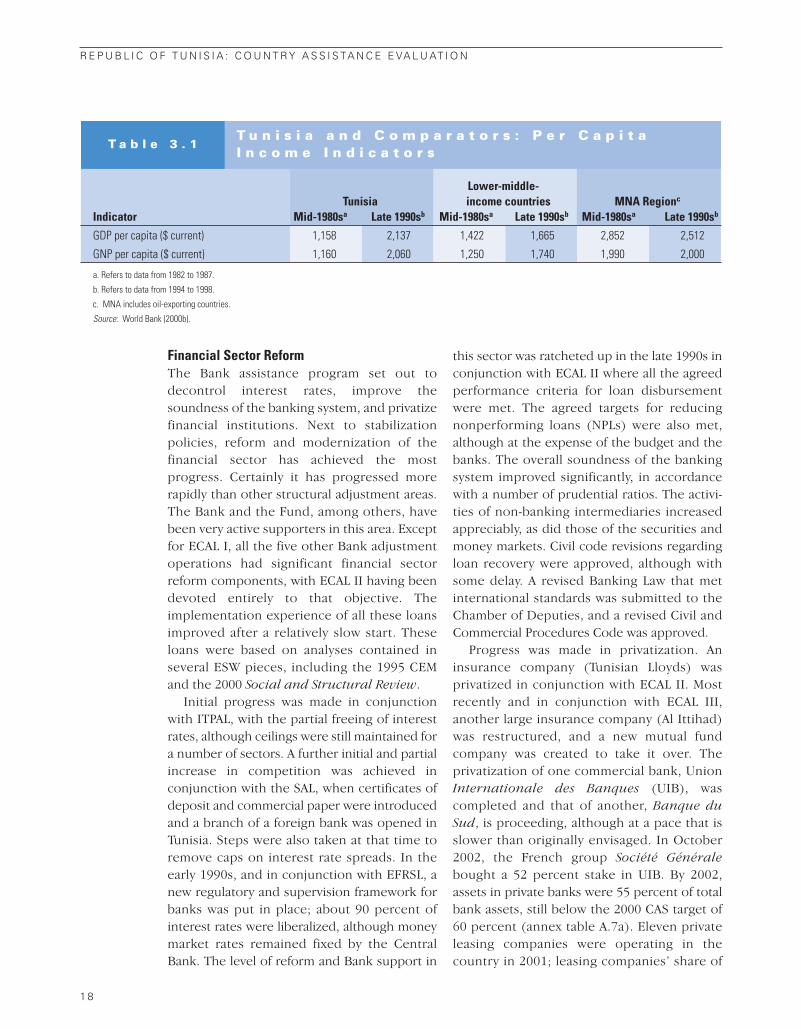
Financial Sector ReformThe Bank assistance program set out todecontrol interest rates, improve thesoundness of the banking system, and privatizefinancial institutions. Next to stabilizationpolicies, reform and modernization of thefinancial sector has achieved the mostprogress. Certainly it has progressed morerapidly than other structural adjustment areas.The Bank and the Fund, among others, havebeen very active supporters in this area. Exceptfor ECAL I, all the five other Bank adjustmentoperations had significant financial sectorreform components, with ECAL II having beendevoted entirely to that objective. Theimplementation experience of all these loansimproved after a relatively slow start. Theseloans were based on analyses contained inseveral ESW pieces, including the 1995 CEMand the 2000 Social and Structural Review.
Initial progress was made in conjunctionwith ITPAL, with the partial freeing of interestrates, although ceilings were still maintained fora number of sectors. A further initial and partialincrease in competition was achieved inconjunction with the SAL, when certificates ofdeposit and commercial paper were introducedand a branch of a foreign bank was opened inTunisia. Steps were also taken at that time toremove caps on interest rate spreads. In theearly 1990s, and in conjunction with EFRSL, anew regulatory and supervision framework forbanks was put in place; about 90 percent ofinterest rates were liberalized, although moneymarket rates remained fixed by the CentralBank. The level of reform and Bank support in
this sector was ratcheted up in the late 1990s inconjunction with ECAL II where all the agreedperformance criteria for loan disbursementwere met. The agreed targets for reducingnonperforming loans (NPLs) were also met,although at the expense of the budget and thebanks. The overall soundness of the bankingsystem improved significantly, in accordancewith a number of prudential ratios. The activi-ties of non-banking intermediaries increasedappreciably, as did those of the securities andmoney markets. Civil code revisions regardingloan recovery were approved, although withsome delay. A revised Banking Law that metinternational standards was submitted to theChamber of Deputies, and a revised Civil andCommercial Procedures Code was approved.
Progress was made in privatization. Aninsurance company (Tunisian Lloyds) wasprivatized in conjunction with ECAL II. Mostrecently and in conjunction with ECAL III,another large insurance company (Al Ittihad)was restructured, and a new mutual fundcompany was created to take it over. Theprivatization of one commercial bank, UnionInternationale des Banques (UIB), wascompleted and that of another, Banque duSud, is proceeding, although at a pace that isslower than originally envisaged. In October2002, the French group Société Généralebought a 52 percent stake in UIB. By 2002,assets in private banks were 55 percent of totalbank assets, still below the 2000 CAS target of60 percent (annex table A.7a). Eleven privateleasing companies were operating in thecountry in 2001; leasing companies’ share of
1 8
R E P U B L I C O F T U N I S I A : C O U N T R Y A S S I S TA N C E E VA L U AT I O N
Lower-middle-Tunisia income countries MNA Regionc
Indicator Mid-1980sa Late 1990sb Mid-1980sa Late 1990sb Mid-1980sa Late 1990sb
GDP per capita ($ current) 1,158 2,137 1,422 1,665 2,852 2,512
GNP per capita ($ current) 1,160 2,060 1,250 1,740 1,990 2,000
a. Refers to data from 1982 to 1987.
b. Refers to data from 1994 to 1998.
c. MNA includes oil-exporting countries.
Source: World Bank (2000b).
T u n i s i a a n d C o m p a r a t o r s : P e r C a p i t a I n c o m e I n d i c a t o r s
T a b l e 3 . 1

financing private investment rose from 8percent in 1996 to 12 percent in 2001.1 Atpresent, only four commercial banks remain inthe public sector, with combined assets thatrepresent 45 percent of the entire commercialbanking system.2 At least for the foreseeablefuture, there appears to be no intention toprivatize these banks, because their continuedrole in the public domain is considerednecessary to serve “strategic” sectors, one persector: agriculture, housing, tourism, andmicro-credit for very small enterprises(although there is talk of merging the last two).The government does not wish to relinquishthe control it exerts over the bank andenterprises through the public banks, as it feelsthere is adequate competition since privatebanks are not prevented from operating inthese sectors. Nevertheless, these public bankswith a heavy burden of nonperforming loanspose risks to financial stability.
Progress in reform of the insurance industry,with much appreciated World Bank support,has also taken place. Two insurance companieshave recently been privatized; however, thecountry’s largest insurance company, with a 34percent share of the entire market, is likely toremain in the public sector for some time. Aswith the banks, the government is reluctant togive up ownership of some key entities that ituses to exercise control over part of the marketor to provide subsidized services for social orstability reasons. But when the EUAA comesinto effect in 2008, the Tunisian economy willhave to align its structure along EU norms,which will require an even greater private rolein the financial sector.
Nonperforming loans remain a top priorityfor action in the financial sector and for theeconomy at large. In conjunction with ECAL II,NPLs were reduced from about 36 percent in1993 to about 19 percent in 2001,3 which wasstill high. They are believed to have increased to22 percent since 2002 reflecting the exposure ofbanks to the tourism sector, which was hit bythe unfavorable international environment. TheCentral Bank continues to closely monitor thesituation and is implementing a scheme thatallows it to work with the banks involved to
clean up their portfolios over time. A majorproblem is the fact that the judicial system isvery slow in implementing procedures relatedto loan recovery; for example, whereas theseizure of property used as collateral is possiblein principle, the procedure is so cumbersomeand lengthy that it is effectively not an optionthat can be used at present. In addition todealing with the stock of NPLs, it is even moreimportant to deal with preventing new NPLs byaddressing the root causes within the publicenterprise (PE) sector (particularly the tourismsector). The Central Bank is trying to instill anew credit culture within the banking system toprevent new NPLs in the future.
Trade Liberalization By the mid-1980s, Tunisia was a highlyprotected economy, with extensive restrictionson imports and a widely dispersed and hightariff structure. Immediately following theimplementation of the successful stabilizationin 1986, the country embarked on a number ofstructural reforms, including trade liberaliza-tion, to inject more competitiveness andefficiency into the economy. Both the Bank andthe Fund gave priority to supporting thegovernment program and often pressed it totake action in dismantling the quantitativerestrictions (QR) regime and reforming thetariff structure. Four Bank structural adjustmentoperations (ITPAL, SAL, EFRSL, and ECAL I)included trade liberalization components, andone investment operation (Export Develop-ment Project) supported export developmentthrough financing technical assistance and pre-shipment finance guarantees. Considerableanalytical work was undertaken to supportreforms in trade policy, including the 1994report on the determinants of export growth(World Bank 1994a), the 1995 CEM, and the2000 Social and Structural Review.
Early Bank operations with regard to disman-tling the QR regime met with stiff resistance, andachieved only modest progress in rationalizingthe tariff structure (e.g., the tariff range wascompressed from 5 to 235 percent to 14 to 41percent). This continued until the mid-1990s,when Tunisia joined the World Trade Organiza-
T H E D E V E L O P M E N T I M PA C T O F W O R L D B A N K A S S I S TA N C E
1 9
tion (WTO) and signed the EUAA. On the eve ofthese events, 30 to 40 percent of imports werestill subject to restrictions. Since then, liberaliza-tion has proceeded in the context of the freetrade component of the EUAA. Tunisia’sweighted average tariff rate fell from 30 percentin the mid-1990s to 27 percent in 2001. With theexception of Morocco’s rate of 28 percent,Algeria, Egypt, and Jordan have lower rates(Annex table A-2l). Also, the weighted averagetariff rate in non-MNA high-growth countries(Chile, Korea, Malaysia, Mauritius, and Thailand)is much lower, ranging from 5 percent inMalaysia to 16 percent in Mauritius.
Further progress in trade liberalization will begoverned by implementation of the EUAA (i.e.,full liberalization of the trade regime, at leastregarding trade with the EU, is now expected in2008). In the meantime, implementation of theearly phase of the EUAA has actually increasedeffective protection since duties on productioninputs have been reduced ahead of those on finalgoods, but this is the standard nature of thisagreement as applied in several other countriesthat have similar agreements with the EU. Thegap between tariffs applied to imports from theEU and the rest of the world has also widened(Annex table A-2m).4 It would have been prefer-able for Tunisia to move more forcefully to lowerprotection and barriers to free trade. However,in view of the importance of the EUAA, it wasunderstandable for the Bank to go along with therequirements of that agreement while pointingout the need for Tunisia to take other measuresto enhance competitiveness, such as reducingcost of production. Such complementarymeasures have been slow in coming. In addition,the Bank could have helped design programs tolower the discrimination against non-EU trade inparallel with implementation of the EUAA.
Private Sector Development and the Enabling EnvironmentUnder the dirigiste system that characterizedthe economic structure until the mid-1980s,the economy was heavily regulated and publicenterprises dominated the business sector,including banks and other financial intermedi-aries. Since 1987, the Bank has given top
priority in its assistance strategy to helping thecountry inject more competition into theeconomy by creating a friendlier climate forprivate sector development, privatizing publicenterprises, or helping them become moreefficient. To that end, eight Bank lendingoperations (ASAL1, ITPAL, SAL, PERL, EFRSL,PICP, ECAL I, and ECAL III) have included majorcomponents designed to help achieve theseobjectives. All these loans were, in turn, basedon a set of high-quality ESW that included the1994 and 2000 Private Sector Assessments andthe 2000 Social and Structural Review.
The results and achievements of thecountry’s efforts and the Bank’s support havebeen mixed. Progress has been greatest inspecific, more “technical” areas such as pricedecontrol and some aspects of the regulatoryand procedural environment; progress on themore strategic dimensions such as the pace ofprivatization and addressing the financial andother problems of public enterprises has beenslow but steady. For example, upon completionof the EFRSL in the early 1990s, prices andmargins had been decontrolled for the bulk ofcommodities, although some controls remainto date at the retail level. A law prohibiting non-competitive pricing was passed. A unifiedInvestment Code was adopted under theEFRSL, although it still contained some costlyand inefficient clauses such as tax privileges forforeign investors. A new Company Code wasadopted in November 2002 and amendmentsare being proposed. Some modest measureshave been implemented to facilitate labormobility. A law that created a severance schemefor laying off workers has been passed, butenterprises continue to face obstacles and verycomplex procedures if they want to dismissworkers for “economic reasons.”
Recent Bank surveys on business climateshow that the private sector enjoys a betterbusiness climate in Tunisia than in other MNAcountries. Specifically, Tunisian entrepreneursscore higher on average than other MNAcountries in terms of starting a business,getting credit, and closing a business. Incontrast, they face more rigid employment lawsand more court involvement in the process of
2 0
R E P U B L I C O F T U N I S I A : C O U N T R Y A S S I S TA N C E E VA L U AT I O N

closing a business than the regional average.Tunisia lags considerably behind the OECDcountries (figure 3.1).
As far as privatization is concerned, 163 PEswere sold for a total of 2,345 million dinars(US$1720 million or 9 percent of GDP) during1987–03 (table 3.2). When the privatizationprogram started in 1987, the sectorsearmarked for privatization were chosenstrategically, but gradually other sectors of theeconomy were drawn in. The first privatizationprogram (1987–94) targeted small andmedium-size PEs, mainly in the textile, tourism,and construction sectors. The Bank supportedthe reform through a Public Enterprise Restruc-turing Loan (PERL). However, the reformprogram was modest, resulting in the privatiza-tion of a few small-scale PEs, generating aboutUS$80 million in sales proceeds. Furtherprogress has taken place since 1995 with theprivatization of large PEs such as the largecement plants under ECAL I, with privatizationproceeds amounting to US$570 million in 1998.Sales take place competitively primarilythrough invitations to tender with set terms
and conditions, or through the securitiesmarket (annex table A.2j). However, in therecent privatization of Global System Mobile(GSM), the Bank was not comfortable with the
T H E D E V E L O P M E N T I M PA C T O F W O R L D B A N K A S S I S TA N C E
2 1
B u s i n e s s C l i m a t e I n d i c e s f o r T u n i s i a , M N A , a n d O E C D ( v a l u e s 0 – 1 0 0 )
F i g u r e 3 . 1
0 10 20 30 40 50 60 70 80
Court involvement in closing a business (highervalues indicate more court involvement)
Closing a business (higher values indicate a moreefficient system)
Getting credit (higher values indicate easinessof getting credit)
Enforcing contracts (higher values indicate more complexity)
Employment laws (higher values indicate rigid laws)
Tunisia MNA average OECD average
Source: Doing Business in 2004 Database (World Bank 2004).
Of which: Total Receipts from
Sector receipts foreign investors
Tourism 277 93
Transport 69 17
Chemical & mechanical industries 108 6
Trade 137 76
Agriculture, fishing, food 75 -
Construction materials 825 771
Textiles 19 5
Others 835 788
Total 2345 1756
Source: Ministry of Economic Development.
P r i v a t i z a t i o n b yS e c t o r , i n m i l l i o nT u n i s i a n D i n a r( 1 9 8 7 t o A u g u s t3 1 , 2 0 0 3 )
T a b l e 3 . 2

process and allowed the associated floatingtranche of ECAL III to lapse. Moreover, moreinformation is needed on the relativeimportance of the privatized enterprises, interms of their size in the PE sector and theircontribution to employment. to assess theoverall impact of the program.
Tunisia attracted a small but rising amount offoreign direct investment (FDI) inflows, averag-ing 2.6 percent of GDP, during the 1990s,compared to an average of 0.8 percent during thesecond half of the 1980s. Annual average FDIinflows to other MNA countries at similar incomelevel during the 1990s were also small: Jordanreceived an amount of FDI averaging 0.7 percentof GDP annually, Morocco 1.1 percent of GDP, andEgypt 1.1 percent of GDP (Dabour 2000).5 Apartfrom small FDI amounts directed to tourism,Tunisia receives negligible FDI in the non-energyservices sector (World Bank data, 2003).
In sum, a successful stabilization andeconomic growth program supported by theBank and the Fund was maintained. Tunisia hasalso experienced a significant diversification ofits resources with non-oil/gas manufacturesassuming a larger role in the economy. TheBank’s program successfully promoted policyreforms in the trade, financial, and privatesectors, especially with respect to improving thesoundness of the banking system, as evidencedby a number of prudential ratios. Nevertheless,incomplete reforms in these areas have thepotential to make it difficult to sustain pasteconomic performance, in light of the morecompetitive environment that Tunisia is likely toface in the next few years. Although tariffs havebeen reduced and the economy is now moreopen to the outside world, tariff rates are stillhigh relative to competitors. Progress has beenmade in privatization, but it is not clear that thestate’s role in commercial sectors has beensubstantially reduced, because the Bank’sprogram did not specify objective indicators formeasuring progress, such as reducing thepercent of revenues or value added generatedby state-controlled firms. Despite recent stepsto eliminate past losses and establish a soundregulatory framework for the banking sector,nonperforming loans remain high and have
risen recently, reflecting incomplete enterpriseadjustment (e.g., privatization) and a slowdownin tourism. As a result, Tunisia’s private invest-ment remains low as a share of GDP (13.5percent) and of total investment (56) and doesnot compare favorably with other MNAcountries at similar income level (annex tableA.7a). Also, the private investment ratio to GDPin non-MNA high-growth countries (Chile,Korea, Malaysia, Mauritius, and Thailand) was 25percent over the 1990s (World Bank data, 2003).Moreover, the country is already beginning toface some of the socioeconomic problems thatprevail in more developed countries, such aspersistent youth unemployment.6 The Bank’sprogram needs to continue to support Tunisia’seffort to implement the EUAA and pursue tradeopenness beyond the EU, to improve the regula-tory climate for private enterprises, tostrengthen the court system to enforce businesslaws and regulations (particularly in relation tononperforming loans), and to continue progresson enterprise and financial sector privatization.
Human Development and Progresstoward MDGsThe Bank’s human resource developmentstrategy has emphasized achieving universalprimary education, expanding post-primaryenrollment, reducing infant mortality and fertil-ity, increasing health coverage, and enhancingthe quality and efficiency of education and healthservices. The Bank’s strategy focus on the socialsectors is aligned with the MDGs and thecountry’s emphasis on social achievements. Withthe Bank and other donor support—forexample, EU, the African Development Bank(AfDB), and the French Development Agency(Agence Française de Développement, AFD),Tunisia has already met some MDG target levelsand is likely to meet them all by 2015 (box 3.1).The Bank’s assistance contributed to many ofthese outcomes. Education and health were thebasis for 21 percent of all Bank lending to Tunisiaduring the 1990s. Most of this went to education,a pattern repeated from previous decades.7
Education. The Bank focused initially on increas-ing enrollments, then shifted toward improving
2 2
R E P U B L I C O F T U N I S I A : C O U N T R Y A S S I S TA N C E E VA L U AT I O N
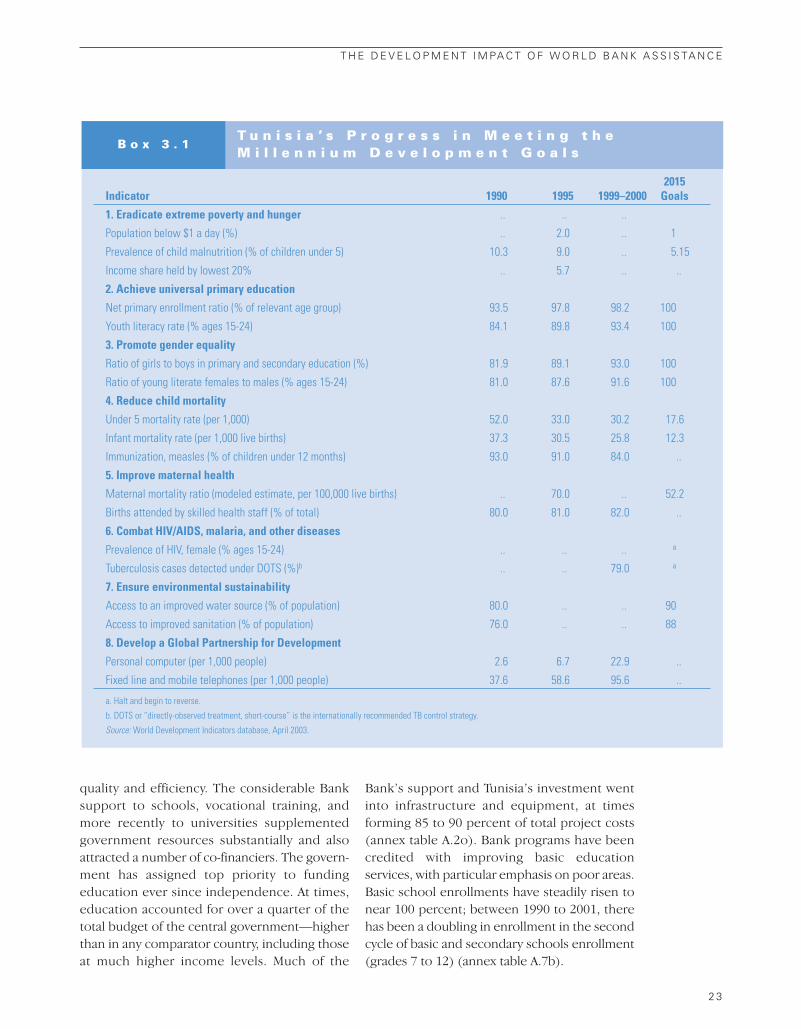
quality and efficiency. The considerable Banksupport to schools, vocational training, andmore recently to universities supplementedgovernment resources substantially and alsoattracted a number of co-financiers. The govern-ment has assigned top priority to fundingeducation ever since independence. At times,education accounted for over a quarter of thetotal budget of the central government—higherthan in any comparator country, including thoseat much higher income levels. Much of the
Bank’s support and Tunisia’s investment wentinto infrastructure and equipment, at timesforming 85 to 90 percent of total project costs(annex table A.2o). Bank programs have beencredited with improving basic educationservices, with particular emphasis on poor areas.Basic school enrollments have steadily risen tonear 100 percent; between 1990 to 2001, therehas been a doubling in enrollment in the secondcycle of basic and secondary schools enrollment(grades 7 to 12) (annex table A.7b).
T H E D E V E L O P M E N T I M PA C T O F W O R L D B A N K A S S I S TA N C E
2 3
2015 Indicator 1990 1995 1999–2000 Goals
1. Eradicate extreme poverty and hunger .. .. ..
Population below $1 a day (%) .. 2.0 .. 1
Prevalence of child malnutrition (% of children under 5) 10.3 9.0 .. 5.15
Income share held by lowest 20% .. 5.7 .. ..
2. Achieve universal primary education
Net primary enrollment ratio (% of relevant age group) 93.5 97.8 98.2 100
Youth literacy rate (% ages 15-24) 84.1 89.8 93.4 100
3. Promote gender equality
Ratio of girls to boys in primary and secondary education (%) 81.9 89.1 93.0 100
Ratio of young literate females to males (% ages 15-24) 81.0 87.6 91.6 100
4. Reduce child mortality
Under 5 mortality rate (per 1,000) 52.0 33.0 30.2 17.6
Infant mortality rate (per 1,000 live births) 37.3 30.5 25.8 12.3
Immunization, measles (% of children under 12 months) 93.0 91.0 84.0 ..
5. Improve maternal health
Maternal mortality ratio (modeled estimate, per 100,000 live births) .. 70.0 .. 52.2
Births attended by skilled health staff (% of total) 80.0 81.0 82.0 ..
6. Combat HIV/AIDS, malaria, and other diseases
Prevalence of HIV, female (% ages 15-24) .. .. .. a
Tuberculosis cases detected under DOTS (%)b .. .. 79.0 a
7. Ensure environmental sustainability
Access to an improved water source (% of population) 80.0 .. .. 90
Access to improved sanitation (% of population) 76.0 .. .. 88
8. Develop a Global Partnership for Development
Personal computer (per 1,000 people) 2.6 6.7 22.9 ..
Fixed line and mobile telephones (per 1,000 people) 37.6 58.6 95.6 ..
a. Halt and begin to reverse.
b. DOTS or “directly-observed treatment, short-course” is the internationally recommended TB control strategy.
Source: World Development Indicators database, April 2003.
T u n i s i a ’ s P r o g r e s s i n M e e t i n g t h e M i l l e n n i u m D e v e l o p m e n t G o a l s
B o x 3 . 1

Although early Bank education projectsemphasized enrollment expansion, in line withgovernment policy, the lending portfolio of themid- to late 1990s addressed quality andefficiency. Recent projects have focused onteaching and learning processes that are child-centered, and on improving the efficiency ofeducation spending, albeit largely at the tertiarylevel. Repetition and dropout rates of sixthgraders declined from 23 percent and 13.6percent in 1995 to 8.1 percent and 4.7 percentin 2001, respectively.8 Likewise, completionrates for grades 6 and 7 rose from 62 percentand 32 percent in 1995 to 87 percent and 63.5percent in 2001, respectively (annex table A.7b).Basic, secondary, vocational, and tertiary facili-ties and services have also been enhanced,although further improvements are needed inthe efficiency of services. For the vocationaleducation subsector, attempts to improve therelevance of training and to strengthen linkageswith the job market have been moderatelysuccessful.
Nevertheless, Bank projects have tended toequate quality with inputs (teacher training,class size, equipment, and higher spending perstudent) instead of student performance andoutcomes. Weak monitoring and evaluationmechanisms helped sustain these assumptionsand practices, and costs were not kept in check.Recent performance in international standard-ized testing (an outcome measurement) waspoor, reinforcing concerns about the quality ofeducation.9 With Bank support, the governmentlaunched a reform program in 2002, includingthe introduction of new subjects (physics tostudents in the seventh grade and English tostudents in the fourth grade) and improvementsin the quality of textbooks. However, funding ofmanagement and systemic improvements wassmall even for those Bank projects with overrid-ingly qualitative objectives.10
Health. During interviews, government officialsacknowledged the Bank’s support for construc-tion of 20 percent of total primary health unitsand for providing equipment. Health coveragehas expanded, and fertility and mortality havedeclined. Infant mortality rate dropped to 26 per
thousand live births in 2002 compared to 30.5 in1995 and total fertility rate declined to 2 (table1.4). The efficiency of large urban hospitals hasimproved with management upgrading and costsharing with the social security program, andmanagement information systems are beinginstalled.11 However, the Ministry of Health hasnot granted these hospitals the autonomy tofully manage their human resources andbudgets.12 Reform of health insurance has beenslow. Recent reforms such as decentralization,regional health planning, and effective resourceallocations are expected to enhance quality andefficiency. As demographic changes cause enroll-ment in basic education to fall and demand forsecondary and higher education to increase, thegovernment, with Bank support, will need tofocus attention on the education system at post-primary levels (figure 3.2).13 There are now300,000 university students, which will rise to500,000 by the end of the decade. The composi-tion of education expenditure is more skewedtoward the secondary and higher educationlevels than in other countries.14 Public spendingon education is already high (27 percent of totalpublic expenditure and more than 7 percent ofGDP in 2003) and cannot be expected to expandsignificantly, thus further improvements inefficiency need to be pursued. There is nomechanism for analyzing the education system’sfiscal sustainability in the ongoing Bank-supported Education Quality ImprovementProgram Phase 1 (EQIP 1), which focuses onpromoting inclusion in basic education byreducing dropout and repetition rates throughimproved teaching.15 With the upcomingcompletion of the EUAA; the projectedpressures on the budget for higher socialspending; and the need to accelerate thereduction of the public debt by more ambitiousfiscal consolidation; improving the efficiency ofsocial expenditures is becoming of paramountimportance.
In sum, the support of the Bank and otherdonors (EU, AfDB, and AFD) and the govern-ment’s sustained emphasis on human resourcedevelopment have resulted in remarkableprogress in almost all areas covered by the MDGs(box 3.1). Figures 3.3–3.5 summarize the main
2 4
R E P U B L I C O F T U N I S I A : C O U N T R Y A S S I S TA N C E E VA L U AT I O N

T H E D E V E L O P M E N T I M PA C T O F W O R L D B A N K A S S I S TA N C E
2 5
E d u c a t i o n S y s t e m E x p a n s i o n a t t h e P o s t - B a s i c L e v e l
F i g u r e 3 . 2
0
200,000
400,000
600,000
800,000
1,000,000
1,200,000
1,400,000
1,600,000
Number
77–78 82–83 87–88 92–93 97–98 02–03
1st cycle of basic education 2nd cycle of basic education and secondary education
Source: Government data: Statistiques de l’enseignement scolaire.
0
20
40
60
80
100
120%
1975 1990 2000
Tunisia MNA
0
20
40
60
80
1975 1990 2000
Tunisia MNA Lower-middle-income
%
Net Pr imary Net Pr imaryEnrol lment
Enrol lmentF i g u r e 3 . 3 I l l i teracyF i g u r e 3 . 4
Infant Mortal i ty
F i g u r e 3 . 5
Source: World Bank, World Development Indicators database.
0
20
40
6080
100
120
140
1975 1990 2000Tunisia MNA Lower-middle-income
Per 1,000 live births
achievements in comparison with the averagesfor MNA and other middle-income countries.
Poverty Alleviation and RuralDevelopment16
Rapid economic growth laid the groundworkfor poverty reduction given that incomeinequality remained unchanged. The pooraccounted for 4 percent of the population in2000, down from 8 percent in 1990 (WorldBank data). Tunisia’s incidence of poverty is thelowest among MNA countries at similar incomelevels (annex tables A.2b and A.2c). Althoughrural poverty has decreased over the years, its2000 level remained four times the urban level(World Bank data).
Controversy on poverty estimates not yet resolved. Asmentioned earlier, there is a range of estimatesof poverty in Tunisia. World Bank and Tunisiananalysts note that poverty is predominatelyrural and this contradicts the findings of thegovernmental institutions.17 Official Tunisiandata shows that poverty has not been primarilyrural since 1990. According to the NationalInstitute of Statistics (INS), the incidence ofrural poverty in 1990, 1995, and 2000 was 5.7,4.9, and 2.9 percent, respectively. These levelsare much lower than those reported by theBank (table 1.3).18 The Bank is working withthe Tunisian authorities to reconcile themethodological differences that are driving thesubstantial discrepancies in poverty estimates.It is important to close the large gap betweenestimates so that the focus can be shifted topolicy and strategy to reduce poverty. Everyattempt should be made before the 2005Household Survey and before the next povertyassessment is completed (a collaborative effortbetween the government and the Bank isrecommended) to address differences inpoverty measurements.
The Bank’s rural development strategy. The Bankassistance strategies have broadly agreed onthe following priorities for agriculture and ruraldevelopment: (i) liberalize the agriculturesector, (ii) increase the efficiency of resourceuse, (iii) promote sustainable natural resource
management, (iv) increase incomes in remoterural areas, (v) strengthen agricultural supportservices; and (vi) promote land consolidationand tenure security. These objectives wererooted in the Bank’s analytical work since 1982(annex table A.4).19 To achieve its objectives, theBank provided a number of agricultural loans:two Agriculture Sector Adjustment Loans(ASALs), two Agriculture Sector InvestmentLoans (ASILs); one Water Sector InvestmentProject (WSIP); two Agriculture Research andExtension/cum/ Services projects; twoNorthwest Mountainous Areas DevelopmentProjects, one Forestry Development Project; oneNatural Resource Management Project; and oneRural Finance Project. Progress toward address-ing the Bank’s program priorities is examinedbelow.
Liberalization. With assistance from the Bankthrough the two ASALs, Tunisia has undertakensubstantial agricultural policy reforms since1989. Subsidies for fertilizer, animal feed, seed,irrigation, and mechanized services have beensubstantially reduced. The supply of farminputs, collection of produce, and theprovision of mechanized plowing and harvest-ing have been privatized. The role of privateextension agents and veterinarians hasexpanded. Progress has been slower, however,in liberalizing food marketing, with the stateremaining involved in cereals, milk, olive oil,sugar, tea, coffee, and tobacco.
Increased efficiency of resource use in irrigatedperimeters. This objective, supported by ASIL andWSIP loans, was partially achieved as water tariffswere raised, and many water users’ associationswere created to manage irrigation in a decentral-ized way. Since Tunisia has not developed directmeasurements of water savings at farm andirrigation perimeter levels, there is no directmeasure. But there are some indirect measures,including the extent of the use of water savingsdevices and the value added from the use ofirrigated perimeters. In 1995, the governmentlaunched a national water savings program bysubsidizing the purchase of water savingequipment. So far, around 72 percent of the
2 6
R E P U B L I C O F T U N I S I A : C O U N T R Y A S S I S TA N C E E VA L U AT I O N

public irrigation perimeters are equipped withthese devices. However, following the droughtof 1998, the government started to subsidizewater tariffs. This subsidization runs counter tothe objective of increasing water tariffs andwater savings devices to improve efficient use.Regarding the value added from the use ofirrigation perimeters, the continued subsidiza-tion of wheat maintains an incentive system thatfavors the cultivation of cereals, a low value crop.Problems of accessing the EU market20 anddomestic problems of marketing high-valuecrops are also undermining the switch to highervalue crops; addressing these problemswarrants Bank support.
Sustainable Natural Resource Management. Therehave been substantial physical achievements inForestry II, Natural Resource Management, theNorthwest Mountainous Areas, and theNorthwest Mountainous and Forested Areasprojects. For example, in the NorthwestMountainous Areas project the water conserva-tion component was fully implemented,covering some 53,000 hectares. Improved soilmanagement allowed farmers to plant pasturesand alternative crops on land that wouldotherwise have been left fallow. An increaseddemand for agro-forestry species was met by theOffice du Développement Sylvo-Pastoral duNord-Ouest (ODESYPANO), a regional develop-ment agency, supporting the establishment of 36small private enterprise nurseries. The Banksought to improve natural resource managementin a sustainable fashion by involving localcommunities. The partnership between theForestry Department and local NGOs expandedfrom piloting 10 integrated rural developmentoperations to 40. Forestry Groups with Collec-tive Interest (groupement forestier d’interetcollectif, GFIC) in forested areas or AgriculturalDevelopment Groups (groupement développe-ment agricole, GDA) in agricultural areas havebeen created. The government has subsequentlyallocated increased resources—budgetary andfrom donors—to natural resource management.
Increased incomes in remote rural areas. The Banksought to increase the incomes of poor farm
families in remote rural areas such as the NorthWest Region through its two NorthwestMountainous Area Development projects. Itsubstantially achieved this objective as well asthe broader objective of improving the livingstandards of these farm families (table 3.3). Themajor benefits to the poor have been improvedaccess to public goods and services, includingschools, health facilities, and potable water.The positive results on poverty reduction aresupported by the Bank findings in 2003, whichnoted the overall reduction in rural povertyand pointed out that the North West Region isno longer the poorest of rural areas.21 Table 3.3also shows that farm income is only half of totalhousehold income for small farmers (with lessthan 5 hectares), reflecting the positive butlimited contribution of improved agriculturaltechniques to rural vulnerability/povertyreduction. The project report points out thatthe very poor and landless did not benefitmuch from the agricultural interventions.22
This highlights the need for supplementingefficiency gains with better targeted safety nets.
Strengthen agricultural support services. The Banksought to improve agricultural support services(such as research and extension and ruralfinance) and to strengthen several institutions(such as water and community groups) asmeans to achieving developmental objectives.The outcome is mixed. The Bank achieved itsobjectives to improve participation andresource management and to increase familyincomes by supporting water users associa-tions and community development structures,both local level institutions. The Bank’s contri-bution to strengthening agriculture researchand extension and rural finance to assist smallholders was less successful. Despite someprogress, research and extension is far frombeing demand-oriented because the agendasof researchers still dominate, and the transla-tion of research results into extendablemessages is still problematic. In rural finance,government policy on debt forgiveness inresponse to drought still continues toundermine financial discipline, and thereforethe viability and reach of rural finance.
T H E D E V E L O P M E N T I M PA C T O F W O R L D B A N K A S S I S TA N C E
2 7

Land consolidation and tenure security. The Banktried to promote land consolidation and tenuresecurity as a means of improving incentives toinvest in land and increase productivity,especially among small holders. It succeeded inimplementing some pilot cases, but did notsucceed in accelerating the process of landconsolidation and tenure security. A 2003project performance assessment report (PPAR)notes that the Bank did not give sufficientattention to these complex and sensitive landissues and argues correctly that the Bank haslargely tacked the land issue onto projects(ASAL II, ASIL I, and Northwest MountainousArea projects) (World Bank 2003).23 On theother hand, the Bank contributed in later yearsto raising government consciousness andincreasing government resources to land issues.
To conclude, the Bank was successful insupporting measures that raised farm incomesin remote rural areas, increased local institu-tions participation, and improved resourcemanagement sustainability. On the other hand,the Bank’s contribution to linking research toextension, to enhancing rural finance, and to
promoting land tenure and output markets wasless successful. Future Bank programs shouldfocus on these areas: supporting institutionsessential for efficient functioning of output andinput markets (for example, land and ruralfinance), while maintaining social cohesionthrough better targeted safety nets for the ruralpopulation. Ministry of Agriculture (MOA)officials suggested that the Bank and the MOAshould closely collaborate to undertake asectorwide review as a first step. As MOAofficials pointed out, the last agricultural sectorreview was carried out over twenty years agoand a new review is needed to inform futureBank programs.
Outcome, Sustainability, and Institutional Development The Bank’s assistance, in tandem with that ofthe IMF and other donors, made a contributionto maintaining macroeconomic stabilizationand structural reforms, which in turn facilitatedgrowth. Along with sustained per capitaincome growth, solid progress was made inreducing poverty. With Bank assistance, the
2 8
R E P U B L I C O F T U N I S I A : C O U N T R Y A S S I S TA N C E E VA L U AT I O N
Indicator Unit 1996 2000 Difference (%)
Agricultural income:
Less than 5 ha TD 1,113 1,633 46.7
More than 5 ha TD 3,141 4,724 50.4
Contribution to total household income:
Less than 5 ha % 47 48 1.0
More than 5 ha % 65 67 2.0
Employment in family farm Work day 136 285 109
Distance to potable water km 1.5 0.8 –46.7
Areas close to basic education facility % 39 46 17.9
Distance from clinic km 7 3.9 –44.3
Wheat yield
Less than 5 ha QT/HA 11.5 13.6 18.3
More than 5 ha 10.7 16.1 50.5
Barley yield QT/HA 11.1 15.4 38.7
Notes: TD: Tunisian Dinar; km : kilometers; QT/HA: Quintal per hectare. 1 Quintal = 100 Kilos. The survey covered 158 households with less than 5 ha farms and 101 households with
greater than 5 ha farms. These households come from 28 Community Development Groups.
Source: Northwest Forestry and Pastoral Development Agency (ODESYPANO).
N o r t h w e s t M o u n t a i n o u s A r e a s D e v e l o p m e n t P r o j e c t : S e l e c t e d R e s u l t sf r o m t h e 2 0 0 0 S u r v e y
T a b l e 3 . 3
overall soundness of the banking systemimproved. However, large public banks with aheavy burden of nonperforming loans stilldominate the banking sector and pose risks tothe system’s stability. Tariffs have been reducedand the economy is now more open to theoutside world but protection remains highcompared to Tunisia’s competitors. Furtherprogress in trade liberalization will be governedby the implementation of the EUAA. The Bank’sassistance also contributed to significantprogress in the rural and social sectors. In therural sector, the Bank’s assistance madeimportant contributions such as achievingsustainable resource use, increasing farmincomes, and improving living standards inremote areas. However, efforts to facilitaterural credit and land consolidation were lesseffective. With Bank support, remarkableprogress in meeting the MDGs was made.Almost all children attend school, morechildren are surviving their first years, lifeexpectancy has grown substantially, and genderequity has improved steadily. However, theBank did not pay sufficient attention to thecountry’s expanding social programs andpublic expenditure reviews were not periodi-cally undertaken. Overall, the outcome of theBank’s assistance program is rated satisfactorybased on its substantial relevance and efficacy.
There are two risks/vulnerabilities to sustain-ability: the relatively high level of external debtand large fiscal deficit increase Tunisia’s vulner-abilities to external shocks, and vulnerabilitiesto regional and international developments,including the expiration of the MFA. However,the country has managed economic andregional political uncertainties quite well bygradually diversifying its export base, forgingcloser relations with the EU, and maintainingsocial and macroeconomic stability.24 Theprogress achieved in attaining and maintainingmacroeconomic stability is likely to besustained—a broad political consensus thatrealizes the benefits and understands theimportance of economic stability has evolved.Similarly, the structural reforms that have beenaccomplished have been based on a consensusamong the key actors in the economy and are
likely to be sustained. As Tunisia has joinedWTO and has signed a free trade agreementwith the EU, trade and investment policyreforms are unlikely to be reversed. Sustain-ability is rated likely.
The already relatively good institutionalcapacity in the country was strengthened furtherby the Bank’s support. Institutional changes inTunisia’s policy, regulatory, and legal environmentwere accomplished with the help of Bankassistance. A broad range of investment, competi-tion, and banking laws were implemented (annextable A.2n). New structures were established andnow are operating successfully, such as the banksupervision and the associated revised bankinglaw, and the new regulatory framework formutual funds that complied with internationalstandards and represented good progress inensuring an adequate legal framework for thesector. On the other hand, there has been poorenforcement of regulations concerning loanrecovery and, although a law that created aseverance scheme for laying off workers has beenpassed, enterprises continue to face obstaclesand very complex procedures if they want todismiss workers for “economic reasons.”
Other organizations were restructured. Thecapacity of the ODESYPANO, a regionaldevelopment agency in the northwest, still oneof the poorest regions, and of the communitydevelopment committees has been enhanced.Contracting of soil and water conservationworks to private firms, privatization of veteri-nary services, and strengthening of water userand community development groups andagricultural development associations all has apositive impact. On the other hand, the Bank’sefforts to strengthen institutional developmentto promote rural finance, enhance researchand extension, and address land tenureproblems—some of the most difficultstructural problems in rural development—had a limited impact. In contrast, substantialinstitutional and structural changes were madein the education and health sectors with theBank’s support, facilitating the remarkableprogress toward meeting the MDGs. Onaverage, the Bank’s contribution to institu-tional development has been substantial.
T H E D E V E L O P M E N T I M PA C T O F W O R L D B A N K A S S I S TA N C E
2 9


3 1
Contributors’ Performance
Tunisia’s Own Central Role
The main party responsible for the significant socioeconomic achieve-ments of Tunisia is the country itself. The Bank’s support and that ofother development partners no doubt played important roles, but it was
the government’s own belief in the correctness of the policies it followed andits ability to muster the national consensus to implement them that made thebiggest difference.
Perhaps three main attributes of Tunisia’sefforts were crucial for this overall success: (i)program ownership and the explicit policy ofthe government to move ahead with difficultpolicies and reforms only after a broad consen-sus with labor unions, the business community,and the political structure had been achieved,albeit within a regime that is governed by astrong central authority. Although this meantthat the pace of reform had to be cautious anddeliberate, it also meant that there have beenno policy reversals and that economic agentscould count on a basically predictable policyenvironment; (ii) the maintenance of highinvestment levels in human resources, whichhas led to a well-educated population and awell-trained and qualified labor force; and (iii)the achievement and maintenance ofmacroeconomic stability through a combina-tion of sound fiscal, monetary, and foreignexchange policies.
These factors enabled the country toimplement reforms across a wide variety ofareas: price liberalization, trade, financial andprivate sector development, investmentincentives, legal and institutional frameworks,human resources, and agriculture and ruraldevelopment. However, although comprehen-sive, both the pace and the depth of reformshas been uneven. Whereas stabilization policieswere implemented rather swiftly and generallyhave been maintained, and broad fiscal andfinancial sector reforms have moved forwardrapidly, progress with public enterprise restruc-turing and privatization has been relativelymodest, proceeding at a more cautious pacebecause the consensus behind them is not asfirm. In addition, labor mobility remainshampered by rigidities in the labor marketwhose removal has experienced considerableresistance from the unions. Trade liberalization,on the other hand, was initially resisted and
44

had moved slowly, but eventually wouldaccelerate under the EUAA free tradeagreement. The government has placed strongemphasis on education. This investment haspaid off impressively: rising educationstandards were a major contribution to the risein total factor productivity.
According to some policymakers, the1986–93 period represented the first phase ofreforms that were not fully developed at thetime and, sometimes, not fully owned by thecountry. This led to mixed and partial resultsand some slippage in implementing policies. Tothese practitioners, 1993 signaled the beginningof the “post-adjustment” phase, in preparationfor the signing of the EUAA in 1995. During thisperiod, the authorities took a couple of years todevelop their own program and build therequisite internal consensus for its support.This served as the basis for the three EconomicCompetitive Adjustment Loans (Tunisianofficials chose the name over a StructuralAdjustment Loan [SAL], noting that adjustmenthad already been completed and the countryhad entered its post-adjustment phase).However, even when the authorities havethemselves been convinced of the reforms thatthey owned, they have chosen to continue tomove prudently and deliberately to ensure thatall concerned were on board. In the words of anofficial, “We wait until things ripen and then wemove, step-by-step. This is why there have beenno reversals or slippages in this phase. Forexample, after seven years of partial tradeliberalization and five years of hesitant privatiza-tion, both have now accelerated.”
Perhaps the most controversial issue has todo with the “appropriate” pace of reform. Thegradualist, cautious approach followed by theTunisian authorities to ensure as broad a politi-cal consensus as possible in sensitive areas hasled to some delays, from the standpoint of theBank, and it entails some risks, as the economyfaces growing competitive pressures. But onthe other hand, the gradual approach hasallowed the government to build the necessaryconsensus and has served the overall objectiveof reform well, at least so far. Bank staff wentalong with this pace in general, but by the late
1990s started encouraging Tunisia with moreurgency to accelerate the implementation of itsreforms and make the private sector moreopen and transparent, in view of the significantincrease in competitive pressures expected forthe country. Because of domestic opposition tothe more difficult measures required, theTunisians have elected not to abandon thegradualist approach that has served them wellso far, in order to avoid risking a major derail-ment of reforms.
The World Bank’s PerformanceThe Bank provided significant assistance tosupport the country’s development efforts. Itsanalytical work was timely; the topics coveredwere driven by socioeconomic developmentsin the country. It was generally of high qualityand important for the design of the Bank’sstrategies. It also underpinned the Bank’slending.
Policy-based and sector investment loanswere generally well conceived and designed.1
They covered the right policy areas, starting witha broad catch-all operation like the IndustrialTrade Policy and Adjustment Loans, which wasappropriate for the early days of reform, andbecame more focused and specific as the processmatured. Successive operations covered thesame set of areas, but each time building onprevious progress and adding new and deeperdimensions. This reasonable approach workedparticularly well in financial reform, where Bankassistance supported the country first inintroducing the basic rudiments of a modernfinancial system in the early days and then inadopting more specific measures appropriate fora more advanced system by the turn of thecentury. Similarly, early education and healthprojects placed more emphasis on improvingaccess; the lending portfolio of the later 1990swas more focused on sector-wide policy issuessuch as enhancing the quality of services.
In general, Bank staff and managementshowed reasonable flexibility during implemen-tation. For example, Bank staff showed flexibil-ity during ECAL I preparation, reaching anagreement with the government to postponethe banking reforms initially envisaged in the
3 2
R E P U B L I C O F T U N I S I A : C O U N T R Y A S S I S TA N C E E VA L U AT I O N

operation in order to arrive subsequently at afully agreed policy package for the sector loan(ECAL II). This flexibility entailed a reduction ofthe ECAL I amount by half. On the other hand,the Bank was not comfortable with the telecom-munication privatization process, and decidedto allow the floating tranche of ECAL III to lapse.In a few instances, a technical or partial waiverfor a tranche-release condition had to be given,or a loan covenant was not honored, and theBank still disbursed the loan. This was normallya negotiable approach, since the agreedmeasures were subsequently implemented andthe momentum of the overall reform effortmaintained.
In particular, an explicit approach of“incremental progress” by all the partiesinvolved has proven very effective in Tunisia.This approach involved the Bank staying thecourse in a particular policy area and address-ing the same or closely related issues in thatpolicy area with successive analytical pieces orlending operations, but each time incremen-tally and patiently introducing additionalmeasures until more complete progress wasachieved over time. This was particularly clearin the more difficult areas in finance, agricul-ture, and investment incentives—areas wherepolitical resistance initially slowed down therate of progress, and patience and persistenceproved worthwhile.
As is to be expected, where there was strongconcordance between the Bank and thegovernment (as in the case of the NaturalResource Management Project), there wasgreat progress; and vice versa, as in the case ofrural finance. The Bank was not able to changethe government’s traditional approach of re-scheduling and forgiving debts as a method ofdrought relief. This behavior underminedincentives to repay the National AgriculturalBank (Banque Nationale Agricole or BNA)loans even among farmers in irrigated areaswho were not drought-afflicted.
While turnover of country directors forTunisia has not been high (annex table A.9),staff rotation is relatively high at the projectlevel. There have been three or more taskmanagers in eight (24 percent) out of 33
projects (annex table A.8). The turnover wasthe highest for the Hospital RestructuringLoan, which had five task managers, and thePrivate Investment Credit, which had four.Ongoing projects with a high turnover of taskmanagers include the Education QualityImprovement Program (with three taskmanagers).
Other Development Partners
The International Monetary Fund. Tunisia joinedthe Fund in April 1958. The IMF has played asignificant role in supporting the country’ssuccessful stabilization and financial sectorreform efforts. As with the Bank, the Fundprovided valuable technical advice and consid-erable funding, and played an important role inhelping the government avert the threateningbalance of payments crisis in the mid-1980s. AStandby Arrangement in an amount of SDR103.65 million was approved in July 1988, and adrawing of SDR 207.30 from the Extended FundFacility was approved in July 1992. Theseamounts were very important in helpingTunisia meet external financing requirements,and the underlying programs supported thegovernment’s efforts to maintain macroeco-nomic stability and implement structuralreforms in a number of the areas alsosupported by Bank adjustment lending. TheFund and the Bank jointly conducted a financialassessment. The Fund also provided assess-ments of the country’s macroeconomicconditions under the three ECALs. The Fundand the Bank also cooperated in a number ofareas to provide technical advice, most notablyfor the financial sector and debt management.
The European Union. The partnership betweenTunisia and the EU has been very strong, bothwith the Commission itself and with theEuropean Investment Bank (EIB). Over the1977-1996 period, four financial protocols wereimplemented, for a total support from theEuropean Union of euro 742 million; of this,euro 324 million is directly from the Commis-sion’s budget, and euro 418 million is from EIB.Priority was given during this period to support
C O N T R I B U T O R S ’ P E R F O R M A N C E
3 3

agriculture and rural development, environ-mental management, transport, industry,infrastructure, and training. After Tunisiasigned the Association Agreement in 1995, thenature of the support shifted significantlyunder the MEDA I program (1996–99). In linewith the Tunisian government’s priorities at thetime, 48 percent of this program’s euro 428.4million support was for structural adjustment,in conjunction with World Bank ECAL support.In addition, EIB provided euro 620 million inloans, mainly in support of infrastructure,environmental protection, and private sectordevelopment. MEDA II (2000–06) was designedto support similar priorities that were furtheremphasized in the Document de Strategie(2002–2006) and the accompanying Pro-gramme Indicatif National (2002–2004).Under MEDA II, the Commission provided euro249 million for structural adjustment; modern-ization of industry, the judiciary, ports, andinformation technology ; the media; andgreater participation of civil society in socioe-conomic development. The EU analyses ofeconomic developments and prospects inTunisia are similar to the Bank’s, giving thecountry high marks on macroeconomicstabilization and good overall performance onstructural adjustment, but stressing the needto accelerate the implementation of policiesthat would increase competitiveness, such asfurther export-orientation, private sectordevelopment, and dealing more decisively withthe public enterprise sector through the mise ániveau (box 1.1) program. Finally, the EU hasalso given Tunisia high marks for its efficientabsorptive capacity of the EU assistanceprogram.
The EU has co-financed all three Bank-supported ECALs, for a total of euro 260million. The EU—along with the GermanAgency for Reconstruction (Kreditanstalt fürWiederaufbau or KfW) and AFD—have beenimportant partners in the Bank’s rural develop-ment program. Staff of the EU delegation inTunis feel that the cooperation with the Bankhas basically been very good, especially duringloan preparation and appraisal, but that theBank could do a better job of actively engaging
EU staff during loan implementation andsupervision. The EU noted the lack of Bankrepresentation in Tunis. At present, the Bankhas only a liaison office in Tunis staffed by oneOperations Officer; the Country Director isbased in Washington, D.C.
The African Development Bank. AfDB has enjoyedexcellent cooperation with Tunisia and hascontributed significantly to its developmenteffort. Since the beginning of its operations inthe country in 1968, it has committed aboutUS$4,290 million equivalent in support of 84operations. AfDB loan commitments haveaveraged about US$250 million equivalentannually in recent years. These loans havegiven priority to electrification, roads, railways,water resources, agriculture, rural develop-ment, and structural adjustment, in conjunc-tion with the three ECALs (for a total of about330 million AfDB currency units), and small andmedium enterprise (SME) developmentthrough support of the mise á niveau programin conjunction with the EU. AfDB staff workingon the ECALs commended the excellentworking relationship with the Bank.
The Islamic Development Bank. Tunisia joined theIDB in 1974 and since then has enjoyed anexemplary relationship with the IDB. The IDBsupported Tunisia’s development efforts byproviding trade financing (US$818 million),project financing (US$355 million), and specialassistance (US$4 million). Priorities for IDBassistance have been public utilities, mainlywater and sewerage (44 percent), agricultureand integrated rural development (17 percent),and social sectors (15 percent). The IDB co-financed one World Bank project and theworking relationship between the two institu-tions has been excellent.
Exogenous FactorsThe amount of rainfall in a particular year is avery important, unpredictable, and ever-present exogenous factor for Tunisia. It has animmediate effect on agricultural production,which, because of its significant share of GDP,greatly influences aggregate production. The
3 4
R E P U B L I C O F T U N I S I A : C O U N T R Y A S S I S TA N C E E VA L U AT I O N

cyclical nature of GDP in Tunisia is due torainfall cycles, and it is interesting to note inthis context that this cyclical relationship isasymmetric. The influence of agriculturalproduction on GDP is stronger in the contrac-tion phase than in the expansion phase, sincewhen agricultural output is higher than normal,its multiplier effect through its use by agro-industries takes place only if spare capacity isavailable. There is also a household incomeseffect that reinforces this asymmetry.
Another important exogenous factor thatapplies to most countries is the level ofeconomic activity in trading countries. In thecase of Tunisia, this means essentially the rateof economic growth in the EU. Because ofincreasing international competition in exportsto the EU, this factor is likely to be quite signif-
icant, particularly during years of low, ornegative EU growth.
Although Tunisia is not a direct participantin the Middle East conflict, its economy can stillfeel any significant perturbations in the region,as happened during the Gulf War; the attack inDjerba, a tourist resort; and the currentuncertain situation in Iraq.
By their nature, exogenous factors are notwithin the country’s control. But Tunisia can tryto build up resilience against them by increasingthe flexibility of its economic structure so it canrespond more rapidly to unpredictable changesin its environment. Its prudent macroeconomicstabilization measures and adjustment programto make the economy more open and competi-tive have enabled Tunisia to weather some ofthese factors over the past couple of decades.
C O N T R I B U T O R S ’ P E R F O R M A N C E
3 5


3 7
Recommendations
This evaluation finds that a combination of macroeconomic stability, at-tention to human resource development, and structural reform can yielddramatic improvements in the living standards of developing countries.
Also, government ownership of reforms and the reform program are impor-tant ingredients of a successful Bank assistance program. It also shows thatESW can play an important role in formulating and supporting reform pro-grams that underline Bank lending, particularly adjustment lending. In this re-gard, omission of diagnostic work, such as sector work, public expenditureanalysis, and core fiduciary work do have an impact on the Bank’s programsin sectoral reform, the efficiency of public expenditures, and accountability.
This evaluation has the following recommen-dations:
• Follow through on supporting programs toimprove the environment for private sector de-velopment and enhance competitiveness, asTunisia seeks to integrate within the worldeconomy. Specifically, the Bank should help thecountry (i) pursue trade openness with theEU and the rest of the world; (ii) improve theenabling environment to attract private andforeign investment; (iii) strengthen the judicialsystem to implement laws and regulations re-garding loans recovery, particularly nonper-forming loans and measures to facilitate exit ofprivate firms; and (iv) continue progress on pri-vatizing public financial and enterprise firms.
• Continue support for social sectors. While sup-portive of the MDGs, the Bank’s program needsto continue this emphasis and focus on im-proving the country’s capacity to prioritize pub-lic spending and address burgeoning demandfor secondary and tertiary education—giventhe demographic transition under way—whilepreserving social gains. As expenditures on so-cial services remain high, representing over 40percent of expenditures, education expansionat the post-basic level will necessitate efficiencyimprovements. A public expenditure reviewcould help build capacity to prioritize socialspending and provide the basis for measures toefficiently address education expansion.
• Focus on institutional development and safetynets in the rural sector. Future Bank programs
55

should focus on institutional development tosupport efficient output and input markets(for example, land and rural finance), whilemaintaining social and political stability throughbetter targeted rural safety nets. Good qualityeconomic and sector studies should informfuture Bank programs. After 21 years withouta comprehensive Bank agricultural sector re-
view, OED agrees with the government’s sug-gestion that it is time to undertake one.
• Enhance a results-based monitoring and eval-uation approach. Strengthening monitoringof output and outcome indicators embedded inan improved monitoring and evaluation functionwould help to anchor the Bank’s future assis-tance program in a result-based approach.
3 8
R E P U B L I C O F T U N I S I A : C O U N T R Y A S S I S TA N C E E VA L U AT I O N

ANNEXES


4 1
Annex A.1 Tunisia at a GlanceAnnex A.2 Key Background DataAnnex A.3 External Assistance to TunisiaAnnex A.4 Selected ESW and CAS List for TunisiaAnnex A.5 Ratings for Tunisia and Comparator CountriesAnnex A.6 Cost of Bank Programs for Tunisia and Comparator CountriesAnnex A.7 Country Strategy Objectives and Key IndicatorsAnnex A.8 Tunisia: Task Manager Turnover of Projects Approved in FY90–03Annex A.9 Tunisia: Bank’s Senior Management, 1991–03
ANNEX A: STATISTICAL ANNEXES
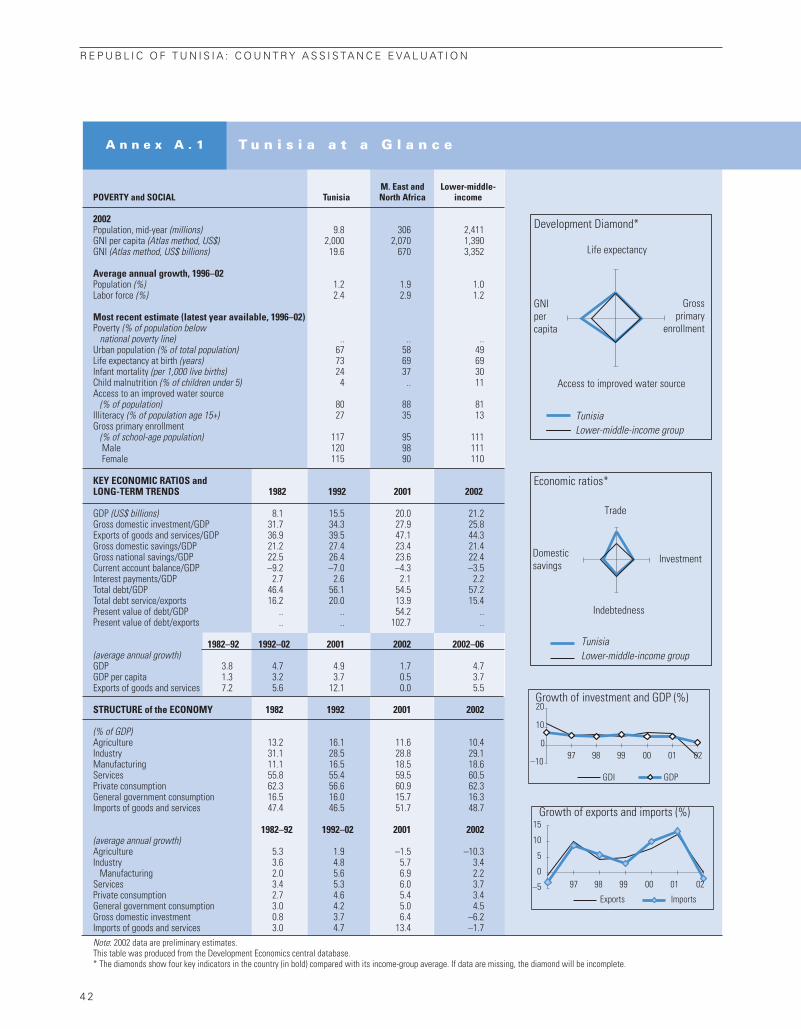
R E P U B L I C O F T U N I S I A : C O U N T R Y A S S I S TA N C E E VA L U AT I O N
4 2
M. East and Lower-middle-POVERTY and SOCIAL Tunisia North Africa income
2002Population, mid-year (millions) 9.8 306 2,411GNI per capita (Atlas method, US$) 2,000 2,070 1,390GNI (Atlas method, US$ billions) 19.6 670 3,352
Average annual growth, 1996–02Population (%) 1.2 1.9 1.0Labor force (%) 2.4 2.9 1.2
Most recent estimate (latest year available, 1996–02)Poverty (% of population below
national poverty line) .. .. ..Urban population (% of total population) 67 58 49Life expectancy at birth (years) 73 69 69Infant mortality (per 1,000 live births) 24 37 30Child malnutrition (% of children under 5) 4 .. 11Access to an improved water source
(% of population) 80 88 81Illiteracy (% of population age 15+) 27 35 13Gross primary enrollment
(% of school-age population) 117 95 111Male 120 98 111Female 115 90 110
KEY ECONOMIC RATIOS and LONG-TERM TRENDS 1982 1992 2001 2002
GDP (US$ billions) 8.1 15.5 20.0 21.2Gross domestic investment/GDP 31.7 34.3 27.9 25.8Exports of goods and services/GDP 36.9 39.5 47.1 44.3Gross domestic savings/GDP 21.2 27.4 23.4 21.4Gross national savings/GDP 22.5 26.4 23.6 22.4Current account balance/GDP –9.2 –7.0 –4.3 –3.5Interest payments/GDP 2.7 2.6 2.1 2.2Total debt/GDP 46.4 56.1 54.5 57.2Total debt service/exports 16.2 20.0 13.9 15.4Present value of debt/GDP .. .. 54.2 ..Present value of debt/exports .. .. 102.7 ..
1982–92 1992–02 2001 2002 2002–06(average annual growth)GDP 3.8 4.7 4.9 1.7 4.7GDP per capita 1.3 3.2 3.7 0.5 3.7Exports of goods and services 7.2 5.6 12.1 0.0 5.5
STRUCTURE of the ECONOMY 1982 1992 2001 2002
(% of GDP)Agriculture 13.2 16.1 11.6 10.4Industry 31.1 28.5 28.8 29.1Manufacturing 11.1 16.5 18.5 18.6Services 55.8 55.4 59.5 60.5Private consumption 62.3 56.6 60.9 62.3General government consumption 16.5 16.0 15.7 16.3Imports of goods and services 47.4 46.5 51.7 48.7
1982–92 1992–02 2001 2002(average annual growth)Agriculture 5.3 1.9 –1.5 –10.3Industry 3.6 4.8 5.7 3.4
Manufacturing 2.0 5.6 6.9 2.2Services 3.4 5.3 6.0 3.7Private consumption 2.7 4.6 5.4 3.4General government consumption 3.0 4.2 5.0 4.5Gross domestic investment 0.8 3.7 6.4 –6.2Imports of goods and services 3.0 4.7 13.4 –1.7Note: 2002 data are preliminary estimates.This table was produced from the Development Economics central database.* The diamonds show four key indicators in the country (in bold) compared with its income-group average. If data are missing, the diamond will be incomplete.
T u n i s i a a t a G l a n c eA n n e x A . 1
Development Diamond*
Life expectancy
TunisiaLower-middle-income group
Access to improved water source
GNIpercapita
Grossprimary
enrollment
Economic ratios*
Trade
Indebtedness
InvestmentDomesticsavings
TunisiaLower-middle-income group
–10
097 98 99 00 01 02
10
20
GDI GDP
Growth of investment and GDP (%)
–5
0
5
10
15
97 98 99 00 01 02
Exports Imports
Growth of exports and imports (%)
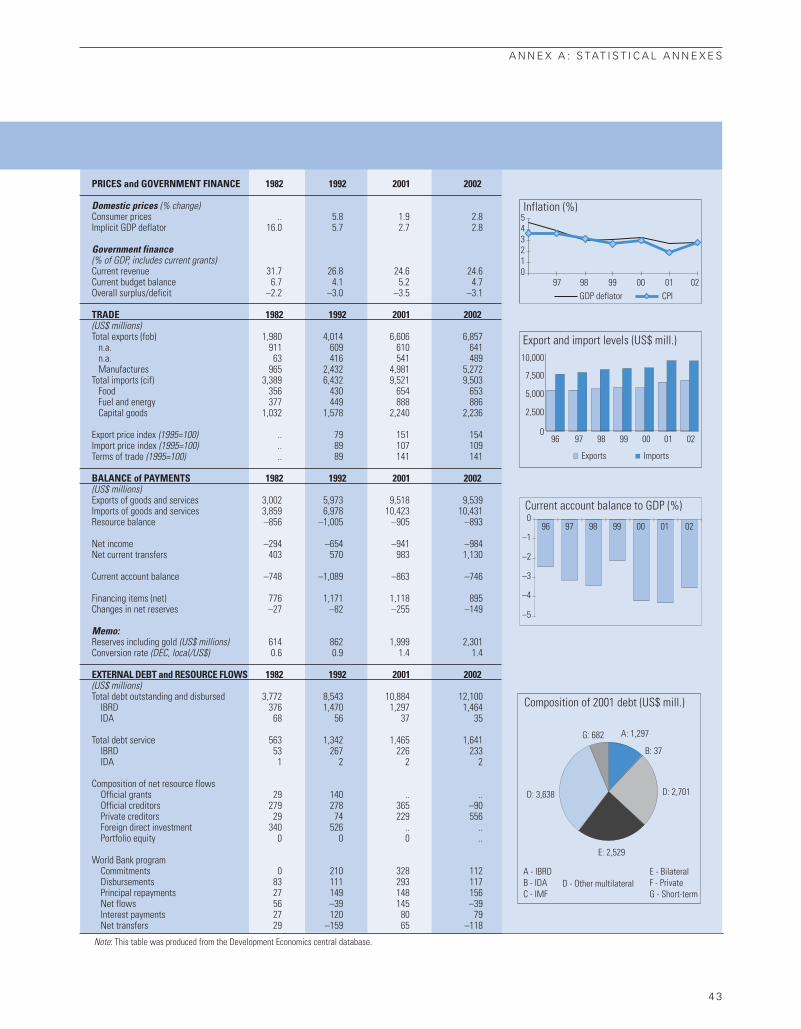
PRICES and GOVERNMENT FINANCE 1982 1992 2001 2002
Domestic prices (% change)Consumer prices .. 5.8 1.9 2.8Implicit GDP deflator 16.0 5.7 2.7 2.8
Government finance(% of GDP, includes current grants)Current revenue 31.7 26.8 24.6 24.6Current budget balance 6.7 4.1 5.2 4.7Overall surplus/deficit –2.2 –3.0 –3.5 –3.1
TRADE 1982 1992 2001 2002(US$ millions)Total exports (fob) 1,980 4,014 6,606 6,857
n.a. 911 609 610 641n.a. 63 416 541 489Manufactures 965 2,432 4,981 5,272
Total imports (cif) 3,389 6,432 9,521 9,503Food 356 430 654 653Fuel and energy 377 449 888 886Capital goods 1,032 1,578 2,240 2,236
Export price index (1995=100) .. 79 151 154Import price index (1995=100) .. 89 107 109Terms of trade (1995=100) .. 89 141 141
BALANCE of PAYMENTS 1982 1992 2001 2002(US$ millions)Exports of goods and services 3,002 5,973 9,518 9,539Imports of goods and services 3,859 6,978 10,423 10,431Resource balance –856 –1,005 –905 –893
Net income –294 –654 –941 –984Net current transfers 403 570 983 1,130
Current account balance –748 –1,089 –863 –746
Financing items (net) 776 1,171 1,118 895Changes in net reserves –27 –82 –255 –149
Memo:Reserves including gold (US$ millions) 614 862 1,999 2,301Conversion rate (DEC, local/US$) 0.6 0.9 1.4 1.4
EXTERNAL DEBT and RESOURCE FLOWS 1982 1992 2001 2002(US$ millions)Total debt outstanding and disbursed 3,772 8,543 10,884 12,100
IBRD 376 1,470 1,297 1,464IDA 68 56 37 35
Total debt service 563 1,342 1,465 1,641IBRD 53 267 226 233IDA 1 2 2 2
Composition of net resource flowsOfficial grants 29 140 .. ..Official creditors 279 278 365 –90Private creditors 29 74 229 556Foreign direct investment 340 526 .. ..Portfolio equity 0 0 0 ..
World Bank programCommitments 0 210 328 112Disbursements 83 111 293 117Principal repayments 27 149 148 156Net flows 56 –39 145 –39Interest payments 27 120 80 79Net transfers 29 –159 65 –118
Note: This table was produced from the Development Economics central database.
A N N E X A : S TAT I S T I C A L A N N E X E S
4 3
012345
97 98 99 00 01 02GDP deflator CPI
Inflation (%)
10,000
7,500
5,000
2,500
09796 98 99 00 01 02
Exports Imports
Export and import levels (US$ mill.)
–5
–4
–3
–2
–1
09796 98 99 00 01 02
Current account balance to GDP (%)
G: 682 A: 1,297
B: 37
D: 2,701
E: 2,529
D: 3,638
A - IBRDB - IDAC - IMF
D - Other multilateralE - BilateralF - PrivateG - Short-term
Composition of 2001 debt (US$ mill.)

R E P U B L I C O F T U N I S I A : C O U N T R Y A S S I S TA N C E E VA L U AT I O N
4 4
Indicator 1990 1991 1992 1993 1994 1995 1996
GDP growth (annual %) 8.0 3.9 7.8 2.2 3.3 2.3 7.1
GNI per capita, Atlas method (current US$) 1,430 1,490 1,700 1,690 1,740 1,820 2,000
GNI per capita, PPP (current international $) 3,770 3,940 4,310 4,400 4,540 4,720 5,030
GDP per capita growth (annual %) 5.4 1.9 5.6 0.2 1.4 0.7 5.5
Agriculture, value added (% of GDP) 15.7 16.7 16.1 14.7 12.6 11.4 13.7
Manufacturing, value added (% of GDP) 16.9 16.9 16.5 17.1 18.3 18.8 18.3
Services, etc., value added (% of GDP) 54.5 54.3 55.4 57.3 58.4 59.6 57.8
Exports of goods and services (% of GDP) 43.6 40.4 39.5 40.4 44.9 44.7 42.1
Imports of goods and services (% of GDP) 50.6 45.3 46.5 48.0 47.9 48.7 43.7
Current account balance (% of GDP) –3.8 –3.6 –7.1 –9.1 –3.4 –4.3 –2.4
Total debt service (% of GNI) 26.7 26.0 21.9 22.9 20.8 18.4 17.8
External debt, total (% of GNI) 64.7 65.7 57.8 63.2 65.2 62.1 59.7
Gross foreign reserves in months of imports 1.6 1.6 1.4 1.4 2.2 2.5 3.1
Current revenue, excluding grants (% of GDP) 30.7 29.0 29.4 30.3 31.3 30.1 29.6
Expenditure, total (% of GDP) 34.6 34.0 32.1 33.1 32.3 32.8 32.6
Gross domestic savings (% of GDP) 25.5 27.1 27.4 21.7 21.5 20.7 23.5
Illiteracy rate, adult total (% of people ages 15 and above) 40.9 39.8 38.7 37.7 36.5 35.3 34.1
Immunization, DPT (% of children under 12 months) 93.0 93.0 95.0 94.0 93.0 94.0 95.0
Improved water source (% of population with access) 80.0 .. .. .. .. .. ..
Improved sanitation facilities (% of population with access) 76.0 .. .. .. .. .. ..
School enrollment, primary (% gross) 113.3 113.7 114.1 116.6 117.2 116.8 116.5
School enrollment, secondary (% gross) 44.9 45.9 48.6 53.2 56.8 60.4 64.6
Population, total (in million) 8.2 8.3 8.5 8.7 8.8 9.0 9.1
Population growth (annual %) 2.4 2.0 2.0 2.0 1.8 1.6 1.5
Urban population (% of total) 57.9 58.7 59.5 60.3 61.1 61.9 62.6
Life expectancy at birth, total (years) 70.3 70.5 70.8 70.8 71.0 71.4 71.6
Fertility rate, total (births per woman) 3.5 .. 3.2 .. 2.9 2.7 2.5
Infant mortality rate (per 1,000 live births) 37.3 35.7 34.2 32.3 31.7 30.5 29.7
School enrollment, primary, male (% gross) 119.6 119.5 119.4 121.6 121.8 120.9 120.1
School enrollment, primary, female (% gross) 106.6 107.5 108.6 111.4 112.4 112.6 112.6
Illiteracy rate, adult male (% of males ages 15 and above) 28.4 27.6 26.7 26.0 25.0 24.0 23.0
Illiteracy rate, adult female (% of females ages 15 and above) 53.5 52.1 50.8 49.4 48.1 46.7 45.3
Source: World Bank database as of March 23, 2003.
T u n i s i a : K e y E c o n o m i c a n d S o c i a l I n d i c a t o r s , 1 9 9 0 – 0 1
T a b l e A . 2 a
ANNEX A.2: KEY BACKGROUND DATA

A N N E X A : S TAT I S T I C A L A N N E X E S
4 5
Average, 1990–2000 Lower-middle-income
1997 1998 1999 2000 2001 Tunisia Algeria Egypt Jordan Morocco MNA countries
5.4 4.8 6.1 4.7 5.4 4.7 2.0 4.6 4.8 4.8 3.0 3.7
2,080 2,050 2,090 2,100 2,070 1,855 1,741 1,086 1,513 1,162 1,876 1,100
5,220 5,350 5,730 6,070 6,450 4,961 4,591 3,039 3,628 3,188 4,595 3,824
4.0 3.4 4.7 3.5 4.2 3.1 0.1 2.6 0.9 0.9 0.9 2.5
13.2 12.5 12.9 12.3 11.8 13.6 11.1 17.3 4.7 16.5 14.0 15.3
18.5 18.4 17.9 18.2 18.1 17.8 10.8 17.8 14.7 17.6 13.1 25.9
58.2 59.2 59.2 58.9 59.4 57.7 35.9 50.5 68.8 51.6 46.2 45.3
43.8 43.0 42.2 44.0 44.2 42.7 28.8 21.2 49.5 27.4 31.8 27.2
46.2 46.3 44.4 47.6 47.8 46.9 24.7 27.8 74.2 32.7 31.6 26.6
–3.1 –3.4 –2.2 –4.2 –4.7 –4.3 3.7 1.3 –4.7 –1.3 .. ..
17.1 16.8 17.3 22.2 .. 20.7 49.4 18.9 22.8 37.3 16.8 15.2
60.7 56.7 60.1 59.7 60.2 61.5 63.9 55.7 142.3 71.6 41.3 36.6
3.1 2.6 3.2 2.6 2.5 2.1 6.8 8.9 4.7 4.6 7.3 6.3
28.7 29.3 28.8 28.6 .. 29.6 29.9 30.7 26.9 28.1 .. 14.8
31.9 31.7 31.6 32.0 .. 32.6 31.1 33.6 32.4 31.1 .. 18.0
24.0 23.6 24.6 23.9 24.5 24.0 32.5 14.6 2.9 17.3 23.3 29.3
32.8 31.5 30.2 29.0 27.9 34.5 39.5 48.4 13.8 55.6 40.2 17.9
96.0 97.0 96.0 .. .. 94.6 78.6 85.7 94.1 89.1 83.3 89.6
.. .. .. .. .. 80.0 94.0 94.5 96.5 78.5 87.0 77.0
.. .. .. .. .. 76.0 73.0 90.5 98.5 68.5 80.3 48.4
120.2 118.5 118.2 .. .. 116.5 106.5 96.8 81.8 80.2 95.6 112.1
68.4 72.9 74.6 .. .. 59.0 62.9 77.2 58.9 37.6 61.7 62.8
9.2 9.3 9.5 9.6 9.7 9.0 28.1 58.8 4.2 26.6 269.9 2043.0
1.4 1.3 1.3 1.1 1.2 1.6 1.9 2.0 3.8 1.8 2.1 1.1
63.4 64.1 64.8 65.5 66.1 62.2 54.6 43.1 76.9 52.3 55.6 42.0
71.9 72.1 72.1 72.1 .. 71.3 69.4 65.2 70.2 65.6 66.0 68.5
2.4 2.2 2.1 2.1 .. 2.6 3.8 3.6 4.4 3.4 4.0 2.3
27.6 26.6 26.2 25.8 .. 30.7 38.6 52.7 27.8 56.8 51.7 37.9
123.8 121.8 121.2 .. .. 121.0 112.9 102.9 81.2 91.2 102.3 113.9
116.5 115.0 115.0 .. .. 111.8 99.8 90.4 82.4 68.7 88.6 110.3
21.9 20.8 19.7 18.6 17.7 23.3 29.1 36.2 6.9 42.1 28.8 11.1
43.8 42.3 40.9 39.4 38.1 45.9 50.0 60.9 21.4 68.9 52.0 24.8
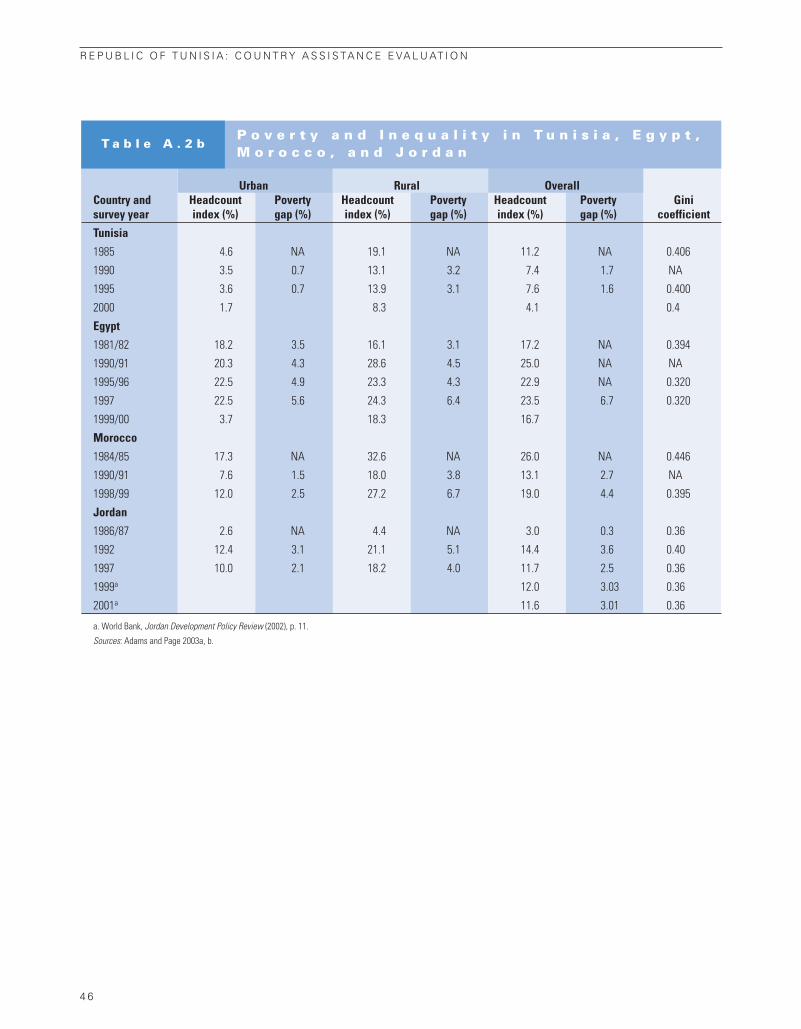
R E P U B L I C O F T U N I S I A : C O U N T R Y A S S I S TA N C E E VA L U AT I O N
4 6
Urban Rural OverallCountry and Headcount Poverty Headcount Poverty Headcount Poverty Gini survey year index (%) gap (%) index (%) gap (%) index (%) gap (%) coefficient
Tunisia
1985 4.6 NA 19.1 NA 11.2 NA 0.406
1990 3.5 0.7 13.1 3.2 7.4 1.7 NA
1995 3.6 0.7 13.9 3.1 7.6 1.6 0.400
2000 1.7 8.3 4.1 0.4
Egypt
1981/82 18.2 3.5 16.1 3.1 17.2 NA 0.394
1990/91 20.3 4.3 28.6 4.5 25.0 NA NA
1995/96 22.5 4.9 23.3 4.3 22.9 NA 0.320
1997 22.5 5.6 24.3 6.4 23.5 6.7 0.320
1999/00 3.7 18.3 16.7
Morocco
1984/85 17.3 NA 32.6 NA 26.0 NA 0.446
1990/91 7.6 1.5 18.0 3.8 13.1 2.7 NA
1998/99 12.0 2.5 27.2 6.7 19.0 4.4 0.395
Jordan
1986/87 2.6 NA 4.4 NA 3.0 0.3 0.36
1992 12.4 3.1 21.1 5.1 14.4 3.6 0.40
1997 10.0 2.1 18.2 4.0 11.7 2.5 0.36
1999a 12.0 3.03 0.36
2001a 11.6 3.01 0.36
a. World Bank, Jordan Development Policy Review (2002), p. 11.
Sources: Adams and Page 2003a, b.
P o v e r t y a n d I n e q u a l i t y i n T u n i s i a , E g y p t ,M o r o c c o , a n d J o r d a n
T a b l e A . 2 b

A N N E X A : S TAT I S T I C A L A N N E X E S
4 7
National Poverty International Lines Poverty Lines
Population Population Population Survey below the Survey below $1.00/ below $2.00/
Country year poverty line (%) year person/day (%) person/day (%)
Algeria 1995 22.6 1995 < 2 15.1
Egypt 1997 23.5 1995 3.1 52.7
Jordan 1997 11.7 1997 < 2 7.4
Morocco 1998/99 19.0 1990/91 < 2 7.5
Tunisia 1995 7.6 1995 < 2 10.0
West Bank & Gaza 1998 23.2 NA NA NA
Yemen 1991/92 19.1 1998 15.7 45.2
Source: Adams and Page (2003).
C o m p a r i n g N a t i o n a l a n d I n t e r n a t i o n a lP o v e r t y L i n e s f o r S e l e c t e d C o u n t r i e s i n M N A R e g i o n
T a b l e A . 2 c
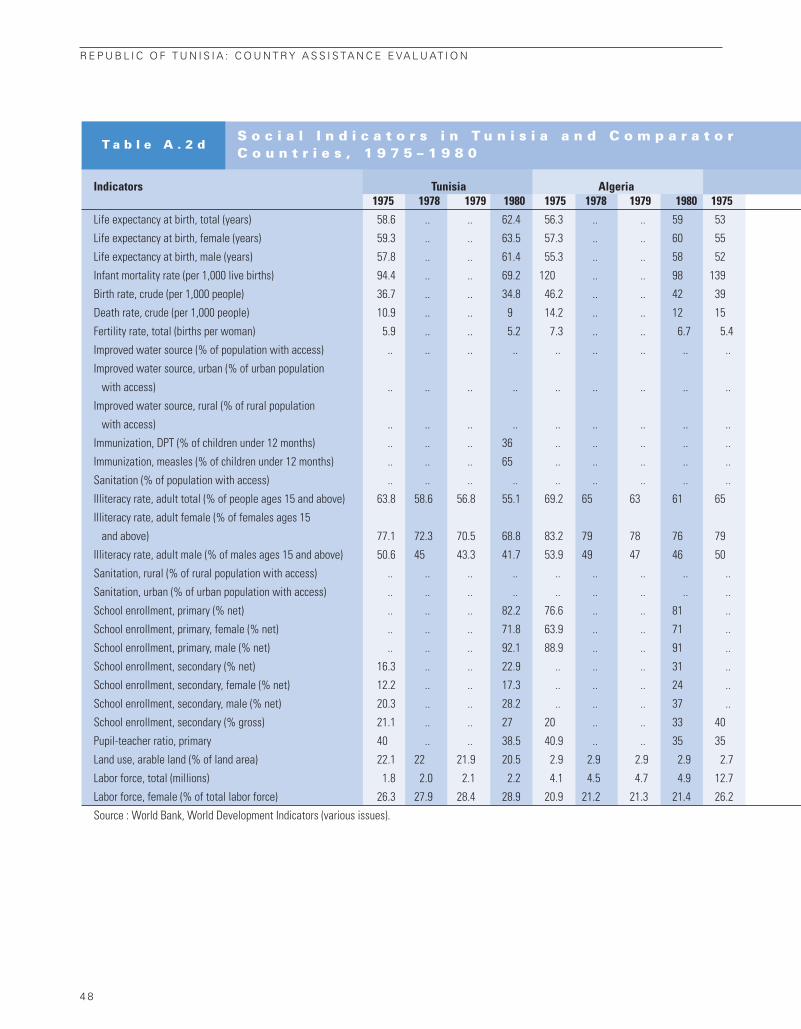
R E P U B L I C O F T U N I S I A : C O U N T R Y A S S I S TA N C E E VA L U AT I O N
4 8
Indicators Tunisia Algeria1975 1978 1979 1980 1975 1978 1979 1980 1975
Life expectancy at birth, total (years) 58.6 .. .. 62.4 56.3 .. .. 59 53
Life expectancy at birth, female (years) 59.3 .. .. 63.5 57.3 .. .. 60 55
Life expectancy at birth, male (years) 57.8 .. .. 61.4 55.3 .. .. 58 52
Infant mortality rate (per 1,000 live births) 94.4 .. .. 69.2 120 .. .. 98 139
Birth rate, crude (per 1,000 people) 36.7 .. .. 34.8 46.2 .. .. 42 39
Death rate, crude (per 1,000 people) 10.9 .. .. 9 14.2 .. .. 12 15
Fertility rate, total (births per woman) 5.9 .. .. 5.2 7.3 .. .. 6.7 5.4
Improved water source (% of population with access) .. .. .. .. .. .. .. .. ..
Improved water source, urban (% of urban population
with access) .. .. .. .. .. .. .. .. ..
Improved water source, rural (% of rural population
with access) .. .. .. .. .. .. .. .. ..
Immunization, DPT (% of children under 12 months) .. .. .. 36 .. .. .. .. ..
Immunization, measles (% of children under 12 months) .. .. .. 65 .. .. .. .. ..
Sanitation (% of population with access) .. .. .. .. .. .. .. .. ..
Illiteracy rate, adult total (% of people ages 15 and above) 63.8 58.6 56.8 55.1 69.2 65 63 61 65
Illiteracy rate, adult female (% of females ages 15
and above) 77.1 72.3 70.5 68.8 83.2 79 78 76 79
Illiteracy rate, adult male (% of males ages 15 and above) 50.6 45 43.3 41.7 53.9 49 47 46 50
Sanitation, rural (% of rural population with access) .. .. .. .. .. .. .. .. ..
Sanitation, urban (% of urban population with access) .. .. .. .. .. .. .. .. ..
School enrollment, primary (% net) .. .. .. 82.2 76.6 .. .. 81 ..
School enrollment, primary, female (% net) .. .. .. 71.8 63.9 .. .. 71 ..
School enrollment, primary, male (% net) .. .. .. 92.1 88.9 .. .. 91 ..
School enrollment, secondary (% net) 16.3 .. .. 22.9 .. .. .. 31 ..
School enrollment, secondary, female (% net) 12.2 .. .. 17.3 .. .. .. 24 ..
School enrollment, secondary, male (% net) 20.3 .. .. 28.2 .. .. .. 37 ..
School enrollment, secondary (% gross) 21.1 .. .. 27 20 .. .. 33 40
Pupil-teacher ratio, primary 40 .. .. 38.5 40.9 .. .. 35 35
Land use, arable land (% of land area) 22.1 22 21.9 20.5 2.9 2.9 2.9 2.9 2.7
Labor force, total (millions) 1.8 2.0 2.1 2.2 4.1 4.5 4.7 4.9 12.7
Labor force, female (% of total labor force) 26.3 27.9 28.4 28.9 20.9 21.2 21.3 21.4 26.2
Source : World Bank, World Development Indicators (various issues).
S o c i a l I n d i c a t o r s i n T u n i s i a a n d C o m p a r a t o r C o u n t r i e s , 1 9 7 5 – 1 9 8 0
T a b l e A . 2 d

A N N E X A : S TAT I S T I C A L A N N E X E S
4 9
Egypt Morocco Jordan MNA1978 1979 1980 1975 1978 1979 1980 1975 1978 1979 1980 1975 1978 1979 1980
.. .. 56 55 .. .. 58 .. .. .. .. 46 .. .. 47.6
.. .. 57 56 .. .. 59.8 .. .. .. .. 47.8 .. .. 49.4
.. .. 54 53 .. .. 56.3 .. .. .. .. 44.4 .. .. 46
.. .. 120 115 .. .. 99.2 48.8 .. .. 40.8 125 .. .. 115
.. .. 39 42 .. .. 38.1 .. .. .. .. 47.6 0 0 46.8
.. .. 13 14 .. .. 12 .. .. .. .. 18.9 0 0 17.5
.. .. 5.1 6.3 .. .. 5.4 7.5 .. .. 6.8 6.6 .. .. 6.6
.. .. .. .. .. .. .. .. .. .. ... .. .. .. ..
.. .. .. .. .. .. .. .. .. .. .. .. .. .. ..
.. .. .. .. .. .. .. .. .. .. .. .. .. .. ..
.. 82 84 .. .. .. .. .. .. .. 30 .. .. .. ..
.. 62 78 .. .. .. .. .. .. .. 29 .. .. .. ..
.. .. .. .. .. .. .. .. .. .. .. .. .. .. ..
62 62 61 76 73 72 71.5 38.6 35.7 56.8 31.6 66.9 63.8 62.8 61.7
77 76 75 88 86 85 84.6 56.2 51.9 70.5 46.1 77.3 74.4 73.3 72.2
48 47 47 62 60 59 58 22.1 20.3 43.3 17.9 56.1 52.8 51.7 50.6
.. .. .. .. .. .. .. .. .. .. .. .. .. .. ..
.. .. .. .. .. .. .. .. .. .. .. .. .. .. ..
.. .. .. 47 .. .. 61.6 78.6 .. .. 73 .. .. .. ..
.. .. .. 35 .. .. 47.4 73.4 .. .. 72.6 .. .. .. ..
.. .. .. 58 .. .. 75.1 83.6 .. .. 73.4 .. .. .. ..
.. .. .. 14 .. .. 20.3 44.2 .. .. 52.8 .. .. .. ..
.. .. .. 10 .. .. 15.7 37.2 .. .. 50.8 .. .. .. ..
.. .. .. 17 .. .. 24.8 50.9 .. .. 54.6 .. .. .. ..
.. .. 51 17 .. .. 26 47.5 .. .. 59.1 9.9 .. .. 15
.. .. .. 42 .. .. 38.2 34.7 .. .. 31.8 .. .. .. ..
2.4 2.3 2.3 16 17 17 16.9 3.3 3.3 21.9 3.4 5.3 5.4 5.4 5.5
13.6 13.9 14.3 6.0 6.6 6.8 7.0 0.5 0.5 0.5 0.5 149.5 161.4 165.7 170.3
26.4 26.4 26.5 32.5 33.1 33.3 33.5 14.1 14.5 14.6 14.7 23.2 23.6 23.7 23.8

R E P U B L I C O F T U N I S I A : C O U N T R Y A S S I S TA N C E E VA L U AT I O N
5 0
Tunisia Algeria1996 1997 1998 1999 2000 2001 1996 1997 1998 1999 2000 2001 1996
Life expectancy at birth, total (years) .. 72 72 72 .. 72 .. 70 .. 71 .. ..
Life expectancy at birth, female (years) .. 74 74 74 .. .. 72 .. 73 .. ..
Life expectancy at birth, male (years) .. 70 71 71 .. .. 69 .. 69 .. ..
Infant mortality rate (per 1,000 live births) 30 28 25 24 .. 37 35 .. 34 .. ..
Birth rate, crude (per 1,000 people) 20 19 18 17 .. .. 27 .. 25 .. ..
Death rate, crude (per 1,000 people) 5.5 5.6 5.6 5.6 .. 6 6.1 .. 5.6 .. ..
Fertility rate, total (births per woman) 2.5 2.4 2.2 2.2 .. .. 3.6 .. 3.4 .. ..
Improved water source (% of population with access) .. .. .. .. .. .. .. .. .. 94 ..
Improved water source, urban (% of urban population
with access) .. .. .. .. .. .. .. .. .. 98 ..
Improved water source, rural (% of rural population
with access) .. .. .. .. .. .. .. .. .. 88 ..
Immunization, DPT (% of children under 12 months) 91 96 96 100 .. 77 79 80 83 .. 91
Immunization, measles (% of children under 12 months) 86 92 94 93 .. 75 74 75 78 .. 92
Sanitation (% of population with access) .. .. .. .. .. .. .. .. .. 73 ..
Illiteracy rate, adult total (% of people ages 15 and above) 34 33 31 30 29 28 37 36 35 33 32 32 48
Illiteracy rate, adult female (% of females ages 15
and above) 45 44 42 41 39 49 47 46 44 43 60
Illiteracy rate, adult male (% of males ages 15 and above) 23 22 21 20 19 18 26 25 24 23 22 23 36
Sanitation, rural (% of rural population with access) .. .. .. .. .. .. .. .. .. 47 ..
Sanitation, urban (% of urban population with access) .. .. .. .. .. .. .. .. .. 90 ..
School enrollment, primary (% net) 98 .. 98 .. .. 94 .. 94 .. .. 93
School enrollment, primary, female (% net) 96 .. 96 .. .. 91 .. 92 .. .. 88
School enrollment, primary, male (% net) 99 .. 99 .. .. 97 .. 96 .. .. 98
School enrollment, secondary (% net) .. .. .. .. .. 56 .. 58 .. .. 68
School enrollment, secondary, female (% net) .. .. .. .. .. 55 .. 59 .. .. 64
School enrollment, secondary, male (% net) .. .. .. .. .. 58 .. 58 .. .. 71
School enrollment, secondary (% gross) 65 64 73 .. .. 63 .. 66 .. .. 75
Pupil-teacher ratio, primary 25 24 25 .. .. 27 27 .. .. .. 27
Land use, arable land (% of land area) 19 19 19 .. .. 3.2 3.2 3.2 .. .. 2.8
Labor force, total (millions) 3.4 3.5 3.6 3.7 3.8 3.9 9 9.3 9.6 9.9 10 11 22
Labor force, female (% of total labor force) 30.7 30.9 31.2 31.4 31.7 31.9 25.1 25.7 26.4 27.0 27.6 28.3 29.0
Source: World Bank, World Development Indicators (various issues).
S o c i a l I n d i c a t o r s F o r T u n i s i a a n d C o m p a r a t o r C o u n t r i e s , 1 9 9 6 – 2 0 0 1
T a b l e A . 2 e

A N N E X A : S TAT I S T I C A L A N N E X E S
5 1
Egypt Jordan Morocco MNA1997 1998 1999 2000 2001 1996 1997 1998 1999 2000 2001 1996 1997 1998 1999 2000 2001 1996 1997 1998 1999 2000 2001
66 .. 67 .. .. 71 .. 71 .. .. 67 .. 67 .. .. 49 .. 68 ..
68 .. 68 .. .. 73 .. 73 .. .. 69 .. 69 .. .. 50 .. 48 ..
65 .. 65 .. .. 69 .. 70 .. .. 65 .. 65 .. .. 47 .. 46 ..
51 .. 47 .. .. 28 .. 26 .. .. 51 .. 48 .. .. 93 .. 43 ..
26 .. 26 .. .. 31 .. 30 .. .. 26 .. 25 .. 0 41 0.1 40 ..
7 .. 6.9 .. .. 4.4 .. 4.2 .. .. 6.8 .. 6.6 .. 0 16 0 16 ..
3.4 .. 3.3 .. .. 3.9 3.8 3.7 .. 3.3 3.1 .. 2.9 .. .. 5.5 .. 3 ..
.. .. .. 95 .. .. .. .. 96 .. .. .. .. 82 .. .. .. .. 89
.. .. .. 96 .. .. .. .. 100 .. .. .. .. 100 .. .. .. .. 82
.. .. .. 94 .. .. .. .. 84 .. .. .. .. 58 .. .. .. .. 41
94 96 95 .. 100 93 91 85 .. 95 95 93 94 .. 53 53 48 59 ..
92 98 96 .. 98 95 86 83 .. 93 92 91 93 .. 54 58 50 57 ..
.. .. .. 94 .. .. .. .. 99 .. .. .. .. 75 .. .. .. .. 55
47 46 45 45 44 13 12 11 11 10 9.8 55 54 53 52 51 50 43 42 41 39 38 34
59 58 57 56 19 18 17 17 16 68 67 66 65 64 52 50 49 47 46
35 35 34 33 33 6.6 6.2 5.8 5.5 5.2 4.6 41 41 40 39 38 37 34 33 32 31 30 24
.. .. .. 91 .. .. .. .. 98 .. .. .. .. 42 .. .. .. .. 41
.. .. .. 98 .. .. .. .. 100 .. .. .. .. 100 .. .. .. .. 81
.. 92 .. .. .. .. 83 .. .. 74 .. 79 .. .. .. .. .. .. ..
.. 89 .. .. .. .. 83 .. .. 65 .. .. .. .. .. .. .. .. ..
.. 95 .. .. .. .. 82 .. .. 83 .. 85 .. .. .. .. .. .. ..
.. .. .. .. .. .. 72 .. .. .. .. .. .. .. .. .. .. .. ..
.. .. .. .. .. .. 75 .. .. .. .. .. .. .. .. .. .. .. ..
.. .. .. .. .. .. 70 .. .. .. .. .. .. .. .. .. .. .. ..
78 81 .. .. 56 57 80 .. .. 39 .. 40 .. .. .. .. .. .. ..
23 24 .. .. 21 21 25 .. .. 28 28 28 .. .. .. .. .. .. ..
2.8 2.8 .. .. 2.8 2.9 2.9 .. .. 20 20 20 .. .. 6.5 6.5 6.5 .. ..
22 23 24 24 25 1.2 1.3 1.3 1.4 1.5 1.5 10 11 11 11 12 12 260 268 275 282 289 290
29.4 29.7 30.1 30.4 30.7 22 23 23 24 25 25 34.6 34.6 34.7 34.7 34.7 34.8 26.2 26.6 26.9 27.3 27.7 28.1
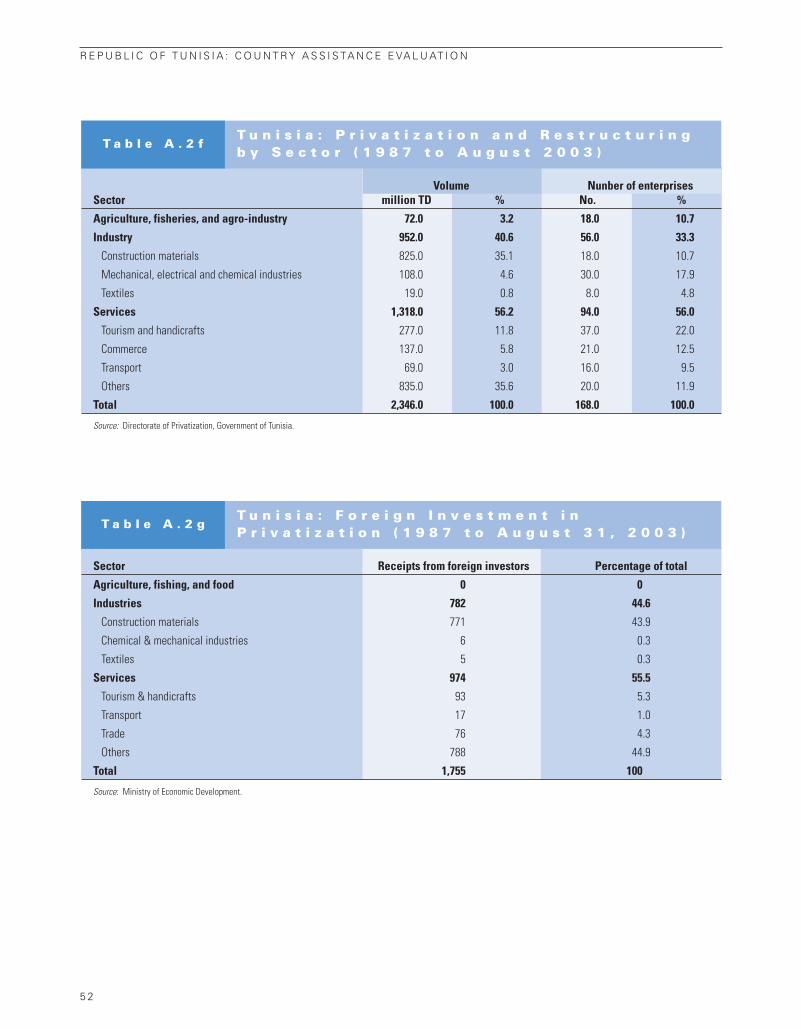
R E P U B L I C O F T U N I S I A : C O U N T R Y A S S I S TA N C E E VA L U AT I O N
5 2
Volume Nunber of enterprisesSector million TD % No. %
Agriculture, fisheries, and agro-industry 72.0 3.2 18.0 10.7
Industry 952.0 40.6 56.0 33.3
Construction materials 825.0 35.1 18.0 10.7
Mechanical, electrical and chemical industries 108.0 4.6 30.0 17.9
Textiles 19.0 0.8 8.0 4.8
Services 1,318.0 56.2 94.0 56.0
Tourism and handicrafts 277.0 11.8 37.0 22.0
Commerce 137.0 5.8 21.0 12.5
Transport 69.0 3.0 16.0 9.5
Others 835.0 35.6 20.0 11.9
Total 2,346.0 100.0 168.0 100.0
Source: Directorate of Privatization, Government of Tunisia.
T u n i s i a : P r i v a t i z a t i o n a n d R e s t r u c t u r i n gb y S e c t o r ( 1 9 8 7 t o A u g u s t 2 0 0 3 )
T a b l e A . 2 f
Sector Receipts from foreign investors Percentage of total
Agriculture, fishing, and food 0 0
Industries 782 44.6
Construction materials 771 43.9
Chemical & mechanical industries 6 0.3
Textiles 5 0.3
Services 974 55.5
Tourism & handicrafts 93 5.3
Transport 17 1.0
Trade 76 4.3
Others 788 44.9
Total 1,755 100
Source: Ministry of Economic Development.
T u n i s i a : F o r e i g n I n v e s t m e n t i n P r i v a t i z a t i o n ( 1 9 8 7 t o A u g u s t 3 1 , 2 0 0 3 )
T a b l e A . 2 g

A N N E X A : S TAT I S T I C A L A N N E X E S
5 3
Sector Receipts, million TD Percentage of total
Agriculture, fishing, and food 24 1
Industries 855 45
Construction materials 798 42
Chemical & mechanical industries 51 3
Textiles 6 0
Services 205 11
Tourism & handicrafts 143 8
Transport 0 0
Trade 62 3
Others 806 43
Total 1,891 100
Source: Ministry of Economic Development.
T u n i s i a : P r i v a t i z a t i o n a n d R e s t r u c t u r i n gb y S e c t o r ( O c t o b e r 1 9 9 8 t o A u g u s t 2 0 0 3 )
T a b l e A . 2 h
Number of enterprises Percentage of total
Full privatization 87 52
Partial privatization 31 18
Liquidation 38 23
Others 10 6
Concession 2 1
Total 168 100
Note: Total Receipts amounted to 2,346 MDT.
Source: Privatization Directorate, Government of Tunisia.
T u n i s i a : P r i v a t i z a t i o n T y p e s ( b e t w e e n 1 9 8 2 a n d A u g u s t 3 1 , 2 0 0 3 )
T a b l e A . 2 i
Privatization proceeds in MDT Percentage of total
Sales of shares 1,239 53
Sales of asset/capital (Vente d’éléments d’actif) 352 15
Concession 756 32
Total 2,346 100
Source: Privatization Directorate, Government of Tunisia.
T u n i s i a : M o d e o f P r i v a t i z a t i o n s ( b e t w e e n 1 9 8 2 a n d A u g u s t 3 1 , 2 0 0 3 )
T a b l e A . 2 j

R E P U B L I C O F T U N I S I A : C O U N T R Y A S S I S TA N C E E VA L U AT I O N
5 4
1985 2000
Algeria 50 64
Egypt, Arab Republic 52 39
Jordan 113 110
Morocco 60 69
Tunisia 70 92
MNA 45 59
Source: World Bank, World Development Indicators, and World Bank , “Jobs, Growth, and Governance in the Middle East and North Africa” (2003).
T r a d e a n d O p e n n e s s : T u n i s i a a n d C o m p a r a t o r C o u n t r i e s
T a b l e A . 2 k
Country 1992–95 2001–02
Algeria 16.1 7.6
Egypt, Arab Rep. 17.1 9.7
Jordan n.a. 11.1
Morocco 47.0 27.9
Tunisia 30.0 27.4
Chile 10.98 7
Korea, Rep. 6.94 5.68
Mauritius 22.64 15.76
Malaysia 4.7 5.17
Thailand 13.18 9.33
Source: World Bank, World Integrated Trade Solutions ( WITS) as of October 2003.
A v e r a g e T a r i f f R a t e s i n S e l e c t e d C o u n t r i e s( w e i g h t e d , % )
T a b l e A . 2 l
MFN tariffs EU-preferential tariffs2000 2001 2002 2000 2001 2002
Average 35.9 35.9 34.5 28.5 25.6 24.3
Agricultural 77.1 77.1 71.6 77.2 76.7 76.6
Non-agricultural 25 25 22.8 16 12.5 10.9
Maximum 220 220 215 n.a. n.a. n.a.
Source: IMF 2003, table 2, page 20.
T u n i s i a : S u m m a r y T a r i f f S t a t i s t i c s , 2 0 0 0 – 0 2
T a b l e A . 2 m

A N N E X A : S TAT I S T I C A L A N N E X E S
5 5
Project/actual costs ($ million except for EQIP)
Sec. ed. Higher ed. Employment & Education & Fifth Ed. EQIP 1 support restructuring training fund training sector Project
Category (2000–05) (1995–02) (1992–02) (1990–97) Loan (1989–97) (1983–90)
School infrastructure 122 150 59 - 114 8.7
Equipment/information and
communications technology 49 - - - 54.7 18
Training/technical assistance/
innovation 11 7.3 15 18.5 2.8 0.5
Management/administration/
systemic improvements 0.3 - 3 2.2 - -
Total 182 157.3 77 20.7 172 27
Note: Costs are projected costs for the EQIP project and actual for the other project.
Source: Internal World Bank data.
C a t e g o r i e s o f I n v e s t m e n t i n F i v e M o s t R e c e n t l y C l o s e d E d u c a t i o n P r o j e c t s a n d i n t h e O n g o i n g Q u a l i t y P r o j e c t ( E Q I P )
T a b l e A . 2 n
A new unified Investment Code, adopted in December 1993 under EFRSL, represented an important improvement over the previous system.
A revised Banking Law and a new regulatory framework for mutual funds were submitted to the Chamber of Deputies in the context of ECAL II.
Overall, the law complied with international standards and represented good progress in ensuring an adequate legal framework for the sector.
An amended Civil and Commercial Procedures Code in 2003 to facilitate the judicial process for recovering loans under ECAL II.
A law prohibiting non-competitive pricing was passed under EFRSL in the early 1990.
T u n i s i a : I n v e s t m e n t , C o m p e t i t i o n , a n dB a n k i n g L a w s
T a b l e A . 2 n

R E P U B L I C O F T U N I S I A : C O U N T R Y A S S I S TA N C E E VA L U AT I O N
5 6
1990 1991 1992 1993 1994 1995 1996 1997 1998 1999 2000 2001
All donors 619.9 333.5 696.5 717.9 694.5 1,510.9 650.7 522.6 499.3 622.1 665.5 729.6
World Bank 103.2 172.8 –35.4 108.6 14.6 –68.4 –3.1 –48.9 –39.3 41.0 –16.9 144.7
IBRD 102.0 172.0 –36.9 101.2 15.3 –64.7 14.6 –45.8 –36.5 43.8 –14.5 146.9
IDA –1.0 –2.0 –1.9 –2.0 –2.1 –2.1 –2.1 –2.1 –2.1 –2.1 –2.1 –2.1
IFC 2.2 2.8 3.4 9.4 1.4 –1.6 –15.6 –0.9 –0.6 –0.6 –0.3 –
World Food Program 13.6 3.4 2.6 3.7 3.7 3.9 2.5 4.0 –0.1 – – –
France 11.0 –101.8 142.6 105.9 105.3 118.8 103.9 65.3 192.1 257.2 35.7 139.5
Germany 23.4 21.6 52.7 50.2 22.8 –16.0 3.5 180.3 –15.0 –69.2 28.9 24.2
Japan 14.8 –263.1 –70.8 10.2 380.2 530.9 284.4 14.8 15.1 45.8 119.5 117.8
Sweden 28.4 32.9 12.6 20.7 9.7 0.2 –7.3 –6.4 0.7 –0.9 4.4 1.5
United Kingdom 15.0 13.8 103.4 1.2 8.4 –1.4 4.3 4.1 43.9 –3.3 50.8 –26.8
United States 24.0 8.0 –1.0 –14.0 –13.0 766.0 2.0 51.0 –5.4 –48.0 4.0 –30.0
Arab Countries 105.0 –3.0 –4.4 –4.5 –15.1 –22.6 –38.3 –20.5 –32.0 –18.4 –11.5 –1.5
Arab agencies 32.0 28.5 46.8 34.1 3.0 –0.8 0.7 0.1 0.5 0.4 –0.4 –1.1
EC/EU 205.4 166.3 582.8 393.1 171.0 164.0 307.8 467.0 424.0 329.6 619.1 333.0
Others 44.4 254.1 –135.4 8.8 4.1 36.4 –9.7 –188.2 –85.2 88.0 –168.1 28.4
Net receipts
Algeria 641 1,968 –1,062 –15 661 548 1876 –391 203 –934 –384 552
Egypt 3,311 4,237 1,661 2,677 3,228 2,441 2,737 2,916 4,119 1,771 3,242 2,800
Jordan 1,087 747 404 118 465 944 846 503 611 511 573 490
Morocco 1,620 1,888 1,182 746 811 617 812 549 895 587 586 377
Source: OECD 2003.
T u n i s i a : N e t R e c e i p t s o f E x t e r n a l F i n a n c i a l R e s o u r c e s ( $ m i l l i o n )
T a b l e A . 3 a
ANNEX A.3: EXTERNAL ASSISTANCE TO TUNISIA
1990 1991 1992 1993 1994 1995 1996 1997 1998 1999 2000 2001 2002 2003
Commitments 147 68 385 144 268 273 99 242 222 194 202 76 253 112
Net disbursements 140 109 58 27 14 10 –57 28 –48 33 –16 28 77 –19
Net transfers 47 –1 –56 –92 –106 –118 –182 –80 –145 –62 –99 –48 –3 –79
Net disbursements
per capita (US$) 17.2 13.1 6.8 3.1 1.6 1.1 –6.3 3.0 –5.2 3.5 –1.7 2.9 7.9 –1.9
T u n i s i a : W o r l d B a n k F l o w s , 1 9 9 0 – 0 3( U S $ m i l l i o n )
T a b l e A . 3 b

A N N E X A : S TAT I S T I C A L A N N E X E S
5 7
1990 1991 1992 1993 1994 1995 1996 1997 1998 1999 2000 2001 2002 2003
Commitments 458 431 215 240 140 331 428 89 150 0 98 42 31 89
Net disbursements 171 95 236 36 9 203 256 –131 –4 –147 –119 –105 –104 –114
Net transfers 95 11 127 –80 –104 77 112 –260 –118 –276 –248 –229 –217 –188
Net disbursements
per capita (US$)** 6.8 3.7 9.0 1.3 0.3 7.2 9.0 –4.5 –0.1 –4.9 –3.9 –3.4 –3.3 –3.6
A l g e r i a : W o r l d B a n k F l o w s , 1 9 9 0 – 0 3 ( U S $ m i l l i o n )
T a b l e A . 3 c
1990 1991 1992 1993 1994 1995 1996 1997 1998 1999 2000 2001 2002 2003
Commitments 62 524 376 338 121 80 172 75 142 550 50 0 50 12
Net disbursements –70 –98 –60 33 –16 –84 –67 –55 29 –51 –38 –57 –48 –26
Net transfers –207 –249 –184 –92 –136 –207 –180 –146 –41 –114 –94 –105 –87 –53
Net disbursements
per capita (US$) –1.3 –1.8 –1.1 0.6 –0.3 –1.5 –1.1 –0.9 0.5 –0.8 –0.6 –0.9 –0.7 –0.4
E g y p t : W o r l d B a n k F l o w s , 1 9 9 0 – 0 3 ( U S $ m i l l i o n )
T a b l e A . 3 d
1990 1991 1992 1993 1994 1995 1996 1997 1998 1999 2000 2001 2002 2003
Commitments 483 626 325 549 412 58 540 108 200 440 8 98 5 4
Net disbursements 189 135 263 58 19 –102 141 –24 –31 113 –227 –130 –218 –197
Net transfers –20 –103 22 –201 –245 –381 –134 –274 –249 –103 –427 –310 –375 –305
Net disbursements
per capita (US$) 7.9 5.5 10.5 2.3 0.7 –3.9 5.3 –0.9 –1.1 4.0 –7.9 –4.5 –7.3 –6.5
M o r o c c o : W o r l d B a n k F l o w s , 1 9 9 0 – 0 3 ( U S $ m i l l i o n )
T a b l e A . 3 e
1990 1991 1992 1993 1994 1995 1996 1997 1998 1999 2000 2001 2002 2003
Commitments 175 25 0 55 100 147 120 140 67 210 35 120 5 120
Net disbursements 78 –17 21 38 22 31 40 109 –7 89 –24 103 –10 99
Net transfers 43 –61 –20 –4 –22 –17 –9 63 –56 41 –75 50 –53 70
Net disbursements
per capita (US$) 24.7 –4.7 5.5 9.8 5.4 7.3 9.2 24.5 –1.5 18.7 –4.9 20.6 –1.9 18.5
* Until April 29, 2003.
** 2002 and 2003 population figures extrapolated using 2001 population growth rate.
Source: World Bank’s data as of April 29, 2003.
J o r d a n : W o r l d B a n k F l o w s , 1 9 9 0 – 0 3 ( U S $ m i l l i o n )
T a b l e A . 3 f

R E P U B L I C O F T U N I S I A : C O U N T R Y A S S I S TA N C E E VA L U AT I O N
5 8
Report Title Report Type* Date Report # Year
1. Tunisia – Country Assistance Strategy CAS 03/28/00 20161 2000
Agriculture
1. From universal food subsidies to a self-targeted program: a case
study in Tunisian reform Pub 12/31/96 WDP351 1996
Economic Policy
1. Morocco, Tunisia – Export growth: determinants and prospects SR 10/31/94 12947 1994
2. Tunisia – Poverty alleviation: preserving progress while preparing
for the future (Vol. 1-2) SR 08/31/95 13993 1995
3. Tunisia – towards the 21st century (Vol. 1-2) ER 10/31/95 14375 1995
4. Logistical constraints on international trade in the Maghreb PRWP 05/31/96 WPS1598 1996
5. From universal food subsidies to a self-targeted program SR 06/30/96 15878 1996
6. Tunisia’s global integration and sustainable development: strategic
choices for 21st century Pub 08/31/96 15966 1996
7. Implementation of Uruguay Round commitments: the
development challenges PRWP 10/31/99 WPS2215 1999
8. Trade policy developments in the Middle East and North Africa Pub 02/29/00 20322 2000
9. Exports and information spillovers PRWP 11/30/00 WPS2474 2000
Education
1. Tunisia – Higher education: challenges and opportunities SR 05/08/97 16522 1997
2. Education in the Middle East and North Africa: a strategy
towards learning for development WP 04/30/99 21589 1999
3. L’Enseignement Superieur Tunisien: Enjeux et Avenir Pub 03/31/98 17493 1998
Energy
1. Tunisia – Inter-fuel substitution study: a joint report ESMAP 05/31/90 ESM114 1990
2. Tunisia – Power efficiency study ESMAP 02/29/92 ESM136 1992
3. Tunisia – Energy management strategy in residential and
tertiary sectors ESMAP 04/30/92 ESM146 1992
4. Increasing the efficiency of gas distribution – Phase 1: case studies
and thematic data sheets ESMAP 07/31/99 ESM218 1999
Environment
1. The greening of the economic policy reform (Vol. 1-2) EWP 02/28/97 16339 1997
Finance
1. External finance in the Middle East – trends and prospects DWP 12/31/93 20956 1993
2. Making micro finance work in the Middle East and North Africa WP 12/31/98 23076 1998
Health
1. How access to contraception affects fertility and contraceptive
use in Tunisia PRWP 01/31/92 WPS841 1992
2. Towards a virtuous circle: nutrition review of MNA DWP 08/31/99 20960 1999
3. Risks and macroeconomic impact of HIV/AIDS in the Middle East
and North Africa: why waiting to intervene can be costly PRWP 08/31/02 WPS2874 2002
S e l e c t e d E S W a n d C A S L i s t f o r T u n i s i a A n n e x A . 4

A N N E X A : S TAT I S T I C A L A N N E X E S
5 9
S e l e c t e d E S W a n d C A S L i s t f o r T u n i s i a ( c o n t i n u e d )
A n n e x A . 4
Report Title Report Type* Date Report # Year
Multisector
1. The World Bank research oberver Pub 02/28/98 17258 1998
Others
1. Strengthening Tunisian municipalities to foster local urban development OEDRP 01/01/01 24568 2001
3. The World Bank in action: stories of development WP 01/01/02 24928 2002
3. Initiative in legal and judicial reform WP 03/31/02 25082 2002
Social Protection and Poverty Analysis
1. Options for pension reforms in Tunisia PRWP 07/31/93 WPS1154 1993
2. Tunisia’s insurance sector PRWP 05/31/95 WPS1451 1995
3. Tunisia – Social Structure review 2000: integrating into the world
economy and sustaining economic and social progress WP 06/30/00 20976 2000
Private Sector Development
1. Privatization in Tunisia DWP 01/31/93 11645 1993
2. Tunisia – Private sector assessment SR 11/30/94 12945 1994
3. Tunisia – Private sector assessment update - meeting the challenge
of globalization (Vol.1-3) SR 12/14/00 20173 2000
4. Is inequality bad for business: a non-linear microeconomic model
wealth effects on self-employment PRWP 01/31/01 WPS2527 2001
Public Sector Management
1. Partners for development: new roles for government and private
sector in the Middle East and North Africa Pub 09/30/99 19807 1999
Transportation
1. Optimal user charges and cost recovery for roads in
developing countries PRWP 10/31/91 WPS780 1991
Urban Development
1. The urban age – innovations in urban management 3 (4) Newsletter 01/31/96 17449 1996
Water Supply and Sanitation
1. Water pricing experiences: an international perspective Pub 10/31/97 WTP386 1997
Abbreviations:
CAS: Country Assistance Strategy
DWP: Departmental Working Paper
ER : Economic Report
ESMAP: Working Paper, Economic & Social Council for Asia & Pacific
EWP: Environmental Working Paper
IDP: Internal Discussion Paper
OEDAR: OED Annual Report/Review
PRWP: Policy Research Working Paper
Pub: Publication
SR: Sector Report
Source: Imagebank, Word Bank. These documents can be accessed at World Development Sources at www-wds.worldbank.org.

R E P U B L I C O F T U N I S I A : C O U N T R Y A S S I S TA N C E E VA L U AT I O N
6 0
ANNEX A.5: EVALUATION RATINGS
Inst. developmento/w: Outcome Sustainability* impact*
Total Adjustment % % % % % % Sub-Country evaluated ($m) Satisf Satisf. adj. Likely Likely adj Substan. stan. adj
before 1990
Tunisia 2,180 533 91 100 73 72 20 29
MNA 14,282 1,897 76 87 48 45 30 59
Algeria 2,056 .. 48 .. 7 .. 1 ..
Egypt 3,130 70 83 0 56 0 19 0
Jordan 753 .. 77 0 51 .. 31 ..
Morocco 4,177 1,256 81 88 52 38 51 76
Bankwide 186,355 29,568 71 68 53 55 33 34
*The Institutional Development Impact and Sustainability ratings have been in use only since FY98. Hence, the data for these two ratings for the period before FY 91 apply for smaller
levels of total net commitment than shown in columns 2 and 3 of the tab.
Source: OED internal database as of May 1, 2003.
R a t i n g s f o r T u n i s i a a n d C o m p a r a t o r C o u n t r i e s
T a b l e A . 5 a
Satisfactory Likely sustainability Substantial ID Net outcome (%) (%) (%)
commit- O/w Net O/w Net O/w Net O/w ment Adjustment commit- Adjust- commit- Adjust- commit- Adjust-
Country (US$M) (US$M) ment ment ment ment ment ment
Tunisia 2,367 967 81.8 86.5 83.8 100 41 17
MNA 15,974 5,276 71.1 72.1 52.1 56.5 35 41
Algeria 3,253 1,099 45.8 41 7.2 0 21 27
Egypt 2,025 150 83.2 100 39.5 0 34 100
Jordan 1,534 870 93.6 100 79.5 90.8 49 63
Morocco 4,736 1984 67.2 67.6 38 46 58.9 51.4
Bankwide 251,234 87,978 75.9 76.9 65.5 71.9 43 44
Note: Sustainability and institutional development impact ratings have been in use only since FY98.
Source: OED internal data.
O E D E v a l u a t i o n F i n d i n g s o f E v a l u a t e d P r o j e c t s ( E x i t s F Y 9 0 – 0 3 )

A N N E X A : S TAT I S T I C A L A N N E X E S
6 1
Country No. of projects Net commit. ($m) Projects at risk (%) Commitments at risk (%)
Tunisia 18 1,168 11 6
MNA 110 4,801 25 28
Algeria 13 566 38 52
Egypt 16 905 25 40
Jordan 6 192 17 18
Morocco 15 418 13 25
Bankwide 1,376 95,489 18 18
Source: World Bank data as of May 2003.
R a t i n g s f o r t h e A c t i v e P o r t f o l i o f o rT u n i s i a a n d C o m p a r a t o r C o u n t r i e s
T a b l e A . 5 b

R E P U B L I C O F T U N I S I A : C O U N T R Y A S S I S TA N C E E VA L U AT I O N
6 2
Approval Exit LendingFY FY Project ID Project name instrument type
Agriculture
1967 1974 P005595 Cooperative farm project Investment
1972 1977 P005607 Agricultural credit project Investment
1972 1980 P005608 Fisheries project Investment
1975 1983 P005616 Irrigation rehabilitation project Investment
1977 1982 P005622 Second agricultural credit project Investment
1977 1984 P005623 Sidi Salem multipurpose project Investment
1979 1987 P005629 Second fisheries project Investment
1980 1987 P005633 Third agricultural credit project Investment
1980 1987 P005633 Southern irrigation project Investment
1997 2004 P005736 TN- Natural Resource Management Investment
2000 2006 P035707 TN- Water Sector Investment Project Investment
2001 2007 P005750 TN- Agriculture Support Services Investment
Economic Policy
1987 FY90 P005688 Industry & Trade Policy Adj. Adjustment
1988 FY91 P005718 SAL I Adjustment
1992 FY95 P005742 Econ. & Fin. Reform SU Adjustment
Education
1967 1976 P005596 Second education project Investment
1976 1983 P005620 Third education project Investment
1981 1989 P005640 Fourth education project Investment
1983 FY90 P005650 Education V Investment
1989 FY97 P005715 Edu. & Training Sector Investment
1992 FY02 P005726 Higher Education Restructuring Investment
1995 FY02 P005743 Secondary Education Investment
1998 12/31/2003 P005741 TN-Higher Education Reform Support I Investment
2000 6/30/2005 P050945 TN- Education PAQSET 1 Investment
Electric Power & Other Energy
1972 1977 P005610 Power project Investment
1977 1981 P005625 Second power project Investment
1981 1986 P005643 Third power project Investment
Energy and Mining
1984 FY91 P005656 Mining Technical Assistance Investment
1984 FY91 P005657 Power IV Investment
1985 FY93 P005662 Elec. & Mec. Ind. II Investment
1987 FY94 P005701 Energy Conservation Demonstr Investment
1988 FY95 P005667 SMI - II Investment
1989 FY94 P005729 Petroleum Explor. Pr. Investment
1992 FY97 P005735 Gas Infrastructure Investment
A l l A p p r o v e d T u n i s i a P r o j e c t s , E v a l u a t e d a n d O n g o i n g a s o f D e c e m b e r 1 8 , 2 0 0 2
T a b l e A . 5 c

A N N E X A : S TAT I S T I C A L A N N E X E S
6 3
Commitment Eval Latest Latest Latest risk ($m) Outcome ID Sustainability APPI type DO IP rating
18 Unsat NR NR PAR
8 Sat NR NR PAR
2 Sat NR NR PAR
12.2 Sat NR NR PCR
12 Sat NR NR PAR
42 Sat NR NR PAR
28.5 Sat Sub Likely PCR
30 Sat Modest Likely PAR
25 Sat NR NR PCR
26.5 Sat Sat Modest
103.3 Sat Sat Modest
21.3 Sat Sat Sub
150 Sat Modest Likely 7.25 PAR
150 Sat Sub Likely 8.25 PAR
250 Sat Modest Likely 7.25 PAR Sat Sat Sub
13 Sat NR NR PAR
8.9 Sat NR NR PAR
26 Sat Modest Likely PAR
27 Unsat Neg Uncertain 4 PCR
95 Sat Modest Likely 7.25 PAR
68.7 Sat Subs Likely 8.25 ES Sat Sat Modest
91.3 Sat Sub Likely 8.25 ES Sat Sat Neg
80.0 Sat Sat Modest
99.0 Sat Sat Sub
12 Sat NR NR PAR
14.5 Sat NR NR PCR
41.5 Sat NR NR PCR
13.4 Sat Sub Likely 8.25 PCR
38.7 Mod. Sat Neg Likely 6 PCR
54 Unsat Modest Unlikely 4.25 PAR
4 Unsat Modest Likely 5 PAR
28 Unsat Neg Unlikely 3.75 EVM
5.5 Sat Modest Uncertain 6.75 EVM
60 Sat Modest Likely 7.25 ES Sat Sat Modest
(Table continues on the following page.)
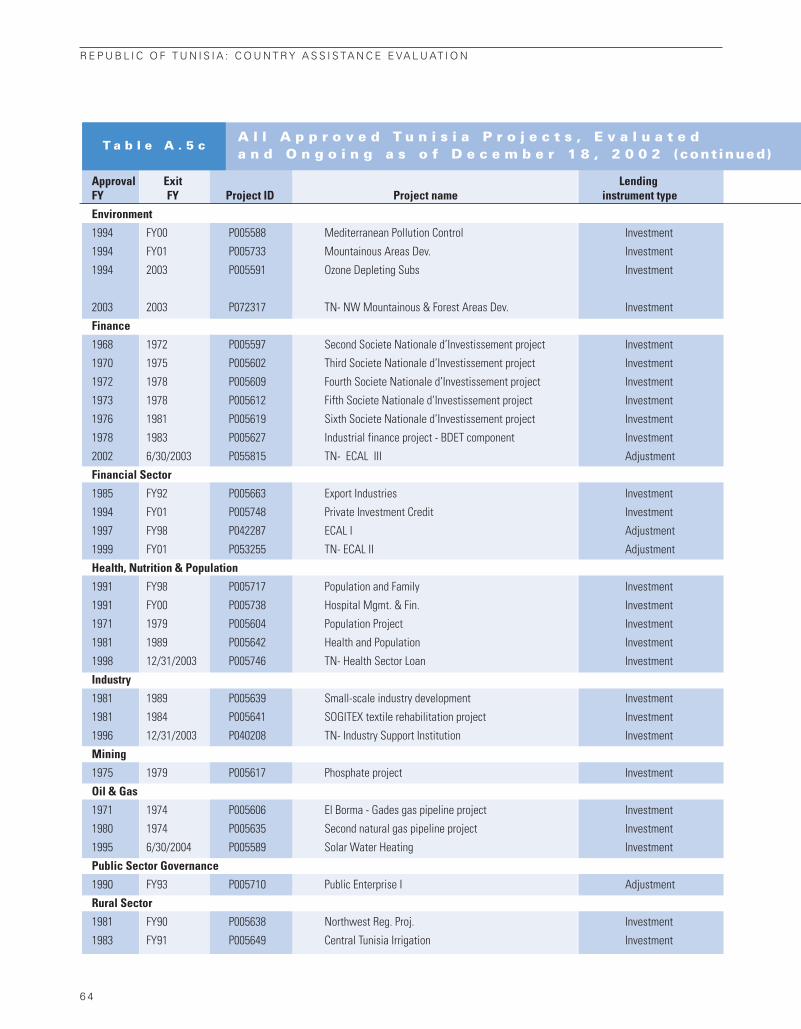
R E P U B L I C O F T U N I S I A : C O U N T R Y A S S I S TA N C E E VA L U AT I O N
6 4
A l l A p p r o v e d T u n i s i a P r o j e c t s , E v a l u a t e d a n d O n g o i n g a s o f D e c e m b e r 1 8 , 2 0 0 2 (cont inued)
T a b l e A . 5 c
Approval Exit LendingFY FY Project ID Project name instrument type
Environment
1994 FY00 P005588 Mediterranean Pollution Control Investment
1994 FY01 P005733 Mountainous Areas Dev. Investment
1994 2003 P005591 Ozone Depleting Subs Investment
2003 2003 P072317 TN- NW Mountainous & Forest Areas Dev. Investment
Finance
1968 1972 P005597 Second Societe Nationale d’Investissement project Investment
1970 1975 P005602 Third Societe Nationale d’Investissement project Investment
1972 1978 P005609 Fourth Societe Nationale d’Investissement project Investment
1973 1978 P005612 Fifth Societe Nationale d’Investissement project Investment
1976 1981 P005619 Sixth Societe Nationale d’Investissement project Investment
1978 1983 P005627 Industrial finance project - BDET component Investment
2002 6/30/2003 P055815 TN- ECAL III Adjustment
Financial Sector
1985 FY92 P005663 Export Industries Investment
1994 FY01 P005748 Private Investment Credit Investment
1997 FY98 P042287 ECAL I Adjustment
1999 FY01 P053255 TN- ECAL II Adjustment
Health, Nutrition & Population
1991 FY98 P005717 Population and Family Investment
1991 FY00 P005738 Hospital Mgmt. & Fin. Investment
1971 1979 P005604 Population Project Investment
1981 1989 P005642 Health and Population Investment
1998 12/31/2003 P005746 TN- Health Sector Loan Investment
Industry
1981 1989 P005639 Small-scale industry development Investment
1981 1984 P005641 SOGITEX textile rehabilitation project Investment
1996 12/31/2003 P040208 TN- Industry Support Institution Investment
Mining
1975 1979 P005617 Phosphate project Investment
Oil & Gas
1971 1974 P005606 El Borma - Gades gas pipeline project Investment
1980 1974 P005635 Second natural gas pipeline project Investment
1995 6/30/2004 P005589 Solar Water Heating Investment
Public Sector Governance
1990 FY93 P005710 Public Enterprise I Adjustment
Rural Sector
1981 FY90 P005638 Northwest Reg. Proj. Investment
1983 FY91 P005649 Central Tunisia Irrigation Investment

A N N E X A : S TAT I S T I C A L A N N E X E S
6 5
Commitment Eval Latest Latest Latest risk ($m) Outcome ID Sustainability APPI type DO IP rating
0 Sat Sub Likely 8.25 ES H Sat. H Sat. Neg
26.4 Mod Sat Subs Likely 7.5 ES Sat Sat Modest
3.8 Sat Sat Low or
Neg.
34 Sat Sat Sub
10 Sat NR NR PAR
10 Sat NR NR PAR
10 Sat NR NR PAR
14 Sat NR NR PAR
20 Sat NR NR PAR
30 Sat NR NR PAR
252.5 Sat Sat Sub
50 Mod. Sat Modest Likely 5.75 PAR
118.8 Sat Sub Likely 8.25 ES Sat Sat Neg
69.9 Sat NR Likely ES Sat Sat Modest
134 Sat Modest Likely 7.25 ES Sat Sat Neg
26 Highly Sat Sub Likely 10 ES H Sat. H. Sat Neg
29.7 Sat Sub Likely 8.25 ES
9.6 Unsat NR NR PAR
12.5 Sat Sub Likely PAR
50.0 Sat Sat Modest
30 Sat Modest Likely PCR
18.6 Sat NR NR PAR
38.7 Sat Sat Modest
23.3 Sat NR NR PCR
7.5 Sat NR NR PAR
37 Sat Modest Likely PAR
7.4 Sat Sat Modest
130 Mod Unsat Modest Likely 5.75 PAR
24 Unsat Sub Unlikely 5.25 PAR
16.5 Sat Sub Likely 8.25 PCR
(Table continues on the following page.)

R E P U B L I C O F T U N I S I A : C O U N T R Y A S S I S TA N C E E VA L U AT I O N
6 6
A l l A p p r o v e d T u n i s i a P r o j e c t s , E v a l u a t e d a n d O n g o i n g a s o f D e c e m b e r 1 8 , 2 0 0 2 (cont inued)
T a b l e A . 5 c
Approval Exit LendingFY FY Project ID Project name instrument type
Rural Sector (continued)
1985 FY92 P005660 NW Agri. Production Investment
1985 FY95 P005661 NATL. IRR. MGMT. IMP Investment
1986 FY94 P005665 Gabes Irrigation Investment
1988 FY96 P005683 Forestry Investment
1988 FY92 P005703 AG.CR.BNT IV Investment
1989 FY95 P005692 ASAL II Adjustment
1990 FY97 P005727 Research and Extension Investment
1993 FY01 P005725 Second Forestry Deve. Investment
1994 FY01 P005721 Agriculture Sec. Inv. Investment
1995 FY01 P005720 Rural Finance Investment
Transport
1982 FY92 P005647 Highways V Investment
1984 FY93 P005658 Urban Transport II Investment
1988 FY95 P005672 Highway Maint. & Re. Investment
1969 1975 P005599 Second port project Investment
1969 1976 P005600 Railway project Investment
1971 1977 P005605 Highway project Investment
1974 1980 P005614 Tunis district urban planning and public transport proj Investment
1976 1983 P005621 Second highway project Investment
1978 1986 P005628 Rural roads project Investment
1980 1988 P005636 Fourth highway project Investment
1980 1989 P005637 Third ports project Investment
1998 12/31/2004 P043700 TN- Transport Sector Investment Investment
2001 6/30/2006 P064082 TN- Transport Sector Investment Investment
Urban Development
1972 1981 P005611 Tourism infrastructure project Investment
1974 1981 P005613 Hotel training project Investment
1979 1986 P005630 Second urban development project Investment
1983 FY93 P005652 Urban Dev. III Investment
1987 FY95 P005668 Urban IV Investment
1989 FY97 P005691 Fifth Urban Investment
1993 FY99 P005687 Municipal Sec. Inv. Investment
1997 6/30/2003 P046832 TN- Municipal Development II Investment
2001 6/30/2007 P048825 TN- Cultural Heritage Investment
2003 2/28/2003 P074398 TN- Municipal Development III Project Investment
Water Supply and Sanitation
1969 1977 P005601 National water supply project Investment
1970 1977 P005603 Second water supply project Investment

A N N E X A : S TAT I S T I C A L A N N E X E S
6 7
Commitment Eval Latest Latest Latest risk ($m) Outcome ID Sustainability APPI type DO IP rating
15 Unsat Negl Unlikely 3.75 PCR
22 Mod. Sat Modest Likely 5.75 EVM
27.7 Sat Sub Likely 8.25 PCR
20 Sat Modest Uncertain 6.75 EVM
30 Sat Sub Uncertain 7.75 PAR
84 Sat Modest Likely 7.25 EVM
17 Mod. Sat Modest Uncertain 6 ES
61.7 Sat High Likely 8.25 ES
118.5 Sat Sub Highly Likely 8.25 ES
65 Unsat Modest Unlikely 4.25 ES
35.5 Sat Modest Likely 7.25 PAR
33 Sat Modest Likely 7.25 PCR
63 Sat Modest Likely 7.25 EVM
8.5 Sat NR NR PAR
17 Sat NR NR PAR
24 Sat NR NR PAR
18 Unsat NR NR PCR
28 Sat NR NR PCR
32 Sat NR NR PAR
36.5 Sat Sub Likely PCR
42.5 Sat Modest Likely PCR
50.0 Sat Sat Modest
37.6 Sat Sat Modest
24 Sat NR NR PCR
5.6 Sat NR NR PCR
19 Sat NR NR PAR
25 Sat Modest Uncertain 6.75 PAR
30.2 Unsat Neg Uncertain 4 EVM
58 Mod. Sat Modest Likely 5.75 EVM
75 Sat Sub Likely 8.25 PAR
80 Sat Sat Modest
17 Sat Sat Modest
78.4 Sat Sat Sub
15 Sat NR NR PAR
10.5 Sat NR NR PAR
(Table continues on the following page.)

R E P U B L I C O F T U N I S I A : C O U N T R Y A S S I S TA N C E E VA L U AT I O N
6 8
A l l A p p r o v e d T u n i s i a P r o j e c t s , E v a l u a t e d a n d O n g o i n g a s o f D e c e m b e r 1 8 , 2 0 0 2 (cont inued)
T a b l e A . 5 c
Approval Exit LendingFY FY Project ID Project name instrument type
Water Supply and Sanitation (continued)
1974 1980 P005615 Third water supply project Investment
1975 1983 P005618 Urban sewerage project Investment
1977 1984 P005626 Fourth water supply project Investment
1979 1988 P005631 Second urban sewerage project Investment
1979 1984 P005632 Fifth water supply project Investment
1983 FY93 P005653 Urban Sewerage III Investment
1984 FY93 P005659 Rural Water Supply Investment
1995 6/30/2003 P005680 TN-Water Supply and Sewerage Investment
1997 12/31/2004 P005731 TN- Greater Tunis Sewerage Investment
Social Protection
1991 FY95 P005734 Employment & Training Investment
1996 6/30/2003 P005745 TN- 2nd Employment and Training Investment
2002 8/31/2008 P048315 TN- Protected Areas Management Project Investment
Multisector
1999 3/31/2004 P055814 TN- Export Development Investment
Source: OED internal database.

A N N E X A : S TAT I S T I C A L A N N E X E S
6 9
Commitment Eval Latest Latest Latest risk ($m) Outcome ID Sustainability APPI type DO IP rating
23 Sat NR NR PAR
28 Sat NR NR PCR
21 Sati NR NR PCR
26.5 Sat NR Likely PAR
25 Sat NR NR PCR
34 Sat Sub Likely 8.25 PCR
50 Sat Sub Likely 8.25 PCR
58.0 Sat Sat Modest
60.0 Unsat. Unsat. Sub
12 Sat Sub Uncertain 7.75 PAR
60.0
5.6
35.0 Sat Sat Modes

R E P U B L I C O F T U N I S I A : C O U N T R Y A S S I S TA N C E E VA L U AT I O N
7 0
Lending completion Supervision ESW completion Regions/countries costs, $m costs, $m costs, $m Total costs, $m
Bankwide 757.7 897.9 415 2,292
MNA 58.2 64.6 38 178
Tunisia 9.8 9.3 4 24
Algeria 5.8 8.1 3 21
Egypt 9.3 10.1 5 29
Jordan 7.8 6.2 3 19
Morocco 13.5 13.3 8 39
Percentages
Bankwide 33% 39% 18% 90%
MNA 33% 36% 21% 91%
Tunisia 40% 38% 16% 95%
Algeria 28% 40% 17% 84%
Egypt 33% 35% 16% 100%
Jordan 42% 34% 15% 91%
Morocco 35% 34% 20% 89%
C o s t s T a b l e A . 6 a
ANNEX A.6: COST OF BANK PROGRAMS FOR TUNISIA AND COMPARATOR COUNTRIES

A N N E X A : S TAT I S T I C A L A N N E X E S
7 1
Net
N
et c
omm
itmen
t Av
erag
e co
sts
com
mit-
for s
atis
fact
ory
Aver
age
Aver
age
cost
s($
s pe
r $1,
000
of n
et
Tota
l N
umbe
r m
ents
,&
non
-ris
ky
Aver
age
cost
s ($
s p
er $
1,00
0 co
mm
itmen
t for
co
sts,
of
($
pr
ojec
ts
proj
ect s
ize
per p
roje
ct
of n
et
satis
fact
ory
&
Regi
ons/
coun
trie
s$m
proj
ects
m
illio
n)($
mill
ion)
($
mill
ion)
($1,
000)
co
mm
itmen
t)no
n-ri
sky
proj
ects
)
Bank
wid
e2,
292
2,22
919
7,10
314
4,12
088
1,02
8 12
16
MN
A17
8 16
911
,773
8,49
070
1,05
0 15
21
Tuni
sia
24
271,
888
1,81
070
900
1313
Alge
ria21
19
1,96
71,
218
104
1,07
9 10
17
Egyp
t29
26
1,94
51,
483
751,
100
1519
Jord
an19
19
864
724
4597
4 21
26
Mor
occo
39
342,
699
1,57
079
1,13
8 14
25
*
The
am
ount
of t
otal
cos
ts in
clud
es le
ndin
g co
mpl
etio
n co
sts,
sup
ervi
sion
, sch
edul
ed a
nd u
nsch
edul
ed E
SW, a
nd d
ropp
ed p
roje
ct c
osts
.
**
The
amou
nt o
f len
ding
com
plet
ion
cost
s in
clud
es le
ndin
g co
mpl
etio
n co
sts
and
dro
pped
pro
ject
cos
ts.
***
The
amou
nt o
f ESW
pre
para
tion
cost
s in
clud
es u
nsch
edul
ed a
nd s
ched
uled
ESW
pre
para
tion
cost
s.
Sour
ce:
Wor
ld b
ank
data
base
.
Ef
fi
ci
en
cy
Ta
bl
e
A.
6b

R E P U B L I C O F T U N I S I A : C O U N T R Y A S S I S TA N C E E VA L U AT I O N
7 2
InstrumentsObjectives AAA Lending
• Keep inflation under control Private Sector Assessment Update (FY 01); ECAL I, II, III ($486m); Export Development
Social and Structural Review (FY 00); ($35m); Transport Sector Investment I and II
• Maintain viable financial balances Strategy for Public Debt Management ($87.6m and $50m); Private Investment Credit
(FY 02); Export Growth: Determinants and Project ($120m); Industry Support Institutions
• Increase international reserves Prospects (FY95); Private Sector Assessment Upgrading Project ($38.7m); ($60m) Economic
(FY95); Towards the 21st Century (FY96) and Financial Reforms Support Loan Project
• Sustained growth of real GDP ($130m); Public Enterprise Reform Loan
Project ($130m)
• Strengthening private investment
• Improve financial sector
• Promote trade and openness
* The early 1990s country strategy was not a stand-alone document as it was embedded in a loan document; it did not develop quantitative performance indicators for monitoring results.
**The ratio for Algeria is 21%, Egypt 17%, and Morocco 23%..
***World Development Indicators (Nov. 3, 2003), the ratio for Algeria is 0.3%, Egypt 0.5%, and Morocco 0.2%.
Source: Internal Bank data.
1 9 9 6 a n d 2 0 0 0 C o u n t r y S t r a t e g y O b j e c t i v e s a n d K e y M a c r o e c o n o m i c a n d S t r u c t u r a l R e f o r m P e r f o r m a n c e I n d i c a t o r s *
T a b l e A . 7 a
ANNEX A.7: COUNTRY STRATEGY OBJECTIVES AND KEY INDICATORS
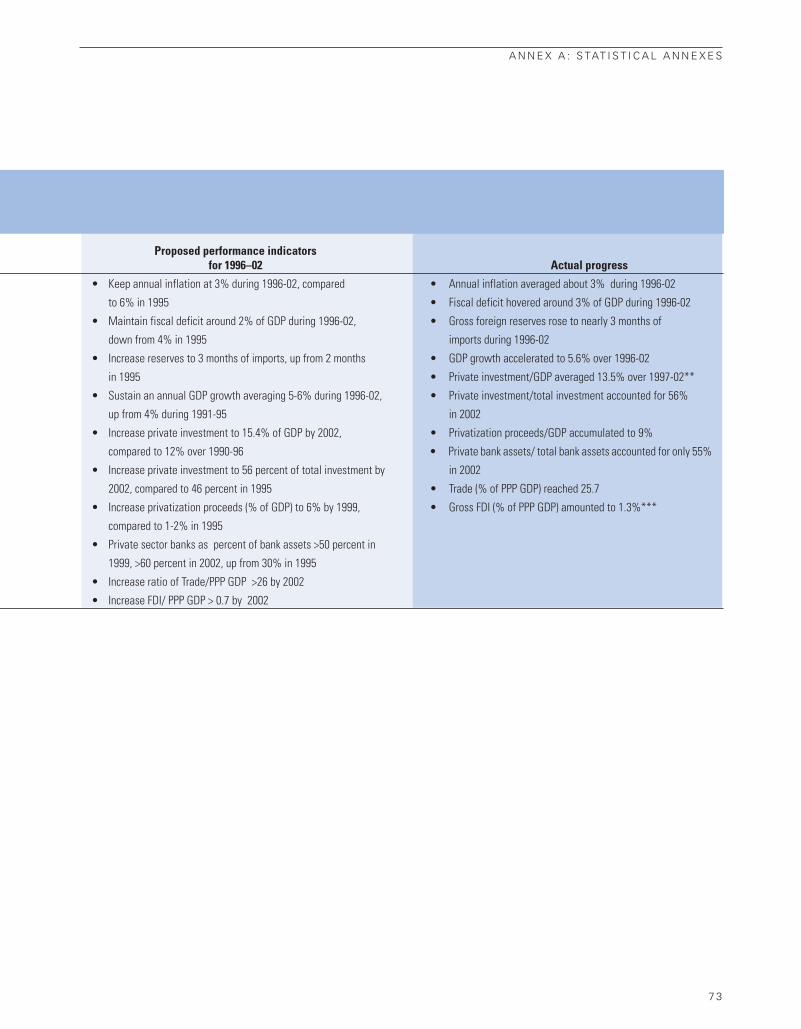
A N N E X A : S TAT I S T I C A L A N N E X E S
7 3
Proposed performance indicatorsfor 1996–02 Actual progress
• Keep annual inflation at 3% during 1996-02, compared • Annual inflation averaged about 3% during 1996-02
to 6% in 1995 • Fiscal deficit hovered around 3% of GDP during 1996-02
• Maintain fiscal deficit around 2% of GDP during 1996-02, • Gross foreign reserves rose to nearly 3 months of
down from 4% in 1995 imports during 1996-02
• Increase reserves to 3 months of imports, up from 2 months • GDP growth accelerated to 5.6% over 1996-02
in 1995 • Private investment/GDP averaged 13.5% over 1997-02**
• Sustain an annual GDP growth averaging 5-6% during 1996-02, • Private investment/total investment accounted for 56%
up from 4% during 1991-95 in 2002
• Increase private investment to 15.4% of GDP by 2002, • Privatization proceeds/GDP accumulated to 9%
compared to 12% over 1990-96 • Private bank assets/ total bank assets accounted for only 55%
• Increase private investment to 56 percent of total investment by in 2002
2002, compared to 46 percent in 1995 • Trade (% of PPP GDP) reached 25.7
• Increase privatization proceeds (% of GDP) to 6% by 1999, • Gross FDI (% of PPP GDP) amounted to 1.3%***
compared to 1-2% in 1995
• Private sector banks as percent of bank assets >50 percent in
1999, >60 percent in 2002, up from 30% in 1995
• Increase ratio of Trade/PPP GDP >26 by 2002
• Increase FDI/ PPP GDP > 0.7 by 2002

R E P U B L I C O F T U N I S I A : C O U N T R Y A S S I S TA N C E E VA L U AT I O N
7 4
InstrumentsObjectives AAA Lending
• Achieve near universal primary Social and Structural Review (FY00); Higher Training and Employment Project II ($60m);
education Education: Challenges and Secondary Education Support Project ($98.3m);
• Improve completion rates Opportunities (FY97) Higher Education Restructuring Project I ($75m);
in education Higher Education Restructuring Project II ($50m);
• Increase insertion rate of vocational Employment and Training Fund Project ($12m);
graduates into workforce Education Quality Improvement Program Project
• Improvements in teacher training ($99m); Health Sector Loan ($50m); Hospital
and qualifications Restructuring Support Project ($30m); Education
• Reduce unemployment and Training Sector Loan ($95m); Population
• Enhance financial sustainability of and Family Health Project ($12m)
• Reduce infant mortality
• Lower fertility
• Reduction in subsidized health
care provision
• Enhance the quality of health services
• Improve the efficiency of health
services
• Ensure the sustainability of the
health system
Sources: * Government data “Statistiques de l’ Enseignement Scolaire et de la Formation Professionnelle 2002-2003.’’ ** Internal Bank data.
1 9 9 6 a n d 2 0 0 0 C o u n t r y S t r a t e g y O b j e c t i v e s a n d K e y H u m a n D e v e l o p m e n t P e r f o r m a n c e I n d i c a t o r s
T a b l e A . 7 b

A N N E X A : S TAT I S T I C A L A N N E X E S
7 5
Proposed performance indicators Actual progress
• Net primary enrollment ratio of 100% • 98.2% in 2000
• Raise persistence rate to grade 9 from 42% to 73% • Completion rates for grades 6 and 7 were 87% and 63.5%,
by 2004 respectively, in 2001/2002*
• Placement rate of 60% for vocational graduates in 1999 • Monitoring system of placement of graduates into labor
• Reduce unemployment rate to 15% by 2002. market set up and operational in 1998
• Lower maternal mortality ratios • Unemployment at 14.9% in 2002
• Reduce infant mortality rate to 20 per thousand live births by 2002 • Infant mortality at 26 per thousand in 2002
• Lower subsidized health care availability to roughly 25% of • 8% of population have fully subsidized access and another
the population in 1999 22% pay only 20% of the cost
• Improve health service quality through improved case • MMR at 69 per 100,000 in 2002
management and staff training • Hospital stay lowered from 8 to 7 days
• Policy measures for cost control • At the regional health level, expenses recovered from Social
Insurance program improved to 62.5% in 2003 from 2.2% in
1998; central government subsidy to recurrent budget of
tertiary hospitals decreased to 35% (1998) from 69%
(1991)**

R E P U B L I C O F T U N I S I A : C O U N T R Y A S S I S TA N C E E VA L U AT I O N
7 6
No. of Changes
Project Name (FY90-03) FY98 FY99 FY00 FY01 FY02
Economic and FinancialExport Development Project 0 a a a a aIndustry Support Institutions Upgrading 3 a a a b bPrivate Investment Credit 4 a a b b bEducationEducation Quality Improvement Program 2 a a a b bHigher Education Reform Support II 1 a a a b bTraining and Employment II 1 a a a a bEducation Support II 1 a a b b bHigher Education Restructuring 2 a a a b bEnvironment, Energy, and MiningGas Infrastructure Development Project 0 a a a a aHealth, Nutrition and PopulationHealth Sector Loan 1 a a a b bHospital Restructuring Support 5 a a b b bPopulation and Family Health 1 a a a a aRural SectorNorthwest Mount. and Forestry Areas Dev. 1 a a a a aAgricultural Support Services 1 a a a a bWater Sector Investment Loan 2 a a a b,c cSecond Agricultural Sector Investment 1 a a b b bNatural Resources Management 2 a a b b cNational Rural Finance 2 a a b,c c cAgricultural Sector Investment Loan 1 a b b b bNorthwest Mountainous Areas Dev. 2 a b b b bSecond Forestry Development 2 a a b b bTransportTransport Sector Investment I 0 a a a a aRural Roads 2 b c c c cUrban Development and Water Supply and SanitationMunicipal Development III 1 a a a a aCultural Heritage 0 a a a a aMunicipal Development II 3 a b,c c d dMunicipal Sector Investment 4 a b,c,d d d dGreater Tunis Sewerage Project 3 a a b b c,dWater Supply and Sewerage 3 a a b b c,dAdjustmentECAL III 0 a a a a aECAL II 1 a a a a bECAL I 2 a a a a aEconomic and Financial Ref. Supp. Loan 1 a a a a a
Note: a=no change since FY98; b=one change since FY98; c=two changes since FY98; d=three changes since FY98.Source: World Bank project data.
T u n i s i a : T a s k M a n a g e r T u r n o v e r o f P r o j e c t s A p p r o v e d i n F Y 9 0 – 0 3
A n n e x A . 8
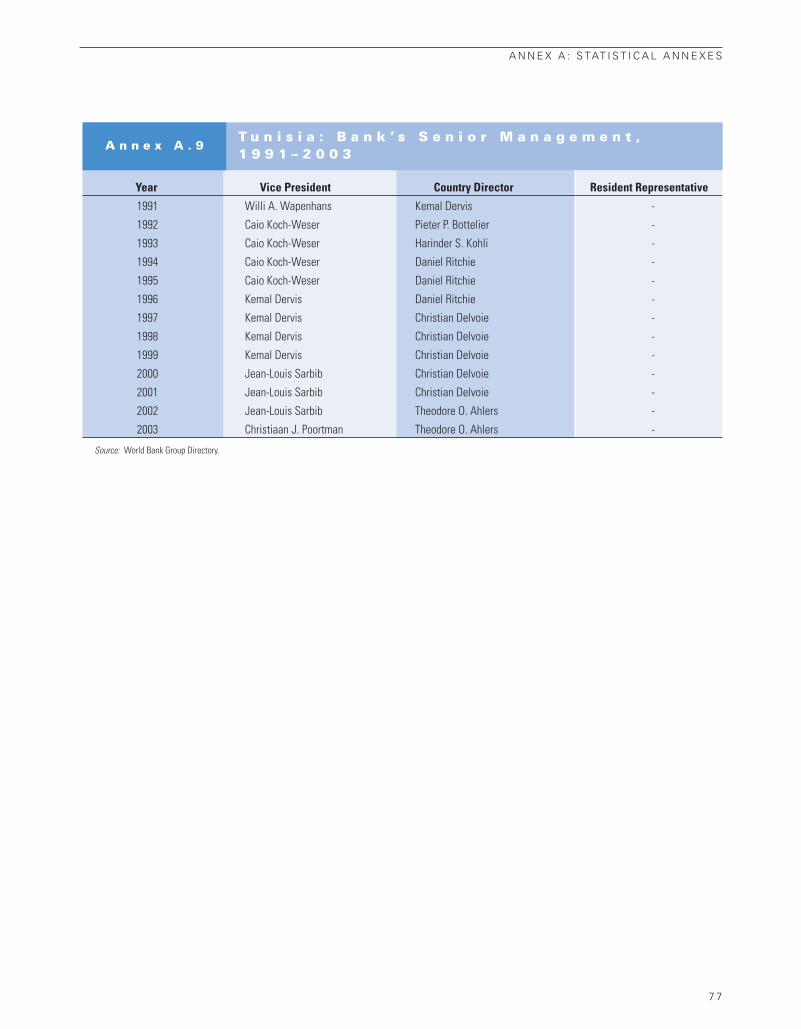
A N N E X A : S TAT I S T I C A L A N N E X E S
7 7
Year Vice President Country Director Resident Representative
1991 Willi A. Wapenhans Kemal Dervis -
1992 Caio Koch-Weser Pieter P. Bottelier -
1993 Caio Koch-Weser Harinder S. Kohli -
1994 Caio Koch-Weser Daniel Ritchie -
1995 Caio Koch-Weser Daniel Ritchie -
1996 Kemal Dervis Daniel Ritchie -
1997 Kemal Dervis Christian Delvoie -
1998 Kemal Dervis Christian Delvoie -
1999 Kemal Dervis Christian Delvoie -
2000 Jean-Louis Sarbib Christian Delvoie -
2001 Jean-Louis Sarbib Christian Delvoie -
2002 Jean-Louis Sarbib Theodore O. Ahlers -
2003 Christiaan J. Poortman Theodore O. Ahlers -
Source: World Bank Group Directory.
T u n i s i a : B a n k ’ s S e n i o r M a n a g e m e n t ,1 9 9 1 – 2 0 0 3
A n n e x A . 9


7 9
Government Officials, Donors and Private Sector Representatives
Ministry of Development & InternationalCooperationKamel Ben Rejeb, Director General Monir Boumessouer, Director General,
InfrastructureFouad El Shrafi, DirectorLutfi Frad, DirectorMohamed Naceur Braham; Counselor of
Public Services, Director of Agriculture andAgro-Industries
Foued Charfi; Director General, ProductiveSectors
Borgi Kacem; Director General of RegionalDevelopment
Abel Hamid Triki, DirectorMoncef Youzbachi
Ministry of FinanceBelhadji Jameleddine, Director General
Ministry of Higher EducationAbdallah Riahi, Director, Studies and PlanningMohamed El Hedi Zaiem, Consultant
Ministry of Education and Formation and Institute of Training H. E. Mohamed El-Monsif Ben Saad,
GovernmentSecretary General (Deputy Minister)Abdelkader Lgoulli, Director General, ServicesAbdelmalik Elsallami, Advisor to the Minister Ahmed Midamia, Director General, NVCMohamed Nazar El-Aish, Director GeneralFarahat El-Nasiri, DirectorMohamed El-Nasir, Director
Ibrahim Eltoumi, DirectorLutfi Blzabis, DirectorHofia El-Bahri, Director
Ministry of Health Dr. Khaled Kheireddine, Director of PlanningSlaheddine Kalat, Director of EquipmentsNacer Kamel, Director of Studies
National Statistical InstituteKhalifa Ben Faqih, Director GeneralAbdel Majd El-Wislati
Tunisia Central BankHabib El Montacer, Managing DirectorBadreddine Barkia, Director General,
SupervisionSamir Brahimi, Director General, Services
& Audit
Ministry of TransportSalem Miladi, Director General
Ministry of Industry and EnergyHamdi Guezguez, Principal EngineerRidha Ben Mosbah, Director General, De mise
à niveaùMohamed El Kamel, Project Manager, ISIUP
Private SectorNoureddine Ferchiou, Advocat, Ferchio
AssoicesAhmed Benghazi, Associe-Gérant, AxisAhmed SmaouiProf. Marouanne El AbassiFaycal Lakhoua, Counsellor, IACEJurgen Blanken, Water sector Economist, Pri-
vate Consultant
ANNEX B: LIST OF PEOPLE MET ON MISSION IN TUNISIA (AND WORLD BANK AND IMF STAFF INTERVIEWED)

National Agricultural BankBerraies Mohamed, Directeur
Exports Promotion Agency (FAMEX)Slim Chaker, Director for Coordination
Trade UnionMohamed Trabelsi, Secretaire
AfDBO. Ojo, Chief Evaluation OfficerK. Diallo, Principal Economist
EUBernard Brunet, Premier SecrètaireManfredo Fanti, Premier SecrètairePaul Mathieu, EconomistPhilippe Massin, Rural Development ExpertAmparo Gonzalez Diez, Section Chief, Rural
Development and the EnvironmentJose-Maria Bellostas, Rural Development
Expert
Tunisia LeasingFethi Mestri, Director General
Ministry of Agriculture, Environment and Water ResourcesAhmed El Achek, President Director General,
Office of Sylvo-Pastoral Development of the North West
Badr Ben Ammar, General Rural Economist,Director General of Studies and AgriculturalDevelopment
Abderraman Chaffai, Director, Studies andAgricultural Development
Ahmed Ridha Fekih Salem, General Engineer,Director General of Forests
Mohamed Gharbi, Director General, Agricul-tural Land Agency
Abdellatif Ghedira, Chief of Mission, Cabinetof the Minister, Director of the Bureau ofPlanning and Hydraulics
Lamine Ben Hamadi, Deputy Director of Planning and Budget, Institute of Researchand Higher Learning
Mohamed Ben Hamouda, Teacher-Researcher,Coordinator of Regional Research Pole of
the Northwest, Institute of Research andHigher Learning
Mohamed Mounir Hedri, Director of ResearchInstitute of Research and Higher Learning
Said Helal, Chief Engineer, Water and Forests,Director of Socio-Economic Developmentof the Forest Population
Abdelkadar Hamdane, Director General ofRural Works and of Hydraulics
Abdallah Mallek, Director General of Finance,Investment and Professional Organisations
Bellakhal Moktar, Director of Agriculture Extension
Kachouri Mondher, Deputy Director of Moni-toring & Evaluation of Research Programs,Institute of Research and Higher Learning
Sahla Mezghani, Agro-economist, SectionChief Finance, Investment, and ProfessionalOrganizations
Ben Mohamed Mongi, Chief, General Labora-tory, Director of Tuniso Japanese Project
Abdelaziz Mougou, President, Institute of Research and Higher Learning
Hamda Zeramdini, Agriculture Extension andTraining Agency, Coordinator of the Agricul-ture Support Services Project
World Bank, IMF, and IslamicDevelopment Bank StaffTheodore O. Ahlers (Country Director)Christian Delvoie (then Country Director)Dimmitri Vittas (Senior Adviser, OPD)Daniel Ritchie (then COD Division Chief)John Page (Director, PRMPR)Aristomene Varoudakis (Country Economist)Cecile Fruman (Country Officer)Pedro Alba (Sector Manager, MNSED) Mustapha Nabli (Chief Economist and
Director, MNSED)Setareh Razmara (Senior Economist,
MNSHD)Sara Johansson (Economist, MNSED)Hamid Alavi (Senior Private Sector Develop-
ment Specialist, MNSIF)Jeffery Waite (Senior Education Specialist,
MNSHD)Meskerem Mulatu (Senior Education Special-
ist, AFTH2)
R E P U B L I C O F T U N I S I A : C O U N T R Y A S S I S TA N C E E VA L U AT I O N
8 0

Anwar Bach-Baouab (Lead Operations Officer,AFTH3)
Gillian Perkins (Consultant OEDST)Domenico Fanizza (Deputy Division Chief
IMF)Bader Elddine Nouioua, Advisor, Operations
Evaluation Office, Islamic DevelopmentDjelloula Saci, Head, Operations Evaluation
Office, Islamic Development BankAbdel Ouahab Ghazala, Operations Evaluation
Office, Islamic Development Bank
A N N E X B : L I S T O F P E O P L E M E T O N M I S S I O N I N T U N I S I A
8 1


8 3
This methodological note describes the key el-ements of OED’s Country Assistance Evaluation(CAE) methodology.1
CAEs rate the outcomes of Bank assistance programs,not clients’ overall development progress.An assistance program needs to be assessed on howwell it met its particular objectives, which are typ-ically a sub-set of the client’s development objec-tives. If an assistance program is large in relationto the client’s total development effort, the programoutcome will be similar to the client’s overall de-velopment progress. However, most Bank assis-tance programs provide only a fraction of the totalresources devoted to a client’s development bydonors, stakeholders, and the government itself.In CAEs, OED rates only the outcome of the Bank’sprogram, not the client’s overall development out-come, although the latter is clearly relevant forjudging the program’s outcome.
The experience gained in CAEs confirms thatprogram outcomes sometimes diverge signifi-cantly from the client’s overall developmentprogress. CAEs have identified assistance pro-grams that had:
• Satisfactory outcomes matched by good clientdevelopment
• Unsatisfactory outcomes with clients thatachieved good overall development results,notwithstanding the weak Bank program
• Satisfactory outcomes with clients that did notachieve satisfactory overall results during theperiod of program implementation.
Assessments of assistance program outcome andBank performance are not the same.By the same token, an unsatisfactory assistanceprogram outcome does not always mean that
Bank performance was also unsatisfactory, andvice-versa. This becomes clearer once we con-sider that the Bank’s contribution to the outcomeof its assistance program is only part of the story.The assistance program’s outcome is determinedby the joint impact of four agents: (a) the client,(b) the Bank, (c) partners and other stakehold-ers, and (d) exogenous forces (such as events ofnature, international economic shocks, and soon). Under the right circumstances, a negativecontribution from any one agent might over-whelm the positive contributions from the otherthree, and lead to an unsatisfactory outcome.
OED measures Bank performance primarilyon the basis of contributory actions the Bank di-rectly controlled. Judgments regarding Bankperformance typically consider the relevanceand implementation of the strategy; the designand supervision of the Bank’s lending interven-tions; the scope, quality, and follow-up of diag-nostic work and other analytical and advisoryactivities; the consistency of Bank’s lending withits non-lending work and with its safeguard poli-cies; and the Bank’s partnership activities.
Evaluation in Three DimensionsAs a check on the inherent subjectivity of ratings,OED examines a number of elements that con-tribute to assistance program outcomes. Theconsistency of ratings is further tested by ex-amining the country assistance program acrossthree dimensions:
(a) A Products and Services Dimension, in-volving a “bottom-up” analysis of major pro-gram inputs—loans, analytical and advisoryactivities, and aid coordination
(b) A Development Impact Dimension, involv-ing a “top-down” analysis of the principal
ANNEX C: GUIDE TO OED’S COUNTRY ASSISTANCE EVALUATION METHODOLOGY

program objectives for relevance, efficacy, out-come, sustainability, and institutional impact
(c) An Attribution Dimension, in which the eval-uator assigns responsibility for the programoutcome to the four categories of actors.
Rating Assistance Program OutcomeIn rating the outcome (expected developmentimpact) of an assistance program, OED gaugesthe extent to which major strategic objectiveswere relevant and achieved, without any short-comings. Programs typically express their goals interms of higher-order objectives, such as povertyreduction. The Country Assistance Strategy (CAS)may also establish intermediate goals, such as im-proved targeting of social services or promotionof integrated rural development, and specify howthey are expected to contribute toward achievingthe higher-order objective. OED’s task is then tovalidate whether the intermediate objectives pro-duced satisfactory net benefits and whether the re-sults chain specified in the CAS was valid. Wherecausal linkages were not fully specified in the CAS,it is the evaluator’s task to reconstruct this causalchain from the available evidence and assess rel-evance, efficacy, and outcome with reference to theintermediate and higher-order objectives.
Evaluators also assess the degree of clientownership of international development prior-ities, such as the Millennium Development Goals,and Bank corporate advocacy priorities, such assafeguards. Ideally, any differences in dealingwith these issues would be identified and re-solved by the CAS, enabling the evaluator tofocus on whether the tradeoffs adopted were ap-propriate. However, in other instances, the strat-egy may be found to have glossed over certainconflicts or avoided addressing key client de-velopment constraints. In either case, the con-sequences could include a diminution ofprogram relevance, a loss of client ownership,and/or unwelcome side-effects, such as safe-guard violations, all of which must be taken intoaccount in judging program outcome.
Ratings Scale OED utilizes six rating categories for outcome,ranging from highly satisfactory to highly un-satisfactory:
Highly Satisfactory: The assistance programachieved at least acceptable progress toward allmajor relevant objectives, and had best practicedevelopment impact on one or more of them.No major shortcomings were identified.
Satisfactory: The assistance program achievedacceptable progress toward all major relevantobjectives. No best practice achievements ormajor shortcomings were identified.
Moderately Satisfactory: The assistance pro-gram achieved acceptable progress toward mostof its major relevant objectives. No major short-comings were identified.
Moderately Unsatisfactory: The assistanceprogram did not make acceptable progress to-ward most of its major relevant objectives, ormade acceptable progress on all of them, but ei-ther (a) did not take into adequate account a keydevelopment constraint or (b) produced a majorshortcoming, such as a safeguard violation.
Unsatisfactory: The assistance program didnot make acceptable progress toward most of itsmajor relevant objectives, and either (a) did nottake into adequate account a key developmentconstraint or (b) produced a major shortcoming,such as a safeguard violation.
Highly Unsatisfactory: The assistance pro-gram did not make acceptable progress towardany of its major relevant objectives and did nottake into adequate account a key developmentconstraint, while also producing at least onemajor shortcoming, such as a safeguard violation.
The institutional development impact(IDI) can be rated as: high, substantial, modest,or negligible. IDI measures the extent to whichthe program bolstered the client’s ability to makemore efficient, equitable, and sustainable use ofits human, financial, and natural resources. Ex-amples of areas included in judging the institu-tional development impact of the program are:
• The soundness of economic management• The structure of the public sector and, in par-
ticular, the civil service• The institutional soundness of the financial
sector• The soundness of legal, regulatory, and judicial
systems
R E P U B L I C O F T U N I S I A : C O U N T R Y A S S I S TA N C E E VA L U AT I O N
8 4

• The extent of monitoring and evaluation sys-tems
• The effectiveness of aid coordination• The degree of financial accountability • The extent of building NGO capacity• The level of social and environmental
capital.
Sustainability can be rated as highly likely,likely, unlikely, highly unlikely, or, if availableinformation is insufficient, non-evaluable. Sus-tainability measures the resilience to risk of thedevelopment benefits of the country assistanceprogram over time, taking into account eightfactors:
• Technical resilience• Financial resilience (including policies on cost
recovery)
• Economic resilience• Social support (including conditions subject to
safeguard policies)• Environmental resilience• Ownership by governments and other key
stakeholders • Institutional support (including a supportive
legal/regulatory framework, and organizationaland management effectiveness)
• Resilience to exogenous effects, such as in-ternational economic shocks or changes inthe political and security environments.
A N N E X C : G U I D E T O O E D ’ S C O U N T R Y A S S I S TA N C E E VA L U AT I O N M E T H O D O L O G Y
8 5


8 7
• Follow through on supporting programs to improve the environment
for private sector development and enhance competitiveness as
Tunisia seeks to integrate within the world economy. Specifically, the
Bank should help the country (i) pursue trade openness with the EU
and the rest of the world; (ii) improve the enabling environment
through regulatory and judicial reforms to attract private and foreign
investment; and (iii) progress on privatizing public financial and en-
terprise firms.
• Continue support for social sectors. While supportive of the MDGs,
the Bank’s program needs to continue this emphasis and focus on im-
proving the country’s capacity to prioritize social spending and address
education expansion at the post-basic level given the demographic
transition underway. The Bank should undertake a public expenditure
review in partnership with the Government. This should help build ca-
pacity to prioritize social spending and provide the basis for meas-
ures to efficiently address growing demand for secondary and tertiary
education.
• Focus on institutional development and safety nets in the rural sec-
tor. Future Bank programs should focus on rural institutional devel-
opment to support efficient output and input markets, including land,
rural finance, and research and extension, while maintaining social
cohesion through better targeted safety nets. After 21 years without
a comprehensive agricultural sector review, the Bank should under-
take one to inform its future programs.
• Enhance a results-based monitoring and evaluation approach. En-
hancing a results-based approach with agreed and monitorable out-
put and outcome indicators embedded in an improved monitoring and
evaluation framework would help to anchor the Bank’s assistance pro-
gram in the future.
ANNEX D: MANAGEMENT ACTION RECORD
The proposed CAS for FY05-08 addresses these issues squarely. The
first pillar of the CAS focuses on improving the business environment
and enhancing competitiveness, while the second pillar supports
greater quality and efficiency of the education system to address the
needs of the market place. The CAS supports greater competition in
infrastructure through the PPI (private participation in infrastructure)
agenda.
This is also addressed in the new CAS though the second pillar (edu-
cation), and the third pillar, which supports greater efficiency of so-
cial programs (pension, health, and social protection). A PER is proposed
and the Country Team agrees that emphasis should be given to
reviewing expenditures in social sectors.
The Country Team has taken CAE’s recommendation and proposes to
conduct a comprehensive agricultural sector review. This will inform
policy dialogue and future lending to this sector.
The proposed FY05-08 CAS is a results-based CAS and will lead to reg-
ular monitoring of CAS outcomes and results (yearly reports and CAS
progress report in 2006). In addition, the country team has already
started reinforcing capacity of project implementation staff in Tunisia
in regular M&E of projects. CB will also be strengthened for Bank teams.
Major Monitorable OED Recommendations Requiring a Response Management Response

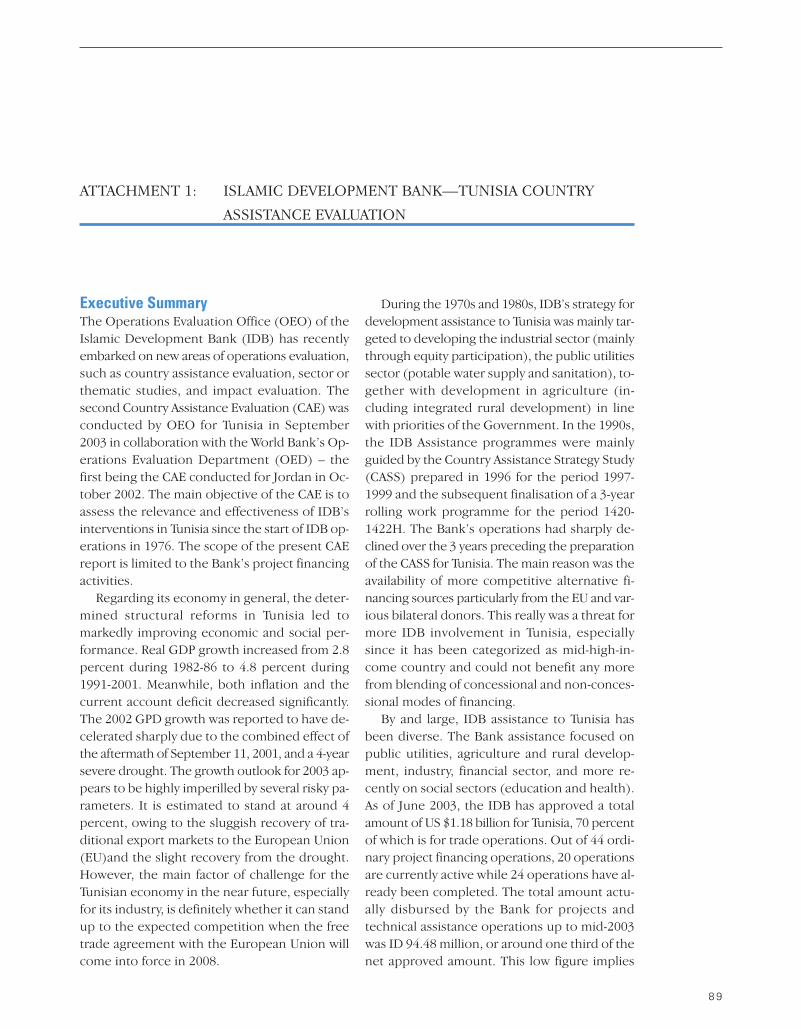
8 9
Executive Summary The Operations Evaluation Office (OEO) of theIslamic Development Bank (IDB) has recentlyembarked on new areas of operations evaluation,such as country assistance evaluation, sector orthematic studies, and impact evaluation. Thesecond Country Assistance Evaluation (CAE) wasconducted by OEO for Tunisia in September2003 in collaboration with the World Bank’s Op-erations Evaluation Department (OED) – thefirst being the CAE conducted for Jordan in Oc-tober 2002. The main objective of the CAE is toassess the relevance and effectiveness of IDB’sinterventions in Tunisia since the start of IDB op-erations in 1976. The scope of the present CAEreport is limited to the Bank’s project financingactivities.
Regarding its economy in general, the deter-mined structural reforms in Tunisia led tomarkedly improving economic and social per-formance. Real GDP growth increased from 2.8percent during 1982-86 to 4.8 percent during1991-2001. Meanwhile, both inflation and thecurrent account deficit decreased significantly.The 2002 GPD growth was reported to have de-celerated sharply due to the combined effect ofthe aftermath of September 11, 2001, and a 4-yearsevere drought. The growth outlook for 2003 ap-pears to be highly imperilled by several risky pa-rameters. It is estimated to stand at around 4percent, owing to the sluggish recovery of tra-ditional export markets to the European Union(EU)and the slight recovery from the drought.However, the main factor of challenge for theTunisian economy in the near future, especiallyfor its industry, is definitely whether it can standup to the expected competition when the freetrade agreement with the European Union willcome into force in 2008.
During the 1970s and 1980s, IDB’s strategy fordevelopment assistance to Tunisia was mainly tar-geted to developing the industrial sector (mainlythrough equity participation), the public utilitiessector (potable water supply and sanitation), to-gether with development in agriculture (in-cluding integrated rural development) in linewith priorities of the Government. In the 1990s,the IDB Assistance programmes were mainlyguided by the Country Assistance Strategy Study(CASS) prepared in 1996 for the period 1997-1999 and the subsequent finalisation of a 3-yearrolling work programme for the period 1420-1422H. The Bank’s operations had sharply de-clined over the 3 years preceding the preparationof the CASS for Tunisia. The main reason was theavailability of more competitive alternative fi-nancing sources particularly from the EU and var-ious bilateral donors. This really was a threat formore IDB involvement in Tunisia, especiallysince it has been categorized as mid-high-in-come country and could not benefit any morefrom blending of concessional and non-conces-sional modes of financing.
By and large, IDB assistance to Tunisia hasbeen diverse. The Bank assistance focused onpublic utilities, agriculture and rural develop-ment, industry, financial sector, and more re-cently on social sectors (education and health).As of June 2003, the IDB has approved a totalamount of US $1.18 billion for Tunisia, 70 percentof which is for trade operations. Out of 44 ordi-nary project financing operations, 20 operationsare currently active while 24 operations have al-ready been completed. The total amount actu-ally disbursed by the Bank for projects andtechnical assistance operations up to mid-2003was ID 94.48 million, or around one third of thenet approved amount. This low figure implies
ATTACHMENT 1: ISLAMIC DEVELOPMENT BANK—TUNISIA COUNTRY
ASSISTANCE EVALUATION

partially that there has been under-utilisation ofthe extended financings as there were many costsavings that stemmed from both the depreciationof the Tunisian dinar and a tendency to overes-timate the project costs at appraisal time.
With regard to the performance of the 11post-evaluated projects, 10 projects were con-sidered as successful or partly successful andone project not successful. Currently, a 3-yearwork programme for 1423-1425H is being im-plemented as planned.
During two decades (1980s and 1990s),Tunisia’s commitments in trade were almost con-stant and in line with earmarked allocations,thanks to annual operations entered into with tra-ditional clients in that member country.
However, it is felt that Tunisia has not been en-gaging with IDB on trade financing operationsat a level that is commensurate with the highcreditworthiness that the country does enjoy.The main reason why Tunisia does not take ad-vantage of IDB’s trade financing operations, ata similar pace to other member countries ofcomparable economic development, is that IDB’smark-up is perceived—particularly by the privatesector—not to be competitive enough as com-pared with the rates available.
Water supply and sanitation has been the pri-mary beneficiary sector of IDB project financing(45 percent), with particular emphasis on theconstruction of sewerage infrastructure in favourof the Sewerage Authority (ONAS). Under IDBfinancing, ONAS procured new technology ofsludge mechanical dewatering and handling.Regarding the water supply, two projects arecurrently being implemented by the Water Au-thority (SONEDE). In view of the relatively lowrate of access to potable water of northernzones, IDB may envisage in the future to fi-nance projects in these regions. It was proposedalso that IDB might contribute to SONEDE pro-gramme of renewal of transmission lines inurban areas.
IDB assistance to the industrial sector wasprimarily provided in the early 1980s through eq-uity participation in three companies. The CAEmission recommends to undertake a review ofthe equity portfolio performance in Tunisia, inlight of the difficulties faced by these companies.
The Bank’s intervention in the IntegratedRural Development (IRD) sector related to 5projects which entailed activities that were spreadall over Tunisia, and whose scope encompasseda multitude of components of both agriculturaland non- agricultural nature. All the 5 IRD proj-ects have been post evaluated, and their per-formance was assessed as satisfactory since thetargeted objectives were attained in terms of re-gional development and improvement of theliving conditions of the most disfavoured pop-ulations.
IDB involvement in the social sectors hasrather been modest and tardy. Although thehuman resources development was a top prior-ity for Tunisia, IDB was involved neither in pri-mary and secondary education nor in vocationaltraining. IDB involvement in higher educationand the health sector is relatively recent, and itis premature to assess its performance.
With regard to education, many stakeholdersinterviewed by the mission expressed high con-cern about the lagging improvements in thequality of education at all levels. For higher ed-ucation in particular, the Tunisian officials in-formed the mission that their country is puttingmore emphasis on vocational and technical ed-ucation, especially computers and informationtechnology, to combat unemployment amongthe youth, which now stands at around 16 per-cent. In this connection, the Ministry in chargeof higher education is preparing a project tocreate technological poles, and IDB may envis-age its contribution to this project.
On the other hand, IDB extended severallines of financing to Tunisia, but most of themhave remained dormant. The main reason for thenon-utilization of these lines of financing is theforeign exchange risk which the local investorsand businessmen are unwilling to bear. In this re-spect, a new global line was approved in 2003.It has been devised to overcome all the short-comings related to previous lines of financing ex-tended to local banks in Tunisia, especiallythrough the introduction of a mechanism forthe exchange risk coverage, involving local banksand insurance companies.
In conclusion, the Tunisian authorities af-firmed the importance and the timeliness of the
R E P U B L I C O F T U N I S I A : C O U N T R Y A S S I S TA N C E E VA L U AT I O N
9 0
current evaluation of IDB’s activities in Tunisia.The IDB’s assistance to Tunisia has been appre-ciated and acknowledged by them. There was ageneral agreement that this assistance was rele-vant. As a matter of fact, IDB’s experience indealing with the different executing agencies isconsidered very successful, because Tunisia pos-
sesses a very efficient and experienced technicaland administrative staff. However, there were anumber of criticisms of bank assistance. Thecomplaints concern mainly operational aspectssuch as time-consuming disbursement proce-dures and IDB financing cost which is viewed tobe rather high.
AT TA C H M E N T 1 : I S L A M I C D E V E L O P M E N T B A N K — T U N I S I A C O U N T R Y A S S I S TA N C E E VA L U AT I O N
9 1


9 3
The Informal Subcommittee (SC) of the Com-mittee on Development Effectiveness (CODE)met on April 21, 2004, to discuss the TunisiaCountry Assistance Evaluation prepared jointlyby the Operations Evaluation Department (OED)and the Islamic Development Bank (IDB).
Background OED’s evaluation commended Tunisia’s re-markable socioeconomic progress and reduc-tion in poverty rates and underlined theimportant role of country ownership, a broad po-litical consensus, a well-developed human re-source base, and a stable macroeconomicenvironment. The report noted that the Bankprogram in Tunisia succeeded in promoting re-forms in the financial, rural, and private sectorsby providing assistance in terms of policy advice,lending, and resource mobilization. It also notedsome shortfalls that may pose risks for sustain-ing high performance in the more competitiveenvironment that Tunisia is likely to face in thenear future, such as low levels of private invest-ment, the significant role of government in eco-nomic activities, the large number ofnonperforming loans at public banks, and hightariffs. The evaluation concluded that the Bankshould concentrate its efforts on helping theauthorities to improve the business environ-ment through regulatory reform, to continuesupport for the rural sector and social institu-tions, and on high quality analytical studies.
Management broadly agreed with the CAEconclusions and noted that they will be largelyreflected in the new Tunisia country strategy. Inparticular, the new country strategy will focus onthree strategic objectives: (i) strengthening en-vironment for private investment; (ii) improvingthe quality of output from the education sys-
tem and its link to the labor market; and (iii) im-proving public services through a focus on effi-ciency and sustainability of public expenditures.
The Chair representing Tunisia thanked OEDfor preparing a very balanced and insightful re-port, and reiterated the Tunisian authorities’general agreement with the main conclusionsand recommendations of the evaluation. Heconcurred with the OED assessment of the Bankassistance as satisfactory, and highlighted theimportant role of the Bank’s lending, policy ad-vice and analytical work in the country’s so-cioeconomic development. At the same time,he stressed that the authorities have employeda cautious approach to structural reforms inorder to ensure a broad consensus. He also ex-pressed concerns about the increasing pressureof the cost of doing business with the Bank andnoted that the report could have benefited fromdrawing comparisons with other MDBs, as wellas specific proposals to improve flexibility of thecountry strategy program and IFC’s involvementin the country.
Main Conclusions and Next Steps The Subcommittee welcomed the CAE andagreed with the OED rating of Bank assistanceas satisfactory. Members endorsed the main con-clusions and recommendations of the report.They commended management for includingthe CAE’s recommendations in the new countrystrategy, and stressed the importance of drawinglessons from Tunisia’s impressive performance.Among other major issues discussed at the meet-ing were the pace of future reforms, challengesof sustaining the development progress and re-lated vulnerabilities of the Tunisian economy,the cost of doing business in Tunisia in the con-text of Bank lending to the middle income coun-
ATTACHMENT 2: REPORT FROM THE COMMITTEE ON DEVELOPMENT
EFFECTIVENESS (CODE)

tries, and the lessons to be drawn from the jointevaluations with other development partners.
The following points were raised:
Lessons Learned Many members were interested in the positivelessons from the Tunisian experience, andwhether they could be replicated in other coun-tries. Management noted that Tunisian experi-ence is very relevant, especially for the MNA andAfrica Regions, and that it is being currently uti-lized through a series of regional seminars andworkshops. Some members asked for more de-tails on the impact of and the differences inviews on the mise à niveau program of enter-prise restructuring and upgrading. Managementnoted that in its view the main factor in sup-porting enterprise restructuring should be theinvestment climate rather than providing a smallamount of subsidy, which is the essence of themise à niveau program
Looking Forward Members concurred with the report’s conclusionthat the Bank should continue to support im-proving the investment climate and enhancingcompetitiveness. They stressed the importanceof developing a results-based approach in theareas of trade openness, the business environ-ment, enterprise and financial sector privatiza-tion, and land and rural finance. Membersexpressed concern about the size of the publicbanks’ portfolio and potentially heavy burden ofnonperforming loans on the economy. Somemembers concurred with OED’s observationthat further structural reforms are needed inlight of an increasingly more competitive re-gional and global trade environment, but notedthe importance of simultaneously sustaining fullownership of the reform process and broad po-litical consensus. Management noted that thereis interest on behalf of the authorities to take ad-vantage of the Bank’s assistance on debt man-agement and doing an investment climateassessment. Some members asked about thereasons of IFC’s lack of activity in the country.Management replied that IFC’s limited involve-ment is due to the availability of alternative andcheaper financing for Tunisian companies. At
the same time, management confirmed that IFCis interested in exploring new opportunities inTunisia. Members praised the country’s successin achieving the MDGs, but had questions aboutthe consistently high levels of unemployment.Management agreed that, despite meeting thetarget on unemployment, job creation and pri-vate investment remain issues of concern forthe Tunisian authorities, given the rapid growthof the labor force. Management noted that thoseissues are discussed extensively in the countrystrategy through the prism of creating more flex-ibility in public financial management and im-proving the investment climate. Some membersasked management to elaborate on the absenceof a full-fledged Bank office in the country. Man-agement replied that given the presence of verystrong and competent public administration,the Tunisian authorities at this point do not seethe need for the same kind of implementationassistance as in other countries.
Cost of Doing Business Some members echoed the concern expressedby the Tunisian chair about the cost of doing busi-ness with the Bank vis-à-vis other MDBs, andstressed the importance of that issue in the over-all context of lending to the middle-incomecountries. OED noted that these issues will beaddressed in the OED study on lending to mid-dle-income countries. Management added thatTunisia could clearly be a case where the Bankcan quickly adopt national systems in order todrive down the costs, and that the future workon core ESW (CFAA, CPAR) is designed to addressfiduciary issues so as to move towards using na-tional systems.
Donor Coordination Members welcomed OED’s cooperation with IDB,consistent with the Bank’s broader agenda of har-monization and reducing the cost of assistance tothe clients, and urged OED to continue that prac-tice in future. Some members were interested toknow whether joint work was an important fac-tor in the overall success of the evaluation, andwhat were the lessons learned. OED replied thatthe partnership arrangement with IDB led to sig-nificant capacity development, laying the ground-
R E P U B L I C O F T U N I S I A : C O U N T R Y A S S I S TA N C E E VA L U AT I O N
9 4

work for further collaboration. This was the sec-ond joint report with IDB, and OED had foundthose exercises very useful in terms of raising theefficiency of the evaluation function, capacitybuilding, and sharing of ideas. Management noted
that the high level of competence of the Tunisianauthorities allows for a sufficient level of dialoguewith donors to be maintained bilaterally, but en-couraged the authorities to do it in a more coor-dinated manner in the future.
AT TA C H M E N T 2 : R E P O R T F R O M T H E C O M M I T T E E O N D E V E L O P M E N T E F F E C T I V E N E S S ( C O D E )
9 5
Chander Mohan Vasudev, Chairman


9 7
Chapter 11. The GDI ranks Jordan 75th, Tunisia 76th, Alge-
ria 88th, Egypt 99th, and Morocco 102nd out of 175
countries (UNDP 2003).
2. Deeper integration into EU markets will make
Tunisia more vulnerable to economic swings in the EU.
Anemic growth in the EU is swiftly felt in Tunisia, as
in the sharp GDP slowdown seen in 2002.
Chapter 21. Most of the World Bank’s closed projects in
Tunisia do not have an operationalized M&E mecha-
nism.
2. The Region notes, “It is important to indicate that
it was not the Bank’s choice not to conduct a PER but
the Government’s reluctance to let the Bank do one.”
3. By way of comparison, only the Bank’s West
Bank and Gaza program mobilized more resources
than Tunisia. During FY94–01, the West Bank and
Gaza program secured $541 million in co-financ-
ing/parallel funding against $326 million in Bank com-
mitments—a ratio of $1.66 on every dollar. The Bank’s
Jordan program mobilized a co-financing ratio simi-
lar to its program in Tunisia.
4. For example, Municipal Development Project was
postponed and Cultural Heritage and Agricultural
Support Services projects were reduced in size by 40
percent.
Chapter 31. The authorities noted that when these private
leasing companies are combined with the private
banks, the share of assets of all private credit institu-
tions out of the total is about 62 percent.
2. Excludes five “development” banks that are joint
ventures with other Arab countries (which account for
about 5 percent of the banking assets) and are not sub-
ject to the authority and supervision of the Central
Bank, but are governed by bilateral protocols. These
are now being commercialized and the intention is to
bring them under the umbrella of the Central Bank.
Three foreign banks operate in Tunisia today, BNP,
Citibank, and Société Générale, and the Arab Banking
Group has recently been authorized to open up a
branch as well. However, the presence of foreign
banks in Tunisia remains below that seen in other de-
veloping countries, especially in EU accession coun-
tries that have modernized their banking systems
with a significant involvement of foreign banks.
3. The reduction in NPLs was largely the result of
the government taking over or guaranteeing bad
debts rather than evidence of better lending.
4. In 2002, average (unweighted) Tunisian most fa-
vored nation (MFN) tariffs were 34.5 percent, mar-
ginally down from 35.9 in 2000, compared to 24.3
percent for imports originating in the EU.
5. FDI flows also account for only a small per-
centage of gross capital formation in the region, about
5 percent in 2000. In comparison, FDI flows accounted
for 26 percent in Singapore (World Bank data, 2003).
6. Tunisia’s unemployment rate is similar to the
MNA average of 15 percent in 2000 (Finance and De-
velopment, March 2003, p. 19). Based on its ESW, the
Bank has proposed measures to improve the unem-
ployment situation.
7. The Bank’s first education project in Tunisia
was in 1962.
8. Government data, Statistiques de l’enseigne-
ment scolaire, 2002-2003.
9. Third International Mathematics and Science
Study measured student performance in mathemat-
ics and science achievements and collected relevant
information on instruction, curriculum, schools, and
policies.
10. The ongoing Education Quality Improvement
Program Phase 1 (EQIP 1). See Annex table A-2o.
ENDNOTES

11. Hospital Restructuring Support Project of 1991.
12. The Region notes that there has been sub-
stantial progress on the reforms concerning the re-
gional health bodies, although it was slow until about
two years ago. OED notes that the Region, in its eval-
uation of the health structuring project, mentioned
that requiring a legal framework for hospital autonomy
as a condition for project effectiveness is important
to ensure political commitment.
13. According to the Ministry of Education projec-
tions covering the period 2000-2020, secondary edu-
cation student numbers will increase by 80 percent and
basic education students will decrease by 40 percent.
14. Tunisia’s expenditure per student rises sharply
with the level of education. For example, per capita
tertiary spending is five times higher than primary level
and three times higher than secondary spending.
These ratios do not compare favorably with other
comparator countries (World Bank data, 2003).
15. Economic and fiscal analyses are light in the con-
text of this program.
16. This section draws heavily on World Bank
(2003) and Tsakok (2004).
17. Ayadi et al. (2001).
18. Republic of Tunisia. Ministry of Development
and International Cooperation. National Institute of
Statistics. National survey on household budget, con-
sumption, and living standards–2000. Volume A. Re-
sults of the survey on household budgets. Enquete
nationale sur le budget, la consommation et le
niveau de vie des ménages–2000. Volume A. Resultats
de l’Enquete sur le Budget des ménages, p. 33.
19. These objectives addressed all issues the Bank
raised in its analytical work except the high risks of a
drought-vulnerable agriculture and the weaknesses of
marketing. The Bank addressed the growth, sustain-
ability, and poverty reduction objectives of the gov-
ernment, but did not pay sufficient attention in its
program to the government’s other major objectives
of achieving food self-sufficiency and increasing rural
employment.
20. The 1995 EUAA excludes agricultural goods.
However, an agricultural agreement with the EU in
January 2001 presented new opportunities for Tunisian
exports, which would boost the country’s position in
the European market, especially for products such as
olive oil, double concentrate tomato paste, and table
grapes.
21. The Center West is the poorest, according to
the Bank data. In the Natural Resources Management
project (1997-2003) operating in the north (Jendouba),
center west (Kasserine), and south (Medenine), there
have been substantial physical achievements, but
since there is no M&E, there is no systematic evi-
dence on the income-increasing impact, which is pre-
sumed to be positive.
22. World Bank. Tunisia Northwest Mountainous
Ares Development project report.
23. A proposed policy note on land issues (men-
tioned in the 2000 CAS) was dropped.
24. Tunisia has successfully diversified its exports
toward new manufactured products including elec-
trical machinery, tobacco, footwear, explosives, and py-
rotechnics (World Bank 2000b), p. 14.
Chapter 41. One exception is the 1993 PERL. The project
seems to have been too ambitious and unrealistic in
its design from the onset. It was the first operation to
try to help a reluctant country deal with the difficult
area of public enterprise reform, employing an ex-
perimental instrument embodied in the performance
contracts, and resorting to imprecise conditionalities
that started weak and got weaker during implemen-
tation. It was also poorly supervised, except for its
transport component.
R E P U B L I C O F T U N I S I A : C O U N T R Y A S S I S TA N C E E VA L U AT I O N
9 8
9 9
Adams, Richard, and John Page. 2003a. “Poverty,Inequality and Growth in Selected MiddleEast and North Africa Countries, 1980-2003.”World Development 13, No. 12, pp. 2027-2048.
———. 2003b. Jobs Growth, and Governance inthe Middle East and North Africa: Unlockingthe Potential for Prosperity. Washington, D.C.:World Bank.
Ayadi, Mohamed; Mohamed Salah Matoussi; andMaria Victoria-Feser. 2001.”Putting Robust Sta-tistical Methods into Practice: Poverty Analy-sis in Tunisia.” Swiss Journal of Economicsand Statistics 137, No. 3 (September), pp.463-482.
Dabour, Nabil. 2000. “The Role of Foreign DirectInvestment in Development and Growth inOIC Member Countries.” Journal of Eco-nomic Cooperation 21, No. 3.
IMF (International Monetary Fund). 2003.Tunisia—Preliminary Conclusions of the Ar-ticle IV Consultation Mission for 2003. Wash-ington, D.C.
Kanaan, A. 2004. “Evaluating Bank Assistance inthe Areas of Macroeconomic Management,Private Sector Development and FinancialSector Development.” Forthcoming OEDWorking Paper. Washington, D.C.: World Bank.
Ministry of Economic Development (MED), Re-public of Tunisia. 2002. The Tenth Plan:2002–06.
Ministry of Economic Development (MED), Re-public of Tunisia. 1997. Ninth Plan: 1997–01.
OECD (Organisation for Economic Co-opera-tion and Development). 2003. GeographicalDistribution of Financial Flow Aid Recipients.Paris.
Tsakok, I. 2004. “Rural Development and PovertyReduction 1990-2003.” Forthcoming OEDWorking Paper. Washington, D.C.: World Bank.
UNDP (United Nations Development Pro-gramme). 2003. Human Development Report:Millennium Development Goals—A Compactamong Nations to End Human Poverty. NewYork, NY: Oxford University Press.
World Bank. 2004. Doing Business in 2004: Un-derstanding Regulation. Washington, D.C.:World Bank and Oxford University Press.Doing Business Database available athttp://rru.worldbank.org/DoingBusiness.
———. 2003. Tunisia: Project Performance As-sessment Report, Agricultural Research andExtension Project (Loan No. 3217), Agricul-tural Sector Investment Project (Loan No.3661), Northwest Mountainous Areas Devel-opment Project (Loan No. 3691), NationalRural Finance Project (Loan No. 3892), ReportNo. 26260, June 26, 2003. Washington D.C.:World Bank.
———. 2000a. Republic of Tunisia: Private Sec-tor Assessment Update—Meeting the Chal-lenge of Globalization. 3 vols. Report No.20173-TUN. Washington, D.C.: World Bank.
———. 2000b. Republic of Tunisia: Social andStructural Review 2000—Integrating into theWorld Economy and Sustaining Economicand Social Progress, Report No. 20976, June2000. Washington, D.C.: World Bank.
———. 1995a. Republic of Tunisia: Towards the21st Century. Country Economic Memoran-dum (CEM). Report No. 14375-TUN. Wash-ington, D.C.: World Bank.
———. 1995b. Tunisia: Poverty Alleviation, Re-port No. 13993. Washington, D.C.: World Bank.
REFERENCES
———. 1994a. Kingdom of Morocco, Republic ofTunisia—Export Growth: Determinants andProspects. Report No. 12947. Washington,D.C.: World Bank.
———. 1994b. Republic of Tunisia: Private Sec-tor Assessment. Report No. 12945-TUN. Wash-ington, D.C.: World Bank.
R E P U B L I C O F T U N I S I A : C O U N T R Y A S S I S TA N C E E VA L U AT I O N
1 0 0