republic financial holdings cover revised … · financial holdings limited will be held at the...
TRANSCRIPT

1
www.republicfinancialholdings.comAnnual Report
2016
C
M
Y
CM
MY
CY
CMY
K
REPUBLIC FINANCIAL HOLDINGS COVER REVISED 1.11.16.pdf 1 11/1/16 10:51 AM

2 1
CONNECT
Deep connections…extending to a past nearly two
centuries ago and evolving to a present filled with
milestones and achievements. Broad network…
stretching across seas through our subsidiaries and the
sum of the parts of our Holding Company. Unshakeable
links…indelibly connecting us to our stakeholders
and to the lives of those in the communities we serve.
Motivated by progress, our vision for moving forward
has always been a united one; and as Republic Financial
Holdings Limited, that vision is even clearer now than
before. Empowered by growth, achievement and
success, we continue our journey into the future.

2 3
10 Notice of Meeting
11 Corporate Information
12 Consolidated Financial Summary
13 Group Financial Calendar
16 Board of Directors
22 Directors’ Report
25 Chairman’s Review
29 President’s Discussion and Analysis
42 Subsidiaries
60 Corporate Governance
68 Power to Make a Difference
76 Financial Reporting Requirements
78 Independent Auditors’ Report
79 Consolidated Statement of Financial Position
81 Consolidated Statement of Income
82 Consolidated Statement of Comprehensive Income
83 Consolidated Statement of Changes In Equity
84 Consolidated Statement of Cash Flows
86 Notes to the Consolidated Financial Statements
TABLE OF CONTENTS
CORPORATEINFORMATION
BOARD OF DIRECTORS & EXECUTIVES
THE GROUPSUBSIDIARIES
CORPORATE SOCIAL RESPONSIBILITY
FINANCIALSTATEMENTS5
4
3
2
1
Republic Financial Holdings,
the Caribbean Financial
Services Group of Choice
for our Staff, Customers
and Shareholders.
We set the Standard of Excellence
in Customer Satisfaction,
Employee Engagement,
Social Responsibility and
Shareholder Value, while building
successful societies.
Our mission is to provide
Personalised, Efficient
and Competitively-priced
Financial Services
and to implement Sound Policies
which will redound to the benefit
of our Customers, Staff,
Shareholders and the Communities
we serve.
• Customer Focus
• Integrity
• Respect for the Individual
• Professionalism
• Results Orientation
OurVision
OurMission
OurValues

4 5
1 CORPORATE INFORMATIONLinked to Growth

6 7
GRENADAGHANA
GUYANA SURINAME
TRINIDAD AND TOBAGO
BARBADOS
THE COUNTRIES IN WHICH WE OPERATE
CAYMAN
7
Republic Bank (Barbados) Limited 100%
Republic Wealth Management Limited 100%
Republic Securities Limited100%
London Street Project Company Limited 100%
Republic Bank (Grenada) Limited 74.1%
Atlantic Financial Limited 100%
HFC Bank (Ghana) Limited 57.1%
Republic Finance & Trust (Barbados) Corporation 100%
Republic Insurance Company (Cayman) Limited 100%
Republic (Suriname) Holdings Limited 100%
Republic Caribbean Investments Limited 100%
Republic Bank Trinidad and Tobago (Barbados) Limited 100%
Republic Investments Limited 100%
Republic Bank (Guyana) Limited 51%
Republic Bank (Cayman) Limited 100%
East Caribbean Financial Holding 19.3%
Republic Bank (Suriname) N.V.100%
REPUBLIC FINANCIAL HOLDINGS LIMITED
OUR CORPORATE STRUCTURE
Republic Bank Limited100%

8 9
2003 2006 2012 2015From the 2013 acquision of
40% of HFC Bank (Ghana)
Limited, acquired an additional
19.25% shareholding. This
increased the shareholdings to
a 57.11% majority.
Acquired 100% shareholding
in RBC Suriname N.V. which
was re-branded Republic Bank
(Suriname) N.V.
Acquired 100% shareholding
in Royal Overseas Holdings
(St. Lucia) Limited which was
re-branded Republic Suriname
Holdings Limited.
The Group was restructured
which resulted in Republic
Bank Financial Holdings
Limited being established.
National Bank of Industry &
Commerce (NBIC), the Bank’s
subsidiary in Guyana, acquired
the assets of Guyana National
Co-operative Bank (GNCB).
Acquired a 57.23% majority
shareholding in Barbados
National Bank Inc. (BNB).
Shareholding later increased
to 65.1%.
Acquired a 99% shareholding
in Banco Mercantil S.A. in the
Dominican Republic.
Acquired a 20% shareholding
in East Caribbean Financial
Holding Company Limited
(ECFH), the Parent Company
of the Bank of Saint Lucia
Limited, one of the few regional
banks providing development
banking services to assist in the
expansion of the productive
and social sectors of St. Lucia.
National Commercial Bank of
Grenada Limited re-branded
to Republic Bank (Grenada)
Limited.
Acquired the operations
of Dextra Bank and Trust
Company through Republic
Bank Trinidad and Tobago
(Cayman) Limited.
National Bank of Industry and
Commerce Ltd. re-branded
to Republic Bank (Guyana)
Limited.
Republic Bank (DR) S.A. sold
retail portfolio.
Republic Bank celebrates 175th
Anniversary
Barbados National Bank Inc.
re-branded to Republic Bank
(Barbados) Limited.
OUR MILESTONES IN HISTORY
1937 1981 1992 1997Acquired 51% shareholding in
National Bank of Industry and
Commerce Limited (NBIC), the
largest commercial bank in
Guyana.
After purchasing 23% of
Bank of Commerce Trinidad
and Tobago Limited in 1994,
1997 showed the successful
completion of integration
of Bank of Commerce with
Republic Bank Limited.
Acquisition was one of the
largest and most successful
organisational transformations
within the Caribbean and
resulted in the Bank having
the largest branch and ABM
networks in Trinidad and
Tobago.
The Colonial Bank, the first
commercial bank in Trinidad,
opened its doors for business.
With The Colonial Bank
Act of 1925, the Bank was
amalgamated with the National
Bank of South Africa Limited
and the Anglo-Egyptian
Bank to become Dominion,
Colonial and Overseas D.C.O.
was renamed Barclays Bank
International Limited. The
following year, the Bank’s
operations were localised and
the institution was renamed
Barclay’s Bank of Trinidad and
Tobago.
The passing of a special
resolution at an Extraordinary
General Meeting of the
Company, the Bank took the
name Republic Bank Limited.
Purchased a 51% shareholding
in the National Commercial
Bank of Grenada Limited (NCB).
10 11
DIRECTORS
Chairman
Ronald F. deC. Harford, CMT, FCIB, FIBAF, FCABFI, LLD
President
Nigel M. Baptiste, BSc (Econ.) (Hons.), MSc (Econ.), ACIB
Directors
Shazan Ali, BSc (Mechanical Eng.)
Dawn Callender, FCCA, CPA, MBA
Terrence W. Farrell, PhD, LLB, LEC
Alison Lewis, MOM, BA (Econ. and Mgmt.)
William P. Lucie-Smith, MA (Oxon), FCA
Russell Martineau, CMT, SC, LLM (Lond.)
Robert Riley, CMT, BSc (Agri. Sc.), LLB, LEC, EMBA
Kristine Thompson, B.Comm., MBA
Gregory I. Thomson, BSc (Math and Physics), MBA
EXECUTIVE MANAGEMENT
Chief Financial Officer
Parasram Salickram, FCCA, ACMA, CGMA, CA, CFA
Chief Risk Officer
Anthony C. Subero, Dip. (Business Mgmt.), IMIS, PMP, MBA
Chief Internal Auditor
Riah Dass-Mungal, BSc (Acct.), FCCA
Group General Counsel/Corporate Secretary
Jacqueline H.C. Quamina, LLB, MA, MBA, FIBF
REGISTERED OFFICE
Republic House
4th Floor
9-17 Park Street, Port of Spain
Trinidad and Tobago, West Indies
GROUP HEAD OFFICE
Republic House
4th Floor
9-17 Park Street, Port of Spain
Trinidad and Tobago, West Indies
Tel: (868) 625-4411, 623-1056
Fax: (868) 624-1323
Swift: RBNKTTPX
Email: [email protected]
Website: www.republicfinancialholdings.com
REGISTRAR
Trinidad and Tobago Central Depository Limited
10th Floor, Nicholas Tower
63-65 Independence Square, Port of Spain
Trinidad and Tobago, West Indies
ATTORNEYS-AT-LAW
Pollonais, Blanc, de la Bastide & Jacelon
Pembroke Court
17-19 Pembroke Street, Port of Spain
Trinidad and Tobago, West Indies
J.D. Sellier & Company
129-131 Abercromby Street, Port of Spain
Trinidad and Tobago, West Indies
Hobsons
Hobsons Court
13-17 Keate Street, San Fernando
Trinidad and Tobago, West Indies
AUDITORS
Ernst & Young
5-7 Sweet Briar Road
St. Clair, Port of Spain
Trinidad and Tobago, West Indies
CORPORATE INFORMATION
ANNUAL MEETING
NOTICE is hereby given that the First Annual Meeting of Republic
Financial Holdings Limited will be held at the Ballroom of the Hilton
Trinidad and Conference Centre, Lady Young Road, Port of Spain on
Monday December 12, 2016 at 9:30 a.m. for the following purposes:-
1 To receive the Audited Financial Statements of Republic
Financial Holdings Limited for the year ended September 30,
2016 and the Reports of the Directors and Auditors thereon.
2 To take note of the Dividends paid for the twelve-month period
ended September 30, 2016.
3 To elect Directors.
4 To re-appoint the Auditors, Ernst & Young and to authorise the
Directors to fix their remuneration.
5 Any other business.
By order of the Board
JACQUELINE H.C. QUAMINA
Corporate Secretary
November 3, 2016
NOTES
Persons Entitled to Notice
In accordance with Section 110(2) of the Companies Act Chap. 81:01,
the Directors of the Company have fixed November 14, 2016 as the
Record Date for the determination of shareholders who are entitled
to receive notice of the Annual Meeting. A list of such shareholders
will be available for examination by shareholders at the Office of the
Registrar during usual business hours.
Proxies
Shareholders of the Company entitled to attend and vote at the
Meeting are entitled to appoint one or more proxies to attend, and in
a poll, vote instead of them. A proxy need not be a shareholder. Any
instrument appointing a proxy must be received at the Registrar’s
Office not less than 48 hours before the Meeting. Shareholders who
return completed proxy forms are not precluded, if subsequently
they so wish, from attending the Meeting instead of their proxies and
voting in person. In the event of a poll, their proxy votes lodged with
the Registrar will be excluded.
Dividend
A final dividend of $3.10 declared for the financial year ended
September 30, 2016 will be payable on December 1, 2016 to
shareholders at the close of business on November 14, 2016.
Republic Financial Holdings Limited
This is the First Annual Meeting of Republic Financial Holdings
Limited since the Republic Bank Limited Vesting Order (Legal Notice
#215 of 2015) and the change of name from Republic Bank Limited to
Republic Financial Holdings Limited.
Documents Available for Inspection
No service contracts were granted by the Company or Subsidiary
Companies, to any Director or Proposed Director of the Company.
NOTICE OF MEETING

12 13
DIVIDEND PAYMENTS
Final dividend for year ended September 30, 2016 December 2016
Dividend for half year ending March 31, 2017 May 2017
RESULTS
Publication of results for first quarter to December 31, 2016 February 2017
Publication of results for half year to March 31, 2017 May 2017
Publication of results for third quarter to June 30, 2017 August 2017
Publication of results for year ending September 30, 2017 November 2017
Report and Accounts mailing November 2017
Annual Meeting December 2017
GROUP FINANCIAL CALENDARCONSOLIDATED FINANCIAL SUMMARYAll figures are in thousands of Trinidad and Tobago dollars ($’000)
2016 2015 2014 2013 2012
Total assets 66,859,543 66,001,576 59,371,516 57,612,365 51,626,290
Advances 34,292,693 33,007,998 27,095,407 25,235,517 23,317,199
Customers’ deposits 49,631,274 49,711,582 43,770,760 42,098,310 37,090,139
Stated capital 765,950 739,125 704,871 649,932 628,150
Equity 9,542,695 9,410,609 8,746,323 8,516,034 8,510,350
Actual number of shares in issue 162,274 161,999 161,663 161,111 160,929
Weighted average number
of shares - diluted 161,592 161,662 161,467 160,768 159,776
Profit after taxation and
non-controlling interest 946,307 1,223,648 1,193,390 1,151,021 1,158,968
Dividends based on the results
of the financial year 705,820 704,665 686,865 683,527 683,950
Dividends paid during the year 704,967 687,597 685,251 683,028 642,819
Dividend per share based on the results
of the financial year $4.35 $4.35 $4.25 $4.25 $4.25
Dividend per share paid during the year $4.35 $4.25 $4.25 $4.25 $3.65
Earnings per share (basic) $5.87 $7.59 $7.42 $7.18 $7.27
Return on average assets 1.42% 1.97% 2.10% 2.16% 2.48%
Return on average equity 10.49% 14.09% 14.33% 14.33% 15.48%

14 15
2 BOARD OF DIRECTORS & EXECUTIVESOn Course Together

16 17
ALISON LEWIS
MOM, BA (Economics and Management) Consultant
WILLIAM P. LUCIE-SMITH
MA (Oxon), FCA Retired Chartered
Accountant
RUSSELL MARTINEAU
CMT, SC, LLM (Lond.) Senior Counsel
NIGEL M. BAPTISTE
BSc (Econ.) (Hons.), MSc (Econ.), ACIB President,
Republic Financial Holdings
Limited,
Managing Director,
Republic Bank Limited
SHAZAN ALI
BSc (Mechanical Eng.) Chief Executive Officer,
TOSL Engineering Limited
DAWN CALLENDER
FCCA, CPA, MBA Director,
Finance and Risk Management,
Power Generation Company
of Trinidad and Tobago
TERRENCE W. FARRELL
PhD, LLB, LEC Consultant
BOARD OF DIRECTORS
RONALD F. deC. HARFORD
CMT, FCIB, FIBAF, FCABFI, LLD
Chairman,
Republic Financial Holdings
Limited

18 19
ROBERT RILEY
CMT, BSc (Agri. Sc.), LLB, LEC, EMBA Executive Director,
Robert Riley Leadership
and Energy Consulting
KRISTINE THOMPSON
B.Comm, MBA Entrepreneur
GREGORY I. THOMSON
BSc (Math and Physics), MBA Consultant
BOARD OF DIRECTORS
RONALD F. deC. HARFORD Age 71
CMT, FCIB, FIBAF, FCABFI, LLD
Chairman, Republic Financial Holdings Limited
Ronald F. deC. Harford, Chairman of Republic Financial Holdings
Limited and Republic Bank Limited, is a career banker, who has
celebrated over 53 years of service with Republic Bank Limited.
Mr. Harford is a Fellow of the UK Chartered Institute of Bankers,
the Institute of Banking of Trinidad and Tobago and the Caribbean
Association of Banking and Finance. He is the Chairman of Republic
Bank (Barbados) Ltd., (formerly Barbados National Bank Inc.),
Republic Bank Trinidad and Tobago (Barbados) Limited, Republic
Bank (Grenada) Limited and the Campaign Cabinet for Habitat for
Humanity Trinidad and Tobago. He is also the Deputy Chairman of
the Arthur Lok Jack Graduate School of Business – UWI, a Director of
Caribbean Information & Credit Rating Services Limited and a former
Director of the Grenada Industrial Corporation. He is a past President
of the Bankers Association of Trinidad and Tobago and the Trinidad &
Tobago Red Cross Society and the former Chairman of The University
of the West Indies (UWI) Development and Endowment Fund, having
served on the Board for over two decades.
Mr. Harford is a former founding Director of the Trinidad and Tobago
Debates Commission and led the private sector funding that enabled
the Commission to be established and hold a successful political
debate on Local Government.
On August 31, 2010 Mr. Harford was awarded the Chaconia Medal
Gold by the Government of Trinidad and Tobago for his meritorious
contribution to banking and the business community.
Mr. Harford was conferred an Honorary Degree of Doctor of Laws
(LLD) by the University of the West Indies on October 26, 2012 and
was inducted to the Trinidad and Tobago Chamber of Industry and
Commerce Business Hall of Fame on November 10, 2012.
NIGEL M. BAPTISTE Age 50
BSc (Econ.) (Hons.), MSc (Econ.), ACIB
President, Republic Financial Holdings Limited
Managing Director, Republic Bank Limited
Nigel M. Baptiste was appointed President, Republic Financial
Holdings Limited and Managing Director of Republic Bank Limited
on February 11, 2016.
He was first appointed to the Board in 2005, as Executive Director. He
is a First Class Honours Graduate of The University of the West Indies,
an Associate of the Chartered Institute of Banking in England and a
graduate of the Stonier Graduate School of Banking in the United
States of America. Mr. Baptiste serves on the Boards of Republic
Bank (Guyana) Limited, HFC Bank (Ghana) Limited and other entities
within the Republic Bank Group.
SHAZAN ALI Age 69
BSc (Mechanical Eng.)
Chief Executive Officer, TOSL Engineering Limited
Shazan Ali joined the Board of Directors of the Republic Group in
2010. He is the Chief Executive Officer of TOSL Engineering Limited.
He has a wealth of experience in the energy industry and spent
the last 34 years developing TOSL Engineering into a world-class
operation with interests in the wider Caribbean, the Guianas and
Sub-Saharan Africa.
External Appointments
Mr. Ali is the Chairman of Eagle Ibis Consulting Limited and a Council
Member of the Energy Chamber of Trinidad and Tobago (ECTT). In
these roles, he aims to fashion a more proactive energy services
sector that will redound more financial benefits to the Trinidad and
Tobago economy.
DAWN CALLENDER Age 59
FCCA, CPA, MBA
Director, Finance and Risk Management,
Power Generation Company of Trinidad and Tobago
Dawn Callender joined the Board of Directors of the Republic Group
in 2011. She heads the Corporate Strategy Function at the Power

20 21
Generation Company of Trinidad and Tobago (Powergen). She also
holds the position of Director of Finance and Risk Management, and
has worked in the UK, US and Zimbabwe in the fields of business
management, strategic financial management and implementation
of business systems. With over ten years of experience at the
executive management level, Ms. Callender is a Fellow of the
Association of Chartered Certified Accountants (UK) and a Certified
Public Accountant. She holds an MBA from Henley Management
College in the UK and has research interest in the fields of strategy
and leadership.
External Appointments
Ms. Callender is a Director of Trinidad Dry Dock Company Limited.
TERRENCE W. FARRELL Age 63
PhD, LLB, LEC
Consultant
Terrence W. Farrell is Principal of Farrell Law and Mediation, which
provides legal advice as well as mediation and arbitration services.
He is also the Principal Consultant of Terrayanna Investments Limited,
which provides business development and strategy consulting
services. In 2008, he was appointed to the Board of Directors of the
Republic Group.
Dr. Farrell is a former Deputy Governor of the Central Bank of Trinidad
and Tobago. Within the private sector, he has held senior executive
positions at Guardian Holdings Limited and One Caribbean Media
Limited (Group Chief Executive Officer). He studied Economics at
the University of the West Indies, and at the University of Toronto
where he obtained his PhD in 1979. He also holds an LLB (London)
degree, as well as the LEC (Hugh Wooding Law School). He is a Fellow
of the Institute of Banking and Finance of Trinidad and Tobago. He
has published several scholarly articles in Economics, written a book
on Central Banking in Trinidad and Tobago, and co-edited a book
on Caribbean Monetary Integration. His latest book, “The Under-
Achieving Society: Development Policy and Strategy in Trinidad and
Tobago, 1958 - 2008” was published by UWI Press in 2013.
External Appointments
Dr. Farrell is a director of CREDI and Chairman of the Economic
Development Advisory Board.
ALISON LEWIS Age 62
MOM, BA (Econ. and Mgmt.)
Consultant
Alison Lewis was appointed to the Republic Group Board of Directors
in 2014. She is a member on the Economic Development Advisory
Board and a Director at Trinidad Cement Limited.
In August 2015, Ms. Lewis was awarded the Public Service Medal
of Merit (Gold) by the Government of Trinidad and Tobago for her
meritorious and outstanding service. She was a governor of the
Heritage and Stabilisation Fund. She has worked as an Advisor in the
office of Executive Director World Bank, as Permanent Secretary of the
Ministry of Finance and was a former Commissioner on the Securities
and Exchange Commission. Over the last two decades, Ms. Lewis sat
on several Boards of Directors, including those of the Central Bank of
Trinidad and Tobago and the Sovereign Wealth Funds Group.
WILLIAM P. LUCIE-SMITH Age 65
MA (Oxon), FCA
Retired Chartered Accountant
William P. Lucie-Smith is a retired Senior Partner of
PricewaterhouseCoopers Trinidad where he headed its Corporate
Finance and Recoveries practice. He joined the Board of Directors
of Republic Group in 2005. A Chartered Accountant by profession,
Mr. Lucie-Smith holds an MA in Philosophy, Politics and Economics
from Oxford University. He has extensive experience in mergers and
acquisitions, valuation and taxation.
External Appointments
Mr. Lucie-Smith currently serves as a Non-Executive Director on
a number of Boards including Massy Holdings Ltd. and Sagicor
Financial Corporation.
RUSSELL MARTINEAU Age 71
CMT, SC, LLM (Lond.)
Senior Counsel
Russell Martineau joined the Republic Group Board of Directors in
1999. He has been Senior Counsel since 1993 and is a member of the
Bar in England and Wales, Barbados, Antigua, St. Lucia, St. Vincent,
BOARD OF DIRECTORS
Grenada, Dominica and Trinidad and Tobago. He is Chairman of
the A.N.R. Robinson Library, Museum and Ethics Centre; a former
Attorney General of Trinidad and Tobago and a former President
of the Law Association of Trinidad and Tobago. In August 2012,
Mr. Martineau was awarded the Chaconia Medal (Gold) by the
Government of Trinidad and Tobago for his meritorious contribution
to the field of law.
External Appointments
Mr. Martineau is a member of the Board of Directors of Caribbean
Finance Company Limited.
ROBERT RILEY Age 59
CMT, BSc (Agri. Sc.), LLB, LEC, EMBA
Executive Director, Robert Riley Leadership and Energy Consulting
Robert Riley joined the Board of Directors, Republic Financial
Holdings Limited, on October 1, 2016.
During his professional career, which spans more than three
decades, Mr. Riley has held a number of executive management and
senior legal positions, including Group Head of Safety and Operation
Risk, BP PLC (London); Chairman and Chief Executive Officer, BP
Trinidad and Tobago; Business Unit Leader, BP Amoco Trinidad; Vice
President, Legal and Government Affairs, Amoco and BP/Amoco;
General Counsel and Corporate Secretary, BWIA; Attorney, Legal and
Government Affairs, Amoco Trinidad; and Advocate Attorney-at-Law,
JD Sellier & Co.
An Attorney-at-Law, admitted to the Supreme Court in 1987, Mr.
Riley holds a Consortium Executive MBA from the Thunderbird
American Graduate School of International Management; a Bachelor
of Laws (Hons.) from the University of the West Indies, Barbados; and
BSc. (Hons) in Agricultural Science from the University of the West
Indies, St. Augustine, Trinidad. In 2003, he was awarded a Chaconia
Medal (Gold) for Contribution to National Development, and in 2009,
he was awarded a Doctor of Laws Honoris Causa from the University
of the West Indies, St. Augustine.
External Appointments
Mr. Riley has served as Chairman, Amoco Trinidad and Tobago LLC and
other Amoco Entities; Executive Director, Titan Methanol; Executive
Chairman, BP Trinidad and Tobago LLC; Executive Director, Atlantic
LNG Boards; Executive Director, PowerGen; Director, Bank of Nova
Scotia Trinidad and Tobago Limited; Founder Director, University of
Trinidad and Tobago (UTT); and Director, Caribbean Airlines Limited.
Currently, Mr. Riley serves as Director, Sequis LLC (Internet Software
Company); and Non-Executive Director, Massy Holdings Limited.
KRISTINE THOMPSON Age 45
B. Comm., MBA
Entrepreneur
Kristine Thompson joined the Republic Group Board of Directors in
2011. She owns and operates the Chuck E. Cheese’s family restaurant
franchise in Trinidad. Prior to this, she was heavily involved in project
development, particularly in the energy sector, and has extensive
experience in the fields of finance, private equity, mergers and
acquisitions and general management. The early years of her career
were spent in management consulting with the Boston Consulting
Group (BCG) where she advised Fortune 500 companies, with stints
at BCG’s Toronto, New York, Buenos Aires and Melbourne offices.
She then headed the business development function at Guardian
Holdings for many years. She holds a Bachelor of Commerce degree
from Queen’s University in Canada and a Master’s Degree in Business
Administration from the Harvard Business School.
External Appointments
Mrs. Thompson currently serves as a Non-Executive Director on the
Boards of the Caribbean Communications Network (CCN) and the
Arthur Lok Jack Graduate School of Business.
GREGORY I. THOMSON Age 64
BSc (Math and Physics), MBA
Consultant
Gregory I. Thomson has over 35 years of experience in Banking and
Finance. He was the Deputy Managing Director of Republic Bank
Limited for seven years and retired from this postion in 2012. Mr.
Thomson joined the Board of Directors in 2014. Mr. Thomson holds
a Bachelor of Science Degree in Mathematics and Physics from The
University of the West Indies and a Master of Business Administration
(MBA) degree from the University of Western Ontario, Canada.

22 23
DIRECTORS’ REPORT
10 LARGEST SHAREHOLDERS
Shareholder Ordinary Shares %
CLICO Trust Corporation Ltd. 40,072,299 24.69
National Insurance Board 29,104,942 17.94
CLICO Investment Bank Ltd. (In liquidation) 16,196,905 9.98
Trintrust Limited 14,687,491 9.05
First Company Limited 13,191,640 8.13
Colonial Life Insurance Company Ltd. 11,786,000 7.26
RBC Trust Limited 5,728,833 3.53
First Citizens Trust & Merchant Bank Ltd. 4,444,069 2.74
Trinidad & Tobago Unit Trust Corporation 2,265,290 1.40
Guardian Life of the Caribbean Ltd. 2,166,998 1.34
DIRECTORS
In accordance with By-law No. 1, Paragraph 4.4, Messrs. Shazan Ali, William P. Lucie-Smith and Mrs. Kristine Thompson retire from the Board by
rotation and being eligible offer themselves for re-election for a term expiring at the close of the third annual meeting following this appointment.
Mr. Robert Riley was appointed a Director on October 1, 2016 to fill a casual vacancy. In accordance with By-law No. 1, Paragraph 4.4.5, Mr. Riley,
having been appointed since the last meeting, retires from the Board and being eligible, offers himself for re-election for a term expiring at the
close of the second annual meeting following this appointment.
COMMUNITY INVOLVEMENT
The Power to Make A Difference
With the first steps under a new banner as Republic Financial Holdings Limited, the Group’s commitment to serve – the very heart of the Power
to Make A Difference – gained even greater momentum as relationships were strengthened with diverse societies across the English-speaking
Caribbean and bonds formed in South America and Africa.
The journey that started more than a decade ago in collaboration with non-governmental and charitable communities to alleviate social ills,
through investment and collaboration, continues to define the Group as a responsible corporate citizen in every market that Republic Financial
Holdings Limited now calls home. In this new era, the goal remains to reach out to an even wider cross section of people in providing much-
needed assistance in the fight for poverty alleviation, youth development through sport, culture, the arts, and education, advocating the rights
of the differently able, and providing a better standard of life for the sick, the socially marginalised, and elderly.
Regionally, flagship youth empowerment investments – the Republic Bank Youth Link Apprenticeship Programme, Republic Cup Youth Football
and the Republic Bank Pan Minors Music Literacy Programme were maintained. Adding to that, new territory in literacy and education was
charted, thanks to partnerships with the Cropper Foundation and their Teen Writer’s Workshop (Trinidad), the T.A. Marryshow Community College
with the revamping of its Mirabeau Campus computer room (Grenada), the University of Guyana on their National Development Scholarship
Programme, and with the YMCA on their redevelopment project (Barbados).
Your Directors have pleasure in submitting their Report for the year ended September 30, 2016.
FINANCIAL RESULTS AND DIVIDENDS
The Directors report that the Group’s profit after taxation and non-controlling interest for the year ended September 30, 2016 amounted to
$946.3 million.
The Directors have declared a dividend of $3.10 per share for the year ended September 30, 2016. A half-year dividend of $1.25 per share was
paid on June 1, 2016, making a total dividend on each share of $4.35 (2015: $4.35).
Set out below are the names of the Directors and Senior Officers with an interest in the Company as at September 30, 2016 together with their
connected parties and our ten (10) largest shareholders.
DIRECTORS AND SENIOR OFFICERS
Director/Senior Officer Shareholding Connected Party Shareholding
Shazan Ali 11,212
Nigel M. Baptiste 17,070
Dawn Callender 1,000
Terrence W. Farrell -
Ronald F. deC. Harford 4,574
Alison Lewis -
William P. Lucie-Smith - 7,500
Russell Martineau - 1,000
Robert Riley 1,000
Kristine Thompson -
Gregory I. Thomson 15,917
Jacqueline H.C. Quamina 29,197 2,702
Parasram Salickram 10,183
Anthony C. Subero 9,294
Riah Dass-Mungal 4,283
There has been no change in these interests occurring between the end of the Company’s year and one month prior to the date convening the
Annual Meeting.

24 25
The Group remained steadfast in support of raising awareness around health and social issues like cancer, diabetes, autism and dyslexia, as once
again strong ties were forged with the Trinidad and Tobago Cancer Society, the Grenada Cancer Society, the Autistic Society of Trinidad and
Tobago (ALTA), Step-by-Step Foundation – School for Autistic Children (Guyana), the Dyslexia Association (Trinidad and Tobago), the National
Centre for Persons with Disabilities, Women Across Differences (Guyana), the Dorothy Hopkin Centre for the Disabled (Grenada), Persons
Associated with Visual Impairment (P.A.V.I.), and the Irving Wilson School for the Blind and the Deaf (Barbados).
Committed to championing social investment by example, staff members channelled their time, energy, and effort – that unique Republic spirit
of kinship – into the Group’s staff volunteerism programme, working hand-in-hand with charities across the region to make a difference. They
worked together to provide and refurbish homes for families, orphans, and senior citizens in need, refurnish a pediatric ward, and repair and
restore a library and a basketball court for a diversity of communities across the region.
Without a doubt, as the drive to accentuate corporate citizenship, under the banner of Republic Financial Holding Limited, takes us into uncharted
but familiar territories, in this new phase, the Group looks forward to working together as one with employees, customers, and communities
across the diversity of markets. The Group will make a greater push toward sustainable development; one where new opportunities to build will
arise, and existing relationships strengthened as the best possible way to create a meaningful, long-lasting impact and contribute to a thriving,
sustainable tomorrow.
AUDITORS
The retiring Auditors, Ernst & Young have expressed their willingness to be re-appointed and a resolution to that effect will be proposed at the
Annual Meeting.
By order of the Board
JACQUELINE H.C. QUAMINA
Corporate Secretary
DIRECTORS’ REPORT CHAIRMAN’S REVIEWRESULTS
Republic Financial Holdings Limited (RFHL) and its subsidiaries,
recorded core profits attributable to equity holders of the parent of
$1.18 billion for the year ended September 30, 2016, an increase of
$8.4 million or 0.7% over the core profits of the prior year. However,
when the impact of the following one-off items totalling $236.9
million is accounted for, we achieved profits after tax of $946.3
million, a decrease of $277.3 million or 22.7% from the prior year. The
three items were:
1 Goodwill impairment of $107.3 million recognised on
investment in HFC Bank (Ghana) Limited (HFC);
2 A loss of $117.8 million recorded by HFC, of which RFHL’s 57.11%
share is $67.8 million and;
3 A $61.8 million impairment charge of RFHL’s 19.3% stake in East
Caribbean Financial Holdings Limited (ECFH).
A full discussion of these three items can be found in the President’s
Discussion and Analysis contained on pages 27 to 38 of this report.
Based on these results, the Board of Directors has declared a final
dividend of $3.10 (2015: $3.10), which brings the total dividend
for the fiscal year to $4.35 (2015: $4.35). This final dividend, which
represents a payout ratio of 74.6% (2015: 57.4%), will be paid on
December 1, 2016 to all shareholders on record at November 14,
2016.
KEY HIGHLIGHTS FOR THE YEAR
Holding Company
On December 16, 2015, Republic Financial Holdings Limited (RFHL)
was created, the umbrella company for all of our main banking
subsidiaries. The holding company structure will better enable us to
segregate and isolate the risk among the various group companies,
will allow for a more efficient deployment of capital, and will bring us
in line with international best practice.
Acquisitions
In the last quarter of the Fiscal 2016, RFHL acquired a further 23.12%
shareholding in Republic Bank (Grenada) Limited, increasing our
total shareholding from 51% to 74.12%. This larger shareholding is in
RONALD F. deC. HARFORD

26 27
keeping with our focus of deepening our footprint across the region
and creating the platform for greater operational synergies across
the Group.
During the year, we continued the integration process of our new
subsidiaries in Ghana and Suriname through implementation of
common policies and procedures and secondment and cross-
training of staff.
Regulations
RFHL and its main subsidiary, Republic Bank Limited (RBL), have
commenced the preparatory work for the implementation of the
Basel II and III framework in Trinidad and Tobago. While the new
requirements, in their current forms, will require banks to hold
substantially more capital, RFHL and RBL, with their existing strong
capital base, fully expect to satisfy the new requirements.
THE GLOBAL ECONOMY
The global economy is expected to expand by 3.1% in 2016,
marginally down from 2015 (3.2%). Growth in 2016 was restrained
by Brexit and the weaker-than-expected growth in the US economy.
Advanced economies recorded a weak performance during the year,
with GDP projected to ease to 1.6% compared to 2.1% in 2015.
Emerging market and developing economies are expected to
expand by 4.2% in 2016 compared to 4% in 2015. Despite this slight
improvement, the slowdown in the Chinese economy provides
substantial downside risks for these economies going forward.
China’s GDP is expected to slow further in 2016, to 6.6%, as it
continues its efforts to rebalance its economy.
THE REGIONAL ECONOMY
In 2016, the divergence between tourism-dependent and
commodity-exporting countries continued. Economic activity in
tourism-dependent economies is anticipated to expand by 2.2% in
2016, up from 1.2% in 2015. Conversely, the economies of commodity
exporters are projected to contract by an estimated 0.6% in 2016,
following a slide of 0.9% in 2015.
Trinidad and Tobago
After a GDP contraction of 3% year-on-year in the fourth quarter
of 2015, continued weak performances in both the energy and
non-energy sectors ensured that the domestic economy remained
in the doldrums in 2016. Real GDP is projected to decline by 2.3%
in 2016. The performance of the energy sector was suppressed by
weak global energy prices and lower domestic production. Oil prices
averaged US$42.78 in 2016, compared to US$56.49 in 2015, while oil
output fell from 81,059 barrels per day (b/d) to average 71,182 b/d
for the first eight months of 2016. Natural gas output contracted by
more than 11% compared to 2015, thereby placing a damper on the
downstream sector. Similarly, the non-energy sector struggled, with
the manufacturing sub-sector negatively impacted by the closure of
the country’s largest iron and steel plant, Arcelor Mittal. Construction
activity fell substantially, while the distribution sector contracted for
a third successive year.
The fiscal deficit widened from 1.8% of GDP in fiscal 2015 to 5% of
GDP in fiscal 2016. Given its current fiscal constraints, the Government
embarked on, and successfully completed, an initiative to raise
debt financing; raising in excess of $10 billion on the domestic
and international markets in 2016. Net public sector debt has now
increased from 50.9% of GDP in fiscal 2015 to 60.8% of GDP in fiscal
2016.
Looking ahead, the domestic economy may experience a boost
in construction activity, as the government plans to commence a
number of projects in the next fiscal. However, the energy sector is
expected to face continued challenges in the new fiscal, with global
energy prices forecasted to remain weak. In this regard, the plan by
the current administration to provide incentives to encourage the
recovery of an estimated 3 billion barrels of “stranded oil” is timely.
Gas production is likely to receive a boost in 2017, with new output
expected to be released to the market.
Barbados
Economic activity picked up slightly in 2015, with growth of 0.9%,
driven largely by an increase in private investment and a 14% surge
in tourism arrivals. Barbados’ economy grew by a further 1.3% in
the first half of 2016; mainly due to the tourism sector, which saw a
5.3% increase in long-stay visitors. Growth is expected to reach 1.5%
in 2016 as some major projects got off the ground. In spite of the
improved economic performance, the 2016 fiscal deficit worsened to
7.4% of GDP, while total debt to GDP stood at 108% by June 30th.
International reserves fell by $43 million in the first half of 2016 to
$884 million, equivalent to 13.6 weeks of import cover.
In April 2016, Moody’s Investor Services lowered Barbados’ credit
rating from B3 to Caa1 with a ‘stable’ outlook. Later in the year,
CHAIRMAN’S REVIEW
Standard and Poor’s (S&P) also lowered its long-term foreign and
local currency sovereign ratings on Barbados to B- from B with a
“negative” outlook for the island.
Ghana
The Ghanaian economy expanded by 3.9% in 2015 and is projected
to grow by 3.3% in 2016. In 2015, the main drivers for growth were the
services, trade and information and communication sectors. Slower
growth is expected in 2016 due to disruptions in oil production and
a subdued non-energy sector. The fiscal deficit was 6.9% of GDP
in 2015 and this deficit is projected to fall to 5.2% of GDP in 2016.
Fiscal consolidation was challenging in 2016, due to low domestic
revenues resulting from the weaker performance of the oil-sector
and overall weak economic activity. However, the Government was
able to cut expenditure by reducing capital spending and transfers
during the first half of 2016. Total Public Sector Debt is forecasted
to be 70.4% of GDP in 2016, but the government’s ongoing fiscal
consolidation programme is expected to gradually reduce this figure
in coming years. Crucially, the Cedi which had depreciated by 18%
in 2015, displayed considerably more stability in 2016 with only a 4%
depreciation recorded up to October 28, 2016.
Oil production is likely to be boosted in 2017 with the coming online
of a second Tweneboa, Enyenra, Ntomme (TEN) oilfield. On the
other hand, the non-oil sector will remain subdued, given tight fiscal
measures and strict monetary policies. The country’s fiscal accounts
are expected to improve under the IMF’s Extended Credit Facility
Arrangement.
Grenada
Grenada recorded economic growth of 4.6% in 2015, due largely
to the expansion of agriculture, tourism and tourism-related
construction. Stay-over tourist arrivals increased by 5.6% in 2015, but
this growth created relatively few jobs, resulting in little improvement
in the unemployment rate which stands around 30%. Grenada’s
tourist arrivals remained strong in 2016 with an estimated 10.3%
increase in arrivals during the first half of this year. Initiatives to
enhance tax collection resulted in Grenada achieving a fiscal surplus
of 2.2% of GDP in 2015 - its first surplus in a decade. The discipline
and determination continued in 2016 with a 3% fiscal surplus in the
first half of the year. Ongoing debt restructuring efforts have seen
the country’s debt to GDP ratio fall from 101.4% in 2014 to 85% in
June 2016. The IMF expects Grenada’s economic growth to moderate
to a more sustainable rate of 3% in 2016 and 2.7% in 2017.
Guyana
Guyana’s economy achieved growth of 3% in 2015. While protracted
low prices for gold and alumina weakened the revenue stream from
these commodities, economic activity and output were boosted
in the last third of the year with the September start-up of the
Aurora gold mine in Cuyuni-Mazaruni, followed by the opening
of the Karouni gold mine in the Essequibo region in October. The
Government’s fiscal balance improved markedly from a deficit of
5.6% of GDP in 2014 to a deficit of just 0.2% in 2015. Debt to GDP also
improved to 48.2% by year’s end. International reserves remained at
around 3.5 months of import cover as weaker reserve accumulation
was offset by a lower oil import bill.
Guyana’s economy grew by 2% in the first half of 2016 largely
due to the mining and quarrying sector, driven again by strong
outputs of gold, diamonds and bauxite. Nonetheless, revenue from
diamonds and bauxite declined overall due to lower world market
prices. Growth for 2016 is expected to reach 4% as additional gold
mining projects come on stream, agriculture output improves and
oil-related investment picks up. The IMF projects a similar level of
growth in 2017.
Suriname
Suriname’s economy continued to be challenged by the fall in
international commodity prices and the shutdown of its alumina
industry. The ensuing drop in revenue inflows combined with an
increase of government spending resulted in a deterioration of the
country’s fiscal balance to -8.8% of GDP in 2015. Foreign reserves
fell by almost 50% to US$355 million at the end of 2015, and, in an
attempt to arrest this slide, the Surinamese dollar was devalued by
21% in November 2015. In March 2016, the authorities floated the
dollar, leading to a depreciation of roughly 60% and a cumulative
depreciation of 90% from October 2015.
As a result of the significant deterioration in a number of its key
indicators, in May 2016, Moody’s lowered Suriname’s credit rating
from Ba3 to B1 with a ‘stable’ outlook. This followed downgrades by
Fitch Ratings in February 2016 (from BB- to B+, Negative outlook) and
Standard and Poor’s in April 2016 (from BB- to B+, Negative outlook).
Following growth of 0.1% in 2015, Suriname’s economy is expected
to contract by 2% in 2016, as a result of the significant weakening
of its key drivers, while its debt-to-GDP ratio is likely to increase to a
still respectable 46% in 2016 before declining thereafter. The IMF has

28 29
CHAIRMAN’S REVIEW
forecasted growth of 2.5% for Suriname in 2017, driven by increased
economic activity associated with the coming on stream of the
Newmont Gold Mine and the Staatsolie Oil refinery upgrade.
OUTLOOK
Global oil prices are expected to remain weak in 2017, while European
and British interest rates are expected to remain unchanged. Interest
rates in the US are expected to increase in the short term, albeit
marginally. This environment along with the continued possibility
of more de-risking by major international banks, will adversely
impact economic fortunes in emerging markets generally, and the
Caribbean, in particular.
Despite economic challenges in several of the countries in which
we operate, we are optimistic that given our strong asset base and
sound risk management policies, we will achieve a satisfactory
performance in 2017.
I wish to acknowledge and thank Mr. David Dulal-Whiteway,
President, who retired in February 2016, for his sterling service to
the Group for over 25 years; 10 of which was served in the capacity
of Managing Director of the Bank. I also welcome Mr. Nigel Baptiste,
who assumed the role of President following Mr. David Dulal-
Whiteway’s retirement.
I wish to recognise and thank Mr. Chandrabhan Sharma for over 19
years dedicated service to the Group. I also take this opportunity to
warmly welcome Mr. Robert Riley, who joined the Board in October
2016.
I thank all our valued stakeholders of RFHL and its subsidiaries for
their continued commitment, loyalty and support throughout the
year.
PRESIDENT’S DISCUSSION AND ANALYSISINTRODUCTION
Republic Financial Holdings Limited (RFHL) and its subsidiaries
recorded profit attributable to equity holders of the parent of $946.3
million for the year ended September 30, 2016, a decrease of $277.3
million or 22.7% compared to the prior year. These results were
affected by three major one-off items which occurred in the last
quarter of the fiscal.
Excluding these one-off items, profit attributable to equity holders
of the parent grew by $8.4 million or 0.7%, comparable with the
growth rate reported in the first three quarters. This is analysed in
the following table:
NIGEL M. BAPTISTE

30 31
1 The acquisition of a controlling interest of 57.11% in HFC Bank (Ghana) Limited (HFC) over the period November 2012 to April 2015 gave
rise to a final goodwill position of $230 million after recognising intangible assets of $40.2 million. As required by International Financial
Reporting Standards, the goodwill was tested for impairment and an amount of $107.3 million was considered to be impaired. The following
were the major reasons for the impairment:
a At the time of the first investment in HFC, the Ghana Cedi per US Dollar was 1.89, and at September 2016, it was 4.03; a depreciation of
114%. It means, therefore, that the level of earnings, when converted to Trinidad and Tobago dollars, will be less than half of what was
originally envisaged.
b The level of non-performing loans (NPL’s) increased after acquisition mainly due to large unexpected losses in the corporate sector.
NPL’s to gross loans at September 30, 2016 is 31.3%, compared with 11.4% at the time of gaining controlling interest.
2 HFC’s profits before loan losses grew by $35 million or 219% over the prior year. However, loan losses of $169 million, mainly on loans to the
energy distribution sector, resulted in a loss of $117.8 million, of which RFHL’s 57.11% share is $67.8 million.
3 RFHL’s 19.3% stake in East Caribbean Financial Holdings Limited (ECFH) was written down by $61.8 million after an assessment of the
carrying value. ECFH’s recorded losses, significant variability in earnings over the last five years, and less optimistic growth outlook resulted
in the write-down.
NET PROFIT All figures are in TT$ Millions Notes 2016 2015 Change % Change
Profits attributable to equity holders of the parent,
excluding one-off items 1,183.2 1,174.8 8.4 0.7%
One-off items in 2016 (after-tax):
- Goodwill impairment expense - HFC 1 (107.3)
- RFHL Share of HFC loss 2 (67.8)
- Write-down of investment in ECFH 3 (61.8)
Net one-off losses - 2016 (236.9)
One-off items in 2015 (after-tax):
- One-off recovery on a non-performing corporate loan 4 123.4
- Goodwill impairment - RBL Cayman 4 (31.5)
- RFHL Share of HFC loss 4 (43.0)
Net one-off gains - 2015 48.9
Profits attributable to equity holders of the parent,
as reported 946.3 1,223.6 (277.3) -22.7%
PRESIDENT’S DISCUSSION AND ANALYSIS
4 In 2015, profits were boosted by a recovery of $123.4 million (after tax) on a non-performing facility, which were offset somewhat by
goodwill impairment of $31.5 million for our Cayman operations and losses at HFC of $43 million (RFHL’s share).
Based on these results, the Board of Directors has declared a final dividend of $3.10 per share for the year ended September 30, 2016. When
combined with the interim dividend of $1.25 per share, this brings the total dividend for the year to $4.35 per share.
The following is a detailed discussion and analysis of the financial results of RFHL and its subsidiaries. This should be read in conjunction with the
audited financial statements contained on pages 84 to 164 of this report. All amounts are stated in Trinidad and Tobago dollars.
HFC became a subsidiary on May 1, 2015, and Republic Bank Suriname NV (RBSR) on July 31, 2015. The financial results of these two subsidiaries
were fully consolidated in 2016, but in 2015, the Group results included three months of income and expense from HFC, and no income and
expense items from RBSR. We have excluded the effect of these two subsidiaries for income and expense line items, where practical, to make the
comparison more meaningful.
REVIEW OF THE CONSOLIDATED STATEMENT OF INCOME
Overall, net interest income increased by $604 million or 24.6% in 2016. However, excluding the operations in Ghana and Suriname, which were
not subsidiaries for the whole of the comparative period in 2015, the growth was $313 million or 13%.
NET INTEREST INCOME AND NET INTEREST MARGINS All figures are in TT$ Millions 2016 2015 Change % Change
Interest Income 3,611 2,779 832 29.9%
Interest Expense (553) (326) (228) 69.9%
Net Interest Income 3,057 2,453 604 24.6%
Trinidad and Tobago 1,901 1,688 214 12.7%
Barbados 427 366 62 16.9%
Guyana 214 192 22 11.4%
Cayman/Eastern Caribbean 182 166 16 9.5%
Suriname 83 – 83 100.0%
Ghana 250 42 208 495.3%
Total 3,057 2,453 604 24.6%
Average Total Assets 66,431 62,682 3,749 6.0%
Net interest margin 4.60% 3.91%

32 33
• In Trinidad and Tobago, the loan portfolio grew by $991 million or 4.5%, and the related increase in interest income was $224 million.
Investment securities increased by $1.1 billion, resulting in a $30.9 million increase in interest income. Despite a $1.8 billion decline in the
deposit portfolio in Trinidad and Tobago, increased interest rates on deposit products resulted in a $10 million rise in interest expense, while
a $1.5 billion increase in other fund raising instruments resulted in a $25.3 million increase in interest paid on those instruments.
• In Barbados, the loan portfolio increased by $146 million, resulting in a $10 million increase in interest income and the removal of the
minimum savings rate resulted in reduced interest expenses of $52 million. The combination of these factors resulted in a $62 million
increase in net interest income.
• A $283 million increase in total advances in Guyana resulted in a $20 million increase in interest income.
While average total assets increased by $3.7 billion or 6% in 2016, the 24.6% increase in net interest income and higher spreads in Ghana and
Suriname resulted in an increase in net interest margin, from 3.9% in 2015 to 4.6% in 2016.
Other Income increased by $75 million or 5.6% in 2016 over 2015; however, excluding Ghana and Suriname, this area actually declined by $36
million or 2.8%.
This decline was in Trinidad and Tobago and is the net effect of the following:
• Fees and commissions increased by $44 million, of which commissions from credit card services increased by $34.5 million, and fees from
Trustee services increased by $16.5 million. These increases were slightly offset by a $7 million decline in fees from customer account
services.
• Exchange earnings declined by $46.7 million or 23% as a result of reduced trading volumes and declining spreads.
• Gains on the sale of investments declined by $19 million and other operating income declined by $15 million. These were mainly as a result
of positive one-off items in 2015 which were not repeated in 2016.
OTHER INCOME All figures are in TT$ Millions 2016 2015 Change % Change
Fees and commission income 1,011 827 184 -22.2%
Net exchange trading income 230 283 (52) -18.6%
Gains from disposal of investments 28 28 – -0.7%
Other operating income 145 201 (57) -28.1%
Total Other Income 1,414 1,339 75 5.6%
Trinidad and Tobago 972 1,008 (36) -3.5%
Barbados 142 142 – 0.3%
Guyana 81 89 (8) -8.8%
Cayman/Eastern Caribbean 71 66 5 6.9%
Suriname 51 – 51 100.0%
Ghana 106 45 61 135.6%
Inter-company eliminations (9) (11) 2 19.0%
Total 1,414 1,339 75 5.6%
PRESIDENT’S DISCUSSION AND ANALYSIS
Core operating expenses, excluding costs incurred by Ghana and Suriname in 2015 and 2016, increased by $79.3 million or 3.9%.
The major contributor to this increase was staff costs, which increased by $51.2 million or 5.2%, mainly due to union-negotiated salary increases
in Trinidad and Tobago, Barbados and Grenada.
General administrative expenses increased by $9.6 million or 1.4% mainly in Trinidad and Tobago, where increased costs were incurred for credit
card rewards programs, regulatory fees, security and software license fees.
Increased provisions for rates and taxes and higher property rental and electricity in Trinidad and Tobago resulted in a $17 million or 14.1%
increase in Property-related expenses.
CORE OPERATING EXPENSES All figures are in TT$ Millions 2016 2015 Less Excluding Less Excluding Consolidated Ghana and Ghana and Consolidated Ghana and Ghana and % 2016 Suriname Suriname 2015 Suriname Suriname Change Change
Staff Costs 1,237.8 (203.2) 1,034.5 1,019.8 (36.4) 983.4 51.2 5.2%
General administrative expenses 827.2 (146.2) 681.0 706.3 (34.9) 671.4 9.6 1.4%
Property related expenses 151.7 (14.2) 137.4 120.4 – 120.4 17.0 14.1%
Depreciation 165.6 (25.7) 139.9 145.2 (4.5) 140.6 (0.7) -0.5%
Advertising and public relations 81.7 (8.7) 73.0 76.0 (0.7) 75.3 (2.3) -3.1%
Other 67.1 (9.2) 57.9 56.8 (3.5) 53.3 4.6 8.6%
Total core operating expenses
(excluding Ghana and Suriname) 2,531.1 (407.3) 2,123.8 2,124.5 (79.9) 2,044.5 79.3 3.9%
Trinidad and Tobago 1,593.0 – 1,593.0 1,496.7 – 1,496.7 96.3 6.4%
Barbados 333.3 – 333.3 319.1 – 319.1 14.2 4.4%
Guyana 136.4 – 136.4 133.1 – 133.1 3.3 2.5%
Cayman/Eastern Caribbean 127.0 – 127.0 107.1 – 107.1 19.8 18.5%
Suriname 112.5 (112.5) – – – – – 0.0%
Ghana 294.8 (294.8) – 79.9 (79.9) – – 0.0%
Inter-company eliminations (65.9) – (65.9) (11.5) – (11.5) (54.4) 474.5%
Total Core operating expenses 2,531.1 (407.3) 2,123.8 2,124.5 (79.9) 2,044.5 79.3 3.9%

34 35
PRESIDENT’S DISCUSSION AND ANALYSIS
The Group’s loan impairment expense, net of recoveries, increased by $247.4 million or 149.7%. The main contributors were the corporate
and commercial sector, which increased by $245 million, followed by the retail sector of $14.1 million. Impairment on the mortgage portfolio
reduced by $11.7 million.
The increase in impairment expenses was in Trinidad and Tobago and Ghana and was concentrated among a few large loans in the Corporate
and Commercial portfolio. In the case of Trinidad and Tobago, the change was exacerbated by the positive effect of a one-off write back in 2015.
The retail and mortgage portfolios continue to perform satisfactorily relative to the slowdown in our main market, Trinidad and Tobago.
LOAN IMPAIRMENT EXPENSE
All figures are in TT$ Millions 2016 2015 Change % Change
Retail lending 76.7 62.6 14.1 22.5%
Corporate and commercial lending 314.4 69.4 245.0 352.9%
Mortgages 21.5 33.2 (11.7) -35.3%
412.6 165.3 247.4 149.7%
Trinidad and Tobago 139.5 (8.4) 147.9 1752.4%
Barbados 42.0 33.5 8.6 25.6%
Guyana 24.7 17.4 7.3 42.0%
Cayman/Eastern Caribbean 22.1 31.7 (9.5) -30.1%
Suriname 15.5 – 15.5 100.0%
Ghana 168.7 91.2 77.6 85.1%
Total 412.6 165.3 247.4 149.7%
REVIEW OF THE CONSOLIDATED STATEMENT OF FINANCIAL POSITION
All figures are in TT$ Millions 2016 2015 Change % Change
Financial Position
Total assets 66,860 66,002 858 1.3%
Total liquid assets 17,808 20,263 (2,455) -12.1%
Total advances 34,293 33,008 1,285 3.9%
Total investments 10,265 8,094 2,171 26.8%
Total deposits 49,631 49,712 (80) -0.2%
Total equity 9,543 9,411 132 1.4%
TOTAL ASSETS
As at September 30, 2016, total assets for the Group stood at $66.9 billion; an increase of $858 million or 1.3% over 2015. This growth in assets
includes the net effect of a $2.5 billion decline in liquid assets and increases of $1.3 billion in advances and $2.2 billion in investments.
Liquid assets & deposits and other fund raising instruments
The decline of $2.5 billion or 12.1% in liquid assets emanated mainly from the Trinidad and Tobago operations, where excess liquidity was re-
deployed into higher-yielding loans and investments. This resulted in a decline in the Group’s liquid assets ratio from 30.7% in 2015 to 26.6%
in 2016. This reduction in liquidity is also evident in the decline of $80 million or 0.2% in the deposit portfolio, of which the deposit portfolio in
Trinidad and Tobago declined by $1.8 billion or 5%. This decline in Trinidad and Tobago was however offset by increased deposit balances in
Barbados ($662 million), Guyana ($471 million) and Ghana ($883 million).
Other fund raising instruments increased by $1.3 billion or 48.6% and were the major sources of funding the investment portfolio in Trinidad
and Tobago.
Loans and advances
Loans and advances increased by $1.3 billion or 3.9%, of which $991 million was generated in Trinidad and Tobago (4.1% increase) and $283
million (18% increase) in Guyana. In both these territories, growth in the loan portfolio was attributed mainly to increases in the mortgage and
corporate sectors.
Investments
Total investments increased by $2.1 billion or 26.8%, mainly due to increased investments in the Government Sector in Trinidad and Tobago in
2016, which resulted in a $1.1 billion increase. The Group’s exposure to high-grade US dollar investments increased by $0.5 billion and in Ghana,
the investment portfolio also increased by $0.3 billion as that subsidiary increased its investments in high-yielding assets in that region.
Total Equity
Total equity increased by $132 million to $9.5 billion at September 30, 2016. With a Group Capital adequacy ratio of 24.71% as at September 30,
2016, the Group continues to maintain sufficient capital levels to meet Basel I and Basel II capital requirements.

36 37
PRESIDENT’S DISCUSSION AND ANALYSIS
Loans and advances across the Group increased by $1.3 billion or 3.9% for the year ended September 30, 2016. $665 million or 52% of this growth
was in the mortgage sector and $480 million or 37% in the corporate and commercial sector.
Trinidad and Tobago and Guyana contributed $1.2 billion to the total growth in the loan portfolio through growth in the mortgages and
corporate and commercial sectors. In Suriname, however, while that territory also enjoyed a 52% increase in total loans advanced for the year, the
depreciation of that currency by over 136% during the fiscal resulted in an effective decline of $437 million or 31% when converted to Trinidad
and Tobago dollars.
LOANS AND ADVANCES
All figures are in TT$ Millions 2016 2015 Change % Change
Retail lending 6,058 5,918 140 2.4%
Corporate and commercial lending 15,539 15,059 480 3.2%
Mortgages 12,696 12,031 665 5.5%
34,293 33,008 1,285 3.9%
Trinidad and Tobago 23,307 22,386 921 4.1%
Barbados 4,731 4,585 146 3.2%
Guyana 1,875 1,592 283 17.8%
Cayman/Eastern Caribbean 1,809 1,647 162 9.8%
Suriname 976 1,414 (437) -30.9%
Ghana 1,594 1,384 209 15.1%
Total 34,293 33,008 1,285 3.9%
The Group’s non-performing loans (NPL’s) to gross loans ratio stands at 5.1% as at September 30, 2016, up by 1.4% from 3.7% in 2015. This
resulted from increased NPL’s in Ghana where NPL’s to gross loans increased from 14.3% in 2015 to 31.3% in 2016. We continue to work with that
subsidiary as they transition from their locally-established policies to the Group’s risk management policies.
The level of NPL’s in Trinidad and Tobago remains very low at 1.4% and the level of provision coverage at 71% is considerable. In Barbados, the
NPL ratio declined by 0.2% to 11.4%.
The increase in the level of provisions booked across the Group also resulted in an increase in the Group’s loan provision coverage ratio from
48.9% in 2015 to 49.2% in 2016.
The Group provides for 100% of non-performing loans by recording specific and inherent risk provisions in the consolidated statement of income
and the difference via transfers to a general contingency reserve which is a component of equity. As at September 30, 2016, the combination of
specific and general provisions is in line with target at 100% of NPL’s.
LOANS AND ADVANCES BY TERRITORY Trinidad Cayman and and East Total Total All figures are in TT$ Millions Tobago Barbados Guyana Caribbean Suriname Ghana 2016 2015
Performing loans 23,212 4,347 1,788 1,756 954 1,325 33,383 32,370
Non-performing loans (NPL’s) 327 559 114 134 52 603 1,790 1,250
Gross loans 23,540 4,906 1,903 1,889 1,007 1,929 35,173 33,619
Loan provision (232) (175) (27) (80) (30) (335) (880) (611)
Net loans 23,307 4,731 1,875 1,809 976 1,594 34,293 33,008
Contingency reserve 134 394 89 2 22 269 909 642
Non-performing loans to gross loans 1.4% 11.4% 6.0% 7.1% 5.2% 31.3% 5.1% 3.7%
Loan provision as a % of NPL’s 71.0% 31.4% 24.0% 59.9% 58.1% 55.5% 49.2% 48.9%
Provision and contingency reserves
as a % of Non-performing loans 111.9% 101.8% 102.2% 61.2% 100.0% 100.0% 100.0% 100.3%

38 39
PRESIDENT’S DISCUSSION AND ANALYSIS
PERFORMANCE RATIOS
18.00
15.00
12.00
9.00
6.00
3.00
0
RETURN ON EQUITY (%)RETURN ON ASSETS (%)
3.00
2.50
2.00
1.50
1.00
0.50
0 2012 2013 2014 2015 2016 2016 Core
2012 2013 2014 2015 2016 2016 Core
2.48
2.16
2.10
1.97
1.42
1.78
15.4
8
14.3
3
14.3
3
10.4
914.0
9
13.1
1
140
120
100
80
60
40
20
0 2012 2013 2014 2015 2016
10
8
6
4
2
0
105.
51
110.
04
121.
61
112.
00
109.
99
SHARE PRICE ($)EARNINGS PER SHARE ($)
2012 2013 2014 2015 2016 2016 Core
7.18 7.42 7.59
5.87
7.33
7.27
The 22.7% decline in overall profits resulted in a fall in the Return on Average assets (ROA) ratio from 1.97% in 2015 to 1.42% in 2016.
The reduced profits, combined with a 3.9% increase in average equity, also resulted in a decrease in the Return on Average Equity (ROE) ratio
from 14.09% in 2015 to 10.48% in 2016.
Excluding the one-off items, ROA in 2016 would be 1.78% and ROE 13.11%.
Earnings per Share (EPS) also declined from $7.59 in 2015 to $5.87 in 2016. Assessed against a share price of $109.99 as at September 30, 2016,
the decline in EPS resulted in an increase in the trailing price/earnings (P/E) ratio from 14.8 times in 2015 to 18.8 times in 2016. EPS on core profits
for 2016 would be $7.33, resulting in a P/E ratio of 15.0 times.
Despite the reduced profitability, the dividend payment of $4.35 per share was the same as in 2015. This represents a dividend yield to
shareholders, using a closing share price of $109.99, of 3.95%; an increase of 7 basis points over the 3.88% yield of 2015. However, over the year
the share price declined by $2.01 or 1.8%.
20
18
16
14
12
10
8
6
4
2
0
4.10
4.00
3.90
3.70
3.60
3.50
3.40
3.30
3.20 2012 2013 2014 2015 2016
4.03
3.86
3.49
3.88 3.
95
PRICE EARNINGS RATIO DIVIDEND YIELD (%)
2012 2013 2014 2015 2016 2016 Core
15.1
15.3 16.4
14.8
18.8
15.0
CAPITAL STRUCTURE
Capital adequacy ratio (under Basel I) 2016 2015
Republic Bank Limited 21.18% 21.72%
Republic Bank (Cayman) Limited 26.72% 26.74%
Republic Bank (Grenada) Limited 15.50% 15.60%
Republic Bank (Guyana) Limited 22.38% 22.85%
Republic Bank (Barbados) Limited 16.48% 19.78%
Republic Bank (Suriname) N.V. 9.40% 15.37%
HFC Bank (Ghana) Limited 12.08% 14.20%
Atlantic Financial Limited 50.80% 52.73%
40 41
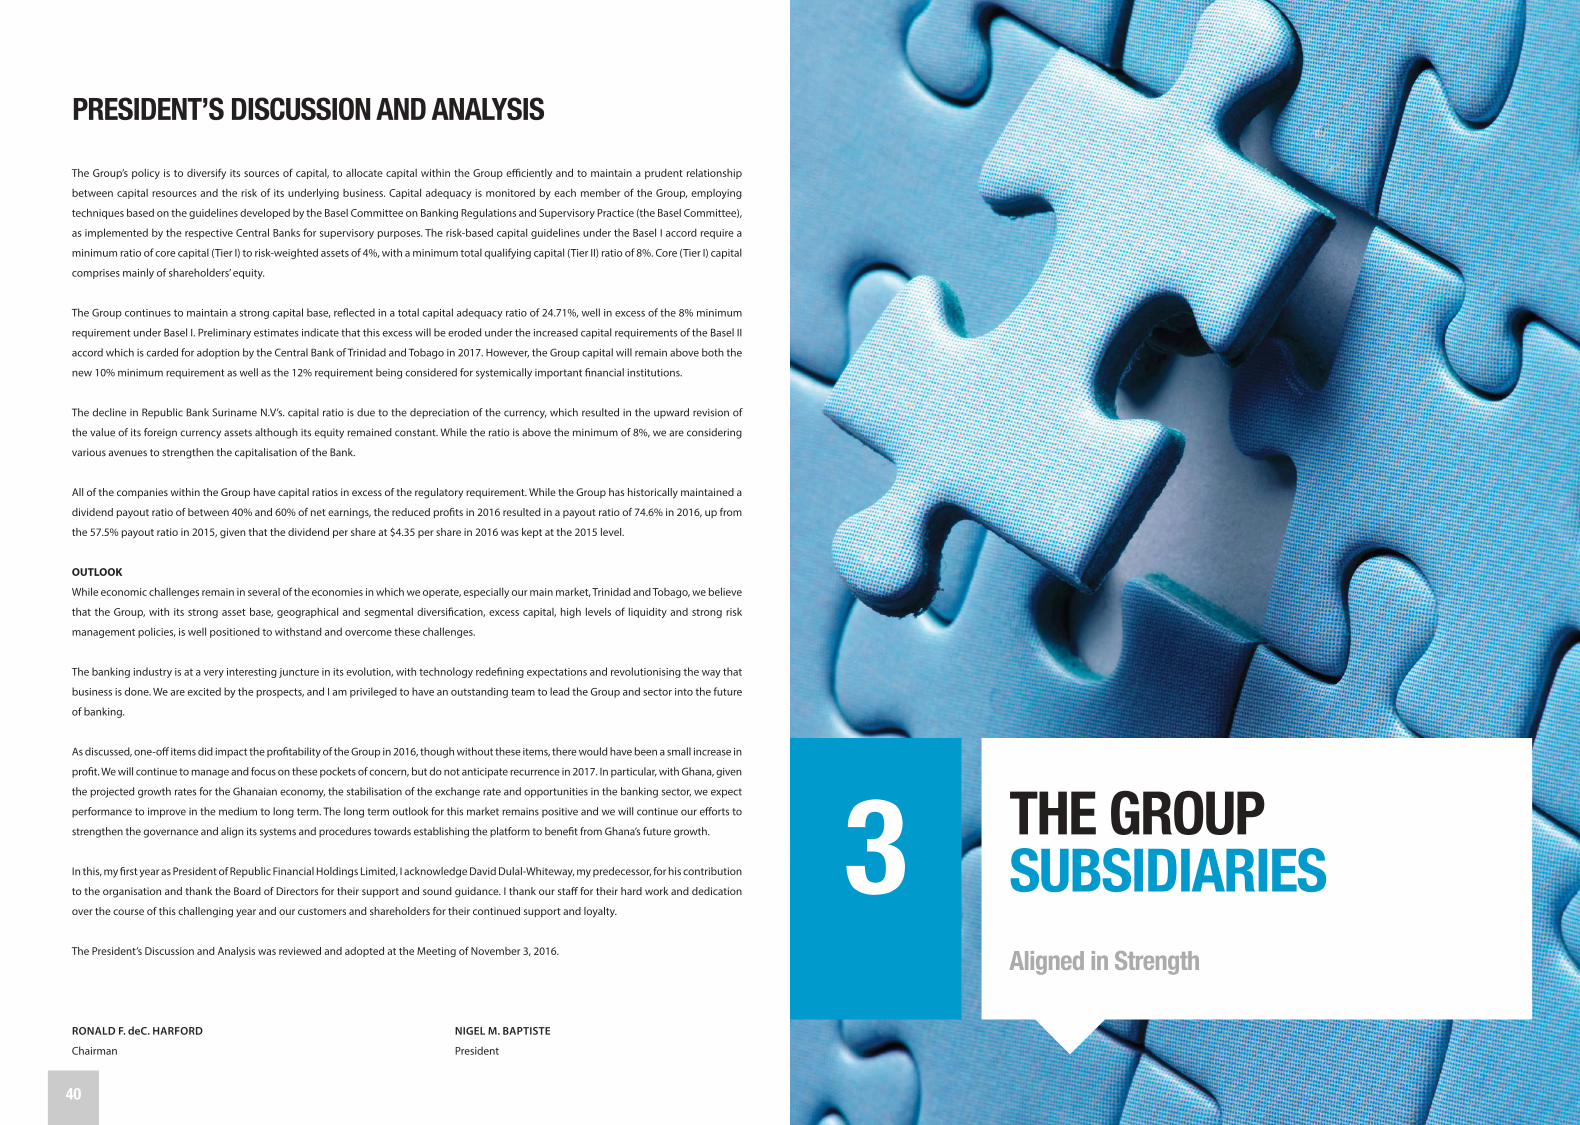
3 THE GROUP SUBSIDIARIESAligned in Strength
PRESIDENT’S DISCUSSION AND ANALYSIS
The Group’s policy is to diversify its sources of capital, to allocate capital within the Group efficiently and to maintain a prudent relationship
between capital resources and the risk of its underlying business. Capital adequacy is monitored by each member of the Group, employing
techniques based on the guidelines developed by the Basel Committee on Banking Regulations and Supervisory Practice (the Basel Committee),
as implemented by the respective Central Banks for supervisory purposes. The risk-based capital guidelines under the Basel I accord require a
minimum ratio of core capital (Tier I) to risk-weighted assets of 4%, with a minimum total qualifying capital (Tier II) ratio of 8%. Core (Tier I) capital
comprises mainly of shareholders’ equity.
The Group continues to maintain a strong capital base, reflected in a total capital adequacy ratio of 24.71%, well in excess of the 8% minimum
requirement under Basel I. Preliminary estimates indicate that this excess will be eroded under the increased capital requirements of the Basel II
accord which is carded for adoption by the Central Bank of Trinidad and Tobago in 2017. However, the Group capital will remain above both the
new 10% minimum requirement as well as the 12% requirement being considered for systemically important financial institutions.
The decline in Republic Bank Suriname N.V’s. capital ratio is due to the depreciation of the currency, which resulted in the upward revision of
the value of its foreign currency assets although its equity remained constant. While the ratio is above the minimum of 8%, we are considering
various avenues to strengthen the capitalisation of the Bank.
All of the companies within the Group have capital ratios in excess of the regulatory requirement. While the Group has historically maintained a
dividend payout ratio of between 40% and 60% of net earnings, the reduced profits in 2016 resulted in a payout ratio of 74.6% in 2016, up from
the 57.5% payout ratio in 2015, given that the dividend per share at $4.35 per share in 2016 was kept at the 2015 level.
OUTLOOK
While economic challenges remain in several of the economies in which we operate, especially our main market, Trinidad and Tobago, we believe
that the Group, with its strong asset base, geographical and segmental diversification, excess capital, high levels of liquidity and strong risk
management policies, is well positioned to withstand and overcome these challenges.
The banking industry is at a very interesting juncture in its evolution, with technology redefining expectations and revolutionising the way that
business is done. We are excited by the prospects, and I am privileged to have an outstanding team to lead the Group and sector into the future
of banking.
As discussed, one-off items did impact the profitability of the Group in 2016, though without these items, there would have been a small increase in
profit. We will continue to manage and focus on these pockets of concern, but do not anticipate recurrence in 2017. In particular, with Ghana, given
the projected growth rates for the Ghanaian economy, the stabilisation of the exchange rate and opportunities in the banking sector, we expect
performance to improve in the medium to long term. The long term outlook for this market remains positive and we will continue our efforts to
strengthen the governance and align its systems and procedures towards establishing the platform to benefit from Ghana’s future growth.
In this, my first year as President of Republic Financial Holdings Limited, I acknowledge David Dulal-Whiteway, my predecessor, for his contribution
to the organisation and thank the Board of Directors for their support and sound guidance. I thank our staff for their hard work and dedication
over the course of this challenging year and our customers and shareholders for their continued support and loyalty.
The President’s Discussion and Analysis was reviewed and adopted at the Meeting of November 3, 2016.
RONALD F. deC. HARFORD NIGEL M. BAPTISTE
Chairman President

42 43
DERWIN M. HOWELL
Executive Director,
Republic Bank Limited
JACQUELINE H.C. QUAMINA
Executive Director,
Group General Counsel/
Corporate Secretary,
Republic Bank Limited
ROOPNARINE OUMADE SINGH
Executive Director,
Republic Bank Limited
NIGEL M. BAPTISTE
President,
Republic Financial Holdings Limited;
Managing Director,
Republic Bank Limited
Republic Bank is one of the largest and most successful indigenous
banks in Trinidad and Tobago, offering a diverse portfolio of products
and services designed to satisfy the growing needs of its retail
banking customers, corporate clients and governments. The Bank
has a network of 41 branches – the largest in the Nation – and the
most extensive ABM network in the island, with 125 ABMs in 82
locations. The Bank is also the nation’s largest credit card operator.
Registered Office
Republic House, 9-17 Park Street, Port of Spain
Trinidad and Tobago, West Indies
Tel: (868) 625-4411, 623-1056
Fax: (868) 624-1323
Swift: RBNKTTPX
Email: [email protected]
Website: www.republictt.com
President, Republic Financial Holdings Limited;
Managing Director, Republic Bank Limited
Nigel M. Baptiste, BSc (Econ.) (Hons.), MSc (Econ.), ACIB
Nigel M. Baptiste was appointed President, Republic Financial
Holdings Limited and Managing Director of Republic Bank Limited
on February 11, 2016.
He was first appointed to the Board in 2005, as Executive Director. He
is a First Class Honours Graduate of The University of the West Indies,
an Associate of the Chartered Institute of Banking in England and a
graduate of the Stonier Graduate School of Banking in the United
States of America.
Mr. Baptiste serves on the Boards of Republic Financial Holdings
Limited, Republic Bank Limited, Republic Bank (Guyana) Limited, and
other entities within the Republic Bank Group.
EXECUTIVE DIRECTORSREPUBLIC BANK LIMITED
IAN R. DE SOUZA
Managing Director and
Chief Executive Officer,
Republic Bank
(Barbados) Limited
ROBERT LE HUNTE
Managing Director,
HFC Bank (Ghana)
Limited

44 45
VIJAI RAGOONANAN
General Manager,
Risk Management
ALDRIN RAMGOOLAM
General Manager,
Information Technology
Management
MICHELLE PALMER-KEIZER
General Manager,
Group Marketing
and Communications
DAVID ROBINSON
General Manager,
Wealth Management
PARASRAM SALICKRAM
General Manager,
Planning and
Financial Control
FARID ANTAR
General Manager,
Corporate Operations
and Process Improvement
REPUBLIC BANK LIMITEDEXECUTIVE MANAGEMENT
RIAH DASS-MUNGAL
General Manager,
Internal Audit
HILTON HYLAND
General Manager,
Commercial and
Retail Banking
ANNA-MARÍA GARCÍA-BROOKS
General Manager,
Group Human Resources
CHARLES A. MOUTTET
General Manager,
Treasury

46 47
REPUBLIC BANK LIMITED EXECUTIVE MANAGEMENT
ANTHONY C. SUBERO
General Manager,
Enterprise Risk
Management
ANTHONY WONG
General Manager,
Electronic Channels
and Payments
KAREN YIP CHUCK
General Manager,
Corporate and
Investment Banking
REPUBLIC BANK (BARBADOS) LIMITEDOne of the longest serving banks in Barbados, Republic Bank
(Barbados) Limited has been in existence for over 30 years. Formerly
Barbados National Bank Inc. (BNB), it boasts one of the largest ABM
networks on the island and 10 conveniently located branches.
The Bank offers an array of financial services such as personal and
commercial lending and premium, corporate and investment
banking. Its wholly-owned subsidiaries, Republic Finance & Trust
(Barbados) Corporation and Republic Funds (Barbados) Limited,
offer funds management, lease financing and merchant banking
services.
Registered Office
Independence Square, Bridgetown
Barbados, West Indies
Tel: (246) 431-5999
Fax: (246) 429-2606
Swift: BNBABBBB
Email: [email protected]
Website: www.republicbarbados.com
Managing Director and Chief Executive Officer
Ian R. De Souza, BSc (Econ), Post-Grad Dip. Mgmt, MBA, CPA - CMA, CA,
CIRA
Ian R. De Souza, Managing Director and Chief Executive Officer of
Republic Bank (Barbados) Limited, has been a banker for more than
30 years. He is a graduate of The University of the West Indies
(UWI), a Certified Professional Accountant (Canadian) and a Certified
Insolvency and Restructuring Advisor (American).
IAN R. DE SOUZA
Chief Executive Officer

48 49
SEAN HUSAIN
General Manager,
Corporate and Commercial
Credit
HAMANT LALLA
Corporate Controller
SUSAN TORRY
General Manager,
Operations
SHARON ZEPHIRIN
General Manager,
Retail Banking
REPUBLIC BANK (BARBADOS) LIMITEDGENERAL MANAGERS
Republic Bank (Cayman) Limited is a private bank offering
comprehensive wealth management service to clients in the
Caribbean region and beyond. This service includes banking in
most currencies, investment management and formation of private
investment holding companies and trustee services. Republic Bank
(Cayman) Limited continues to be a strong contributor to the
Group’s profits and allows the network to offer a full range of
Offshore Wealth Management Services to its clients.
Registered Office
Suite #308, Smith Road Centre, 150 Smith Road
P.O. Box 2004, KY1-1104
George Town, Grand Cayman
Tel: (345) 949-7844
Fax: (345) 949-2795
Managing Director
Carlton Barclay, FCCA, MBA
Carlton Barclay, Managing Director, Republic Bank (Cayman)
Limited, has over 20 years’ experience in the banking and insurance
industry, with a career that spans the fields of audit, financial control
and strategic planning.
He has held other senior management positions in other financial
services organisations in the Caribbean, namely Jamaica National
Building Society in Jamaica and Grand Cayman. He has a strong
knowledge of both the Cayman market and the emerging
compliance environment.
Mr. Barclay holds an MBA in Business from Northwestern University,
and a Diploma in Business Administration from the University
of Technology in Jamaica. He is a member and Fellow of the
Association of Chartered Accounts (FCCA, ACCA).
REPUBLIC BANK (CAYMAN) LIMITED
CARLTON BARCLAY
Managing Director
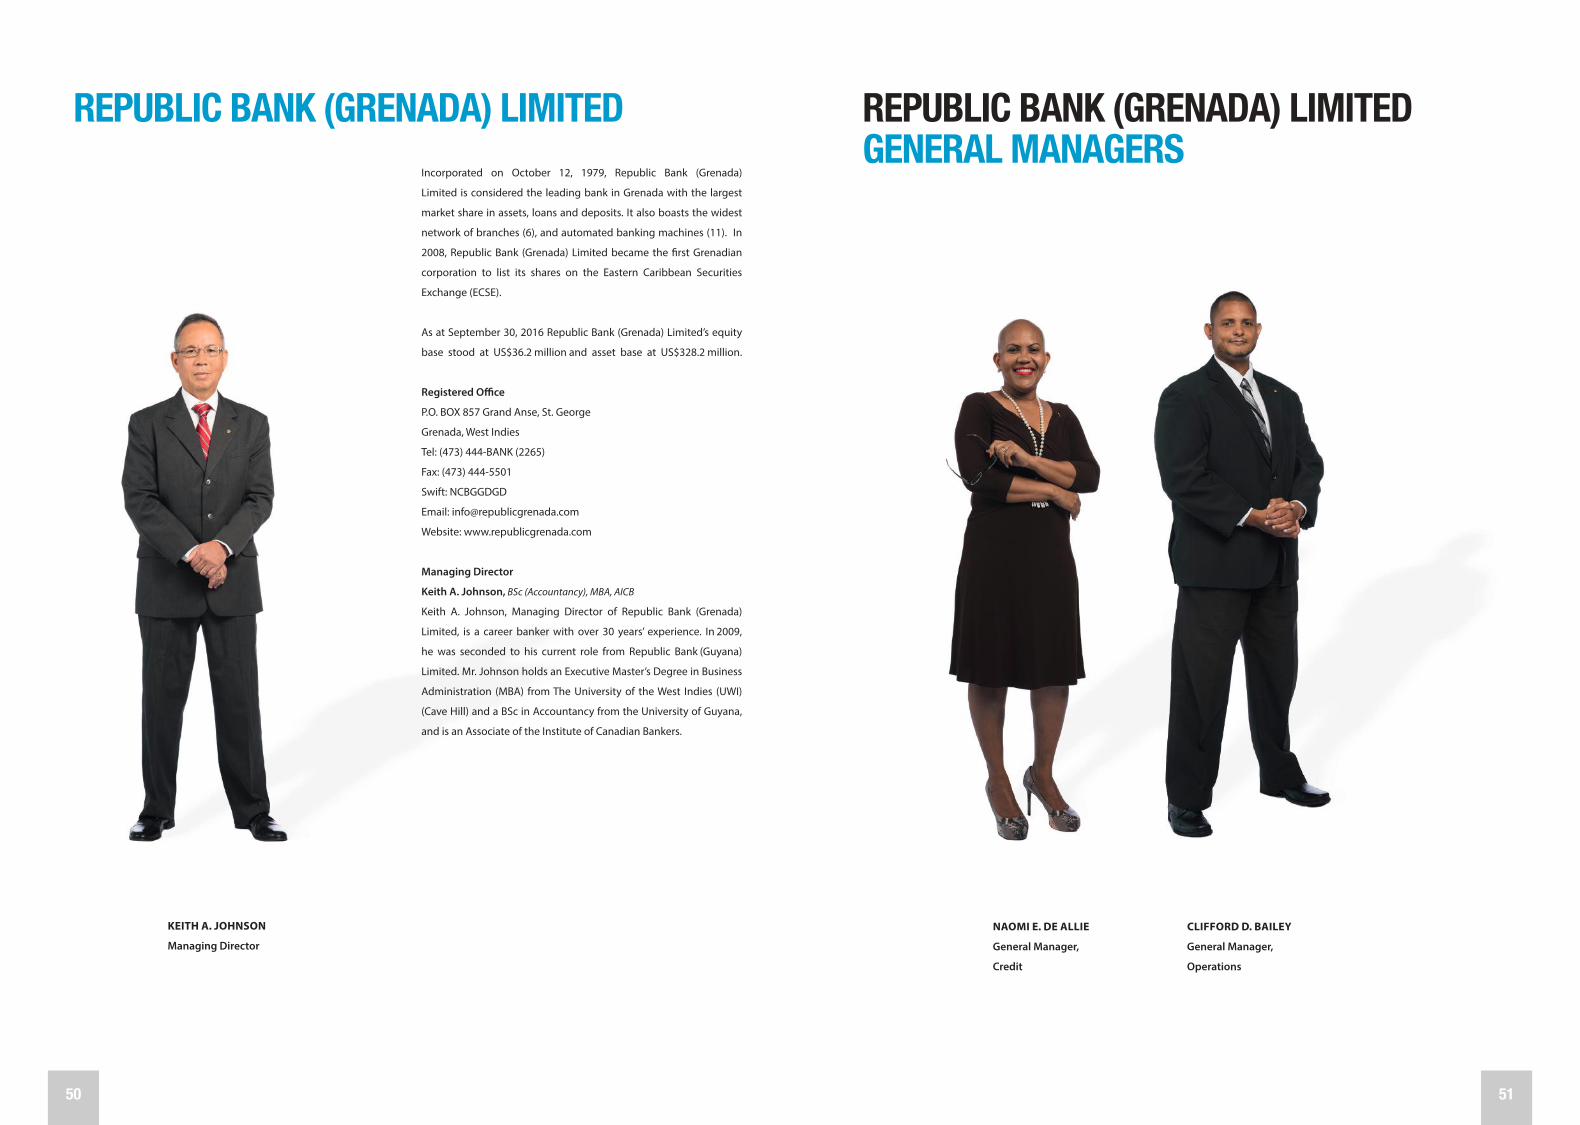
50 51
REPUBLIC BANK (GRENADA) LIMITEDGENERAL MANAGERS
NAOMI E. DE ALLIE
General Manager,
Credit
CLIFFORD D. BAILEY
General Manager,
Operations
Incorporated on October 12, 1979, Republic Bank (Grenada)
Limited is considered the leading bank in Grenada with the largest
market share in assets, loans and deposits. It also boasts the widest
network of branches (6), and automated banking machines (11). In
2008, Republic Bank (Grenada) Limited became the first Grenadian
corporation to list its shares on the Eastern Caribbean Securities
Exchange (ECSE).
As at September 30, 2016 Republic Bank (Grenada) Limited’s equity
base stood at US$36.2 million and asset base at US$328.2 million.
Registered Office
P.O. BOX 857 Grand Anse, St. George
Grenada, West Indies
Tel: (473) 444-BANK (2265)
Fax: (473) 444-5501
Swift: NCBGGDGD
Email: [email protected]
Website: www.republicgrenada.com
Managing Director
Keith A. Johnson, BSc (Accountancy), MBA, AICB
Keith A. Johnson, Managing Director of Republic Bank (Grenada)
Limited, is a career banker with over 30 years’ experience. In 2009,
he was seconded to his current role from Republic Bank (Guyana)
Limited. Mr. Johnson holds an Executive Master’s Degree in Business
Administration (MBA) from The University of the West Indies (UWI)
(Cave Hill) and a BSc in Accountancy from the University of Guyana,
and is an Associate of the Institute of Canadian Bankers.
REPUBLIC BANK (GRENADA) LIMITED
KEITH A. JOHNSON
Managing Director

52 53
REPUBLIC (GUYANA) LIMITEDGENERAL MANAGERS
DENISE HOBBS
General Manager,
Corporate and Management
Services
PARBATIE KHAN
General Manager,
Credit
Established in 1836, Republic Bank (Guyana) Limited is one of
Guyana’s longest-serving institutions and is a recognised leader
in the provision of financial services. Over the past year, the Bank
has concentrated on growing its lending portfolio, with particular
emphasis on Small and Medium Enterprises. The Bank remains
committed to providing customised, efficient and competitively-
priced financial services, and maintaining a philosophy of social
investment in Guyana.
At September 30, 2016, Republic Bank (Guyana) Limited’s equity
base stood at US$81.3 million and asset base at US$737.6 million.
Registered Office
Promenade Court, 155-156 New Market Street
North Cummingsburg
Georgetown, Guyana
Tel: (592) 223-7938-49
Fax: (592) 233-5007
SWIFT: RBGL GYGG
Email: [email protected]
Webite: www.republicguyana.com
Managing Director
Richard Sammy, BSc (Mgmt. Studies) (Hons.), MBA
Mr. Richard S. Sammy is an outstanding banker with significant
experience in corporate and investment banking. He previously
served as the Regional Manager, Corporate Business Centre – South
and Regional Manager, Investment Banking Division at Republic
Bank Limited. Prior to joining Republic Bank Limited, he served as
Senior Manager, Business Development at Sagicor Merchant Limited
and Risk Manager, Deals Management and Regional Manager,
Capital Markets at RBTT Merchant Bank Limited. Mr. Sammy holds an
MBA from the Warwick Business School in the United Kingdom and
a Bachelor of Science Degree (Hons.) in Management Studies from
the University of the West Indies, St. Augustine. He is well-respected
in the banking field and continues to provide excellent leadership
to the Republic Bank (Guyana) Limited team since assuming the
position of Managing Director on July 1, 2015.
REPUBLIC BANK (GUYANA) LIMITED
RICHARD SAMMY
Managing Director

54 55
REPUBLIC BANK (SURINAME) N.V.GENERAL MANAGERS
PETER NG A THAM
Deputy Managing Director
MONTAGUE D. MC LEOD
Director,
Corporate Banking
LILIAN LEEFLANG
Director,
Retail Banking
On July 31, 2015, Republic Bank welcomed Republic Bank
(Suriname) N.V. into its expanding financial Group. Republic Bank
acquired RBC Royal Bank (Suriname) N.V. from RBC Financial
(Caribbean) Limited through the purchase of Royal Overseas
Holdings (St. Lucia) Limited. The Suriname bank has a network of five
branches in the capital of Paramaribo and one in Nickerie, and assets
of approximately US$389 million, as at September 30, 2016.
Registered Office
Kerkplein 1, Paramaribo
Suriname
Tel: (597) 471555
Fax: (597) 425709
Email: [email protected]
Webite: www.republicbanksr.com
Managing Director
Gloria Anthony, ACIB, MBA
Gloria Anthony, Managing Director, Republic Bank (Suriname) N.V.
is a career banker with extensive experience in Corporate and Retail
Banking. During the last 15 years, she has performed in key Senior
Managerial positions in the Parent Company including Corporate
Manager, Area Credit Manager, Regional Sales Manager and General
Manager Commercial and Retail Banking. She previously sat
on the boards of Bank of St. Lucia Limited, G4S Secure Solutions
Services, Trinidad and the Caribbean Association of Banks. Mrs.
Anthony holds a Master’s Degree in Business Administration from
Heriot-Watt University in the UK and an Associate Degree in Banking
from the IFS School of Finance, UK. She is a member of the American
Management Association and an Associate of the Chartered Institute
of Bankers.
REPUBLIC BANK (SURINAME) N.V.
GLORIA ANTHONY
Managing Director
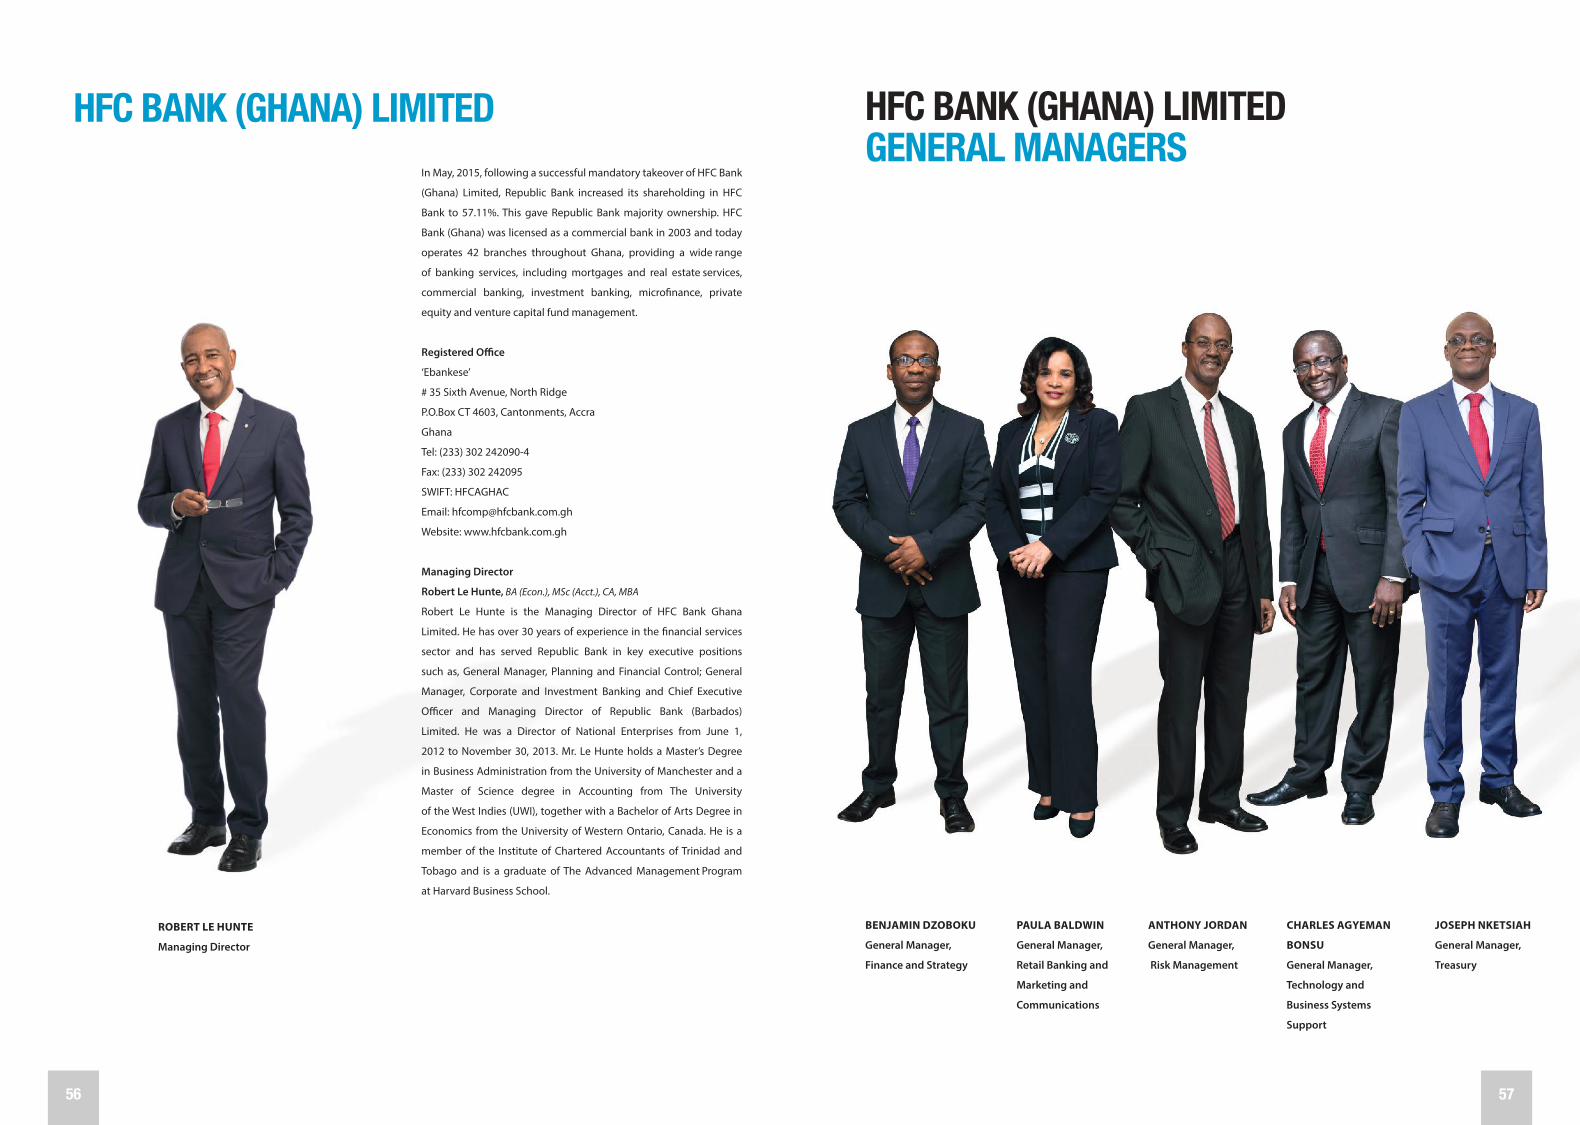
56 57
HFC BANK (GHANA) LIMITEDGENERAL MANAGERS
BENJAMIN DZOBOKU
General Manager,
Finance and Strategy
PAULA BALDWIN
General Manager,
Retail Banking and
Marketing and
Communications
ANTHONY JORDAN
General Manager,
Risk Management
CHARLES AGYEMAN
BONSU
General Manager,
Technology and
Business Systems
Support
JOSEPH NKETSIAH
General Manager,
Treasury
In May, 2015, following a successful mandatory takeover of HFC Bank
(Ghana) Limited, Republic Bank increased its shareholding in HFC
Bank to 57.11%. This gave Republic Bank majority ownership. HFC
Bank (Ghana) was licensed as a commercial bank in 2003 and today
operates 42 branches throughout Ghana, providing a wide range
of banking services, including mortgages and real estate services,
commercial banking, investment banking, microfinance, private
equity and venture capital fund management.
Registered Office
‘Ebankese’
# 35 Sixth Avenue, North Ridge
P.O.Box CT 4603, Cantonments, Accra
Ghana
Tel: (233) 302 242090-4
Fax: (233) 302 242095
SWIFT: HFCAGHAC
Email: [email protected]
Website: www.hfcbank.com.gh
Managing Director
Robert Le Hunte, BA (Econ.), MSc (Acct.), CA, MBA
Robert Le Hunte is the Managing Director of HFC Bank Ghana
Limited. He has over 30 years of experience in the financial services
sector and has served Republic Bank in key executive positions
such as, General Manager, Planning and Financial Control; General
Manager, Corporate and Investment Banking and Chief Executive
Officer and Managing Director of Republic Bank (Barbados)
Limited. He was a Director of National Enterprises from June 1,
2012 to November 30, 2013. Mr. Le Hunte holds a Master’s Degree
in Business Administration from the University of Manchester and a
Master of Science degree in Accounting from The University
of the West Indies (UWI), together with a Bachelor of Arts Degree in
Economics from the University of Western Ontario, Canada. He is a
member of the Institute of Chartered Accountants of Trinidad and
Tobago and is a graduate of The Advanced Management Program
at Harvard Business School.
HFC BANK (GHANA) LIMITED
ROBERT LE HUNTE
Managing Director

58 59
STEVE ROBERTS
Head
GODFREY GOSEIN
Chief Executive Officer
REPUBLIC SECURITIES LIMITED REPUBLIC WEALTH MANAGEMENT LIMITEDRepublic Securities Limited is a full-service stock broking firm that
trades on the local stock exchange and has execution capabilities
for international stocks on the New York Stock Exchange. The
company provides investment advisory services and specialises in
financial planning, portfolio management and retirement planning.
Registered Office
2nd Floor, Promenade Centre
72 Independence Square, Port of Spain
Trinidad and Tobago, West Indies
Tel: (868) 623-0435
Fax: (868) 623-0441
Email: [email protected]
Website: www.rsltt.com
Chief Executive Officer
Godfrey Gosein, BSc (Ind. Mgmt.), MBA
Godfrey Gosein, Chief Executive Officer of Republic Securities
Limited, is a Registered Representative with the Securities and
Exchange Commission and a Registered stockbroker with the
Trinidad and Tobago Stock Exchange. He has been involved
in the Trinidad and Tobago capital market for over 25 years. He sits
on the boards of the Trinidad and Tobago Stock Exchange and
the Securities Dealers Association of Trinidad and Tobago. He is a
graduate of The University of the West Indies (UWI) and holds an MBA
from the Arthur Lok Jack Graduate School of Business.
Republic Bank’s Trust and Asset Management Division (TRAM),
which was established in 1938, was disaggregated on July 1,
2014. The investment management services provided to individual
investors, to corporate pension and savings plan clients and to
Republic Bank’s suite of proprietary funds are now housed at
Republic Wealth Management Limited, which is registered under the
Securities Act, 2012 as an Investment Adviser.
Registered Office
Republic House
9-17 Park Street, Port of Spain
Trinidad and Tobago, West Indies
Tel: (868) 625-3617
Fax: (868) 625-3617 Ext. 3178
Email: [email protected]
Website: www.republictt.com
Head
Steve Roberts, BSc (Mgmt. Studies) (Hons.)
Steve Roberts, Head of Republic Wealth Management Limited,
has been a banker for over 35 years and has gained extensive
knowledge in the asset management and trust disciplines over the
course of his career. In 1997, Mr. Roberts joined Republic Bank Limited
and in 1998, was transferred to the Trust and Asset Management
Division where he was appointed as an Investment Manager in 2001.
Mr. Roberts, who holds a BSc in Industrial Management from the
University of the West Indies, was appointed Head of Republic
Wealth Management Limited on its formation on July 1, 2014.
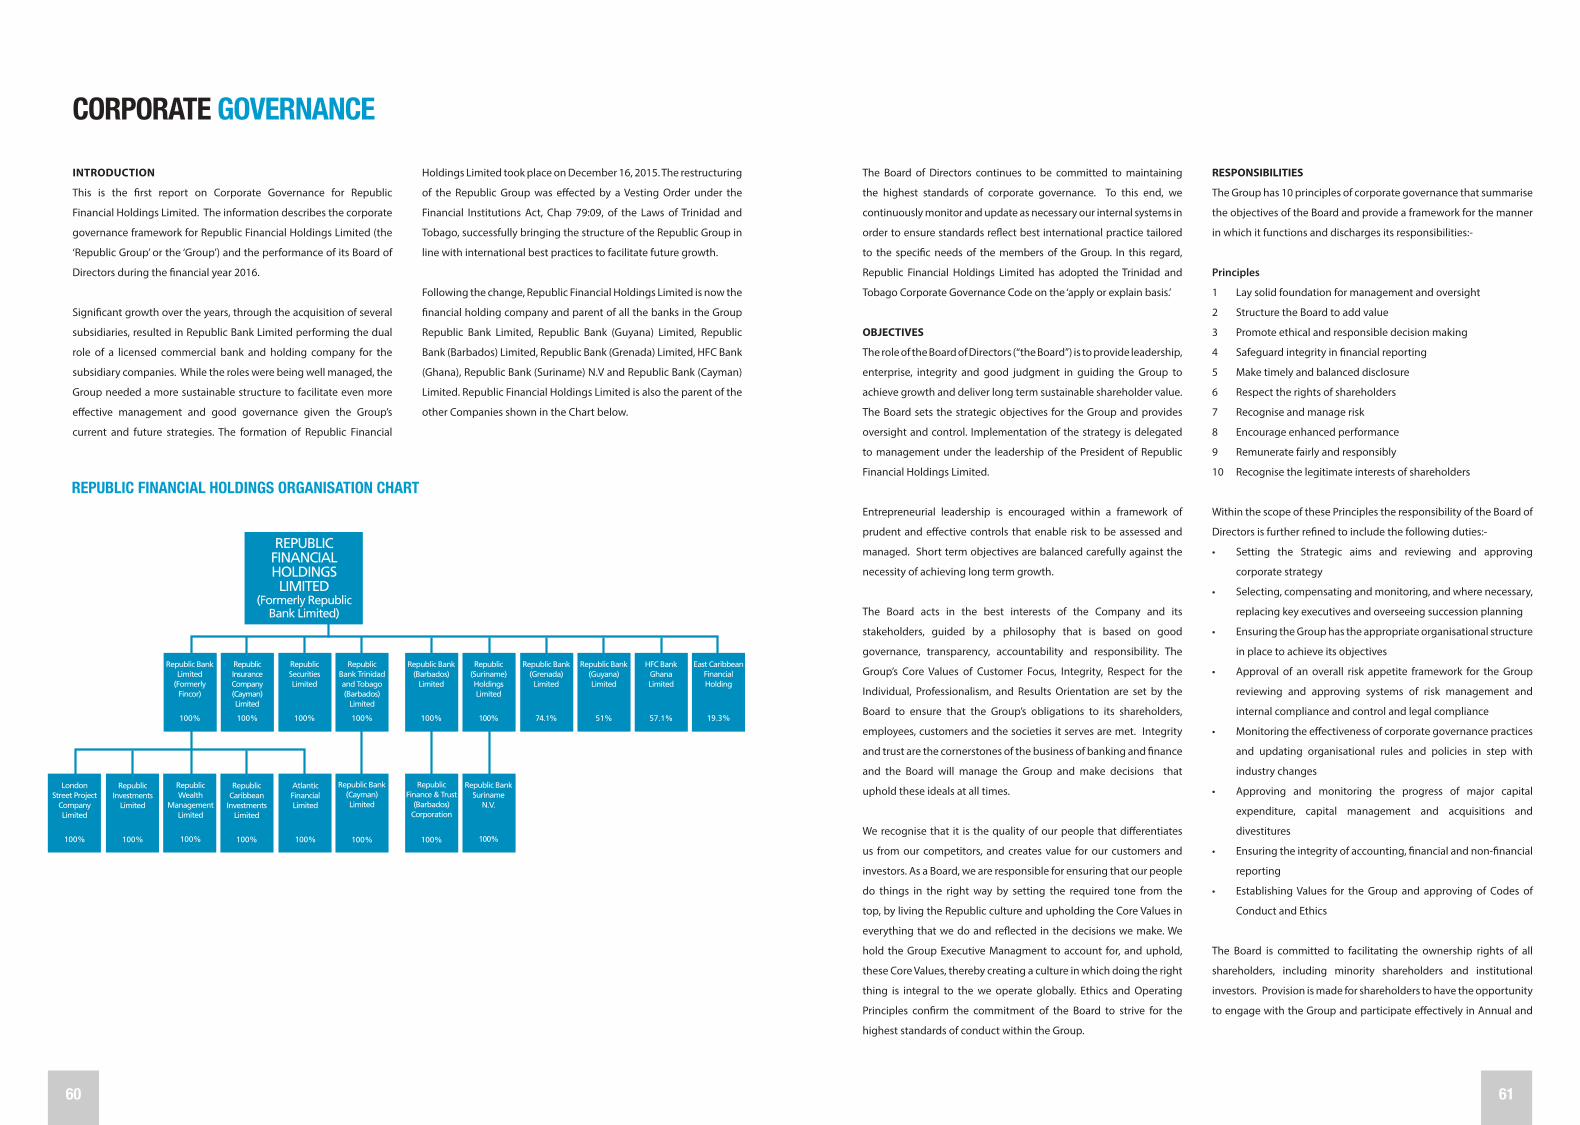
60 61
The Board of Directors continues to be committed to maintaining
the highest standards of corporate governance. To this end, we
continuously monitor and update as necessary our internal systems in
order to ensure standards reflect best international practice tailored
to the specific needs of the members of the Group. In this regard,
Republic Financial Holdings Limited has adopted the Trinidad and
Tobago Corporate Governance Code on the ‘apply or explain basis.’
OBJECTIVES
The role of the Board of Directors (“the Board”) is to provide leadership,
enterprise, integrity and good judgment in guiding the Group to
achieve growth and deliver long term sustainable shareholder value.
The Board sets the strategic objectives for the Group and provides
oversight and control. Implementation of the strategy is delegated
to management under the leadership of the President of Republic
Financial Holdings Limited.
Entrepreneurial leadership is encouraged within a framework of
prudent and effective controls that enable risk to be assessed and
managed. Short term objectives are balanced carefully against the
necessity of achieving long term growth.
The Board acts in the best interests of the Company and its
stakeholders, guided by a philosophy that is based on good
governance, transparency, accountability and responsibility. The
Group’s Core Values of Customer Focus, Integrity, Respect for the
Individual, Professionalism, and Results Orientation are set by the
Board to ensure that the Group’s obligations to its shareholders,
employees, customers and the societies it serves are met. Integrity
and trust are the cornerstones of the business of banking and finance
and the Board will manage the Group and make decisions that
uphold these ideals at all times.
We recognise that it is the quality of our people that differentiates
us from our competitors, and creates value for our customers and
investors. As a Board, we are responsible for ensuring that our people
do things in the right way by setting the required tone from the
top, by living the Republic culture and upholding the Core Values in
everything that we do and reflected in the decisions we make. We
hold the Group Executive Managment to account for, and uphold,
these Core Values, thereby creating a culture in which doing the right
thing is integral to the we operate globally. Ethics and Operating
Principles confirm the commitment of the Board to strive for the
highest standards of conduct within the Group.
RESPONSIBILITIES
The Group has 10 principles of corporate governance that summarise
the objectives of the Board and provide a framework for the manner
in which it functions and discharges its responsibilities:-
Principles
1 Lay solid foundation for management and oversight
2 Structure the Board to add value
3 Promote ethical and responsible decision making
4 Safeguard integrity in financial reporting
5 Make timely and balanced disclosure
6 Respect the rights of shareholders
7 Recognise and manage risk
8 Encourage enhanced performance
9 Remunerate fairly and responsibly
10 Recognise the legitimate interests of shareholders
Within the scope of these Principles the responsibility of the Board of
Directors is further refined to include the following duties:-
• Setting the Strategic aims and reviewing and approving
corporate strategy
• Selecting, compensating and monitoring, and where necessary,
replacing key executives and overseeing succession planning
• Ensuring the Group has the appropriate organisational structure
in place to achieve its objectives
• Approval of an overall risk appetite framework for the Group
reviewing and approving systems of risk management and
internal compliance and control and legal compliance
• Monitoring the effectiveness of corporate governance practices
and updating organisational rules and policies in step with
industry changes
• Approving and monitoring the progress of major capital
expenditure, capital management and acquisitions and
divestitures
• Ensuring the integrity of accounting, financial and non-financial
reporting
• Establishing Values for the Group and approving of Codes of
Conduct and Ethics
The Board is committed to facilitating the ownership rights of all
shareholders, including minority shareholders and institutional
investors. Provision is made for shareholders to have the opportunity
to engage with the Group and participate effectively in Annual and
INTRODUCTION
This is the first report on Corporate Governance for Republic
Financial Holdings Limited. The information describes the corporate
governance framework for Republic Financial Holdings Limited (the
‘Republic Group’ or the ‘Group’) and the performance of its Board of
Directors during the financial year 2016.
Significant growth over the years, through the acquisition of several
subsidiaries, resulted in Republic Bank Limited performing the dual
role of a licensed commercial bank and holding company for the
subsidiary companies. While the roles were being well managed, the
Group needed a more sustainable structure to facilitate even more
effective management and good governance given the Group’s
current and future strategies. The formation of Republic Financial
CORPORATE GOVERNANCE
Holdings Limited took place on December 16, 2015. The restructuring
of the Republic Group was effected by a Vesting Order under the
Financial Institutions Act, Chap 79:09, of the Laws of Trinidad and
Tobago, successfully bringing the structure of the Republic Group in
line with international best practices to facilitate future growth.
Following the change, Republic Financial Holdings Limited is now the
financial holding company and parent of all the banks in the Group
Republic Bank Limited, Republic Bank (Guyana) Limited, Republic
Bank (Barbados) Limited, Republic Bank (Grenada) Limited, HFC Bank
(Ghana), Republic Bank (Suriname) N.V and Republic Bank (Cayman)
Limited. Republic Financial Holdings Limited is also the parent of the
other Companies shown in the Chart below.
Republic Insurance Company (Cayman) Limited
100%
Republic Securities Limited
100%
Republic Investments
Limited
100%
Republic Bank Trinidad and Tobago (Barbados)
Limited
100%
Republic Wealth
Management Limited
100%
Republic Bank (Barbados)
Limited
100%
Republic Bank Limited
(Formerly Fincor)
100%
Republic Caribbean
Investments Limited
100%
Republic Bank (Grenada) Limited
74.1%
Republic (Suriname) Holdings Limited
100%
Republic Bank Suriname
N.V.
100%
Atlantic Financial Limited
100%
Republic Bank (Guyana) Limited
51%
Republic Bank (Cayman) Limited
100%
Republic Finance & Trust
(Barbados) Corporation
100%
HFC Bank Ghana Limited
57.1%
East Caribbean Financial Holding
19.3%
London Street Project
Company Limited
100%
REPUBLICFINANCIAL HOLDINGSLIMITED
(Formerly Republic Bank Limited)
REPUBLIC FINANCIAL HOLDINGS ORGANISATION CHART

62 63
INDEPENDENT ADVICE
The Board shall have access to the best possible banking,
management and financial advice during its deliberations and, in
that regard, the Board has access to the advice of the Group General
Counsel/Corporate Secretary, as well as External Counsel. In addition,
the Board of Directors may appoint or retain any other professional
advisors it considers appropriate.
DELEGATED AUTHORITY
The Board is the principal decision making forum for decisions
that impact the Group. The Board of Directors has delegated the
responsibility for the operational and day to day activities in relation
to the Group’s business to the President of Republic Financial
Holdings Limited. Explicit authorities and responsibilities of the
President are documented and approved by the Board of Directors.
Matters not specifically delegated are reserved to the Board.
The Board of Directors has also delegated authority to the following
Board Committees:-
• Audit Committee
• Enterprise Risk Committee
• Governance and Nomination Committee
DIRECTOR TENURE
A Non- Executive Director shall retire from the Board after serving for
a maximum of 15 years or on becoming 75 years of age whichever
first occurs. However, the Board may in its discretion consider the
exigencies of a particular situation. An Executive Director shall retire
in accordance with the Bank’s usual retirement policy.
Since the effective date of the restructuring of the Group into Republic
Financial Holdings Limited, four (4) meetings were scheduled within
the period January 2016 to September 2016:-
BOARD - 3 MEETINGS
SPECIAL BOARD - 1 MEETING
Directors Attendance Eligible to Attend
Shazan Ali 3 4
Nigel M. Baptiste 4 4
Dawn Callender 4 4
Terrence W. Farrell 4 4
Ronald F. deC. Harford 4 4
Alison Lewis 3 4
William P. Lucie-Smith 4 4
Russell Martineau 3 4
Kristine Thompson 2 4
Gregory I. Thomson 3 4
AUDIT COMMITTEE
This Committee meets quarterly to review the Group’s financial
statements, the system of internal control throughout the Group,
management of financial risks, the Group audit process, the Group’s
process for monitoring compliance with laws and regulations and its
own code of business. Three (3) meetings were held this fiscal.
The Committee comprises:-
Directors Attendance
William P. Lucie-Smith, Chairman 3
Dawn Callender 3
Ronald F. deC. Harford 3
Alison Lewis 2
Gregory I. Thomson 3
ENTERPRISE RISK COMMITTEE
This Committee is responsible for providing oversight and advice to
the Board on risk management in Republic Financial Holdings Limited
and its subsidiaries and affiliates. This sub-committee considers and
recommends for approval by the Board the Group’s enterprise risk
management policy, risk appetite statement, tolerance, limits and
mandates taking into account the Group’s capital adequacy and the
external risk environment. It has oversight of strategic or material
transactions including acquisitions or disposals, focusing on risk and
implications for the risk appetite and tolerance of the Group. One (1)
meeting was held this fiscal.
Special Meetings through the provision of proxies. External Auditors
and members of Senior Management and the Board are available at
meetings with shareholders to respond to shareholder questions.
The Group’s strategies, policies, agreed management performance
criteria and business plans are defined and measurable in a manner
which is precise and tangible both to the Board and Management.
In turn, these performance expectations and business plans are
disseminated to each subsidiary. The Group’s affairs are subject
to comprehensive assessment against accurate and relevant
information, both financial and non-financial as appropriate,
obtainable not only from the Group’s internal reporting systems but
from external sources as well, so that informed assessment can be
made of issues facing the Board.
The Board of Directors complies with the Model Code for Securities
Transaction by Insiders of Listed Companies issued by the Trinidad
and Tobago Stock Exchange Limited. Strict guidelines are provided
by the Group for the occasions when it may be perceived that
Directors and Officers have special knowledge, and dealing in the
entity’s shares during these occasions is prohibited. The purchase
or sale of shares by an insider requires the prior consent of the
Corporate Secretary, and transactions are tabled for the information
of the Board of Directors. All Directors are routinely reminded of their
obligations under the Code for Dealing in the Republic Financial
Holdings Limited Group securities.
The Board also has a disclosure policy designed to provide for
accurate, timely and balanced disclosure of all material matters
concerning the Group.
COMPOSITION
The Board shall comprise a maximum of 15 Directors, of which no
more than two shall be Executive Directors. The Chairman shall be
a Non-Executive Director. There shall be a Senior Non-Executive
Director to be known as the Senior Independent Director.
The majority of the Directors shall be independent. It shall be for the
Board to review the criteria to be considered in determining whether
a Director is independent, both in character and judgment. The
Board may take into account any direct or indirect relationship that a
Director has within the Group that may be likely to interfere with the
exercise of independent, unbiased judgment.
This balance between independent Non-Executive Directors and
Executive Directors throughout the Group ensures that the Board
as well as other subsidiary boards are able to exercise independent
judgment with sufficient management information to enable proper
and objective assessment of issues facing the Group.
The Board considers certain core characteristics important in any
nominee for Director. They must: (i) be individuals of the highest
character and integrity, (ii) demonstrate a breadth and depth of
management and/or leadership experience, preferably in a senior
leadership role in a large or recognised organisation or governmental
entity; (iii) possess financial literacy or other professional or
business experience relevant to an understanding of the Group
and its business; and (iv) have a demonstrated ability to think and
act independently as well as the ability to work constructively in
a collegial environment. In identifying nominees for the position
of Director, the Governance and Nomination Committee shall
determine whether an individual meets the characteristics approved
by the Board, assess any gaps identified in a skills matrix and also
consider the current composition of the Board in light of the diverse
communities and geographies served by the Group.
The Board considers that the quality, skills and experience of its
Directors enhance the Board’s effectiveness, and the core set of
skills and experience identified effectively provide the Group with
appropriate leadership and guidance, necessary to tackle the risks
and opportunities facing the Group.
The Non-Executive Directors on this board, as well as on the
subsidiary boards, reflect a diverse cross-section of the professional
and business community and are highly respected, independent
individuals with significant experience in their respective fields. It is
also critical that all Directors have sufficient time available to devote
to the performance of their duties.
Non-Executive Directors, including the Chairman, shall not participate
in performance- based incentive plans; their remuneration consists
solely of cash. Committee Chairmen and Members are paid an
additional fee for each Committee on which they serve. Executive
Directors are not paid fees in respect of their Board or Committee
membership.
The Board of Directors shall meet at least quarterly, while Special
Board Meetings shall be called as the need arises.
CORPORATE GOVERNANCE

64 65
The Group Chief Risk Officer (CRO) has been appointed with
responsibility for ensuring consistent application of the risk
management framework across the group and monitoring how
effectively risk is being managed. The CRO reports to the Enterprise
Risk Committee of the Board.
INTERNAL AUDIT
The Chief Internal Auditor provides an independent review of
the Group’s operations and validates that controls are working
effectively. Under the leadership of the Chief Internal Auditor a
professional cadre of Internal Auditors conducts periodic audits
of all aspects of the Group’s operations. External Auditors have full
and free access to the Chairman of the Audit Committee, and meet
periodically with the Audit Committee to discuss the audit and
findings as to the integrity of the Group’s accounting and financial
reporting Internal Audit provides the Board/Audit Committee with
independent assurance on the adequacy of the system of internal
controls within the Group.
FINANCIAL REPORTING REQUIREMENTS
The Board of Directors of Republic Financial Holdings Limited is
responsible for the preparation and fair presentation of the financial
statements and other financial information contained in this Annual
Report. The accompanying financial statements have been prepared
in conformity with International Financial Reporting Standards
and present a true and fair view of the financial affairs of Republic
Financial Holdings Limited and the subsidiaries within the Group
on a consolidated and individual basis. Where amounts are based
on estimates and judgments, these represent the best estimate and
judgment of the Directors.
Responsibilities include:-
• establishing and maintaining effective internal controls and
procedures for financial reporting;
• safeguarding of assets; and
• prevention and detection of fraud and other irregularities.
The financial information appearing throughout this Annual Report
is consistent with that in the financial statements. Directors have a
responsibility for ensuring that the Group keeps accounting records
which disclose with reasonable accuracy the financial position of the
Group.
The Directors have always recognised the importance of the
Group maintaining and reinforcing the highest possible standards
of conduct in all of its actions, including the preparation and
dissemination of statements presenting fairly the financial condition
of the Group. In this regard, the Directors have developed and
maintained a system of accounting and reporting which provides
the necessary internal controls to ensure that transactions are
properly authorised and recorded, assets are safeguarded against
unauthorised use or disposition and liabilities are recognised. The
system is augmented by written policies and procedures, the careful
selection and training of qualified staff, the establishment of an
organisational structure that provides an appropriate and well-
defined division of responsibility, and the communication of policies
and guidelines of business conduct throughout the Group.
Signed on behalf of the Board
RONALD F. deC. HARFORD
Chairman
September 30, 2016
The Committee comprises:-
Directors Attendance
Terrence W. Farrell, Chairman 1
Nigel M. Baptiste 1
Dawn Callender 1
William P. Lucie-Smith 1
Gregory I. Thomson 1
GOVERNANCE AND NOMINATION COMMITTEE
This Committee is responsible for establishing formal and
transparent procedures for the selection of Executive and Non-
Executive Directors, reviewing the Group’s Management Succession
Plan, developing and implementing processes to assess and improve
Board and Committee effectiveness, and addressing issues which
from time to time may emerge, having implications for the good
governance within the Group and meets as the need arises. This
Committee is also responsible for reviewing the remuneration,
performance and incentive rewards of Senior Executives to ensure
that the remuneration framework is relevant and balanced. One (1)
meeting was held for the fiscal year.
The Committee comprises:-
Directors Attendance
Ronald F. deC. Harford, Chairman 1
Shazan Ali Nil
Terrence W. Farrell 1
Russell Martineau 1
Kristine Thompson 1
At the Annual Meeting, one-third of the Directors retire and may
offer themselves for re-election. At this Annual Meeting, Kristine
Thompson, Shazan Ali, and William Lucie-Smith retire from the
Board by rotation and being eligible, have offered themselves for
re-election. With effect from October 1, 2016, we welcome Robert
Riley who fills the casual vacancy created by the retirement of
Chandrabhan Sharma. In accordance with the Company’s By-laws,
Mr. Riley will retire from the Board and will then be re-elected to the
Board. The Board recommends that all the nominees be re-elected.
DIRECTOR TRAINING AND EVALUATION
The international environment and legislative and regulatory
demands are becoming increasingly complex and challenging
causing us to constantly review our systems and make use of
technology to ensure that compliance is robust with minimal
negative impact on our legitimate customers. In this context, the
Group recognises its responsibility to continue to source training
programmes for Directors that will enhance Directors’ knowledge
and improve effectiveness.
This fiscal year, our Board attended the “Distinguished Leadership
and Innovation Conference” held at the Hyatt Regency Port of Spain
and also attended a training session on Anti-Money Laundering/
Combatting Terrorist Financing, which was provided in-house,
utilising an external facilitator.
Each new Director participates in an orientation of the Group. This
orientation includes presentations by Senior Management on the
Group’s strategic plans, its significant financial, accounting and risk
management policies and issues, its compliance programs, and other
matters of importance to the Group.
The Board engages external consultants every three years to evaluate
the performance of the Board of Directors, an independent review
will be due in 2017. In the intervening years, ‘self-evaluations’ are
conducted after which the Chairman will invite Directors to discuss
areas identified in which performance can be improved.
ENTERPRISE RISK MANAGEMENT
Republic Financial Holdings Limited is committed to maintaining
a robust enterprise risk management framework to ensure that it
understands and monitors its risk environment and takes proactive
measures to manage risk within acceptable levels consistent with its
risk appetite. To this end, Republic Financial Holdings Limited has
defined its risk management goals and objectives and supporting
principles to effectively embed risk management throughout the
Group into its strategic decisions and day-to-day business activities.
The Board of Directors (the Board) has overall accountability for the
Group’s enterprise risk profile. They approve and enforce the risk
management framework, inclusive of the overall risk appetite and
the Group’s philosophy on risk taking.
CORPORATE GOVERNANCE

66 67
4 CORPORATE SOCIAL RESPONSIBILITYA Flow of Support

68 69
THE POWER TO MAKE A DIFFERENCEIt is widely accepted that understanding the past is critical to charting
the future; building the kinds of relationships that will stand the test
of time and truly make a difference in the lives of many. As part of the
Caribbean for more than 175 years, Republic Bank has always been
committed to a vision of local and regional sustainable development.
In many ways, the story of the Power to Make A Difference programme
is the story of the Republic Group itself. As we have grown, forming
strong bonds with diverse communities in the Caribbean and
beyond, so too has our commitment to raising the bar of corporate
social investment.
Guided by the belief in the Power to Make A Difference, we intend,
as a financial institution of the people, to take our investment even
further, under a new brand, Republic Financial Holdings Limited,
as we chart the way forward in programmes that focus on youth
empowerment through education, the arts, culture, and sport,
advocate the rights of the differently able and socially marginalised,
and foster a spirit of social activism through staff volunteerism.
Creating a Legacy of Teamwork and Caring
Through advocacy and collaboration, we have successfully expanded
on the traditional model of sustainable investment beyond
sponsorship, to help create a legacy of teamwork and caring; one
that embraces the wider interests of the NGO and CBO communities,
while inspiring us to pursue additional areas, previously unexplored,
where we could provide even more meaningful assistance.
In 2015/2016, as Republic Financial Holdings Limited, we welcomed
communities in Suriname and Ghana to the fold as we invested over
TT$30 million, carrying the Power to Make a Difference forward;
directing our resources toward sustainable development through
investment and staff volunteerism as we build upon existing
partnerships and support new efforts for holistic social improvement.
Inspiring the Leaders of Tomorrow
The focus on youth empowerment through education, cultural
development and sport starts with giving young achievers the
encouragement and the avenues to succeed; viable options that they
may not necessarily have an opportunity to make the most of. As we
sought new ways to reconnect and inspire younger minds, we kept
the spotlight on maintaining existing programmes that have proven
their worth through longevity and sheer impact on a diverse array of
communities.
Once again, in collaboration with a diversity of communities, the
Group made strides in promoting greater literacy throughout
the region, unlocking the potential within thousands of children
through well-received initiatives like the successful launch of the
groundbreaking Literacy Caravan in partnership with the Trinidad &
Tobago National Commission for UNESCO and their ongoing cause
to promote greater literacy among young achievers.
In a similar vein of youth empowerment through education, the
RightStart Speech Contest, which entered its sixth successful year
of investing in the futures of children, continues to improve the
language skills of Barbadian primary school students between the
ages of nine and 11. This year, 38 students from 20 public and private
primary schools participated in the contest that helps develop
strong communication skills, builds confidence, encourages reading,
writing, and research, and improves speech delivery.
Across the diversity of the Region, sponsorship mainstays – the
Republic Bank RightStart Youth Football Tournament, the Republic
Bank Youth Link Apprenticeship Programme, and the Republic Bank
Pan Minors Music Literacy Programme – continue to build upon
our rich and ongoing history of programmes centred on youth
empowerment through sport, culture, and the arts.
Keeping the focus on education as a means of social mobility, in
2015/2016, the Group strengthened the kinship shared with diverse
communities thanks to dynamic partnerships with the Butler Institute
of Learning and Labour afterschool programme, St Ann’s/Cascade
Motivational Programme, the Cropper Foundation, the Cotton Tree
Foundation, the Adult Literacy Tutors Association, the Loveuntil
Foundation, and the Archdiocesan Family Life Commission’s
Common Sense Parenting Programme.
Keeping the Promise to our Brothers and Sisters
The 2015/2016 phase of the Power to Make a Difference saw an
even deeper, more focussed investment in the work of our partners,
particularly those committed to championing the rights and
standards of living for the social marginalised and the differently
able; our brothers and sisters whom we have promised to protect.
January 2016 also signalled a huge milestone in the Group’s
commitment to sustainable social investment with the launch
of Power to Make A Difference in Suriname; adding credence to
Republic Bank LimitedInaugural Sea to Sea Marathon held in Tobago
Republic Bank (Suriname) Limitedgives back to the nearly 60 inhabitants of elderly home ‘Fatima Oord’, by giving the garden of the home a complete make-over
Republic Bank (Barbados) Limited Knowledge is power –
on the road testing with the Diabetes Association of Barbados
and Republic Bank Mobile Unit

70 71
THE POWER TO MAKE A DIFFERENCE
an overall aim to truly have a positive impact on all the places the
Republic Group calls home. In this inaugural phase, the first project
was the renovation and upgrade of five rooms in the children’s
section at the Diakonessen Hospital. Thanks to this improvement,
sick children will now have comfortable surroundings that will go
a long way to improving their spirits, and quite possibly, even their
health.
In 2015/2016, the connections formed through the years have raised
awareness for developmental disabilities like Autism Spectrum
Disorder and Dyslexia; helped continue to provide palliative care,
testing, and vital assistance for those afflicted by cancer and diabetes;
given succour to many young children awaiting medical attention
and life-saving organ transplants; and offered hope to the differently
able that they may be empowered to lead fulfilling lives in a world
more in touch with their abilities.
These powerful alliances have resulted in thousands across the
Caribbean receiving the help they need; laying the framework for
successful collaboration as the key to realising an even stronger,
more aware, and more caring environment, and providing the
encouragement for others to become more involved as we aspire
toward a brighter future for the region.
Providing hope for a better future is the philosophy behind our
support of the revolutionary rehabilitation programme, Vision on
Mission (VoM). Founded in 1995 to prepare inmates for release into
the society and to facilitate their resettlement, VoM has evolved over
the years to become an important part of the national machinery
responsible for restorative justice in Trinidad and Tobago; serving the
needs of hundreds of current and former male criminal offenders.
Going a step further, Republic’s investment toward the construction
of a centre at Claxton Bay to cater to the needs of 120 socially
marginalised women, between the ages of 16-65 years in Trinidad
and Tobago, will help provide the right counselling, accommodation
and meals, employment assessment and placement, and medical
assistance necessary to facilitate these women’s successful re-
integration into our society.
So overwhelming has been the support for this project that staff
members have stepped up in their numbers to assist with the
painting and beautifying of the rooms for the residents.
Preserving Our Home
Our country is our home. As our home, we have a responsibility to
provide for not only its well-being, and ultimately, its safety, we also
have to provide so that future generations understand their role in
keeping our country beautiful on all fronts – environmentally and
culturally. Maintaining the beauty of our home extends beyond
simply ensuring we have safe, clean, and comfortable spaces, it is as
equally important to continue adding value to our people’s cultural
development.
Having the power to make a difference in the reenergising of
Grand Kadooment, the culmination of the annual Barbados Crop
Over festival, has, since our involvement, resulted in increased
numbers of costumed bands participating. Our support has also
greatly contributed to the National Cultural Foundation achieving
its objectives including, providing more meaningful prizes and
opportunities for improving the skills of costume designers.
Similarly, the Group ushered in a new era of cultural development,
celebrating milestones of investment in the Republic Bank Junior
Parade of the Bands, the Baal Vikaas Vihaar Festival, and the Republic
Bank Love Movement Youth Outreach, which have all continued
to connect us with different people; developing and showcasing
the talents of countless young achievers, as we joined hands in the
pursuit of a culturally rich and expressive environment for all.
As bridges were formed with new communities in Ghana, so too
were powerful initiatives to strengthen a nation that is finding its
way in the agricultural and oil and gas sectors. Partnerships with
the lobbyist group, Ghana Oil and Gas Service Providers Association
(GOGSPA), and the Sekondi-Takoradi Chamber of Commerce and
Industry further cemented the Group’s commitment to working
hand-in-hand with the country’s industry leaders on an ongoing
drive to augment upstream, midstream and downstream parts of
the oil and gas sector. Similarly, during this period, HFC Bank (Ghana)
focussed on other areas of sustainable development by successfully
hosting the first ever Cocoa Summit as a way of offering support, a
viable platform to engage a wider cross section of rural cocoa farmers
and exporters, and additional avenues for increased employment
and infrastructural development.
Republic Bank (Grenada) LimitedPartnership with Grenada Youth Adventurers, and professional swim trainers locally and internationally, who volunteered their time and skill to teach water safety. Training was delivered in basic water survival techniques
HFC Bank (Ghana) LimitedRobert Le Hunte, Managing Director, HFC Bank (Ghana) Limited, addressing participants at the Cocoa Summit
Republic Bank (Suriname) LimitedGloria Anthony, Managing Director,
presents a cheque to Afke Fitz Jim, Chief Financial Officer of the
Diakonessen Hospital, at the launch of the Republic Bank
Power to Make a Difference programme in Suriname

72 73
Republic Bank (Guyana) LimitedA Staff Volunteer engages children during a visit to the Save Our Children Orphanage
THE POWER TO MAKE A DIFFERENCE
Working beyond the regular work day
As our sponsorship and social programmes continue to make inroads
in raising the standard of living in various communities, so too has
our staff volunteerism programme laid down a blueprint of how
to let our actions outside of the bank speak just as loudly as those
inside. Beyond the dollars and cents of financial investment, comes
the investment of human capital, energy, and most all, the belief in
all hands working together to achieve the future we seek.
In February 2016, more than 20 Suriname team members led the way
by joining forces to beautify the garden of the elderly home ‘Fatima
Oord’. In collaboration with some garden specialists, these “True
Blue” volunteers gave the garden a complete makeover, much to the
delight of the residents, who expressed their gratitude for helping
to beautify and maintain such an important area of relaxation and
activity for most of the senior citizens.
The 2015/2016 phase was a particularly memorable one as our “True
Blue” teams once again showed their resourcefulness by successfully
working together on national beautification and construction
projects with the Habitat for Humanity and the United Way Trinidad
and Tobago. The challenge, we have issued ourselves is to become
more involved as we strive to do more with our time in pursuit of the
common good.
On Mother’s Day 2016, staff from HFC Bank (Ghana) spread joy to
communities in Accra, Kumasi, Tamale, Koforidua and Cape Coast as
part of “My Mother, My Joy” – a staff volunteerism drive to donate
much needed toiletries, provisions, clothes, and toys to hundreds in
need. Going further, Tamale Branch staff successfully raised funds to
outfit the children’s ward of the Seventh Day Adventist (SDA) hospital
in Tamale, Tema branch staff worked together to renovate the Manhia
Hospital’s maternity ward, and the Adabraka team likewise helped
refurbish the Accra Psychiatric Hospital.
Across the region, the relationships that we have made with various
communities have come to define us as more than simply a financial
institution of choice, but also as a collection of like-minded souls,
dedicated to working together to help set the right foundation for the
day when volunteerism becomes the norm and not the exception.
The Future Beckons
As we begin a new era as Republic Financial Holdings Limited,
we look forward to the future of the Power to Make A Difference
programme serving the communities across the regions we serve in
the Caribbean, South America, and Africa. The promises we have built
upon over the last decade will pave the way for new opportunities to
enhance the well-being and future prospects of many. In this next
phase of our evolution, the focus remains fixed on adding value to
the ways we engage the community and leading by example, to
uplift a multitude of people and societies.
Republic Bank LimitedWe did it! Volunteers celebrate
after painting the rooms at the Vision on Mission facility
for women in Claxton Bay
Republic Bank (Barbados) LimitedFinalists of the Republic Bank RightStart Speech Contest 2016

74 75
5 FINANCIAL STATEMENTSProcessing Our Success
•
HFC Bank (Ghana) Limited Young athletes displaying athletic vests and medals presented by HFC Bank to the Ghana Education Service (GES) as part of a three-year partnership programme
Republic Bank (Grenada) LimitedPartnership with the “Proactive
Nation Builders” to provide positive alternatives for youth. Training in the
performing arts, music and dance, activities that assist in the creation of
productive, socially healthy and civic-minded youth, who can
make meaningful contribution to the society
Republic Bank (Guyana) LimitedYoung Steel Band Arrangers demonstrate their playing skills during the Graduation Ceremony of the Republic Bank RightStart Pan Minors Music Literacy Programme
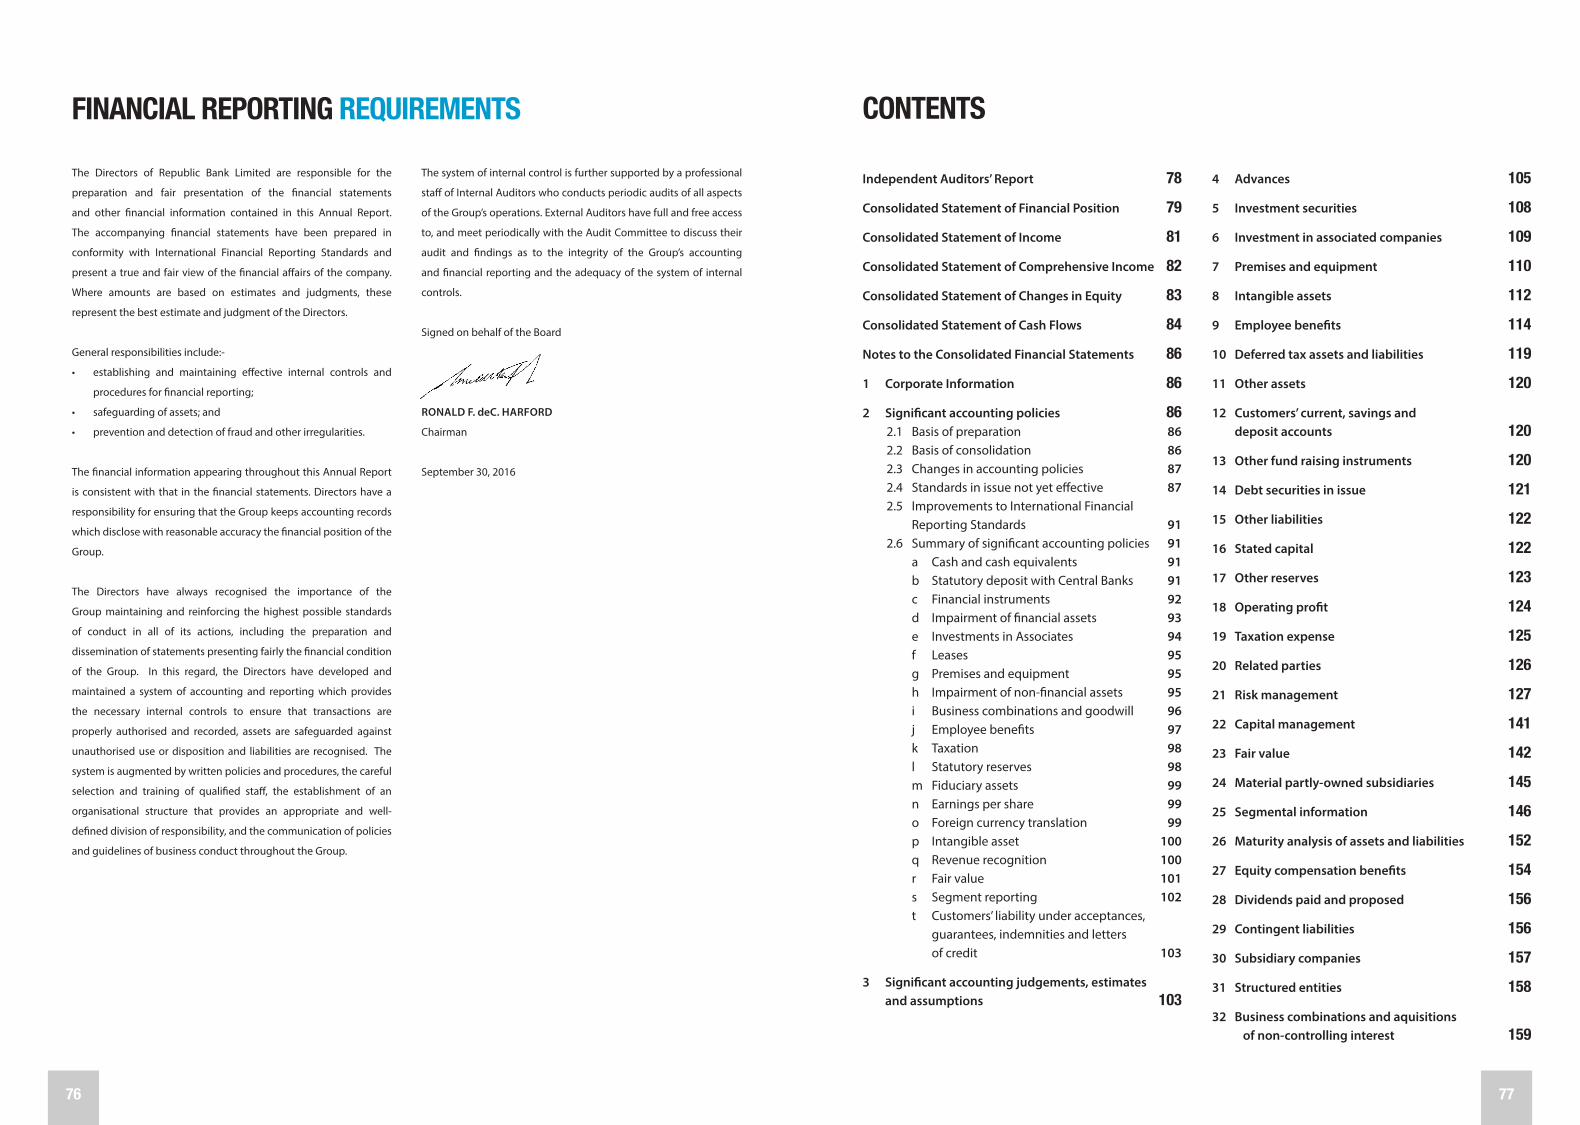
76 77
CONTENTS
Independent Auditors’ Report 78
Consolidated Statement of Financial Position 79
Consolidated Statement of Income 81
Consolidated Statement of Comprehensive Income 82
Consolidated Statement of Changes in Equity 83
Consolidated Statement of Cash Flows 84
Notes to the Consolidated Financial Statements 86
1 Corporate Information 86
2 Significant accounting policies 862.1 Basis of preparation 862.2 Basis of consolidation 862.3 Changes in accounting policies 872.4 Standards in issue not yet effective 872.5 Improvements to International Financial Reporting Standards 912.6 Summary of significant accounting policies 91
a Cash and cash equivalents 91b Statutory deposit with Central Banks 91c Financial instruments 92d Impairment of financial assets 93e Investments in Associates 94f Leases 95g Premises and equipment 95h Impairment of non-financial assets 95i Business combinations and goodwill 96j Employee benefits 97k Taxation 98l Statutory reserves 98m Fiduciary assets 99n Earnings per share 99o Foreign currency translation 99p Intangible asset 100q Revenue recognition 100r Fair value 101s Segment reporting 102t Customers’ liability under acceptances, guarantees, indemnities and letters of credit 103
3 Significant accounting judgements, estimates and assumptions 103
4 Advances 105
5 Investment securities 108
6 Investment in associated companies 109
7 Premises and equipment 110
8 Intangible assets 112
9 Employee benefits 114
10 Deferred tax assets and liabilities 119
11 Other assets 120
12 Customers’ current, savings and deposit accounts 120
13 Other fund raising instruments 120
14 Debt securities in issue 121
15 Other liabilities 122
16 Stated capital 122
17 Other reserves 123
18 Operating profit 124
19 Taxation expense 125
20 Related parties 126
21 Risk management 127
22 Capital management 141
23 Fair value 142
24 Material partly-owned subsidiaries 145
25 Segmental information 146
26 Maturity analysis of assets and liabilities 152
27 Equity compensation benefits 154
28 Dividends paid and proposed 156
29 Contingent liabilities 156
30 Subsidiary companies 157
31 Structured entities 158
32 Business combinations and aquisitions of non-controlling interest 159
The Directors of Republic Bank Limited are responsible for the
preparation and fair presentation of the financial statements
and other financial information contained in this Annual Report.
The accompanying financial statements have been prepared in
conformity with International Financial Reporting Standards and
present a true and fair view of the financial affairs of the company.
Where amounts are based on estimates and judgments, these
represent the best estimate and judgment of the Directors.
General responsibilities include:-
• establishing and maintaining effective internal controls and
procedures for financial reporting;
• safeguarding of assets; and
• prevention and detection of fraud and other irregularities.
The financial information appearing throughout this Annual Report
is consistent with that in the financial statements. Directors have a
responsibility for ensuring that the Group keeps accounting records
which disclose with reasonable accuracy the financial position of the
Group.
The Directors have always recognised the importance of the
Group maintaining and reinforcing the highest possible standards
of conduct in all of its actions, including the preparation and
dissemination of statements presenting fairly the financial condition
of the Group. In this regard, the Directors have developed and
maintained a system of accounting and reporting which provides
the necessary internal controls to ensure that transactions are
properly authorised and recorded, assets are safeguarded against
unauthorised use or disposition and liabilities are recognised. The
system is augmented by written policies and procedures, the careful
selection and training of qualified staff, the establishment of an
organisational structure that provides an appropriate and well-
defined division of responsibility, and the communication of policies
and guidelines of business conduct throughout the Group.
FINANCIAL REPORTING REQUIREMENTS
The system of internal control is further supported by a professional
staff of Internal Auditors who conducts periodic audits of all aspects
of the Group’s operations. External Auditors have full and free access
to, and meet periodically with the Audit Committee to discuss their
audit and findings as to the integrity of the Group’s accounting
and financial reporting and the adequacy of the system of internal
controls.
Signed on behalf of the Board
RONALD F. deC. HARFORD
Chairman
September 30, 2016

78 79
As at September 30, 2016. Expressed in thousands of Trinidad and Tobago dollars ($’000)CONSOLIDATED STATEMENT OF FINANCIAL POSITION
Notes 2016 2015
ASSETS
Cash and cash equivalents 793,703 930,485
Statutory deposits with Central Banks 5,787,709 5,627,292
Due from banks 5,340,734 7,542,995
Treasury Bills 5,886,143 6,162,162
Investment interest receivable 95,535 74,400
Advances 4 34,292,693 33,007,998
Investment securities 5 10,265,047 8,094,392
Investment in associated companies 6 75,491 142,066
Premises and equipment 7 2,188,528 1,917,870
Intangible assets 8 416,931 539,771
Pension assets 9 1,010,851 1,223,147
Deferred tax assets 10 (a) 211,868 170,736
Taxation recoverable 82,820 72,586
Other assets 11 411,490 495,676
TOTAL ASSETS 66,859,543 66,001,576
LIABILITIES AND EQUITY
LIABILITIES
Due to banks 167,481 554,135
Customers’ current, savings and deposit accounts 12 49,631,274 49,711,582
Other fund raising instruments 13 3,843,646 2,586,569
Debt securities in issue 14 1,148,792 1,192,952
Pension liability 9 67,360 52,595
Provision for post-retirement medical benefits 9 430,929 406,171
Taxation payable 160,274 165,493
Deferred tax liabilities 10 (b) 394,194 420,011
Accrued interest payable 104,676 68,591
Other liabilities 15 1,368,222 1,432,868
TOTAL LIABILITIES 57,316,848 56,590,967
The accompanying notes form an integral part of these consolidated financial statements.
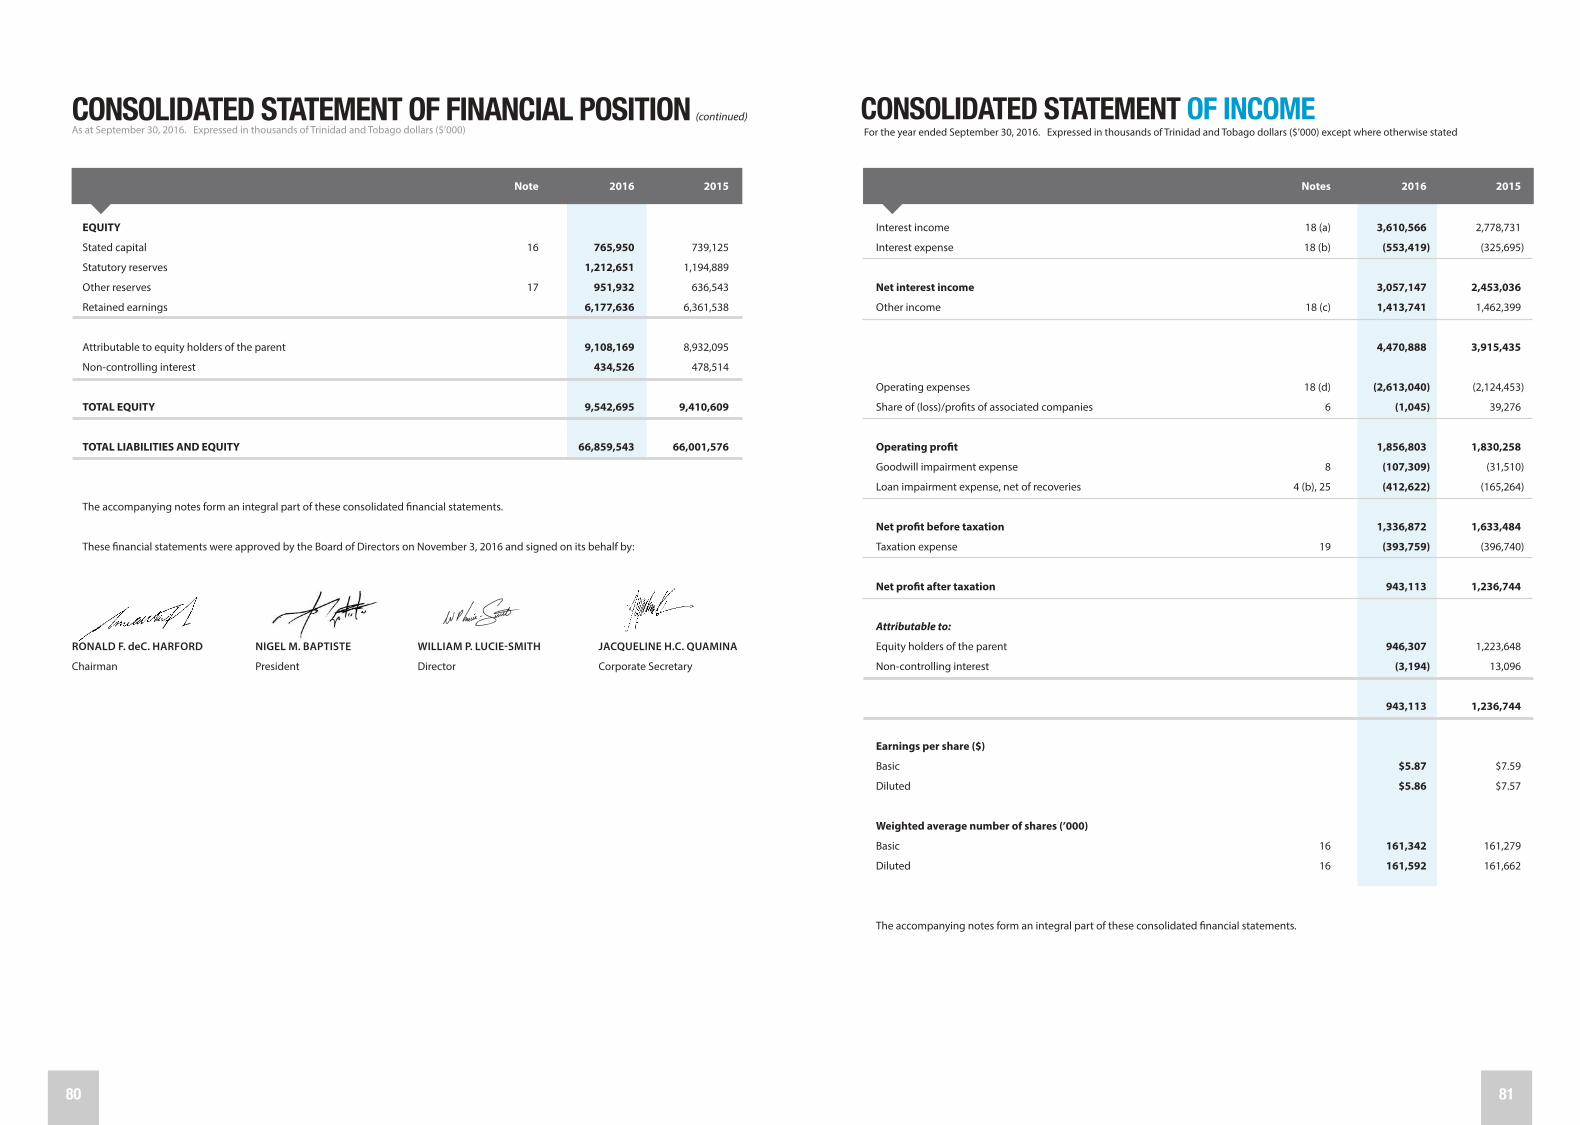
80 81
Notes 2016 2015
Interest income 18 (a) 3,610,566 2,778,731
Interest expense 18 (b) (553,419) (325,695)
Net interest income 3,057,147 2,453,036
Other income 18 (c) 1,413,741 1,462,399
4,470,888 3,915,435
Operating expenses 18 (d) (2,613,040) (2,124,453)
Share of (loss)/profits of associated companies 6 (1,045) 39,276
Operating profit 1,856,803 1,830,258
Goodwill impairment expense 8 (107,309) (31,510)
Loan impairment expense, net of recoveries 4 (b), 25 (412,622) (165,264)
Net profit before taxation 1,336,872 1,633,484
Taxation expense 19 (393,759) (396,740)
Net profit after taxation 943,113 1,236,744
Attributable to:
Equity holders of the parent 946,307 1,223,648
Non-controlling interest (3,194) 13,096
943,113 1,236,744
Earnings per share ($)
Basic $5.87 $7.59
Diluted $5.86 $7.57
Weighted average number of shares (’000)
Basic 16 161,342 161,279
Diluted 16 161,592 161,662
The accompanying notes form an integral part of these consolidated financial statements.
CONSOLIDATED STATEMENT OF INCOMEFor the year ended September 30, 2016. Expressed in thousands of Trinidad and Tobago dollars ($’000) except where otherwise statedAs at September 30, 2016. Expressed in thousands of Trinidad and Tobago dollars ($’000)
CONSOLIDATED STATEMENT OF FINANCIAL POSITION (continued)
Note 2016 2015
EQUITY
Stated capital 16 765,950 739,125
Statutory reserves 1,212,651 1,194,889
Other reserves 17 951,932 636,543
Retained earnings 6,177,636 6,361,538
Attributable to equity holders of the parent 9,108,169 8,932,095
Non-controlling interest 434,526 478,514
TOTAL EQUITY 9,542,695 9,410,609
TOTAL LIABILITIES AND EQUITY 66,859,543 66,001,576
The accompanying notes form an integral part of these consolidated financial statements.
These financial statements were approved by the Board of Directors on November 3, 2016 and signed on its behalf by:
RONALD F. deC. HARFORD NIGEL M. BAPTISTE WILLIAM P. LUCIE-SMITH JACQUELINE H.C. QUAMINA
Chairman President Director Corporate Secretary

82 83
CONSOLIDATED STATEMENT OF CHANGES IN EQUITYFor the year ended September 30, 2016. Expressed in thousands of Trinidad and Tobago dollars ($’000)
Total equity attributable to equity Non- Stated Statutory Other Retained holders of controlling Total capital reserves reserves earnings the parent interest equity
Balance at September 30, 2014 704,871 1,202,364 744,363 5,785,296 8,436,894 309,429 8,746,323
Total comprehensive (loss)/income
for the year – – (89,647) 1,253,189 1,163,542 12,476 1,176,018
Issue of shares 27,374 – – – 27,374 – 27,374
Share-based payment 6,880 – – – 6,880 – 6,880
Shares purchased for
profit sharing scheme – – (67,410) – (67,410) – (67,410)
Allocation of shares – – 49,195 – 49,195 – 49,195
Transfer to general
contingency reserve – – 42 (42) – – –
Transfer from statutory reserves – (7,475) – 7,475 – – –
Acquisition of non-
controlling interest – – – – – 192,040 192,040
Dividends (Note 28) – – – (687,597) (687,597) – (687,597)
Dividends paid to non-
controlling interest – – – – – (35,431) (35,431)
Other – – – 3,217 3,217 – 3,217
Balance at September 30, 2015 739,125 1,194,889 636,543 6,361,538 8,932,095 478,514 9,410,609
Total comprehensive
income for the year – – 71,806 804,263 876,069 13,820 889,889
Issue of shares 22,752 – – – 22,752 – 22,752
Share-based payment 4,073 – – – 4,073 – 4,073
Shares purchased for
profit sharing scheme – – (78,461) – (78,461) – (78,461)
Allocation of shares – – 54,762 – 54,762 – 54,762
Transfer to general
contingency reserve – – 267,282 (267,282) – – –
Transfer to statutory reserves – 17,762 – (17,762) – – –
Acquisition of non-
controlling interest – – – – – (54,960) (54,960)
Dividends (Note 28) – – – (704,965) (704,965) – (704,965)
Dividends paid to non-
controlling interest – – – – – (20,175) (20,175)
Other – – – 1,844 1,844 885 2,729
Balance at September 30, 2016 765,950 1,212,651 951,932 6,177,636 9,108,169 418,084 9,526,253
The accompanying notes form an integral part of these consolidated financial statements.
CONSOLIDATED STATEMENT OF COMPREHENSIVE INCOMEFor the year ended September 30, 2016. Expressed in thousands of Trinidad and Tobago dollars ($’000)
Note 2016 2015
Net profit after taxation 943,113 1,236,744
Other comprehensive income:
Items of other comprehensive income that may be reclassified to profit or loss
in subsequent periods (net of tax):
Net gain/(loss) on available-for-sale investments 61,465 (226,908)
Translation adjustments 29,168 138,388
Net other comprehensive income/(loss) that may be reclassified to profit or loss
in subsequent periods: 90,633 (88,520)
Items of other comprehensive income that will not be reclassified to profit or loss
in subsequent periods (net of tax):
Net re-measurement (losses)/gains on defined benefit plans (143,231) 29,575
Share of changes recognised directly in associate’s equity 6 (626) (1,781)
Net other comprehensive (loss)/income that will not be reclassified to profit or loss
in subsequent periods: (143,857) 27,794
Total other comprehensive loss for the year, net of tax (53,224) (60,726)
Total comprehensive income for the year, net of tax 889,889 1,176,018
Attributable to:
Equity holders of the parent 876,069 1,163,542
Non-controlling interest 13,820 12,476
889,889 1,176,018
The accompanying notes form an integral part of these consolidated financial statements.

84 85
CONSOLIDATED STATEMENT OF CASH FLOWS CONSOLIDATED STATEMENT OF CASH FLOWS (continued)
For the year ended September 30, 2016. Expressed in thousands of Trinidad and Tobago dollars ($’000) For the year ended September 30, 2016. Expressed in thousands of Trinidad and Tobago dollars ($’000)
Notes 2016 2015
Operating activities
Net profit before taxation 1,336,872 1,633,484
Adjustments for:
Depreciation 7 165,627 145,159
Loan impairment expense, net of recoveries 4 (b)(ii) 412,622 165,264
Goodwill impairment expense, net of negative goodwill 8 (a) 106,573 31,510
Investment securities impairment expense 65,507 –
Amortisation of intangibles 8 (b) 16,267 –
Translation difference 258,259 151,407
Loss/(profit) on sale of premises and equipment 6,286 (11,661)
Realised gain on investment securities (11,359) (1,958)
Share of net loss/(profit) of associated companies 6 1,045 (39,276)
Stock option expense 16 4,073 6,880
Increase in employee benefits 90,493 32,023
Increase in advances (1,694,495) (3,375,831)
Increase in customers’ deposits and other fund raising instruments 1,176,768 748,559
Increase in statutory deposits with Central Banks (160,417) (511,440)
Decrease in other assets and investment interest receivable 63,050 256,035
(Decrease)/increase in other liabilities and accrued interest payable (28,561) 66,284
Taxes paid, net of refund (463,257) (331,570)
Cash provided by/(used in) operating activities 1,345,353 (1,035,131)
Investing activities
Purchase of investment securities (7,681,348) (5,586,978)
Redemption of investment securities 5,652,267 5,800,181
Acquisition of controlling interest in a subsidiary 6 – 236,660
Acquisition of additional interest in a subsidiary 32 (c) (38,518) –
Acquisition of subsidiaries, net of cash acquired 32 – 959,092
Dividends from associated companies 6 1,705 5,638
Additions to premises and equipment 7 (438,756) (287,338)
Proceeds from sale of premises and equipment 5,388 17,134
Cash (used in)/provided by investing activities (2,499,262) 1,144,389
The accompanying notes form an integral part of these consolidated financial statements.
Notes 2016 2015
Financing activities
(Decrease)/increase in balances due to other banks (386,654) 325,700
Repayment of debt securities (44,160) (12,510)
Proceeds from share issue 16 22,754 27,374
Shares purchased for profit sharing scheme 17 (78,461) (67,410)
Allocation of shares to profit sharing plan 17 54,761 49,195
Dividends paid to shareholders of the parent 28 (704,965) (687,597)
Dividends paid to non-controlling shareholders of the subsidiaries (20,176) (35,431)
Cash used in financing activities (1,156,901) (400,679)
Net decrease in cash and cash equivalents (2,310,810) (291,421)
Net foreign exchange difference (384,171) (7,140)
Cash and cash equivalents at beginning of year 13,492,116 13,790,677
Cash and cash equivalents at end of year 10,797,135 13,492,116
Cash and cash equivalents at end of year are represented by:
Cash on hand 793,703 930,485
Due from banks 5,340,734 7,542,995
Treasury Bills - original maturities of three months or less 4,330,354 4,685,164
Bankers’ acceptances - original maturities of three months or less 332,344 333,472
10,797,135 13,492,116
Supplemental information:
Interest received during the year 3,589,431 2,742,574
Interest paid during the year (517,335) (297,696)
Dividends received 18 (c) 1,257 442
The accompanying notes form an integral part of these consolidated financial statements.
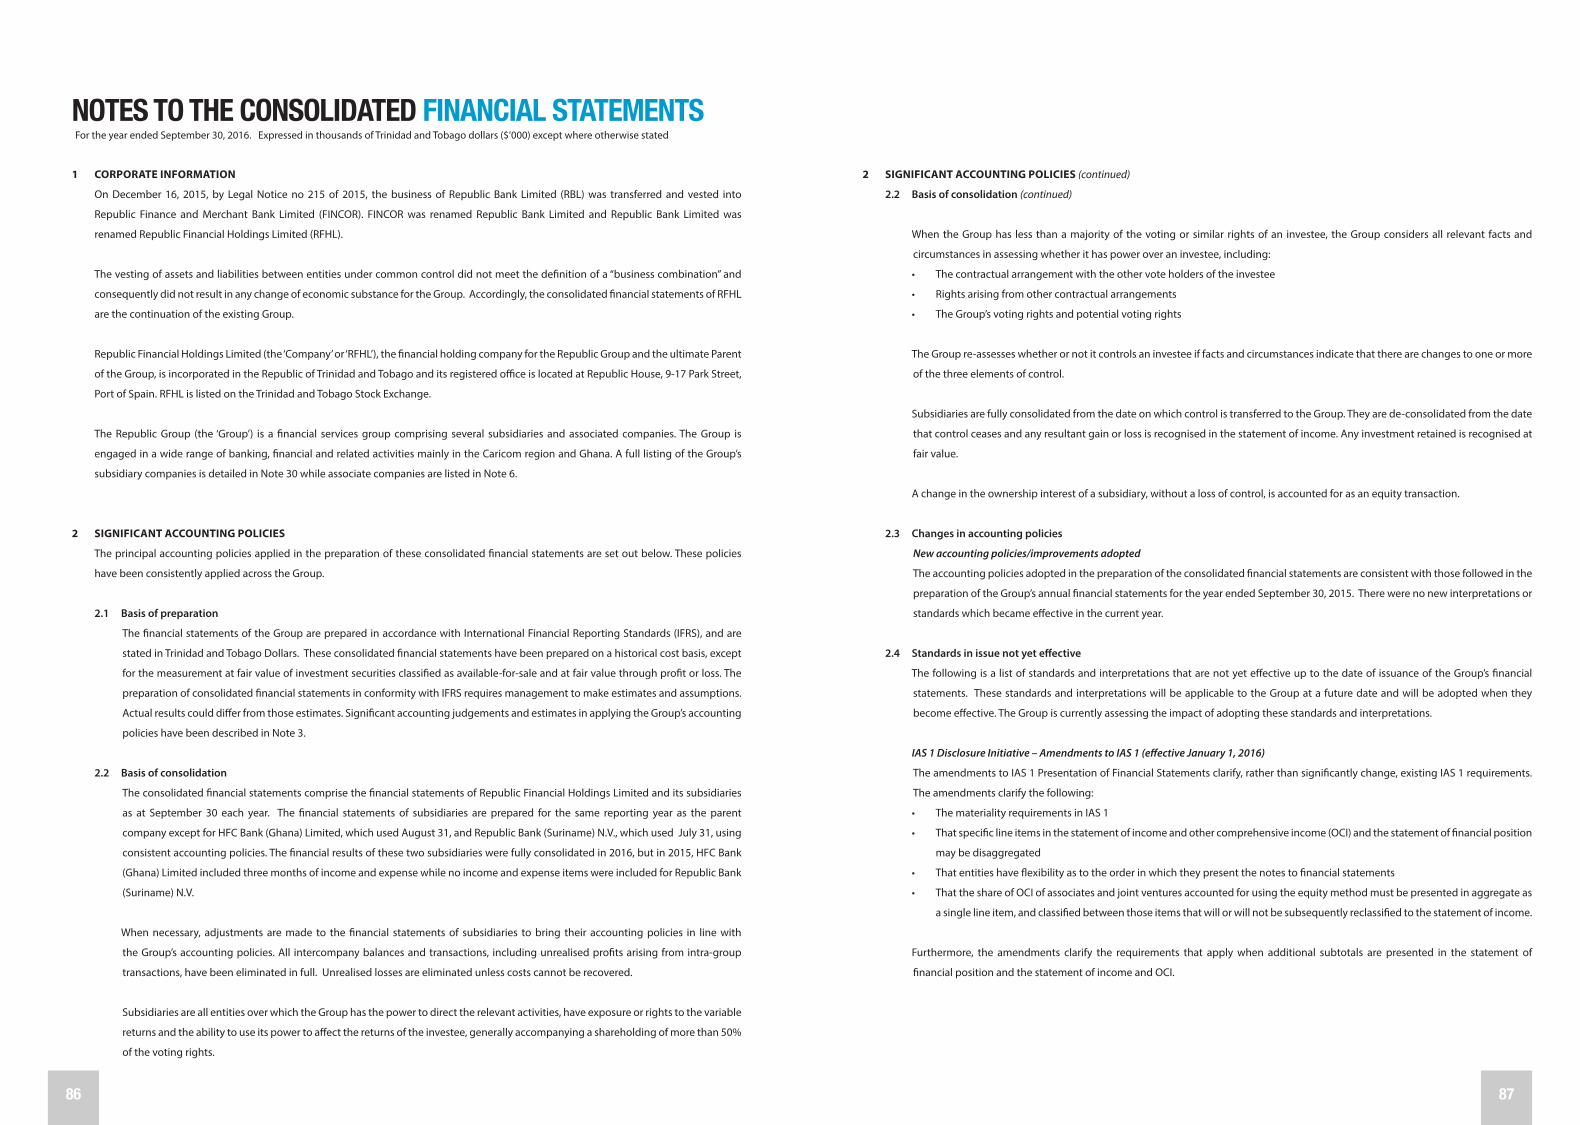
86 87
1 CORPORATE INFORMATION
On December 16, 2015, by Legal Notice no 215 of 2015, the business of Republic Bank Limited (RBL) was transferred and vested into
Republic Finance and Merchant Bank Limited (FINCOR). FINCOR was renamed Republic Bank Limited and Republic Bank Limited was
renamed Republic Financial Holdings Limited (RFHL).
The vesting of assets and liabilities between entities under common control did not meet the definition of a “business combination” and
consequently did not result in any change of economic substance for the Group. Accordingly, the consolidated financial statements of RFHL
are the continuation of the existing Group.
Republic Financial Holdings Limited (the ‘Company’ or ‘RFHL’), the financial holding company for the Republic Group and the ultimate Parent
of the Group, is incorporated in the Republic of Trinidad and Tobago and its registered office is located at Republic House, 9-17 Park Street,
Port of Spain. RFHL is listed on the Trinidad and Tobago Stock Exchange.
The Republic Group (the ‘Group’) is a financial services group comprising several subsidiaries and associated companies. The Group is
engaged in a wide range of banking, financial and related activities mainly in the Caricom region and Ghana. A full listing of the Group’s
subsidiary companies is detailed in Note 30 while associate companies are listed in Note 6.
2 SIGNIFICANT ACCOUNTING POLICIES
The principal accounting policies applied in the preparation of these consolidated financial statements are set out below. These policies
have been consistently applied across the Group.
2.1 Basis of preparation
The financial statements of the Group are prepared in accordance with International Financial Reporting Standards (IFRS), and are
stated in Trinidad and Tobago Dollars. These consolidated financial statements have been prepared on a historical cost basis, except
for the measurement at fair value of investment securities classified as available-for-sale and at fair value through profit or loss. The
preparation of consolidated financial statements in conformity with IFRS requires management to make estimates and assumptions.
Actual results could differ from those estimates. Significant accounting judgements and estimates in applying the Group’s accounting
policies have been described in Note 3.
2.2 Basis of consolidation
The consolidated financial statements comprise the financial statements of Republic Financial Holdings Limited and its subsidiaries
as at September 30 each year. The financial statements of subsidiaries are prepared for the same reporting year as the parent
company except for HFC Bank (Ghana) Limited, which used August 31, and Republic Bank (Suriname) N.V., which used July 31, using
consistent accounting policies. The financial results of these two subsidiaries were fully consolidated in 2016, but in 2015, HFC Bank
(Ghana) Limited included three months of income and expense while no income and expense items were included for Republic Bank
(Suriname) N.V.
When necessary, adjustments are made to the financial statements of subsidiaries to bring their accounting policies in line with
the Group’s accounting policies. All intercompany balances and transactions, including unrealised profits arising from intra-group
transactions, have been eliminated in full. Unrealised losses are eliminated unless costs cannot be recovered.
Subsidiaries are all entities over which the Group has the power to direct the relevant activities, have exposure or rights to the variable
returns and the ability to use its power to affect the returns of the investee, generally accompanying a shareholding of more than 50%
of the voting rights.
NOTES TO THE CONSOLIDATED FINANCIAL STATEMENTSFor the year ended September 30, 2016. Expressed in thousands of Trinidad and Tobago dollars ($’000) except where otherwise stated
2 SIGNIFICANT ACCOUNTING POLICIES (continued)
2.2 Basis of consolidation (continued)
When the Group has less than a majority of the voting or similar rights of an investee, the Group considers all relevant facts and
circumstances in assessing whether it has power over an investee, including:
• The contractual arrangement with the other vote holders of the investee
• Rights arising from other contractual arrangements
• The Group’s voting rights and potential voting rights
The Group re-assesses whether or not it controls an investee if facts and circumstances indicate that there are changes to one or more
of the three elements of control.
Subsidiaries are fully consolidated from the date on which control is transferred to the Group. They are de-consolidated from the date
that control ceases and any resultant gain or loss is recognised in the statement of income. Any investment retained is recognised at
fair value.
A change in the ownership interest of a subsidiary, without a loss of control, is accounted for as an equity transaction.
2.3 Changes in accounting policies
New accounting policies/improvements adopted
The accounting policies adopted in the preparation of the consolidated financial statements are consistent with those followed in the
preparation of the Group’s annual financial statements for the year ended September 30, 2015. There were no new interpretations or
standards which became effective in the current year.
2.4 Standards in issue not yet effective
The following is a list of standards and interpretations that are not yet effective up to the date of issuance of the Group’s financial
statements. These standards and interpretations will be applicable to the Group at a future date and will be adopted when they
become effective. The Group is currently assessing the impact of adopting these standards and interpretations.
IAS 1 Disclosure Initiative – Amendments to IAS 1 (effective January 1, 2016)
The amendments to IAS 1 Presentation of Financial Statements clarify, rather than significantly change, existing IAS 1 requirements.
The amendments clarify the following:
• The materiality requirements in IAS 1
• That specific line items in the statement of income and other comprehensive income (OCI) and the statement of financial position
may be disaggregated
• That entities have flexibility as to the order in which they present the notes to financial statements
• That the share of OCI of associates and joint ventures accounted for using the equity method must be presented in aggregate as
a single line item, and classified between those items that will or will not be subsequently reclassified to the statement of income.
Furthermore, the amendments clarify the requirements that apply when additional subtotals are presented in the statement of
financial position and the statement of income and OCI.

88 89
2 SIGNIFICANT ACCOUNTING POLICIES (continued)
2.4 Standards in issue not yet effective (continued)
IAS 16 and IAS 38 Clarification of Acceptable Methods of Depreciation and Amortisation –Amendments to IAS 16 and IAS 38 (effective
January 1, 2016)
The amendments clarify the principle in IAS 16 Property, Plant and Equipment and IAS 38 Intangible Assets that revenue reflects a
pattern of economic benefits that are generated from operating a business (of which the asset is part) rather than the economic
benefits that are consumed through use of the asset. As a result, the ratio of revenue generated to total revenue expected to be
generated cannot be used to depreciate property, plant and equipment and may only be used in very limited circumstances to
amortise intangible assets.
IFRS 10, IFRS 12 and IAS 28 Investment Entities: Applying the Consolidation Exception - Amendments to IFRS 10, IFRS 12 and IAS 28
(effective January 1, 2016)
The amendments address issues that have arisen in applying the investment entities exception under IFRS 10.
The amendments to IFRS 10 clarify that the exemption (in IFRS 10.4) from presenting consolidated financial statements applies to a
parent entity that is a subsidiary of an investment entity, when the investment entity measures all of its subsidiaries at fair value.
Furthermore, the amendments to IFRS 10 clarify that only a subsidiary of an investment entity that is not an investment entity itself and
that provides support services to the investment entity is consolidated. All other subsidiaries of an investment entity are measured at
fair value.
The amendments to IAS 28 allow the investor, when applying the equity method, to retain the fair value measurement applied by
the investment entity associate or joint venture to its interests in subsidiaries.
IFRS 10 and IAS 28 Sale or Contribution of Assets between an Investor and its Associate or Joint Venture – Amendments to IFRS 10 and
IAS 28 (effective January 1, 2016)
The amendments address the conflict between IFRS 10 and IAS 28 in dealing with the loss of control of a subsidiary that is sold or
contributed to an associate or joint venture. The amendments clarify that the gain or loss resulting from the sale or contribution of
assets that constitute a business, as defined in IFRS 3 Business Combinations, between an investor and its associate or joint venture,
is recognised in full. Any gain or loss resulting from the sale or contribution of assets that do not constitute a business, however, is
recognised only to the extent of unrelated investors’ interests in the associate or joint venture.
IFRS 11 Accounting for Acquisitions of Interests in Joint Operations – Amendments to IFRS 11 (effective January 1, 2016)
The amendments require an entity acquiring an interest in a joint operation in which the activity of the joint operation constitutes a
business to apply, to the extent of its share, all of the principles in IFRS 3, and other IFRSs, that do not conflict with the requirements of
IFRS 11. Furthermore, entities are required to disclose the information required in those IFRSs in relation to business combinations.
The amendments also apply to an entity on the formation of a joint operation if, and only if, an existing business is contributed by the
entity to the joint operation on its formation.
Furthermore, the amendments clarify that for the acquisition of an additional interest in a joint operation in which the activity of the
joint operation constitutes a business, previously held interests in the joint operation must not be remeasured if the joint operator
retains joint control.
2 SIGNIFICANT ACCOUNTING POLICIES (continued)
2.4 Standards in issue not yet effective (continued)
IFRS 2 Classification and Measurement of Share-based Payment Transactions – Amendments to IFRS 2 (effective January 1, 2016)
The amendments are in relation to the classification and measurement of share-based payment transactions. The amendments
address three main areas:
• The effects of vesting conditions on the measurement of a cash-settled share-based payment transaction
• The classification of a share-based payment transaction with net settlement features for withholding tax obligations
• The accounting where a modification to the terms and conditions of a share-based payment transaction changes its classification
from cash-settled to equity-settled.
IFRS 14 Regulatory Deferral Accounts (effective January 1, 2016)
The standard requires disclosures on the nature of, and risks associated with, the entity’s rate-regulation and the effects of that rate-
regulation on its financial statements. IFRS 14 allows an entity, whose activities are subject to rate-regulation, to continue applying
most of its existing accounting policies for regulatory deferral account balances upon its first-time adoption of IFRS. Existing IFRS
preparers are prohibited from applying this standard. Also, an entity whose current GAAP does not allow the recognition of rate-
regulated assets and liabilities, or that has not adopted such policy under its current GAAP, would not be allowed to recognise them
on first-time application of IFRS.
IFRS 15 Revenue from Contracts with Customers (effective January 1, 2018)
IFRS 15 replaces all existing revenue requirements in IFRS (IAS 11 Construction Contracts, IAS 18 Revenue, IFRIC 13 Customer Loyalty
Programmes, IFRIC 15 Agreements for the Construction of Real Estate, IFRIC 18 Transfers of Assets from Customers and SIC 31 Revenue
– Barter Transactions Involving Advertising Services) and applies to all revenue arising from contracts with customers. It also provides a
model for the recognition and measurement of disposal of certain non-financial assets including property, equipment and intangible
assets.
The standard outlines the principles an entity must apply to measure and recognise revenue. The core principle is that an entity will
recognise revenue at an amount that reflects the consideration to which the entity expects to be entitled in exchange for transferring
goods or services to a customer.
The standard requires entities to exercise judgement, taking into consideration all of the relevant facts and circumstances when
applying each step of the model to contracts with their customers.
The standard also specifies how to account for the incremental costs of obtaining a contract and the costs directly related to fulfilling
a contract.
The standard will affect entities across all industries. Adoption will be a significant undertaking for most entities with potential changes
to an entity’s current accounting, systems and processes.
NOTES TO THE CONSOLIDATED FINANCIAL STATEMENTSFor the year ended September 30, 2016. Expressed in thousands of Trinidad and Tobago dollars ($’000) except where otherwise stated

90 91
2 SIGNIFICANT ACCOUNTING POLICIES (continued)
2.4 Standards in issue not yet effective (continued)
IFRS 9 Financial Instruments (effective January 1, 2018)
Classification and measurement of financial assets
Except for certain trade receivables, an entity initially measures a financial asset at its fair value plus, in the case of a financial asset
not at fair value through profit or loss (FVTPL), transaction costs. Debt instruments are subsequently measured at FVTPL, amortised
cost, or fair value through other comprehensive income (FVOCI), on the basis of their contractual cash flows and the business model
under which the debt instruments are held. There is a fair value option (FVO) that allows financial assets on initial recognition to be
designated as FVTPL if that eliminates or significantly reduces an accounting mismatch. Equity instruments are generally measured
at FVTPL. However, entities have an irrevocable option on an instrument-by-instrument basis to present changes in the fair value of
non-trading instruments in other comprehensive income (OCI) without subsequent reclassification to profit or loss.
Classification and measurement of financial liabilities
For financial liabilities designated as FVTPL using the FVO, the amount of change in the fair value of such financial liabilities that is
attributable to changes in credit risk must be presented in OCI. The remainder of the change in fair value is presented in profit or
loss, unless presentation in OCI of the fair value change in respect of the liability’s credit risk would create or enlarge an accounting
mismatch in profit or loss. All other IAS 39 Financial Instruments: Recognition and Measurement classification and measurement
requirements for financial liabilities have been carried forward into IFRS 9, including the embedded derivative separation rules and
the criteria for using the FVO.
Impairment
The impairment requirements are based on an expected credit loss (ECL) model that replaces the IAS 39 incurred loss model. The
ECL model applies to debt instruments accounted for at amortised cost or at FVOCI, most loan commitments, financial guarantee
contracts, contract assets under IFRS 15 Revenue from Contracts with Customers and lease receivables under IAS 17 Leases. Entities
are generally required to recognise 12-month ECL on initial recognition (or when the commitment or guarantee was entered into) and
thereafter as long as there is no significant deterioration in credit risk. However, if there has been a significant increase in credit risk on
an individual or collective basis, then entities are required to recognise lifetime ECL. For trade receivables, a simplified approach may
be applied whereby the lifetime ECL are always recognised.
IAS 7 Disclosure Initiative – Amendments to IAS 7 (effective January 1, 2017)
The amendments to IAS 7 Statement of Cash Flows are part of the IASB’s Disclosure Initiative and require an entity to provide
disclosures that enable users of financial statements to evaluate changes in liabilities arising from financing activities, including both
changes arising from cash flows and non-cash changes.
IAS 12 Recognition of Deferred Tax Assets for Unrealised Losses – Amendments to IAS 12 (effective January 1, 2017)
The IASB issued the amendments to IAS 12 Income Taxes to clarify the accounting for deferred tax assets for unrealised losses on debt
instruments measured at fair value. The amendments clarify that an entity needs to consider whether tax law restricts the sources
of taxable profits against which it may make deductions on the reversal of that deductible temporary difference. Furthermore, the
amendments provide guidance on how an entity should determine future taxable profits and explain the circumstances in which
taxable profit may include the recovery of some assets for more than their carrying amount.
2 SIGNIFICANT ACCOUNTING POLICIES (continued)
2.4 Standards in issue not yet effective (continued)
IFRS 16 Leases (effective January 1, 2019)
IFRS 16 requires lessees to account for all leases under a single on-balance sheet model in a similar way to finance leases under IAS 17.
The standard includes two recognition exemptions for lessees – leases of ’low-value’ assets (e.g., personal computers) and short-term
leases (i.e., leases with a lease term of 12 months or less). At the commencement date of a lease, a lessee will recognise a liability to
make lease payments (i.e., the lease liability) and an asset representing the right to use the underlying asset during the lease term (i.e.,
the right-of-use asset).
Lessees will be required to separately recognise the interest expense on the lease liability and the depreciation expense on the right-
of-use asset.
Lessees will be required to remeasure the lease liability upon the occurrence of certain events (e.g., a change in the lease term, a
change in future lease payments resulting from a change in an index or rate used to determine those payments). The lessee will
generally recognise the amount of the remeasurement of the lease liability as an adjustment to the right-of-use asset.
Lessor accounting is substantially unchanged from today’s accounting under IAS 17. Lessors will continue to classify all leases using
the same classification principle as in IAS 17 and distinguish between two types of leases: operating and finance leases.
2.5 Improvements to International Financial Reporting Standards
The annual improvements process of the International Accounting Standards Board deals with non-urgent but necessary clarifications
and amendments to IFRS. The following amendments are applicable to annual periods beginning on or after January 1, 2016.
IFRS Subject of Amendment
IFRS 5 - Non-current Assets Held for Sale and Discontinued Operations - Changes in methods of disposal
IFRS 7 - Financial Instruments: Disclosures - Servicing contracts
IFRS 7 - Financial Instruments: Disclosures - Applicability of the offsetting disclosures to condensed interim financial statements
IAS 19 - Employee Benefits - Discount rate: regional market issue
IAS 34 - Interim Financial Reporting - Disclosure of information ‘elsewhere in the interim financial report’
2.6 Summary of significant accounting policies
a) Cash and cash equivalents
For the purpose of presentation in the consolidated statement of cash flows, cash and cash equivalents consist of highly liquid
investments, cash at hand and at bank, Treasury Bills and bankers’ acceptances with original maturities of three months or less.
b) Statutory deposits with Central Banks
Pursuant to the provisions of the Central Bank Act, 1964 and the Financial Institutions Act, 2008, Republic Bank Limited is
required to maintain with the Central Bank of Trinidad and Tobago, statutory balances in relation to the deposit liabilities of the
institutions. Other than Statutory Deposits of $4.3 billion, the Bank also holds Treasury Bills and other deposits of $2.9 billion
with the Central Bank of Trinidad & Tobago as at September 30, 2016. Interest earned on these balances for the year was $29.2
million.
Pursuant to the Banking Act of Grenada 1988, Republic Bank (Grenada) Limited is required to maintain specified assets as a
reserve requirement to its deposit liabilities.
NOTES TO THE CONSOLIDATED FINANCIAL STATEMENTSFor the year ended September 30, 2016. Expressed in thousands of Trinidad and Tobago dollars ($’000) except where otherwise stated

92 93
2 SIGNIFICANT ACCOUNTING POLICIES (continued)
2.6 Summary of significant accounting policies (continued)
b) Statutory deposits with Central Banks (continued)
Pursuant to the Guyana Financial Institutions Act 1995, Republic Bank (Guyana) Limited is required to maintain with the Bank of
Guyana, statutory reserve balances in relation to the deposit liabilities of the institution.
In accordance with statutory provisions, Republic Bank (Barbados) Limited, is required to maintain reserves in the form of certain
cash resources and government securities with the Central Bank of Barbados.
In accordance with statutory provisions, HFC Bank (Ghana) Limited, is required to maintain reserves in the form of certain cash
resources with the Bank of Ghana.
In accordance with statutory provisions, Republic Bank (Suriname) N.V. is required to maintain reserves in the form of certain cash
resources with the Central Bank of Suriname.
c) Financial instruments
The Group’s financial assets and financial liabilities are recognised in the consolidated statement of financial position when it
becomes party to the contractual obligation of the instrument. A financial asset is derecognised when the rights to receive the
cash flows from the asset have expired or where the Group has substantially transferred all the risks and rewards of ownership
of the asset or control of the asset. A financial liability is derecognised when the obligation under the liability is discharged,
cancelled or has expired. All ‘regular way’ purchases and sales are recognised at settlement date.
For purposes of subsequent measurement, financial assets are classified in the following categories:
i) Advances
Advances are financial assets with fixed or determinable payments and fixed maturities that are not quoted in an active
market. They are not entered into with the intention of immediate or short-term resale and are not classified as ‘Financial
assets held for trading’, designated as ‘Financial investments - available-for-sale’ or ‘Financial assets designated at fair value
through profit or loss’. After initial measurement, advances are subsequently measured at amortised cost using the effective
interest rate method, less allowance for impairment. Amortised cost is calculated by taking into account any discount or
premium on acquisition and fees and costs that are an integral part of the effective interest rate. The amortisation is included
in ‘Interest income’ in the consolidated statement of income. The losses arising from impairment are recognised in the
consolidated statement of income in ‘loan impairment expense’.
ii) Investment securities
At fair value through profit or loss
Financial assets are classified in this category if they are either acquired for the purpose of selling in the short term or if so-
designated by management. Securities held as financial assets at fair value through profit or loss are initially recognised at
fair value and are continuously measured at fair value based on quoted market prices where available, or discounted cash
flow models.
2 SIGNIFICANT ACCOUNTING POLICIES (continued)
2.6 Summary of significant accounting policies (continued)
c) Financial instruments (continued)
ii) Investment securities (continued)
At fair value through profit or loss (continued)
All gains realised and unrealised from trading securities and those designated at fair value through profit or loss are reported
in other income whilst losses are reported in operating expenses. Interest and dividends earned whilst holding trading
securities and those designated at fair value through profit or loss are reported in interest income.
Available-for-sale
Available-for-sale investments are securities intended to be held for an indefinite period of time, but may be sold in response
to needs for liquidity or changes in interest rates, exchange rates or equity prices. Securities held as available-for-sale are
initially recognised at fair value plus transaction costs and are continuously remeasured at fair value based on quoted
market prices where available or discounted cash flow models. Unquoted equity instruments are recognised at cost, being
the fair value of the consideration paid for the acquisition of the investment.
Unrealised gains and losses arising from changes in the fair value of securities classified as available-for-sale are recognised
in other comprehensive income net of applicable deferred tax. When the securities are disposed of, the related accumulated
fair value adjustments are included in other income. When securities become impaired, the related accumulated fair value
adjustments previously recognised in equity are included in the consolidated statement of income as an impairment
expense on investment securities.
iii) Debt securities and other fund raising instruments
Debt securities and other fund raising instruments are recognised initially at fair value net of transaction costs, and
subsequently measured at amortised cost using the effective interest rate method.
d) Impairment of financial assets
The Group assesses, at each consolidated statement of financial position date, whether there is any objective evidence that a
financial asset or group of financial assets is impaired. A financial asset or group of financial assets is impaired when the carrying
value is greater than the recoverable amount and there is objective evidence of impairment. The recoverable amount is the
present value of the future cash flows.
i) Advances
All non-performing and individually significant advances are individually reviewed and specific provisions made for the
impaired portion based on the present value of estimated future cash flows and discounted by the original effective interest
rate of the loan. The provision made is the difference between the loan balance and the discounted value of the collateral.
Individually insignificant loans with similar characteristics are assessed for impairment on a group basis.
Regulatory and other loan loss requirements that exceed these amounts are dealt with in the general contingency reserve
as an appropriation of retained earnings.
When all efforts have been exhausted to recover a non-performing loan, that loan is deemed uncollectible and written off
against the related provision for loan losses.
NOTES TO THE CONSOLIDATED FINANCIAL STATEMENTSFor the year ended September 30, 2016. Expressed in thousands of Trinidad and Tobago dollars ($’000) except where otherwise stated

94 95
2 SIGNIFICANT ACCOUNTING POLICIES (continued)
2.6 Summary of significant accounting policies (continued)
d) Impairment of financial assets (continued)
ii) Investment securities
The Group individually assesses each investment security for objective evidence of impairment. If an impaired debt
instrument has been renegotiated, interest continues to be accrued on the reduced carrying amount of the asset and is
recorded as part of ‘interest income’. If the fair value of the instrument increases in a subsequent year, the impairment loss is
reversed through the consolidated statement of income.
If there is objective evidence that the cost of an available-for-sale equity security may not be recovered, the security is
considered to be impaired. Objective evidence that the cost may not be recovered includes qualitative impairment criteria
as well as a significant or prolonged decline in the fair value below cost. The Group’s policy considers a significant decline
to be one in which the fair value is below the weighted-average cost by more than 30%, or a prolonged decline to be one in
which fair value is below the weighted-average cost for greater than one year. This policy is applied by all subsidiaries at the
individual security level.
If an available-for-sale equity security is impaired based upon the Group’s qualitative or quantitative impairment criteria,
any further declines in the fair value at subsequent reporting dates are recognised as impairments. Therefore, at each
reporting period, for an equity security that is determined to be impaired based upon the Group’s impairment criteria, an
impairment is recognised for the difference between the fair value and the original cost basis, less any previously recognised
impairments.
Any subsequent increases in value of previously impaired securities are taken to OCI.
e) Investment in Associates
Associates are all entities over which the Group has significant influence but not control, generally accompanying a shareholding
of between 20% and 50% of the voting rights. Significant influence is the power to participate in the financial and operating
policy decisions of the investee, but is not control or joint control over those policies.
The Group’s investments in associates are accounted for under the equity method of accounting.
The investments in associates are initially recognised at cost and adjusted to recognise changes in the Group’s share of net
assets of the associate, less any impairment in value. Goodwill relating to the associate, is included in the carrying amount of the
investment and is not tested for impairment individually.
The consolidated statement of income reflects the Group’s net share of the results of operations of the associates. Any change in
other comprehensive income (OCI) of those investees is presented as part of the Group’s OCI. In addition, when there has been a
change recognised directly in the equity of the associate the Group recognises its share of any changes, when applicable, in the
statement of changes in equity.
The Group determines whether it is necessary to recognise an impairment loss on its investment in its associates. At each
reporting date, the Group determines whether there is objective evidence that the investment in the associate is impaired. If
there is such evidence, the Group calculates the amount of impairment as the difference between the recoverable amount of the
associate and its carrying value, and then recognises the loss in the consolidated statement of income.
2 SIGNIFICANT ACCOUNTING POLICIES (continued)
2.6 Summary of significant accounting policies (continued)
f) Leases
Finance Leases
Finance charges on leased assets are taken into income using the amortisation method. This basis reflects a constant periodic
rate of return on the lessor’s net investment in the finance lease. Finance leases net of unearned finance income are included in
the consolidated statement of financial position under advances.
Operating Leases
Leases in which a significant portion of the risks and rewards of ownership are retained by the lessor are classified as operating
leases. Payments made under operating leases are charged to the consolidated statement of income on a straight-line basis
over the period of the lease. Renewal of operating leases is based on mutual agreement between parties prior to the expiration
date.
g) Premises and equipment
Premises and equipment are stated at cost less accumulated depreciation.
Subsequent costs are included in the asset’s carrying amount or are recognised as a separate asset, as appropriate, only when it is
probable that future economic benefits associated with the item will flow to the Group and the cost of the item can be measured
reliably. All other repairs and maintenance are charged to the consolidated statement of income during the financial period in
which they are incurred.
The assets’ residual values and useful lives are reviewed, and adjusted if appropriate, at each statement of financial position
date. Gains and losses on disposals are determined by comparing proceeds with the carrying amount. These are included in the
consolidated statement of income.
Leasehold improvements and leased equipment are depreciated on a straight-line basis over the period of the lease. Depreciation,
other than on leasehold improvements and leased equipment, is computed on the declining balance method at rates expected
to apportion the cost of the assets over their estimated useful lives.
The depreciation rates used are as follows:
Freehold and leasehold premises 2%
Equipment, furniture and fittings 15% - 33.33%
h) Impairment of non-financial assets
Further disclosures relating to impairment of non-financial assets are also provided in the following notes:
• Disclosures for significant assumptions (Note 3)
• Premises and equipment (Note 7)
• Intangible assets (Note 8)
NOTES TO THE CONSOLIDATED FINANCIAL STATEMENTSFor the year ended September 30, 2016. Expressed in thousands of Trinidad and Tobago dollars ($’000) except where otherwise stated

96 97
2 SIGNIFICANT ACCOUNTING POLICIES (continued)
2.6 Summary of significant accounting policies (continued)
h) Impairment of non-financial assets (continued)
The Group assesses, at each reporting date, whether there is an indication that an asset may be impaired. If any indication exists,
or when annual impairment testing for an asset is required, the Group estimates the asset’s recoverable amount. An asset’s
recoverable amount is the higher of an asset’s or cash-generating unit’s (CGU) fair value less costs of disposal and its value in
use. The recoverable amount is determined for an individual asset, unless the asset does not generate cash inflows that are
largely independent of those from other assets or groups of assets. When the carrying amount of an asset or CGU exceeds its
recoverable amount, the asset is considered impaired and is written down to its recoverable amount.
In assessing value in use, the estimated future cash flows available to shareholders are discounted to their present value using
a pre-tax discount rate that reflects current market assessments of the time value of money and the risks specific to the asset.
In determining fair value less costs of disposal, recent market transactions are taken into account. If no such transactions can
be identified, an appropriate valuation model is used. These calculations are corroborated by valuation multiples, quoted share
prices for publicly traded companies, or other available fair value indicators.
For assets excluding goodwill, an assessment is made at each reporting date to determine whether there is an indication that
previously recognised impairment losses no longer exist or have decreased. If such indication exists, the Group estimates the
asset’s or CGU’s recoverable amount.
i) Business combinations and goodwill
The Group uses the purchase method of accounting to account for the acquisition of subsidiaries. The cost of an acquisition is
measured as the aggregate of the consideration transferred, measured at acquisition date fair value and the amount of any non-
controlling interests in the acquiree. For each business combination, the Group elects to measure the non-controlling interests
in the acquiree at the proportionate share of the acquiree’s identifiable net assets. Acquisition-related costs are expensed as
incurred.
If the business combination is achieved in stages, any previously held equity interest is remeasured at its acquisition date fair
value and any resulting gain or loss is recognised in the statement of income.
Goodwill is initially measured at cost, being the excess of the aggregate of the consideration transferred and the amount
recognised for non-controlling interests, and any previous interest held, over the net identifiable assets acquired and liabilities
assumed. If the fair value of the net assets acquired is in excess of the aggregate consideration transferred, the Group reassesses
whether it has correctly identified all of the assets acquired and all of the liabilities assumed and reviews the procedures used to
measure the amounts to be recognised at the acquisition date. If the reassessment still results in an excess of the fair value of net
assets acquired over the aggregate consideration transferred, then the gain is recognised in statement of income.
As at acquisition date, any goodwill acquired is allocated to each of the cash-generating units expected to benefit from the
combination’s synergies. After initial recognition, goodwill is measured at cost less any accumulated impairment losses.
Goodwill is reviewed for impairment, annually or more frequently, if events or changes in circumstances indicate that the carrying
value may be impaired.
2 SIGNIFICANT ACCOUNTING POLICIES (continued)
2.6 Summary of significant accounting policies (continued)
i) Business combinations and goodwill (continued)
Impairment is determined by assessing the recoverable amount of the cash-generating unit to which goodwill relates. Where the
recoverable amount of the cash-generating unit is less than the carrying amount, an impairment loss is recognised. Impairment
losses relating to goodwill cannot be reversed in future periods.
j) Employee benefits
i) Pension obligations
The Group operates a number of defined benefit plans; the assets of which are held in separate trustee-administered funds.
The pension plans are funded by payments from the relevant Group companies, taking account of the recommendations of
independent qualified actuaries who carry out the full valuation of the Plans every three years. In Trinidad, Republic Bank
Limited took the actuary’s advice regarding a pension holiday, effective January 1999.
Annually, the Group’s independent actuaries conduct a valuation exercise to measure the effect of all employee benefit
plans.
Remeasurements, comprising of actuarial gains and losses, the effect of the asset ceiling, excluding amounts included in net
interest on the net defined benefit liability and the return on plan assets (excluding amounts included in net interest on the
net defined benefit liability) are recognised immediately in the statement of financial position with a corresponding debit
or credit to retained earnings through OCI in the period in which they occur. Remeasurements are not reclassified to the
statement of income in subsequent periods.
Past service costs are recognised in the statement of income on the earlier of:
a) The date of the plan amendment or curtailment, and
b) The date that the Group recognises related restructuring costs
Net interest is calculated by applying the discount rate to the net defined benefit liability or asset. The Group recognises
the following changes in the net defined benefit obligation under ‘operating expenses’ in the consolidated statement of
income:
a) Service costs comprising current service costs, past-service costs, gains and losses on curtailments and non-routine
settlements
b) Net interest expense or income
The defined benefit plans mainly expose the Group to risks such as investment risk, interest rate risk and longevity risk.
The above accounting requirement in no way affects the pension plans which continue to be governed by the approved
Trust Deed and Rules and remain under the full control of the appointed Trustees.
The full results of the valuation exercise are disclosed in Note 9 to these consolidated financial statements.
NOTES TO THE CONSOLIDATED FINANCIAL STATEMENTSFor the year ended September 30, 2016. Expressed in thousands of Trinidad and Tobago dollars ($’000) except where otherwise stated
98 99
2 SIGNIFICANT ACCOUNTING POLICIES (continued)
2.6 Summary of significant accounting policies (continued)
j) Employee benefits (continued)
ii) Other post-retirement obligations
The Group provides post-retirement medical benefits to its retirees. The entitlement to these benefits is usually based on
the employee remaining in service up to retirement age and the completion of a minimum service period. The expected
costs of these benefits are accrued over the period of employment, using a methodology similar to that for defined benefit
pension plans. Independent qualified actuaries carry out a valuation of these obligations.
iii) Profit sharing scheme
The Group operates various employee profit sharing schemes at the subsidiary level, which are administered by Trustees in
accordance with terms outlined in the Profit Sharing Scheme Rules. The profit share to be distributed to employees each
year is based on a specific formula outlined in these Profit Sharing Scheme Rules. Employees of RBL have the option to
receive their profit share allocation in cash (up to a maximum of 75% of the total entitlement) and receive the balance in
ordinary shares of RFHL. The number of shares to be allocated is based on the employees’ total entitlement less the cash
element, divided by the average price of the unallocated shares purchased by the Trustees. The Group accounts for the
profit share, as an expense, through the consolidated statement of income.
iv) Share-based payments
Employees of the Group receive remuneration in the form of share-based payments, whereby employees render services as
consideration for equity instruments (equity-settled transactions).
k) Taxation
Deferred income tax is provided in full, using the liability method, on temporary differences arising between the tax bases of
assets and liabilities and their carrying amounts in the consolidated financial statements. Deferred income tax is determined
using tax rates (and laws) that have been enacted or substantially enacted by the statement of financial position date and are
expected to apply when the related deferred income tax asset is realised or the deferred income tax liability is settled.
Deferred tax assets are recognised where it is probable that future taxable profit will be available against which the temporary
differences can be utilised.
Income tax payable on profits, based on the applicable tax law in each jurisdiction, is recognised as an expense in the period in
which profits arise. The tax effects of income tax losses available for carry forward are recognised as an asset when it is probable
that future taxable profits will be available against which these losses can be utilised.
l) Statutory reserves
The Trinidad and Tobago Financial Institutions Act 2008 requires that a minimum of 10% of the net profit after deduction of taxes
in each year be transferred to a statutory reserve account until the balance on this reserve is not less than the paid-up capital. This
requirement was met as at June 2012. For RBL in accordance with the Trinidad and Tobago Financial Institutions Act 2008, RBL is
also required to maintain statutory reserves of at least 20 times deposit liabilities.
The Banking Act of Grenada (No. 19 of 2005), requires that a minimum of 20% of the net profit after deduction of taxes in each
year be transferred to a statutory reserve fund until the balance on this reserve is equal to the paid-up capital. These reserves are
not available for distribution as dividends or for any other form of appropriation.
2 SIGNIFICANT ACCOUNTING POLICIES (continued)
2.6 Summary of significant accounting policies (continued)
l) Statutory reserves (continued)
The Guyana Financial Institutions Act 1995 requires that a minimum of 15% of the net profit after deduction of taxes in each year
be transferred to a statutory reserve fund until the balance on this reserve is equal to the paid-up or assigned capital.
The Offshore Banking Act of Barbados requires that a minimum of 25% of the net profits of each year before any dividend is paid,
be transferred to a statutory reserve account until the balance on this reserve is not less than the issued and paid-up capital.
The Barbados Financial Institutions Act requires that a minimum of 25% of the net income in each year be transferred to a
general reserve account until the balance on this reserve is not less than the paid-up capital.
The Banking Act, 2004 and Amendment Act, 2008 of Ghana require that proportions of 12.5% to 50% of net profit after tax be
transferred to a statutory reserve fund depending on the existing statutory reserve fund to paid-up capital.
m) Fiduciary assets
The Group provides custody, trustee and investment management services to third parties. All related assets are held in a
fiduciary capacity and are not included in these consolidated financial statements as they are not the assets of the Group. These
assets under administration, at September 30, 2016, totalled $32.0 billion (2015: $32.1 billion).
n) Earnings per share
Data on basic earnings per share has been computed by dividing the net profit attributable to equity holders of the parent, by
the weighted average number of ordinary shares in issue during the year.
For the diluted earnings per share, the weighted average number of ordinary shares in issue is adjusted to assume conversion of
all dilutive potential ordinary shares. The Group has one category of dilutive potential ordinary shares, which are share options
granted to Executive Management.
The difference between the weighted average number of shares used as the denominator in calculating basic earnings per share
and that used for calculating diluted earnings per share is due to share options granted during the year.
o) Foreign currency translation
The individual financial statements of each group entity is presented in the currency of the primary economic environment, in
which the entity operates (its functional currency). The consolidated financial statements are expressed in Trinidad and Tobago
dollars, which is the functional currency of the parent.
Monetary assets and liabilities of the parent, which are denominated in foreign currencies are expressed in Trinidad and Tobago
dollars at rates of exchange ruling on September 30. Non monetary assets and liabilities denominated in foreign currencies are
translated at historic rates. All revenue and expenditure transactions denominated in foreign currencies are translated at mid-
exchange rates and the resulting profits and losses on exchange from these trading activities are dealt with in the consolidated
statement of income.
The assets and liabilities of subsidiary companies are translated into Trinidad and Tobago dollars at the mid-rates of exchange
ruling at the statement of financial position date and all resulting exchange differences are recognised in other comprehensive
income. All revenue and expenditure transactions are translated at an average rate.
NOTES TO THE CONSOLIDATED FINANCIAL STATEMENTSFor the year ended September 30, 2016. Expressed in thousands of Trinidad and Tobago dollars ($’000) except where otherwise stated
100 101
2 SIGNIFICANT ACCOUNTING POLICIES (continued)
2.6 Summary of significant accounting policies (continued)
p) Intangible assets
The cost of intangible assets acquired in a business combination is their fair value at the date of acquisition. Following initial
recognition, intangible assets are carried at cost less any accumulated amortisation and accumulated impairment losses.
The useful lives of intangible assets are assessed as finite and are amortised over the useful economic life and assessed for
impairment whenever there is an indication that the intangible asset may be impaired. The amortisation period and the
amortisation method for an intangible asset with a finite useful life are reviewed at least at the end of each reporting period.
Changes in the expected useful life or the expected pattern of consumption of future economic benefits embodied in the asset
are considered to modify the amortisation period or method, as appropriate, and are treated as changes in accounting estimates.
The amortisation expense on intangible assets with finite lives is recognised in the statement of income in the expense category
that is consistent with the function of the intangible assets.
Gains or losses arising from derecognition of an intangible asset are measured as the difference between the net disposal
proceeds and the carrying amount of the asset and are recognised in the consolidated statement of income when the asset is
derecognised.
q) Revenue recognition
Revenue is recognised to the extent that it is probable that the economic benefits will flow to the Group and the revenue can be
reliably measured, regardless of when the payment is being made. Revenue is measured at the fair value of the consideration
received or receivable, taking into account contractually defined terms of payment and excluding taxes or duty. The Group has
concluded that it is the principal in all of its revenue arrangements since it is the primary obligor in all the revenue arrangements,
has pricing latitude and is also exposed to credit risks.
The specific recognition criteria described below must also be met before revenue is recognised.
Interest income and expense
Interest income and expense are recognised in the consolidated statement of income for all interest-bearing instruments on an
accrual basis using the effective interest yield method. Interest income includes coupons earned on fixed income investment
and trading securities and accrued discount and premium on Treasury Bills and other discounted instruments.
Fee and commission income
Unless included in the effective interest calculation, fees and commissions are recognised on an accruals basis as the service is
provided. Fees and commissions not integral to effective interest arising from negotiating, or participating in the negotiation of
a transaction from a third party are recognised on completion of the underlying transaction. Portfolio and other management
advisory and service fees are recognised based on the applicable service contracts. Asset management fees related to investment
funds are recognised over the period the service is provided.
Dividends
Dividend income is recognised when the right to receive the payment is established.
2 SIGNIFICANT ACCOUNTING POLICIES (continued)
2.6 Summary of significant accounting policies (continued)
r) Fair Value
The Group measures financial instruments at fair value at each statement of financial position date. Fair value related disclosures
for financial instruments and non-financial assets that are measured at fair value, where fair values are disclosed, are shown in
Note 23 to the financial statements.
Fair value is the price that would be received to sell an asset or paid to transfer a liability in an orderly transaction between market
participants at the measurement date. The fair value measurement is based on the presumption that the transaction to sell the
asset or transfer the liability takes place either:
i) In the principal market for the asset or liability, or
ii) In the absence of a principal market, in the most advantageous market for the asset or liability.
The fair value of an asset or a liability is measured using the assumptions that market participants would use when pricing the
asset or liability, assuming that market participants act in their economic best interest.
A fair value measurement of a non-financial asset takes into account a market participant’s ability to generate economic benefits
by using the asset in its highest and best use or by selling it to another market participant that would use the asset in its highest
and best use.
All assets and liabilities for which fair value is measured or disclosed in the financial statements are categorised within the fair
value hierarchy, described as follows, based on the lowest level input that is significant to the fair value measurement as a
whole:
Level 1
Included in the Level 1 category are financial assets and liabilities that are measured in whole or in part by reference to published
quotes in an active market. A financial instrument is regarded as quoted in an active market if quoted prices are readily and
regularly available from an exchange, dealer, broker, industry group, pricing service or regulatory agency and those prices
represent actual and regularly occurring market transactions on an arm’s length basis.
Level 2
Included in the Level 2 category are financial assets and liabilities that are measured using a valuation technique based on
assumptions that are supported by prices from observable current market transactions and for which pricing is obtained via
pricing services, but where prices have not been determined in an active market. This includes financial assets with fair values
based on broker quotes, investments in private equity funds with fair values obtained via fund managers and assets that are
valued using the Group’s own models whereby the majority of assumptions are market observable.
Level 3
Included in the Level 3 category are financial assets and liabilities that are not quoted as there are no active markets to determine
a price. These financial instruments are held at cost, being the fair value of the consideration paid for the acquisition of the
investment, and are regularly assessed for impairment.
NOTES TO THE CONSOLIDATED FINANCIAL STATEMENTSFor the year ended September 30, 2016. Expressed in thousands of Trinidad and Tobago dollars ($’000) except where otherwise stated

102 103
2 SIGNIFICANT ACCOUNTING POLICIES (continued)
2.6 Summary of significant accounting policies (continued)
r) Fair Value (continued)
Level 3 (continued)
For assets and liabilities that are recognised in the financial statements on a recurring basis, the Group determines whether
transfers have occurred between levels in the hierarchy by re-assessing categorisation (based on the lowest level input that is
significant to the fair value measurement as a whole) at the end of each reporting period.
Where the Group’s available-for-sale investments are not actively traded in organised financial markets, the fair value is
determined using discounted cash flow analysis, which requires considerable judgement in interpreting market data and
developing estimates. Accordingly, estimates contained herein are not necessarily indicative of the amounts that the Group
could realise in a current market exchange. The use of different assumptions and/or estimation methodologies may have a
material effect on the estimated fair values. The fair value information for available-for-sale investments is based on information
available to management as at the dates presented. Management is not aware of any factors that would significantly affect the
estimated fair value amounts.
Investments classified as ‘at fair value through profit or loss’ are actively traded in organised markets and fair value is determined
by reference to the market price at year end or on the last trade date prior to year end.
Financial instruments where carrying value is equal to fair value:- Due to their short-term maturity, the carrying value of certain
financial instruments is assumed to approximate their fair values. These include cash and cash equivalents, investment interest
receivable, customers’ deposit accounts, other fund raising instruments, other assets and other liabilities.
Advances are net of specific and other provisions for impairment. The fair values of advances are based on a current yield curve
appropriate for the remaining term to maturity.
The fair values of the floating rate debt securities in issue are based on quoted market prices where available and where not
available is based on a current yield curve appropriate for the remaining term to maturity. For balances due to banks, where
the maturity period is less than one year, the fair value is assumed to equal carrying value. Where the maturity period is in
excess of one year, these are primarily floating rate instruments, the interest rates of which reset with market rates, therefore the
carrying values are assumed to equal fair values. The fair value of fixed rate debt securities carried at amortised cost is estimated
by comparing market interest rates when they were first recognised with current market rates offered for similar financial
instruments. The estimated fair value of fixed interest-bearing deposits is based on discounted cash flows using prevailing money
market interest rates for facilities with similar credit risk and maturity.
s) Segment reporting
A geographical segment is engaged in providing products, or services within a particular economic environment that are subject
to risks and returns that are different from those of segments operating in other economic environments.
A business segment is a group of assets and operations engaged in providing similar products and services that are subject to
risks and returns that are different from those of other business segments.
The Group analyses its operations by both geographic and business segments. The primary format is geographic; reflecting
its management structure. Its secondary format is that of business segments; reflecting retail and commercial banking and
merchant banking.
2 SIGNIFICANT ACCOUNTING POLICIES (continued)
2.6 Summary of significant accounting policies (continued)
t) Customers’ liabilities under acceptances, guarantees, indemnities and letters of credit
These represent the Group’s potential liability, for which there are equal and offsetting claims against its customers in the event
of a call on these commitments. These amounts are not recorded on the Group’s consolidated statement of financial position, but
are detailed in Note 29(b) of these consolidated financial statements.
3 SIGNIFICANT ACCOUNTING JUDGEMENTS, ESTIMATES AND ASSUMPTIONS
The preparation of the Group’s consolidated financial statements requires management to make judgements, estimates and assumptions
that affect the reported amounts of revenues, expenses, assets and liabilities, and the accompanying disclosures and the disclosure of
contingent liabilities. Uncertainty about these assumptions and estimates could result in outcomes that require a material adjustment to
the carrying amount of assets or liabilities affected in future periods.
Other disclosures relating to the Group’s exposure to risks and uncertainties include:
a) Risk management (Note 21)
b) Capital management (Note 22)
Estimates and assumptions
The key assumptions concerning the future and other key sources of estimation uncertainty at the reporting date that have a significant
risk of causing a material adjustment to the carrying amounts of assets and liabilities within the next financial year are described below. The
Group based its assumptions and estimates on parameters available when the consolidated financial statements were prepared. Existing
circumstances and assumptions about future developments, however, may change due to market changes or circumstances arising that are
beyond the control of the Group. Such changes are reflected in the assumptions when they occur.
Impairment of financial assets
Management makes judgements at each statement of financial position date to determine whether financial assets are impaired. Financial
assets are impaired when the carrying value is greater than the recoverable amount and there is objective evidence of impairment. The
recoverable amount is the present value of the future cash flows.
Inherent provisions on advances (Note 4b)
Inherent provisions on advances are calculated on an estimate of impairment incurred but not reported, existing in assets as at the
consolidated statement of financial position date. Estimated impairment incurred is determined by applying against performing loan
balances, the average loan default rates and adjusting this balance for current economic factors that affect loan performance. An anticipated
recovery rate (determined from historical average) is then applied to determine the value that is recoverable. This calculation is computed
by product type.
Valuation of investments (Note 5)
The Group has applied IAS 39 in its classification of investment securities, which requires measurement of securities at fair value. For unlisted
securities, fair values are estimated using price/earnings or price/cash flow ratios which have been refined to accommodate the specific
circumstances of the issuer.
NOTES TO THE CONSOLIDATED FINANCIAL STATEMENTSFor the year ended September 30, 2016. Expressed in thousands of Trinidad and Tobago dollars ($’000) except where otherwise stated

104 105
3 SIGNIFICANT ACCOUNTING JUDGEMENTS, ESTIMATES AND ASSUMPTIONS (continued)
Estimates and assumptions (continued)
Net pension asset/liability (Note 9)
In conducting valuation exercises to measure the effect of all employee benefit plans throughout the Group, the Banks’ independent
actuaries use judgement and assumptions in determining discount rates, salary increases, NIS ceiling increases, pension increases and the
rate of return on the assets of the Plans.
Goodwill (Note 8a)
The Group financial statements include goodwill arising from acquisitions. In accordance with IFRS 3, goodwill was reviewed for impairment,
as at September 30, 2016, using the ‘value in use’ method. This requires the use of estimates for determination of future cash flows expected
to arise from each cash-generating unit and an appropriate perpetuity discount rate to calculate present value.
Deferred taxes (Note 10)
In calculating the provision for deferred taxation, management uses judgement to determine the probability that future taxable profits will
be available to facilitate utilisation of temporary tax differences which may arise.
Judgements
In the process of applying the Group’s accounting policies, management has made the following judgements which have the most
significant effect on the amounts recognised in the consolidated financial statements:
Premises and Equipment (Note 7)
Management exercises judgement in determining whether costs incurred can accrue sufficient future economic benefits to the Group to
enable the value to be treated as a capital expense. Further judgement is used upon annual review of the residual values and useful lives of
all capital items to determine any necessary adjustments to carrying value.
Assessment of control
Management uses judgement in performing a control assessment review on all mutual funds and retirement plans sponsored by the Group
and its subsidiaries. This assessment revealed that the Group is unable to exercise power over the activities of the funds and is therefore not
deemed to be in control of any of the mutual funds and retirement plans.
4 ADVANCES
a) Advances
2016
Commercial Retail and Corporate
Lending Lending Mortgages Total
Performing advances 6,064,381 15,002,423 12,302,217 33,369,021
Non-performing advances 166,155 1,107,463 516,231 1,789,849
6,230,536 16,109,886 12,818,448 35,158,870
Unearned interest/finance charge (51,310) (50,883) – (102,193)
Accrued interest 7,569 80,436 28,327 116,332
6,186,795 16,139,439 12,846,775 35,173,009
Allowance for impairment losses
- Note 4 (b) (128,738) (600,417) (151,161) (880,316)
Net advances 6,058,057 15,539,022 12,695,614 34,292,693
2015 Commercial Retail and Corporate
Lending Lending Mortgages Total
Performing advances 5,881,567 14,753,757 11,730,937 32,366,261
Non-performing advances 186,424 649,077 414,226 1,249,727
6,067,991 15,402,834 12,145,163 33,615,988
Unearned interest/finance charge (43,807) (64,467) – (108,274)
Accrued interest 10,100 81,259 20,412 111,771
6,034,284 15,419,626 12,165,575 33,619,485
Allowance for impairment losses (116,142) (360,283) (135,062) (611,487)
Net advances 5,918,142 15,059,343 12,030,513 33,007,998
NOTES TO THE CONSOLIDATED FINANCIAL STATEMENTSFor the year ended September 30, 2016. Expressed in thousands of Trinidad and Tobago dollars ($’000) except where otherwise stated
106 107
4 ADVANCES (continued)
b) Allowance for impairment losses
i) Impairment assessment
The main considerations for the loan impairment assessment include whether any payments of principal or interest are
overdue by more than 90 days, or there are any known difficulties in the cash flows of counterparties, credit rating downgrades,
or infringement of the original terms of the contract. The Group addresses impairment assessment in two areas: individually
assessed allowances and collectively assessed allowances.
Individually assessed allowances
The Group determines the allowances appropriate for each individually significant loan on an individual basis. Items considered
when determining allowance amounts include the sustainability of the counterparty’s business plan, its ability to improve
performance once a financial difficulty has arisen, projected receipts and the expected dividend payout should bankruptcy
ensue, the availability of other financial support and the realisable value of collateral and the timing of the expected cash flows.
The impairment losses are evaluated at each reporting date, unless unforeseen circumstances require more immediate attention.
Collectively assessed allowances
Allowances are assessed collectively for losses on loans and advances that are not individually significant (including credit cards,
residential mortgages and unsecured consumer lending) and for individually significant loans and advances where there is not
yet objective evidence of individual impairment.
Allowances are evaluated on each reporting date with each portfolio receiving a separate review. The collective assessment
takes account of impairment that is likely to be present in the portfolio even though there is not yet objective evidence of the
impairment in an individual assessment. Impairment losses are estimated by taking into consideration the following information:
historical losses on the portfolio, current economic conditions, the approximate delay between the time a loss is likely to have
been incurred and the time it will be identified as requiring an individually assessed impairment allowance and expected receipts
and recoveries once impaired.
ii) Reconciliation of the allowance for impairment losses for loans and advances by class
2016 Commercial Retail and Corporate
Lending Lending Mortgages Total
Balance brought forward 116,142 360,283 135,062 611,487
Translation adjustment 1,510 (6,104) (2,554) (7,148)
Charge-offs and write-offs (65,596) (68,205) (2,844) (136,645)
Loan impairment expense 100,602 391,690 40,975 533,267
Loan impairment recoveries (23,918) (77,248) (19,479) (120,645)
Balance carried forward 128,740 600,416 151,160 880,316
4 ADVANCES (continued)
b) Allowance for impairment losses (continued)
ii) Reconciliation of the allowance for impairment losses for loans and advances by class (continued)
2016 Commercial Retail and Corporate
Lending Lending Mortgages Total
Individual impairment 102,981 520,954 121,820 745,755
Collective impairment 25,757 79,463 29,341 134,561
128,738 600,417 151,161 880,316
Gross amount of loans individually determined to be
impaired, before deducting any allowance 166,155 1,107,463 516,231 1,789,849
2015 Commercial Retail and Corporate
Lending Lending Mortgages Total
Balance brought forward 73,831 240,841 76,733 391,405
Acquisition of subsidiaries 11,106 80,529 27,125 118,760
Translation adjustment 136 963 208 1,307
Charge-offs and write-offs (31,537) (31,475) (2,237) (65,249)
Loan impairment expense 113,180 223,265 61,740 398,185
Loan impairment recoveries (50,574) (153,840) (28,507) (232,921)
Balance carried forward 116,142 360,283 135,062 611,487
Individual impairment 92,960 305,372 108,292 506,624
Collective impairment 23,182 54,911 26,770 104,863
116,142 360,283 135,062 611,487
Gross amount of loans individually determined to be
impaired, before deducting any allowance 186,424 649,077 414,226 1,249,727
NOTES TO THE CONSOLIDATED FINANCIAL STATEMENTSFor the year ended September 30, 2016. Expressed in thousands of Trinidad and Tobago dollars ($’000) except where otherwise stated

108 109
4 ADVANCES (continued)
c) Net investment in leased assets included in net advances
2016 2015
Gross investment 242,768 266,822
Unearned finance charge (38,259) (50,514)
Net investment in leased assets 204,509 216,308
d) Net investment in leased assets has the following maturity profile
Within one year 3,150 1,387
One to five years 39,449 37,383
Over five years 161,910 177,538
204,509 216,308
5 INVESTMENT SECURITIES
2016 2015
a) Available-for-sale
Government securities 4,658,321 3,099,999
State owned company securities 1,242,790 990,330
Corporate bonds/debentures 3,435,703 3,321,438
Bankers’ acceptances 469,696 469,382
Equities and mutual funds 34,060 43,415
9,840,570 7,924,564
b) Held to Maturity
Government securities 366,668 120,251
Corporate bonds/debentures 9,142 2,240
Equities and mutual funds 21,769 25,109
397,579 147,600
c) Designated at fair value through profit or loss
Held for trading
Quoted securities 26,898 22,228
Total investment securities 10,265,047 8,094,392
6 INVESTMENT IN ASSOCIATED COMPANIES
2016 2015
Balance at beginning of year 142,066 345,942
Acquisition of controlling interest in a subsidiary – (236,660)
Acquisition of associate – 927
Share of current year (loss)/profit (1,045) 39,276
Dividends received (1,705) (5,638)
Exchange adjustments (1,358) –
Share of revaluation reserves (626) (1,781)
Investment impairment (61,841) –
Balance at end of year 75,491 142,066
The Group’s interest in associated companies is as follows:
Country Reporting Proportion of year-end of of issued incorporation associate capital held
G4S Holdings (Trinidad) Limited Trinidad and Tobago December 24.50%
InfoLink Services Limited Trinidad and Tobago December 25.00%
East Caribbean Financial Holding Company Limited (ECFH) St. Lucia December 19.30%
Summarised financial information in respect of the Group’s associates is as follows:
Associate that is
material to Other Total Investment the Group associates in Associates ECFH
2016 2016 2016 2015
Total assets 9,360,142 186,262 9,546,404 9,464,782
Total liabilities 8,735,865 21,108 8,756,973 8,655,483
Net assets/equity 624,277 165,154 789,431 809,299
Group’s share of associates’ net assets * 33,622 41,869 75,491 142,066
(Loss)/profit for the period (21,142) 10,738 (10,404) 32,767
Group’s share of (loss)/profit of associated companies
after tax for the period (8,168) 7,123 (1,045) 39,276
Group’s share of revaluation reserves of associated companies (626) – (626) (1,781)
Dividends received during the year – 1,705 1,705 5,638
* The Group’s share of ECFH’s net assets attributable to the equity holders is $96.1 million. The balance of $33.6 million is net of an
impairment charge of $61.8 million.
NOTES TO THE CONSOLIDATED FINANCIAL STATEMENTSFor the year ended September 30, 2016. Expressed in thousands of Trinidad and Tobago dollars ($’000) except where otherwise stated

110 111
7 PREMISES AND EQUIPMENT
Capital Equipment, works in Freehold Leasehold furniture 2016 progress premises premises and fittings Total
Cost
At beginning of year 254,583 1,356,920 196,243 1,660,794 3,468,540
Exchange and other adjustments 1,738 735 1,493 (4,339) (373)
Additions at cost 332,420 18,872 1,813 85,651 438,756
Disposal of assets – – (12,950) (49,952) (62,902)
Transfer of assets (186,437) 118,291 8,007 60,139 –
402,304 1,494,818 194,606 1,752,293 3,844,021
Accumulated depreciation
At beginning of year – 181,145 101,126 1,268,399 1,550,670
Exchange and other adjustments – (4,952) 848 (5,471) (9,575)
Charge for the year – 19,659 7,531 138,437 165,627
Disposal of assets – – (6,928) (44,301) (51,229)
– 195,852 102,577 1,357,064 1,655,493
Net book value 402,304 1,298,966 92,029 395,229 2,188,528
7 PREMISES AND EQUIPMENT (continued)
Capital Equipment, works in Freehold Leasehold furniture 2015 progress premises premises and fittings Total
Cost
At beginning of year 172,708 1,153,255 126,114 1,483,731 2,935,808
Acquisition of subsidiaries 827 102,175 64,895 126,478 294,375
Exchange and other adjustments 133 294 223 2,369 3,019
Additions at cost 223,954 6,281 1,908 55,195 287,338
Disposal of assets – (431) (2,385) (49,184) (52,000)
Transfer of assets (143,039) 95,346 5,488 42,205 –
254,583 1,356,920 196,243 1,660,794 3,468,540
Accumulated depreciation
At beginning of year – 159,587 94,354 1,108,364 1,362,305
Acquisitions – 9,030 2,801 80,058 91,889
Exchange and other adjustments – (4,198) 105 1,658 (2,435)
Charge for the year – 16,739 6,251 122,169 145,159
Disposal of assets – (13) (2,385) (43,850) (46,248)
– 181,145 101,126 1,268,399 1,550,670
Net book value 254,583 1,175,775 95,117 392,395 1,917,870
Capital commitments
2016 2015
Contracts for outstanding capital expenditure not provided
for in the consolidated financial statements 520,904 378,100
Other capital expenditure authorised by the Directors but not yet contracted for 77,016 89,333
NOTES TO THE CONSOLIDATED FINANCIAL STATEMENTSFor the year ended September 30, 2016. Expressed in thousands of Trinidad and Tobago dollars ($’000) except where otherwise stated

112 113
8 INTANGIBLE ASSETS
2016 2015
a) Goodwill 393,009 499,582
b) Core Deposits 23,922 40,189
416,931 539,771
a) Goodwill
Note 2016 2015
Goodwill on acquisition brought forward 499,582 300,971
Translation adjustment – (153)
Goodwill arising on acquisition of subsidiaries (restated*) 32 – 230,274
Negative goodwill taken to income 736 –
Goodwill written off during the year (107,309) (31,510)
393,009 499,582
Goodwill arising from business combinations was primarily generated from the acquisitions of Republic Bank (Barbados) Limited and
HFC Bank (Ghana) Limited and acquisitions by Republic Bank (Cayman) Limited and Republic Bank (Guyana) Limited.
* The amount of goodwill is restated and does not correspond to the figures in 2015 financial statements since adjustments to the final
valuation of acquisitions were made as detailed in Note 32.
Impairment testing of goodwill
In accordance with IFRS 3, all assets that gave rise to goodwill were reviewed for impairment using the ‘value in use’ method. In
each case, the cash flow projections are based on financial budgets approved by senior management and the values assigned to key
assumptions reflect past performance.
The following table highlights the goodwill and key assumptions used in value in use calculations for each cash-generating unit:
Republic Republic Republic
HFC Bank Bank Bank Bank (Ghana) (Barbados) (Cayman) (Guyana) Limited Limited Limited Limited Total TT$ million TT$ million TT$ million TT$ million TT$ million
Carrying amount of goodwill 124 144 32 92 393
Basis for recoverable amount Value in use Value in use Value in use Value in use
Discount rate 18% 12% 9% 15%
Cash flow projection term 10 yrs 7 yrs 10 yrs 3 yrs
Terminal growth rate 3.5% 1.8% 3.0% 3.0%
8 INTANGIBLE ASSETS (continued)
a) Goodwill (continued)
Impairment testing of goodwill (continued)
Using these assumptions, the value in use of the cash-generating units exceeded the carrying values except for HFC Bank (Ghana)
Limited which was determined to be lower than the carrying value of the company. A goodwill impairment expense of $107 million
was recorded for the Group’s investment in HFC Bank (Ghana) Limited:
Carrying Value of HFC Bank (Ghana) Limited 394,732
Present value of future cash flows 287,424
Impairment 107,309
b) Core Deposits
Note 2016 2015
Cost
At beginning of year 40,189 –
Acquisition of a subsidiary 32(a) – 40,189
40,189 40,189
Accumulated amortisation
At beginning of year – –
Amortisation 16,267 –
16,267 –
Net book value 23,922 40,189
Core deposit intangibles acquired through business combinations in 2015 have been determined to have a life of 3.5 years from
acquisition date.
NOTES TO THE CONSOLIDATED FINANCIAL STATEMENTSFor the year ended September 30, 2016. Expressed in thousands of Trinidad and Tobago dollars ($’000) except where otherwise stated

114 115
9 EMPLOYEE BENEFITS
a) The amounts recognised in the consolidated statement of financial position are as follows:
Defined benefit pension plans Pension assets Pension liability 2016 2015 2016 2015
Present value of defined benefit obligation (2,790,586) (2,606,449) (359,827) (312,440)
Fair value of plan assets 3,811,946 3,840,920 292,467 259,845
Surplus/(deficit) 1,021,360 1,234,471 (67,360) (52,595)
Effect of asset ceiling (10,509) (11,324) – –
Net asset/(liability) recognised in the consolidated
statement of financial position 1,010,851 1,223,147 (67,360) (52,595)
Post-retirement medical benefits 2016 2015
Present value of defined benefit obligation (430,929) (406,171)
Fair value of plan assets – –
Net liability recognised in the consolidated statement of financial position (430,929) (406,171)
9 EMPLOYEE BENEFITS (continued)
b) Changes in the present value of the defined benefit obligation are as follows:
Defined benefit Post-retirement pension plans medical benefits 2016 2015 2016 2015
Opening defined benefit obligation 2,918,889 3,008,883 406,171 423,502
Acquisition of a subsidiary – – – 22,375
Exchange adjustments 19,707 1,783 1,444 (279)
Current service cost 114,328 114,659 18,056 19,953
Interest cost 166,674 156,820 21,799 21,332
Members’ contributions 1,221 1,107 – –
Past service cost 13,229 – 11,419 –
Re-measurements:
- Experience adjustments 18,735 (51,076) (23,513) (34,388)
- Actuarial gains/(losses) from change in
demographic assumptions 14,050 (4,471) 1,259 (6)
- Actuarial losses from change in financial assumptions – (214,058) – (43,432)
Benefits paid (116,420) (94,758) (284) 126
Premiums paid by the Group – – (5,422) (3,012)
Closing defined benefit obligation 3,150,413 2,918,889 430,929 406,171
c) Reconciliation of opening and closing consolidated statement of financial position entries:
Defined benefit Post-retirement pension plans medical benefits 2016 2015 2016 2015
Defined benefit obligation at prior year end 1,170,552 1,242,450 406,171 423,502
Acquisition of a subsidiary – – – 22,375
Exchange adjustments (2,399) (190) 1,443 51
Opening defined benefit obligation 1,168,153 1,242,260 407,614 445,928
Net pension cost (67,166) (55,720) 51,274 41,282
Re-measurements recognised in other
comprehensive income (190,813) (36,512) (22,253) (77,814)
Premiums paid by the Group 33,317 20,524 (5,706) (3,225)
Closing net pension asset 943,491 1,170,552 430,929 406,171
NOTES TO THE CONSOLIDATED FINANCIAL STATEMENTSFor the year ended September 30, 2016. Expressed in thousands of Trinidad and Tobago dollars ($’000) except where otherwise stated

116 117
9 EMPLOYEE BENEFITS (continued)
d) Liability profile
The defined benefit obligation is allocated amongst the Plan’s members as follows:
Defined benefit pension plans Post-retirement medical benefits
- Active members 61% to 83% 70% to 84%
- Deferred members 4% to 6% N/A
- Pensioners 13% to 33% 16% to 30%
The weighted duration of the defined benefit obligation ranged from 11.9 to 19.8 years.
28% to 46% of the defined benefit obligation for active members was conditional on future salary increases.
19% to 99% of the benefits for active members were vested.
e) Changes in the fair value of plan assets are as follows:
Defined benefit pension plans 2016 2015
Opening fair value of plan assets 4,100,765 4,265,504
Exchange adjustments 17,308 1,593
Interest income 212,203 202,220
Return on plan assets, excluding interest income (142,130) (293,752)
Contributions by employer 33,317 20,524
Members’ contributions 1,221 1,107
Benefits paid (116,420) (94,758)
Expense allowance (1,851) (1,673)
Closing fair value of plan assets 4,104,413 4,100,765
Actual return on plan assets 64,029 205,347
f) Plan asset allocation as at September 30
Defined benefit pension plans Fair value % Allocation 2016 2015 2016 2015
Equity securities 1,904,453 1,870,082 46.40% 45.60%
Debt securities 1,950,027 1,829,269 47.51% 44.62%
Property 13,323 25,117 0.32% 0.61%
Mortgages 6,939 5,818 0.17% 0.14%
Money market instruments/cash 229,671 370,479 5.60% 9.03%
Total fair value of plan assets 4,104,413 4,100,765 100.0% 100.0%
9 EMPLOYEE BENEFITS (continued)
g) The amounts recognised in the consolidated statement of income are as follows:
Defined benefit Post-retirement pension plans medical benefits 2016 2015 2016 2015
Current service cost 114,328 114,659 18,056 19,953
Interest on defined benefit obligation (62,242) (61,293) 21,799 21,329
Past service cost 13,229 – 11,419 –
Administration expenses 1,851 2,354 – –
Total included in staff costs 67,166 55,720 51,274 41,282
h) Re-measurements recognised in other comprehensive income
Defined benefit Post-retirement pension plans medical benefits 2016 2015 2016 2015
Experience (losses)/gains (192,251) (40,068) 22,253 77,814
Effect of asset ceiling 1,438 3,556 – –
Total included in other comprehensive income (190,813) (36,512) 22,253 77,814
i) Summary of principal actuarial assumptions as at September 30
2016 2015 % %
Discount rate 4.00 - 7.75 5.00 - 7.75
Rate of salary increase 4.00 - 6.75 4.00 - 6.75
Pension increases 0.00 - 2.40 0.00 - 2.50
Medical cost trend rates 5.75 - 7.00 5.00 - 6.00
NIS ceiling rates 3.00 - 5.00 3.00 - 5.00
Assumptions regarding future mortality are based on published mortality rates. The life expentancies underlying the value of the
defined benefit obligation as at September 30, 2016 are as follows:
NOTES TO THE CONSOLIDATED FINANCIAL STATEMENTSFor the year ended September 30, 2016. Expressed in thousands of Trinidad and Tobago dollars ($’000) except where otherwise stated
118 119
9 EMPLOYEE BENEFITS (continued)
i) Summary of principal actuarial assumptions as at September 30 (continued)
Defined benefit pension plans 2016 2015
Life expectancy at age 60 - 65 for current pensioner in years:
- Male 14.6 to 24.5 14.6 to 21.0
- Female 18.4 to 26.8 18.4 to 25.1
Life expectancy at age 60 - 65 for current members age 40 in years:
- Male 14.6 to 26.2 14.6 to 21.4
- Female 18.4 to 27.6 18.4 to 25.4
j) Sensitivity analysis
The calculations of the defined benefit and medical obligations are sensitive to the assumptions used. The following table summarises
how these obligations, as at September 30, 2016, would have changed as a result of a change in the assumptions used:
Defined benefit Post-retirement
pension plans medical benefits 1% p.a. 1% p.a. 1% p.a. 1% p.a. increase decrease increase decrease
- Discount rate (391,061) 505,415 (74,715) 100,375
- Future salary increases 201,327 (171,480) 305 (261)
- Future pension cost increases 244,000 (244,000) – –
- Medical cost increases – – 98,668 (74,241)
An increase of 1 year in the assumed life expectancies shown above would increase the defined benefit obligation at September 30,
2016 by $54.51 million and the post-retirement medical benefit by $13.38 million.
These sensitivities were calculated by re-calculating the defined benefit obligations using the revised assumptions.
k) Funding
The Group meets the entire cost of funding the defined benefit pension plan. The funding requirements are based on regular actuarial
valuations of the Plan made every three years and the assumptions used to determine the funding required may differ from those set
out above. The Group expects to pay $9.3million to the pension plan in the 2017 financial year.
The Group operates the post-retirement medical benefit plan as a self-insured arrangement administered by insurance brokers. Retirees
contribute at a fixed rate depending on the level of cover selected. The Group pays ‘premiums’ of twice the retiree contributions but
will be required to meet the balance of cost of the benefits if these joint premiums prove inadequate. The Group expects to pay $13.3
million to the medical plan in the 2017 financial year.
10 DEFERRED TAX ASSETS AND LIABILITIES
Components of deferred tax assets and liabilities
a) Deferred tax assets
Credit/(charge)
Opening Exchange Consolidated Closing balance and other statement of balance 2015 adjustments income OCI 2016
Post-retirement medical benefits 110,053 830 20,923 7,808 139,614
Leased assets 14,779 – (3,621) – 11,158
Unrealised reserve 7,812 422 24 (3,293) 4,965
Unearned loan origination fees 31,379 179 7,581 – 39,139
Other 6,713 – 10,279 – 16,992
170,736 1,431 35,186 4,515 211,868
b) Deferred tax liabilities
(Credit)/charge Opening Consolidated Closing balance Exchange statement of balance 2015 adjustments income OCI 2016
Pension asset 307,847 189 13,802 (17,376) 304,462
Leased assets 27,869 – 1,673 – 29,542
Premises and equipment 72,546 (388) (33,694) – 38,464
Unrealised reserve 9,475 46 – 11,181 20,702
Other 2,274 (1,245) – (5) 1,024
420,011 (1,398) (18,219) (6,200) 394,194
Net credit to consolidated statement of income 53,405
NOTES TO THE CONSOLIDATED FINANCIAL STATEMENTSFor the year ended September 30, 2016. Expressed in thousands of Trinidad and Tobago dollars ($’000) except where otherwise stated
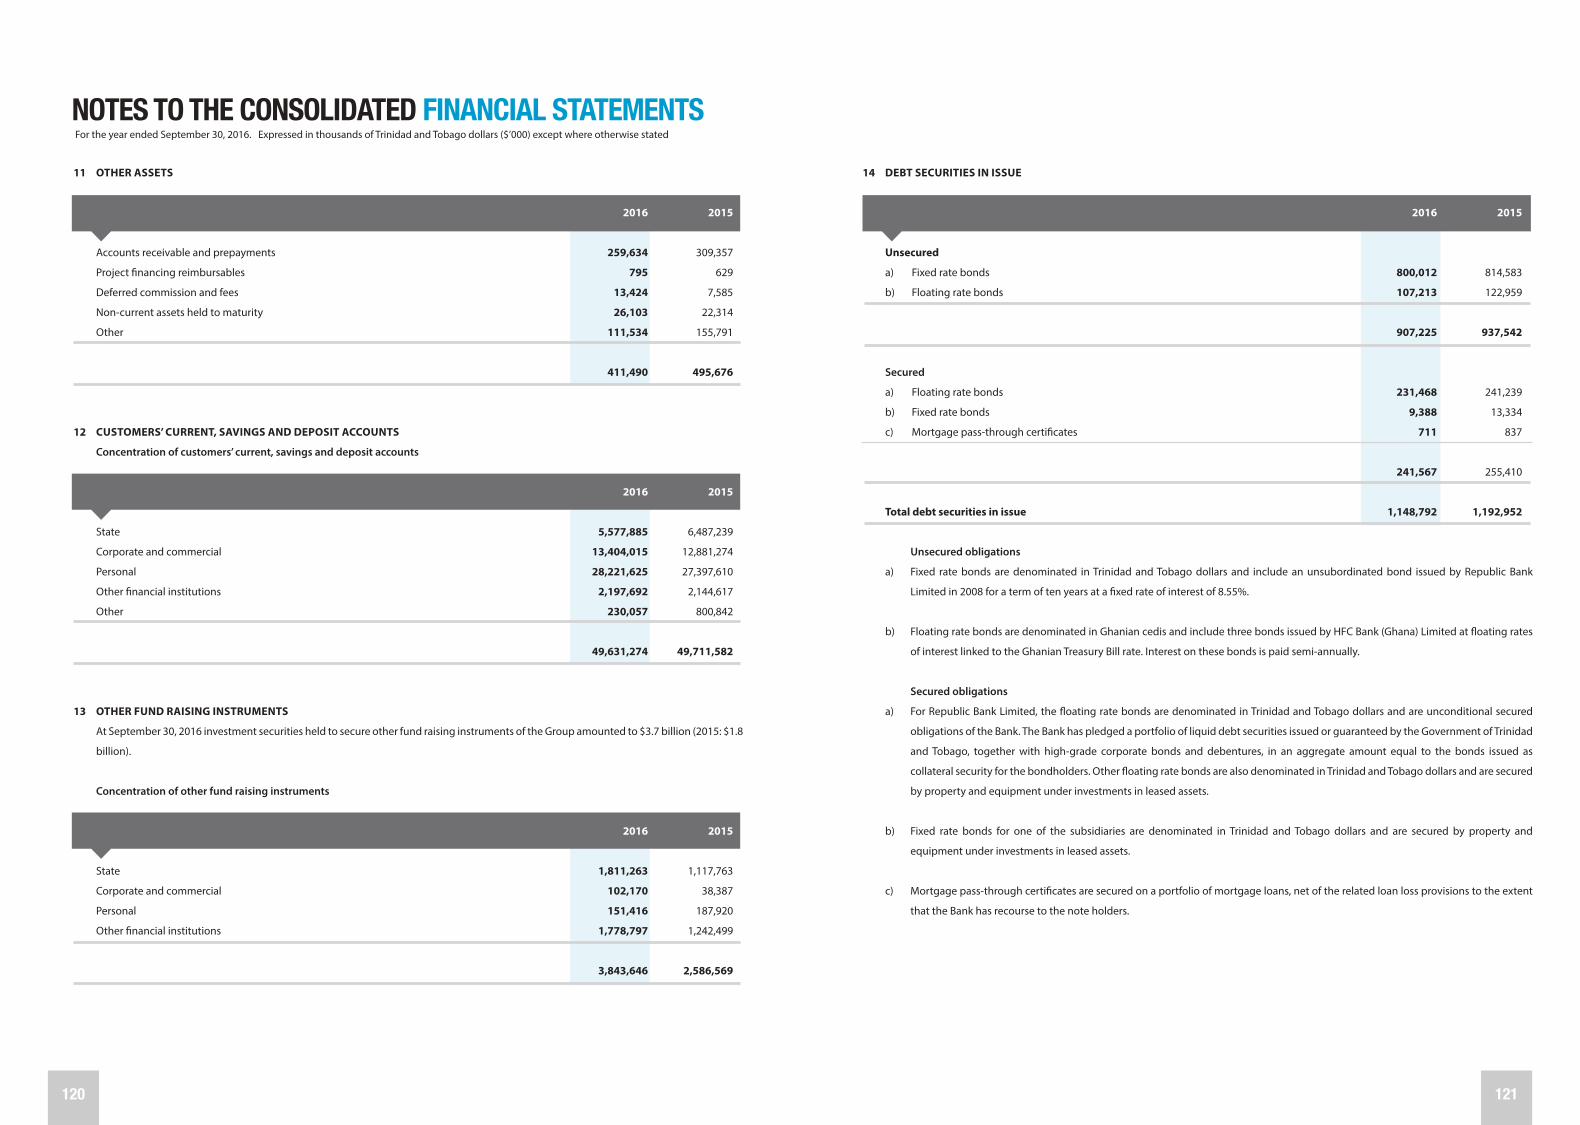
120 121
11 OTHER ASSETS
2016 2015
Accounts receivable and prepayments 259,634 309,357
Project financing reimbursables 795 629
Deferred commission and fees 13,424 7,585
Non-current assets held to maturity 26,103 22,314
Other 111,534 155,791
411,490 495,676
12 CUSTOMERS’ CURRENT, SAVINGS AND DEPOSIT ACCOUNTS
Concentration of customers’ current, savings and deposit accounts
2016 2015
State 5,577,885 6,487,239
Corporate and commercial 13,404,015 12,881,274
Personal 28,221,625 27,397,610
Other financial institutions 2,197,692 2,144,617
Other 230,057 800,842
49,631,274 49,711,582
13 OTHER FUND RAISING INSTRUMENTS
At September 30, 2016 investment securities held to secure other fund raising instruments of the Group amounted to $3.7 billion (2015: $1.8
billion).
Concentration of other fund raising instruments
2016 2015
State 1,811,263 1,117,763
Corporate and commercial 102,170 38,387
Personal 151,416 187,920
Other financial institutions 1,778,797 1,242,499
3,843,646 2,586,569
14 DEBT SECURITIES IN ISSUE
2016 2015
Unsecured
a) Fixed rate bonds 800,012 814,583
b) Floating rate bonds 107,213 122,959
907,225 937,542
Secured
a) Floating rate bonds 231,468 241,239
b) Fixed rate bonds 9,388 13,334
c) Mortgage pass-through certificates 711 837
241,567 255,410
Total debt securities in issue 1,148,792 1,192,952
Unsecured obligations
a) Fixed rate bonds are denominated in Trinidad and Tobago dollars and include an unsubordinated bond issued by Republic Bank
Limited in 2008 for a term of ten years at a fixed rate of interest of 8.55%.
b) Floating rate bonds are denominated in Ghanian cedis and include three bonds issued by HFC Bank (Ghana) Limited at floating rates
of interest linked to the Ghanian Treasury Bill rate. Interest on these bonds is paid semi-annually.
Secured obligations
a) For Republic Bank Limited, the floating rate bonds are denominated in Trinidad and Tobago dollars and are unconditional secured
obligations of the Bank. The Bank has pledged a portfolio of liquid debt securities issued or guaranteed by the Government of Trinidad
and Tobago, together with high-grade corporate bonds and debentures, in an aggregate amount equal to the bonds issued as
collateral security for the bondholders. Other floating rate bonds are also denominated in Trinidad and Tobago dollars and are secured
by property and equipment under investments in leased assets.
b) Fixed rate bonds for one of the subsidiaries are denominated in Trinidad and Tobago dollars and are secured by property and
equipment under investments in leased assets.
c) Mortgage pass-through certificates are secured on a portfolio of mortgage loans, net of the related loan loss provisions to the extent
that the Bank has recourse to the note holders.
NOTES TO THE CONSOLIDATED FINANCIAL STATEMENTSFor the year ended September 30, 2016. Expressed in thousands of Trinidad and Tobago dollars ($’000) except where otherwise stated
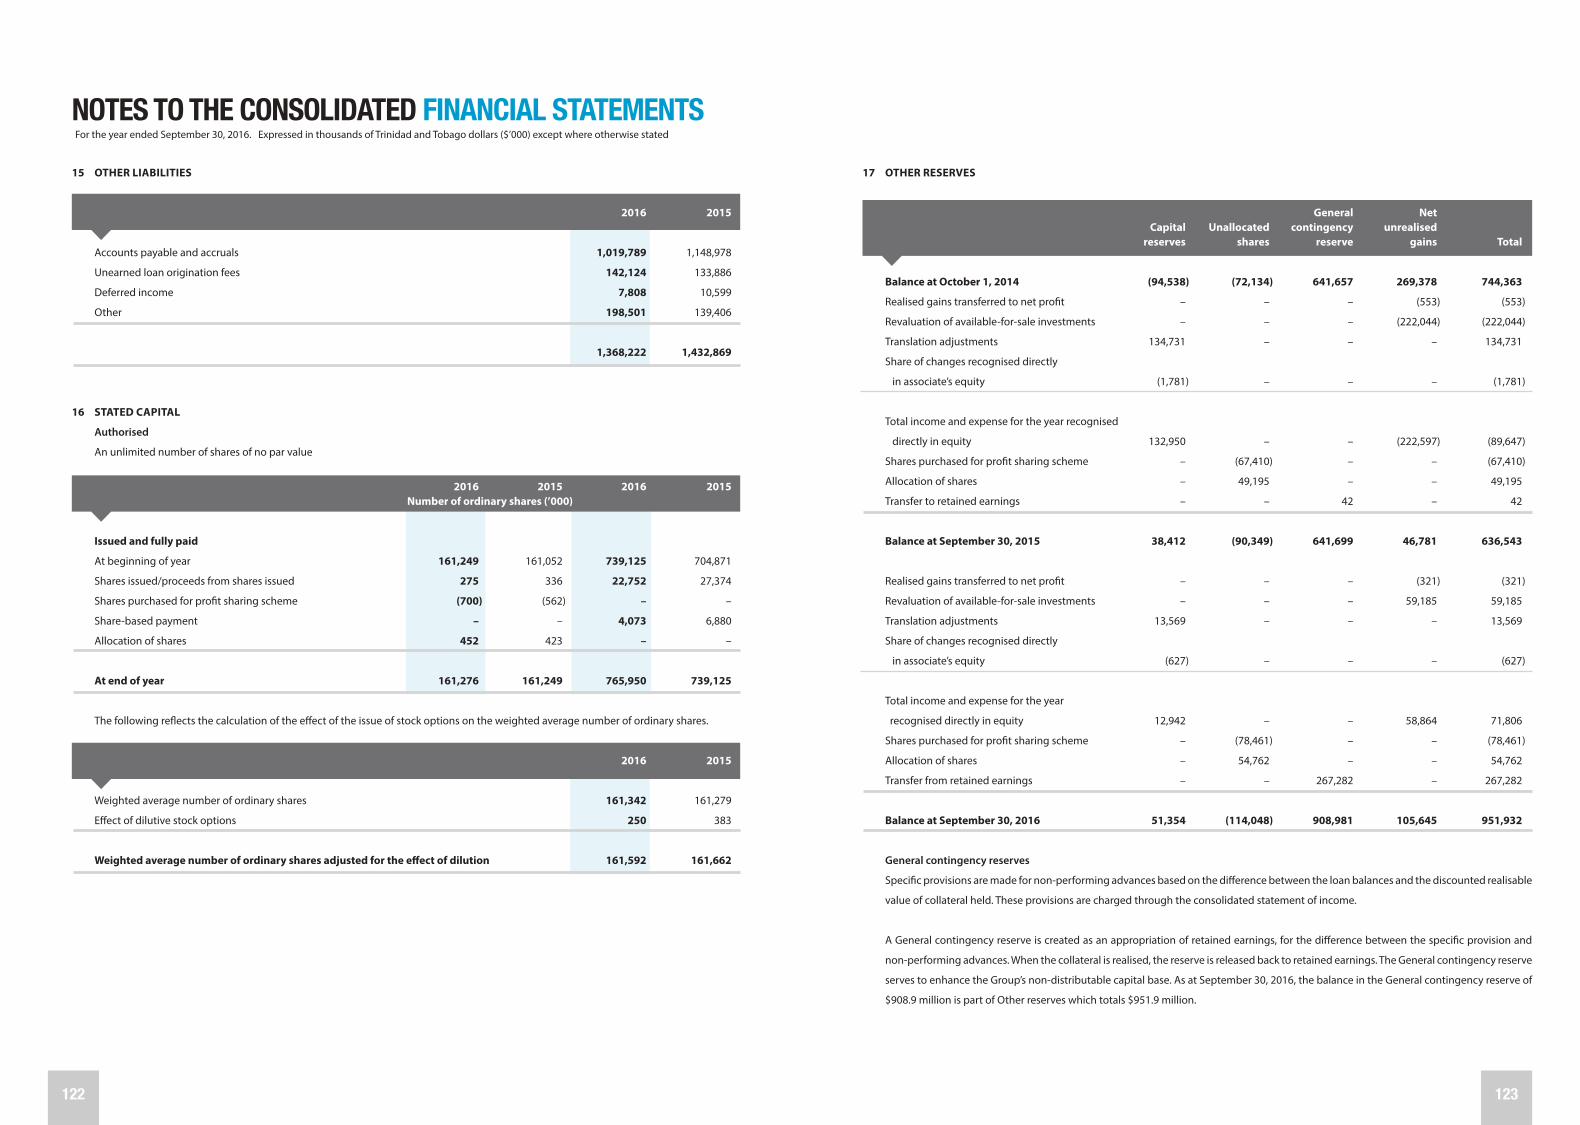
122 123
15 OTHER LIABILITIES
2016 2015
Accounts payable and accruals 1,019,789 1,148,978
Unearned loan origination fees 142,124 133,886
Deferred income 7,808 10,599
Other 198,501 139,406
1,368,222 1,432,869
16 STATED CAPITAL
Authorised
An unlimited number of shares of no par value
2016 2015 2016 2015 Number of ordinary shares (’000)
Issued and fully paid
At beginning of year 161,249 161,052 739,125 704,871
Shares issued/proceeds from shares issued 275 336 22,752 27,374
Shares purchased for profit sharing scheme (700) (562) – –
Share-based payment – – 4,073 6,880
Allocation of shares 452 423 – –
At end of year 161,276 161,249 765,950 739,125
The following reflects the calculation of the effect of the issue of stock options on the weighted average number of ordinary shares.
2016 2015
Weighted average number of ordinary shares 161,342 161,279
Effect of dilutive stock options 250 383
Weighted average number of ordinary shares adjusted for the effect of dilution 161,592 161,662
17 OTHER RESERVES
General Net Capital Unallocated contingency unrealised reserves shares reserve gains Total
Balance at October 1, 2014 (94,538) (72,134) 641,657 269,378 744,363
Realised gains transferred to net profit – – – (553) (553)
Revaluation of available-for-sale investments – – – (222,044) (222,044)
Translation adjustments 134,731 – – – 134,731
Share of changes recognised directly
in associate’s equity (1,781) – – – (1,781)
Total income and expense for the year recognised
directly in equity 132,950 – – (222,597) (89,647)
Shares purchased for profit sharing scheme – (67,410) – – (67,410)
Allocation of shares – 49,195 – – 49,195
Transfer to retained earnings – – 42 – 42
Balance at September 30, 2015 38,412 (90,349) 641,699 46,781 636,543
Realised gains transferred to net profit – – – (321) (321)
Revaluation of available-for-sale investments – – – 59,185 59,185
Translation adjustments 13,569 – – – 13,569
Share of changes recognised directly
in associate’s equity (627) – – – (627)
Total income and expense for the year
recognised directly in equity 12,942 – – 58,864 71,806
Shares purchased for profit sharing scheme – (78,461) – – (78,461)
Allocation of shares – 54,762 – – 54,762
Transfer from retained earnings – – 267,282 – 267,282
Balance at September 30, 2016 51,354 (114,048) 908,981 105,645 951,932
General contingency reserves
Specific provisions are made for non-performing advances based on the difference between the loan balances and the discounted realisable
value of collateral held. These provisions are charged through the consolidated statement of income.
A General contingency reserve is created as an appropriation of retained earnings, for the difference between the specific provision and
non-performing advances. When the collateral is realised, the reserve is released back to retained earnings. The General contingency reserve
serves to enhance the Group’s non-distributable capital base. As at September 30, 2016, the balance in the General contingency reserve of
$908.9 million is part of Other reserves which totals $951.9 million.
NOTES TO THE CONSOLIDATED FINANCIAL STATEMENTSFor the year ended September 30, 2016. Expressed in thousands of Trinidad and Tobago dollars ($’000) except where otherwise stated

124 125
17 OTHER RESERVES (continued)
Unallocated shares in the staff profit sharing scheme
The staff profit sharing scheme purchases Republic Financial Holdings Limited shares to build its stock for allocation in the annual profit
sharing exercise. As at September 30, 2016, shares costing $114 million (2015: $90 million) remain unallocated from the profit sharing
scheme. Refer to Note 27(a).
No. of shares (000’s) 2016 2015
Balance brought forward 750 610
Add shares purchased 700 562
Allocation of shares (452) (422)
Balance carried forward 998 750
18 OPERATING PROFIT
2016 2015
a) Interest income
Advances 3,044,845 2,357,816
Investment securities 345,503 306,980
Liquid assets 220,218 113,935
3,610,566 2,778,731
b) Interest expense
Customers’ current, savings and deposit accounts 367,707 203,832
Other fund raising instruments and debt securities in issue 164,895 119,112
Other interest bearing liabilities 20,817 2,751
553,419 325,695
c) Other income
Fees and commission from trust and other fiduciary activities 249,976 238,357
Other fees and commission income 722,081 589,063
Net exchange trading income 268,769 282,633
Dividends 1,257 442
Net gains from investments at fair value through profit or loss – 771
Gains from disposal of available-for-sale investments 27,843 26,885
Other operating income 143,814 324,248
1,413,740 1,462,399
18 OPERATING PROFIT (continued)
d) Operating expenses
2016 2015
Staff costs 992,413 804,835
Staff profit sharing - Note 27(a) 126,931 117,922
Employee benefits pension and medical contribution - Note 9(g) 118,440 97,002
General administrative expenses 840,821 706,193
Operating lease payments 40,789 46,368
Property related expenses 151,661 120,437
Depreciation expense - Note 7 165,627 145,159
Advertising and public relations expenses 81,721 76,005
Intangible amortisation expense 16,267 –
Investment impairment expense 65,507 –
Directors’ fees 12,863 10,532
2,613,040 2,124,453
e) Non-cancellable operating lease commitments
Within one year 24,261 28,313
One to five years 60,823 19,084
Over five years 21,660 5,479
106,744 52,876
19 TAXATION EXPENSE
2016 2015
Corporation tax 447,164 415,222
Deferred tax (53,405) (18,482)
393,759 396,740
NOTES TO THE CONSOLIDATED FINANCIAL STATEMENTSFor the year ended September 30, 2016. Expressed in thousands of Trinidad and Tobago dollars ($’000) except where otherwise stated

126 127
19 TAXATION EXPENSE (continued)
Reconciliation between taxation expense and accounting profit
Income taxes in the consolidated statement of income vary from amounts that would be computed by applying the statutory tax rate for
the following reasons:
2016 2015
Accounting profit 1,336,872 1,633,484
Tax at applicable statutory tax rates 358,909 469,525
Tax effect of items that are adjustable in determining taxable profit:
Tax exempt income (36,347) (91,799)
Non-deductible expenses 134,973 45,747
Allowable deductions (53,405) (18,481)
Provision for other taxes (10,371) (8,252)
393,759 396,740
The Group has tax losses in two of its subsidiaries amounting to $55.9 million (2015: $128.9 million). In one of these subsidiaries, no deferred
tax asset has been recognised for these tax losses in the financial statements since it is not anticipated that there will be sufficient future
taxable profits to offset these losses.
20 RELATED PARTIES
Parties are considered to be related if one party has the ability to control the other party or exercise significant influence over the other party
in making financial or operating decisions. A number of banking transactions are entered into with related parties in the normal course of
business. These transactions are both secured and unsecured and were carried out on commercial terms and conditions at market rates.
2016 2015
Advances, investments and other assets
Directors and key management personnel 18,706 20,695
Other related parties 216,923 101,095
235,629 118,812
Deposits and other liabilities
Directors and key management personnel 76,759 64,231
Other related parties 119,544 75,848
196,303 139,282
20 RELATED PARTIES (continued)
2016 2015
Interest and other income
Directors and key management personnel 1,672 1,229
Other related parties 44,442 7,576
46,114 8,805
Interest and other expense
Directors and key management personnel 13,536 7,551
Other related parties 7,803 2,558
21,339 10,109
Key management personnel are those persons having authority and responsibility for planning, directing and controlling the activities of
the Group.
Key management compensation
2016 2015
Short-term benefits 34,437 30,508
Post employment benefits 19,495 1,750
Share-based payment 4,074 6,912
58,006 39,170
21 RISK MANAGEMENT
21.1 Introduction
The Group’s prudent banking practices are founded on solid risk management. In an effort to keep apace with its dynamic environment,
the Group has established a comprehensive framework for managing risks, which is continually evolving as the Group’s business
activities change in response to market, credit, product and other developments.
The basic principles of risk management followed by the Group include:
- Managing risk within parameters approved by the Board of Directors and Executives;
- Assessing risk initially and then consistently monitoring those risks through their life cycle;
- Abiding by all applicable laws, regulations and governance standards in every country in which we do business;
- Applying high and consistent ethical standards to our relationships with all customers, employees and other stakeholders; and
- Undertaking activities in accordance with fundamental control standards. These controls include the disciplines of planning,
monitoring, segregation, authorisation and approval, recording, safeguarding, reconciliation and valuation.
NOTES TO THE CONSOLIDATED FINANCIAL STATEMENTSFor the year ended September 30, 2016. Expressed in thousands of Trinidad and Tobago dollars ($’000) except where otherwise stated

128 129
21 RISK MANAGEMENT (continued)
21.1 Introduction (continued)
The Board of Directors has ultimate responsibility for the management of risk within the Group. Acting with authority delegated by
the Board, the Credit, Audit, Asset/Liability Committee and Other Risks Committees, review specific risk areas.
In 2016, a Group Enterprise Risk Management unit, headed by a Chief Risk Officer, was formed with overall responsibility for ensuring
compliance with all risk management policies, procedures and limits.
The Internal Audit function audits Risk Management processes throughout the Group by examining both the adequacy of the
procedures and the Group’s compliance with these procedures. Internal Audit discusses the results of all assessments with Management
and reports its findings and recommendations to the Audit Committees of the Parent and respective subsidiaries.
The Group’s activities are primarily related to the use of financial instruments. The Group accepts funds from customers and seeks to
earn above average interest margins by investing in high quality assets such as government and corporate securities as well as equity
investments and seeks to increase these margins by lending for longer periods at higher rates, while maintaining sufficient liquidity to
meet all claims that might fall due.
The main risks arising from the Group’s financial instruments are credit risk, interest rate and market risk, liquidity risk, foreign currency
risk and operational risk. The Group reviews and agrees policies for managing each of these risks as follows:
21.2 Credit risk
Credit risk is the potential that a borrower or counterparty will fail to meet its stated obligations in accordance with agreed terms. The
objective of the Group’s credit risk management function is to maximise the Group’s risk-adjusted rate of return by maintaining credit
risk exposure within acceptable parameters. The effective management of credit risk is a key element of a comprehensive approach to
risk management and is considered essential to the long-term success of the Group.
The Group’s credit risk management process operates on the basis of a hierarchy of discretionary authorities. A Board Credit Committee,
chaired by the Chairman of the Board and including executive and non-executive directors, is in place, with the authority to exercise
the powers of the Board on all risk management decisions.
The Risk Management unit is accountable for the general management and administration of the Group’s credit portfolio, ensuring
that lendings are made in accordance with current legislation, sound banking practice and in accordance with the applicable general
policy of the Board of Directors. The Risk Management function is kept separate from and independent of the business development
aspect of the operations.
The Group uses a risk rating system which groups commercial/corporate accounts into various risk categories to facilitate the
management of risk on both an individual account and portfolio basis. For retail lending, a computerised Credit Scoring system with
preset risk management criteria is in place at all branches to facilitate decision-making. Trend indicators are also used to evaluate risk
as improving, static or deteriorating. The evaluation of the risk and trend inform the credit decision and determines the intensity of
the monitoring process.
The Group’s credit control processes emphasise early detection of deterioration and prompt implementation of remedial action and
where it is considered that recovery of the outstanding balance may be doubtful or unduly delayed, such accounts are transferred
from performing to non-performing status.
21 RISK MANAGEMENT (continued)
21.2 Credit risk (continued)
Loan loss provisions are set aside to cover any potential loss in respect of debts that are not performing satisfactorily. A review of these
provisions is conducted quarterly in accordance with established guidelines and recommended provisions arising out of this review
are submitted to the Board for approval. Non-performing debts recommended for write-off are also reviewed annually and action
taken in accordance with prescribed guidelines.
The Group avoids exposure to undue concentrations of risk by placing limits on the amount of risk accepted from a number of
borrowers engaged in similar business activities, or activities in the same geographic region or with similar economic features that
would cause their ability to meet contractual obligations to be similarly affected by changes in economic, political or other conditions.
Such risks are controlled and monitored on a revolving basis and are subject to an annual or more frequent review. Limits on the level
of credit risk by product, industry sector, client and geography are approved by the Board of Directors.
21.2.1 Maximum exposure to credit risk without taking account of any collateral and other credit enhancements
The table below shows the Group’s maximum exposure to credit risk:
Gross maximum exposure 2016 2015
Statutory deposits with Central Banks 5,787,709 5,627,292
Due from banks 5,340,734 7,542,995
Treasury Bills 5,886,143 6,162,162
Investment interest receivable 95,535 74,400
Advances 34,292,693 33,007,998
Investment securities 10,182,319 8,003,640
Total 61,585,133 60,418,487
Undrawn commitments 5,882,547 5,138,615
Acceptances 1,050,602 1,108,666
Guarantees and indemnities 277,114 301,161
Letters of credit 231,387 309,110
Total 7,441,650 6,857,552
Total credit risk exposure 69,026,783 67,276,039
Where financial instruments are recorded at fair value, the amounts shown represent the current credit risk exposure, but
not the maximum risk exposure that could arise in the future as a result of changes in values.
NOTES TO THE CONSOLIDATED FINANCIAL STATEMENTSFor the year ended September 30, 2016. Expressed in thousands of Trinidad and Tobago dollars ($’000) except where otherwise stated

130 131
21 RISK MANAGEMENT (continued)
21.2 Credit risk (continued)
21.2.1 Maximum exposure to credit risk without taking account of any collateral and other credit enhancements (continued)
Collateral and other credit enhancements
The Group maintains credit risk exposure within acceptable parameters through the use of collateral as a risk-mitigation
tool. The amount and type of collateral required depends on an assessment of the credit risk of the counterparty. Guidelines
are implemented regarding the acceptability of types of collateral and valuation parameters.
The main types of collateral obtained are cash or securities, charges over real estate properties, inventory and trade receivables
and mortgages over residential properties and chattels. The Group also obtains guarantees from parent companies for loans
to their subsidiaries.
Management monitors the market value of collateral, requests additional collateral in accordance with the underlying
agreement, and monitors the market value of collateral obtained during its review of the adequacy of the allowance for
impairment losses.
21.2.2 Risk concentrations of the maximum exposure to credit risk
Concentration of risk is managed by client/counterparty, by geographical region and by industry sector as detailed in the
following schedules:
a) Geographical sectors
The Group’s maximum credit exposure, after taking account of credit loss provisions established but before taking
into account any collateral held or other credit enhancements, can be analysed by the following geographical regions
based on the country of domicile of its counterparties:
2016 2015
Trinidad and Tobago 42,188,341 42,001,307
Barbados 8,390,365 7,307,155
Eastern Caribbean 1,969,617 1,499,065
Guyana 4,521,953 3,920,385
United States 2,853,410 3,944,367
Europe 786,755 757,070
Suriname 2,713,115 2,640,184
Ghana 2,456,498 2,139,890
Other Countries 3,146,729 3,066,616
69,026,783 67,276,039
21 RISK MANAGEMENT (continued)
21.2 Credit risk (continued)
21.2.2 Risk concentrations of the maximum exposure to credit risk (continued)
b) Industry sectors
The following table breaks down the Group’s maximum credit exposure as categorised by the industry sectors of its
counterparties:
2016 2015
Government and Central Government Bodies 20,983,381 21,031,567
Financial sector 9,133,643 9,161,190
Energy and mining 1,663,986 1,640,811
Agriculture 300,844 296,051
Electricity and water 485,652 433,797
Transport, storage and communication 644,140 673,403
Distribution 4,869,925 3,896,355
Real estate 3,155,974 3,706,672
Manufacturing 2,113,988 1,973,901
Construction 2,204,606 1,971,464
Hotel and restaurant 1,891,120 1,392,342
Personal 16,364,418 15,145,163
Other services 5,215,106 5,953,323
69,026,783 67,276,039
Credit exposure with state-owned bodies have been categorised according to the service offered by the organisation
rather than within ‘Government and Central Government Bodies’.
21.2.3 Credit quality per category of financial assets
The Group has determined that credit risk exposure arises from the following consolidated statement of financial position
lines:
- Treasury Bills and Statutory deposits with Central Banks
- Balances due from banks
- Advances
- Investment securities
Treasury Bills and Statutory deposits with Central Banks
These funds are placed with Central Banks in the countries where the Group is engaged in the full range of banking and
financial activities and management therefore considers the risk of default to be very low. These financial assets have
therefore been rated as ‘Superior’.
NOTES TO THE CONSOLIDATED FINANCIAL STATEMENTSFor the year ended September 30, 2016. Expressed in thousands of Trinidad and Tobago dollars ($’000) except where otherwise stated

132 133
21 RISK MANAGEMENT (continued)
21.2 Credit risk (continued)
21.2.3 Credit quality per category of financial assets (continued)
Balances due from banks
The credit quality of balances due from other banks is assessed by the Group according to the level of creditworthiness of
the institution in relation to other institutions in the region. The credit quality of these balances has been analysed into the
following categories:
Superior: These institutions have been accorded the highest rating, indicating that the institution’s capacity to meet its
financial commitment on the obligation is extremely strong.
Desirable: These institutions have been accorded the second-highest rating, indicating that the institution’s capacity to
meet its financial commitment on the obligation is very strong.
Acceptable: These institutions have been accorded the third-highest rating, indicating that the institution’s capacity to
meet its financial commitment is adequate.
The table below illustrates the credit quality for balances due from banks as at September 30:
Superior Desirable Acceptable Total
2016 2,673,633 2,487,087 180,014 5,340,734
2015 3,160,390 4,020,141 362,464 7,542,995
Advances - Commercial and Corporate
The credit quality of commercial and corporate advances is internally determined from an assessment of the counterparty
based on a combination of factors. These include the level and strength of experience of management, the track record
and level of supervision required for existing facilities of the company, the financial and leverage position of the borrowing
company, the estimated continued profitability of the company and the ability of that company to service its debts, the
stability of the industry within which the company operates and the competitive advantage held by that company in the
market. The overall level of risk thus assessed is assigned a credit score which indicates the overall quality of the Commercial/
Corporate borrowing account. The related scores for commercial and corporate advances that are neither past due nor
impaired are defined as follows:
21 RISK MANAGEMENT (continued)
21.2 Credit risk (continued)
21.2.3 Credit quality per category of financial assets (continued)
Superior: These counterparties have strong financial position. Facilities are well secured, and business has proven track
record.
Desirable: These counterparties have good financial position. Facilities are reasonably secured and underlying business
is performing well.
Acceptable: These counterparties are of average risk with a fair financial position. Business may be new or industry may
be subject to more volatility, and facilities typically have lower levels of security.
Sub-standard: Past due or individually impaired.
The table below illustrates the credit quality of commercial and corporate advances as at September 30:
Sub- Superior Desirable Acceptable standard Total
2016 365,749 2,375,785 11,914,350 883,138 15,539,022
2015 511,989 2,700,543 11,223,828 622,983 15,059,343
The following is an aging of facilities classed as sub-standard:
Less than 31 to 60 61 to 90 More than
30 days days days 91 days Impaired Total
2016 110,119 84,076 79,072 23,362 586,509 883,138
2015 111,371 27,805 38,032 111,850 333,925 622,983
Advances - Retail loans and Mortgages
These retail loans and mortgages are individually insignificant and are secured by the related assets for which these loans
were granted to fund. The following is an aging analysis of these facilities:
Less than 31 to 60 61 to 90 More than Current 30 days days days 91 days Impaired Total
2016 15,113,175 2,481,520 212,197 138,541 350,653 457,585 18,753,671
2015 14,595,102 2,367,694 96,336 163,463 365,763 360,297 17,948,655
NOTES TO THE CONSOLIDATED FINANCIAL STATEMENTSFor the year ended September 30, 2016. Expressed in thousands of Trinidad and Tobago dollars ($’000) except where otherwise stated

134 135
21 RISK MANAGEMENT (continued)
21.2 Credit risk (continued)
21.2.3 Credit quality per category of financial assets (continued)
Investment securities
The debt securities within the Group’s investment security portfolio are exposed to credit risk. The credit quality of each
individual security is internally assessed based on the financial strength, reputation and market position of the issuing
company and the ability of that company to service the debt. The level of credit risk thus assessed and associated with the
security is assigned a risk premium. These premiums are defined as follows:
Superior: Government and Government Guaranteed securities, securities secured by a Letter of comfort from the
Government and securities placed with institutions that have been accorded the highest rating by an
international rating agency. These securities are considered risk free.
Desirable: Corporate securities that are current and being serviced in accordance with the terms and conditions of the
underlying agreements and Government and Government Guaranteed securities where the country has
been recently downgraded by an international rating agency. Issuing institution has good financial strength
and reputation.
Acceptable: Corporate securities that are current and being serviced in accordance with the terms and conditions of the
underlying agreements. Issuing company has fair financial strength and reputation.
Sub-standard: These securities are either greater than 90 days in arrears, display indicators of impairment, or have been
restructured during the financial year.
The table below illustrates the credit quality of debt security investments as at September 30:
Sub-
Superior Desirable Acceptable standard Total
Available-for-sale
2016 7,209,125 1,812,011 754,379 31,000 9,806,515
2015 6,655,944 728,260 461,518 35,427 7,881,149
Held to Maturity
2016 – 375,810 – – 375,810
2015 – 122,491 – – 122,491
NOTES TO THE CONSOLIDATED FINANCIAL STATEMENTSFor the year ended September 30, 2016. Expressed in thousands of Trinidad and Tobago dollars ($’000) except where otherwise stated
21 RISK MANAGEMENT (continued)
21.3 Liquidity risk
Liquidity risk is defined as the risk that the Group either does not have sufficient financial resources available to meet all its obligations
and commitments as they fall due, or can access these only at excessive cost.
Liquidity management is therefore primarily designed to ensure that funding requirements can be met, including the replacement
of existing funds as they mature or are withdrawn, or to satisfy the demands of customers for additional borrowings. Liquidity
management focuses on ensuring that the Group has sufficient funds to meet all of its obligations.
Three primary sources of funds are used to provide liquidity – retail deposits, wholesale deposits and the capital market. A substantial
portion of the Group is funded with ‘core deposits’. The Group maintains a core base of retail and wholesale funds which can be drawn
on to meet ongoing liquidity needs. The capital markets are accessed for medium to long-term funds as required; providing diverse
funding sources to the Group. Facilities are also established with correspondent banks, which can provide additional liquidity as
conditions demand.
The Asset/Liability Committee (ALCO) sets targets for daily float, allowable liquid assets and funding diversification in line with system
liquidity trends. While the primary asset used for short-term liquidity management is the Treasury bill, the Group also holds significant
investments in other Government securities, which can be used for liquidity support. The Group continually balances the need for
short-term assets, which have lower yields, with the need for higher asset returns.
21.3.1 Analysis of financial liabilities by remaining contractual maturities
The table below summarises the maturity profile of the Group’s financial liabilities at September 30 based on contractual
undiscounted repayment obligations over the remaining life of those liabilities. These balances include interest to be
paid over the remaining life of the liabilities and will therefore be greater than the carrying amounts on the consolidated
statement of financial position. Refer to Note 26 for a maturity analysis of assets and liabilities.
Financial liabilities - on consolidated statement of financial position
On Up to one 1 to 5 Over 5
demand year years years Total
2016
Customers’ current, savings
and deposit accounts 42,082,957 7,907,820 184,356 – 50,175,133
Other fund raising instruments – 3,453,904 346,781 104,873 3,905,558
Debt securities in issue – 132,471 1,105,751 134,800 1,373,022
Due to banks 85,739 88,501 – – 174,240
Other liabilities 502,019 196,133 – – 698,152
Total un-discounted
financial liabilities 42,670,715 11,778,829 1,636,888 239,673 56,326,105

136 137
NOTES TO THE CONSOLIDATED FINANCIAL STATEMENTSFor the year ended September 30, 2016. Expressed in thousands of Trinidad and Tobago dollars ($’000) except where otherwise stated
21 RISK MANAGEMENT (continued)
21.3 Liquidity risk (continued)
21.3.1 Analysis of financial liabilities by remaining contractual maturities (continued)
Financial liabilities - on consolidated statement of financial position (continued)
On Up to one 1 to 5 Over 5
demand year years years Total
2015
Customers’ current, savings
and deposit accounts 41,764,069 7,802,633 221,511 – 49,788,213
Other fund raising instruments 341,887 1,941,627 269,544 124,185 2,677,243
Debt securities in issue 5,956 111,398 1,208,640 250,024 1,576,018
Due to banks 112,472 657,592 – – 770,064
Other liabilities 532,364 83,309 2,256 2,306 620,235
Total undiscounted
financial liabilities 42,756,748 10,596,559 1,701,951 376,515 55,431,773
Financial liabilities - off consolidated statement of financial position
On Up to one 1 to 5 Over 5
demand year years years Total
2016
Acceptances 359,645 400,081 289,949 927 1,050,602
Guarantees and indemnities 42,980 171,570 37,631 24,933 277,114
Letters of credit 126,263 105,124 – – 231,387
Total 528,888 676,775 327,580 25,860 1,559,103
2015
Acceptances 391,149 389,352 327,499 666 1,108,666
Guarantees and indemnities 8,222 227,053 35,313 30,573 301,161
Letters of credit 85,533 223,577 – – 309,110
Total 484,904 839,982 362,812 31,239 1,718,937
The Group expects that not all of the contingent liabilities or commitments will be drawn before expiry of the commitments.
21 RISK MANAGEMENT (continued)
21.4 Market risk
Market risk is the risk that the fair value or future cash flows of financial instruments will fluctuate due to changes in market variables
such as interest rates, foreign exchange rates and equity prices.
21.4.1 Interest rate risk
Interest rate risk arises from the possibility that changes in interest rates will affect future cash flows or the fair values of
financial instruments. The Group has an Asset/Liability Committee which reviews on a monthly basis the non-credit and non-
operational risk for the Parent and each subsidiary. Asset and Liability management is a vital part of the risk management
process of the Group. The mandate of the Committee is to approve strategies for the management of the non-credit risks of
the Group, including interest rate, foreign exchange, liquidity and market risks.
The primary tools currently in use are gap analysis, interest rate sensitivity analysis and exposure limits for financial
instruments. The limits are defined in terms of amount, term, issuer, depositor and country. The Group is committed to
refining and defining these tools to be in line with international best practice.
The table below summarises the interest-rate exposure of the Group’s consolidated statement of financial position. Interest
on financial instruments classified as floating is repriced at intervals of less than one year while interest on financial
instruments classified as fixed is fixed until the maturity of the instrument.
An interest rate sensitivity analysis was performed to determine the impact on net profit and equity of a reasonable possible
change in the interest rates prevailing as at September 30, with all other variables held constant. The impact on net profit
is the effect of changes in interest rates on the floating interest rates of financial assets and liabilities. The impact on net
unrealised gains is the effect of changes in interest rates on the fair value of available-for-sale financial assets. This impact is
illustrated on the following table:
Impact on net profit Change in 2016 2015
basis points Increase Decrease Increase Decrease
TT$ Instruments +/- 50 45,601 (45,601) 40,742 (40,742)
US$ Instruments +/- 50 5,668 (5,668) 12,135 (12,135)
BDS$ Instruments +/- 50 7,057 (7,057) 7,349 (7,349)
GHS Instruments +/- 300 5,597 (5,597) 371 (371)
Other currency instruments +/- 50 308 (308) 277 (277)
Impact on net equity Change in 2016 2015
basis points Increase Decrease Increase Decrease
TT$ Instruments +/- 50 (55,329) 58,663 (42,211) 43,233
US$ Instruments +/- 50 (31,455) 32,136 (43,270) 37,833
EC$ Instruments +/- 25 (150) 151 (78) 78
BDS$ Instruments +/- 50 (9,585) 10,650 (8,106) 8,419
Other currency instruments +/- 50 (110) 107 (180) 239

138 139
NOTES TO THE CONSOLIDATED FINANCIAL STATEMENTSFor the year ended September 30, 2016. Expressed in thousands of Trinidad and Tobago dollars ($’000) except where otherwise stated
21 RISK MANAGEMENT (continued)
21.4 Market risk (continued)
21.4.2 Currency risk
Currency risk is the risk that the value of a financial instrument will fluctuate due to changes in foreign exchange rates. The
Group’s exposure to the effects of fluctuations in foreign currency exchange rates arises mainly from its investments and
overseas subsidiaries and associates. The Group’s policy is to match the initial net foreign currency investment with funding
in the same currency. The Group also monitors its foreign currency position for both overnight and intra-day transactions.
Changes in foreign exchange rates affect the Group’s earnings and equity through differences on the re-translation of the
net assets and related funding of overseas subsidiaries and associates from the respective local currency to TT dollars. Gains
or losses on foreign currency investment in subsidiary and associated undertakings are recognised in reserves. Gains or
losses on related foreign currency funding are recognised in the consolidated statement of income.
The principal currencies of the Group’s subsidiary and associated company investments are TTD, USD, GYD, XCD, BDS, Ghana
Cedi (GHS) and Suriname SRD.
The tables below indicate the currencies to which the Group had significant exposure at September 30 on its non-trading
monetary assets and liabilities and its forecast cash flows. The analysis also calculates the effect of a reasonably possible
movement of each currency rate against the Trinidad and Tobago dollar, with all other variables held constant.
2016 TTD USD BDS GHS Other Total
Financial assets
Cash and cash equivalents 359,822 61,660 96,830 69,071 206,320 793,703
Statutory deposits
with Central Banks 4,265,040 – 661,330 171,086 690,251 5,787,707
Due from banks 1,264,401 2,333,573 11,767 141,183 1,589,810 5,340,734
Treasury Bills 2,782,962 – 1,633,400 – 1,469,781 5,886,143
Investment interest receivable 44,142 34,308 2,428 11,928 2,729 95,535
Advances 19,620,214 4,948,836 4,730,935 1,593,771 3,398,937 34,292,693
Investment securities 5,205,892 4,084,608 471,725 424,403 78,419 10,265,047
Total financial assets 33,542,473 11,462,985 7,608,415 2,411,442 7,436,247 62,461,562
21 RISK MANAGEMENT (continued)
21.4 Market risk (continued)
21.4.2 Currency risk (continued)
2016 TTD USD BDS GHS Other Total
Financial liabilities
Due to banks – 93,063 9,206 35,768 29,444 167,481
Customers’ current, savings
and deposit accounts 24,962,190 9,012,864 6,117,686 2,100,767 7,437,767 49,631,274
Other fund raising
instruments 3,234,203 174,684 332,589 102,170 – 3,843,646
Debt securities in issue 1,041,580 – – 107,212 – 1,148,792
Interest payable 37,408 9,090 4,709 50,581 2,888 104,676
Total financial liabilities 29,275,391 9,289,701 6,464,190 2,396,498 7,470,089 54,895,869
Net currency risk exposure 2,173,284 1,144,225 14,944 (33,842)
Reasonably possible change
in currency rate (%) 1% 1% 3% 1%
Effect on profit before tax 21,733 11,442 448 (338)
2015 TTD USD BDS GHS Other Total
Financial assets
Cash and cash equivalents 352,743 186,847 108,247 91,262 191,386 930,485
Statutory deposits
with Central Banks 4,364,178 17,871 464,920 86,771 693,552 5,627,292
Due from banks 2,611,970 3,324,254 8,535 43,291 1,554,945 7,542,995
Treasury Bills 3,485,001 – 1,200,164 – 1,476,997 6,162,162
Investment interest receivable 31,587 26,732 2,479 6,864 6,738 74,400
Advances 20,135,442 4,600,371 4,584,901 1,128,182 2,559,102 33,007,998
Investment securities 3,783,046 3,560,128 436,823 169,720 144,675 8,094,392
Total financial assets 34,763,967 11,716,203 6,806,069 1,526,090 6,627,395 61,439,724
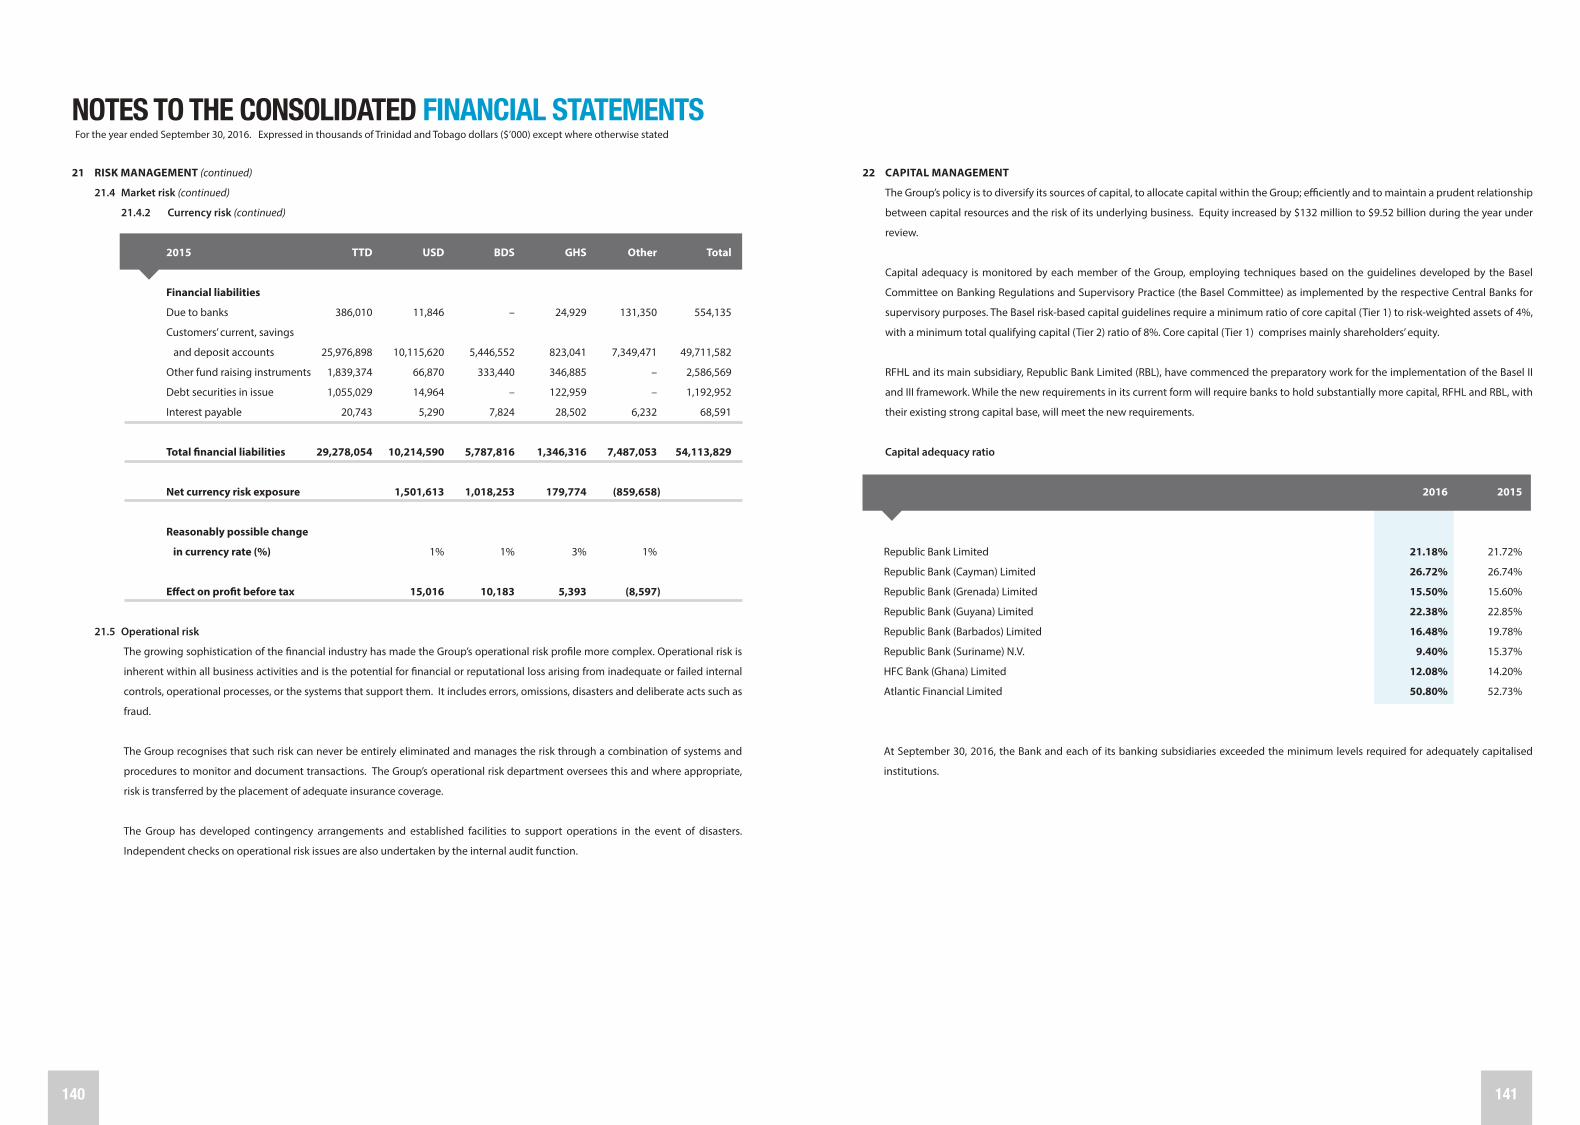
140 141
NOTES TO THE CONSOLIDATED FINANCIAL STATEMENTSFor the year ended September 30, 2016. Expressed in thousands of Trinidad and Tobago dollars ($’000) except where otherwise stated
21 RISK MANAGEMENT (continued)
21.4 Market risk (continued)
21.4.2 Currency risk (continued)
2015 TTD USD BDS GHS Other Total
Financial liabilities
Due to banks 386,010 11,846 – 24,929 131,350 554,135
Customers’ current, savings
and deposit accounts 25,976,898 10,115,620 5,446,552 823,041 7,349,471 49,711,582
Other fund raising instruments 1,839,374 66,870 333,440 346,885 – 2,586,569
Debt securities in issue 1,055,029 14,964 – 122,959 – 1,192,952
Interest payable 20,743 5,290 7,824 28,502 6,232 68,591
Total financial liabilities 29,278,054 10,214,590 5,787,816 1,346,316 7,487,053 54,113,829
Net currency risk exposure 1,501,613 1,018,253 179,774 (859,658)
Reasonably possible change
in currency rate (%) 1% 1% 3% 1%
Effect on profit before tax 15,016 10,183 5,393 (8,597)
21.5 Operational risk
The growing sophistication of the financial industry has made the Group’s operational risk profile more complex. Operational risk is
inherent within all business activities and is the potential for financial or reputational loss arising from inadequate or failed internal
controls, operational processes, or the systems that support them. It includes errors, omissions, disasters and deliberate acts such as
fraud.
The Group recognises that such risk can never be entirely eliminated and manages the risk through a combination of systems and
procedures to monitor and document transactions. The Group’s operational risk department oversees this and where appropriate,
risk is transferred by the placement of adequate insurance coverage.
The Group has developed contingency arrangements and established facilities to support operations in the event of disasters.
Independent checks on operational risk issues are also undertaken by the internal audit function.
22 CAPITAL MANAGEMENT
The Group’s policy is to diversify its sources of capital, to allocate capital within the Group; efficiently and to maintain a prudent relationship
between capital resources and the risk of its underlying business. Equity increased by $132 million to $9.52 billion during the year under
review.
Capital adequacy is monitored by each member of the Group, employing techniques based on the guidelines developed by the Basel
Committee on Banking Regulations and Supervisory Practice (the Basel Committee) as implemented by the respective Central Banks for
supervisory purposes. The Basel risk-based capital guidelines require a minimum ratio of core capital (Tier 1) to risk-weighted assets of 4%,
with a minimum total qualifying capital (Tier 2) ratio of 8%. Core capital (Tier 1) comprises mainly shareholders’ equity.
RFHL and its main subsidiary, Republic Bank Limited (RBL), have commenced the preparatory work for the implementation of the Basel II
and III framework. While the new requirements in its current form will require banks to hold substantially more capital, RFHL and RBL, with
their existing strong capital base, will meet the new requirements.
Capital adequacy ratio
2016 2015
Republic Bank Limited 21.18% 21.72%
Republic Bank (Cayman) Limited 26.72% 26.74%
Republic Bank (Grenada) Limited 15.50% 15.60%
Republic Bank (Guyana) Limited 22.38% 22.85%
Republic Bank (Barbados) Limited 16.48% 19.78%
Republic Bank (Suriname) N.V. 9.40% 15.37%
HFC Bank (Ghana) Limited 12.08% 14.20%
Atlantic Financial Limited 50.80% 52.73%
At September 30, 2016, the Bank and each of its banking subsidiaries exceeded the minimum levels required for adequately capitalised
institutions.

142 143
NOTES TO THE CONSOLIDATED FINANCIAL STATEMENTSFor the year ended September 30, 2016. Expressed in thousands of Trinidad and Tobago dollars ($’000) except where otherwise stated
23 FAIR VALUE
23.1 Carrying values and fair values
The following table summarises the carrying amounts and the fair values of the Group’s financial assets and liabilities:
Carrying Fair Unrecognised 2016 value value gain/(loss)
Financial assets
Cash, due from banks and Treasury Bills 12,020,580 12,020,580 –
Investment interest receivable 95,535 95,535 –
Advances 34,292,693 33,441,973 (850,720)
Investment securities 10,265,047 10,265,047 –
Other financial assets 259,634 259,634 –
Financial liabilities
Customers’ current, savings and deposit accounts 49,631,274 49,630,366 908
Borrowings and other fund raising instruments 4,011,127 4,011,127 –
Debt securities in issue 1,148,792 1,210,049 (61,257)
Accrued interest payable 104,675 104,099 576
Other financial liabilities 1,019,789 1,013,830 5,959
Total unrecognised change in unrealised fair value (904,534)
Carrying Fair Unrecognised
2015 value value gain/(loss)
Financial assets
Cash, due from banks and Treasury Bills 14,635,642 14,635,642 –
Investment interest receivable 74,400 74,400 –
Advances 33,007,998 32,806,167 (201,830)
Investment securities 8,094,392 8,094,392 –
Other financial assets 309,357 309,357 –
Financial liabilities
Customers’ current, savings and deposit accounts 49,711,582 49,729,973 (18,391)
Borrowings and other fund raising instruments 3,140,704 3,140,704 –
Debt securities in issue 1,192,952 1,292,125 (99,173)
Accrued interest payable 68,591 68,591 –
Other financial liabilities 1,148,978 1,148,978 –
Total unrecognised change in unrealised fair value (319,394)
23 FAIR VALUE (continued)
23.2 Fair value and fair value hierarchies
23.2.1 Determination of fair value and fair value hierarchies
The following table shows the fair value measurement hierarchy of the Group’s assets and liabilities:
Level 1 Level 2 Level 3 Total
2016
Financial assets measured at fair value
Investment securities 3,351,302 6,904,994 8,751 10,265,047
Financial assets for which fair value is disclosed
Advances – – 33,441,973 33,441,973
Financial liabilities for which fair value is disclosed
Customers’ current, savings and deposit accounts – – 49,630,366 49,630,366
Debt securities in issue – 1,010,158 199,891 1,210,049
2015
Financial assets measured at fair value
Investment securities 3,512,848 4,572,636 8,908 8,094,392
Financial assets for which fair value is disclosed
Advances – – 32,806,167 32,806,167
Financial liabilities for which fair value is disclosed
Customers’ current, savings and deposit accounts – – 49,729,973 49,729,973
Debt securities in issue – 1,292,125 – 1,292,125

144 145
NOTES TO THE CONSOLIDATED FINANCIAL STATEMENTSFor the year ended September 30, 2016. Expressed in thousands of Trinidad and Tobago dollars ($’000) except where otherwise stated
23 FAIR VALUE (continued)
23.2 Fair value and fair value hierarchies (continued)
23.2.2 Description of significant unobservable inputs to valuation:
The significant unobservable inputs used in the fair value measurements categorised within Level 3 of the fair value
hierarchy as at September 30, 2016 are as shown below:
Significant
Valuation unobservable technique inputs Range
Advances Discounted Growth 3.3% - 34%
Cash Flow rate for cash
Method flows for
subsequent
years
Customers’ current, savings Discounted Growth 0.0% - 27%
and deposit accounts Cash Flow rate for cash
Method flows for
subsequent
years
23.2.3 Transfers between Level 1 and 2
For the year ended September 30, 2016, no assets were transferred between Level 1 and Level 2.
23.2.4 Reconciliation of movements in Level 3 investment securities measured at fair value
Balance at Disposals
beginning /Transfers Balance at of year to Level 2 end of year
Financial assets designated at fair value through profit or loss 107 (38) 69
Investments securities - available-for-sale 8,801 (119) 8,682
8,908 (157) 8,751
24 MATERIAL PARTLY-OWNED SUBSIDIARIES
Financial information of subsidiaries that have material non-controlling interests is provided below:
Proportion of equity interest held by non-controlling interests:
Name Country of incorporation and operation 2016 2015
HFC Bank (Ghana) Limited Ghana 42.89% 42.89%
Republic Bank (Guyana) Limited Guyana 49.00% 49.00%
Accumulated balances of material non-controlling interest:
HFC Bank (Ghana) Limited 91,086 141,499
Republic Bank (Guyana) Limited 265,164 228,330
(Loss)/profit allocated to material non-controlling interest:
HFC Bank (Ghana) Limited (50,039) (32,263)
Republic Bank (Guyana) Limited 41,594 41,808
The summarised financial information of these subsidiaries is provided in Note 25 (i) of these financial statements.

146 147
NOTES TO THE CONSOLIDATED FINANCIAL STATEMENTSFor the year ended September 30, 2016. Expressed in thousands of Trinidad and Tobago dollars ($’000) except where otherwise stated
25 SEGMENTAL INFORMATION
The Group is organised into two main business segments: retail and commercial banking and merchant banking. The Group’s primary
reporting format comprises geographical segments, reflecting its management structure and the secondary segment is by class of business.
The following is an analysis by respective segments:
i) By geographic segment
Cayman,
Suriname Trinidad and Eastern
and Tobago Barbados Guyana Caribbean Ghana Eliminations Total
2016
Interest income 2,117,656 465,714 232,696 329,685 503,753 (38,938) 3,610,566
Interest expense (216,194) (38,378) (18,949) (65,320) (253,516) 38,938 (553,419)
Net interest income 1,901,462 427,336 213,747 264,365 250,237 – 3,057,147
Other income 1,397,829 141,977 81,141 121,657 105,886 (434,749) 1,413,741
Share of (loss)/profits
of associates (1,661) – – 616 – – (1,045)
Operating income 3,297,630 569,313 294,888 386,638 356,123 (434,749) 4,469,843
Investment impairment
expense (61,841) – – (3,666) – – (65,507)
Other operating expenses (1,613,015) (333,285) (136,410) (235,802) (294,814) 65,793 (2,547,533)
Operating profit 1,622,774 236,028 158,478 147,170 61,309 (368,956) 1,856,803
Goodwill impairment
expense (107,309) – – – – – (107,309)
Loan impairment expense,
net of recoveries (139,463) (42,030) (24,699) (37,685) (168,745) – (412,622)
Net profit/(loss) before
taxation 1,376,002 193,998 133,779 109,485 (107,436) (368,956) 1,336,872
Taxation (307,617) (25,147) (48,893) (1,690) (10,412) – (393,759)
Net profit/(loss)
after taxation 1,068,385 168,851 84,886 107,795 (117,848) (368,956) 943,113
25 SEGMENTAL INFORMATION (continued)
i) By geographic segment (continued)
Cayman, Suriname
Trinidad and Eastern and Tobago Barbados Guyana Caribbean Ghana Eliminations Total
2016
Investment in
associated companies 74,653 – – 838 – – 75,491
Total assets 50,455,735 9,453,132 4,865,530 8,213,823 2,723,546 (8,852,223) 66,859,543
Total liabilities 38,848,413 7,917,525 4,328,955 6,190,711 2,496,722 (2,465,478) 57,316,848
Depreciation 91,837 25,835 12,000 13,524 20,897 1,534 165,627
Capital expenditure on
premises and equipment 300,400 23,290 45,664 33,168 36,234 – 438,756
Cash flow from operating
activities (362,992) 677,417 143,317 954,766 228,262 (295,417) 1,345,353
Cash flow from investing
activities (1,373,752) (332,163) (160,749) (331,604) (291,341) (9,653) (2,499,262)
Cash flow from financing
activities (1,258,691) (57,113) (41,446) (34,975) (18,528) 253,852 (1,156,901)

148 149
NOTES TO THE CONSOLIDATED FINANCIAL STATEMENTSFor the year ended September 30, 2016. Expressed in thousands of Trinidad and Tobago dollars ($’000) except where otherwise stated
25 SEGMENTAL INFORMATION (continued)
i) By geographic segment (continued)
Cayman, Suriname
Trinidad and Eastern and Tobago Barbados Guyana Caribbean Ghana Eliminations Total
2015
Interest income 1,861,744 455,338 209,726 201,362 89,056 (38,495) 2,778,731
Interest expense (174,145) (89,771) (17,872) (35,378) (47,024) 38,495 (325,695)
Net interest income 1,687,599 365,567 191,854 165,984 42,032 – 2,453,036
Other income 1,401,864 152,196 88,975 66,488 45,434 (292,558) 1,462,399
Share of profits
of associates 39,276 – – – – – 39,276
Operating income 3,128,739 517,763 280,829 232,472 87,466 (292,558) 3,954,711
Other operating expenses (1,496,698) (319,100) (133,068) (107,131) (79,932) 11,476 (2,124,453)
Operating profit 1,632,041 198,663 147,761 125,341 7,534 (281,082) 1,830,258
Goodwill impairment
expense – – – (31,510) – – (31,510)
Loan impairment
expense, net of recoveries 8,440 (33,475) (17,399) (31,665) (91,165) – (165,264)
Net profit/(loss)
before taxation 1,640,481 165,188 130,362 62,166 (83,631) (281,082) 1,633,484
Taxation (337,107) (21,174) (45,039) (1,827) 8,407 – (396,740)
Net profit/(loss)
after taxation 1,303,374 144,014 85,323 60,339 (75,224) (281,082) 1,236,744
25 SEGMENTAL INFORMATION (continued)
i) By geographic segment (continued)
Cayman, Suriname
Trinidad and Eastern and Tobago Barbados Guyana Caribbean Ghana Eliminations Total
2015
Investment in
associated companies 142,066 – – – – – 142,066
Total assets 48,366,058 8,442,558 4,327,834 8,498,266 2,234,069 (5,867,209) 66,001,576
Total liabilities 41,003,885 7,050,274 3,865,036 6,516,471 1,887,016 (3,731,715) 56,590,967
Depreciation 94,156 25,924 12,430 8,137 4,512 – 145,159
Capital expenditure on
premises and equipment 251,604 10,338 14,194 4,695 6,507 – 287,338
Cash flow from operating
activities (697,874) 129,792 356,654 (122,230) (79,805) (621,668) (1,035,131)
Cash flow from investing
activities (1,167,865) 452,981 (79,589) 193,731 89,672 1,655,459 1,144,389
Cash flow from financing
activities (525,247) (67,066) (31,769) 6,710 (55,881) 272,574 (400,679)

150 151
NOTES TO THE CONSOLIDATED FINANCIAL STATEMENTSFor the year ended September 30, 2016. Expressed in thousands of Trinidad and Tobago dollars ($’000) except where otherwise stated
25 SEGMENTAL INFORMATION (continued)
ii) By class of business
Retail and
commercial Merchant banking banking Eliminations Total
2016
Interest income 3,352,525 296,979 (38,938) 3,610,566
Interest expense (516,842) (75,515) 38,938 (553,419)
Net interest income 2,835,683 221,464 – 3,057,147
Other income 1,719,192 129,298 (434,749) 1,413,741
Share of loss of associates (1,045) – – (1,045)
Operating income 4,553,830 350,762 (434,749) 4,469,843
Investment impairment expense (65,507) – – (65,507)
Other operating expenses (2,568,986) (44,340) 65,793 (2,547,533)
Operating profit 1,919,337 306,422 (368,956) 1,856,803
Goodwill impairment expense (107,309) – – (107,309)
Loan impairment expense, net of recoveries (396,391) (16,231) – (412,622)
Net profit before taxation 1,415,637 290,191 (368,956) 1,336,872
Taxation (349,740) (44,019) – (393,759)
Net profit after taxation 1,065,897 246,172 (368,956) 943,113
Investment in associated companies 75,491 – – 75,491
Total assets 66,973,580 8,738,186 (8,852,223) 66,859,543
Total liabilities 53,129,955 6,652,371 (2,465,478) 57,316,848
Depreciation 163,502 591 1,534 165,627
Capital expenditure on premises and equipment 388,490 50,266 – 438,756
Cash flow from operating activities 267,486 1,373,284 (295,417) 1,345,353
Cash flow from investing activities 6,302,823 (8,792,432) (9,653) (2,499,262)
Cash flow from financing activities (218,254) (1,192,499) 253,852 (1,156,901)
25 SEGMENTAL INFORMATION (continued)
ii) By class of business
Retail and
commercial Merchant banking banking Eliminations Total
2015
Interest income 2,530,533 286,693 (38,495) 2,778,731
Interest expense (316,100) (48,090) 38,495 (325,695)
Net interest income 2,214,433 238,603 – 2,453,036
Other income 1,619,835 135,122 (292,558) 1,462,399
Share of profits of associates 39,276 – – 39,276
Operating income 3,873,544 373,725 (292,558) 3,954,711
Other operating expenses (2,092,314) (43,615) 11,476 (2,124,453)
Operating profit 1,781,230 330,110 (281,082) 1,830,258
Goodwill impairment expense – (31,510) – (31,510)
Loan impairment expense, net of recoveries (143,929) (21,335) – (165,264)
Net profit before taxation 1,637,301 277,265 (281,082) 1,633,484
Taxation (351,478) (45,262) – (396,740)
Net profit after taxation 1,285,823 232,003 (281,082) 1,236,744
Investment in associated companies 142,066 – – 142,066
Total assets 63,862,604 8,006,181 (5,867,209) 66,001,576
Total liabilities 54,513,068 5,809,614 (3,731,715) 56,590,967
Depreciation 144,567 592 – 145,159
Capital expenditure on premises and equipment 573 286,765 – 287,338
Cash flow from operating activities (702,825) 289,362 (621,668) (1,035,131)
Cash flow from investing activities (1,281,493) 770,423 1,655,459 1,144,389
Cash flow from financing activities (395,540) (277,713) 272,574 (400,679)

152 153
NOTES TO THE CONSOLIDATED FINANCIAL STATEMENTSFor the year ended September 30, 2016. Expressed in thousands of Trinidad and Tobago dollars ($’000) except where otherwise stated
26 MATURITY ANALYSIS OF ASSETS AND LIABILITIES
The table below analyses the discounted assets and liabilities of the Group based on the remaining period at September 30 to the
contractual maturity date. See Note 21.3 - ‘Liquidity risk’ - for an analysis of the financial liabilities based on contractual undiscounted
repayment obligations.
Within After
one year one year Total
2016
ASSETS
Cash and cash equivalents 793,703 – 793,703
Statutory deposits with Central Banks 5,787,709 – 5,787,709
Due from banks 5,340,734 – 5,340,734
Treasury Bills 5,886,143 – 5,886,143
Investment interest receivable 95,535 – 95,535
Advances 10,419,928 23,872,765 34,292,693
Investment securities 2,198,826 8,066,221 10,265,047
Investment in associated companies – 75,491 75,491
Premises and equipment – 2,188,528 2,188,528
Intangible assets – 416,931 416,931
Net pension asset – 1,010,851 1,010,851
Deferred tax assets – 211,868 211,868
Taxation recoverable 219 82,601 82,820
Other assets 383,768 27,722 411,490
30,906,565 35,952,978 66,859,543
LIABILITIES
Due to banks 167,481 – 167,481
Customers’ current, savings and deposit accounts 49,449,444 181,830 49,631,274
Other fund raising instruments 3,601,167 242,479 3,843,646
Debt securities in issue – 1,148,792 1,148,792
Net pension liability – 67,360 67,360
Provision for post-retirement medical benefits – 430,929 430,929
Taxation payable 160,274 – 160,274
Deferred tax liabilities – 394,194 394,194
Accrued interest payable 104,676 – 104,676
Other liabilities 1,120,427 247,795 1,368,222
54,603,469 2,713,379 57,316,848
26 MATURITY ANALYSIS OF ASSETS AND LIABILITIES (continued)
Within After one year one year Total
2015
ASSETS
Cash and cash equivalents 930,485 – 930,485
Statutory deposits with Central Banks 5,627,292 – 5,627,292
Due from banks 7,542,995 – 7,542,995
Treasury Bills 6,162,162 – 6,162,162
Investment interest receivable 74,400 – 74,400
Advances 10,311,719 22,696,279 33,007,998
Investment securities 1,745,178 6,349,214 8,094,392
Investment in associated companies – 142,066 142,066
Premises and equipment – 1,917,870 1,917,870
Intangible assets – 539,771 539,771
Net pension asset – 1,223,147 1,223,147
Deferred tax assets – 170,736 170,736
Taxation recoverable 23,521 49,065 72,586
Other assets 479,743 15,933 495,676
32,897,495 33,104,081 66,001,576
LIABILITIES
Due to banks 554,135 – 554,135
Customers’ current, savings and deposit accounts 49,496,180 215,402 49,711,582
Other fund raising instruments 2,272,144 314,425 2,586,569
Debt securities in issue 48,444 1,144,508 1,192,952
Net pension liability – 52,595 52,595
Provision for post-retirement medical benefits – 406,171 406,171
Taxation payable 165,493 – 165,493
Deferred tax liabilities 1,784 418,227 420,011
Accrued interest payable 68,591 – 68,591
Other liabilities 1,220,060 212,808 1,432,868
53,826,831 2,764,136 56,590,967

154 155
NOTES TO THE CONSOLIDATED FINANCIAL STATEMENTSFor the year ended September 30, 2016. Expressed in thousands of Trinidad and Tobago dollars ($’000) except where otherwise stated
27 EQUITY COMPENSATION BENEFITS
a) Profit sharing scheme
It is estimated that approximately $89.5 million (2015: $101million) will be allocated to staff from the profit sharing scheme in the
current financial year. The total staff profit sharing for the Group was $127 million (2015: $118 million). Refer to Note 18. During the
2016 financial year, $78 million in advances were made by Republic Bank Limited for purchase of shares to the staff profit sharing
scheme (2015: $67 million).
b) Stock option plan
The Group has a stock option plan for senior executives. Under this arrangement, the holder has the right to purchase a specified
number of ordinary shares of Republic Financial Holdings Limited at a pre-determined price on or before a pre-determined date.
Options are granted only when certain pre-determined individual, corporate and strategic objectives are realised.
The plan provides that the maximum number of ordinary shares that may be purchased on the exercise of options is 7,950,650 shares
and the maximum entitlement for any one executive is no more than 50% of the shares comprising the plan. There is a three-year
waiting period after the grant date of options before the grantee may exercise the right to purchase the shares represented by the
options. The maximum period within which an option may be exercised is ten years.
The option price shall be the Bank’s share price at the beginning of the performance period during which the option is earned. The
price is calculated as the average closing share price on all trading days during the calendar month, prior to the beginning of the
performance period. The process of assessment, calculation of options and approval by the Board of Directors take place in the first
quarter following the end of the financial year.
The movement in outstanding options is outlined below:
Weighted average exercise price Number of shares 2016 2015 2016 2015
At the beginning of the year $93.39 $87.71 1,811,265 1,791,585
Granted $121.74 $110.03 415,912 355,800
Exercised $82.87 $81.67 (275,139) (336,120)
At end of year $100.91 $93.39 1,952,038 1,811,265
Exercisable at end of year $89.85 $83.41 1,022,954 859,349
27 EQUITY COMPENSATION BENEFITS (continued)
b) Stock option plan (continued)
Exercise Expiry date price 2016 2015
15-Dec-18 $78.78 31,841 31,841
20-Dec-19 $90.19 88,127 93,301
20-Dec-20 $86.75 104,156 104,156
20-Dec-21 $80.00 94,324 137,160
20-Dec-22 $101.80 11,876 11,876
13-Dec-23 $85.94 89,551 143,481
8-Dec-24 $72.99 164,363 254,739
14-Dec-25 $92.67 253,673 336,496
14-Dec-26 $104.41 342,415 342,415
11-Dec-27 $110.03 355,800 355,800
11-Dec-28 $121.74 415,912 –
1,952,038 1,811,265
As at September 30, 2016, 415,912 (2015: none) of the outstanding options were anti-dilutive and therefore not included in the
calculation of diluted earnings per share.
The fair value of the stock options has been determined using a binomial option-pricing model. The assumptions used in the
calculation of the fair value are as follows:
Grant date December 18, 2015 to April 2, 2016
Number granted 415,912
Exercise price $121.74
Share price at grant date $111.49 to $112.24
Risk free interest rate 3.5% per annum
Expected volatility 7.5% per annum
Dividend yield 4.0% per annum
Exercise term Option exercised when share price is 150% of the exercise price
Fair value $4.14 to $4.68
The expected volatility is based on historical volatility of the share price over the last five years.
The weighted average share price for share options exercised during the year was $82.70. For options outstanding at September 30,
2016, the exercise price ranged from $72.99 to $121.74 and the weighted average remaining contractual life was 8.9 years.
The total expense for the share option plan was $3.951 million (2015 : $5.735 million).

156 157
NOTES TO THE CONSOLIDATED FINANCIAL STATEMENTSFor the year ended September 30, 2016. Expressed in thousands of Trinidad and Tobago dollars ($’000) except where otherwise stated
28 DIVIDENDS PAID AND PROPOSED
2016 2015
Declared and paid during the year
Equity dividends on ordinary shares:
Final dividend for 2015: $3.10 (2014: $3.00) 502,197 485,129
First dividend for 2016: $1.25 (2015: $1.25) 202,770 202,468
Total dividends paid 704,967 687,597
Equity dividends on ordinary shares:
Final dividend for 2016: $3.10 (2015: $3.10) 503,050 502,197
29 CONTINGENT LIABILITIES
a) Litigation
As at September 30, 2016, there were certain tax and legal proceedings outstanding against the Group. No provision has been made
as professional advice indicates that it is unlikely that any significant loss will arise or that it would be premature at this stage of the
action to determine the eventuality.
b) Customers’ liability under acceptances, guarantees, indemnities and letters of credit
2016 2015
Acceptances 1,050,603 1,108,666
Guarantees and indemnities 277,114 301,161
Letters of credit 231,387 309,110
1,559,104 1,718,937
c) Sectoral information
State 233,463 243,319
Corporate and commercial 1,242,660 1,375,195
Personal 39,736 32,082
Other financial institutions 43,195 52,402
Other 50 15,939
1,559,104 1,718,937
29 CONTINGENT LIABILITIES (continued)
d) Pledged assets
The table below illustrates the distribution of pledged assets in the Group’s consolidated statement of financial position:
Carrying amount Related liability
2016 2015 2016 2015
Financial investments - available-for-sale 3,776,434 3,262,880 3,725,755 1,946,278
The assets pledged by the Group relate to a pool of securities held for the purpose of providing collateral for the counterparty.
Individual securities within the pool may be sold by the Group once the total value of the pool exceeds the value of the liability. In the
event of the Group’s default, the counterparty is entitled to apply the collateral in order to settle the liability.
30 SUBSIDIARY COMPANIES
Country of % equity Name of Company incorporation interest
Republic Bank (Barbados) Limited Barbados 100.00%
Commercial Bank
Republic Bank Trinidad and Tobago (Barbados) Limited Barbados 100.00%
Offshore Bank
Republic Bank (Cayman) Limited Cayman Islands 100.00%
Offshore Bank
Republic Insurance Company (Cayman) Limited Cayman Islands 100.00%
Insurance Company
HFC Bank (Ghana) Limited Ghana 57.11%
Commercial Bank
Republic Bank (Grenada) Limited Grenada 74.12%
Commercial Bank
Republic Bank (Guyana) Limited Guyana 51.00%
Commercial Bank
Atlantic Financial Limited St. Lucia 100.00%
International Business Company
Republic Caribbean Investments Limited St. Lucia 100.00%
Investment Company

158 159
NOTES TO THE CONSOLIDATED FINANCIAL STATEMENTSFor the year ended September 30, 2016. Expressed in thousands of Trinidad and Tobago dollars ($’000) except where otherwise stated
30 SUBSIDIARY COMPANIES (continued)
Country of % equity Name of Company incorporation interest
Republic Suriname Holdings Limited St. Lucia 100.00%
Investment Company
Republic Bank (Suriname) N.V. Suriname 100.00%
Commercial Bank
Republic Bank Limited Trinidad and Tobago 100.00%
Commercial Bank
London Street Project Company Limited Trinidad and Tobago 100.00%
Facilitate Financing of Property Development Projects
Republic Investments Limited Trinidad and Tobago 100.00%
Investment Management Company
Republic Securities Limited Trinidad and Tobago 100.00%
Securities Brokerage Company
Republic Wealth Management Limited Trinidad and Tobago 100.00%
Investment Advisory Company
31 STRUCTURED ENTITIES
The Group sponsors several structured entities which are not consolidated as the Group is not deemed to be in control of those entities.
The Group considers itself to be sponsor of a structured entity when it facilitates the establishment of the structured entity. The Group may
hold an interest in some of these entities but does not provide any financial support to these entities.
These structured entities include Mutual Funds and Retirement Benefit Plans, which are financed through the issue of units to investors
in the funds. The Group generates fees from managing the assets of these funds on behalf of the third party investors. For the year ended
September 30, 2016, the Group earned $8.8 million (2015: $12.7 million) in management fees from the retirement plans and $63.8 million
(2015: $77.1 million) from the mutual funds.
The Group holds an interest of $21.0 million (2015:$20.4 million) in sponsored funds as at September 30, 2016. The maximum exposure to
loss in these funds is the carrying value of the assets held by the Group. These values are all included in the Investment securities portfolio
of the Group as at September 30, 2016.
32 BUSINESS COMBINATIONS AND ACQUISITION OF NON-CONTROLLING INTERESTS
a) Acquisition of HFC Bank (Ghana) Limited in 2015
Over the period November 2012 to September 2013, the Group acquired 39.87% of the outstanding ordinary shares of HFC Bank
(Ghana) Limited; a company based in Ghana and listed on the Ghana Stock Exchange. In May 2015, the Group acquired 17.25% of the
outstanding ordinary shares and obtained control of HFC Bank (Ghana) Limited.
The final fair values of the identifiable assets and liabilities of HFC Bank (Ghana) Limited as at the date of acquisition were:
Fair value recognised on acquisition
Assets
Cash resources 339,331
Investment securities 265,761
Advances 1,277,584
Core deposit intangible (Note 8b) 40,189
Other assets 398,729
2,321,594
Liabilities
Customer deposits and due to banks 1,269,624
Debt securities and other fund raising instruments 499,806
Other liabilities 58,001
1,827,431
Purchase consideration transferred
Total identifiable net assets at fair value 494,163
Non-controlling interests (191,970)
Goodwill arising on acquisition (Note 8a) 231,010
533,203
Purchase Consideration
Amount settled in cash 165,987
Fair Value of previously held investment 367,216
533,203
Analysis of cash flows on acquisition
Net cash acquired (included in cash flows from investing activities) 339,331
Consideration transferred (533,203)
Net cash outflow (193,872)

160 161
NOTES TO THE CONSOLIDATED FINANCIAL STATEMENTSFor the year ended September 30, 2016. Expressed in thousands of Trinidad and Tobago dollars ($’000) except where otherwise stated
32 BUSINESS COMBINATIONS AND ACQUISITION OF NON-CONTROLLING INTERESTS (continued)
a) Acquisition of HFC Bank (Ghana) Limited in 2015 (continued)
The net assets recognised in the September 30, 2015 financial statements were based on a provisional assessment of the fair value of
HFC Bank (Ghana) Limited while the Group sought an independent valuation of the assets. The valuation had not been completed by
the date the 2015 financial statements were approved for issue by the Board of Directors.
In 2016, the valuation was completed and the acquisition date fair value of Core deposit intangibles of $70.4 million was determined,
of which $40.2 million was the Group’s share. Fair value of the land and buildings was $84.6 million, an increase of $22.6 million over
the provisional value, of which $12.9 million was the Group’s share. The 2015 comparative was restated to reflect the adjustment to
the provisional amounts. As a result, there was a reduction in goodwill of $53.1 million, resulting in $231.0 million of total goodwill
arising on acquisition. The increased depreciation charge on the Core deposit intangibles and buildings from the acquisition date to
September 30, 2015 was not material.
b) Acquisition of Republic Bank (Suriname) N.V. in 2015
On July 31, 2015, the Group acquired 100% of the outstanding ordinary shares of RBC Royal Bank (Suriname) N.V., renamed Republic
Bank (Suriname) N.V., through the purchase of Royal Overseas Holdings (St. Lucia) Limited, renamed Republic Suriname Holdings
Limited.
The final fair values of the identifiable assets and liabilities of Republic Bank (Suriname) N.V. as at the date of acquisition were:
Fair value recognised on acquisition
Assets
Cash resources 1,441,598
Investment securities 166,756
Advances 1,424,440
Other assets 280,902
3,313,696
Liabilities
Customer deposits and due to banks 2,948,709
Other liabilities 75,617
3,024,326
Purchase consideration transferred
Total identifiable net assets at fair value 289,370
Goodwill arising on acquisition (Note 8a) (736)
288,634
32 BUSINESS COMBINATIONS AND ACQUISITION OF NON-CONTROLLING INTERESTS (continued)
b) Acquisition of Republic Bank (Suriname) N.V. in 2015 (continued)
Fair value recognised on acquisition
Purchase consideration
Amount settled in cash 288,634
Analysis of cash flows on acquisition
Net cash acquired (included in cash flows from investing activities) 1,441,598
Consideration transferred (288,634)
Net cash inflow 1,152,964
The net assets recognised in the September 30, 2015 financial statements were based on a provisional assessment of the fair value of
Republic Bank (Suriname) N.V. while the Group sought an independent valuation of the assets. The valuation had not been completed
by the date the 2015 financial statements were approved for issue by the Board of Directors.
In 2016, the valuation was completed and the acquisition date fair value of the land and buildings was $80.5 million, an increase of
$51.0 million over the provisional value. Software intangibles of $12.3 million and additional liabilities of $9.4 million were recognised.
The 2015 comparative was restated to reflect the adjustment to the provisional amounts. As a result, there was also a corresponding
reduction in goodwill of $54.0 million, resulting in $0.7 million of total negative goodwill arising on acquisition. The increased
depreciation charge on the buildings from the acquisition date to September 30, 2015 was not material.
c) Acquisition of additional interest in Republic Bank (Grenada) Limited
Over the period July to September 2016, the Group acquired an additional 23.14% interest in the voting shares of Republic Bank
(Grenada) Limited, increasing its ownership interest to 74.12%. Cash consideration of $38.5 million was paid to the non-controlling
shareholders. The following is a schedule of additional interest acquired in Republic Bank (Grenada) Limited:
Cash consideration paid to non-controlling shareholders 38,518
Carrying value of the additional interest in Republic Bank (Grenada) Limited (54,960)
Difference recognised in retained earnings (16,442)

162 163
NOTES TO THE CONSOLIDATED FINANCIAL STATEMENTSFor the year ended September 30, 2016. Expressed in thousands of Trinidad and Tobago dollars ($’000) except where otherwise stated
32 BUSINESS COMBINATIONS AND ACQUISITION OF NON-CONTROLLING INTERESTS (continued)
d) Restatement
In accordance with the provisions of IFRS 3, Business Combinations, the 2015 comparative information was restated based on the final
fair value goodwill adjustments as follows:
As previously HFC Suriname 2015
stated Adjustment Adjustment Restated
Premises and equipment 1,853,964 12,885 51,021 1,917,870
Intangible assets 606,612 (12,885) (53,956) 539,771
Other assets 483,351 – 12,325 495,676
Other liabilities 1,423,478 – 9,390 1,432,868

164
www.republicfinancialholdings.comAnnual Report
2016
C
M
Y
CM
MY
CY
CMY
K
REPUBLIC FINANCIAL HOLDINGS COVER REVISED 1.11.16.pdf 1 11/1/16 10:51 AM