reproductions supplied by edrs are the best that can be .... w-2 participants are assigned to either...
TRANSCRIPT

ED 452 351
AUTHOR
TITLE
-INSTITUTIONREPORT NOPUB DATENOTEAVAILABLE FROM
PUB TYPE
EDRS PRICEDESCRIPTORS
IDENTIFIERS
ABSTRACT
DOCUMENT RESUME
CE 081 555
Stuiber, Paul; Lecoanet, Robin; Lathrop, Jessica; Miller,
David; Russell, Matthew; Schoenbrunn, Rob; Smith, Joshua;
Specht, ChristineWisconsin Works (W-2) Program, Department of WorkforceDevelopment: An Evaluation.Wisconsin State Legislative Audit Bureau, Madison.
WLAB-01-72001-04-00218p.Wisconsin State Legislative Audit Bureau, 22 E. Mifflin St.,
Suite 500, Madison, WI 53703; Tel: 608-266-2818; e-mail:
[email protected]. For full text:
http://www.legis.state.wi.us/Reports/01-7full.pdf.Numerical/Quantitative Data (110) Reports Evaluative
(142)
MF01/PC09 Plus Postage.Adults; Employment Opportunities; *Employment Programs;
Employment Services; *Income; *Job Placement; Job Search
Methods; Job Training; Low Income Groups; *ProgramEffectiveness; Program Implementation; Services; *StatePrograms; Supported Employment; *Welfare Recipients
Self Sufficiency; Welfare to Work Programs
Wisconsin Works (W-2) is a time-limited employmentassistance program that, in September 1997, replaced cash entitlements
provided to low-income families under Aid to Families with Dependent
Children. W-2 provides subsidized or unsubsidized placements for
participants, based upon their level of preparedness for employment.
Participants in both types of placements can receive program services to
assist them in finding or retaining employment, increasing their skills or
wages, and overcoming barriers to employment (such as mental health problems
and substance abuse), as well as health care, food stamps, and subsidized
child care. Implementation of W-2 has resulted in large declines in the
number of individuals receiving cash assistance. From January 1998 through
September 2000, cash assistance caseloads declined more than 50 percent, from
14,204 to 6,771 cases. However, the program's success in achieving economic
self-sufficiency for participants has been mixed. Among 2,129 participants
who left W-2 during the firsts 3 months of 1998, 1,377 filed 1999 Wisconsin
tax returns. Of those who filed, 643, or 47 percent, had incomes above the
federal poverty level when earned income tax credits were included. In
addition, 26 percent of those who left the program from January through March
of 1998 had returned for cash assistance or other services by July 2000.
Legislative challenges to be considered before the next contract period for
W-2, which begins in January 2002, include the problem of returning
participants and those with multiple or severe barriers to employment; how to
best address the needs of those who are nearing time limits on program
participation; and how to assist individuals who have entered the work force
in maintaining their employment, advancing, and raising themselves and their
families out of poverty. (Fifteen appendixes provide statistical information
about the W-2 program and a response to the study from the Wisconsin
Department of Workforce Development.) (KC)
Reproductions supplied by EDRS are the best that can be madefrom the original document.

AN EVALUATION
Wisconsin Works(W-2) Program
Department of Workforce Development
01-7
April 2001
U.S. DEPARTMENT OF EDUCATIONOffice of Educational Research and Improvement
ildCATIONAL RESOURCES INFORMATIONCENTER (ERIC)
This document has been reproduced asreceived from the person or organizationoriginating it.
Minor changes have been made toimprove reproduction quality.
Points of view or opinions stated in thisdocument do not necessarily representofficial OERI position or policy.
1
PERMISSION TO REPRODUCE ANDDISSEMINATE THIS MATERIAL HAS
BEEN GRANTED BY
TO THE EDUCATIONAL RESOURCESINFORMATION CENTER (ERIC)
2001-2002 Joint Legislative Audit Committee Members
Senate Members:
Gary R. George, Co-chairpersonJudith RobsonBrian BurkePeggy RosenzweigMary Lazich
BEST COPY AVAILABLE 2
Assembly Members:
Joseph K. Leibham, Co-chairpersonSamantha StarzykJohn GardDavid CullenJames Kreuser

LEGISLATIVE AUDIT BUREAU
The Bureau is a nonpartisarillegislative service agency responsible for conducting financial and programevaluation audits of state agencies. The Bureau's purpose is to provide assurance to the Legislature thatfinancial transactions and management decisions are made effectively, efficiently, and in compliance withstate law and that state agencies carry out the policies of the Legislature and the Governor. Audit Bureaureports typically contain reviews of financial transactions, analyses of agency performance or public policyissues, conclusions regarding the causes of problems found, and recommendations for improvement.
Reports are submitted to the Joint Legislative Audit Committee and made available to other committees ofthe Legislature and to the public. The Audit Committee may arrange public hearings on the issues identifiedin a report and may introduce legislation in response to the audit recommendations. However, the findings,conclusions, and recommendations in the report are those of the Legislative Audit Bureau. For moreinformation, write the Bureau at 22 E. Mifflin Street, Suite 500, Madison, WI 53703, call (608) 266-2818,or send e-mail to [email protected]. Electronic copies of current reports are available on lineat www.legis.state.wi.us/lab/windex.htm.
State Auditor - Janice Mueller
Editor of Publications - Jeanne Thieme
Audit Prepared by
Paul Stuiber, Director and Contact PersonRobin LecoanetJessica LathropDavid MillerMatthew RussellRob SchoenbrunnJoshua SmithChristine Specht
3

CONTENTS
Letter of Transmittal 1
Summary 3
Introduction 11
Program Funding 12
Participant Eligibility and Characteristics 13
Contracting with Local Providers 16
Types of Services Provided 18
Trends in Program Participation 22
Program Expenditures 27
Initial Contract Expenditures 28Unspent Contract Funds 32
Current Contract Expenditures 38Performance Bonuses 40
Program Effectiveness 43
Financial Status of Former ParticipantsReturning Participants
Factors Influencing the Effectiveness of Services
4349
53
Sanctions of Participant Benefits 53Resolution of Participant Complaints 59Trial Job Wages 62
Measuring Performance and Providing Oversight 67
Performance Standards 67Milwaukee County Oversight 70
Assessing Contract Performance 71
Improving Oversight of PIC Activities 74
Future Considerations 77
Assessing Barriers to Employment 78Addressing the Needs of Participants Nearing Eligibility Limits 80Considering Future Program Modifications 85
4

Appendix 1Profiles of 17 W-2 Agencies
Appendix 2Percentage of Participants Receiving Employment-Related ServicesUnder Current Implementation Contracts
Appendix 3Percentage of Participants Receiving Education and Training ServicesUnder Current Implementation Contracts
Appendix 4Percentage of Participants Receiving Assessment and CounselingServices Under Current Implementation Contracts
Appendix 5W-2 Agencies' Caseloads
Appendix 6W-2 Agencies' Contract Amounts, Reported Expenditures, Profits, andReinvestment Under Initial Implementation Contracts
Appendix 7Reported Expenditures by Type Under Initial Implementation Contracts
Appendix 8Expenditures of Community Reinvestment Funds
Appendix 9Current Contract Amounts, Reported Expenditures, and PotentialBonuses and Reinvestment
Appendix 10Reported Expenditures by Type Under Current Implementation Contracts
Appendix 11Performance Bonus Criteria
Appendix 12Performance Bonuses Earned and Standards Met Under CurrentImplementation Contracts
Appendix 13Income and Poverty Status of Former W-2 Participants
Appendix 14Returning Participants by W-2 Agency
Appendix 15Response from the Department of Workforce Development
5

State of Wisconsin LEGISLATIVE AUDIT BUREAU
April 10, 2001
Senator Gary R. George andRepresentative Joseph K. Leibham, Co-chairpersonsJoint Legislative Audit CommitteeState CapitolMadison, Wisconsin 53702
Dear Senator George and Representative Leibham:
JANICE MUELLERSTATE AUDITOR
22 E. MIFFLIN ST., STE. 500MADISON, WISCONSIN 53703
(608) 266-2818FAX (608) 267-0410
We have completed our evaluation of the Wisconsin Works program (W-2), as required bys. 49.141(2g)(a), Wis. Stats. This is the sixth and final report issued under that requirement.
W-2 is a time-limited employment assistance program administered by the Department of WorkforceDevelopment. It replaced cash entitlements provided to low-income families under Aid to Familieswith Dependent Children in September 1997. Through September 2000, W-2 program costs totaled$710.4 million, of which 93.6 percent was spent by local public and private contractors for programservices; benefits, and administration.
Implementation of W-2 has resulted in large declines in the number of individuals receiving cashassistance. From January 1998 through September 2000, cash assistance caseloads declined morethan 50 percent, from 14,204 to 6,771 cases. However, the program's success in achieving economicself-sufficiency for participants has been mixed. Among 2,129 participants who left W-2 during thefirst three months of 1998, 1,377 filed 1999 Wisconsin tax returns. Of those who filed, 643, or46.7 percent, had incomes above the federal poverty level when earned income tax credits wereincluded. In addition, we found that 26.1 percent of those who left the program from January throughMarch of 1998 had returned for cash assistance or other services by July 2000.
Before the start of a new contract period, which is scheduled to begin January 2002, the Department andthe Legislature will need to consider challenges posed by returning participants and those with multipleor severe barriers to employment; how to best address the needs of those who are nearing time limits onprogram participation; and how to assist individuals who have entered the workforce in maintainingtheir employment, advancing, and raising themselves and their families out of poverty.
We appreciate the courtesy and cooperation extended to us by the Department of WorkforceDevelopment and staff of the many W-2 agencies we contacted during the course of our review. TheDepartment's response is Appendix 15.
Respectfully submitted,
Janice MuellerState Auditor
JM/PS/ao
6

Summary
The Wisconsin Works program, more commonly known as W-2, wascreated by 1995 Wisconsin Act 289 to help participants achieveeconomic self-sufficiency through employment. It took effect statewidein September 1997. W-2 participants, who are primarily women withdependent children, are not entitled to cash benefits as they would havebeen under Aid to Families with Dependent Children (AFDC). Instead,they earn wages or receive cash grants and other program services basedon their employment status. Through September 2000, W-2 programcosts have totaled $710.4 million and have been funded by state generalpurpose revenue and federal Temporary Assistance for Needy Families(TANF) block grant funds. This evaluation of the history andeffectiveness of the W-2 program is the sixth and last in a series ofreports we have conducted, as required by Wisconsin law.
Program participants receive services from counties, private agencies,and tribes under the terms of contracts the agencies signed with the stateagency responsible for administering W-2, the Department ofWorkforce Development (DWD). To receive cash benefits under W-2,applicants must meet two financial eligibility requirements:
the family gross income must be at or below115 percent of the federal poverty level, whichis currently $16,825 for a family of three; and
the family must have assets at or below $2,500,excluding the combined equity of vehicles valuedat up to $10,000 and one home that serves as thehomestead.
W-2 participants are assigned to either subsidized or unsubsidizedplacements, based upon their level of preparedness for employment.Subsidized placements include:
transitional placements, which provide work practiceand training for participants who are unable toperform independent, self-sustaining work or workassociated with community service or trial jobs, andfor which the monthly benefit is a cash grant of$628;
7

community service jobs, which provide workexperience and training to participants who areable to perform some job duties and are expectedto eventually move into trial jobs or unsubsidizedemployment, and for which the monthly benefit isa cash grant of $673; and
trial jobs, which provide work experience andtraining and may become permanent, unsubsidizedpositions, and for which the participant earns notless than the state or federal minimum wage forevery hour worked, and the employer receives asubsidy of no more than $300 per month for eachparticipant who works full-time.
In addition, custodial parents of infants are not required to work outsideof the home until the infants are older than 12 weeks. They receive amonthly cash grant of $673.
Participants in unsubsidized placements earn market wages and do notreceive additional cash benefits. However, participants in bothsubsidized and unsubsidized placements are eligible to receive programservices that are intended to assist them in finding or retainingemployment, increasing their skills or wages, and overcoming barriersto employment that can include mental health problems and substanceabuse. In addition, most participants are also eligible for servicesthrough other public assistance programs, including health care throughMedical Assistance, food stamps, and subsidized child care through theWisconsin Shares program.
In general, W-2 participants who are ready for unsubsidizedemployment receive fewer services than those who have more barriersto employment and who remain in the program for a longer period oftime. However, the type and amount of services provided to participantsvaries from agency to agency.
Of all the services provided, only employment search services wereprovided to more than half of all those served by W-2 agencies in 2000:a total of 21,497 individuals, or 61.0 percent of those enrolled in eitherW-2 or the Food Stamp Employment and Training (FSET) program,whose participants are also served by W-2 agencies under their contractswith the State, searched for employment with the assistance of a W-2agency. The only other services that were provided to more than20 percent of all participants were adult basic education, which wasprovided to 31.6 percent of all participants, and motivational training,which was provided to 25.1 percent.
4

It was expected that caseloads would decline in the transition fromAFDC to W-2, but they did so much faster than had been projected.In three years, the decline was 50.9 percent, from 22,761 inSeptember 1997 to 11,171 in September 2000. The most significantdecline has been in the cash benefit caseload; that is, among participantsin the program's three categories of subsidized job placementtransitional placements, community service jobs, and trial jobsandcustodial parents of infants. In contrast to the decline in the numberof individuals receiving cash benefits, the number receiving casemanagement servicessuch as education and training services,counseling, and various assessment serviceshas generallyincreased since the beginning of the program. In September 2000,4,400 participants received case management but not cash assistance.
During the program's initial contract period, from September 1997through December 1999, a total of $651.5 million was budgeted forW-2, and $413.6 million was spent. Approximately 50 percent of thefunds the local agencies received was spent on services for programparticipants, 40 percent for the payment of cash benefits, and almost10 percent for administration. However, a controversial aspect of localadministration of the program during the initial contract period was theagencies' ability to retain a portion of unspent contract funds as profits.
Largely because of the unanticipated decline in caseloads,$237.9 million in funds that had been contracted remained unspent.Contracts called for the majority of the unspent funds to be returned tothe local agencies, which were allowed to retain a portion of these fundsas unrestricted profits that could be spent for a variety of purposes, andas restricted profits, known as community reinvestment funds, that mustbe spent on TANF-eligible individuals.
Under the terms of the initial implementation contracts, W-2 agencyprofits totaled $65.1 million. The agency with the largest profitEmployment Solutions, Inc., a private agency serving a portion ofMilwaukee Countyreceived $9.5 million. The agency with thesmallest profitPepin Countyreceived $42,071. Private agencies arenot under any contractual or legal obligation to disclose the way inwhich their unrestricted profits were used.
In site visits to 17 public and private agencies, we asked about profituse. We found that most public agencies reported using their profits tooffset county property tax levies or to provide various services to low-income residents. The private agencies' uses of profits varied, but someprofits were used to expand businesses serving low-income persons orfor a variety of education and training activities.
5
Community reinvestment funds earned by W-2 agencies under theinitial implementation contracts totaled $83.4 million. These funds maybe used to provide services to families whose incomes are below200 percent of the federal poverty level, which is currently $29,260annually for a family of three. The allowable uses of communityreinvestment funds are numerous and include supplementing agencybudgets under the current implementation contracts, providingtransportation services, providing counseling services not covered byMedical Assistance, and expanding services to address cultural andlanguage barriers. Marinette County has spent all of its communityreinvestment funds, while 15 agencies reported no expenditures throughSeptember 2000. Overall, W-2 agencies spent $14.2 million, or17.0 percent of the community reinvestment funds they received undertheir initial implementation contracts, through September 2000. Twoprivate W-2 agencies in Milwaukee CountyEmployment Solutionsand Opportunities Industrialization Center of Greater Milwaukeehaveagreed to provide a portion of their community reinvestment funds,$3.8 million and $300,000, respectively, to Milwaukee County.
In order to improve agency performance, and in response to concernsabout the $65.1 million of profits paid, DWD developed sevenperformance standards for the current contract period with the intentionof ensuring monetary incentives are related to performance and not thelevel of unspent funds. Further, DWD and the Legislature reducedamounts provided in the current contract period to reflect lower-than-anticipated caseloads and the shorter time period of the contracts.Current W-2 contracts, which began on January 1, 2000 and areeffective through December 31, 2001, total $369.3 million. Duringthis period, up to $25.9 million will be available to local agenciesfor performance bonuses if the performance measures are met. InMarch 2001, DWD announced that all but two agenciesBayfieldand Menominee countieswere meeting or exceeding base-levelperformance measures.
To evaluate the program's effectiveness in meeting its primaryobjectivehelping participants achieve self-sufficiency thoughemploymentwe reviewed the income of all participants who left theprogram in the first quarter of 1998 and, with the assistance of theDepartment of Revenue, matched this population with those who filed1999 Wisconsin income tax returns. During the first quarter of 1998,2,129 participants left the W-2 program. Of this group, 64.7 percentfiled 1999 Wisconsin income tax returns. The average income reportedby the former W-2 participants was $11,988.
When only this income is considered, 33.8 percent of these filers wereabove the federal poverty level for their respective family size, while66.2 percent were below it. However, the incomes of many former W-2participants who filed 1999 tax returns were enhanced by receipt of stateand federal earned income tax credits. If the value of these credits is
6
10

included, 46.7 percent of former W-2 participants were above thefederal poverty level in 1999. It should be noted, however, that thisfigure does not take into account the more than one-third of our originalsample who did not file tax returns. Those who did not file presumablywere not required to do so based on their limited income, because theywere no longer Wisconsin residents, because they became eligible forSupplemental Security Income, or because they were supported a spouseor other adult in the household.
The highest average incomes were reported by former W-2 participantswho received only case management services before obtainingunsubsidized employment. Maximus, a private agency serving a portionof Milwaukee County, and Brown County had the largest percentage offormer participants above the poverty level at 55.3 percent and53.3 percent, respectively, when the value of state and federal earnedincome tax credits was included.
Despite the significant decline in the program's caseload, there areindications that at least a portion of former participants are returning toW-2. DWD officials indicate that the extent to which participants returnto the program may not be a good measure of success because theprogram is designed to encourage employment, and returning to theprogram for services may assist participants in achieving the long-termgoal of economic self-sufficiency. However, analyzing changes in thenumber of returning participants over time, the frequency with whichthey return, and the reasons for which they originally left provideinformation useful in assessing program effectiveness, as well asimproving service delivery. Furthermore, an understanding of thecharacteristics of returnees may be useful in modifying the program toaddress new or special participant needs that present barriers toemployment.
By July 2000, 26.1 percent of 2,129 former participants who had left theprogram during the first three months of 1998 participated again inreopened cases. The percentage of participants who returned throughJuly 2000 ranged from a high of 43.3 percent for OpportunitiesIndustrialization Center of Greater Milwaukee, a private agency, to alow of 7.7 percent for Sawyer County. Of the 555 cases that werereopened, 409, or 73.7 percent, returned in a subsidized job placement,while 146, or 26.3 percent, returned in an unsubsidized placement inorder to receive case management services. Milwaukee County had agreater percentage of returning participants than the balance of state.
In July 2000, Milwaukee County accounted for 85.2 percent of allreturning participants statewide. Returning participants had been2.7 percent of all Milwaukee County participants in July 1998 but were42.4 percent of all Milwaukee County Participants by July 2000. In therest of the state, returning participants increased from 9.7 to 25.0 percentof all W-2 participants.
7

W-2 agencies also exercise considerable discretion in sanctioningparticipants' cash benefits if they miss work or fail to participate in arequired activity without good cause. The percentage of participantssanctioned has decreased from 31.4 percent of the statewide caseload inOctober 1999 to 21.1 percent in December 2000. However, inMilwaukee County the sanction rate has consistently beenapproximately 10 percentage points higher than in the balance of thestate. Four of the five agencies serving Milwaukee County sanctionedmore than 20 percent of participants receiving cash assistance fromOctober 1999 through December 2000.
W-2 was designed to provide individual W-2 agencies the flexibilitythey need to modify the type of services they provide and the manner inwhich services are provided. However, the wide variation in the numberand amount of sanctions raises concerns about the equitable treatment ofparticipants. Further, we found several instances of sanctions beinginappropriately applied: at least 35 participants who were the custodialparents of infants were inappropriately sanctioned from July throughDecember 2000 because of errors made by local W-2 agencies.Maximus and Employment Solutions issued the largest inappropriatesanctions to new mothers, representing more than one-third of theseparticipants' full monthly benefit of $673. DWD is in the process ofattempting to identify other instances in which inappropriate sanctionswere imposed and ensuring W-2 agencies issue supplemental paymentsto those affected.
Program participants and applicants can follow a fact-finding andappeal process if they wish to have their eligibility or benefit decisionsreviewed. The majority of requests for findings of fact have been relatedto employment issues, such as disputes about participation in anassigned W-2 activity. We analyzed data for all fact-finding requestssince they have been collected and found decisions by W-2 agencieswere fairly evenly divided between those in favor of the petitionerand those in favor of the agency. Most fact-finding requestsapproximately 90 percentwere made by Milwaukee Countyparticipants.
Both participants and W-2 agencies may appeal fact-finding decisions.We reviewed all cases that were appealed to the Department ofAdministration's Division of Hearings and Appeals. Through December2000, 216 cases were appealed, and hearing officers decided in favor ofthe applicant or participant 69.9 percent of the time. The percentage ofMilwaukee County cases found in favor of the participants was78.7 percent, compared to 51.0 percent for the balance of the state. Thismay suggest that hearing officers believed fact-finding decisions haveincorrectly favored the W-2 agencies more often in Milwaukee Countythan elsewhere in the state.
8
12
We reviewed selected aspects of local agency administration of the W-2program, including how local agencies are planning for thoseparticipants who are approaching state and federally imposed time limitsplaced on the receipt of W-2 services. Two separate provisions limit thelength of participation in W-2: a 24-month limit within each of the threetypes of job categories, and a 60-month lifetime limit on receipt ofprogram benefits. Through June 2000, 1,551 W-2 participants wereapproaching the 24-month limit. Through November 2000, 68 wereapproaching the 60-month lifetime limit, which will be reached inSeptember 2001 for those who have been in the program since itsinception. Extensions may be granted to these time limits, but agenciesvaried widely in how frequently they requested them. MilwaukeeCounty agencies with the largest caseloads have requested extensions totime limits less frequently than other W-2 agencies. W-2 agenciesoutside of Milwaukee County requested extensions for 53.6 percent oftheir participants. In contrast, Milwaukee County agencies requestedextensions for 13.4 percent of their participants.
Developing strategies to increase incomes above the poverty level forformer W-2 participants, addressing the needs of returning participants,and responding to a possible downturn in the economy will all beimportant to ensuring the future success of the W-2 program. However,there are other challenges facing DWD and the Legislature, includingoverseeing the complex administration of the program in MilwaukeeCounty, which has the highest caseload and the greatest number ofagencies administering services. While a private agency, the PrivateIndustry Council (PIC) of Milwaukee County, has been paid$5.7 million in program funds to provide monitoring and oversightservices, the local W-2 agencies have generally been critical of itsperformance and, until recently, DWD provided it with little direction infulfilling its responsibilities. The Governor's 2001-03 Biennial BudgetProposal includes $500,000 annually to continue the PIC's role in W-2monitoring and oversight, and an additional $500,000 annually forunspecified oversight activities to be conducted by DWD or privatecontractors. The Legislature will need to determine the amount offunding it wishes to appropriate for monitoring and oversightresponsibilities, and the role of DWD in ensuring effective use of thesefunds.
Several other issues will warrant legislative consideration, including:
whether to modify proposed performance standardsfor the next contracts with W-2 agencies, which willrun from January 2002 through December 2003, tobest ensure bonuses are based on efforts to assistparticipants in attaining self-sustaining employment;
9

whether the challenges posed by participants withbarriers to employment, such as limited education orsubstance abuse problems, are being addressedadequately;
how best to address the needs of participants whoare nearing the time limits established for receipt ofservices;
developing strategies to ensure all contract funds arespent appropriately;
ensuring all participants are aware of and haveaccess to other programs, such as MedicalAssistance, the Food Stamp Program, subsidizedchild care, and other supportive services;
determining whether to consolidate the contracts toadminister the program in Milwaukee County toimprove performance and provide administrativeefficiencies; and
how best to assist those who have entered theworkforce but remain in poverty to become fullyself-sufficient.
10
14

Introduction
The W-2 programattempts to helpparticipants achieveself-sufficiency throughemployment.
The Wisconsin Works program, more commonly known as W-2, wascreated by 1995 Wisconsin Act 289 to help participants achieveeconomic self-sufficiency through employment. It took effect statewidein September 1997. W-2 participants, who are primarily women withdependent children, are not entitled to cash benefits as they would havebeen under Aid to Families with Dependent Children (AFDC); instead,they earn wages or receive cash grants and other program services basedon their employment status. The program also provides job-search andother employment assistance, education and training, and help inovercoming barriers to employment. Its participants are eligible toreceive additional benefits through Medical Assistance, the Food StampProgram, and the State's subsidized child care program. There is a60-month lifetime limit on program benefits under both federal and statelaw.
W-2 and programs that preceded it have served as prototypes forwelfare reform nationally; influenced development of the federalTemporary Assistance for Needy Families (TANF) program, whichreplaced AFDC; and received the 1999 Innovations in AmericanGovernment Award from the Ford Foundation and the Kennedy Schoolof Government at Harvard University. W-2 is administered at the statelevel by the Department of Workforce Development (DWD) and locallyby public and private contractors, who spent a total of $413.6 million instate and federal funds to implement the program from September 1997through December 1999. Current W-2 contracts, which are effectivethrough December 31, 2001, total $369.3 million.
This report is the sixth and last in a series evaluating the W-2 program,as required by s. 49.141(2g)(a), Wis. Stats. The others include areview of first-year W-2 expenditures (report 99-3); a report on theadministration of W-2 by Maximus, Inc., a private contractor inMilwaukee County; an evaluation of the Food Stamp Program(report 00-8); a report on Wisconsin Shares, the State's child caresubsidy program (report 01-1); and a report on the administration ofW-2 by Employment Solutions, Inc., and 15 other agencies.
As part of our final evaluation under the statutory requirement, wereviewed:
available data on program participants, includingtrends in program participation;
11
15

Through FFY 2001-02,approximately$317.0 million in federalblock grant funds isavailable annually.
program expenditures under both the initialimplementation contracts that ended inDecember 1999 and the current contracts thatexpire in December 2001, including thedevelopment of performance bonuses that arelinked to meeting specific standards;
both the provision and the effectiveness of servicesunder the first W-2 contracts, including wages paidto W-2 participants and the extent to which formerparticipants remain in poverty;
management oversight of the program; and
funding and policy issues affecting the program thatwill require consideration by the Legislature andDWD.
In conducting this evaluation, we analyzed program budgets,expenditures, and caseload reports and interviewed officials and staff ofDWD and W-2 agencies that administer the program locally. We alsomade site visits to 17 W-2 agencies, including all 5 of the agencies thatadminister the program in Milwaukee County. In addition, we reviewedsurveys conducted by DWD and the University of Wisconsin-Extensionconcerning the status of individuals who left W-2, and we analyzed datafrom 1999 state income tax returns filed by former W-2 participants.
Program Funding
Before W-2 was implemented statewide in September 1997, the federalgovernment replaced AFDCwhich had served essentially the samepopulation now served by W-2with the TANF block grants that funda significant portion of program costs. Under AFDC, Wisconsin hadbeen reimbursed approximately 58 percent of program costs on amatching basis, with no limit on the amount of state expenditureseligible for reimbursement. In federal fiscal year (FFY) 1995-96, the lastfull year of AFDC, Wisconsin received $217.0 million in federal fundsto support AFDC and the Job Opportunities and Basic Skills program,an employment and job training program for AFDC recipients. TANFlegislation provides the State with the potential to obtain approximately$317.0 million in block grant funding for W-2 and other programs ineach year of a six-year period that ends with FFY 2001-02. The otherprograms funded by TANF include child care subsidies; emergencyassistance; and programs administered by the Department of Health andFamily Services and other state agencies, such as Kinship Care, HeadStart, child abuse and neglect prevention, and assistance for homelesspersons.
12
16

Current GPR and federalfunding for W-2 andother TANF-fundedprograms totals$485.9 million.
To receive these federal funds, the State must document that it hasmaintained the level of support provided in FFY 1993-94 under AFDCand related programs. However, this maintenance of effort funding levelcan be reduced if minimum work participation rates are met. DWDestimates the requirement for FFY 2000-01 to be approximately$168.9 million, which is funded primarily with general purpose revenue(GPR). This amount, combined with the $317.0 million in federal fundsavailable each year, results in available funding of approximately$485.9 million for W-2 and other TANF-funded programs inFFY 2000-01.
Participant Eligibility and Characteristics
To receive cash benefits under W-2, applicants must meet two financialeligibility requirements:
the family gross income must be at or below115 percent of the federal poverty level, which iscurrently $16,825 for a family of three; and
the family must have assets at or below $2,500,excluding the combined equity of vehicles valued atup to $10,000 and one home that serves as thehomestead.
In addition, the applicant must:
be a custodial parent who is 18 years of age or older;
be a United States citizen or a qualifying alien;
have residence in Wisconsin;
cooperate with efforts to establish paternity for anyminor child and to obtain support or other paymentsor property to which the applicant and any minorchild may have rights;
have made a good-faith effort to obtain employment;and
not receive either Supplemental Security Income(SSI), state supplemental payments, or SocialSecurity Disability Income (SSDI).
13
17
Employment placementsmay be either subsidizedor unsubsidized.
Participants are eligiblefor services throughW-2 and other publicassistance programs.
In July 2000, 48.3 percentof W-2 participants had ahigh school education ormore.
W-2 participants are assigned to either subsidized or unsubsidizedplacements, based upon their level of preparedness for employment.Subsidized placements include:
transitional placements, which provide work practiceand training for participants who are unable toperform independent, self-sustaining work or workassociated with community service or trial jobs, andfor which the monthly benefit is a cash grant of $628;
community service jobs, which provide workexperience and training to participants who are ableto perform some job duties and are expected toeventually move into trial jobs or unsubsidizedemployment, and for which the monthly benefit is acash grant of $673; and
trial jobs, which provide work experience andtraining and may become permanent, unsubsidizedpositions, and for which the participant earns notless than the state or federal minimum wage forevery hour worked, and the employer receives asubsidy of no more than $300 per month for eachparticipant who works full-time.
In addition, custodial parents of infants are not required to work outsideof the home until their infants are older than 12 weeks. They receive amonthly cash grant of $673.
Participants in unsubsidized placements earn market wages and donot receive additional cash benefits. However, participants in bothsubsidized and unsubsidized placements are eligible to receive programservices that are intended to assist them in finding or retainingemployment, increasing their skills or wages, and overcoming barriersto employment that can include mental health problems and substanceabuse. In addition, most participants are also eligible for servicesthrough other public assistance programs, including health care throughMedical Assistance, food stamps, and subsidized child care through theWisconsin Shares program.
Since W-2 was created, the majority of participants have been womenbetween 18 and 29 with limited education and an average of twochildren. As shown in Table 1, which profiles participants in July 2000,39.0 percent of W-2 participants had a high school diploma or itsequivalent, and 9.3 percent had some post-secondary education.Although most W-2 participants were also eligible for child caresubsidies and services through Medical Assistance and the Food StampProgram, the extent to which eligible participants received these
14
18

Table 1
Profile of W-2 ParticipantsJuly 2000
Description NumberPercentage
of Total Description NumberPercentage
of Total
Age of Participants Level of Education
Under 18 2 <0.1% No formal education 114 1.1%
18 to 29 6,432 60.2 Grade 8 or less 386 3.6
30 to 49 4,126 38.6 Some high school 5,030 47.0
50 to 64 127 1.2 High school* 4,168 39.0
65 and Over 0 0.0 Some post-secondary 989 9.3
Total 10,687 100.0% Total 10,687 100.0%
Gender of Participants Household Status
Female 10,312 96.5% One parent 10,454 97.8%
Male 375 3.5 Two parents 167 1.6
Total 10,687 100.0% Unknown 66 0.6
Total 10,687 100.0%
Ethnicity of Head of Assistance Group Assistance Group Size
African American 6,056 56.7% 1 person 46 0.4%
White 2,226 20.8 2 persons 3,882 36.3
Other 1,265 11.9 3 persons 3,205 30.0
Hispanic 879 8.2 4 or more persons 3.554 33.3
Asian 131 1.2 Total 10,687 100.0%
American Indian 130 1.2
Total 10,687 100.0%
Eligibility for Support Services** Disability Status
Medical Assistance 10,419 97.5% Reported disability 278 2.6%
Food stamps 8,959 83.8 No reported disability 10.409 97.4
Child care subsidy 5,096 47.7 Total 10,687 100.0%
* Includes those who graduated from high school and those who have completed the equivalent of a high schooleducation.
** For those individuals who requested their eligibility to be determined.
19
Five private agencieshave contracted toadminister W-2 inMilwaukee County.
benefits is not known. However, nearly all W-2 participants are alsoenrolled in Medical Assistance.
Contracting with Local Providers
To implement W-2 on the local level, DWD entered into contracts withcounty social service agencies, private agencies, and tribes to provideservices that include:
an initial determination of each applicant's eligibilityfor W-2 and other assistance programs, along withan assessment of the type of W-2 placement throughwhich each participant would best be served andother potential service needs;
general employment-related services, such asassistance in searching for a job;
education and training services, including adult basiceducation, job skills training, and related services;and
additional assessment and counseling services, suchas disability assessments, substance abusecounseling, and occupational counseling.
Contracts also cover the cash grants paid to participants assigned tocommunity service and transitional placements, as well as to custodialparents of infants who are not required to work outside the home, wagesubsidies for participants in trial jobs, and the agencies' administrativecosts.
In most counties, the social service agency has contracted with DWD toprovide W-2 services. For those counties that did not meet performancestandards or did not wish to become W-2 contractors, DWD developed acompetitive process for awarding program implementation contracts.Milwaukee County, which has Wisconsin's largest public assistancecaseload, did not meet eligibility standards related to the percentage ofadult AFDC recipients working in unsubsidized employment and thepercentage of adult AFDC recipients participating in the JobOpportunity and Basic Skills program, and chose not to compete with anumber of private organizations for contract implementation. In 1997,DWD divided Milwaukee County into six regions to facilitate access toservices and accepted bids to administer W-2 separately in each of thesix regions. Five private agencies won those bids: EmploymentSolutions, Inc.; Maximus, Inc.; Opportunities Industrialization Center ofGreater Milwaukee (OIC-GM); United Migrant Opportunity Services(UMOS); and YW Works.
16
20

The initial contractperiod was September 1997through December 1999.
The current contractperiod is January 2000through December 2001.
DWD's start-up contracts with W-2 agencies included costs related tohiring and training staff, renting or purchasing facilities, developing aplan for moving participants from AFDC to W-2, developing proceduresfor resolving disputes between contractors and W-2 participants, andcomputer-related expenses. The start-up contracts were budgeted at$34.1 million during the six months before W-2 was implementedstatewide in September 1997. A total of $31.3 million was spent onthese activities through August 1998, the deadline for reportingallowable start-up expenditures.
The initial implementation contracts covered the 28-month period fromSeptember 1997 through December 1999. During this period, a total of$651.5 million was budgeted and $413.6 million was spent by75 contracted agencies, including:
58 county social service agencies;
13 private agencies, 4 of which were for-profitorganizations, for administration of W-2 in Forest,Juneau, Kewaunee, Milwaukee, Oneida, Shawano,Vilas, Walworth, and Waukesha counties;
3 tribesthe Bad River and Lac du Flambeau bandsof Chippewa and the Oneida Nationthatparticipated in the State's W-2 program; and
1 consortium of county social service agencies, foradministration of W-2 in Grant, Green, Iowa,Lafayette, and Richland counties.
The current implementation contracts cover the 24-month period fromJanuary 2000 through December 2001. For this contract period,$369.3 million has been budgeted. Through September 2000,$121.4 million has been spent by 72 contracted agencies, including:
56 county social service agencies;
13 private agencies, 3 of which are for-profitorganizations, for administration of W-2 in Florence,Forest, Juneau, Kewaunee, Milwaukee, Monroe,Oneida, Shawano, Vilas, Walworth, and Waukeshacounties;
2 tribesthe Bad River Band of Chippewa and theOneida Nationthat continued participating in theState's W-2 program; and
17

The largest percentageof participants receivedemployment searchservices
1 consortium of county social service agencies, foradministration of W-2 in five countiesGrant,Green, Iowa, Lafayette, and Richland counties.
W-2 agencies provide services to participants directly through their ownstaff and by subcontracting with other organizations. DWD tracksexpenditures for services by function but does not track expendituresbased on who provided services. However, among the 17 W-2 agencieswe visited during the course of our review, we determined that13.2 percent of the $337.2 million these agencies spent under initialimplementation contracts was for participant services provided bysubcontractors. Two agencies recorded no expenditures forsubcontracted services: Price County, and Forward Service Corporation,which served Vilas County. In contrast, 56 percent of Monroe County's$1.3 million in total expenditures was for subcontracted services.Information on each of the 17 agencies' program implementation effortsduring the initial and current contract periods, including anyexpenditures for subcontracting, is included in agency profiles that areAppendix 1.
Types of Services Provided
In general, W-2 participants who are ready for unsubsidizedemployment receive fewer services than those who have more barriersto employment and who remain in the program for a longer period oftime. However, the type and amount of services provided to participantsvaries from agency to agency. In addition, the W-2 services thatparticipants receive may be supplemented by services they receivethrough other programs, such as Wisconsin's Workforce Attachmentand Advancement program, which provides training to allowadvancement into higher-paying jobs and helps employers retainworkers and upgrade their skills, and the Workforce Investment Act,which consolidated several federal job training programs in order toincrease the employment, job retention, earnings, and occupationalskills of program participants.
As shown in Table 2, only employment search services were provided tomore than half of all those served by W-2 agencies in 2000: a total of21,497 individuals, or 61.0 percent of those enrolled in either W-2 or theFood Stamp Employment and Training (FSET) program, searched foremployment with the assistance of a W-2 agency. This is a 12.1 percentincrease over the number who participated in an employment search in1999, but 5.1 percent fewer than had participated in 1998. In addition,25.1 percent of W-2 and FSET participants received motivationaltraining, a 15.5 percent increase over the number receiving this trainingin 1999, and 13.9 percent more than had received this training in 1998.
18

Activity
Table 2
Types of W-2 Services2000
Number PercentageReceiving Service* Receiving Service
General Employment ServicesEmployment search 21,497 61.0%Motivational training 8,841 25.1
Education and Training ServicesAdult basic education 11,142 31.6High school equivalency 6,412 18.2
Job skills training 4,867 13.8
Parenting and life skills 3,655 10.4
English as a second language 886 2.5Driver education 186 0.5
Technical college courses** 99 0.3
Other post-secondary education 5 <0.1
Additional Assessment and Counseling Services***Occupational assessment 3,990 11.3
Physical rehabilitation 3,896 11.1
Employment counseling 3,052 8.7
Disability assessment 2,771 7.9Mental health counseling 2,129 6.0Alcohol and other drug abuse counseling 899 2.6
* The number of individuals within each activity is unduplicated, although an individual may have participated inmore than one activity.
** Began reporting this activity in March 2000.*** Includes approved W-2 activities for increasing employability that may be paid for by other programs.
Contracts between DWD and the W-2 agencies require the agencies toprovide services to FSET program participants, who may not be eligiblefor W-2 because they have no dependents but are required to work andattend training as a condition of receiving food stamp benefits. It shouldbe noted that the needs of FSET and W-2 participants can be different.
19
f)3

Education and trainingservices were provided tosmaller percentages ofparticipants.
Some approved W-2services are paid for byprograms such asMedical Assistance.
For example, W-2 participants are more likely than FSET participantsto:
need additional training to become employable,largely because they often have less workexperience;
retain jobs for longer periods of time and changejobs less frequently;
more actively engage in program activities and keepin contact with their caseworkers;
have a formal education; and
be interested in receiving job-related skills trainingor broad-based educational opportunities, rather thanfocused on finding immediate employment.
Educational services that were less directly related to employment, suchas parenting and life skills or driver education training, were provided toa much smaller group of participants. In part, this is because W-2agencies tend to focus on short-term training that is directly related toemployment in order to satisfy federal TANF rules, which generallyrequire any educational activities to contribute directly to a participant'semployability. For example, as part of their participation requirements,individuals in community service jobs or transitional placements may berequired to pursue high school equivalency degrees, enroll in technicalcollege courses, or participate in adult basic education or English as asecond language classes. In addition, participants in trial jobs or inunsubsidized positions may participate in such activities if a formalassessment determines they are in need of basic education and they wishto pursue it. However, only seven agencies provided technical collegecourses or other post-secondary education opportunities to more than1 percent of their participants in 2000, and only Maximus enrolled morethan 15 participants in these activities.
Participants with personal barriers to employment, such as a disabilityor a substance abuse problem, are provided with additional assessmentand counseling services, some of which may be approved as W-2services but funded by other programs, such as Medical Assistance.Specialized assessment and counseling services such as substance abuseand mental health counseling, disability assessments, and physicalrehabilitation services were provided to a relatively small group ofprogram participants.
20
24
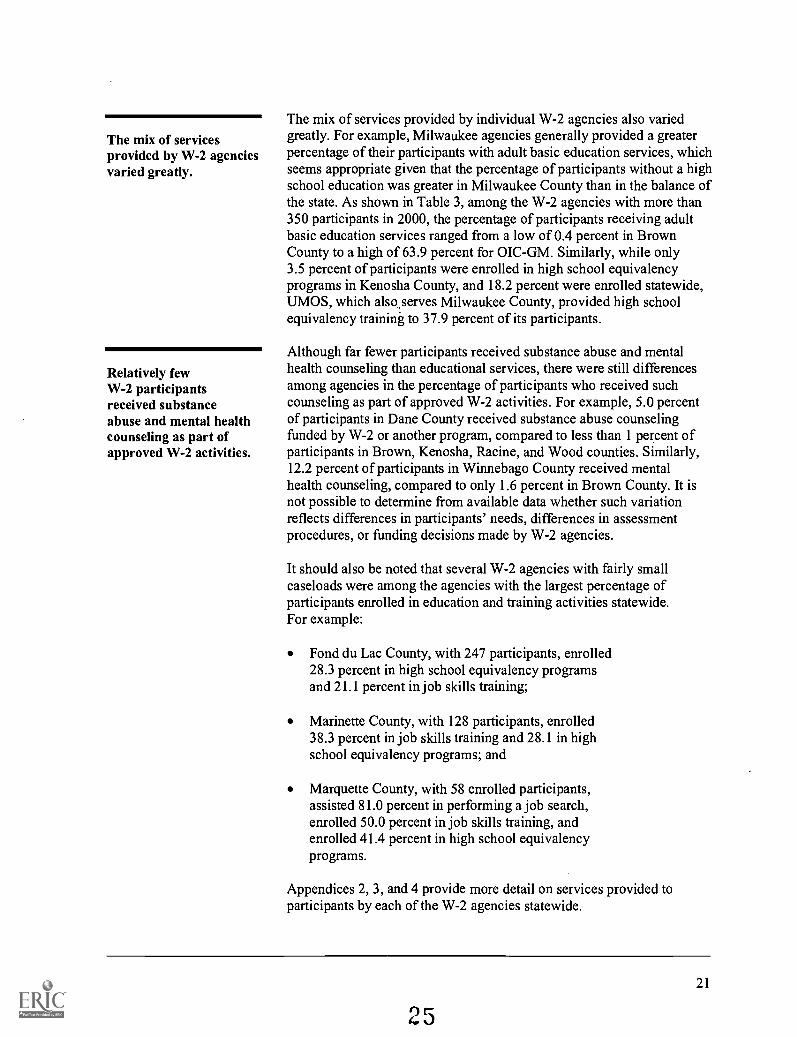
The mix of servicesprovided by W-2 agenciesvaried greatly.
Relatively fewW-2 participantsreceived substanceabuse and mental healthcounseling as part ofapproved W-2 activities.
The mix of services provided by individual W-2 agencies also variedgreatly. For example, Milwaukee agencies generally provided a greaterpercentage of their participants with adult basic education services, whichseems appropriate given that the percentage of participants without a highschool education was greater in Milwaukee County than in the balance ofthe state. As shown in Table 3, among the W-2 agencies with more than350 participants in 2000, the percentage of participants receiving adultbasic education services ranged from a low of 0.4 percent in BrownCounty to a high of 63.9 percent for OIC-GM. Similarly, while only3.5 percent of participants were enrolled in high school equivalencyprograms in Kenosha County, and 18.2 percent were enrolled statewide,UMOS, which also serves Milwaukee County, provided high schoolequivalency training to 37.9 percent of its participants.
Although far fewer participants received substance abuse and mentalhealth counseling than educational services, there were still differencesamong agencies in the percentage of participants who received suchcounseling as part of approved W-2 activities. For example, 5.0 percentof participants in Dane County received substance abuse counselingfunded by W-2 or another program, compared to less than 1 percent ofparticipants in Brown, Kenosha, Racine, and Wood counties. Similarly,12.2 percent of participants in Winnebago County received mentalhealth counseling, compared to only 1.6 percent in Brown County. It isnot possible to determine from available data whether such variationreflects differences in participants' needs, differences in assessmentprocedures, or funding decisions made by W-2 agencies.
It should also be noted that several W-2 agencies with fairly smallcaseloads were among the agencies with the largest percentage ofparticipants enrolled in education and training activities statewide.For example:
Fond du Lac County, with 247 participants, enrolled28.3 percent in high school equivalency programsand 21.1 percent in job skills training;
Marinette County, with 128 participants, enrolled38.3 percent in job skills training and 28.1 in highschool equivalency programs; and
Marquette County, with 58 enrolled participants,assisted 81.0 percent in performing a job search,enrolled 50.0 percent in job skills training, andenrolled 41.4 percent in high school equivalencyprograms.
Appendices 2, 3, and 4 provide more detail on services provided toparticipants by each of the W-2 agencies statewide.
21
25
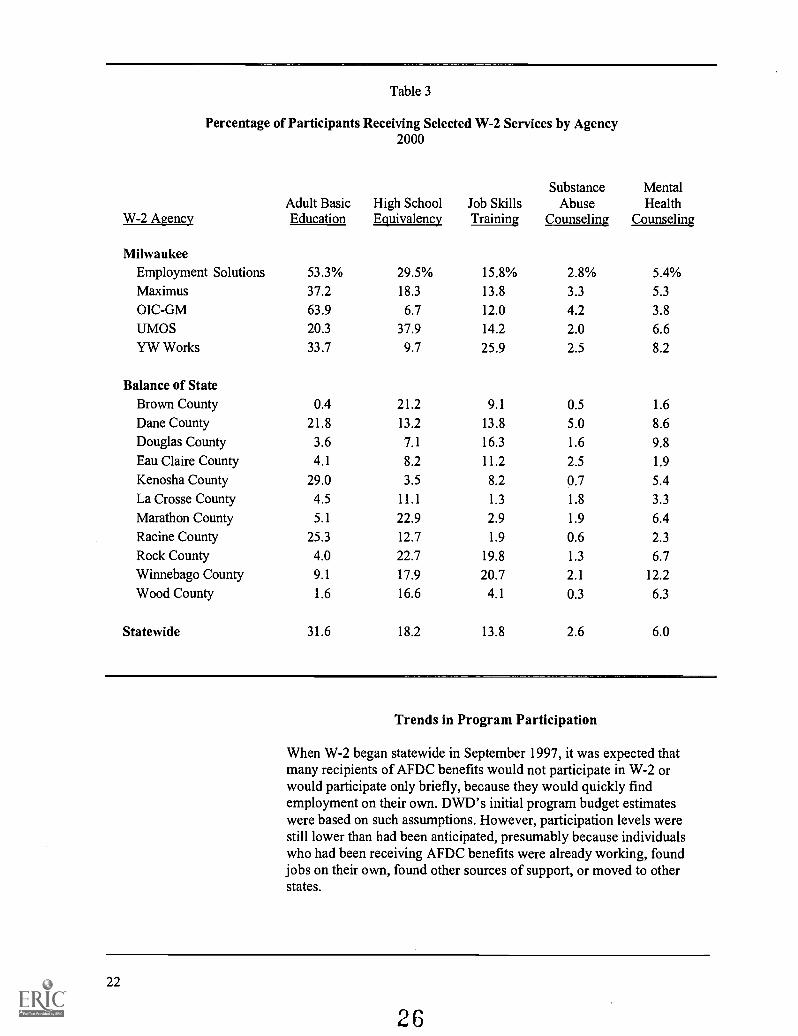
Table 3
Percentage of Participants Receiving Selected W-2 Services by Agency2000
W-2 AgencyAdult BasicEducation
High SchoolEquivalency
Job SkillsTraining
SubstanceAbuse
Counseling
MentalHealth
Counseling
MilwaukeeEmployment Solutions 53.3% 29.5% 15.8% 2.8% 5.4%Maximus 37.2 18.3 13.8 3.3 5.3
OIC-GM 63.9 6.7 12.0 4.2 3.8
UMOS 20.3 37.9 14.2 2.0 6.6YW Works 33.7 9.7 25.9 2.5 8.2
Balance of StateBrown County 0.4 21.2 9.1 0.5 1.6
Dane County 21.8 13.2 13.8 5.0 8.6
Douglas County 3.6 7.1 16.3 1.6 9.8
Eau Claire County 4.1 8.2 11.2 2.5 1.9
Kenosha County 29.0 3.5 8.2 0.7 5.4
La Crosse County 4.5 11.1 1.3 1.8 3.3
Marathon County 5.1 22.9 2.9 1.9 6.4Racine County 25.3 12.7 1.9 0.6 2.3
Rock County 4.0 22.7 19.8 1.3 6.7
Winnebago County 9.1 17.9 20.7 2.1 12.2
Wood County 1.6 16.6 4.1 0.3 6.3
Statewide 31.6 18.2 13.8 2.6 6.0
Trends in Program Participation
When W-2 began statewide in September 1997, it was expected thatmany recipients of AFDC benefits would not participate in W-2 orwould participate only briefly, because they would quickly findemployment on their own. DWD's initial program budget estimateswere based on such assumptions. However, participation levels werestill lower than had been anticipated, presumably because individualswho had been receiving AFDC benefits were already working, foundjobs on their own, found other sources of support, or moved to otherstates.
22
26

W-2 caseloads declinedmuch faster than hadbeen projected.
As a result, initial caseload projections were much higher than actualprogram participation. For example, DWD's budget estimates projectedthere would be approximately 50,100 participants statewide inSeptember 1997. The actual number was 22,761, or 45.4 percent of thenumber anticipated. It included 22,341 AFDC cases that were still activeand for which participants received cash benefits, as well as 420 newW-2 cases. When the initial W-2 implementation contracts ended inDecember 1999, there were only 11,170 program participants. All wereW-2 cases, because AFDC had ended in March 1998.
As shown in Table 4, the average caseload declined 50.9 percentstatewide from September 1997 to September 2000. In MilwaukeeCounty, where approximately three-quarters of W-2 participants reside,it declined 47.8 percent. Appendix 5 shows changes in allW-2 agencies' caseloads in September 1997 and September 2000.
Table 4
Number of W-2 Cases by Contractor TypeSeptember 1997 and September 2000
Contractor Type September 1997* September 2000PercentageReduction
Tribal Agencies 115 37 67.8%Private Agencies in Counties Other thanMilwaukee 509 206 59.5
County Agencies 5,627 2,303 59.1Private Agencies in Milwaukee County 16,425 8,578 47.8Other** 85 47 44.7
All W-2 Agencies 22,761 11,171 50.9
* Includes AFDC cases that were being moved to the W-2 program.** W-2 programs in Florence and Monroe counties were administered by county agencies in September 1997
and by private agencies in September 2000.
Approximately30 percent of participantsentered the program inunsubsidized placements.
It was expected that most W-2 participants would move from subsidizedto unsubsidized placements. However, some participants never neededor took advantage of subsidized placements but sought only services tohelp them find or maintain employment. As shown in Table 5, we foundthat approximately 30 percent of participants who entered the program
23
27

Table 5
Placements of W-2 Participants Who Entered the Program for theFirst Time in Either July 1999 or July 2000*
Placement Type
July 1999 July 2000
NumberPercentage
of Total NumberPercentage
of Total
Subsidized PlacementsCommunity service jobs 150 25.9% 145 22.5%Custodial parents of infants 146 25.2 183 28.4
Transitional placements 114 19.7 121 18.8
Trial jobs 0 0.0 1 0.1
Subtotal 410 70.8 450 69.8
Unsubsidized PlacementsCase management for those judged
ready to enter employment 67 11.5 86 13.3
Case management for those working 67 11.5 50 7.8Case management follow-up 26 4.5 32 5.0Case management for those who are
pregnant 10 1.7 26 4.0Case management for minor parents 0 0.0 1 0.1
Subtotal 170 29.2 195 30.2
Total 580 100.0% 645 100.0%
* Represents participants' placements at the end of the first month of program participation.
for the first time in July 1999 and July 2000 were in unsubsidizedplacements at the end of their first month.
As shown in Figure 1, the total caseload declined steadily throughJanuary 2000, then increased slightly through September 2000. Most ofthe decline reflects a precipitous reduction in the cash benefit caseload,which includes participants in community service jobs, transitionalplacements, and trial jobs, as well as custodial parents of infants.
24
28

25,000
20,000
15,000
10,000
5,000
0
41 41 cp chR) 4/3 cbq cbcb 4:6 4:5 cp 5p 0: 1 1 0: 1
CPI NO CO° 51' 1 44' 4SV c, 4)4'Sao
NVI'c 0'9
Figure 1
W-2 CaseloadSeptember 1997 through September 2000
aTotalaMilwaukee AgenciesA Balance of State
The number ofparticipants receivingonly case managementservices has generallyincreased.
In contrast to the overall caseload, the non-cash benefit caseloadthatis, participants in unsubsidized placements who either enrolled in theprogram to obtain services other than cash benefits or remained enrolledin order to keep receiving these serviceshas generally increased sincethe program began. From February through November 1999, thenon-cash benefit caseload increased by 34.6 percent. Since then, the rateof increase has slowed. Table 6 shows trends in W-2 participation fromJanuary 1998 through September 2000.
25
29

Table 6
Change in Cash Benefit and Non-Cash Benefit Caseloads
Cash Benefit Percentage Non-Cash Benefit PercentageMonth Caseload Change Caseload Change
January 1998 14,204 3,658
January 1999 9,032 -36.4% 3,523 -3.7%
January 2000 6,700 -25.8 4,022 14.2
September 2000 6,771 1.1 4,400 9.4
26
30

Program Expenditures
W-2 program coststotaled $710.4 millionthrough September 2000.
During the initial implementation period from September 1997 throughDecember 1999, a total of $237.9 million in funds that had beencontracted for local program services and administration remainedunspent, largely because of the unanticipated decline in the W-2caseload. The initial implementation contracts called for the majority ofthe unspent funds to be returned to the W-2 agencies, which wererequired to spend some of these funds on services for low-incomeindividuals but allowed to retain others as unrestricted "profits" thatcould be spent for a variety of purposes. Current contracts, which expirein December 2001, require W-2 agencies to meet performancebenchmarks in order to receive any bonus funds. We reviewedexpenditures under the initial implementation and current contractperiods.
As shown in Table 7, local program implementation by W-2 agenciesaccounted for 93.6 percent of W-2 costs through September 2000. Theunrestricted profits that were provided to all 75 of the counties, privateagencies, and tribes under the initial implementation contracts accountedfor $65.1 million (9.2 percent) of the $710.4 million in total costs. Thesecosts also include an estimated $45.6 million for state administration byDWD, which devoted approximately 57 full-time equivalent (FTE)positions to W-2 since 1997.
27
31

Table 7
W-2 Costs through September 2000(in millions)
PercentageCategory Program Costs of Total
Local Program Implementation by W-2 AgenciesInitial implementation contractsCurrent contractsUnrestricted profitsStart-up contractsAdditional W-2 services*
Community reinvestment funds
Subtotal
$413.6121.4
65.1
31.3
19.2
14.2
58.2%17.1
9.2
4.4
2.7
2.0
664.8 93.6
State Administration** 45.6
Total $710.4
6.4
100.0%
* Includes costs for services such as on-site child care at job centers, job access loans, emergency assistance,and funds for services provided to participants by the Milwaukee Area Technical College Learning Labs,which are included as addenda to the contracts of W-2 agencies.
** Estimated based on total TANF-related administrative costs.
Expenditures arecategorized as either cashbenefits, direct services,or administrative costs.
Initial Contract Expenditures
As shown in Table 8, the five private agencies serving MilwaukeeCounty spent 64.5 percent of the $413.6 million in initialimplementation contract costs. Appendix 6 lists contract amounts andexpenditure information for each of the 75 original W-2 agencies.
DWD classifies expenditures reported by lo,cal W-2 agencies as eithercash benefits, direct services, or administrative costs. Direct servicestypically include the salaries and benefits of those providing services, aswell as the actual costs of the services, including costs of
determining eligibility for W-2, food stamps,Medical Assistance, child care, and refugee cashassistance;
28
32
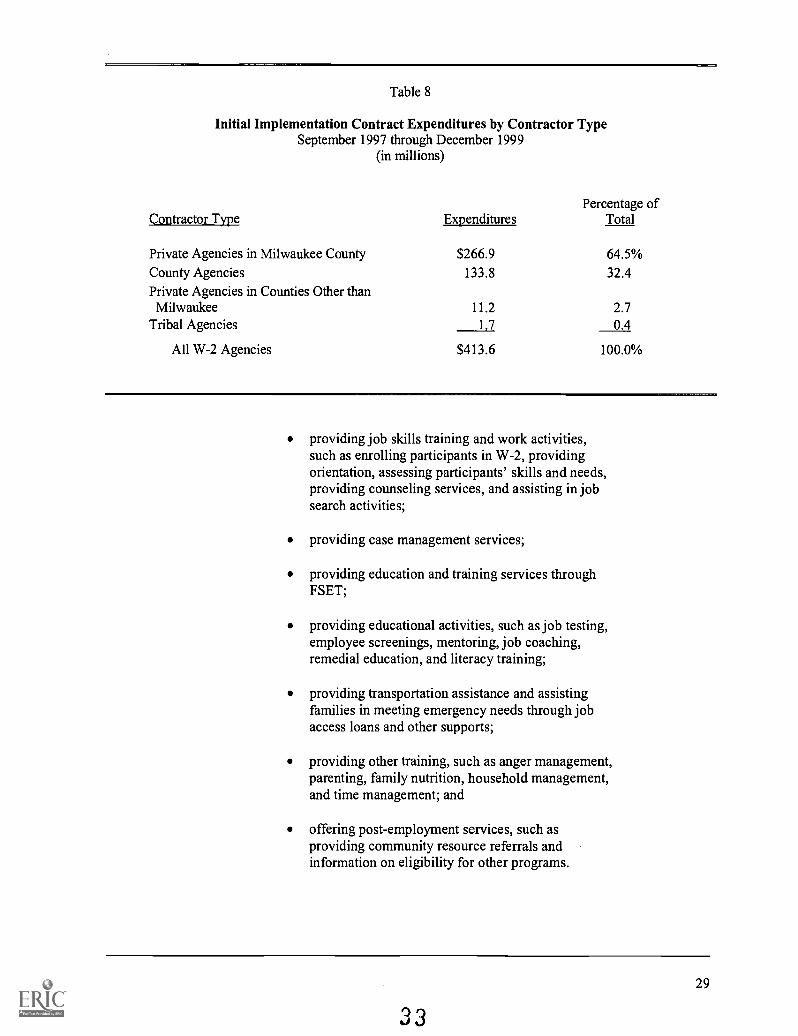
Table 8
Initial Implementation Contract Expenditures by Contractor TypeSeptember 1997 through December 1999
(in millions)
Contractor Type ExpendituresPercentage of
Total
Private Agencies in Milwaukee County $266.9 64.5%County Agencies 133.8 32.4Private Agencies in Counties Other than
Milwaukee 11.2 2.7Tribal Agencies 1.7 0.4
All W-2 Agencies $413.6 100.0%
providing job skills training and work activities,such as enrolling participants in W-2, providingorientation, assessing participants' skills and needs,providing counseling services, and assisting in jobsearch activities;
providing case management services;
providing education and training services throughFSET;
providing educational activities, such as job testing,employee screenings, mentoring, job coaching,remedial education, and literacy training;
providing transportation assistance and assistingfamilies in meeting emergency needs through jobaccess loans and other supports;
providing other training, such as anger management,parenting, family nutrition, household management,and time management; and
offering post-employment services, such asproviding community resource referrals andinformation on eligibility for other programs.
33

50.2 percent ofexpenditures under theinitial implementationcontracts were for directservices.
Local administrativecosts accounted for9.2 percent of W-2 agencyexpenditures under theinitial contracts.
As noted, cash benefit expenditures are for grants to participants inemployment positions, wage subsidies to employers who hireW-2 participants in trial jobs, and grants to custodial parents of infants.Administrative expenditures include the costs of salaries and fringebenefits for staff who are not involved in direct program delivery, aswell as office space, data processing, and other overhead costs.
As shown in Table 9, 50.2 percent of program expenditures underthe initial implementation contracts were for direct services, while40.6 percent were for cash benefits paid to participants and subsidiesto employers, and 9.2 percent were for administrative expenditures.Appendix 7 lists initial implementation expenditures by type for eachW-2 agency. It also includes expenditures for additional services thatwere not part of the original contracts but were included in contractaddenda. It should be noted that payments for subsidized child care,which is available to W-2 participants and other low-income families,are funded through separate appropriations and have been reviewed inanother recently released Legislative Audit Bureau evaluation(report 01-1).
Within the direct services category, $109.6 million was spent on workactivities for program participants. That amount represents 26.5 percentof initial implementation contract expenditures.
Within the cash benefits expenditure category, $121.5 million was paidto W-2 participants in community service jobs. That amount represents29.4 percent of initial implementation contract expenditures. Only$0.4 million, or 0.1 percent of these expenditures, funded trial jobsbecause few trial jobs were created.
W-2 agencies' administrative costs of $37.9 million accounted for9.2 percent of initial implementation contract expenditures. Thecontracts required that the agencies spend no more than 10 percent ofthe total value of their contracts for administrative purposes, and onlyone agency exceeded this amount. Waushara County spent 10.1 percenton administration, or $2,540 more than was available for reimbursementunder its contract.
30
4

Table 9
Initial Implementation Contract Expenditures by Expenditure TypeSeptember 1997 through December 1999
Type of ExpenditurePercentage of
Expenditures Total Expenditures
Direct ServicesWork activities $109,618,826 26.5%Eligibility determination* 48,247,517 11.7
Case management 14,697,829 3.5
FSET services 12,447,082 3.0
Skills training 8,458,110 2.0
Post-employment services 7,795,046 1.9
Educational activities 6,502,998 1.6
Subtotal 207,767,408 50.2
Cash BenefitsCommunity service jobs $121,481,539 29.4Transitional placements 30,497,550 7.4
Custodial parents of infants 14,002,783 3.4
Sanctions** 1,530,140 0.3
Trial jobs 420,062 0.1
Subtotal 167,932,074 40.6
Local Administrative Costs
Total
37,896,667 9.2
$413,596,149 100.0%
* Includes determining eligibility for W-2, Medical Assistance, the Food Stamp Program, subsidized childcare, and refugee cash assistance.
** Except for Milwaukee County, sanctions of participants' grants were counted as expenditures and werecharged against an agency's contract. Milwaukee County agencies were able to retain sanctioned funds.
35

Contractors retainedunspent initialimplementation funds asprofits and forcommunity reinvestment.
Unspent Contract Funds
Because the initial implementation contracts required counties, privateagencies, and tribes to assume financial responsibility for any programcosts that exceeded contract values, they included provisions forcontractors to profit if any program funds were not spent. Contractorscould earn both unrestricted profits, which could be spent in any waythe contractors chose, and community reinvestment funds, which wererestricted funds that are required to be spent on services for TANF-eligible individuals. When only 63.5 percent of the $651.5 millionbudgeted under the initial implementation contracts was spent, allcontractors became eligible to receive both unrestricted profits andcommunity reinvestment funds.
Under the initial implementation contracts, unexpended funds thatwere 7 percent or less of the total contract value were to be paid asunrestricted profits. If unexpended funds exceeded 7 percent of thecontract's value, those funds remaining after the initial profit wascalculated were to be distributed as follows:
10 percent was to be paid as additional unrestrictedprofit to the contractor;
45 percent was to be reinvested in the communityby the contractor, to fund services for eligiblelow-income individuals pursuant to a plan submittedby the contractor and approved by DWD; and
45 percent was to be retained by DWD for use inany manner it determined to be appropriate inaccordance with the State's approved TANF plan.
For example, if a county, private agency, or tribe that entered into acontract for $1.0 million spent only $700,000, the $300,000 in unspentfunds would be 30 percent of the contract's value. The contractor wouldtherefore be entitled to a profit of $70,000, or 7 percent of the contract'svalue. This $70,000 profit would then be deducted from unspentcontract funds, and the contractor would be entitled to receive $23,000(10 percent of the remaining $230,000) as profit and $103,500(45 percent of the remaining $230,000) for community reinvestment. Intotal, the contractor would be entitled to receive $93,000 in profits and$103,500 in community reinvestment funds. DWD would retain theremaining $103,500.
32
06
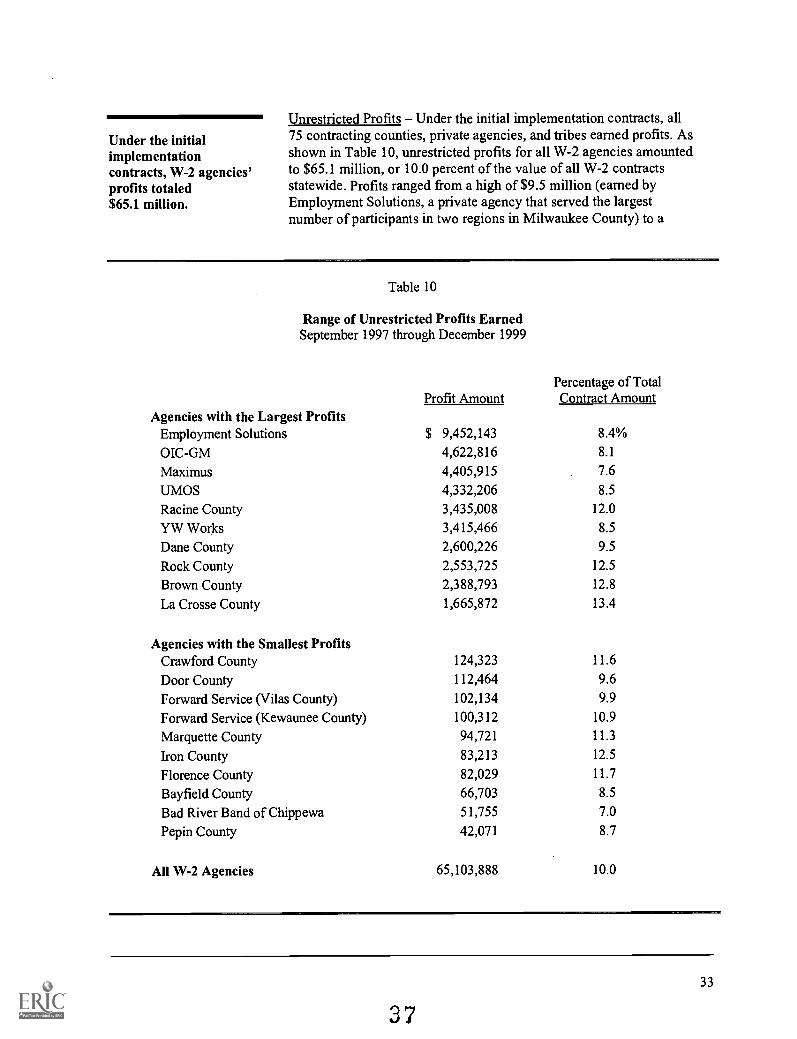
Under the initialimplementationcontracts, W-2 agencies'profits totaled$65.1 million.
Unrestricted Profits Under the initial implementation contracts, all75 contracting counties, private agencies, and tribes earned profits. Asshown in Table 10, unrestricted profits for all W-2 agencies amountedto $65.1 million, or 10.0 percent of the value of all W-2 contractsstatewide. Profits ranged from a high of $9.5 million (earned byEmployment Solutions, a private agency that served the largestnumber of participants in two regions in Milwaukee County) to a
Table 10
Range of Unrestricted Profits EarnedSeptember 1997 through December 1999
Agencies with the Largest ProfitsProfit Amount
Percentage of TotalContract Amount
Employment Solutions $ 9,452,143 8.4%
OIC-GM 4,622,816 8.1
Maximus 4,405,915 7.6
UMOS 4,332,206 8.5
Racine County 3,435,008 12.0
YW Works 3,415,466 8.5
Dane County 2,600,226 9.5
Rock County 2,553,725 12.5
Brown County 2,388,793 12.8
La Crosse County 1,665,872 13.4
Agencies with the Smallest ProfitsCrawford County 124,323 11.6
Door County 112,464 9.6
Forward Service (Vilas County) 102,134 9.9
Forward Service (Kewaunee County) 100,312 10.9
Marquette County 94,721 11.3
lion County 83,213 12.5
Florence County 82,029 11.7
Bayfield County 66,703 8.5
Bad River Band of Chippewa 51,755 7.0
Pepin County 42,071 8.7
All W-2 Agencies 65,103,888 10.0
37
low of $42,071 (earned by Pepin County, which served thesecond-fewest number of participants and had the smallest contract).Three other private agencies in Milwaukee County each earned morethan $4.0 million in profits: Maximus, OIC-GM, and UMOS. At$3.4 million, Racine County earned the largest profits among countyagencies. Information on the profits each W-2 agency earned under theinitial implementation contracts is included in Appendix 6.
Although the initial implementation contracts allowed unrestrictedprofits to be used as each contractor wished, counties are required todisclose the disposition of their profits to the Legislature and the public,because their fluids are public funds. In contrast, private agencies arenot under an obligation to disclose the ways in which their profits wereused.
As part of our site visits to 17 public and private agencies, we requestedinformation on how each used its profits. We found that:
Brown, Kenosha, Price, Rock, and Sawyer countiesreported spending a total of $6.3 million inunrestricted profits to offset county tax levies, ortransferred profits to the county general fund.
OIC-GM reported spending $4.6 million in profitsfor activities that included purchasing a cellularphone business in the central city of Milwaukee,developing a food service program to provide mealsto child care providers and after-school programs,and joining a collaboration to develop a computertechnology academy to increase academicachievement and expand career opportunities foryouth.
Dane County reported spending $1.3 million toprovide housing services for low-income residents.
YW Works reported spending $1.1 million on aplastics processing company that will serve as aworkplace skills training center, on a non-traditionalemployment and training program, and on a varietyof other education and training activities andprograms.
Manitowoc County reported spending $605,000 onalternate care expenses for children, to offset budgetdeficits resulting from shortfalls in other programs.
34
38

Under the first contract,W-2 agencies received$83.4 million incommunity reinvestmentfunds.
Fond du Lac County reported spending $465,000 toexpand a range of services available to low-incomefamilies.
Monroe County reported spending $219,000 toenhance the county human services department'scomputer network.
The agency profiles (Appendix 1) also include information on the use ofunrestricted profits under the initial implementation contracts.
Community Reinvestment Funds As shown in Table 11, W-2 agenciesreceived a total of $83.4 million for community reinvestment. Thesefunds represent 12.8 percent of the value of all agencies' initialimplementation contracts. However, compared to the other contractors,private agencies in Milwaukee County earned a substantially smallerpercentage of community reinvestment funds because they spent alarger percentage of their contract funds. Racine and Rock countiesearned the largest amount of community reinvestment funding,$6.4 million and $5.1 million, respectively.
Table 11
Community Reinvestment Funds EarnedUnder Initial Implementation Contracts
(in millions)
Contractor TypeContractAmount
CommunityReinvestment
CommunityReinvestment Fundsas a Percentage ofContract Amount
Percentage Spentthrough
September 2000
County Agencies $304.9 $64.9 21.3% 16.9%Private Agencies in CountiesOther than Milwaukee 24.3 4.9 20.2 15.9
Tribal Agencies 3.4 0.7 20.6 0.0Private Agencies in
Milwaukee County 318.9 12.9 4.0 19.1
All W-2 Agencies $651.5 $83.4 12.8 17.0
35
39

In September 2000, W-2agencies had spent17 percent of thecommunity reinvestmentfunds they received underthe initial contracts.
The amount of community reinvestment funds received by each agency ispresented in Appendix 6. A total of $83.4 million in communityreinvestment funds was also made available to DWD under the initialimplementation contracts. These funds were reallocated to otherTANF-eligible programs during 1999-2001 biennial budget deliberations.
Community reinvestment funds must be used to provide services tofamilies whose incomes are below 200 percent of the federal povertylevel, which is currently $29,260 annually for a family of three. Underfederal law, the funds must also be spent for purposes consistentwith the TANF legislation, such as encouraging the formation andmaintenance of two-parent families. In October 1998, DWD issuedthe first of several memoranda that outlined the allowable uses ofcommunity reinvestment funds. These include assistance for food,utilities, household goods and personal care, and child care; assistancewith finding a job; and funding for food pantries and clothing centersthat enable low-income individuals to obtain necessities at little or nocost. DWD memoranda also indicate that community reinvestmentfunds may be used to supplement direct services budgets under thecurrent implementation contracts; to provide transportation services,enrichment services to youth, and counseling activities not covered byMedical Assistance; and to expand services to address cultural andlanguage barriers.
To receive community reinvestment funds, W-2 agencies were required tosubmit plans for DWD's approval detailing the types of activities theywish to fund and the types of individuals to be served. As of March 2001,13 agencies were still working on obtaining plan approval from DWD.
As of September 2000, Marinette County had spent all of itsreinvestment funds. Although it reported spending $1.4 million, DWDreimbursed $1.2 million, which was the actual amount of reinvestmentfunds earned. In contrast, 15 agencies had no reported expenditures bySeptember 2000. Overall, W-2 agencies have spent $14.2 million, or17.0 percent of the community reinvestment funds they received underthe initial implementation contracts. Based on our review of the planssubmitted to DWD by the 17 agencies we visited:
11 agencies plan to spend a total of $7.6 million tosupplement funds for services to W-2 participants inthe event that other contract funds are insufficient;
15 agencies plan to spend $5.8 million on supportiveservices to families, including services to reduceout-of-home placements of children;
14 agencies plan to spend $3.8 million to enhanceemployment training and job retention services;
36
40

Milwaukee County willreceive $4.1 million incommunity reinvestmentfunds from two W-2agencies.
12 agencies plan to spend $3.2 million foremergency services, such as loans or grants for food,shelter, and utilities;
11 agencies plan to spend $2.4 million on servicesfor youth, such as after-school activities intended toreduce gang involvement, prevent youth alcohol andother drug abuse, assist children at risk of failing inor dropping out of school, and increase youthemployment skills;
7 agencies plan to spend $1.2 million on childcarerelated services, including funding on-site childcare for W-2 participants and providing funds forstart-up and expansion of child care centers;
5 agencies plan to spend $532,000 for interpreterservices and for coordination and outreach servicesto non-English speaking communities; and
6 agencies plan to spend $442,000 for domesticabuse prevention and support services.
In addition, Employment Solutions and OIC-GM have agreed to providea portion of their community reinvestment funds, $3.8 million and$300,000, respectively, to Milwaukee County to fund activities such as:
case management, non-medical therapy, andindividual and family counseling;
services for developmentally disabled infants,toddlers, and their families; and
overnight shelters and services for the homeless.
The original deadline to spend all W-2 community reinvestmentfunds earned under the initial implementation contracts wasDecember 31, 2001. This deadline was recently extended toJune 30, 2002; however, all funds unspent by January 2002 will bereduced by 25 percent. DWD will reallocate these funds to thoseagencies that have exceeded their W-2 contract funds.
Appendix 8 provides information on the amount of communityreinvestment funds spent by each W-2 agency through September 2000.The agency profiles in Appendix 1 provide more detail on how each ofthe 17 agencies we visited plans to spend its community reinvestmentfunds.
37
41

Current W-2 contractsare for 43.3 percent lessthan the initialimplementationcontracts.
Current Contract Expenditures
The current contracts for implementation of W-2 total $369.3 millionfor the 24-month period from January 2000 through December 2001.This amount is 43.3 percent less than the value of the initialimplementation contracts, in recognition of the $237.9 million that wasbudgeted but not spent under those contracts, the continued decline incaseloads, and the shorter time period of the current implementationcontracts.
As shown in Table 12, W-2 agencies spent $121.4 million in the firstnine months of the current contract implementation period. That totalrepresents 32.9 percent of total current contract amounts. Appendix 9lists the current contract amount, reported expenditures, and potentialbonus and reinvestment amounts by W-2 contractor.
Contractor Type
Table 12
Current Contract Amounts and ExpendituresJanuary 2000 through September 2000
(in millions)
Contract Expenditures throughAmount September 2000
Percentage of TotalContract Expended
Private Agencies in Milwaukee County $253.1 $ 82.1 32.4%County Agencies 103.9 34.8 33.5
Private Agencies in Counties Other thanMilwaukee 11.4 4.2 36.8
Tribal Agencies 0.9 0.3 33.3
All W-2 Agencies $369.3 $121.4 32.9
Direct services accountfor 59.6 percent ofcurrent contractexpenditures.
As shown in Table 13, direct services continue to be the largestexpenditure category under the current implementation contracts. Theyrepresent 59.6 percent of current contract expenditures, compared to50.2 percent under the initial implementation contracts. Cash benefitsrepresent 30.5 percent of current contract expenditures, compared to40.6 percent under the initial implementation contracts. The decline incash benefits can be attributed to the decline in caseloads. Currentcontract expenditures include two direct service categories that were not
38
42

Table 13
Current Contract Expenditures by Category.January 2000 through September 2000
Percentage ofType of Expenditure Expenditures Total Expenditures
Direct ServicesWork activities $ 45,155,113 37.2%Eligibility determination* 13,077,073 10.8
FSET services 4,910,599 4.1
Post-employment services 2,752,969 2.3Educational activities 2,598,342 2.1
Skills training 2,298,177 1.9
Transportation 1,248,954 1.0
Case management 289,452 0.2Non-cash assistance** 19,283 <0.1
Subtotal 72,349,962 59.6
Cash BenefitsCommunity service jobs 14,618,629 12.0Transitional placements 11,735,196 9.7Sanctions 5,395,950 4.4Custodial parents of infants 5,190,753 4.3
Trial jobs 89,697 0.1
Subtotal 37,030,225 30.5
Local Administrative Costs 11,981,391 9.9
Total $121,361,578 100.0%
* Includes determining eligibility for W-2, Medical Assistance, the Food Stamp Program, subsidized child care, andrefugee cash assistance.
** Includes food, clothing, shelter, utilities, household goods, and personal care items.
tracked separately under the initial implementation contracts:transportation, including bus tokens and van services, and non-cashassistance, including the direct provision of food, shelter, utilities,household goods, and personal care items. Finally, in contrast to theinitial implementation contracts, which limited administrative costs to10 percent of the contract amount, administrative costs under the currentcontracts cannot exceed 15 percent of expenditures. Appendix 10 listseach agency's current contract expenditures by type through
39
43

Under the currentcontracts, bonuses areawarded based onperformance rather thanon the level of unspentfunds.
September 2000. It also includes expenditures for additional servicesthat were not part of the original contracts but were included in contractaddenda.
Performance Bonuses
In order to improve agency performance, and in response to concernsabout the $65.1 million in profits that W-2 agencies were paid under theinitial implementation contracts, DWD developed performancestandards for the current contract period that are intended to tiemonetary incentives to performance rather than to the level of unspentfunds.
Since January 2000, each W-2 agency's performance has been measuredusing seven criteria:
the number of W-2 and FSET participants who enterinto full- and part-time jobs lasting 30 days or more;
the average wage rate attained by all participantsserved by the agency who have been placed in jobs,including both W-2 participants and individualsparticipating in the FSET program;
the percentage of all participants who have enteredemployment and remain employed through a 30-dayfollow-through verification;
the percentage of all participants who have enteredemployment and remain employed through a180-day follow-through verification;
the percentage of W-2 participants receiving anemployment subsidy who are engaged in appropriateactivities for at least 30 hours per week, and thepercentage of FSET participants engaged inappropriate activities for at least 27 hours per week;
the percentage of all participants attending basiceducational activities to which they have beenassigned; and
the percentage of all participants who haveemployer-provided health insurance no later than180 days after entering employment.
40
44

Currently, bonuspayment levels are basedon three levels ofperformance.
$25.9 million is availablefor bonus paymentsunder current contracts.
For each of these criteria, DWD has established three levels ofperformance that can be used in determining bonus payment levelsunder the current contracts: the base performance level, the first bonuslevel, and the second bonus level. If an agency achieves the baseperformance level for each of the seven mandatory performancemeasures, it will earn the "right of first selection," which potentiallyallows it to be awarded the next W-2 contract without having tocompete with other public and private organizations that may beinterested in administering W-2 during the next contract period. Inaddition, it will earn a portion of the 3 percent restricted-use bonus forevery standard it meets. Such bonuses may be used much like thecommunity reinvestment funds earned under the initial contracts.
By demonstrating higher levels of performance, agencies can also earnunrestricted bonuses that may be used for any purpose. The first bonuslevel is equal to 2 percent of the agency's contract amount. Thesecond bonus level includes an additional 2 percent of the contractamount.
Appendix 11 provides detail on the three performance bonus levelsfor each of the seven criteria, as well as for two optional performancecriteria. Under the optional criteria, agencies that would otherwise notmeet one of seven mandatory performance standards may still earnsecond-level bonuses if they either: 1) contracted for direct serviceswith at least one faith-based organization during at least seven of theeight quarters of the contract period; or 2) can show that 50 percentof participants who had been assigned to basic and job skills trainingactivities have completed those activities successfully.
As shown in Table 14, the total of maximum bonus payments possibleunder the current contracts is $25.9 million. That amount represents7.0 percent of the total of all current contract amounts. In contrast,W-2 agencies earned profits and community reinvestment funds of$148.5 million under the initial implementation contracts, representing22.8 percent of the total of all initial implementation contract amounts.
Although bonuses will not be determined until the end of the currentcontract period in December 2001, DWD announced in March 2001that all but two agenciesBayfield and Menominee countiesweremeeting or exceeding base level performance standards for restricted-use bonuses. Under current contracts, W-2 agencies that meet thesestandards are eligible for the right of first selection.
In addition, as of December 2000, 34 agencies were meeting thestandards needed to obtain the maximum amount of unrestricted-usebonus funds at the first level, and 9 at the second level. If performancewere to remain unchanged through the end of the current contractperiod, the agencies would earn a total of $22.9 million, or 88.5 percentof the total available to them. Appendix 12 shows the level at which
41
45

Table 14
Contract Amounts and Maximum Performance BonusesAvailable to W-2 Agencies
Contractor TypeContractAmount
Restricted-Use Bonus
FirstUnrestricted-Use Bonus
SecondUnrestricted-Use Bonus
Total BonusPossible
Private Agencies inMilwaukee County $253,170,283 $ 7,595,109 $5,063,405 $5,063,405 $17,721,919
County Agencies 103,876,637 3,116,300 2,077,533 2,077,533 7,271,366Private Agencies in
Counties Other thanMilwaukee 11,387,237 341,616 227,745 227,745 797,106
Tribal Agencies 880,286 26.409 17.606 17,606 61,621
All W-2 Agencies $369,314,443 $11,079,434 $7,386,289 $7,386,289 $25,852,012
Concerns have beenraised about givingagencies that misspentpublic funds anadvantage in seekingfuture contracts.
each agency met the seven mandatory standards throughDecember 2000, as well as potential bonuses if performance remainsunchanged through the remainder of the current contract period.
In prior reports concerning our review of W-2 agencies' expenditures,we found that Maximus and Employment Solutions had inappropriatelybilled the State for numerous unallowable costs, including expendituresassociated with pursuing out-of-state contracts, entertainment,unallowable staff benefits, and donations to other organizations. Somehave raised concerns about DWD's actions in awarding Maximus andEmployment Solutions the right of first selection for the 2002-03W-2 contract period.
The opportunity to earn the right of first selection is provided inWisconsin Statutes. However, statutes do not prescribe the manner inwhich this right is to be implemented in W-2 contracts. Because of themanner in which DWD included these provisions in its W-2 contracts, itis unclear what options, if any, DWD has under the current contract todeny the right of first selection to agencies that have met performancestandards. However, to ensure that DWD has the authority to exercisemeaningful discretion in awarding the right of first selection underfuture contracts, we recommend the Department of WorkforceDevelopment proceed as it has proposed and include provisions in allfuture contracts that allow it to revoke the right of first selection for anyagency that fails to comply with established rules and regulations,including those specified in its financial and policy managementmanuals.
42
46

Program Effectiveness
W-2's success inensuring the economicself-sufficiency ofparticipants has not yetbeen established.
What to include in themeasure of poverty is thesubject of debate.
W-2 has been successful in reducing public assistance caseloads andrequiring participants to work. However, its success in ensuring theeconomic self-sufficiency of former participants has not yet beenestablished. Former participants are likely to continue to receiveassistance through programs such as Medical Assistance and the FoodStamp and Wisconsin Shares Child Care Subsidy programs, which maybe essential to their maintaining employment. Decreased reliance onpublicly funded subsidies may not, therefore, be an appropriate measureof the program's success. However, progress in achieving economicself-sufficiency can be documented by former participants' earnings,which are reflected in income tax data. Therefore, we analyzed theextent to which the income of participants who left the program in thefirst three months of 1998 was above the federal poverty level, as wellas the extent to which former participants returned to the program foreither cash assistance or other services.
Financial Status of Former Participants
During the first three months of 1998, 2,129 participants left W-2 for avariety of reasons, but primarily because they found employment. Thelast placement for 66.5 percent of these participants, some of whomnever received a cash benefit, was case management for those employedor deemed ready for unsubsidized employment. We compared twomeasures of these former W-2 participants' financial status with thefederal poverty level:
average annual income; and
average annual income including state and federalearned income tax credits (EITCs).
Wisconsin's EITC, which offsets low-income working families' taxliabilities and may provide them with tax refunds that can be used forany purpose, was created in 1989 to assist low-income working familiesin meeting living costs.
We did not include other, non-cash benefits in our analysis in order topresent a more accurate picture of income based on employment.What to include in measures of poverty status is the subject of somedebate, and there is currently no consensus on whether non-cashbenefits should be included along with earnings and other cash income.For example, a DWD study that reviewed AFDC and W-2 cases closed
43
4 7

When tax credits wereincluded, 46.7 percent offormer participants wereabove the poverty level.
between September 1997 and September 1999 included the estimatedvalue of food stamps, child care subsidies, and Medical Assistancebenefits in income calculations. Because of the value of these publiclyfunded benefits, the study found 92 percent of the families whose caseshad been closed to be above the poverty level, regardless of theirreported earnings. However, some question whether a family whoseincome consists primarily of publicly funded program benefits can beconsidered self-sufficient.
The current federal definition of poverty includes only earnings thatwould be reported as income on tax returns, and not the value of taxcredits or non-cash benefits such as food stamps, child care subsidies,and Medical Assistance benefits. However, we chose to include theeffect of state and federal EITCs on former W-2 participants' incomebecause the amounts of these credits can be substantial and because thetax refunds that can result may be used like cash income, for anypurpose an individual chooses. It may also be appropriate to include anychild support income received, but we were not able to determinewhether former W-2 participants with earned income also received childsupport. DWD studies indicate that up to 30 percent of formerparticipants received child support. For all participants, the value ofchild support averaged $636 annually.
Among the former W-2 participants who left the program in thefirst three months of 1998, we found that 1,377 (64.7 percent) had filed1999 Wisconsin income tax returns. Nine hundred (65.4 percent) ofthose who filed were required to do so because their incomes exceededan established threshold based on their filing status; the remaining477 (34.6 percent) were not required to file but did so to claim the stateEITC available to working families. Those who did not file presumablywere not required to do so based on their limited income, because theywere no longer Wisconsin residents, because they became eligible forSSI, or because they were supported by a spouse or other adult in thehousehold.
As shown in Table 15, the average income reported by formerW-2 participants who filed 1999 tax returns was $11,988. Whenonly that income is considered, 33.8 percent of these filers are abovethe federal poverty level for their respective family size, while66.2 percent are below it. However, the incomes of the majority offormer W-2 participants who filed 1999 tax returns were increased bystate and federal EITCs; 83.0 percent received the state credit. Statecredits provided an average benefit of $415 for all of those filing taxreturns, while combined state and federal credits averagedapproximately $2,320. If the value of these credits is included,46.7 percent of former participants in our analysis had incomes abovethe federal poverty level. It should be noted that this figure does not take
44
4 8

Table 15
Percentage of Former W-2 Participants Above the Poverty Level1999
NumberFiling
AverageAnnual
PercentageAbove PovertyLevel Based
AverageState andFederal
PercentageAbove Poverty
Filing Status Tax Returns Income on Income EITC* with EITC
Married Filing Jointly 272 $21,467 51.8% $1,942 60.3%Head of Household 861 10,499 31.6 2,839 48.1Single 240 6,663 21.3 926 26.7Married Filing Separately 4 7,662 25.0 0 25.0
Total 1,377 11,988 33.8 2,320 46.7
* Each person's federal EITC was estimated based on state tax return information.
into account more than one-third of our original sample who did not filetax returns, and therefore is likely to overstate the percentage of formerW-2 participants above the poverty level.
Not surprisingly, the group with the highest average income shown inTable 15 was married couples who filed jointly: 51.8 percent of thisgroupand 60.3 percent when tax credits are includedhad incomesabove the federal poverty level. However, we were not able todetermine the extent to which this income could be attributed toearnings of the former W-2 participant and to what extent it was earnedby a spouse.
As shown in Table 16, the highest average incomes were reported byformer W-2 participants who had been in unsubsidized casemanagement placements before leaving the program. These individualswere generally more likely to be above the poverty level than formerparticipants who left from subsidized placements. This suggests thatW-2 participants in unsubsidized placements may be more skilled, eitherwhen they enter the program or as a result of it, and therefore may bebetter able to compete for higher-paying jobs. The large percentage offormer trial job participants whose incomes exceeded the poverty levelwhen tax credits were included results from a change in the status ofonly five individuals, because there were few participants in trial jobplacements.
45
4-9
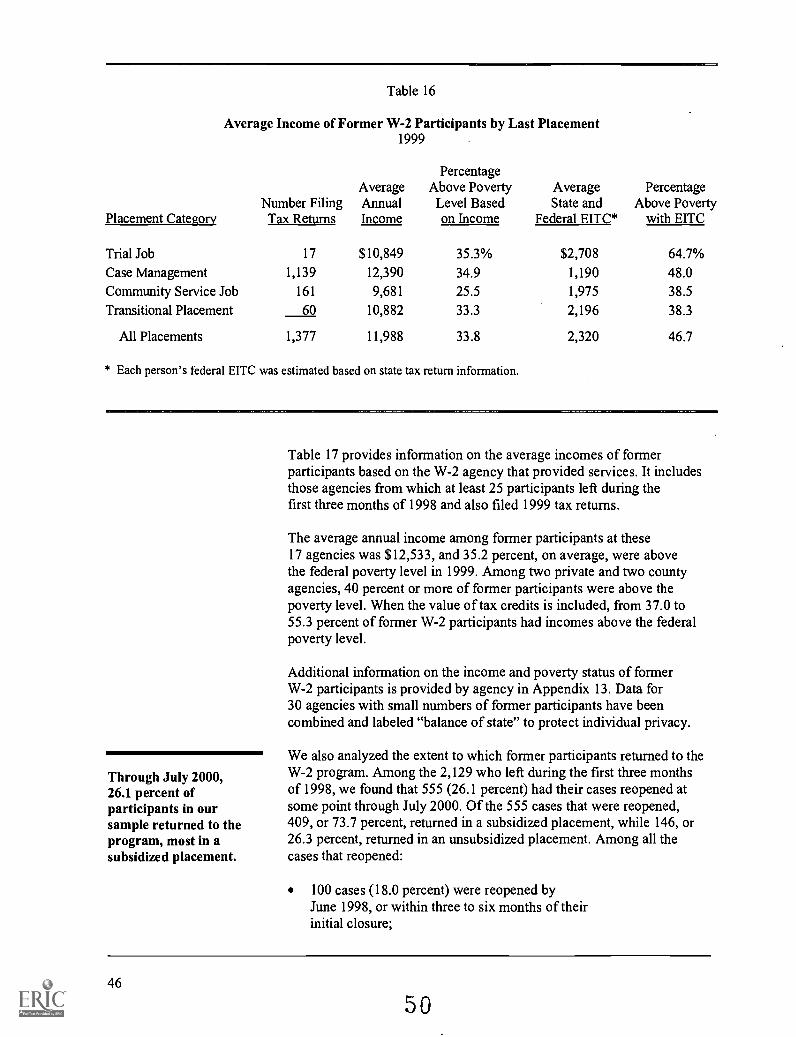
Table 16
Average Income of Former W-2 Participants by Last Placement1999
Number FilingAverageAnnual
PercentageAbove PovertyLevel Based
AverageState and
PercentageAbove Poverty
Placement Category Tax Returns Income on Income Federal EITC* with EITC
Trial Job 17 $10,849 35.3% $2,708 64.7%
Case Management 1,139 12,390 34.9 1,190 48.0Community Service Job 161 9,681 25.5 1,975 38.5
Transitional Placement 60 10,882 33.3 2,196 38.3
All Placements 1,377 11,988 33.8 2,320 46.7
* Each person's federal EITC was estimated based on state tax return information.
Through July 2000,26.1 percent ofparticipants in oursample returned to theprogram, most in asubsidized placement.
Table 17 provides information on the average incomes of formerparticipants based on the W-2 agency that provided services. It includesthose agencies from which at least 25 participants left during thefirst three months of 1998 and also filed 1999 tax returns.
The average annual income among former participants at these17 agencies was $12,533, and 35.2 percent, on average, were abovethe federal poverty level in 1999. Among two private and two countyagencies, 40 percent or more of former participants were above thepoverty level. When the value of tax credits is included, from 37.0 to55.3 percent of former W-2 participants had incomes above the federalpoverty level.
Additional information on the income and poverty status of formerW-2 participants is provided by agency in Appendix 13. Data for30 agencies with small numbers of former participants have beencombined and labeled "balance of state" to protect individual privacy.
We also analyzed the extent to which former participants returned to theW-2 program. Among the 2,129 who left during the first three monthsof 1998, we found that 555 (26.1 percent) had their cases reopened atsome point through July 2000. Of the 555 cases that were reopened,409, or 73.7 percent, returned in a subsidized placement, while 146, or26.3 percent, returned in an unsubsidized placement. Among all thecases that reopened:
100 cases (18.0 percent) were reopened byJune 1998, or within three to six months of theirinitial closure;
46
50

Table 17
Average Income of Former W-2 Participants by W-2 Agency1999
W-2 Agency
Number ofParticipantsFiling TaxReturns
AverageAnnualIncome
Percentage ofFamilies Above
the Poverty LevelBased on Income
AverageState and
Federal EITC*
Percentage ofFamilies AbovePoverty if EITC
Is Included
Maximus 123 $12,979 42.3% $2,277 55.3%Brown County 49 14,326 40.0 2,360 53.3
Employment Solutions 72 12,929 40.3 2,389 52.8Fond du Lac County 33 12,733 32.0 2,557 52.0Winnebago County 62 15,400 40.4 2,214 51.9Racine County 82 11,394 38.6 2,557 50.0Douglas County 68 11,284 37.9 2,283 50.0LIMOS 113 12,919 33.6 2,275 48.7YW Works 35 11,926 31.4 2,200 48.6Curtis & Associates, Inc.
(Waukesha County) 72 12,748 34.3 2,370 47.8Dane County 105 11,449 31.4 2,035 46.1Eau Claire County 45 12,542 28.6 3,081 45.7Marathon County 28 12,864 23.8 3,002 42.9Rock County 31 9,724 17.9 2,341 42.9Outagamie County 27 17,961 33.3 2,498 40.0Kenosha County 37 9,537 25.0 2,171 40.0OIC-GM 27 10,980 33.3 2,041 37.0
Total 1,009 12,533 35.2 2,336 49.1
* Each person's federal EITC was estimated based on state tax return information.
316 cases (56.9 percent) were reopened byDecember 1998, or within nine months to one yearof initial closure; and
493 cases (88.8 percent) were reopened byDecember 1999, or within two years of initialclosure.
We could not, however, determine whether those who filed 1999 taxreturns subsequently returned to the program, because tax returninformation provided to us by the Department of Revenue did notdisclose former participants' names or other identifying information.
5147

Table 18 shows the extent to which participants returned to variousW-2 agencies. The percentage of participants who returned to theprogram through July 2000 ranged from a high of 43.3 percent forOIC-GM, a private agency serving Milwaukee County, to a low of7.7 percent for Sawyer County.
Table 18
Participants Returning to the W-2 Program by Agency
W-2 Agency
Number Who Leftin the First ThreeMonths of 1998
Number WhoReturned through
July 2000
Percentage ofThose LeavingWho Returned
OIC-GM . 60 26 43.3%YW Works 77 33 42.9Western Wisconsin Private IndustryCouncil (Juneau County) 26 11 42.3
Fond du Lac County 39 15 38.5Dane County 188 70 37.2
Kenosha County 71 25 35.2
Employment Solutions, Inc. 124 43 34.7
Rock County 59 19 32.2
UMOS 186 57 30.6
Maximus 186 56 30.1
Outagamie County 35 10 28.6
Menominee County 32 9 28.1
Racine County 104 24 23.1
Marathon County 39 8 20.5
Winnebago County 77 15 19.5
Eau Claire County 55 10 \ 18.2
Wood County 22 4 18.2
Kaiser Group, Inc. (Walworth County) 23 4 17.4
Shawano County Job Center, Inc. 25 4 16.0
Curtis & Associates, Inc. (Waukesha County) 85 13 15.3
Sheboygan County 20 3 15.0
Douglas County 106 12 11.3
Sawyer County 26 2 7.7
Statewide Total 2,129 555 26.1
48

Both the number and thepercentage of returningW-2 participants haveincreased.
Returning Participants
To obtain a more complete picture of those who returned to theW-2 program, we analyzed available data on participants who returnedfor either cash assistance or other services. DWD officials indicate thatthe extent to which participants return is not necessarily a good measureof program success or failure, because W-2 is designed to bothencourage employment and allow participants to return if additionalservices could assist them in achieving the long-term goal of economicself-sufficiency. Nonetheless, analyzing changes in the number ofreturning participants over time, the frequency with which they return,and the reasons for which they originally left can provide informationthat is useful in assessing program effectiveness and improving servicedelivery. Furthermore, an understanding of the characteristics ofreturnees may be useful in modifying the program to address new orspecial participant needs that present barriers to employment.
Despite the significant decline in caseloads since W-2 was implementedstatewide in September 1997, we found that the number of participantswho have left and returned to the program has increased over time. Thenumber of returning participants also represents an increasingpercentage of the total caseload, as shown in Table 19.
Table 19
Participants Returning to the W-2 Program for Cash or Non-Cash Assistance
Number of Participants Returning Participants as aDate Who Had Returned* Total Caseload Percentage of Total Caseload
July 1998 599 15,896 3.8%
July 1999 3,127 11,319 27.6
July 2000 4,108 10,690 38.4
* Includes all participants who had previously been enrolled, regardless of the month they returned to theprogram.
Milwaukee County hasa greater percentage ofreturning participantsthan the balance of thestate.
In July 2000, Milwaukee County accounted for 85.2 percent of allreturning participants statewide. As shown in Table 20, returningparticipants had been 2.7 percent of all Milwaukee County participantsin July 1998 but were 42.4 percent of all Milwaukee County participantsby July 2000. In the rest of the state, returning participants increasedfrom 9.7 to 25.0 percent of W-2 participants. The percentage of
49
53

returning participants increased 39.7 percentage points in MilwaukeeCounty and 15.3 percentage points in the balance of the state during aperiod of economic growth. Therefore, there has been speculation thatreturning participants have unique characteristics that do not respondto program services as they are currently provided, or that someW-2 agencies fail to provide adequate services.
Table 20
First-Time and Returning Participants
Milwaukee County
Percentage ofCaseloadJuly 1998
Percentage ofCaseloadJuly 1999
Percentage ofCaseloadJuly 2000
First-time participants 97.3% 70.8% 57.6%Returning participants 2.7 29.2 42.4
Balance of StateFirst-time participants 90.3 79.1 75.0Returning participants 9.7 20.9 25.0
Data on returning participants are not available for the privateW-2 agencies contracted to serve Milwaukee County, but they areavailable for all other W-2 agencies and for Milwaukee County inaggregate. From these data, we found that the number of formerparticipants who returned to the program more than once has alsoincreased over time. As shown in Table 21, 96.5 percent of all formerW-2 participants who returned to the program in July 1998 werereturning for the first time. By July 1999, the percentage of formerparticipants who were returning for the first time had declined to86.1 percent of returnees statewide, and by July 2000 to 70.7 percent.Furthermore, by July 2000, 959 former W-2 participants statewide hadhad two previous case closures and were returning to the program forthe third time.
50
54

Table 21
Previous Case Closures for Returning Participants
Previous Closures
July 1998 July 1999 July 2000
Number Percentage Number Percentage Number Percentage
Milwaukee CountyOne 358 99.2% 2,312 86.7% 2,460 70.2%
Two 3 0.8 331 12.4 836 23.9Three 0 0.0 25 0.9 175 5.0
Four 0 0.0 0 0.0 27 0.8
Five 0 0.0 0 0.0 3 0.1
Subtotal 361 100.0% 2,668 100.0% 3,501 100.0%
Balance of StateOne 220 92.4% 381 83.0% 444 73.2%Two 17 7.2 66 14.4 123 20.3
Three 1 0.4 10 2.2 33 5.4
Four 0 0.0 1 0.2 5 0.8
Five 0 0.0 1 0.2 2 0.3
Subtotal 238 100.0% 459 100.0% 607 100.0%
StatewideOne 578 96.5% 2,693 86.1% 2,904 70.7%
Two 20 3.3 397 12.8 959 23.3
Three 1 0.2 35 1.1 208 5.1
Four 0 0.0 1 <0.1 32 0.8
Five 0 0.0 1 <0.1 5 0.1
Total 599 100.0% 3,127 100.0% 4,108 100.0%
Information on change in the number of returning W-2 participants fromJuly 1998 to July 2000 is provided in Appendix 14. Data are providedfor the county agencies that are W-2 contractors, as well as for threetribes and six private agencies in counties other than MilwaukeeCounty. Data are not available separately for each of the five privatecontractors in Milwaukee County but are shown in aggregate.
51
55

Because of limitations in data collected by DWD, we were unable toanalyze why returning participants had originally left W-2. However, ina review of 29,077 cases that closed from September 1997 throughSeptember 1999, DWD found that:
75.9 percent of cases closed because of increases inparticipants' incomes, usually as a result ofemployment;
9.4 percent closed because participants chose to nolonger participate;
7.9 percent closed because participants did notcomply with program eligibility requirements;
4.3 percent closed because participants no longermet eligibility requirements for reasons other thanincome; and
2.5 percent closed for other reasons.
It is not known whether the characteristics of those who returned to theprogram, such as their level of education and whether they are morelikely to have substance abuse or mental health problems, differ fromthose who did not return. Determining whether there are differencesamong participants and developing strategies to address them may beimportant to the future success of the program.
52
Factors Influencing the Effectiveness of Services
Cash benefits may besanctioned if participantsmiss work or fail toparticipate in a requiredactivity without goodcause.
If W-2 is to be effective not only in reducing caseloads but also inhelping participants to achieve self-sufficiency through employment,participants should comply with program requirements, and W-2agencies should fairly address their concerns related to eligibility andtheir compliance with program requirements. To determine the extentto which these things were occurring, we examined available data onthe sanctions, or fines, that are imposed to encourage participantsreceiving cash benefits to comply with program requirements, as wellas efforts to address participant and applicant complaints. In addition,s. 49.141(2g)(a)1, Wis. Stats., directs us to review the wages of trial jobparticipants.
Sanctions of Participant Benefits
To encourage compliance with program requirements, W-2 participantsreceiving cash benefits through community service jobs or transitionalplacements may be sanctioned $5.15 per hour for each hour they misswork or fail to participate in a required activity without good cause.Additional sanctions may be imposed on participants who commit fraudin obtaining benefits or increasing the value of their benefits, or whointentionally violate other program requirements. However, trial jobparticipants are not subject to hourly sanctions because they are paid bythe employer, and custodial parents of infants are neither required towork outside the home until the infants are older than 12 weeks norsubject to sanctions. Statutes also do not provide for sanctioning ofparticipants who are not in subsidized placements, and therefore notreceiving cash grants.
W-2 agencies also may be "sanctioned." W-2 contracts allow DWD toimpose a penalty of up to $5,000 for each failure of a W-2 agency toserve an applicant or participant. To date, DWD indicates it has beenable to address concerns related to the agencies' performance withoutimposing monetary penalties.
Only five W-2 agenciesthe Bad River Band of Chippewa andManitowoc, Marinette, Ozaukee, and Vernon countiesdid not sanctionprogram participants between October 1999 and December 2000. Inreviewing available data, we found that the percentage of participantssanctioned is greater in Milwaukee County than elsewhere in the state,and average monthly sanction amounts are higher in Milwaukee Countythan elsewhere in the state. We also found some evidence ofinappropriate sanctions.
53
57

The percentage ofparticipants sanctioned inMilwaukee County hasbeen consistently higherthan in the balance of thestate.
As shown in Table 22, the percentage of participants sanctioned hasdecreased from 31.4 percent of the statewide caseload in October 1999to 21.1 percent in December 2000. However, in Milwaukee County,which has the highest percentage of long-time AFDC recipients in itsW-2 population, the sanction rate has consistently been approximately10 percentage points higher than in the balance of the state.
Table 22
Percentage of Participants Sanctioned
Area of State October 1999 May 2000 December 2000
Milwaukee County 33.3% 28.4% 23.5%Balance of State 20.3 17.2 13.2
Statewide Average 31.4 26.0 21.1
On average, 4.4 percentof participants have theirentire monthly cashbenefit sanctioned.
Although most agencies issue sanctions, there is significant variation inthe percentage of participants they sanction, as well as in both the dollaramount and the percentage of average monthly benefit payments theysanction. For example, within Milwaukee County alone, the averagepercentage of participants sanctioned ranged from 17.8 percent forUMOS to 48.0 percent for YW Works, while the average sanctionamount ranged from $359 to $295 for these same two agencies. Inaddition, during each month between March 2000 and December 2000,an average of 255 participants, or 4.4 percent of all participantsstatewide, were sanctioned for an amount equal to their entire monthlybenefit.
We reviewed data on sanctions imposed by the 34 W-2 agencies with anaverage of at least 10 participants receiving cash benefits each month.As shown in Table 23, we found that 9 (26.5 percent) had issuedsanctions to at least 20 percent of their participants receiving cashbenefits. Conversely, 16 (47.1 percent) had issued sanctions to fewerthan 10 percent. Among the agencies that sanctioned the highestpercentage of their cash assistance caseload, YW Worksa privateagency serving Milwaukee Countyhad the highest sanction rate.
54
58
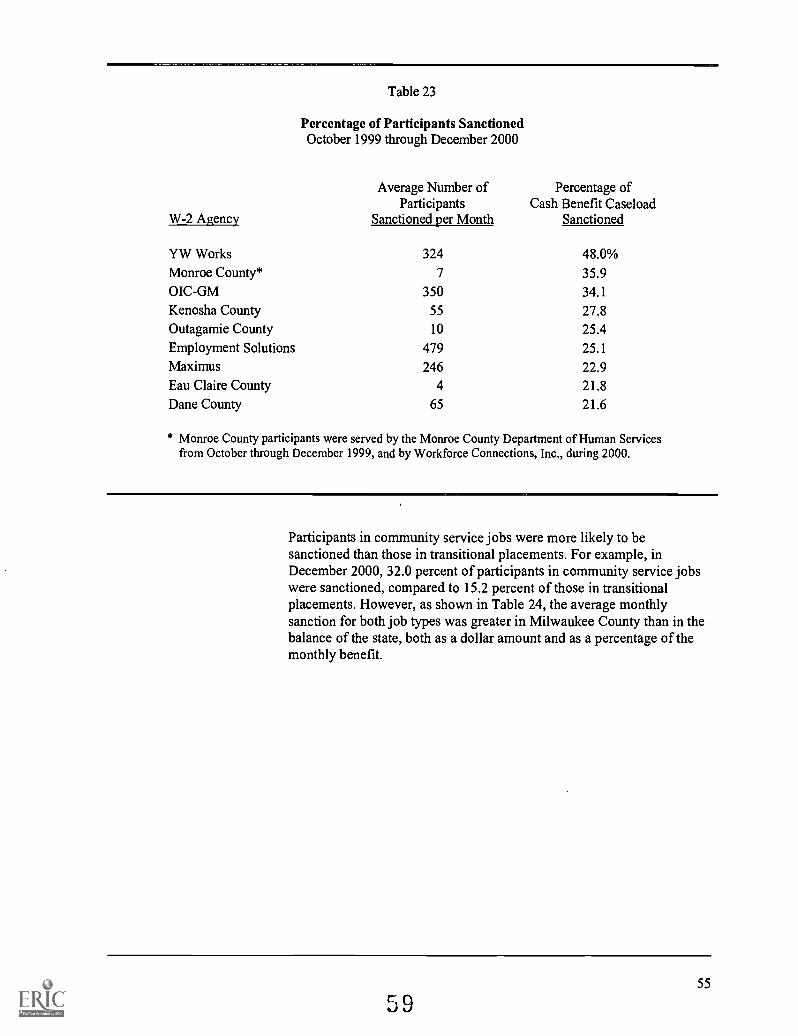
W-2 Agency
Table 23
Percentage of Participants SanctionedOctober 1999 through December 2000
Average Number of Percentage ofParticipants Cash Benefit Caseload
Sanctioned per Month Sanctioned
YW Works 324 48.0%Monroe County* 7 35.9OIC-GM 350 34.1
Kenosha County 55 27.8Outagamie County 10 25.4Employment Solutions 479 25.1
Maximus 246 22.9Eau Claire County 4 21.8Dane County 65 21.6
* Monroe County participants were served by the Monroe County Department of Human Servicesfrom October through December 1999, and by Workforce Connections, Inc., during 2000.
Participants in community service jobs were more likely to besanctioned than those in transitional placements. For example, inDecember 2000, 32.0 percent of participants in community service jobswere sanctioned, compared to 15.2 percent of those in transitionalplacements. However, as shown in Table 24, the average monthlysanction for both job types was greater in Milwaukee County than in thebalance of the state, both as a dollar amount and as a percentage of themonthly benefit.
55
59

Placement Category
Community Service Jobs*Transitional Placements
Table 24
Comparison of Average Monthly Sanction AmountsMarch 2000 through December 2000
MonthlyBenefit
Milwaukee County
AverageMonthlySanction
$673 $383628 278
Sanction as aPercentage of
Monthly Benefit
Balance of State
AverageMonthlySanction
Sanction as aPercentage of
Monthly Benefit
56.9% $262 38.9%44.3 201 32.0
* Represents benefits for those in full-time community service jobs.
As shown in Table 25, 4 of the 9 agencies that sanctioned at least20 percent of their participants receiving cash benefits were also amongthe agencies that imposed the highest average monthly sanction sinceMarch 2000.
Table 25
Sanctions as a Percentage of Benefit LevelsMarch 2000 through December 2000
W-2 Agency
Menominee County
MaximusEmployment SolutionsUMOSRacine CountyOIC-GM
Shawano County Job Center, Inc.YW Works
Waupaca CountyLa Crosse County
Average Percentage ofSanction BenefitAmount Sanctioned
$455 71.1%
386 58.9386 58.5
355 54.4
348 53.7
326 51.7
287 45.9
289 45.1
269 41.2259 41.0
56
60

From July throughDecember 2000, at least35 participants wereinappropriatelysanctioned.
W-2 was designed to allow individual W-2 agencies administrativeflexibility to modify both the type of services they provide and themanner in which services are provided in response to local needs.However, the wide variation in the number and amount of sanctions hasraised concerns about whether the benefit of increasing administrativeflexibility has come at the expense of equitable treatment of participants.The wide variation in the number and amount of sanctions we haveidentified may be, in part, the result of the discretion W-2 agencies arepermitted in sanctioning participants. Therefore, if the Legislature did notintend for such large variation in the number and amount of sanctionsamong agencies, it may wish to consider directing DWD to provideadditional guidance to W-2 agencies in their use of sanctions.
We also found that sanctions have been applied inappropriately. Fromthe available data, we could not determine how many participants intotal have been inappropriately sanctioned or whether the inappropriatesanctions hampered participants' ability to obtain unsubsidizedemployment in a timely manner or to meet interim program objectives.However, we found that in the six-month period from July 2000 throughDecember 2000, at least 35 W-2 participants who were the custodialparents of infants were inappropriately sanctioned because of errorsmade by W-2 agencies. As shown in Table 26, nine W-2 agencies issuedinappropriate sanctions against the custodial parents of infants, whichaveraged $128 per participant and represented 19 percent of theparticipants' monthly benefits. Maximus and Employment Solutionsissued the largest inappropriate sanctions, which averaged more thanone-third of participants' monthly benefits.
Employment Solutions, Kenosha County, Maximus, UMOS, andYW Works subsequently issued supplemental payments to correct someof the inappropriate sanctions against custodial parents of infants. Infive cases, corrections were made within seven days of whenparticipants' regular monthly benefit checks should have been issued. Inthe three other cases, the supplemental payments were issued later: at13 days, 20 days, and 22 days of when the benefit checks should havebeen issued. To date, the remaining 27 inappropriate sanctions againstcustodial parent of infants have not been corrected. DWD is attemptingto identify other instances of inappropriate sanctions, includingsanctions of participants in unsubsidized placements.
57
61

Table 26
Inappropriate Sanctions of Custodial Parents of InfantsJuly 2000 through December 2000
Number ofInappropriate
TotalInappropriately
Average AmountInappropriately
Average AmountInappropriately Sanctioned
as a Percentage ofW-2 Agency Sanctions Sanctioned Sanctioned Monthly Benefit
Maximus 4 $1,253 $313 46.5%Employment Solutions 8 1,803 225 33.4Kenosha County 2 228 114 16.9
UMOS 4 438 109 16.2YW Works 13 715 55 8.2Douglas County 1 21 21 3.1
Racine County 1 21 21 3.1
Fond du Lac County 1 10 10 1.5
Marathon County 1 5 5 0.7
Total 35 $4,494 128 19.0
In order to ensure that the full extent of inappropriate sanctioning byW-2 agencies is known and remedied, and that actions are taken toensure it will not happen in the future, we recommend the Department ofWorkforce Development report to the Joint Legislative Audit Committeeby September 1. 2001, on:
the results of its review related to all inappropriatesanctions imposed since the start of the W-2program, including the number of participantssanctioned, the amounts of the sanctions imposed,and the agencies that imposed the sanctions;
its plans to compensate participants who have beeninappropriately sanctioned;
the procedures it will employ to prevent W-2agencies from imposing inappropriate sanctions inthe future: and
how it plans to monitor W-2 agencies to ensure thatinappropriate sanctions have not been imposed orhave been appropriately remedied if they wereimposed.
58
62

W-2 agencies issuefindings of fact inresponse to participantcomplaints.
Resolution of Participant Complaints
Section 49.152, Wis. Stats., allows program participants and applicantsto request that W-2 agencies review their eligibility or benefits decisionsthrough a fact-finding process, which is conducted by agency staff orindependent parties with whom an agency contracts for this purpose.Fact-finding decisions may be appealedat the request of theparticipant or the agencyto DWD. DWD maintains data on thefindings of fact issued by W-2 agencies and has delegated its authorityto decide appeals to the Department of Administration's Division ofHearings and Appeals.
DWD maintains summary information on the reasons findings of facthave been requested, as shown in Table 27. The vast majority ofrequests have been related to employment issues, such as whether it wasreasonable to expect participation in an assigned W-2 activity. However,requests for findings of fact related to extensions of benefits, including a24-month time limit placed on participation in each subsidized jobcategory, may increase as participants spend more time in the programand reach time limits.
Reasons
EmploymentChild Care*
Job Access LoansExtensions of BenefitsEmergency Assistance
Total
Table 27
Reasons for Fact-Finding RequestsMay 1999 through September 2000
Number of Requests Percentage of Total
1,150
114
4437
27
83.8%
8.3
3.2
2.7
2.0
1,372 100.0%
* Includes individuals who were not in the W-2 program but who received child care subsidies.
We reviewed the disposition of requests for findings of fact fromMay 1999, the first month DWD began to centrally record this type ofinformation, through September 2000, the most recent month data hadbeen collected during our review. As shown in Table 28, 41.6 percent of
59
63

all requests were resolved through W-2 agency decisions. Thesedecisions have been fairly evenly split in favor of the agency and theparticipant. Petitioners withdrew 35.6 percent of their requests, and theremaining requests were dismissed or resolved without a hearing or arepending further action.
Disposition of Request
W-2 Agency Decision:In favor of the agencyIn favor of the petitionerSplit decision
Subtotal
Withdrawn
DismissedResolved
Pending Further Action
Total
Table 28
Disposition of Fact-Finding RequestsMay 1999 through September 2000
Number of Requests Percentage of Total
279
240
52
20.3%
17.5
3.8
571 41.6%
489225
82
5
35.6
16.4
6.0
0.4
1,372 100.0%
Approximately90 percent of fact-findingrequests were made byMilwaukee Countyparticipants.
While W-2 participants in Milwaukee County have represented nomore than 81 percent of the statewide caseload at any point since theprogram's inception, approximately 90 percent of the 1,372 requests forfindings of fact were made by Milwaukee County participants. Morethan half of the remaining 134 requests came from individuals in one ofsix counties: Racine (26 cases), Kenosha (19 cases), Brown (13 cases),Dane (12 cases), Winnebago (8 cases), and Outagamie (7 cases).
Statutes permit appeal of a W-2 agency's fact-finding decision when anapplicant or participant petitions within 21 days of the date the decisionis mailed. Statutes also require review of a fact-finding decision relatedto denial of an application based solely on a determination of financialineligibility when an applicant or participant petitions within 21 daysof the date the decision was mailed. W-2 agencies may appealfact-finding decisions at any time.
60
£4

Through December 2000,the Division of Hearingsand Appeals decided216 appeals.
Through 2000,69.9 percent of appealswere decided in favor ofparticipants.
From September 1997 through December 2000, 216 appeals of W-2agencies' findings of fact were decided by the Division of Hearings andAppeals. The primary issues that were appealed involved:
sanction of benefits (66 cases);
employment placement (21 cases);
timeliness of the fact-finding request (16 cases);
child care (9 cases);
termination of benefits (7 cases);
case closure or delay in providing benefits (7 cases); and
eligibility for benefits (6 cases).
As shown in Table 29, 69.9 percent of appeals were resolved in favor ofthe applicant or participant, whereas 26.9 percent were decided in favorof the W-2 agency. The percentage of Milwaukee County cases found infavor of the participant was 78.7 percent, compared to 51.0 percent forthe balance of the state. This may suggest that hearing officers believedinitial fact-finding decisions incorrectly favored the W-2 agencies moreoften in Milwaukee County than elsewhere in the state.
Table 29
Decisions Issued by the Division of Hearings and AppealsSeptember 1997 through December 2000
Disposition of Appeal
Ruling in Favor of Applicant/ParticipantRuling in Favor of the W-2 Agency
Withdrawn by Complainant
Total
Number of Appeals Percentage of Total
151 69.9%58 26.9
7 3.2
216 100.0%
61
05

Through July 2000,an estimated711 participants hadbeen placed in trial jobs.
As shown in Table 30, for those agencies that issued at least five fact-finding decisions through September 2000, 14.1 percent of the decisionswere appealed. The greatest number of appeals came from MilwaukeeCounty, where both the caseload and the number of fact-findingrequests were significantly larger than elsewhere in the state. However,among all the agencies shown, the appeal rate varied significantly fromthe statewide average of 14.1 percent. In three counties outside ofMilwaukee, 40 percent or more of W-2 agencies' findings of fact wereappealed. Within Milwaukee County, the rates of appeal were highestfor UMOS and YW Works. In contrast, OIC-GM, which issued370 fact-finding decisions, had a rate of appeal that was 10.0 percentagepoints lower than the statewide average. The generally lower rates inMilwaukee County may indicate that W-2 agencies there more oftenissue fact-finding decisions that are acceptable to complainants.
Finally, we reviewed the outcomes of fact-finding appeals. InMilwaukee County, the percentage of cases resolved in favor of theapplicant or participant ranged from a high of 91.7 percent for UMOS toa low of 65.4 percent for Maximus. For the appeals of fact-findingdecisions outside of Milwaukee County, decisions were more equallysplit: 51.0 percent favored the applicant or participant, and 49.0 percentfavored the agency. The difference in outcomes between MilwaukeeCounty and the rest of the state may warrant closer monitoring byDWD, especially because the five private agencies in MilwaukeeCounty serve the majority of the W-2 population.
Trial Job Wages
The use of trial jobs, which are subsidized positions that provide workexperience and training and may become permanent, unsubsidizedpositions, has been lower than many had anticipated before the start ofW-2. Through July 2000, an estimated 711 participants had been placedin trial jobs at which they earn not less than the state or federal minimumwage for each hour worked, and the employer receives no more than$300 per month for each participant who works full-time.
The main reasons W-2 agencies have cited for the infrequent use of trialjobs include:
an unemployment rate that was so low the agenciesdid not need to use trial jobs as an incentive forprivate companies to hire W-2 participants;
62
C6
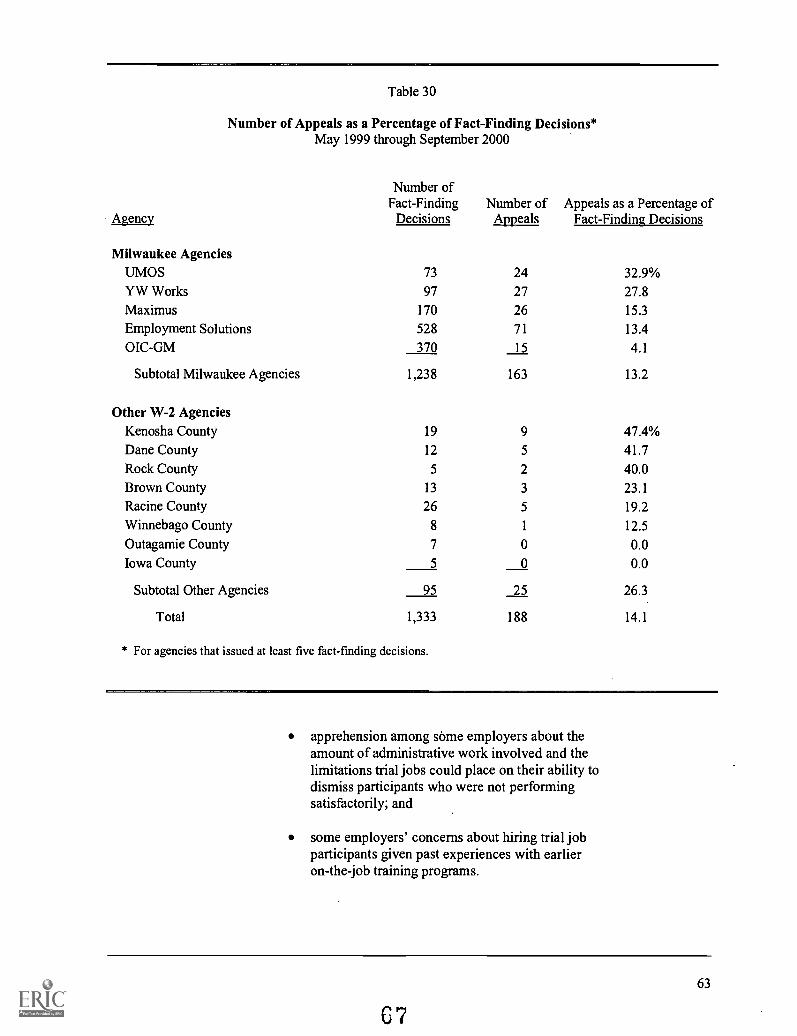
Table 30
Number of Appeals as a Percentage of Fact-Finding Decisions*May 1999 through September 2000
Number ofFact-Finding Number of Appeals as a Percentage of
Agency Decisions Appeals Fact-Finding Decisions
Milwaukee AgenciesUMOS 73 24 32.9%YW Works 97 27 27.8Maximus 170 26 15.3
Employment Solutions 528 71 13.4
OIC-GM 370 15 4.1
Subtotal Milwaukee Agencies 1,238 163 13.2
Other W-2 AgenciesKenosha County 19 9 47.4%Dane County 12 5 41.7Rock County 5 2 40.0Brown County 13 3 23.1
Racine County 26 5 19.2
Winnebago County 8 1 12.5
Outagamie County 7 0 0.0Iowa County 5 0 0.0
Subtotal Other Agencies 95 25 26.3
Total 1,333 188 14.1
* For agencies that issued at least five fact-finding decisions.
apprehension among some employers about theamount of administrative work involved and thelimitations trial jobs could place on their ability todismiss participants who were not performingsatisfactorily; and
some employers' concerns about hiring trial jobparticipants given past experiences with earlieron-the-job training programs.
63
67

DWD has not centrallymaintained complete dataon trial job participants.
There appears to be astrong relationshipbetween trial jobcompletion and theability to obtainunsubsidizedemployment.
DWD has not centrally maintained complete data on trial jobparticipants, and all information concerning their wages and placementhistories had to be collected manually from electronic case files. Weanalyzed data for 200 W-2 participants who held trial jobs during 1999.Among these, 130 participants (65.0 percent) completed their trial jobs,and 127 (63.5 percent) subsequently obtained unsubsidizedemployment. DWD officials believe that in most instances theunsubsidized jobs were the same positions participants had held as trialjobs. One of the three participants who did not obtain unsubsidizedemployment after completing a trial job was laid off, and no informationwas available for the other two.
Of the 70 participants who did not complete a trial job, none obtainedunsubsidized employment. This suggests a strong relationship betweentrial job completion and the ability to obtain unsubsidized employment.
Information on wages received in trial jobs and after participantshad moved into unsubsidized employment was available for only125 participants. None of the participants in trial jobs for whom wagedata were available was paid less than the minimum wage of $5.15 perhour. One was paid the minimum wage, but 124 were paid more. Thehighest trial job wage paid was $10.85 per hour.
In unsubsidized employment, the 125 participants who completed theirtrial jobs earned hourly wages that ranged from a low of $5.15 to a highof $12.00. The average unsubsidized wage was $7.71 per hour, whichrepresents an average annual salary $16,037 for full-time employment.Full-time employment at this wage would have placed a family ofthree above the 1999 poverty level of $13,880. However, the numberof participants working full-time cannot be determined from theinformation DWD maintains.
Table 31 shows the range of wages earned by trial job participants.Hourly earnings increased when 57 of the 125 participants for whomdata were available moved from a trial job to unsubsidized employment.The increase averaged $0.92 per hour (13.0 percent) and ranged from alow of $0.16 per hour to a high of $3.50 per hour.
64
E8

Table 31
Trial Job and Unsubsidized Wages of Selected Trial Job Participants1999
Hourly Wage
Participants inTrial Jobs
Participants in UnsubsidizedEmployment
Number Percentage Number Percentage
$6.00 or less 15 12.0% 6 4.8%$6.01 to $7.00 47 37.6 34 27.2$7.01 to $8.00 35 28.0 42 33.6$8.01 to $9.00 23 18.4 27 21.6$9.01 to $10.00 4 3.2 12 9.6$10.01 to $11.00 1 0.8 3 2.4Greater than $11.00 0 0.0 1 0.8
Total 125 100.0% 125 100.0%
DWD officials indicate that data concerning trial jobs are limitedbecause the small number of W-2 participants in trial jobs made otherdata needs a higher priority. Nevertheless, the available data suggest thattrial jobs may be an effective component of the W-2 program. Inaddition, if the economy slows, trial jobs may be needed to encourageprivate companies to provide job placements for W-2 participants.Therefore, we recommend the Department of Workforce Development:
begin to collect and analyze data on the wages of alltrial jobs participants;
ensure that these individuals are being paid at leastthe minimum wage, as required by statute; and
determine the wages paid to all former trial jobparticipants when they first enter unsubsidizedemployment.
65
69

Measuring Performance and Providing Oversight
Before the currentperformance measureswere adopted, they weremodified in response toagencies' concerns.
Assessing W-2 agencies' performance and ensuring adequate oversightof agencies' activities are essential to a program as large anddecentralized as W-2. Two of the main strategies DWD has used toaccomplish these objectives are the establishment of benchmarks forpayment of performance bonuses and contracting with the PrivateIndustry Council (PIC) of Milwaukee County to provide oversight of thefive private W-2 agencies in Milwaukee County. Although both of theseefforts were undertaken to provide programmatic accountability, theextent to which the goals of these initiatives have been accomplished isunclear, and changes may be needed.
Performance Standards
DWD officials indicate that the next W-2 contract, which will run fromJanuary 2002 through December 2003, will include $11.1 million forrestricted-use bonuses and $12.5 million for unrestricted-use bonuses.These amounts are not delineated in the Governor's 2001-03 BiennialBudget Proposal. As noted, the current implementation contracts includestandards that are intended to tie monetary incentives to performanceand address the concerns of W-2 agencies. DWD modified the currentperformance standards in its proposal for the 2002-03 contract.
The current performance standards address several concerns ofW-2 agencies. For example:
to ensure that agencies with small caseloads wouldnot be adversely affected by the outcome of a singleW-2 participant's case, DWD provided for aone-case credit to be applied in certain instances;
individuals who were assigned to an educationalactivity but did not attend within one month of theirassignment were not included in determining anagency's performance;
to avoid penalizing agencies when participantstransfer from one W-2 agency to another, indMdualswho received no services before they transferred toanother agency are not counted;
67
70

Statutes require DWD toaward future bonusesbased on six areas ofperformance.
DWD has proposedmodifying currentperformance standardsfor the 2002-03 contract.
participants who apply and are approved for SSIbenefits are not counted when determining thepercentage of participants who entered employment,because these individuals are not expected to work;and
W-2 agencies having no participants will beconsidered to have met the performance criteria forthe restricted bonus, but will not be eligible toreceive an unrestricted bonus.
DWD has proposed modifications to the performance standards for thenext W-2 contracts. The proposed modifications reflect the requirementin s. 49.143(3g), Wis. Stats., that any bonus paid after January 1, 2002,be based on six areas of performance:
success in placing participants in unsubsidizedemployment;
the extent to which unsubsidized employmentplacement is full-time or part-time;
job retention of former participants;
wages and benefits earned by former participants;
appropriate implementation of W-2; and
customer satisfaction.
In addition, statutes prohibit DWD from basing performance paymentson caseload decreases or reduced spending that is not related directly toplacement of participants in unsubsidized employment.
Several of the proposed modifications to performance standards differfrom the current standards. For example:
The current standards allow a bonus payment ifparticipants are employed 30 days after placementand another payment if participants are employed180 days after placement. The proposedmodification would allow a bonus only if both30-day and 180-day job retention criteria are met.
A current optional standard related to basic skills orjob skills training is proposed as a required standard.
68
'71

Weighting all criteriaequally may not be thebest approach to measureperformance.
The current average wage rate has been proposed tobe changed so that 50 percent of participants will berequired to demonstrate an average monthly wagegain if the agency is to meet the standard.
New measures of performance have also been proposed. For example:
to demonstrate that agencies deliver effectiveservices, maximum caseload ratios are establishedand staff must meet training requirements;
to measure customer satisfaction, participants will beasked to rate agency performance in areas such asavailable programs and services and assistanceprovided to participants by staff; and
to ensure agencies are financially accountable,agencies may have no audit findings as determinedby DWD or any audit performed by the LegislativeAudit Bureau and cannot be or have been subject toany corrective action plan for noncompliance.
Three of DWD's proposed modifications to performance standardsaddress, in part, concerns raised by the Co-chairs of the Joint LegislativeAudit Committee in a May 1999 letter to DWD's Secretary. First, amodified wage rate standard would reflect recent changes in anindividual's earnings, rather than compare them to the 1998 averagewage rate as the current standard does. Second, the modified jobretention standard related to 30 and 180 days of employment wouldrequire at least 75 percent of participants in unsubsidized positions toremain employed after 30 days and at least 50 percent to remainemployed after 180 days for a job retention bonus to be paid. Finally, amodified standard related to participation in educational activities wouldaward two bonuses, one when participants are assigned to basiceducational activities, as the current standard does, and a second ifparticipants successfully complete their assigned educational activities.
However, additional modifications may be appropriate. For example,the May 1999 letter also suggested that DWD consider a standard ofself-sufficiency that bases performance bonuses on, for example,increasing by a specified percentage the number of participants placedin unsubsidized jobs whose incomes are above the federal poverty level.In addition, the letter indicated that weighting the performance bonuscriteria equally may not be the most appropriate strategy. Specifically,to ensure performance bonuses are based on efforts to assist participantsin attaining meaningful, self-sustaining employment, participants shouldbe able to locate, acquire, and remain employed in jobs that providewages and benefits sufficient to discontinue their receipt of public
69
7 2
Since January 1997,DWD has contracted withthe PIC in Milwaukee toprovide monitoring andoversight.
assistance benefits. Consequently, it may be more appropriate for somestandards, such as the number of participants placed in jobs, to beweighted more heavily than others. These issues are not directlyaddressed by the proposed standards.
Finally, the proposal for the 2002-03 contract period indicates that inorder to be considered for the right of first selection for the next contract,which will likely run from January 2004 through December 2005, anagency must meet the base level of each standard. However, bonus fundswill only be awarded if higher levels of performance are achieved.
To ensure DWD requires W-2 agencies to meet relevant performancestandards in order to receive any bonus funds that may be includedunder future contracts, and to further ensure that the standardsdeveloped are directly linked with the W-2 program's overall, long-termgoal of enabling participants to become self-sufficient, we recommendthe Department of Workforce Development report to the JointLegislative Audit Committee by May 31, 2001, on:
the extent to which it will incorporate all of themodifications suggested by the Co-chairs of theJoint Legislative Audit Committee into the next W-2contract's performance standards;
its rationale for not incorporating any of thesuggested modifications it may choose not to adopt;and
whether standards that better measure the extent towhich those in unsubsidized jobs are successful inattaining self-sufficiency will be developed andimplemented.
Milwaukee County Oversight
The seven regional offices that manage DWD's contracts with localagencies also provide technical assistance and perform oversight ofcontracted agencies. Staff in the 17 W-2 agencies we visited weregenerally pleased with the guidance and oversight the regional officesprovide. Because the majority of W-2 cases are in Milwaukee County,there was a perceived need for additional oversight there. SinceJanuary 1997, DWD has contracted with the Private Industry Councilof Milwaukee County for a total of $7.5 million for oversight andcoordination services. Through December 2000, the PIC has been paida total of $5.7 million to provide services, which have included:
70
73

The PIC has not metall of its contractualobligations.
monitoring W-2 agencies' compliance with theprovisions of their contracts;
providing technical assistance; and
assisting in the coordination of W-2 services amongthe five Milwaukee County W-2 agencies.
However, DWD has provided the PIC with little direction in fulfillingits responsibilities, and until recently its attempts to review or correctapparent deficiencies in the PIC's performance have been limited.
Assessing Contract Performance
Under contracts in effect since January 1997, the PIC's monitoringresponsibilities have included ensuring that W-2 participants inMilwaukee County are appropriately served and ensuring that funds areappropriately spent. For example, the PIC is responsible for:
reviewing all fact-finding proceedings conducted bythe agencies and helping to correct proceduraldeficiencies;
ensuring that the agenties take appropriate action toassist participants approaching the 24-month timelimit placed on employment in each subsidizedcategory;
reviewing all agency requests for extension of the24-month time limit for receipt of cash assistance,and making recommendations to DWD;
ensuring that work performed in community servicejobs and transitional placements is consistent withparticipants' employability plans; and
through June 1999, providing financial oversightthrough reviews of cost allocation plans, theappropriateness of agency expenditures, and whetheragencies are within their budget allocations.
Since January 1998, the PIC has provided DWD with monthly reportsdetailing the activities it has performed to meet its contractualobligations. A review of the reports indicates that some of its obligationshave not been met. For example:
71
7 4

W-2 agencies haveresisted some of the PIC'soversight responsibilities.
Between July 1999 and August 2000, the PICreported reviewing approximately 2,100 of the2,885 cases it was required to review that wereapproaching the 24-month time limit. The PIC metits monthly review requirement in only 3 of14 months it was required to conduct the reviews;however, PIC staff indicate that they wereauthorized by DWD's Milwaukee Regional Office toreview fewer than the required number of cases for3 of the 11 months in which they did not meet therequirement.
Between June 1999 and August 2000;the PICreported visiting only five work sites, although itscontracts required monthly site visits.
Between January 1998 and August 2000, the PICreported reviewing more than 1,500 fact-findingrequests in Milwaukee County. For many of these,it made specific recommendations to agenciesregarding improvement of service delivery.However, it is unknown whether the W-2 agenciesimplemented any of these recommendations becauseno systematic follow-up procedures had beenestablished.
In addition, although contract language requires the PIC to reviewall agency requests for extensions of the 24-month time limit forparticipation in subsidized employment positions, both PIC and DWDstaff indicate this has not occurred because it is not necessary under thereview process that has developed. DWD staff indicate that the existingprocessunder which W-2 agencies forward extension requests directlyto DWD's regional office for approval without review by the PICismore efficient and allows agencies to develop a better understanding ofthe documentation needed to support extension requests beforefinalizing them.
A primary area of concern is the extent to which the PIC wasresponsible for performing the financial oversight required under itsmonitoring contracts between January 1997 and July 1999. The PIC didperform required budget monitoring by comparing agency expenditurereports with monthly budgets to ensure that expenditures were withinbudgeted amounts. However, PIC staff indicate more extensive financialmonitoring, such as reviewing whether agency expenditures wereappropriate, was not performed as a result of resistance from theW-2 agencies and subsequent DWD guidance directing it not toexercise these financial oversight responsibilities. Based on a lack ofdocumentation regarding any agreements that were reached, DWD
72
75

officials indicated they were not in a position to clarify past decisions.However, the current contract with the PIC, which began in July 1999,contains no financial monitoring responsibilities. It is possible thatsome of the inappropriate W-2 expenditures made by Maximus andEmployment Solutions, which we identified in reports released inJuly 2000 and February 2001, could have been avoided or addressedmore quickly if DWD had more quickly resolved the PIC's monitoringresponsibilities.
PIC staff currently provide technical assistance to W-2 agencies inthree primary ways:
providing caseload-related data and reports;
assisting in the development of local policies; and
clarifying W-2 policies and procedures.
The PIC has reported that it provided caseload reports, participantdemographic information, or other data to W-2 agencies inapproximately 130 instances since January 1998. Since July 1999, thePIC has substantially increased its efforts in this area by working moreclosely with W-2 agency staff on specific data requests. It addition, it isresponding to an increasing number of agency requests for informationregarding caseload figures and other computerized reports. The PIC hasalso provided assistance in developing local policies, such as a fraudreferral policy and the current policy governing inter-region casetransfers.
Finally, the PIC has responsibility to coordinate its own activities withthose of the five W-2 agencies in Milwaukee County. In the past, thePIC has coordinated community and media relations among theW-2 agencies, employer contacts and job fairs for the agencies, andadministration and promotion of the seven job centers in which theW-2 agencies are located. Although provisions citing specificcoordination activities have been removed from the current contract, thePIC retains responsibility for general coordination of the W-2 agenciesaccording to written parameters that were to have been agreed upon byDWD and the PIC. However, no such parameters have been developed,and the PIC continues to coordinate activities largely as it had underprevious contracts, by attending meetings with DWD, W-2 agencies,community-based organizations, and other interested parties.
Between January 1998 and June 1999, the PIC reported attendingapproximately 440 meetings to gather and provide information abouttopics such as W-2 operations, welfare-to-work, child abuse prevention,and BadgerCare. The PIC has been less active in this role sinceJuly 1999, attending only about 120 such meetings. This decrease is
73
7 6

The PIC reportedcoordinating nine jobfairs betweenJanuary 1998 andAugust 2000.
Until recently, DWD didnot regularly review thePIC's reports or provideguidance.
likely due to a decrease in funding for coordination activities, as well asa reduced need for coordination among the W-2 agencies as theirexperience with the program increased.
The PIC appears to have been most successful at coordinating activitiesthat fall into its traditional areas of expertise, such as creating additionalcontacts with employers by organizing job fairs. The PIC reportedcoordinating nine job fairs between January 1998 and August 2000 andconducting employer and participant follow-up activities, such asdetermining the number of participants who found employment, foreach. In addition, the PIC plays an important role in operating the ClientAssistance for Re-employment and Economic Support (CARES)computer network by providing W-2 agency access to the CARESsystem and by performing server maintenance.
Improving Oversight of PIC Activities
Although the PIC has provided DWD with monthly reports detailinghow it has carried out its contractual obligations since January 1998,DWD has not regularly reviewed the reports or required apparentdeficiencies to be corrected, and the limited guidance DWD hasprovided to the PIC has been confusing at times. For example, DWDapproved all 12 plans the PIC submitted for carrying out its contractualresponsibilities, even though a number of the plans do not appear toprovide much more detail than the contract language itself did.
DWD also provided conflicting guidance on how the PIC was toimplement the financial oversight provisions of its contract. It was notuntil 15 months after the contract term began that DWD was able toclarify that the PIC was not required to contract with an independentaccounting firm for additional oversight of the W-2 agencies, and evenafter this issue was resolved PIC staff remained unclear about whetherDWD intended them to follow through with the other financial oversightprovisions of the contract.
In October 2000, DWD completed a review to determine whether thePIC had complied with the terms of its contracts and whether thecontinuation of its current contract was justified. After examining themonthly reports from January 2000 through July 2000, DWD concludedin an internal memorandum that the PIC had not met the terms of itscontract by performing all tasks assigned to it. For example, DWDfound:
the required number of fact-finding cases, child Carecases, and work sites had not been reviewed;
74
77

The Governor's 2001-03Biennial Budget Proposalincludes $500,000annually to continue thePIC's oversight role.
the number of case reviews was insufficient, andthese reviews did not include sufficient analysis,were not timely, and were not shared with theW-2 agencies;
the PIC's monthly reimbursement claims did notcorrespond to activities performed; and
little is known of the effectiveness of the PIC's work.
In addition, DWD surveyed the Milwaukee County W-2 agencies toassess the PIC's provision of technical assistance. Agencies weregenerally critical of the PIC and indicated it:
is rarely used for technical assistance;
is not always effective in providing technicalassistance; and
is usually the last contact an agency might make fortechnical assistance.
PIC officials have expressed concern that DWD did not share allspecific fmdings of its review with them. Nevertheless, W-2 agencies inMilwaukee County have been apprehensive of the PIC's role since it firstbegan to review their activities in 1997. Given that part of the PIC's roleis to provide oversight, it is possible that the W-2 agencies' view of thePIC is to some extent influenced by the PIC's oversight responsibilities.
DWD has proposed a number of remedies for the deficiencies identified,such as auditing the PIC and changing the format of the monthly PICreports to reflect contract requirements. DWD's review of the PIC'sactivities and its plan to require changes should enhance the PIC'sperformance and improve the quality of information available onW-2 agencies in Milwaukee County. Although DWD's budget requestdid not include any funding to continue the PIC's role in W-2 monitoringand oversight, the Governor's 2001-03 Biennial Budget Proposalincludes funding for the PIC totaling $1.0 million over the biennium,representing a 50 percent reduction from current funding levels. Itshould be noted that the Governor has also proposed spending anadditional $500,000 annually for oversight of all W-2 agencies, althoughthe exact nature of the oversight activities is not specified in the 2001-03Biennial Budget Proposal. Therefore, the Legislature will need todetermine the amount of funding it wishes to appropriate for allmonitoring and oversight responsibilities and the role of DWD inensuring effective use of these funds.
75
7 8

Future Considerations
The Legislature andDWD have a number ofissues to address in thefuture.
Since W-2 took effect statewide in September 1997 it has had greatsuccess in reducing cash assistance caseloads, and it appears to have hadsome success in helping participants achieve self-sufficiency throughemployment. However, returning participants represent a growingpercentage of the caseload. Local W-2 agencies have raised concernsabout current and future contract funding, and they anticipate servingparticipants with significant barriers to employment. Issues affecting thefuture of the W-2 program that the Legislature and DWD may wish toconsider include:
whether the challenges posed by participants withmultiple or severe barriers to employment are beingadequately addressed;
how best to address the needs of participants whoare nearing the time limits established for receipt ofservices;
how best to assist individuals who have entered theworkforce but remain in poverty in becoming fullyself-sufficient; and
whether to consolidate its contracts to administer theprogram in Milwaukee County.
DWD notes that it has undertaken a number of initiatives to addressemerging issues and integrate efforts to provide W-2 and other servicesto program participants. For example, in March 2001, DWD releasedthree reports it had contracted for on the changing nature of the W-2caseload, ways to enhance job retention and advancement, and how bestto meet the needs of participants with multiple barriers to employment.Two additional reports on integrating non-custodial parents into thefamily and breaking the cycle of dependency on public assistance haveyet to be released. In addition, in February 2001, DWD consolidatedtwo of its divisions to better address a number of issues, includingmeeting the future needs of W-2 participants.
77
9

Those with barriers toemployment wereexpected to remain in theprogram longer thanothers.
The available data do notsuggest that those in theprogram have substantialbarriers to employment.
Assessing Barriers to Employment
Several months after the implementation of W-2, when reductions tocash assistance caseloads began to be noted, some local agency officialsbegan to anticipate difficulty in serving individuals who were likely toremain in the program. It was expected that participants with prior jobexperience, higher levels of education, and fewer barriers toemployment such as disabilities and mental health or substance abuseproblems would find unsubsidized jobs and leave the program beforethose with more significant barriers to employment. That group wasexpected to be more likely to remain in the program for longer periodsand to begin to constitute a substantial portion of the W-2 caseload.
Although the W-2 population is increasingly composed of returningparticipants, available data do not suggest that the current caseloadconsists only of those with higher-than-expected barriers toemployment. In fact, the limited data available suggest that, on average,current W-2 participants may have fewer barriers to employment thanthose who participated in prior years.
As shown in Table 32, trends indicate that the average educational levelattained by participants has increased over time, while the extent towhich participants, their dependents, or other members of theirhouseholds have disabilities has remained fairly steady or has declined.The percentage of participants who were high school graduates or whohad completed high school equivalency requirements increased slightly,from 45.9 percent in January 1998 to 48.3 percent in July 2000. Duringthe same period, the percentage of participants who either haddisabilities or had household members with disabilities declined from5.9 percent to 5.1 percent. For these data, participants are considered tohave a disability if a physician's examination or other professionalassessment determines that they have a physical or mental condition thatimpairs one or more major life functions. In general, other individualswithin the household are determined to have a disability if they qualifyfor SSI or SSDI, or if they receive any other federal payments based ona disability.
Because information on the specific services provided toW-2 participants was not collected until 2000, it is not possible todetermine whether there has been an increase in the number ofparticipants who receive services for significant barriers to employment.However, data from 2000 do not suggest that a large percentage of theexisting caseload has such barriers. As noted, only 7.9 percent ofparticipants were provided with disability assessments, 6.0 with mentalhealth counseling, and 2.6 percent with alcohol and other drug abuse(AODA) counseling in 2000.
78
80
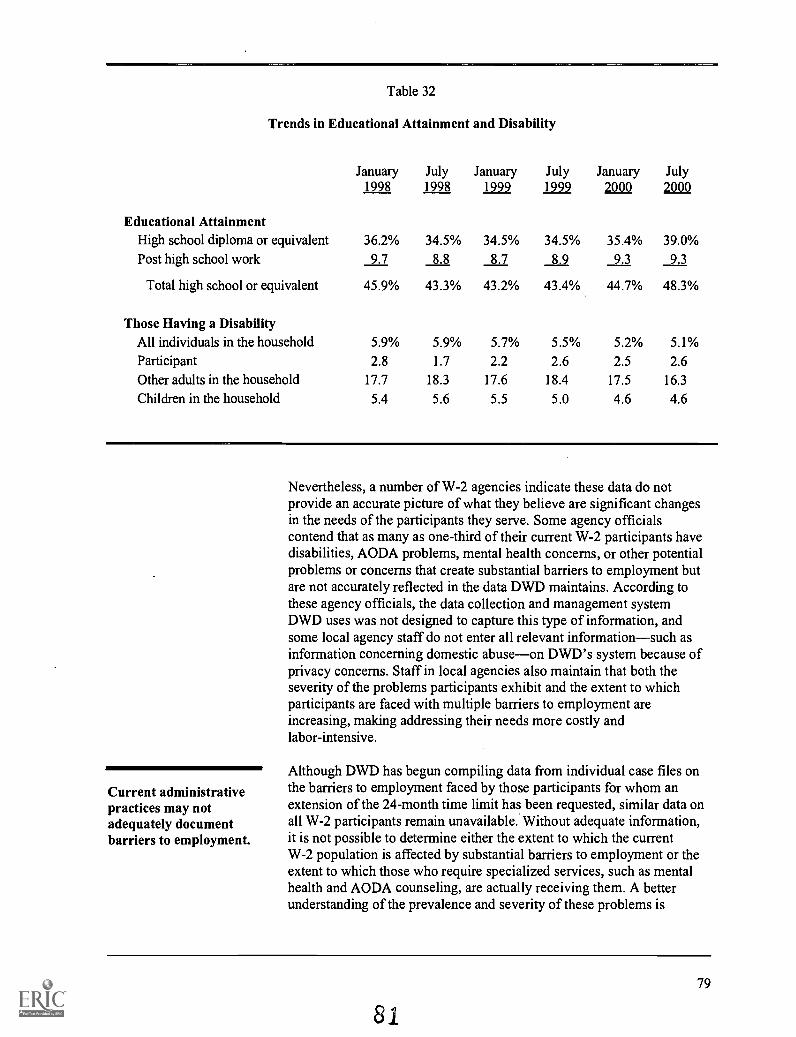
Table 32
Trends in Educational Attainment and Disability
Educational Attainment
January1998
July1998
January1999
July1999
January2000
July2000
High school diploma or equivalent 36.2% 34.5% 34.5% 34.5% 35.4% 39.0%Post high school work 9.7 8.8 8.7 8.9 9.3 9.3
Total high school or equivalent 45.9% 43.3% 43.2% 43.4% 44.7% 48.3%
Those Having a DisabilityAll individuals in the household 5.9% 5.9% 5.7% 5.5% 5.2% 5.1%Participant 2.8 1.7 2.2 2.6 2.5 2.6Other adults in the household 17.7 18.3 17.6 18.4 17.5 16.3
Children in the household 5.4 5.6 5.5 5.0 4.6 4.6
Current administrativepractices may notadequately documentbarriers to employment.
Nevertheless, a number of W-2 agencies indicate these data do notprovide an accurate picture of what they believe are significant changesin the needs of the participants they serve. Some agency officialscontend that as many as one-third of their current W-2 participants havedisabilities, AODA problems, mental health concerns, or other potentialproblems or concerns that create substantial barriers to employment butare not accurately reflected in the data DWD maintains. According tothese agency officials, the data collection and management systemDWD uses was not designed to capture this type of information, andsome local agency staff do not enter all relevant information-such asinformation concerning domestic abuse-on DWD's system because ofprivacy concerns. Staff in local agencies also maintain that both theseverity of the problems participants exhibit and the extent to whichparticipants are faced with multiple barriers to employment areincreasing, making addressing their needs more costly andlabor-intensive.
Although DWD has begun compiling data from individual case files onthe barriers to employment faced by those participants for whom anextension of the 24-month time limit has been requested, similar data onall W-2 participants remain unavailable. Without adequate information,it is not possible to determine either the extent to which the currentW-2 population is affected by substantial barriers to employment or theextent to which those who require specialized services, such as mentalhealth and AODA counseling, are actually receiving them. A betterunderstanding of the prevalence and severity of these problems is
79
81
Most participants nearingprogram eligibility limitsare in Milwaukee County.
I
Responses to programeligibility limits raisequestions about equityand dependency.
important to determining the range of services participants need and thelevel of funds required to address them. Individual staff may haveknowledge of a specific participant's situation, but if these problems arenot documented, there is no way to determine whether the W-2 agencyhas made appropriate referrals or provided adequate services. Inaddition, without this information neither DWD nor W-2 agencies canmake informed decisions regarding requests for extension of programservices. Therefore, we recommend the Department of WorkforceDevelopment revise its data collection procedures to ensure that:
the type and severity of barriers to employmentfaced by individual participants are more completelydocumented; and
these data are regularly compiled and reviewed byDWD staff
Addressing the Needs of Participants Nearing Eligibility Limits
The earliest date at which any W-2 participant could exhaust the60-month lifetime limit on program services is September 2001, when68 individuals could potentially do so. There is also a 24-month statutorylimit to participation in each subsidized W-2 employment position.Through June 2000, that limit was approached by 1,551 participants.More than 90 percent of those approaching both time limits reside inMilwaukee County.
W-2 agencies are 'authorized to seek extensions of both the 60-monthand the 24-month limit under conditions specified in federal law or statestatutes. Variation in the extent to which extensions have been requestedhas raised concerns about whether program participants are beingtreated inequitably because of the flexibility W-2 agencies are allowedin providing services, as well as whether some agencies' efforts toobtain extensions may undermine the program goal of helpingparticipants to achieve self-sufficiency through employment.
Under both federal and state law, the 60-month lifetime limit applies tofull or partial monthswhich do not have to be consecutivein whichan individual W-2 participant or any other adult in the participant'shousehold:
participates in a subsidized W-2 employmentposition (trial job, community service job, orW-2 transitional placement);
80
82

Both federal and statelaw allow extensionsunder some conditions.
68 participants havereceived cash benefits ineach month since 1996.
is subject to a sanction of benefits fornoncompliance with W-2 program rules andregulations;
has actively participated in the former JobOpportunities and Basic Skills Program sinceOctober 1, 1996; and
has received benefits that were funded by TANFdollars in Wisconsin or any other state.
Federal law allows assistance beyond the 60-month lifetime limit for upto 20 percent of a state's average monthly caseload, if those familieshave a hardship or include members who have been battered or subjectto extreme cruelty. The State also allows program eligibility to beextended beyond 60 months, based on circumstances such as:
an inability to work because of personal disability orincapacitation;
a need for the participant to provide care to anothermember of the W-2 assistance group whose healthand well-being would be significantly affectedwithout the participant's assistance;
low achievement ability, learning disability,emotional problems, or family problems of suchseverity that they prevent the participant fromobtaining or retaining unsubsidized employment butare insufficient to meet SSI or SSDI requirements;and
an inability to find unsubsidized employment thatpays at least the minimum wage because of locallabor market conditions.
The most recent data available during the course of our audit indicatethat as of November 2000, the number of individuals who used asubstantial percentage of their lifetime 60-month limit was fairly small.Through November 2000, 68 of 39,916 individuals (0.2 percent)received benefits in each month since October 1996 and had the fewestnumber of months of eligibility left within their lifetime limits. DWDcompiles data on all participants who have received benefits for46 months or more, which indicate that through November 2000,279 individuals had done so. Of these 279 individuals,267 (95.7 percent) resided in Milwaukee County.
81
83

Under the 24-month statutory limit, participants are limited to24 monthswhich need not be consecutivein each of thethree categories of subsidized employment available through W-2: thatis, a participant is eligible to be employed for no more than 24 monthsin a community service job, 24 months in a transitional placement, and24 months in a trial job, unless an extension is granted by DWD or by aW-2 agency with the approval of DWD. Participants are notified thatthey are approaching the 24-month limit when they have reached21 months in any position type. At that time, the W-2 agencyresponsible for providing services is expected to focus more intensivelyon finding options to address the participant's situation. If a participanthas made all appropriate efforts to find unsubsidized employment andhas been unable to do so because of local market conditions, anextension may be requested.
As shown in Table 33, 56.2 percent of the 1,551 W-2 participants whowere approaching the 24-month time limit in a subsidized position at theend of June 2000 left the program. The 40.6 percent who continued toreceive program services either were granted extensions to remain in thesame position, moved to different subsidized positions, left subsidizedemployment but remained in the program to receive case managementservices, or received other program services.
A number of concerns have been raised about the granting of extensionsto W-2 participants approaching program time limits. Questions havebeen raised about whether all participants are treated equitably whenW-2 agencies exercise the flexibility the program allows them toexperiment with different approaches to address local needs. There isconcern, for example, that private W-2 agencies and those administeredby county governments request extensions to the 24-month eligibilitylimit at different rates.
82
8 4

Disposition
Table 33
Dispositions of Cases Approaching 24-Month Time LimitThrough June 2000
Number of PercentageCases of Total
Program Participation ContinuedParticipant moved to a different subsidized position category 244 15.7%Extension requested for current subsidized position 209 13.5Participant left subsidized employment and entered case management 169 10.9Participant received other program services 7 0.5
Subtotal 629 40.6%
Program Participation EndedParticipant obtained employment and left W-2 379 24.4%Participant chose not to participate or declined additional services 269 17.3Participant determined ineligible for continued participation 113 7.3Participant determined to be ready for employment 61 3.9Participant began receiving SSI, SSDI, or caretaker supplementand was thus ineligible for W-2 44 2.8
Other 7 0.5
Subtotal 873 56.2%
Unknown
Total
49 3.2
1,551 100.0%
83
85

As shown in Table 34, the five private agencies in Milwaukee Countyrequested extensions less frequently than W-2 agencies in the balance ofthe state, most of which were county agencies. Outside of MilwaukeeCounty, W-2 agencies requested extensions for 53.6 percent of their153 participants who were approaching the program's 24-month limit toemployment in a subsidized position category. In contrast, the fiveprivate agencies in Milwaukee County requested extensions for13.4 percent of their 1,398 participants approaching the 24-month limit.Among the five private agencies, extensions were also requested atdifferent rates, ranging from 8.1 to 31.3 percent of the agency caseload.
Table 34
Extensions Requested by W-2 AgenciesThrough June 2000
Number of ParticipantsApproaching the
Number ofExtensions
Percentage ofParticipants for Whom
W-2 Agency 24-Month Limit Requested Extensions Were Requested
MilwaukeeYW Works 99 31 31.3%UMOS 215 56 26.0Maximus 226 24 10.6
OIC-GM 354 35 9.9
Employment Solutions 504 41 8.1
Subtotal 1,398 187 13.4
Balance of State 153 82 53.6
Total 1,551 269 17.3
Some argue that private agencies request fewer extensions becauseprivate agencies are more successful in addressing participants' needs,and have therefore found extensions unnecessary. Others suggest thatthe lower percentage of extensions requested by W-2 agencies inMilwaukee County does not indicate better performance, but rather thatthe Milwaukee County agencies may be moving participants fromone subsidized position category to another or determining that they areready to move from subsidized employment to a case managementservices placement based on the time limit rather than on their progress
84
86
Future challenges includeincreasing participants'incomes and reducing thenumber who return.
in developing skills necessary to become self-sufficient throughemployment.
There is also concern related to the 60-month limit among those whofear that broad use of extensions may undermine the program's goal ofreducing welfare dependency and promoting self-sufficiency. Currentlaw allows DWD flexibility in determining the length of any extensionsgranted, and no time limits have been specified.
Over the next several years, it is unclear how many individuals will beplaced in the position of seeking extensions to their 60-month limit onlifetime eligibility. Although fewer than 225 participants are likely to beaffected by this limit by the end of 2001, the manner in which the initialcases are addressed will establish the pattern for how others are dealtwith. Therefore, we recommend the Department of WorkforceDevelopment report to the Joint Legislative Audit Committee bySeptember 1, 2001. on:
the number of participants for whom W-2 agencieshave requested. or by the end of 2001 are likely torequest, extensions to the 60-month time limit, aswell as the W-2 agencies currently serving theseparticipants;
the characteristics of participants, or the specificcircumstances they face. that have led to therequests for extensions;
how individual W-2 agencies plan to assess andrespond to these requests; and
the procedures the Department will use indetermining which requests for extensions it plans toreview and whether it intends to provide guidance orset specific parameters for the length of time forwhich extensions will be granted.
Considering Future Program Modifications
Although W-2 has been successful at encouraging employment andreducing cash assistance caseloads, a substantial percentage of thosewho are employed remain in poverty, and publicly financed programssuch as Medical Assistance and the Food Stamp and Wisconsin SharesChild Care Subsidy programs remain essential to supporting formerparticipants in unsubsidized employment. In the future, challenges forWisconsin's welfare reform efforts will likely include enhancing theincomes of program participants to make them truly self-sufficient,
85
67

while at the same time working to reduce the number of formerparticipants who return to the program.
Meeting these challenges will require a number of policy andadministrative questions to be answered. First, DWD will need to assesswhether sufficient steps have been taken to address access to servicesthat can reduce the need for cash assistance, including whether W-2participants, former participants, and other low-income individuals:
are aware that they may continue to qualify forreceipt of food stamps and, as required by federallaw, are encouraged to apply for these benefits,which was discussed in a previous Audit Bureaureport (report 00-8);
are aware of and have access to health programs forlow-income families, such as Medical Assistance,BadgerCare, and the Birth to 3 program; and
are aware of and have access to Kinship Care,energy assistance programs, and other localprograms available to provide support andcounseling.
Second, the Legislature will need to determine the level and type offunds available to support low-income families who are striving toachieve self-sufficiency, including:
whether future contracts should continue to provideincentives such as community reinvestment andperformance bonus funds to W-2 agencies, orwhether these resources would be better used to fundstate initiatives that more directly address themovement of former W-2 participants out ofpoverty;
whether W-2 contractors who misspend public fundsshould be financially penalized for their actions;
how to address the substantial increase in childcare funding costs that will result if subsidies forlow-income working families are maintained atcurrent levels, which was discussed in a previousAudit Bureau report (report 01-1); and
86
88

Program changes may beneeded to accomplishW-2's long-term goals.
how best to work with Wisconsin's congressionaldelegation to ensure that the reauthorization of theTANF legislation, which is expected by 2002,provides adequate flexibility and funding to addressWisconsin's changing welfare reform needs.
Finally, DWD and the Legislature will need to determine how potentialobstacles to future program success can be overcome, including:
how best to encourage non-custodial parents inlow-income families to become more involvedin the well-being of their children;
whether more guidance should be provided toW-2 agencies in sanctioning participants fornoncompliance with program rules;
whether more attention should be given todetermining what types of services are mosteffective in facilitating movement of formerW-2 participants out of poverty, and therebyreducing their reliance on other types of publicassistance;
whether more attention should be given tounderstanding the reasons a growing number ofparticipants are returning to the W-2 program;
whether the current focus of W-2 agencies onassisting participants in finding jobs based on theirexisting skills, rather than providing more vocationaland other training that may assist them in obtaininghigher-paying jobs, is the most appropriateapproach, or whether with more training, fewerparticipants would return to the program; and
how best to serve the large number of individualswho could potentially be eligible to return to theprogram in the event of an economic downturn.
The manner in which these issues are addressed will likely determine theform W-2 takes in the future, as well as how the State believes its limitedresources can best be invested to further the goals of the program. Changeswill likely be needed if the program is to accomplish its next challenge ofassisting a greater percentage of former participants to find and retainemployment that allows them to raise themselves out of poverty.
87
69

In addition, consideration could be given to whether consolidation ofcontracts in Milwaukee County would result in greater effectiveness andlower costs. In September 1997, there were 16,425 W-2 participants inMilwaukee County. By September 2000, that number had fallen to 8,578,or by 47.8 percent. Consequently, five contractors may no longer beneeded to adequately serve the remaining participants. Moreover,reducing the number of contractors in Milwaukee County may improveservices and reduce costs by:
creating competition for the right to provide programservices;
reducing the disruption of services by eliminatingthe need for some participants who move within thecounty to seek services from different administrativeagencies;
reducing administrative costs by, for example,reducing the number of administrators and othermanagers needed for program administration; and
improving oversight of contractor spending, whichhas become an issue given examples ofinappropriate spending that occurred with two of thefive Milwaukee contractors during the program'sinitial implementation period.
88
90

Appendix 1
Profiles of 17 W-2 Agencies
This appendix describes the organization, primary services, and expenditures of the 17 W-2 agencies wevisited during the course of our evaluation. The information is organized by the county in which servicesare delivered and is categorized as follows:
AGENCYnames the W-2 provider or providers for the county, which may be a county social orhuman service agency or a private agency;
SERVICE DELIVERY AREAmay be a county or portion of a county;
USE OF FUNDS AVAILABLE UNDER THE INITIAL IMPLEMENTATION CONTRACTprovides informationon expenditures under the contract in effect from September 1997 through December 1999, theagency's planned use of unrestricted profits, and planned use of community reinvestment funds;
USE OF FUNDS AVAILABLE UNDER THE CURRENT IMPLEMENTATION CONTRACTprovidesinformation on current contract expenditures, potential bonus funds available under the currentcontract, and progress in meeting established performance standards;
CASELOAD INFORMATIONshows changes in cash benefit and case management cases fromSeptember 1997 to September 2000;
SANCTIONSindicates the number and dollar amount of participant sanctions issued in one month,September 2000; and
FACT-FINDING REVIEWSsummarizes the number, type, and outcome of fact-finding reviewsrequested by participants.
91

BROWN COUNTY
AGENCY: Brown County Department of Human Services
SERVICE DELIVERY AREA: Brown County
USE OF FUNDS AVAILABLE UNDER THE INITIAL IMPLEMENTATION CONTRACT:
The Brown County Department of Human Services spent $6.3 million under the initial implementationcontract, of which the agency reports $2.6 million (41.3 percent) was subcontracted service expenditures.As a result of unexpended initial implementation contract funding, the agency received profits of$2.4 million and community reinvestment funds of $4.9 million.
Initial Implementation Contract ExpendituresSeptember 1997 through December 1999
Direct Services:
Expenditures Percentage of Total
Work activities $1,257,395 20.0%Eligibility determination 1,370,243 21.8Case management 363,711 5.8FSET services 530,351 8.4Skills training 72,059 1.2Post-employment services 1,254,620 19.9Educational activities 177,592 2.8
Subtotal $5,025,971 79.9%
Cash Benefits:Community service jobs $ 330,525 5.3%Transitional jobs 267,176 4.2Sanctions* 13,422 0.2Trial jobs 16,972 0.3
Subtotal $ 628,095 10.0%
Administration $ 548,416 8.7%
Additional Services:Contracted child care $ 0 0.0%Job access loans 800 <0.1Emergency assistance 85,036 1.4Other FSET services 2,928 <0.1
Subtotal $ 88,764 1.4%
Total $6,291,246 100.0%
* Except in Milwaukee County, sanctions of participants' grants were counted as expenditures and were chargedagainst an agency's contract. Milwaukee agencies retained all sanctioned funds from the implementation contract.
Brown County 1-2
92

Use of Profits Under the Initial Implementation Contract
The Brown County Department of Human Services reports that it is using its $2.4 million in unrestrictedprofits to offset the 1999, 2000, and 2001 county tax levy.
Planned Use of Community Reinvestment Funds Under the Initial Implementation Contract
Supplement to W-2 and related programs $1,417,416Services to children at risk for placement in institutional settings and their families, to
help maintain the child in the community and to prevent institutional placements 1,000,000Funds provided to the United Way for grants to community-based organizations and
educational institutions for legal services, occupational training, and enhanced childcare referrals 999,999
Services to families with newborns, including home visits, parent education, earlychildhood education and development screenings, and social activities 747,696
Job retention bonuses for participants 300,000Parenting education program 236,542Case management services to pregnant and parenting teens, to help them to stay in
school, graduate, and become self-sufficient 88,200Kinship Care Programcase management 64,155Kinship Care Programsupport group 10.000
Total $4,864,008
USE OF FUNDS AVAILABLE UNDER THE CURRENT IMPLEMENTATION CONTRACT:
The Brown County Department of Human Services' current W-2 contract is for $3.8 million to provideW-2 and related services from January 2000 through December 2001. Between January 2000 andSeptember 2000, $1,312,759, or 34.5 percent of the contract budget, was spent. An additional $267,000 inbonus funds will be available to the Brown County Department of Human Services if it meets establishedperformance standards.
Current Implementation Contract ExpendituresJanuary 2000 through September 2000
Total ExpendituresPercentage of Total as a Percentage of
Expenditures Expenditures Contract Budget
Direct Services $1,069,645 81.5%Cash Benefits 72,301 5.5Administration 137,694 10.5Additional Services 33.119 2.5
Total $1,312,759 100.0% 34.5%
1-3
93
Brown County

Potential Bonus Funds Under the Current Implementation ContractAvailable after December 31, 2001
Total Performance Bonus Funds Available:Restricted bonus $114,327Unrestricted bonuses 152,436
$266,763
Projected Bonus Based on Performance Standards through December 2000: $254,060Restricted bonus $114,327Unrestricted bonuses 139,733
Progress in Meeting Performance Standards Under the Current Implementation ContractAs of December 31, 2000
Meeting Meeting MeetingPerformance Performance PerformanceStandards for Standards for Standards for
Restricted First Unrestricted Second UnrestrictedBonus? Bonus? Bonus?
Entered Employment Yes Yes YesAverage Wage Rate Yes Yes YesJob Retention-30 Days Yes No NoJob Retention-180 Days Yes Yes YesHealth Insurance Benefits Yes Yes YesFull and Appropriate Engagement Yes Yes YesBasic Educational Activities Yes Yes YesFaith-Based Contract (optional) Not Applicable Not Applicable YesBasic Skills/Job Skills (optional) Not Applicable Not Applicable No
CASELOAD INFORMATION: Overall, the participant caseload declined 86.1 percent fromSeptember 1997 to September 2000.
Cash benefit casesCase management casesTotal
September 1997 September 2000 Percentage Change
26013
182038 (86.1%)273
SANCTIONS: The Brown County Department of Human Services sanctioned one community servicejobs participant for $542 in September 2000.
Brown County 1-4

FACT-FINDING REVIEWS: Between May 1999 and September 2000, 11 participants requested13 fact-finding reviews. Information on complaint topics and outcomes is summarized in the followingtable:
Topic of ComplaintRuled in Favor
of AgencyRuled in Favor
of ApplicantRequest
Withdrawn
Employment 1 1 2Child care 5 1 2Emergency assistance 1 0 0Job access loan 0 0 024-month extension 0 0 0
Total 7 2 4
1-5
D5
Brown County

DANE COUNTY
AGENCY: Dane County Department of Human Services
SERVICE DELIVERY AREA: Dane County
USE OF FUNDS AVAILABLE UNDER THE INITIAL IMPLEMENTATION CONTRACT:
The Dane County Department of Human Services spent $18.7 million under the initial implementationcontract, of which the agency reports $6.1 million (32.6 percent) was subcontracted service expenditures.As a result of unexpended initial implementation contract funding, the agency received profits of$2.6 million and community reinvestment funds of $3.1 million.
Initial Implementation Contract ExpendituresSeptember 1997 through December 1999
Direct Services:
Expenditures Percentage of Total
Work activities $ 2,983,879 15.9%Eligibility determination 4,054,596 21.7Case management 759,803 4.1FSET services 1,372,215 7.3Skills training 452,935 2.4Post-employment services 135,794 0.7Educational activities 230,145 1.2
Subtotal $ 9,989,367 53.3%
Cash Benefits:Community service jobs $ 3,681,512 19.7%Transitional jobs 1,891,899 10.1
Sanctions* 546,808 2.9Trial jobs 51,680 0.3
Subtotal $ 6,171,899 33.0%
Administration $ 1,835,464 9.8%
Additional Services:Contracted child care $ 188,400 1.0%Job access loans 232,089 1.2Emergency assistance 313,806 1.7Other FSET services 0 0.0Subtotal $ 734,295 3.9%
Total $18,731,025 100.0%
* Except in Milwaukee County, sanctions of participants' grants were counted as expenditures and were chargedagainst an agency's contract. Milwaukee agencies retained all sanctioned funds from the implementation contract.
Dane County 1-6
"6

Use of Profits Under the Initial Implementation Contract
The Dane County Department of Human Services reports that of its $2.6 million in unrestricted profits:
$1,257,000 was used to provide housing services, including counseling and rental assistance, during2000 and 2001;$994,000 was used to fund medical services for general assistance clients during 1999 and 2000; and$349,000 has not been budgeted for a specific purpose.
Planned Use of Community Reinvestment Funds Under the Initial Implementation Contract
Case management and AODA treatment for non-custodial parents leaving jail $ 710,884Services to link individuals to full-time employment and advancement opportunities 370,697Housing vouchers to prevent evictions or secure housing 439,641Culturally appropriate services for Southeast Asian adults with disabilities 290,500Youth employment services 279,000Supplement to W-2 and related programs 255,036Development of employee assistance services at employment sites 212,712Coordination of job center and neighborhood services 168,000Employment services for absent parents 149,574Expansion of emergency food and clothing services 82,400Neighborhood stabilization and housing counseling services 65,000Transportation services 60,000Culturally appropriate case management services for families moving to employment 40,000
Total $3,123,444
USE OF FUNDS AVAILABLE UNDER THE CURRENT IMPLEMENTATION CONTRACT:
Dane County Department of Human Services' current W-2 contract is for $17.0 million to provide W-2and related services from January 2000 through December 2001. Between January 2000 andSeptember 2000, $6,574,128, or 38.7 percent of the contract budget, was spent. An additional$1.2 million in bonus funds will be available to the Dane County Department of Human Services if itmeets established performance standards.
Current Implementation Contract ExpendituresJanuary 2000 through September 2000
Total ExpendituresPercentage of Total as a Percentage of
Expenditures Expenditures Contract Budget
Direct Services $3,563,202 54.2%Cash Benefits 1,480,265 22.5Administration 690,286 10.5Additional Services 840,375 12.8
Total $6,574,128 100.0% 38.7%
1-7
97
Dane County

Potential Bonus Funds Under the Current Implementation ContractAvailable after December 31, 2001
Total Performance Bonus Funds Available:Restricted bonus $509,597Unrestricted bonuses 679,460
Projected Bonus Based on Performance Standards through December 2000:Restricted bonus $509,597Unrestricted bonuses 622,837
$1,189,057
$1,132,434
Progress in Meeting Performance Standards Under the Current Implementation ContractAs of December 31, 2000
Meeting Meeting MeetingPerformance Performance PerformanceStandards for Standards for Standards for
Restricted First Unrestricted Second UnrestrictedBonus? Bonus? Bonus?
Entered Employment Yes Yes YesAverage Wage Rate Yes Yes YesJob Retention-30 Days Yes Yes YesJob Retention-180 Days Yes No NoHealth Insurance Benefits Yes Yes YesFull and Appropriate Engagement Yes Yes YesBasic Educational Activities Yes Yes YesFaith-Based Contract (optional) Not Applicable Not Applicable YesBasic Skills/Job Skills (optional) Not Applicable Not Applicable No
CASELOAD INFORMATION: Overall, the participant caseload declined 42.6 percent fromSeptember 1997 to September 2000.
Cash benefit casesCase management cases
September 1997 September 2000 Percentage Change
940 3055 237
Total 945 542 (42.6%)
SANCTIONS: The Dane County Department of Human Services sanctioned 75 participants inSeptember 2000. Information on the type of cases sanctioned and average sanction amount issummarized in the following table:
Placement Type Number of Participants Sanctioned Average Sanction AmountCommunity service job 58 $289Transitional placement 17 195Other 0 0Total 75 268
Dane County 1-8
98

FACT-FINDING REVIEWS: Between May 1999 and September 2000, 12 participants requested12 fact-finding reviews. Information on complaint topics and outcomes is summarized in the followingtable:
Topic of Complaint
Ruled inFavor ofAgency
Ruled inFavor of
ParticipantRequest
WithdrawnRequest
Dismissed
Employment 5 1 1 1
Child care 3 0 1 0Emergency assistance 0 0 0 0Job access loan 0 0 0 024-month extension 0 0 0 0
Total 8 1 2 1
1-9
v9
Dane County

EAU CLAIRE COUNTY
AGENCY: Eau Claire County Department of Human Services
SERVICE DELIVERY AREA: Eau Claire County
USE OF FUNDS AVAILABLE UNDER THE INITIAL IMPLEMENTATION CONTRACT:
The Eau Claire County Department of Human Services spent $4.1 million under the initialimplementation contract, of which the agency reports $0.7 million (17.1 percent) was on subcontractedservice expenditures. As a result of unexpended initial implementation contract funding, the agencyreceived profits of $1.5 million and community reinvestment funds of $3.0 million.
Initial Implementation Contract ExpendituresSeptember 1997 through December 1999
Direct Services:
Expenditures Percentage of Total
Work activities $ 704,800 17.3%Eligibility determination 784,165 19.3Case management 280 <0.1FSET services 277,760 6.8Skills training 329,929 8.1Post-employment services 0 0.0Educational activities 122.384 3.0Subtotal $2,219,318 54.5%
Cash Benefits:Community service jobs $ 393,295 9.7%
Transitional jobs 350,119 8.6Sanctions* 22,371 0.5Trial jobs 8,471 0.2Subtotal $ 774,256 19.0%
Administration $ 992,746 24.4%
Additional Services:Contracted child care $ 0 0.0%Job access loans 1,550 <0.1Emergency assistance 84,882 2.1Other FSET services 0 0.0Subtotal $ 86,432 2.1%
Total $4,072,752 100.0%
* Except in Milwaukee County, sanctions of participants' grants were counted as expenditures and were chargedagainst an agency's contract. Milwaukee agencies retained all sanctioned funds from the implementation contract.
Eau Claire County 1-10
100

Use of Profits Under the Initial Implementation Contract
The Eau Claire County Department of Human Services reports that it is using its $1.5 million inunrestricted profits for the following activities:
$592,000 for a youth assessment center, to provide services to delinquent youth and prevent out-of-home placements;$536,000 to provide case management services, activities, and other services to adjudicateddelinquents and youth in out-of-home placements, to reduce recidivism, truancy, and placements inmore restrictive settings;$152,000 for development and start-up costs for the county job center;$150,000 for funding Department of Human Services operations in 1999; and$35,000 for miscellaneous projects and services.
Planned Use of Community Reinvestment Funds Under the Initial Implementation Contract
Full-day kindergarten through the Eau Claire School District $ 518,000Child care resource development staff to work with businesses and providers to
expand child care options 380,000Funds not designated for a specific purpose 235,000Parent education and support services provided through the Family Resource Center 170,000Emergency shelter, case management, and post-shelter support services for families
and pregnant women 160,000In-home family counseling and education for families at risk of disintegration or
disruption due to abusive, insufficient, or inadequate parenting 120,000Child care services for homeless shelter residents 81,960Education and work linkage program for youth 80,000Early intervention services to families at risk for child abuse and neglect 76,000Literacy services 75,000Deferred prosecution services to reduce family violence and assist with maintaining
employment 75,000Family strengthening program for Hmong families 75,000Services to youth to prevent gang affiliation and violence 75,000Quality assurance and monitoring activities related to the administration of
community reinvestment projects 73,000Parenting education, classes, and activities for families in the Augusta School
District Early Intervention program 70,000Expansion of employment and training services for non-W-2 families 67,436Counseling, family stabilization services, and employment assistance for victims of
domestic, violence and their families 65,000Itinerant AODA services provided to high school and middle school students 61,000Expansion of W-2 related services to include individuals ineligible for W-2 services
due to income limits 60,000Supportive parenting program for parents with cognitive limitations 55,000Job coach and mentoring services to individuals in need of workplace support 50,000Employment enhancement services for newly employed Hmong workers and
Hmong youth 50,000Expansion of services to youth through the Big Brothers Big Sisters program 50,000Education services to increase employability of community members 50,000Expansion of after-school activities 47,088Transportation grant matching funds 40,000Emergency food and household items for needy families 31,875
Eau Claire County

Planned Use of Community Reinvestment Funds Under the Initial Implementation Contract
Supportive services provided by a free medical clinic $ 29,685Child abuse prevention services, including assessment and parenting skills training 25,000Building rehabilitation and installation of a security system for a domestic violence
shelter 5.000
Total $2,951,044
USE OF FUNDS AVAILABLE UNDER THE CURRENT IMPLEMENTATION CONTRACT:
The Eau Claire County Department of Human Services' current W-2 contract is for $3.2 million toprovide W-2 and related services from January 2000 through December 2001. Between January 2000 andSeptember 2000, $966,790, or 30.2 percent of the contract budget, was spent. An additional $223,000 inbonus funds will be available to the Eau Claire County Department of Human Services if it meetsestablished performance standards.
Current Implementation Contract ExpendituresJanuary 2000 through September 2000
Direct ServicesCash BenefitsAdministrationAdditional Services
Total
ExpendituresPercentage of Total
Expenditures
Total Expendituresas a Percentage ofContract Budget
$608,23679,799
219,25759.498
62.9%8.2
22.76.2
30.2%$966,790 . 100.0%
Potential Bonus Funds Under the Current Implementation ContractAvailable after December 31, 2001
Total Possible Performance Bonus Funds Available:Restricted bonus $ 95,613Unrestricted bonuses 127,484
Projected Bonus Based on Performance Standards through December 2000:Restricted bonus $ 95,613Unrestricted bonuses 95,613
Eau Claire County 1-12
102
$223,097
$191,226

Progress in Meeting Performance Standards Under the Current Implementation ContractAs of December 31, 2000
Meeting Meeting MeetingPerformance Performance PerformanceStandards for Standards for Standards for
Restricted First Unrestricted Second UnrestrictedBonus? Bonus? Bonus?
Entered Employment Yes Yes YesAverage Wage Rate Yes Yes YesJob Retention-30 Days Yes Yes NoJob Retention-180 Days Yes Yes NoHealth Insurance Benefits Yes Yes YesFull and Appropriate Engagement Yes Yes YesBasic Educational Activities Yes No NoFaith-Based Contract (optional) Not Applicable Not Applicable YesBasic Skills/Job Skills (optional) Not Applicable Not Applicable No
CASELOAD INFORMATION: Overall, the participant caseload declined 85.4 percent fromSeptember 1997 to September 2000.
Cash benefit casesCase management casesTotal
September 1997
1981
199
September 2000
1613
29
Percentage Change
(85.4%)
SANCTIONS: The Eau Claire County Department of Human Services sanctioned two participants inSeptember 2000. Information on the type of cases sanctioned and average sanction amount issummarized in the following table:
Placement TypeCommunity service jobTransitional placementOtherTotal
Number of Participants Sanctioned1
1
02
Average Sanction Amount$216
720
144
FACT-FINDING REVIEWS: Between May 1999 and September 2000, two participants requestedtwo fact-finding reviews. Information on complaint topics and outcomes is summarized in the followingtable:
Topic of ComplaintRuled in Favor
of AgencyRuled in Favorof Participant
RequestWithdrawn
Employment 0 0 0Child care 2 0 0Emergency assistance 0 0 0Job access loan 0 0 024-month extension 0 0 0
Totals 2 0 0
1-13
103
Eau Claire County

FOND DU LAC COUNTY
AGENCY: Fond du Lac County Department of Social Services
SERVICE DELIVERY AREA: Fond du Lac County
USE OF FUNDS AVAILABLE UNDER THE INITIAL IMPLEMENTATION CONTRACT:
The Fond du Lac County Department of Social Services spent $1.9 million under the initialimplementation contract, of which the agency reports approximately $12,000 (0.6 percent) wassubcontracted service expenditures. As a result of unexpended initial implementation contract funding,the agency received profits of $465,000 and community reinvestment funds of $833,000.
Initial Implementation Contract ExpendituresSeptember 1997 through December 1999
Direct Services:
Expenditures Percentage of Total
Work activities $ 173,855 9.3%Eligibility determination 134,163 7.2Case management 219,257 11.8FSET services 125,775 6.8Post-employment services 92,171 5.0Skills training 101,787 5.5Educational activities 46,816 2.5
Subtotal $ 893,824 48.1%
Cash Benefits:Community service jobs $ 279,746 15.0%Transitional jobs 245,272 13.2Sanctions* 10,110 0.5Trial jobs 691 <0.1
Subtotal $ 535,819 28.7%
Administration $ 359,553 19.3%
Additional Services:Contracted child care $ 0 0.0%Job access loans 50,294 2.7Emergency assistance 15,844 0.9Other FSET services 5.374 0.3
Subtotal $ 71,512 3.9%
Total $1,860,708 100.0%
* Except in Milwaukee County, sanctions of participants' grants were counted as expenditures and were chargedagainst an agency's contract. Milwaukee agencies retained all sanctioned funds from the implementation contract.
Fond du Lac County 1-14
104
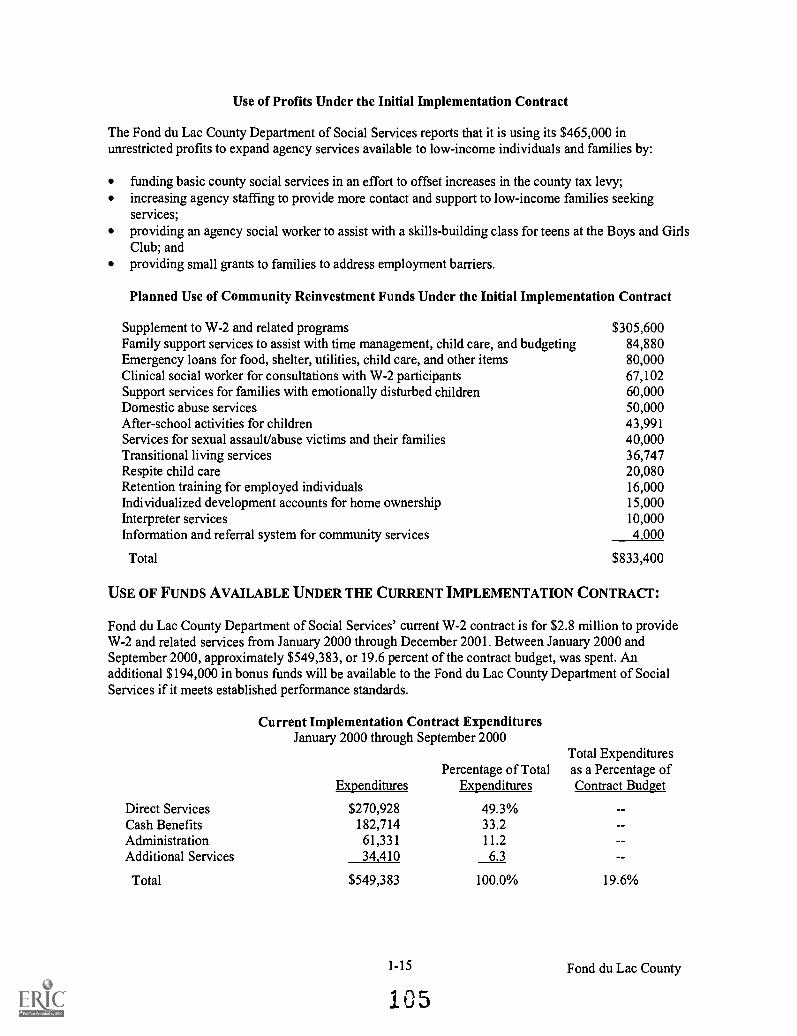
Use of Profits Under the Initial Implementation Contract
The Fond du Lac County Department of Social Services reports that it is using its $465,000 inunrestricted profits to expand agency services available to low-income individuals and families by:
funding basic county social services in an effort to offset increases in the county tax levy;increasing agency staffing to provide more contact and support to low-income families seekingservices;providing an agency social worker to assist with a skills-building class for teens at the Boys and GirlsClub; andproviding small grants to families to address employment barriers.
Planned Use of Community Reinvestment Funds Under the Initial Implementation Contract
Supplement to W-2 and related programs $305,600Family support services to assist with time management, child care, and budgeting 84,880Emergency loans for food, shelter, utilities, child care, and other items 80,000Clinical social worker for consultations with W-2 participants 67,102Support services for families with emotionally disturbed children 60,000Domestic abuse services 50,000After-school activities for children 43,991Services for sexual assault/abuse victims and their families 40,000Transitional living services 36,747Respite child care 20,080Retention training for employed individuals 16,000Individualized development accounts for home ownership 15,000Interpreter services 10,000Information and referral system for community services 4.000
Total $833,400
USE OF FUNDS AVAILABLE UNDER THE CURRENT IMPLEMENTATION CONTRACT:
Fond du Lac County Department of Social Services' current W-2 contract is for $2.8 million to provideW-2 and related services from January 2000 through December 2001. Between January 2000 andSeptember 2000, approximately $549,383, or 19.6 percent of the contract budget, was spent. Anadditional $194,000 in bonus funds will be available to the Fond du Lac County Department of SocialServices if it meets established performance standards.
Current Implementation Contract ExpendituresJanuary 2000 through September 2000
Direct ServicesCash BenefitsAdministrationAdditional Services
Total
ExpendituresPercentage of Total
Expenditures
Total Expendituresas a Percentage ofContract Budget
$270,928182,71461,33134.410
49.3%33.211.26.3
19.6%$549,383 100.0%
1-15
105Fond du Lac County

Potential Bonus Funds Under the Current Implementation ContractAvailable after December 31, 2001
Total Possible Performance Bonus Funds Available:Restricted bonusUnrestricted bonuses
$193.886$ 83,094
110,792
Projected Bonus Based on Performance Standards through December 2000: $189,270Restricted bonus $ 83,094Unrestricted bonuses 106,176
Progress in Meeting Performance Standards Under the Current Implementation ContractAs of December 31, 2000
Meeting Meeting MeetingPerformance Performance PerformanceStandards for Standards for Standards for
Restricted First Unrestricted Second UnrestrictedBonus? Bonus? Bonus?
Entered Employment Yes Yes YesAverage Wage Rate Yes Yes YesJob Retention-30 Days Yes Yes YesJob Retention-180 Days Yes Yes NoHealth Insurance Benefits Yes Yes YesFull and Appropriate Engagement Yes Yes YesBasic Educational Activities Yes Yes YesFaith-Based Contract (optional) Not Applicable Not Applicable YesBasic Skills/Job Skills (optional) Not Applicable Not Applicable No
CASELOAD INFORMATION: Overall, the participant caseload declined 1.5 percent fromSeptember 1997 to September 2000.
Cash benefit casesCase management cases
Total
September 1997 September 2000 Percentage Change
653
68
402767 (1.5%)
SANCTIONS: The Fond du Lac County Department of Social Services sanctioned one communityservice job participant for $191 in September 2000.
FACT-FINDING REVIEWS: Between May 1999 and September 2000, one participant requested afact-finding review related to child care. The case was resolved in favor of the agency.
Fond du Lac County 1-16
106

GRANT COUNTY
AGENCY: Grant County Department of Social Services, which is a member of and administrativeagency for the Southwest Consortium, a collaborative effort by Grant, Green, Iowa, Lafayette, andRichland counties to provide W-2 services.
SERVICE DELIVERY AREA: Grant County
USE OF FUNDS AVAILABLE UNDER THE INITIAL IMPLEMENTATION CONTRACT:
The Grant County Department of Social Services spent $560,000 under the initial implementationcontract. Because Grant County was one of five counties in the Southwest Consortium, it was notpossible to determine the amount of funds subcontracted specifically for services in Grant County. As aresult of unexpended initial implementation contract funding, the agency received profits that amountedto approximately $223,000 and community reinvestment funds that amounted to approximately $376,000.
Initial Implementation Contract ExpendituresSeptember 1997 through December 1999
Direct Services:
Expenditures Percentage of Total
Work activities $ 15,501 2.8%Eligibility determination 195,868 35.0Case management 1,647 0.3FSET services 113,900 20.3Skills training 12,652 2.3Post-employment services 4,017 0.7Educational activities 2.354 0.4
Subtotal $345,939 61.8%
Cash Benefits:Community service jobs $ 44,490 7.9%Transitional jobs 47,003 8.4Sanctions* 686 0.1
Trial jobs 0 0.0Subtotal $ 92,179 16.4%
Administration $102,671 18.3%
Additional Services:Contracted child care $ 0 0.0Job access loans 0 0.0Emergency assistance 300 0.1Other FSET services 19,120 3.4Subtotal $ 19,420 3.5%
Total $560,209 100.0%
* Except in Milwaukee County, sanctions of participants' grants were counted as expenditures and were chargedagainst an agency's contract. Milwaukee agencies retained all sanctioned funds from the implementation contract.
Grant County 1-18
Ion
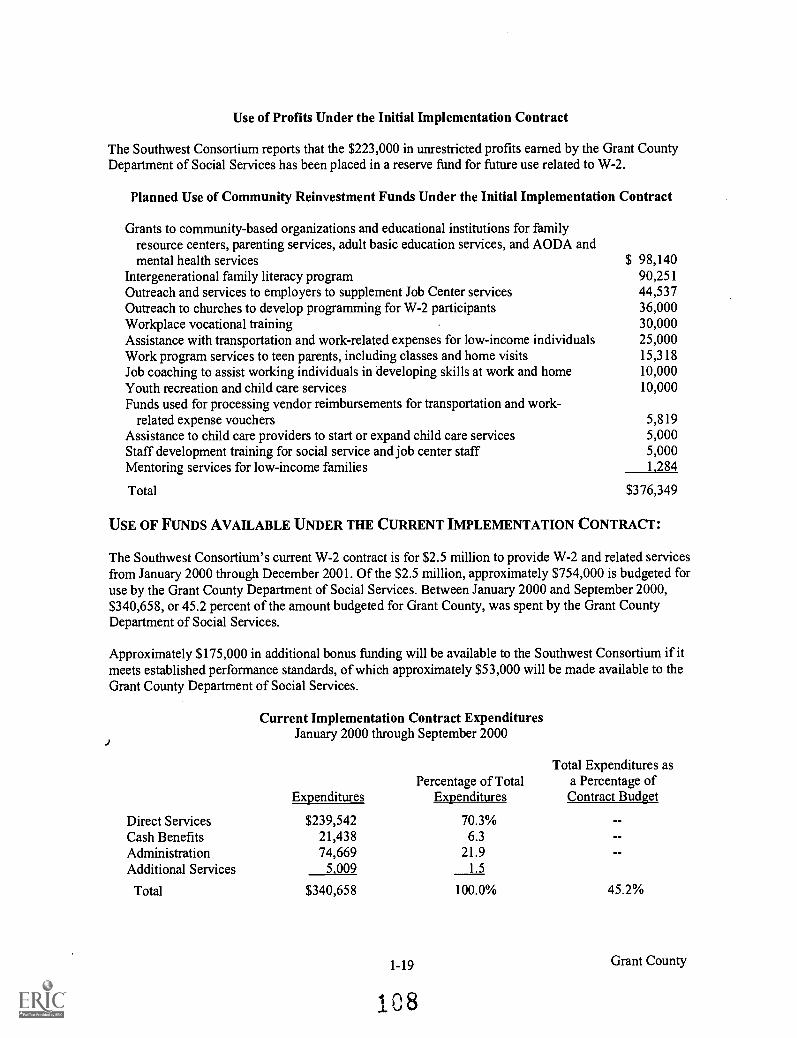
Use of Profits Under the Initial Implementation Contract
The Southwest Consortium reports that the $223,000 in unrestricted profits earned by the Grant CountyDepartment of Social Services has been placed in a reserve fund for future use related to W-2.
Planned Use of Community Reinvestment Funds Under the Initial Implementation Contract
Grants to community-based organizations and educational institutions for familyresource centers, parenting services, adult basic education services, and AODA andmental health services $ 98,140
Intergenerational family literacy program 90,251Outreach and services to employers to supplement Job Center services 44,537Outreach to churches to develop programming for W-2 participants 36,000Workplace vocational training 30,000Assistance with transportation and work-related expenses for low-income individuals 25,000Work program services to teen parents, including classes and home visits 15,318Job coaching to assist working individuals in developing skills at work and home 10,000Youth recreation and child care services 10,000Funds used for processing vendor reimbursements for transportation and work-
related expense vouchers 5,819Assistance to child care providers to start or expand child care services 5,000Staff development training for social service and job center staff 5,000Mentoring services for low-income families 1,284
Total $376,349
USE OF FUNDS AVAILABLE UNDER THE CURRENT IMPLEMENTATION CONTRACT:
The Southwest Consortium's current W-2 contract is for $2.5 million to provide W-2 and related servicesfrom January 2000 through December 2001. Of the $2.5 million, approximately $754,000 is budgeted foruse by the Grant County Department of Social Services. Between January 2000 and September 2000,$340,658, or 45.2 percent of the amount budgeted for Grant County, was spent by the Grant CountyDepartment of Social Services.
Approximately $175,000 in additional bonus funding will be available to the Southwest Consortium if itmeets established performance standards, of which approximately $53,000 will be made available to theGrant County Department of Social Services.
Current Implementation Contract ExpendituresJanuary 2000 through September 2000
ExpendituresPercentage of Total
Expenditures
Total Expenditures asa Percentage ofContract Budget
Direct Services $239,542 70.3%Cash Benefits 21,438 6.3Administration 74,669 21.9Additional Services 5,009 1.5
Total $340,658 100.0% 45.2%
1-19 Grant County
108

Potential Bonus Funds Under the Current Implementation ContractAvailable after December 31, 2001
Total Performance Bonus Funds Available: $52,799Restricted bonus $22,628Unrestricted bonuses 30,171
Projected Bonus Based on Performance Standards through December 2000:Restricted bonusUnrestricted bonuses
$22,62830,171
$52,799
Progress in Meeting Performance Standards Under the Current Implementation Contract*As of December 31, 2000
Meeting Meeting MeetingPerformance Performance PerformanceStandards for Standards for First Standards for
Restricted Unrestricted Second UnrestrictedBonus? Bonus? Bonus?
Entered Employment Yes Yes NoAverage Wage Rate Yes Yes YesJob Retention-30 Days Yes Yes YesJob Retention-180 Days Yes Yes YesHealth Insurance Benefits Yes Yes YesFull and Appropriate Engagement Yes Yes YesBasic Educational Activities Yes Yes YesFaith-Based Contract (optional) Not Applicable Not Applicable YesBasic Skills/Job Skills (optional) Not Applicable Not Applicable No
* Reported information is for the entire Southwest Consortium.
CASELOAD INFORMATION: Overall, the participant caseload declined 89.7 percent fromSeptember 1997 to September 2000.
Cash benefit casesCase management casesTotal
September 1997 September 2000 Percentage Change29
1
30
325 (83.3%)
SANCTIONS: The Grant County Department of Social Services sanctioned no participants inSeptember 2000.
Grant County 1-20
109

FACT-FINDING REVIEWS: Between May 1999 and September 2000, three participants requestedfive fact-finding reviews. Information on complaint topics and outcomes is summarized in the followingtable:
Topic of Complaint
Ruled in Favorof Agency
Ruled in Favorof Participant
RequestWithdrawn
Employment 2 1 0Child care 0 0 0Emergency assistance 0 0 0Job access loan 1 1 024-month extension 0 0 0
Totals 3 2 0
1-21
110
Grant County

KENOSHA COUNTY
AGENCY: Kenosha County Department of Human Services
SERVICE DELIVERY AREA: Kenosha County
USE OF FUNDS AVAILABLE UNDER THE INITIAL IMPLEMENTATION CONTRACT:
The Kenosha County Department of Human Services spent $16.4 million under the initial implementationcontract, of which the agency reports $5.1 million (31.1 percent) was subcontracted service expenditures.As a result of unexpended initial implementation contract funding, the agency received profits of$1.6 million and community reinvestment funds of $1.1 million.
Initial Implementation Contract ExpendituresSeptember 1997 through December 1999
Direct Services:
Expenditures Percentage of Total
Work activities $ 2,905,580 17.7%Eligibility determination 6,223,414 38.0Case management 0 0.0FSET services 418 <0.1Skills training 228,335 1.4Post-employment services 1,198,311 7.3Educational activities 556,876 3.4Subtotal $11,112,934 67.8%
Cash Benefits:Community service jobs $ 1,894,029 11.6%Transitional jobs 641,079 3.9Sanctions 293,879 1.8Trial jobs 7,255 <0.1
Subtotal $ 2,836,242 17.3%
Administration $ 1,751,727 10.7%
Additional Services:Contracted child care $ 396,255 2.4%Job access loans 118,765 0.7Emergency assistance 173,483 1.1
Other FSET services 6,623 <0.1Subtotal $ 695,126 4.2%
Total $16,396,029 100.0%
* Except in Milwaukee County, sanctions of participants' grants were counted as expenditures and were charged againstan agency's contract. Milwaukee agencies retained all sanctioned funds from the implementation contract.
Kenosha County 1-22
111

Use of Profits Under the Initial Implementation Contract
The Kenosha County Department of Human Services reports transferring $881,000 of the $1.6 million inunrestricted profits to Kenosha County's general fund, and using $738,000 to fund out-of-homeplacements for children in need of protective services.
Planned Use of Community Reinvestment Funds Under the Initial Implementation Contract
According to the Kenosha County Department of Human Services, all $1.1 million in communityreinvestment funds will be used to supplement W-2 and related programs.
USE OF FUNDS AVAILABLE UNDER THE CURRENT IMPLEMENTATION CONTRACT:
Kenosha County Department of Human Services' current W-2 contract is for $9.3 million to provideW-2 and related services from January 2000 through December 2001. Between January 2000 andSeptember 2000, $3,780,690, or 40.7 percent of the contract budget, was spent. An additional$650,000 in bonus funds will be available to the Kenosha County Department of Human Services ifit meets established performance standards.
Current Implementation Contract ExpendituresJanuary 2000 through September 2000
Direct ServicesCash BenefitsAdministrationAdditional Services
Total
ExpendituresPercentage of Total
Expenditures
Total Expendituresas a Percentage ofContract Budget
$2,042,1321,101,850
418,714217.994
54.0%29.111.1
5.8
40.7%$3,780,690 100.0%
Potential Bonus Funds Under the Current Implementation ContractAvailable after December 31, 2001
Total Possible Performance Bonus Funds Available:Restricted bonus $278,569Unrestricted bonuses 371,426
Projected Bonus Based on Performance Standards through December 2000:Restricted bonus $278,569Unrestricted bonuses 263,093
1-23
$649,995
$541,662
Kenosha County

Performance Standards Under the Current Implementation ContractAs of December 31, 2000
Meeting Meeting MeetingPerformance Performance PerformanceStandards for Standards for Standards for
Restricted First Unrestricted Second UnrestrictedBonus? Bonus? Bonus?
Entered Employment Yes No NoAverage Wage Rate Yes Yes YesJob Retention-30 Days Yes Yes NoJob Retention-180 Days Yes Yes YesHealth Insurance Benefits Yes Yes NoFull and Appropriate Engagement Yes Yes YesBasic Educational Activities Yes Yes YesFaith-Based Contract (optional) Not Applicable Not Applicable YesBasic Skills/Job Skills (optional) Not Applicable Not Applicable No
CASELOAD INFORMATION: Overall, the participant caseload declined 36.9 percent fromSeptember 1997 to September 2000.
September 1997 September 2000 Percentage Change
Cash benefit cases 486 195Case management cases 78 161Total 564 356 (36.9%)
SANCTIONS: The Kenosha County Department of Human Services sanctioned 52 participants inSeptember 2000. Information on the type of cases sanctioned and average sanction amount is summarizedin the following table:
Placement Type Number of Participants Sanctioned Average Sanction AmountCommunity service job 46 $303Transitional placement 6 231Other 0 0Total 52 295
FACT-FINDING REVIEWS: Between May 1999 and September 2000, 19 participants requested19 fact-finding reviews. Information on complaint topics and outcomes is summarized in the followingtable:
Topic of Complaint
Ruled inFavor ofAgency
Ruled inFavor of
ParticipantRequest
ResolvedRequest
DismissedRequestPending
Employment 3 3 1 4 1
Child care 2 0 1 1 1
Emergency assistance 0 0 0 0 0Job access loan 1 0 1 0 024-month extension 0 0 0 0 0
Total 6 3 3 5 2
Kenosha County 1-24

MANITOWOC COUNTY
AGENCY: Manitowoc County Human Services Department
SERVICE DELIVERY AREA: Manitowoc County
USE OF FUNDS AVAILABLE UNDER THE INITIAL IMPLEMENTATION CONTRACT:
The Manitowoc County Human Services Department spent $1.7 million under the initial implementationcontract, of which the agency reports $426,000 (25.1 percent) was subcontracted service expenditures.As a result of unexpended initial implementation contract funding, the agency received profits of$605,000 and community reinvestment funds of $1.2 million.
Initial Implementation Contract ExpendituresSeptember 1997 through December 1999
Direct Services:
Expenditures Percentage of Total
Work activities $ 805,719 46.3%Eligibility determination 184,236 10.6Case management 32,982 1.9FSET services 94,893 5.4Skills training 26,669 1.5Post-employment services 26,075 1.5Educational activities 7,235 0.4
Subtotal $1,177,809 67.6%
Cash Benefits:Community service jobs $ 60,224 3.4%Transitional jobs 50,062 2.9Sanctions* 3,054 0.2Trial jobs 0 0.0
Subtotal $ 113,340 6.5%
Administration $ 447,637 25.7%
Additional Services:Contracted child care 0 0.0%Job access loans 800 <0.1Emergency assistance 1,702 0.1Other FSET services 500 <0.1Subtotal $ 3,002 0.2%
Total $1,741,788 100.0%
* Except in Milwaukee County, sanctions of participants' grants were counted as expenditures and were charged againstan agency's contract. Milwaukee agencies retained all sanctioned funds from the implementation contract.
Manitowoc County 1-26

Use of Profits Under the Initial Implementation Contract
The Manitowoc County Human Services Department reports that it used its $605,000 in unrestrictedprofits to offset a budget deficit in alternate care programs for children and juveniles that resulted fromfunding shortfalls from other state programs.
Planned Use of Community Reinvestment Funds Under the Initial Implementation Contract
Supplement to W-2 and related programs $ 575,000Counseling services related to child welfare, AODA, and mental health 145,602Administration of programs receiving community reinvestment funds 93,360Coordination of services to Hispanic community 70,998Temporary basic needs assistance 54,000Enhanced services through food pantries 50,000Learning club for academically at-risk children 46,800Teen pregnancy prevention 28,700Mentoring program for juvenile offenders and child abuse/neglect victims 24,473Transportation assistance 22,204Auto repairs 20,000Group and individual therapy 18,300On-site child care center 17,465Legal services to eliminate employment barriers 12,000Outreach and case management for Hmong community 10,500Supplemental services to non-custodial parents 10.000
Total $1,199,402
USE OF FUNDS AVAILABLE UNDER THE CURRENT IMPLEMENTATION CONTRACT:
Manitowoc County Human Services Department's current contract is for $826,000 to provide W-2 andrelated services from January 2000 through December 2001. Between January 2000 and September 2000,$436,255, or 52.8 percent of the contract budget, was spent. An additional $58,000 in bonus funds willbe available to the Manitowoc County Human Services Department if it meets established performancestandards.
Current Implementation Contract ExpendituresJanuary 2000 through September 2000
Total ExpendituresPercentage of Total as a Percentage of
Expenditures Expenditures Contract Budget
Direct Services $336,403 77.1%Cash Benefits 7,682 1.8Administration 77,900 17.8Additional Services 14.270 3.3
Total $436,255 100.0% 52.8%
1-27
1 5
Manitowoc County

Potential Bonus Funds Under the Current Implementation ContractAvailable after December 31, 2001
Total Possible Performance Bonus Funds Available: $57,804Restricted bonus $24,773Unrestricted bonuses 33,031
Projected Bonus Based on Performance Standards through December 2000:Restricted bonusUnrestricted bonuses
$24,77328,901
$53,674
Progress in Meeting Performance Standards Under the Current Implementation ContractAs of December 31, 2000
Meeting MeetingPerformance Performance Meeting PerformanceStandards for Standards for First Standards for
Restricted Unrestricted Second UnrestrictedBonus? Bonus? Bonus?
Entered Employment Yes Yes YesAverage Wage Rate Yes Yes YesJob Retention-30 Days Yes Yes NoJob Retention-180 Days Yes Yes YesHealth Insurance Benefits Yes Yes NoFull and Appropriate Engagement Yes Yes YesBasic Educational Activities Yes Yes YesFaith-Based Contract (optional) Not Applicable Not Applicable YesBasic Skills /Job Skills (optional) Not Applicable Not Applicable No
CASELOAD INFORMATION: Overall, the participant caseload declined 81.4 percent fromSeptember 1997 to September 2000.
Cash benefit casesCase management casesTotal
September 1997 September 2000 Percentage Change
430
43
3
5
8 (81.4%)
SANCTIONS: The Manitowoc County Human Services Department sanctioned no participants inSeptember 2000.
FACT -FINDING REVIEWS: Between May 1999 and September 2000, no participants requested fact-finding reviews.
Manitowoc County 1-28
116
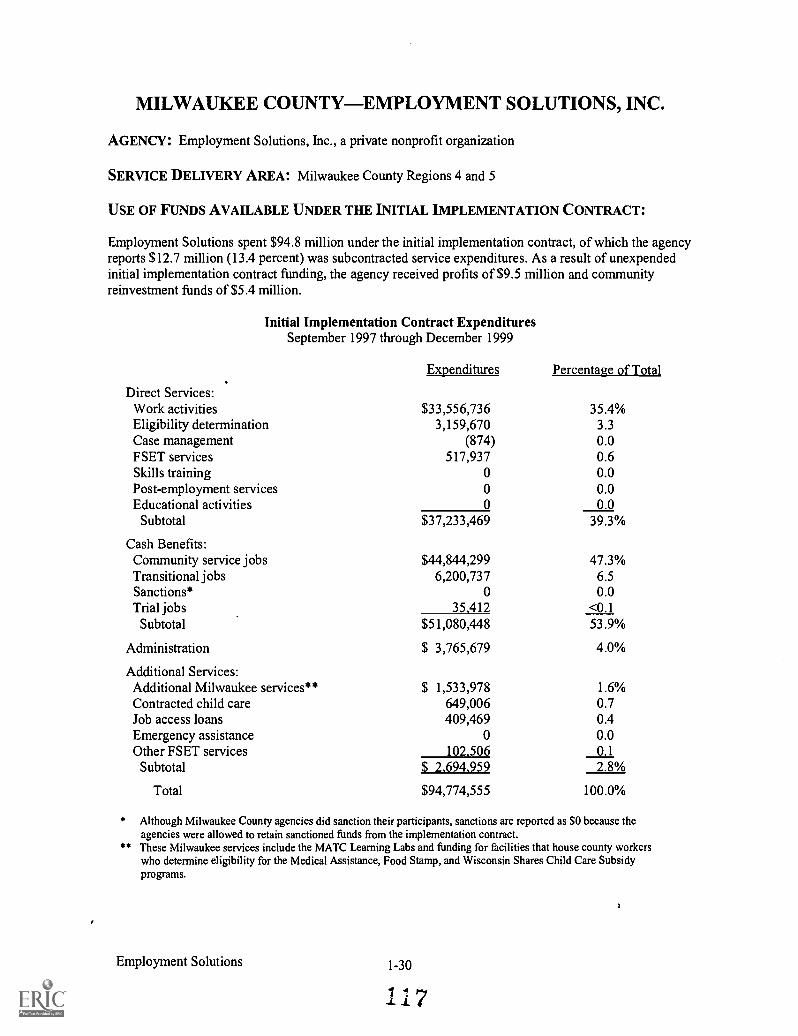
MILWAUKEE COUNTY-EMPLOYMENT SOLUTIONS, INC.
AGENCY: Employment Solutions, Inc., a private nonprofit organization
SERVICE DELIVERY AREA: Milwaukee County Regions 4 and 5
USE OF FUNDS AVAILABLE UNDER THE INITIAL IMPLEMENTATION CONTRACT:
Employment Solutions spent $94.8 million under the initial implementation contract, of which the agencyreports $12.7 million (13.4 percent) was subcontracted service expenditures. As a result of unexpendedinitial implementation contract funding, the agency received profits of $9.5 million and communityreinvestment funds of $5.4 million.
Initial Implementation Contract ExpendituresSeptember 1997 through December 1999
Direct Services:
Expenditures Percentage of Total
Work activities $33,556,736 35.4%Eligibility determination 3,159,670 3.3Case management (874) 0.0FSET services 517,937 0.6Skills training 0 0.0Post-employment services 0 0.0Educational activities 0 0.0
Subtotal $37,233,469 39.3%
Cash Benefits:Community service jobs $44,844,299 47.3%Transitional jobs 6,200,737 6.5Sanctions* 0 0.0Trial jobs 35,412 <0.1
Subtotal $51,080,448 53.9%
Administration $ 3,765,679 4.0%
Additional Services:Additional Milwaukee services** $ 1,533,978 1.6%Contracted child care 649,006 0.7Job access loans 409,469 0.4Emergency assistance 0 0.0Other FSET services 102,506 0.1
Subtotal $ 2,694,959 2.8%
Total $94,774,555 100.0%
* Although Milwaukee County agencies did sanction their participants, sanctions are reported as $0 because theagencies were allowed to retain sanctioned funds from the implementation contract.These Milwaukee services include the MATC Learning Labs and funding for facilities that house county workerswho determine eligibility for the Medical Assistance, Food Stamp, and Wisconsin Shares Child Care Subsidyprograms.
Employment Solutions 1-30
1 7

Use of Profits Under the Initial Implementation Contract
Employment Solutions reports that it is using $4.7 million of the $9.5 million in unrestricted profits forthe following activities:
$3.2 million to provide services to disadvantaged and disabled residents;$1.2 million to provide services to senior citizens; and$0.3 million to provide services to families and children residing in Milwaukee County.
Information on how the remaining $4.8 million in unrestricted profits will be used was not provided.
Planned Use of Community Reinvestment Funds Under the Initial Implementation Contract
Contribution to Milwaukee County Department of Human Services for 2001 funding ofservices to prevent out-of-home placements of juveniles, shelter and services forhomeless families, and services to developmentally disabled infants and toddlers andtheir families $3,800,000
Grants to families to prevent eviction or to use as a security deposit 510,072Courses to improve basic reading and computer skills of adults and children, educate
families on a variety of topics, and provide computers for families with perfectattendance during the 9-week course 465,425
Services to assist with development of technology-related employment skills 465,425One-time grants to families facing gas or electrical service disconnection 200,000Subsidized tax preparation, credit rating, and money management services 4,819Grants to assist individuals with continuing education and career advancement 1,100
Total $5,446,841
USE OF FUNDS AVAILABLE UNDER THE CURRENT IMPLEMENTATION CONTRACT:
Employment Solutions' current W-2 contract is for $87.5 million to provide W-2 and related servicesfrom January 2000 through December 2001. Between January 2000 and September 2000, $27,522,338,or 31.5 percent of the contract budget, was spent. An additional $6.1 million in bonus funds will beavailable to Employment Solutions if it meets established performance standards.
Current Implementation Contract ExpendituresJanuary 2000 through September 2000
Direct ServicesCash BenefitsAdministrationAdditional Services
Total
ExpendituresPercentage of Total
Expenditures
Total Expenditures asa Percentage ofContract Budget
$15,452,15610,151,6041,428,847
489,731
56.1%36.9
5.21.8
31.5%$27,522,338 100.0%
1-31 Employment Solutions
118

Potential Bonus Funds Under the Current Implementation ContractAvailable after December 31, 2001
Total Performance Bonus Funds Available: $6,122,707Restricted bonus $2,624,017Unrestricted bonuses 3,498,690
Projected Bonus Based on Performance Standards through December 2000: $5,831,150Restricted bonus $2,624,017Unrestricted bonus 3,207,133
Progress in Meeting Performance Standards Under the Current Implementation ContractAs of December 31, 2000
Meeting Meeting MeetingPerformance Performance PerformanceStandards for Standards for Standards for
Restricted First Unrestricted Second UnrestrictedBonus? Bonus? Bonus?
Entered Employment Yes Yes NoAverage Wage Rate Yes Yes YesJob Retention-30 Days Yes Yes YesJob Retention 180 Days Yes Yes YesAvailable Health Insurance Yes Yes YesFull and Appropriate Engagement Yes Yes YesBasic Educational Activities Yes Yes YesFaith-Based Contract (optional) Not Applicable Not Applicable YesBasic Skills /Job Skills (optional) Not Applicable Not Applicable No
CASELOAD INFORMATION: Overall, the participant caseload declined 48.6 percent fromSeptember 1997 to September 2000.
Cash benefit casesCase management cases
Total
September 1997 September 2000 Percentage Change
5,59013
1,7131,169
(48.6%)5,603 2,882
SANCTIONS: Employment Solutions sanctioned 469 participants in September 2000. Information onthe type of cases sanctioned and average sanction amount is summarized in the following table:
Placement Type Number of Participants Sanctioned Average Sanction Amount
Community service job 399 $414Transitional placement 65 275Other 5 231Total 469 393
Employment Solutions 1-32
119

FACT -FINDING REVIEWS: Between May 1999 and September 2000, 414 participants requested528 fact-finding reviews. Information on complaint topics and outcomes is summarized in the followingtable:
Topic of ComplaintRuled inFavor ofAgency
Ruled inFavor of
ParticipantSplit
DecisionRequestResolved
RequestDismissed
RequestWithdrawn
Employment 71 12 30 5 86 264Child care 4 3 2 0 8 6Emergency assistance 4 0 0 0 0 4Job access loan 1 1 0 0 4 1324-month extension 3 0 0 1 4 2
Total 83 16 32 6 102 289
1-33 Employment Solutions
120

MILWAUKEE COUNTY-MAXIMUS, INC.
AGENCY: Maximus, Inc., a private for-profit organization
SERVICE DELIVERY AREA: Milwaukee County Region 6
USE OF FUNDS AVAILABLE UNDER THE INITIAL IMPLEMENTATION CONTRACT:
Maximus spent $54.8 million under the initial implementation contract, of which the agency reports$4.6 million (8.4 percent) was subcontracted service expenditures. As a result of unexpended initialimplementation contract funding, the agency received profits of $4.4 million and community reinvestmentfunds of $0.6 million.
Initial Implementation Contract ExpendituresSeptember 1997 through December 1999
Direct Services:
Expenditures Percentage of Total
Work activities $11,840,569 21.6%Eligibility determination 2,957,380 5.4Case management 1,869,919 3.4FSET services 1,782,911 3.3Skills training 1,752,175 3.2Post-employment services 562,390 1.0Educational activities 1.339,108 2.5Subtotal $22,104,452 40.4%
Cash Benefits:Community service jobs $21,494,386 39.2%Transitional jobs 4,708,635 8.6Sanctions* 0 0.0Trial jobs 2.550 <0.1Subtotal $26,205,571 47.8%
Administration $ 4,342,987 7.9%
Additional Services:Additional Milwaukee services** $ 1,629,787 3.0%Contracted child care 228,293 0.4Job access loans 254,308 0.5Emergency assistance 0 0.0Other FSET services 0 0.0
Subtotal $ 2,112,388 3.9%
Total $54,765,398 100.0%
* Although Milwaukee County agencies did sanction their participants, sanctions are reported as $0 because theagencies were allowed to retain sanctioned funds from the implementation contract.
** These Milwaukee services include the Job Center Network and MATC Learning Labs.
Maximus 1-34
121

Use of Profits Under the Initial Implementation Contract
Maximus reports that it is using its $4.4 million in unrestricted profits for the following activities:
$1,489,000 for payment of expenses that were not billed to DWD under the initial W-2implementation contract;$1,139,000 for reinvestment in company growth;$792,000 for payment of federal and state taxes owed;$500,000 in donations to 26 community organizations to address issues related to homelessness,emergency food, adult literacy, community business initiatives, domestic violence, and services toyouth and first-time mothers; and$485,000 for payment of expenses that were billed to DWD and disallowed under the initial W-2implementation contract, many of which were reported in our audit of Maximus expenditures inJuly 2000.
Planned Use of Community Reinvestment Funds Under the Initial Implementation Contract
Supplement to W-2 and related programs $232,228Child care resource and referral services 80,000Rent subsidies to refugees newly enrolled in the W-2 program 60,500Expansion of food pantry services and meal programs 50,000Expansion of shelter and services available to single women and women with children 50,000Parenting services to women recently released from incarceration 28,289Screening and case management services to new parents 25,000Expansion of services to Southeast Asian residents to resolve problems and improve
neighborhoods 25,000Expansion of services that provides job-appropriate interview and work attire for
women entering the job market 25,000Outreach and mentoring services to assist families with achieving self-sufficiency 25,000Expansion of services at a family resource center that provides counseling, parenting
classes, case management, job readiness assistance, and placement services to men 15,000
Total $616,017
USE OF FUNDS AVAILABLE UNDER THE CURRENT IMPLEMENTATION CONTRACT:
Maximus' current W-2 contract is for $45.1 million to provide W-2 and related services fromJanuary 2000 through December 2001. Between January 2000 and September 2000, $14,475,753, or32.1 percent of the contract budget, was spent. An additional $3.2 million in bonus funds will beavailable to Maximus if it meets the established performance standards.
Current Implementation Contract ExpendituresJanuary 2000 through September 2000
Direct ServicesCash BenefitsAdministrationAdditional Services
Total
ExpendituresPercentage of Total
Expenditures
Total Expendituresas a Percentage ofContract Budget
$ 7,196,7455,954,649
917,451406,908
49.7%41.1
6.42.8
32.1%$14,475,753 100.0%
1-35 Maximus
122

Potential Bonus Funds Under the Current Implementation ContractAvailable after December 31, 2001
Total Performance Bonus Funds Available: $3.155,863Restricted bonus $1,352,513Unrestricted bonuses 1,803,350
Projected Bonus Based on Performance Standards through December 2000: $2,554,746Restricted bonus $1,352,513Unrestricted bonuses 1,202,233
Progress in Meeting Performance Standards Under the Current Implementation ContractAs of December 31, 2000
Meeting Meeting MeetingPerformance Performance PerformanceStandards for Standards for Standards for
Restricted First Unrestricted Second UnrestrictedBonus? Bonus? Bonus?
Entered Employment Yes Yes NoAverage Wage Rate Yes Yes YesJob Retention-30 Days Yes Yes NoJob Retention-180 Days Yes Yes NoHealth Insurance Benefits Yes Yes YesFull and Appropriate Engagement Yes Yes YesBasic Educational Activities Yes No NoFaith-Based Contract (optional) Not Applicable Not Applicable YesBasic Skills/Job Skills (optional) Not Applicable Not Applicable No
CASELOAD INFORMATION: Overall, the participant caseload declined 44.4 percent fromSeptember 1997 to September 2000.
Cash benefit casesCase management cases
Total
September 1997 September 2000 Percentage Change
2,8547
1,068524
(44.4%)2,861 1,592
SANCTIONS: Maximus sanctioned 163 participants in September 2000. Information on the type ofcases sanctioned and average sanction amount is summarized in the following table:
Placement Type Number of Participants Sanctioned Average Sanction Amount
Community service job 123 $447Transitional placement 36 347Other 4 134Total 163 417
Maximus 1-36
123

FACT-FINDING REVIEWS: Between May 1999 and September 2000, 132 participants requested170 fact-finding reviews. Information on complaint topics and outcomes is summarized in the followingtable:
Ruled inFavor of
Ruled inFavor of Split Request Request Request
Topic of Complaint Agency Participant Decision Resolved Dismissed Withdrawn
Employment 36 22 1 19 23 50Child care 1 0 0 1 0 2Emergency assistance 3 , 1 0 0 0 1
Job access loan 2 2 0 0 1 324-month extension 0 1 0 1 0 0
Total 42 26 1 21 24 56
1-37
X24
Maximus

MILWAUKEE COUNTY-OPPORTUNITIESINDUSTRIALIZATION CENTER OF GREATER MILWAUKEE
AGENCY: Opportunities Industrialization Center of Greater Milwaukee (OIC-GM), a private nonprofitorganization
SERVICE DELIVERY AREA: Milwaukee County Region 3
USE OF FUNDS AVAILABLE UNDER THE INITIAL IMPLEMENTATION CONTRACT:
OIC-GM spent $50.8 million under the initial implementation contract, of which $4.9 million(9.6 percent) was subcontracted service expenditures. As a result of unexpended initial implementationcontract funding, the agency received profits of $4.6 million and community reinvestment funds of$2.0 million.
Initial Implementation Contract ExpendituresSeptember 1997 through December 1999
Direct Services:
Expenditures Percentage of Total
Work activities $15,237,527 30.0%Eligibility determination 1,613,408 3.2Case management 37,307 0.1FSET services 201,344 0.4Skills training 476,884 0.9Post-employment services 641,924 1.2Educational activities 593,336 1.2
Subtotal $18,801,730 37.0%
Cash Benefits:Community service jobs $23,705,362 46.7%Transitional jobs 3,401,383 6.7Sanctions* 0 0.0Trial jobs 25,419 < 0.1
Subtotal $27,132,164 53.4%
Administration $ 2,723,585 5.4%
Additional Services:Additional Milwaukee services** $ 684,870 1.3%Contracted child care 1,218,274 2.4Job access loans 249,829 0.5Emergency assistance 0 0.0Other FSET services 0 0.0Subtotal $ 2,152,973 4.2%
Total $50,810,452 100.0%
* Although Milwaukee County agencies did sanction their participants, sanctions are reported as $0 because theagencies were allowed to retain sanctioned funds from the implementation contract.
** These Milwaukee services include the MATC Learning Labs and funding for facilities that house county workerswho determine eligibility for the Medical Assistance, Food Stamp, and Wisconsin Shares Child Care Subsidyprograms.
OIC-GM 1-38
125

Use of Profits Under the Initial Implementation Contract
OIC-GM reports that it is using its $4.6 million in unrestricted profits to purchase a cellularcommunication business located in central-city Milwaukee and to develop a food service program toprovide meals to child care providers, after-school programs, and other community meal programs. Inaddition, OIC-GM reports that it is collaborating with Manpower International and Wisconsin ElectricPower to develop a computer technology academy for middle school and high school age youth, with thegoal of increasing academic achievement and expanding career opportunities.
Planned Use of Community Reinvestment Funds Under the Initial Implementation Contract
Housing services for families in crisis, including rent, security deposits, utilitypayments, telephone service, and personal care, not to exceed 4 months in duration $ 325,000
Personnel, operational, and administrative costs associated with implementingcommunity reinvestment-funded projects 315,135
Support services for individuals eligible for occupational skills training 300,000Contribution to Milwaukee County Department of Human Services for 2001 funding of
services to prevent out-of-home placements of juveniles, shelter and services forhomeless families, and services to developmentally disabled infants and toddlers andtheir families 300,000
Enrichment services to youth, including job mentoring, work experience, tutorialsessions, computer courses, and field trips 250,000
Education and training services for non-custodial parents 125,000Funding for Sullivan and Teutonia Job Centers 102,595Training program in lead-abatement rehabilitation 50,000Counseling services for families entering the work environment 50,000AODA and mental health counseling for families 50,000Coordination of local food pantries 25,000Transportation services for employed families 25,000Nonrecurring services, including vouchers for food, clothing, and other emergencies 25,000Financial education services related to credit, budgeting, and savings 21,740Unknown 24
Total $1,964,494
1-39 OIC-GM
I 2 6

USE OF FUNDS AVAILABLE UNDER THE CURRENT IMPLEMENTATION CONTRACT:
OIC-GM's current W-2 contract is for $47.1 million to provide W-2 and related services fromJanuary 2000 through December 2001. Between January 2000 and September 2000, $15,862,666, or33.7 percent of the contract budget, was spent. An additional $3.3 million in bonus funds will be availableto OIC-GM if it meets established performance standards.
Current Implementation Contract ExpendituresJanuary 2000 through September 2000
Direct ServicesCash BenefitsAdministrationAdditional Services
Total
ExpendituresPercentage of Total
Expenditures
Total Expendituresas a Percentage ofContract Budget
$ 8,174,1065,517,7941,045,5491.125,217
51.5%34.8
6.67.1
33.7%$15,862,666 100.0%
Potential Bonus Funds Under the Current Implementation ContractAvailable after December 31, 2001
Total Performance Bonus Funds Available:Restricted bonusUnrestricted bonuses
$3,299,809$1,414,204
1,885,605
Projected Bonus Based on Performance Standards through December 2000: $2,828.407Restricted bonus $1,414,204Unrestricted bonuses 1,414,203
Progress in Meeting Performance Standards Under the Current Implementation ContractAs of December 31, 2000
Meeting Meeting MeetingPerformance Performance PerformanceStandards for Standards for First Standards for
Restricted Unrestricted Second UnrestrictedBonus? Bonus? Bonus?
Entered Employment Yes Yes NoAverage Wage Rate Yes Yes YesJob Retention-30 Days Yes Yes YesJob Retention-180 Days Yes Yes YesHealth Insurance Benefits Yes Yes YesFull and Appropriate Engagement Yes Yes NoBasic Educational Activities Yes Yes NoFaith-Based Contract (optional) Not Applicable Not Applicable YesBasic Skills/Job Skills (optional) Not Applicable Not Applicable No
OIC-GM 1-40
1 7
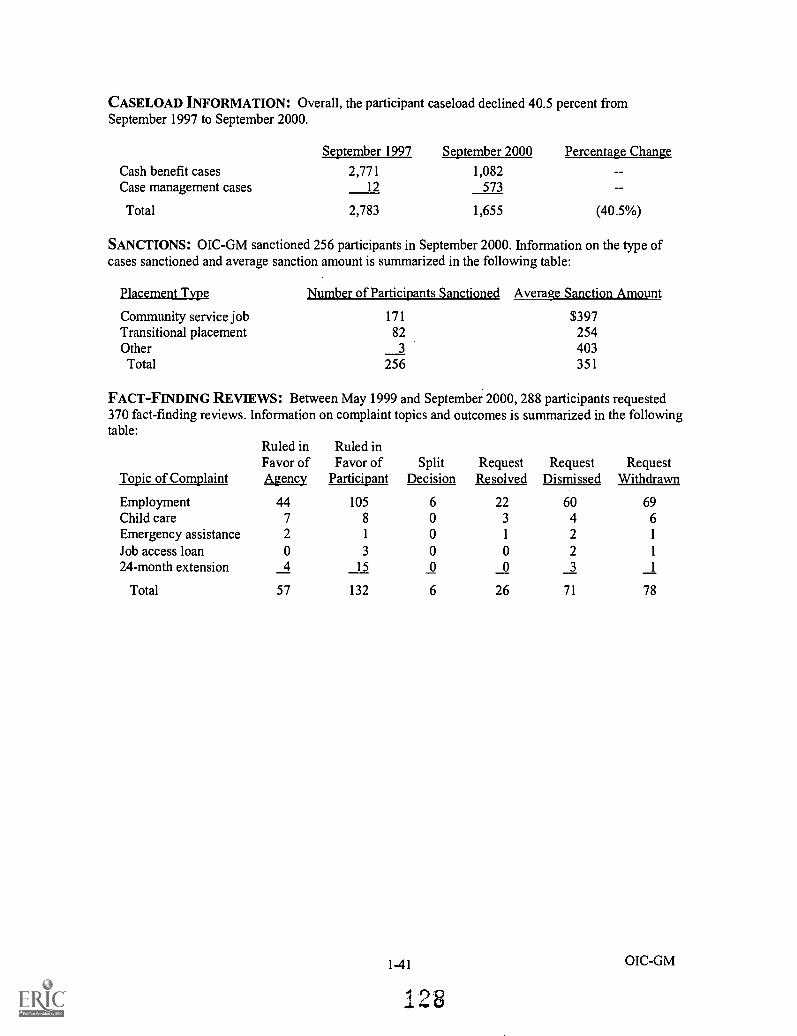
CASELOAD INFORMATION: Overall, the participant caseload declined 40.5 percent fromSeptember 1997 to September 2000.
Cash benefit casesCase management cases
Total
September 1997 September 2000 Percentage Change
2,77112
1,082573
(40.5%)2,783 1,655
SANCTIONS: OIC-GM sanctioned 256 participants in September 2000. Information on the type ofcases sanctioned and average sanction amount is summarized in the following table:
Placement Type Number of Participants Sanctioned Average Sanction Amount
Community service job 171 $397Transitional placement 82 254Other 3 403Total 256 351
FACT-FINDING REVIEWS: Between May 1999 and September 2000, 288 participants requested370 fact-finding reviews. Information on complaint topics and outcomes is summarized in the followingtable:
Ruled inFavor of
Ruled inFavor of Split Request Request Request
Topic of Complaint Agency Participant Decision Resolved Dismissed Withdrawn
Employment 44 105 6 22 60 69Child care 7 8 0 3 4 6Emergency assistance 2 1 0 1 2 1
Job access loan 0 3 0 0 2 1
24-month extension 4 15 0 0 3 1
Total 57 132 6 26 71 78
OIC-GM

MILWAUKEE COUNTY-UNITED MIGRANT OPPORTUNITY SERVICES, INC.
AGENCY: United Migrant Opportunity Services, Inc. (UMOS), a private nonprofit organization
SERVICE DELIVERY AREA: Milwaukee County Region 2
USE OF FUNDS AVAILABLE UNDER THE INITIAL IMPLEMENTATION CONTRACT:
UMOS spent $42.7 million under the initial implementation contract, of which $3.9 million (9.1 percent)was subcontracted service expenditures. As a result of unexpended initial implementation contractfunding, the agency received profits of $4.3 million and community reinvestment funds of $2.7 million.
Initial Implementation Contract ExpendituresSeptember 1997 through December 1999
Direct Services:
Expenditures Percentage of Total
Work activities $ 6,041,521 14.2%Eligibility determination 2,061,652 4.8Case management 8,637,578 20.2FSET services 198,246 0.5Skills training 1,587,688 3.7Post-employment services 933,377 2.2Educational activities 696,014 1.6
Subtotal $20,156,076 47.2%
Cash Benefits:Community service jobs 15,125,798 35.4Transitional jobs 3,549,757 8.3Sanctions* 0 0.0Trial jobs 86,641 0.2
Subtotal $18,762,196 43.9%
Administration $ 2,353,868 5.5%
Additional Services:Additional Milwaukee services** 684,870 1.6Contracted child care 645,541 1.5Job access loans 88,426 0.2Emergency assistance 0 0.0Other FSET services 39,352 0.1Subtotal $ 1,458,189 3.4%
Total $42,730,329 100.0%
* Although Milwaukee County agencies did sanction their participants, sanctions are reported as $0 becausethe agencies were allowed to retain sanctioned funds from the implementation contract.
** These Milwaukee services include the MATC Learning Labs and funding for facilities that house countyworkers who determine eligibility for the Medical Assistance, Food Stamp, and Wisconsin Shares Child CareSubsidy programs.
UMOS 1-42
129

Use of Profits Under the Initial Implementation Contract
UMOS reports that it used its $4.3 million in unrestricted profits for the following activities:
$3.2 million to establish a reserve account from which one-half of the earnings may be used annuallyto fund needed charitable services that are consistent with the UMOS mission, and for which publicfunds do not exist;$668,000 invested in a money market fund to meet future agency operating needs;$411,000 to retire two mortgages for buildings used for operations; and$39,000 to purchase a vacant lot in the city of Milwaukee for future development, potentially for low-income housing.
Planned Use of Community Reinvestment Funds Under the Initial Implementation Contract
Supplement W-2 and related programs $1,534,452AODA, mental health, family violence, and legal services to assist participants with
succeeding in the workplace 723,170Outreach to churches to increase awareness of services provided by UMOS and other
community organizations 142,000Outreach provided by the Hunger Task Force to increase awareness about the food
stamp program 65,000Community outreach to increase public awareness of programs and services offered
through W-2 and Milwaukee Job Centers 62,379Administration of community reinvestment funded projects 56,931Employment training and basic education services to non-custodial parents 50,000Child care transportation services 25,000
Total $2,658,932
USE OF FUNDS AVAILABLE UNDER THE CURRENT IMPLEMENTATION CONTRACT:
UMOS's current W-2 contract is for $37.0 million to provide W-2 and related services from January 2000through December 2001. Between January 2000 and September 2000, $14,685,437, or 39.7 percent ofthe contract budget, was spent. An additional $2.6 million in bonus funds will be available to UMOS if itmeets established performance standards.
Current Implementation Contract ExpendituresJanuary 2000 through September 2000
Direct ServicesCash BenefitsAdministrationAdditional Services
Total
ExpendituresPercentage of Total
Expenditures
Total Expenditures asa Percentage ofContract Budget
$ 8,250,4574,526,2001,411,041
497.739
56.2%30.8
9.63.4
39.7%$14,685,437 100.0%
1-43
130
UMOS

Potential Bonus Funds Under the Current Implementation ContractAvailable after December 31, 2001
Total Performance Bonus Funds Available:Restricted bonus $1,110,818Unrestricted bonuses 1,481,090
Projected Bonus Based on Performance Standards through December 2000:Restricted bonus $1,110,818Unrestricted bonuses 925,681
$2,591,908
$2,036,499
Progress in Meeting Performance Standards Under the Current Implementation ContractAs of December 31, 2000
Meeting Meeting MeetingPerformance Performance PerformanceStandards for Standards for Standards for
Restricted First Unrestricted Second UnrestrictedBonus? Bonus? Bonus?
Entered Employment Yes No NoAverage Wage Rate Yes Yes YesJob Retention-30 Days Yes Yes YesJob Retention-180 Days Yes Yes NoHealth Insurance Benefits Yes Yes YesFull and Appropriate Engagement Yes Yes NoBasic Educational Activities Yes Yes NoFaith-Based Contract (optional) Not Applicable Not Applicable YesBasic Skills/Job Skills (optional) Not Applicable Not Applicable No
CASELOAD INFORMATION: Overall, the participant caseload declined 37.8 percent fromSeptember 1997 to September 2000.
Cash benefit casesCase management cases
September 1997 September 2000 Percentage Change
2,316 8440 597
Total 2,316 1,441 (37.8%)
SANCTIONS: UMOS sanctioned 145 participants in September 2000. Information on the type of casessanctioned and average sanction amount is summarized in the following table:
Placement Type Number of Participants Sanctioned Average Sanction Amount
Community service job 105 $394Transitional placement 39 293Other 1 673
Total 145 369
UMOS 1-44
X31

FACT-FINDING REVIEWS: Between May 1999 and September 2000, 63 participants requested73 fact-finding reviews. Information on complaint topics and outcomes is summarized in the followingtable:
Topic of ComplaintRuled inFavor ofAgency
Ruled inFavor of
ParticipantSplit
DecisionRequest
ResolvedRequest
DismissedRequest
Withdrawn
Employment 9 16 1 11 6 25Child care 0 0 0 0 0 0Emergency assistance 2 1 0 0 0 0Job access loan 2 0 0 0 0 024-month extension 0 0 0 0 0 0
Total 13 17 1 11 6 25
1-45
132
UMOS
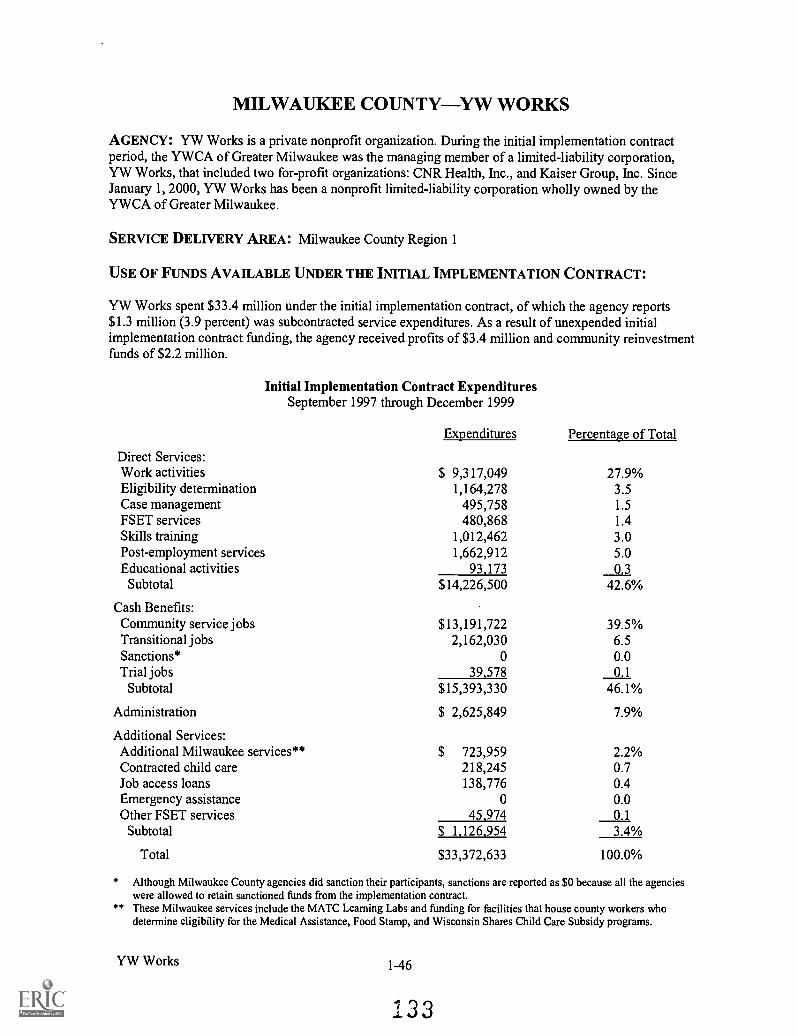
MILWAUKEE COUNTY-YW WORKS
AGENCY: YW Works is a private nonprofit organization. During the initial implementation contractperiod, the YWCA of Greater Milwaukee was the managing member of a limited-liability corporation,YW Works, that included two for-profit organizations: CNR Health, Inc., and Kaiser Group, Inc. SinceJanuary 1, 2000, YW Works has been a nonprofit limited-liability corporation wholly owned by theYWCA of Greater Milwaukee.
SERVICE DELIVERY AREA: Milwaukee County Region 1
USE OF FUNDS AVAILABLE UNDER THE INITIAL IMPLEMENTATION CONTRACT:
YW Works spent $33.4 million under the initial implementation contract, of which the agency reports$1.3 million (3.9 percent) was subcontracted service expenditures. As a result of unexpended initialimplementation contract funding, the agency received profits of $3.4 million and community reinvestmentfunds of $2.2 million.
Initial Implementation Contract ExpendituresSeptember 1997 through December 1999
Direct Services:
Expenditures Percentage of Total
Work activities $ 9,317,049 27.9%Eligibility determination 1,164,278 3.5Case management 495,758 1.5FSET services 480,868 1.4Skills training 1,012,462 3.0Post-employment services 1,662,912 5.0Educational activities 93.173 0.3Subtotal $14,226,500 42.6%
Cash Benefits:Community service jobs $13,191,722 39.5%Transitional jobs 2,162,030 6.5Sanctions* 0 0.0Trial jobs 39,578 0.1Subtotal $15,393,330 46.1%
Administration $ 2,625,849 7.9%
Additional Services:Additional Milwaukee services** $ 723,959 2.2%Contracted child care 218,245 0.7Job access loans 138,776 0.4Emergency assistance 0 0.0Other FSET services 45.974 0.1
Subtotal $ 1,126,954 3.4%
Total $33,372,633 100.0%
* Although Milwaukee County agencies did sanction their participants, sanctions are reported as $0 because all the agencieswere allowed to retain sanctioned funds from the implementation contract.
** These Milwaukee services include the MATC Learning Labs and funding for facilities that house county workers whodetermine eligibility for the Medical Assistance, Food Stamp, and Wisconsin Shares Child Care Subsidy programs.
YW Works 1-46
133

Use of Profits Under the Initial Implementation Contract
YW Works reports that it shared its $3.4 million in unrestricted profits equally among the three agenciesthat created it: the YWCA of Greater Milwaukee, CNR Health, and Kaiser Group. The share of profitsearned by the YWCA of Greater Milwaukee was used to fund administrative, capital, and programexpenses not covered by other funding sources. According to YW Works, the profits were invested in thefollowing activities:
Generation 2 Plastics, a plastics processing company managed by the YWCA of Greater Milwaukee,which serves as a workplace skills training center;the Nontraditional Employment Training program, operated by the YWCA of Greater Milwaukee,which provides orientation, screening and assessment, training, support services, and resource andreferral into nontraditional skilled trade careers;management services to promote women-owned businesses;the Creative Workshop, which teaches job skills in the textile industry;the Vel Phillips Center, a community facility offering GED and adult basic skills programs, youthprograms, and older adult programs;capital to pay off credit lines used to fund the development of affordable housing programs and otherprograms; andacquisition of additional transitional housing
The shares of profits earned by CNR Health and Kaiser Group were not reported by YW Works.
Planned Use of Community Reinvestment Funds Under the Initial Implementation Contract
Emergency assistance, including cash grants and related services to families facingeviction, emergency food boxes, and AODA non-medical treatment $ 255,000
Expansion of the number of community service job sites that provide educational services 228,671Services to assist families with maintaining housing 216,000Services to educate families regarding life management skills 203,865Increasing the availability of customized job training programs for W-2 participants 189,186Expansion of local food pantry operations 55,000Balance of funds available, for which YW Works is seeking DWD approval 1.038.604
Total $2,186,326
1-47 YW Works

USE OF FUNDS AVAILABLE UNDER THE CURRENT IMPLEMENTATION CONTRACT:
YW Works' current W-2 contract is for $36.5 million to provide W-2 and related services fromJanuary 2000 through December 2001. Between January 2000 and September 2000, $12,157,286, or33.3 percent of the contract budget, was spent. An additional $2.6 million in bonus funds will beavailable to YW Works if it meets established performance standards.
Current Implementation Contract ExpendituresJanuary 2000 through September 2000
Direct ServicesCash BenefitsAdministrationAdditional Services
Total
ExpendituresPercentage of Total
Expenditures
Total Expenditures asa Percentage of
Contract Budget
$ 6,943,1523,815,6791,259,097
139.358
57.1%31.410.4
1.1
33.3%$12,157,286 100.0%
Potential Bonus Funds Under the Current Implementation ContractAvailable after December 31, 2001
Total Possible Performance Bonus Funds Available:Restricted bonusUnrestricted bonuses
Projected Bonus Based on Performance Standards through December 2000:Restricted bonusUnrestricted bonuses
$1,093,5571,458,076
$1,093,5571,215,063
$2,551,633
$2,308,620
Progress in Meeting Performance Standards Under the Current Implementation ContractAs of December 31, 2000
Meeting Meeting MeetingPerformance Performance PerformanceStandards for Standards for First Standards for
Restricted Unrestricted Second UnrestrictedBonus? Bonus? Bonus?
Entered Employment Yes Yes YesAverage Wage Rate Yes Yes YesJob Retention-30 Days Yes Yes YesJob Retention-180 Days Yes Yes YesHealth Insurance Benefits Yes Yes YesFull and Appropriate Engagement Yes Yes NoBasic Educational Activities Yes Yes NoFaith-Based Contract (optional) Not Applicable Not Applicable YesBasic Skills /Job Skills (optional) Not Applicable Not Applicable No
YW Works 1-48
135

CASELOAD INFORMATION: Overall, the participant caseload declined 45.9 percent fromSeptember 1997 to September 2000.
Cash benefit casesCase management cases
Total
September 1997 September 2000 Percentage Change
1,8492
609393
(45.9%)1,851 1,002
SANCTIONS: YW Works sanctioned 307 participants in September 2000. Information on the type ofcases sanctioned and average sanction amount is summarized in the following table:
Placement Type Number of Participants Sanctioned Average Sanction Amount
Community service job 196 $308Transitional placement 106 295Other 5 148Total 307 301
FACT-FINDING REVIEWS: Between May 1999 and September 2000, 78 participants requested97 fact-finding reviews. Information on complaint topics and outcomes is summarized in the followingtable:
Ruled inFavor of
Ruled inFavor of Split Request Request Request
Topic of Complaint Agency Participant Decision Resolved Dismissed Withdrawn
Employment 16 19 10 7 8 26Child care 0 1 0 1 4 0Emergency assistance 0 1 0 0 0 1
Job access loan 0 0 0 2 1 024-month extension 0 0 0 0 0 0
Totals 16 21 10 10 13 27
YW Works

MONROE COUNTY
AGENCY: Monroe County Department of Human Services (September 1997-December 1999)Workforce Connections, Inc., a private nonprofit organization (January 2000-present)
SERVICE DELIVERY AREA: Monroe County
USE OF FUNDS AVAILABLE UNDER THE INITIAL IMPLEMENTATION CONTRACT:
The Monroe County Department of Human Services spent $1.3 million under the initial implementationcontract, of which $728,000 (56.0 percent) was subcontracted service expenditures. As a result ofunexpended implementation contract funding, the agency received profits of $520,000 and communityreinvestment funds of $1.1 million.
Initial Implementation Contract ExpendituresSeptember 1997 through December 1999
Direct Services:
Expenditures Percentage of Total
Work activities $ 189,371 14.1%Eligibility determination 283,969 21.1Case management 2,408 0.2FSET services 56,808 4.2Skills training 104,211 7.8Post-employment services 1,386 0.1Educational activities 76,274 5.7Subtotal $ 714,427 53.2%
Cash Benefits:Community service jobs $ 205,499 15.3%Transitional jobs 102,859 7.7Sanctions* 11,071 0.8Trial jobs 2,223 0.2Subtotal $ 321,652 24.0%
Administration $ 261,298 19.4%
Additional Services:Contracted child care 0 0.0%Job access loans 27,776 2.0Emergency assistance 18,455 1.4Other FSET services 0 0.0Subtotal $ 46,231 3.4%
Total $1,343,608 100.0%
* Except in Milwaukee County, sanctions of participants' grants were counted as expenditures and were chargedagainst an agency's contract. Milwaukee agencies retained all sanctioned funds from the implementation contract.
Monroe County 1-50
1 ') 1"")_s_ I

Use of Profits Under the Initial Implementation Contract
The Monroe County Department of Human Services reported that it is using its $520,000 in unrestrictedprofits for the following activities:
$288,000 has not been budgeted for a specific purpose;$219,000 for the enhancement of its computer network, including the purchase of integratedinformation and accounting system hardware and software, and for training and conversion toimplement the new system; and$13,000 for the purchase of office furniture.
Planned Use of Community Reinvestment Funds Under the Initial Implementation Contract
Services and outreach to adolescents and families through the Boys and Girls Clubsof Sparta and Tomah $ 163,616
Parent education and support resources 156,000Emergency shelter and support services for homeless families 109,299Teen health services 101,121Domestic abuse services 91,873Mentoring program for at-risk youth 70,540Prescriptions and ancillary health care supplies 65,000After-school services and activities for teens to build self esteem, encourage
success in school, and develop role models 59,000Transportation/cab services for eligible families 55,000Services to prevent out-of-home placements or reunify families in foster care
system 50,000School supplies for low-income students 35,000Services and activities to reduce or prevent gang involvement among teens 30,000Meal program through Sparta United Methodist Church 23,400Employment loans 20,000Child development services and materials for child care providers 16,540Start-up funding to develop second shift child care services 15,000Transportation grant matching funds to assist employers and individuals with
transportation barriers 10,000
Total $1,071,389
USE OF FUNDS AVAILABLE UNDER TILE CURRENT IMPLEMENTATION CONTRACT:
Workforce Connections' W-2 contract is for $1.4 million to provide W-2 and related services fromJanuary 2000 through December 2001. Between January 2000 and September 2000, $407,793, or29.1 percent of the contract budget, was spent. An additional $98,000 in bonus funds will be availableto Workforce Connections if it meets established performance standards.
1-51 Monroe County
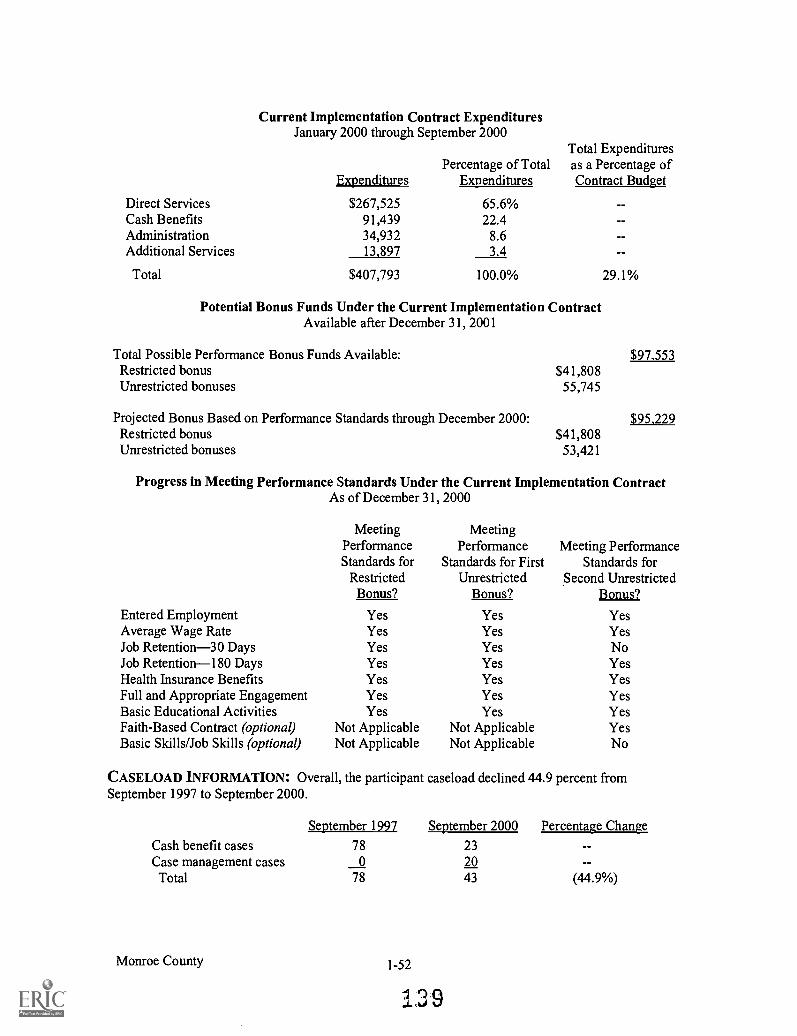
Current Implementation Contract ExpendituresJanuary 2000 through September 2000
Direct ServicesCash BenefitsAdministrationAdditional Services
Total
ExpendituresPercentage of Total
Expenditures
Total Expendituresas a Percentage ofContract Budget
$267,52591,43934,93213.897
65.6%22.4
8.63.4
29.1%$407,793 100.0%
Potential Bonus Funds Under the Current Implementation ContractAvailable after December 31, 2001
Total Possible Performance Bonus Funds Available:Restricted bonusUnrestricted bonuses
Projected Bonus Based on Performance Standards through December 2000:Restricted bonusUnrestricted bonuses
$41,80855,745
$41,80853,421
$97,553
$95,229
Progress in Meeting Performance Standards Under the Current Implementation ContractAs of December 31, 2000
Meeting MeetingPerformance Performance Meeting PerformanceStandards for Standards for First Standards for
Restricted Unrestricted Second UnrestrictedBonus? Bonus? Bonus?
Entered Employment Yes Yes YesAverage Wage Rate Yes Yes YesJob Retention-30 Days Yes Yes NoJob Retention-180 Days Yes Yes YesHealth Insurance Benefits Yes Yes YesFull and Appropriate Engagement Yes Yes YesBasic Educational Activities Yes Yes YesFaith-Based Contract (optional) Not Applicable Not Applicable YesBasic Skills/Job Skills (optional) Not Applicable Not Applicable No
CASELOAD INFORMATION: Overall, the participant caseload declined 44.9 percent fromSeptember 1997 to September 2000.
Cash benefit casesCase management casesTotal
September 1997 September 2000 Percentage Change
780
78
232043 (44.9%)
Monroe County 1-52
1 3 9
SANCTIONS: Workforce Connections sanctioned five community service job participants for anaverage of $164 in September 2000.
FACT-FINDING REVIEWS: Between May 1999 and September 2000, no participants requested fact-finding reviews.
1-53
140
Monroe County

PRICE COUNTY
AGENCY: Price County Human Services Department
SERVICE DELIVERY AREA: Price County
USE OF FUNDS AVAILABLE UNDER TILE INITIAL IMPLEMENTATION CONTRACT:
The Price County Human Services Department spent $784,000 under the initial implementation contract,of which the agency reports $0 was subcontracted service expenditures. As a result of unexpended initialimplementation contract funding, the agency received profits of $142,000 and community reinvestmentfunds of $229,000.
Initial Implementation Contract ExpendituresSeptember 1997 through December 1999
Direct Services:
Expenditures Percentage of Total
Work activities $104,768 13.4%Eligibility determination 218,149 27.8Case management 37,888 4.8FSET services 46,949 6.0Skills training 16,473 2.1Post-employment services 5,094 0.6Educational activities 108,056 13.8Subtotal $537,377 68.5%
Cash Benefits:Community service jobs $ 38,708 4.9%Transitional jobs 29,522 3.8Sanctions* 633 0.1Trial jobs 2,372 0.3Subtotal $ 71,235 9.1%
Administration $ 60,772 7.8%
Additional Services:Contracted child care $ 0 0.0%Job access loans 5,575 0.7Emergency assistance 750 0.1Other FSET services 107,909 13.8Subtotal $114,234 14.6%
Total $783,618 100.0%
* Except in Milwaukee County, sanctions of participants' grants were counted as expenditures and were chargedagainst an agency's contract. Milwaukee agencies retained all sanctioned funds from the implementation contract.
Price County 1-54
141
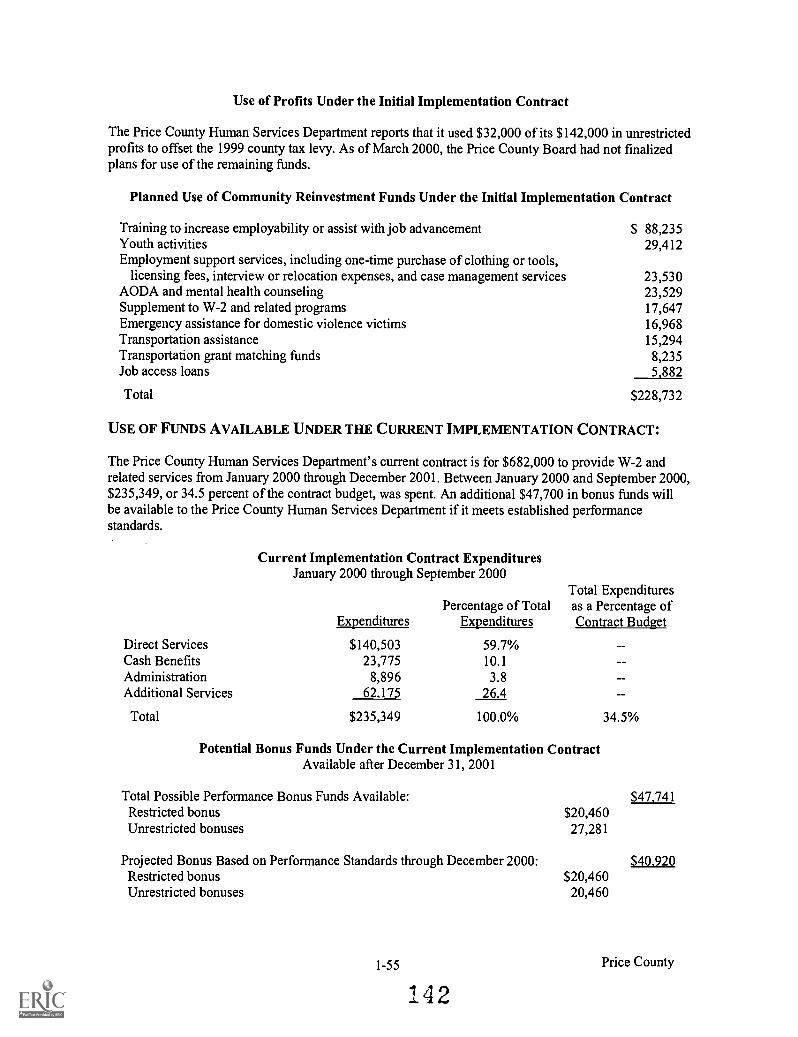
Use of Profits Under the Initial Implementation Contract
The Price County Human Services Department reports that it used $32,000 of its $142,000 in unrestrictedprofits to offset the 1999 county tax levy. As of March 2000, the Price County Board had not finalizedplans for use of the remaining funds.
Planned Use of Community Reinvestment Funds Under the Initial Implementation Contract
Training to increase employability or assist with job advancement $ 88,235Youth activities 29,412Employment support services, including one-time purchase of clothing or tools,
licensing fees, interview or relocation expenses, and case management services 23,530AODA and mental health counseling 23,529Supplement to W-2 and related programs 17,647Emergency assistance for domestic violence victims 16,968Transportation assistance 15,294Transportation grant matching funds 8,235Job access loans 5,882
Total $228,732
USE OF FUNDS AVAILABLE UNDER THE CURRENT IMPLEMENTATION CONTRACT:
The Price County Human Services Department's current contract is for $682,000 to provide W-2 andrelated services from January 2000 through December 2001. Between January 2000 and September 2000,$235,349, or 34.5 percent of the contract budget, was spent. An additional $47,700 in bonus funds willbe available to the Price County Human Services Department if it meets established performancestandards.
Current Implementation Contract ExpendituresJanuary 2000 through September 2000
Direct ServicesCash BenefitsAdministrationAdditional Services
Total
ExpendituresPercentage of Total
Expenditures
Total Expendituresas a Percentage ofContract Budget
$140,50323,775
8,89662,175
59.7%10.1
3.826.4
34.5%$235,349 100.0%
Potential Bonus Funds Under the Current Implementation ContractAvailable after December 31, 2001
Total Possible Performance Bonus Funds Available: $47,741Restricted bonus $20,460Unrestricted bonuses 27,281
Projected Bonus Based on Performance Standards through December 2000: $40,920Restricted bonus $20,460Unrestricted bonuses 20,460
1-55
142Price County

Progress in Meeting Performance Standards Under the Current Implementation ContractAs of December 31, 2000
Meeting MeetingPerformance Performance Meeting PerformanceStandards for Standards for First Standards for
Restricted Unrestricted Second UnrestrictedBonus? Bonus? Bonus?
Entered Employment Yes Yes YesAverage Wage Rate Yes Yes YesJob Retention-30 Days Yes No NoJob Retention-180 Days Yes Yes YesHealth Insurance Benefits Yes Yes YesFull and Appropriate Engagement Yes Yes NoBasic Educational Activities Yes Yes NoFaith-Based Contract (optional) Not Applicable Not Applicable YesBasic Skills/Job Skills (optional) Not Applicable Not Applicable No
CASELOAD INFORMATION: Overall, the participant caseload declined 81.5 percent fromSeptember 1997 to September 2000.
Cash benefit casesCase management casesTotal
September 1997 September 2000 Percentage Change
207
27
41
5 (81.5%)
SANCTIONS: The Price County Human Services Department sanctioned one transitional placementparticipant for $628 in September 2000.
FACT-FINDING REVIEWS: Between May 1999 and September 2000, one participant requested afact-finding review related to employment. The case was resolved in favor of the agency.
Price County 1-56
1 1 r.)'1 ...)

ROCK COUNTY
AGENCY: Rock County Human Services Department
SERVICE DELIVERY AREA: Rock County
USE OF FUNDS AVAILABLE UNDER THE INITIAL IMPLEMENTATION CONTRACT:
The Rock County Human Services Department spent $7.6 million under the initial implementationcontract, of which the agency reports $1.6 million (21.1 percent) was subcontracted service expenditures.As a result of unexpended initial implementation contract funding, the agency received profits of$2.6 million and community reinvestment funds of $5.1 million.
Initial Implementation Contract ExpendituresSeptember 1997 through December 1999
Direct Services:
Expenditures Percentage of Total
Work activities $1,341,482 17.7%Eligibility determination 2,328,618 30.8Case management 404,345 5.3FSET services 418,275 5.5Skills training 231,314 3.1Post-employment services 44,799 0.6Educational activities 172,587 2.3Subtotal $4,941,420 65.3%
Cash Benefits:Community service jobs $ 814,114 10.8%Transitional jobs 390,058 5.2Sanctions 55,844 0.7Trial jobs 4,822 0.1Subtotal $1,264,838 16.8%
Administration $1,117,437 14.8%
Additional Services:Contracted child care 0 0.0%Job access loans 116,628 1.5Emergency assistance 122,996 1.6Other FSET services 2,398 <0.1
Subtotal $ 242,022 3.1%
Total $7,565,717 100.0%
* Except in Milwaukee County, sanctions of participants' grants were counted as expenditures and were chargedagainst an agency's contract. Milwaukee agencies retained all sanctioned funds from the implementation contract.
Rock County 1-58
144

Use of Profits Under the Initial Implementation Contract
The Rock County Human Services Department reports that it used its $2.6 million in unrestricted profitsto offset the 1999, 2000, and 2001 county tax levy for the county human services budget.
Planned Use of Community Reinvestment Funds Under the Initial Implementation Contract
Supplement to W-2 and related programs $1,729,795Youth services, including family preservation and family treatment services 748,401Child protective services, including family preservation and reunification services 696,741Employee retention and advancement 460,000Emergency rental assistance, security deposits, and first month's rent 280,000Emergency energy assistance 263,726Mental health and AODA services for families 169,746Legal representation to assist individuals with eliminating employment barriers 150,000Outreach and coordination of churches to assist with meeting community needs 125,000Loan program to purchase vehicles or other items necessary for access to employment 100,000Transportation services, including bus tokens, gas vouchers, taxi rides for
emergencies, car repairs, licensing, and insurance 99,440Expansion of bus services 75,140Individual development accounts for home purchase, small business start-up, or
post-secondary education 42,000Basic skills education 35,812Before- and after-school child care services 33,226Literacy services to increase basic skills and literacy levels 25,014Drop-in child care services for residents of the domestic violence center 23,630Case management and mentoring services for victims of domestic violence 10,000Parenting and life skills training 3,625
Total $5,071,296
USE OF FUNDS AVAILABLE UNDER THE CURRENT IMPLEMENTATION CONTRACT:
Rock County Human Services Department's current W-2 contract is for $4.7 million to provide W-2 andrelated services from January 2000 through December 2001. Between January 2000 and September 2000,$2,244,993, or 47.8 percent of the contract budget, was spent. An additional $329,000 in bonus fundswill be available to the Rock County Human Services Department if it meets established performancestandards.
Current Implementation Contract ExpendituresJanuary 2000 through September 2000
Expenditures
Direct Services $1,496,031Cash Benefits 414,024Administration 221,265Additional Services 113,673
Total $2,244,993
1-59
Total ExpendituresPercentage of Total as a Percentage of
Expenditures Contract Budget
66.6%18.49.95.1
100.0% 47.8%
X45
Rock County

Potential Bonus Funds Under the Current Implementation ContractAvailable after December 31, 2001
Total Possible Performance Bonus Funds Available: $328,780Restricted bonus $140,906Unrestricted bonuses 187,874
Projected Bonus Based on Performance Standards through December 2000: $242,671Restricted bonus $140,906Unrestricted bonuses 101,765
Progress in Meeting Performance Standards Under the Current Implementation ContractAs of December 31, 2000
Meeting MeetingPerformance Performance Meeting PerformanceStandards for Standards for First Standards for
Restricted Unrestricted Second UnrestrictedBonus? Bonus? Bonus?
Entered Employment Yes Yes NoAverage Wage Rate Yes Yes YesJob Retention-30 Days Yes Yes NoJob Retention-180 Days Yes No NoHealth Insurance Benefits Yes Yes NoFull and Appropriate Engagement Yes Yes YesBasic Educational Activities Yes No NoFaith-Based Contract (optional) . Not Applicable Not Applicable YesBasic Skills/Job Skills (optional) Not Applicable Not Applicable No
CASELOAD INFORMATION: Overall, the participant caseload declined 53.9 percent fromSeptember 1997 to September 2000.
Cash benefit casesCase management casesTotal
September 1997 September 2000 Percentage Change
3360
121
34(53.9%)336 155
SANCTIONS: The Rock County Human Services Department sanctioned seven community service jobparticipants for an average of $365 in September 2000.
Rock County 1-60
146

FACT-FINDING REVIEWS: Between May 1999 and September 2000, five participants requestedfive fact-finding reviews. Information on complaint topics and outcomes is summarized in the followingtable:
Topic of ComplaintRuled in Favor
of AgencyRuled in Favorof Participant
RequestWithdrawn
Employment 2 1 2Child care 0 0 0Emergency assistance 0 0 0Job access loan 0 0 024-month extension 0 0 0
Totals 2 1 2
1-61
147
Rock County

SAWYER COUNTY
AGENCY: Sawyer County Health and Human Services Department
SERVICE DELIVERY AREA: Sawyer County
USE OF FUNDS AVAILABLE UNDER THE INITIAL IMPLEMENTATION CONTRACT:
The Sawyer County Health and Human Services Department spent $798,000 under the initialimplementation contract, of which the agency reports $63,000 (7.9 percent) was subcontracted serviceexpenditures. As a result of unexpended initial implementation contract funding, the agency receivedprofits of $413,000 and community reinvestment funds of $893,000.
Initial Implementation Contract ExpendituresSeptember 1997 through December 1999
Direct Services:
Expenditures Percentage of Total
Work activities $254,481 31.9%Eligibility determination 141,579 17.8Case management 22,590 2.8FSET services 83,573 10.5Skills training 251 <0.1Post-employment services 48,207 6.0Educational activities 27,724 3.5Subtotal $578,405 72.5%
Cash Benefits:Community service jobs $ 63,796 8.0%Transitional jobs 29,870 3.7Sanctions* 11,173 1.4Trial jobs 0 0.0Subtotal $104,839 13.1%
Administration $ 83,508 10.5%
Additional Services:Contracted child care $ 0 0.0%Job access loans 29,951 3.8Emergency assistance 1,050 0.1Other FSET services 0 0.0Subtotal $ 31,001 3.9%
Total $797,753 100.0%
* Except in Milwaukee County, sanctions of participants' grants were counted as expenditures and were chargedagainst an agency's contract. Milwaukee agencies retained all sanctioned funds from the implementation contract.
Sawyer County 1-62
148

Use of Profits Under the Initial Implementation Contract
The Sawyer County Health and Human Services Department reports that it used its $413,000 inunrestricted profits to offset the 2000 county tax levy for community programs.
Planned Use of Community Reinvestment Funds Under the Initial Implementation Contract
Supplement to W-2 and related programs $453,559Parenting aides to work with families involved in the child welfare system- 90,362Intensive supervision services to reduce out-of-home placements for adjudicated delinquents 85,000In-home family counseling services 58,240AODA services for women and families 57,915Lac Courte Oreilles tribal domestic abuse shelter 50,000Transportation services 30,000AODA prevention and education services for teens 23,000Security deposit and rental loan program 20,000Support group and crisis intervention services for domestic abuse victims 15,000Revolving loan program for day care providers 10,000
Total $893,076
USE OF FUNDS AVAILABLE UNDER THE CURRENT IMPLEMENTATION CONTRACT:
Sawyer County Health and Human Services Department's current W-2 contract is for $761,000 toprovide W-2 and related services from January 2000 through December 2001. Between January 2000 andSeptember 2000, $211,258, or 27.8 percent of the contract budget, was spent. An additional $53,000 inbonus funds will be available to the Sawyer County Health and Human Services Department if it meetsestablished performance standards.
Current Implementation Contract ExpendituresJanuary 2000 through September 2000
Total ExpendituresPercentage of Total as a Percentage of
Expenditures Expenditures Contract Budget
Direct Services $177,787 84.2%Cash Benefits 15,275 7.2Administration 7,618 3.6Additional Services 10.578 5.0
Total $211,258 100.0% 27.8%
1-63
X49
Sawyer County

Potential Bonus Funds Under the Current Implementation ContractAvailable after December 31, 2001
Total Possible Performance Bonus Funds Available:Restricted bonusUnrestricted bonuses
$22,82430,431
$53,255
Projected Bonus Based on Performance Standards through December 2000: $43,112Restricted bonus $22,824Unrestricted bonuses 20,288
Progress in Meeting Performance Standards Under the Current Implementation ContractAs of December 31, 2000
Meeting MeetingPerformance Performance Meeting PerformanceStandards for Standards for First Standards for
Restricted Unrestricted Second UnrestrictedBonus? Bonus? Bonus?
Entered Employment Yes Yes YesAverage Wage Rate Yes Yes YesJob Retention-30 Days Yes Yes YesJob Retention-180 Days Yes Yes YesHealth Insurance Benefits Yes No NoFull and Appropriate Engagement Yes No NoBasic Educational Activities Yes Yes YesFaith-Based Contract (optional) Not Applicable Not Applicable YesBasic Skills/Job Skills (optional) Not Applicable Not Applicable No
CASELOAD INFORMATION: Overall, the participant caseload declined 86.0 percent fromSeptember 1997 to September 2000.
Cash benefit casesCase management casesTotal
September 1997 September 2000 Percentage Change
4710
3
5
8 (86.0%)57
SANCTIONS: The Sawyer County Human Services Department sanctioned no participants inSeptember 2000.
FACT -FINDING REVIEWS: Between May 1999 and September 2000, no participants requested fact-finding reviews.
Sawyer County 1-64
150

VILAS COUNTY
AGENCY: Forward Service Corporation, a private nonprofit organization
SERVICE DELIVERY AREA: Vilas County
USE OF FUNDS AVAILABLE UNDER THE INITIAL IMPLEMENTATION CONTRACT:
Forward Service Corporation spent $640,000 under the initial implementation contract, of which theagency reports $0 on subcontracted service expenditures. As a result of unexpended initialimplementation contract funding, the agency received profits of $102,000 and community reinvestmentfunds of $135,000.
Initial Implementation Contract ExpendituresSeptember 1997 through December 1999
Direct Services:
Expenditures Percentage of Total
Work activities $237,523 37.1%Eligibility determination 81,760 12.8Case management 28,382 4.4FSET services 76,187 11.9Skills training 2,890 0.5Post-employment services 976 0.2Educational activities 764 0.1Subtotal $428,482 67.0%
Cash Benefits:Community service jobs $ 68,256 10.7%Transitional jobs 71,949 11.2Sanctions* 72 <0.1Trial jobs 0 0.0
Subtotal $140,277 21.9%
Administration $ 70,544 11.0%
Additional Services:Contracted child care $ 0 0.0%Job access loans 0 0.0Emergency assistance 130 <0.1Other FSET services 768 0.1
Subtotal $ 898 0.1%
Total $640,201 100.0%
* Except in Milwaukee County, sanctions of participants' grants were counted as expenditures and were chargedagainst an agency's contract. Milwaukee agencies retained all sanctioned funds from the implementation contract.
Vilas County 1-66

Use of Profits Under the Initial Implementation Contract
Forward Service Corporation reported that its $102,000 in unrestricted profits will be used to further its"ability to develop innovative and creative educational and charitable services."
Planned Use of Community Reinvestment Funds Under the Initial Implementation Contract
Supplement to W-2 and related programs $ 25,000Grants to assist with car repairs 20,000Temporary housing to assist families with maintaining employment 16,299Forgivable loans to assist families with purchasing cars 15,000Mentoring program for fathers 12,400Assistance with tuition, books, fees, or support services for individuals pursuing short-
term education opportunities 12,000Emergency assistance, including security deposits, driver education, car insurance, food,
clothing, or rent 10,000Counseling to assist families with developing budget management skills 8,500Loan program to assist families with expenses related to car purchase or repair, security
deposits, rent, and work-related needs 5,000Matching funds for individual development accounts to assist families with costs related
to education, job training, home repairs, or down payment for a housing purchase 4,800Clothing program to assist individuals with obtaining appropriate clothing for work and
job-search activities 3,000Parent education and support services 3.000
Total $134,999
USE OF FUNDS AVAILABLE UNDER THE CURRENT IMPLEMENTATION CONTRACT:
Forward Service Corporation's current W-2 contract is for $1.8 million to provide W-2 and relatedservices from January 2000 through December 2001 in Forest, Oneida, and Vilas counties. Of the$1.8 million, approximately $457,000 is budgeted for services in Vilas County. Between January 2000and September 2000, Forward Service Corporation estimates that $172,506, or 37.7 percent of the amountbudgeted in Vilas County, was spent.
Approximately $128,000 in additional bonus funding will be available to Forward Service Corporation ifit meets established performance standards, of which approximately $32,000 will be made available forservices within Vilas County.
Current Implementation Contract ExpendituresJanuary 2000 through September 2000
Direct ServicesCash BenefitsAdministrationAdditional Services
Total
ExpendituresPercentage of Total
Expenditures
Total Expendituresas a Percentage ofContract Budget
$132,18312,78123,3124.230
76.6%7.4
13.52.5
37.7%$172,506 100.0%
1-67
O
Vilas County

Potential Bonus Funds Under the Current Implementation ContractAvailable after December 31, 2001
Total Performance Bonus Funds Available: $32,025Restricted bonus $13,725Unrestricted bonuses 18,300
Projected Bonus Based on Performance Standards through December 2000: $30,500Restricted bonus $13,725Unrestricted bonuses 16,775
Progress in Meeting Performance Standards Under the Current Implementation Contract*As of December 31, 2000
Meeting Meeting MeetingPerformance Performance PerformanceStandards for Standards for First Standards for
Restricted Unrestricted Second UnrestrictedBonus? Bonus? Bonus?
Entered Employment Yes Yes YesAverage Wage Rate Yes Yes YesJob Retention-30 Days Yes Yes YesJob Retention-180 Days Yes Yes YesHealth Insurance Benefits Yes Yes YesFull and Appropriate Engagement Yes Yes YesBasic Educational Activities Yes Yes NoFaith-Based Contract (optional) Not Applicable Not Applicable YesBasic Skills/Job Skills (optional) Not Applicable Not Applicable No
* Reported information is for the entire Forest/Oneida/Vilas Consortium.
CASELOAD INFORMATION: Overall, the participant caseload in Vilas County declined 78.9 percentfrom September 1997 to September 2000.
Cash benefit casesCase management casesTotal
September 1997 September 2000 Percentage Change
172
19
1
3
4 (78.9%)
SANCTIONS: Forward Service Corporation sanctioned no participants in September 2000.
FACT-FINDING REVIEWS: Between May 1999 and September 2000, no participants requested fact-finding reviews.
Vilas County 1-68
153
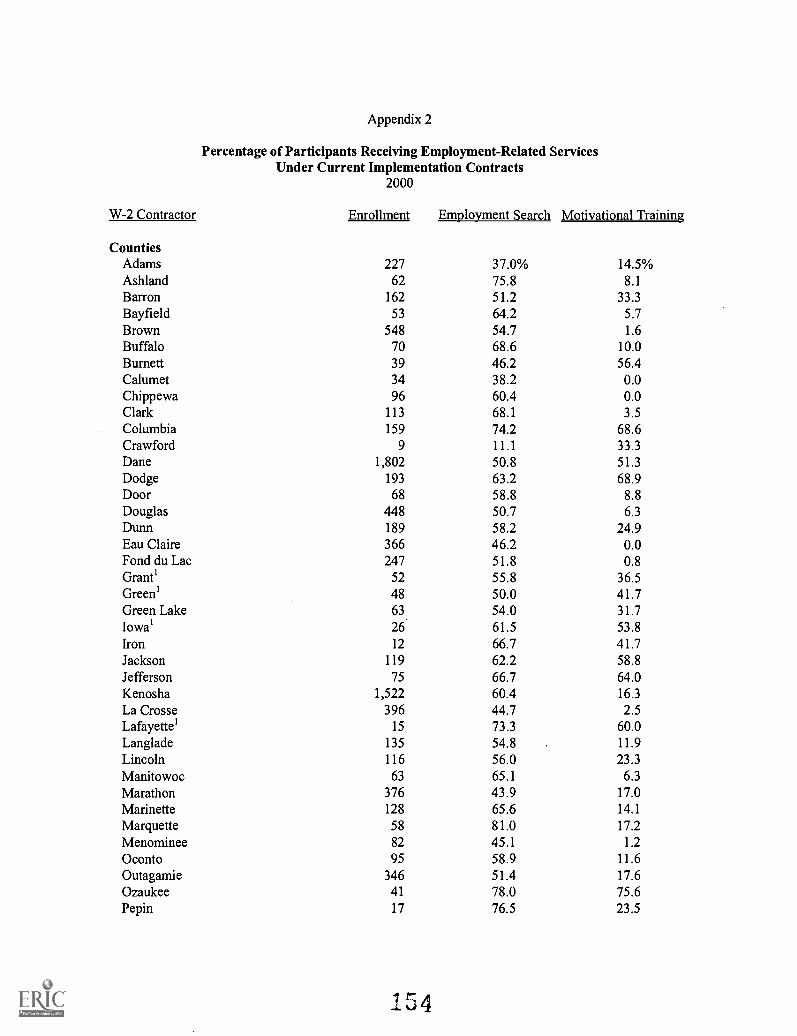
Appendix 2
Percentage of Participants Receiving Employment-Related ServicesUnder Current Implementation Contracts
2000
W-2 Contractor Enrollment Employment Search Motivational Training
CountiesAdams 227 37.0% 14.5%Ashland 62 75.8 8.1Barron 162 51.2 33.3Bayfield 53 64.2 5.7Brown 548 54.7 1.6Buffalo 70 68.6 10.0Burnett 39 46.2 56.4Calumet 34 38.2 0.0Chippewa 96 60.4 0.0Clark 113 68.1 3.5Columbia 159 74.2 68.6Crawford 9 11.1 33.3Dane 1,802 50.8 51.3Dodge 193 63.2 68.9Door 68 58.8 8.8Douglas 448 50.7 6.3Dunn 189 58.2 24.9Eau Claire 366 46.2 0.0Fond du Lac 247 51.8 0.8Grant' 52 55.8 36.5Green' 48 50.0 41.7Green Lake 63 54.0 31.7Iowa' 26 61.5 53.8Iron 12 66.7 41.7Jackson 119 62.2 58.8Jefferson 75 66.7 64.0Kenosha 1,522 60.4 16.3La Crosse 396 44.7 2.5Lafayette' 15 73.3 60.0Langlade 135 54.8 11.9Lincoln 116 56.0 23.3Manitowoc 63 65.1 6.3Marathon 376 43.9 17.0Marinette 128 65.6 14.1
Marquette 58 81.0 17.2Menominee 82 45.1 1.2Oconto 95 58.9 11.6Outagamie 346 51.4 17.6Ozaukee 41 78.0 75.6Pepin 17 76.5 23.5
154
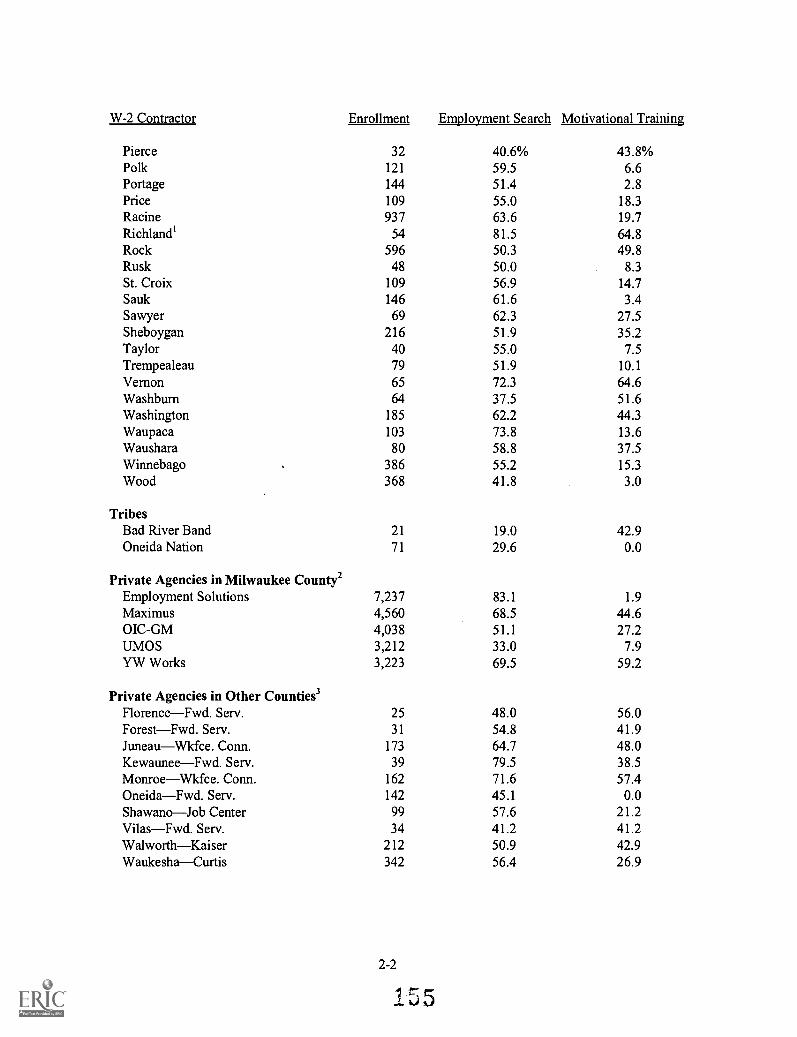
W-2 Contractor Enrollment Employment Search Motivational Training
Pierce 32 40.6% 43.8%Polk 121 59.5 6.6Portage 144 51.4 2.8Price 109 55.0 18.3Racine 937 63.6 19.7Richland' 54 81.5 64.8Rock 596 50.3 49.8Rusk 48 50.0 8.3St. Croix 109 56.9 14.7Sauk 146 61.6 3.4Sawyer 69 62.3 27.5Sheboygan 216 51.9 35.2Taylor 40 55.0 7.5Trempealeau 79 51.9 10.1Vernon 65 72.3 64.6Washburn 64 37.5 51.6Washington 185 62.2 44.3Waupaca 103 73.8 13.6Waushara 80 58.8 37.5Winnebago 386 55.2 15.3Wood 368 41.8 3.0
TribesBad River Band 21 19.0 42.9Oneida Nation 71 29.6 0.0
Private Agencies in Milwaukee County2Employment Solutions 7,237 83.1 1.9Maximus 4,560 68.5 44.6OIC-GM 4,038 51.1 27.2UMOS 3,212 33.0 7.9YW Works 3,223 69.5 59.2
Private Agencies in Other Counties'Florence-Fwd. Serv. 25 48.0 56.0Forest-Fwd. Serv. 31 54.8 41.9Juneau-Wkfce. Conn. 173 64.7 48.0Kewaunee-Fwd. Serv. 39 79.5 38.5Monroe-Wkfce. Conn. 162 71.6 57.4Oneida-Fwd. Serv. 142 45.1 0.0Shawano-Job Center 99 57.6 21.2Vilas-Fwd. Serv. 34 41.2 41.2Walworth-Kaiser 212 50.9 42.9Waukesha-Curtis 342 56.4 26.9
2-2
I 5 5
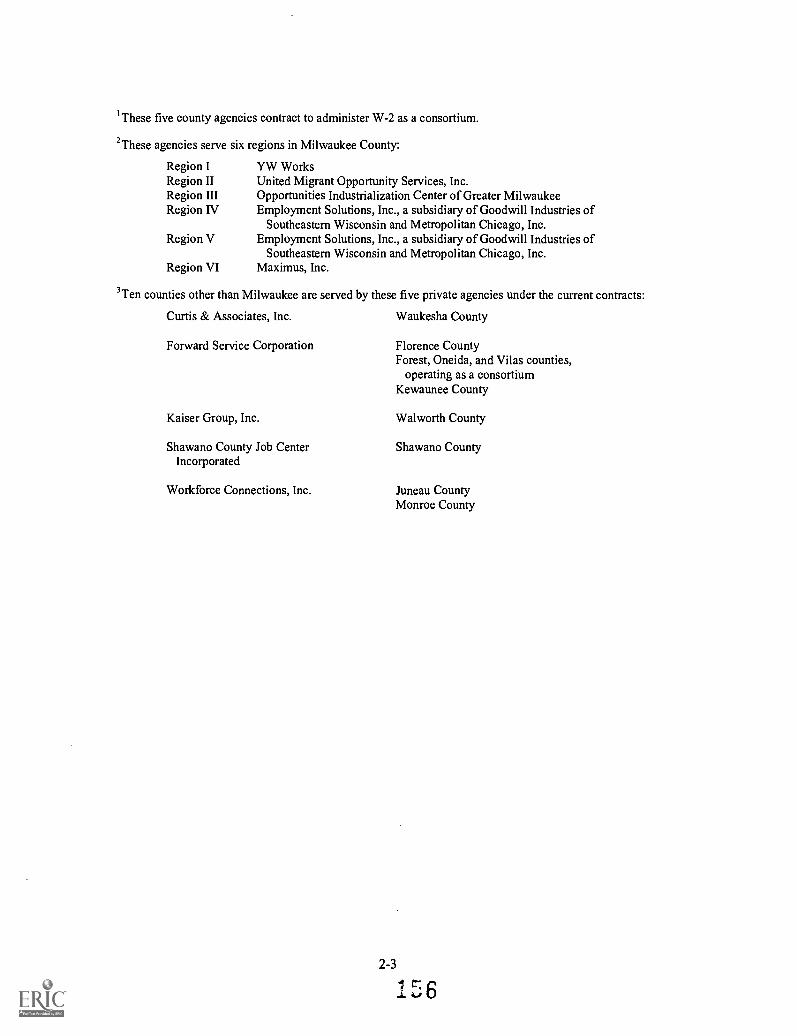
i These five county agencies contract to administer W-2 as a consortium.
2These agencies serve six regions in Milwaukee County:
Region IRegion IIRegion IIIRegion IV
Region V
Region VI
YW WorksUnited Migrant Opportunity Services, Inc.Opportunities Industrialization Center of Greater MilwaukeeEmployment Solutions, Inc., a subsidiary of Goodwill Industries of
Southeastern Wisconsin and Metropolitan Chicago, Inc.Employment Solutions, Inc., a subsidiary of Goodwill Industries of
Southeastern Wisconsin and Metropolitan Chicago, Inc.Maximus, Inc.
3 Ten counties other than Milwaukee are served by these five private agencies under the current contracts:
Curtis & Associates, Inc. Waukesha County
Forward Service Corporation
Kaiser Group, Inc.
Shawano County Job CenterIncorporated
Workforce Connections, Inc.
Florence CountyForest, Oneida, and Vilas counties,
operating as a consortiumKewaunee County
Walworth County
Shawano County
Juneau CountyMonroe County
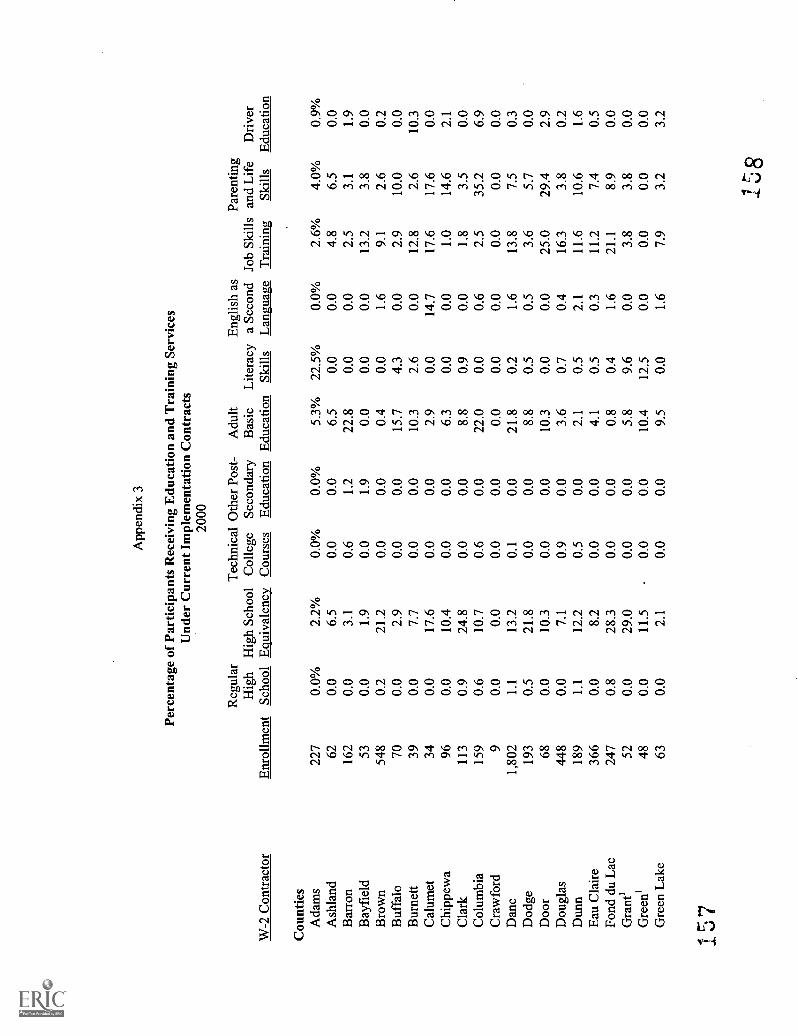
App
endi
x 3
Perc
enta
ge o
f Pa
rtic
ipan
ts R
ecei
ving
Edu
catio
n an
d T
rain
ing
Serv
ices
Und
er C
urre
nt I
mpl
emen
tatio
n C
ontr
acts
2000
W-2
Con
trac
tor
Enr
ollm
ent
Reg
ular
Hig
hSc
hool
Hig
h Sc
hool
Equ
ival
ency
Tec
hnic
al O
ther
Pos
t-C
olle
geSe
cond
ary
Cou
rses
Adu
ltB
asic
Edu
catio
nL
itera
cySk
ills
Eng
lish
asa
Seco
ndL
angu
age
Job
Skill
sT
rain
ing
Pare
ntin
gan
d L
ife
Skill
sD
rive
rE
duca
tion
Cou
ntie
sA
dam
s22
70.
0%2.
2%0.
0%0.
0%5.
3%22
.5%
0.0%
2.6%
4.0%
0.9%
Ash
land
620.
06.
50.
00.
06.
50.
00.
04.
86.
50.
0B
arro
n16
20.
03.
10.
61.
222
.80.
00.
02.
53.
11.
9B
ayfi
eld
530.
01.
90.
01.
90.
00.
00.
013
.23.
80.
0B
row
n54
80.
221
.20.
00.
00.
40.
01.
69.
12.
60.
2B
uffa
lo70
0.0
2.9
0.0
0.0
15.7
4.3
0.0
2.9
10.0
0.0
Bur
nett
390.
07.
70.
00.
010
.32.
60.
012
.82.
610
.3C
alum
et34
0.0
17.6
0.0
0.0
2.9
0.0
14.7
17.6
17.6
0.0
Chi
ppew
a96
0.0
10.4
0.0
0.0
6.3
0.0
0.0
1.0
14.6
2.1
Cla
rk11
30.
924
.80.
00.
08.
80.
90.
01.
83.
50.
0C
olum
bia
159
0.6
10.7
0.6
0.0
22.0
0.0
0.6
2.5
35.2
6.9
Cra
wfo
rd9
0.0
0.0
0.0
0.0
0.0
0.0
0.0
0.0
0.0
0.0
Dan
e1,
802
1.1
13.2
0.1
0.0
21.8
0.2
1.6
13.8
7.5
0.3
Dod
ge19
30.
521
.80.
00.
08.
80.
50.
53.
65.
70.
0D
oor
680.
010
.30.
00.
010
.30.
00.
025
.029
.42.
9D
ougl
as44
80.
07.
10.
90.
03.
60.
70.
416
.33.
80.
2D
unn
189
1.1
12.2
0.5
0.0
2.1
0.5
2.1
11.6
10.6
1.6
Eau
Cla
ire
366
0.0
8.2
0.0
0.0
4.1
0.5
0.3
11.2
7.4
0.5
Fond
du
Lac
247
0.8
28.3
0.0
0.0
0.8
0.4
1.6
21.1
8.9
0.0
Gra
nt'
520.
029
.00.
00.
05.
89.
60.
03.
83.
80.
0G
reen
'48
0.0
11.5
0.0
0.0
10.4
12.5
0.0
0.0
0.0
0.0
Gre
en L
ake
630.
02.
10.
00.
09.
50.
01.
67.
93.
23.
2
1 r:

W-2
Con
trac
tor
Enr
ollm
ent
Reg
ular
Hig
hSc
hool
Tec
hnic
al O
ther
Pos
t-H
igh
Scho
ol C
olle
geSe
cond
ary
Equ
ival
ency
Cou
rses
Edu
catio
n
Adu
ltB
asic
Edu
catio
nL
itera
cySk
ills
Eng
lish
asa
Seco
ndL
angu
age
Job
Skill
sT
rain
ing
Pare
ntin
gan
d L
ife
Skill
sD
rive
rE
duca
tion
Iow
a'26
0.0%
11.1
%0.
0%0.
0%3.
8%0.
0%0.
0%3.
8%19
.2%
0.0%
Iron
128.
326
.90.
00.
00.
00.
00.
025
.025
.00.
0Ja
ckso
n11
90.
00.
00.
00.
00.
85.
00.
015
.112
.60.
8Je
ffer
son
750.
019
.34.
00.
09.
35.
32.
712
.05.
31.
3K
enos
ha1,
522
0.7
13.3
0.2
0.0
29.0
1.8
2.8
8.2
4.5
0.0
La
Cro
sse
396
0.0
25.4
0.0
0.0
4.5
1.0
0.5
1.3
8.3
0.0
Laf
ayet
te'
150.
03.
50.
00.
00.
026
.70.
06.
70.
00.
0L
angl
ade
135
0.0
7.7
0.0
0.0
39.3
0.0
0.0
14.1
0.7
1.5
Lin
coln
116
0.0
11.1
0.0
0.0
11.2
8.6
0.0
2.6
4.3
0.0
Man
itow
oc63
0.0
20.0
0.0
0.0
3.2
0.0
7.9
6.3
1.6
0.0
Mar
atho
n37
60.
514
.10.
30.
05.
10.
85.
62.
943
.91.
9M
arin
ette
128
0.0
8.6
0.8
0.0
2.3
0.0
0.0
38.3
0.0
1.6
Mar
quet
te58
0.0
12.7
0.0
0.0
12.1
0.0
0.0
50.0
6.9
0.0
Men
omin
ee82
0.0
22.9
0.0
0.0
1.2
0.0
0.0
20.7
12.2
2.4
Oco
nto
950.
028
.11.
10.
022
.10.
00.
03.
21.
13.
2O
utag
amie
346
1.2
41.4
0.6
0.0
4.6
1.4
9.2
11.3
46.0
6.9
Oza
ukee
410.
020
.40.
00.
09.
80.
04.
90.
00.
00.
0Pe
pin
170.
07.
40.
00.
00.
011
.80.
05.
90.
00.
0Pi
erce
320.
04.
90.
00.
09.
40.
00.
031
.321
.90.
0Po
lk12
10.
821
.40.
00.
014
.90.
00.
014
.99.
91.
7Po
rtag
e14
40.
00.
00.
00.
04.
90.
70.
02.
12.
10.
0Pr
ice
109
0.0
0.0
0.0
0.0
1.8
11.9
0.0
4.6
1.8
0.0
Rac
ine
937
0.2
18.8
0.1
0.0
25.3
2.0
1.6
1.9
2.1
0.0
Ric
hlan
d'54
0.0
4.1
0.0
0.0
9.3
13.0
0.0
0.0
7.4
0.0
Roc
k59
60.
24.
20.
30.
04.
00.
51.
719
.88.
40.
0R
usk
480.
09.
20.
00.
010
.40.
00.
04.
24.
20.
0St
. Cro
ix10
90.
012
.70.
00.
06.
40.
00.
03.
78.
30.
0Sa
uk14
60.
027
.80.
00.
05.
50.
00.
746
.616
.43.
4
159
3-2

W-2
Con
trac
tor
Enr
ollm
ent
Reg
ular
Hig
hSc
hool
Tec
hnic
al O
ther
Pos
t-H
igh
Scho
ol C
olle
geSe
cond
ary
Equ
ival
ency
Cou
rses
Adu
ltB
asic
Edu
catio
nL
itera
cySk
ills
Eng
lish
asa
Seco
ndL
angu
age
Job
Skill
sT
rain
ing
Pare
ntin
gan
d L
ife
Skill
sD
rive
rE
duca
tion
Saw
yer
690.
0%22
.7%
1.4%
0.0%
7.2%
0.0%
0.0%
0.0%
4.3%
0.0%
Sheb
oyga
n21
60.
010
.40.
90.
08.
80.
916
.20.
03.
20.
0T
aylo
r40
2.5
8.3
0.0
0.0
0.0
0.0
0.0
12.5
5.0
0.0
Tre
mpe
alea
u79
0.0
16.4
0.0
0.0
7.6
1.3
0.0
8.9
3.8
0.0
Ver
non
650.
04.
30.
00.
024
.60.
00.
04.
61.
53.
1W
ashb
urn
640.
025
.30.
00.
012
.50.
01.
61.
60.
03.
1W
ashi
ngto
n18
50.
014
.40.
00.
022
.20.
01.
14.
32.
21.
1
Wau
paca
103
1.0
22.5
0.0
0.0
2.9
1.0
0.0
17.5
15.5
3.9
Wau
shar
a80
0.0
8.9
0.0
0.0
10.0
13.8
0.0
1.3
1.3
0.0
Win
neba
go38
60.
516
.91.
30.
09.
12.
35.
720
.78.
81.
8W
ood
368
0.0
14.7
0.3
0.0
1.6
0.3
0.0
4.1
11.7
1.1
Tri
bes
Bad
Riv
er B
and
210.
00.
00.
00.
019
.00.
00.
09.
54.
80.
0O
neid
a N
atio
n71
1.4
23.9
0.0
0.0
0.0
0.0
0.0
0.0
5.6
0.0
Priv
ate
Age
ncie
s in
Milw
auke
e C
ount
y2E
mpl
oym
ent S
olut
ions
7,23
71.
629
.50.
20.
053
.31.
50.
515
.85.
60.
1M
axim
us4,
560
1.2
18.3
0.8
0.0
37.2
1.0
4.3
13.8
23.7
0.1
OIC
-GM
4,03
81.
26.
70.
10.
063
.90.
60.
112
.01.
7.4
0.3
UM
OS
3,21
20.
637
.90.
20.
020
.31.
210
.714
.26.
10.
0Y
W W
orks
3,22
31.
59.
70.
10.
033
.769
.11.
425
.94.
81.
3
161
3-3

Reg
ular
Hig
hT
echn
ical
Oth
er P
ost-
Hig
h Sc
hool
Col
lege
Seco
ndar
yA
dult
Bas
icL
itera
cyE
nglis
h as
a Se
cond
Job
Skill
sPa
rent
ing
and
Lif
eD
rive
rW
-2 C
ontr
acto
rE
nrol
lmen
tSc
hool
Equ
ival
ency
Cou
rses
Edu
catio
nE
duca
tion
Skill
sL
angu
age
Tra
inin
gSk
ills
Edu
catio
n
Priv
ate
Age
ncie
s in
Oth
erC
ount
ies3
Flor
ence
-Fw
d. S
erv.
250.
0%16
.0%
4.0%
0.0%
20.0
%4.
0%0.
0%20
.0%
12.0
%4.
0%Fo
rest
-Fw
d. S
erv.
313.
229
.00.
00.
09.
70.
00.
06.
532
.33.
2Ju
neau
-Wkf
ce. C
onn.
173
0.0
25.4
0.6
0.0
4.6
0.0
1.7
14.5
12.1
3.5
Kew
aune
e-Fw
d. S
erv.
390.
07.
70.
00.
017
.95.
15.
17.
743
.60.
0M
onro
e-W
kfce
. Con
n.16
20.
020
.40.
60.
04.
90.
00.
04.
34.
90.
0O
neid
a-Fw
d. S
erv.
142
0.0
4.9
0.0
0.0
12.0
0.7
0.0
1.4
5.6
0.0
Shaw
ano-
Job
Cen
ter
990.
025
.30.
00.
015
.24.
00.
026
.38.
11.
0
Vila
s-Fw
d. S
erv.
340.
014
.70.
00.
014
.70.
00.
02.
98.
80.
0W
alw
orth
-Kai
ser
212
0.5
7.1
0.0
0.0
18.9
0.0
2.8
1.4
2.8
0.5
Wau
kesh
a-C
urtis
342
0.3
15.8
0.3
0.0
1.2
0.3
5.0
10.5
0.3
0.0
The
se f
ive
coun
ty a
genc
ies
cont
ract
to a
dmin
iste
r W
-2 a
s a
cons
ortiu
m.
2The
se a
genc
ies
serv
e si
x re
gion
s in
Milw
auke
e C
ount
y:
Reg
ion
IR
egio
n II
Reg
ion
III
Reg
ion
IV
Reg
ion
V
Reg
ion
VI
1 C
3
YW
Wor
ksU
nite
d M
igra
nt O
ppor
tuni
ty S
ervi
ces,
Inc
.O
ppor
tuni
ties
Indu
stri
aliz
atio
n C
ente
r of
Gre
ater
Milw
auke
eE
mpl
oym
ent S
olut
ions
, Inc
., a
subs
idia
ry o
f G
oodw
ill I
ndus
trie
s of
Sout
heas
tern
Wis
cons
in a
nd M
etro
polit
an C
hica
go, I
nc.
Em
ploy
men
t Sol
utio
ns, I
nc.,
a su
bsid
iary
of
Goo
dwill
Ind
ustr
ies
ofSo
uthe
aste
rn W
isco
nsin
and
Met
ropo
litan
Chi
cago
, Inc
.M
axim
us, I
nc.
3-4
1 C
4

3T
en c
ount
ies
othe
r th
an M
ilwau
kee
are
serv
ed b
y th
ese
five
pri
vate
age
ncie
s un
der
the
curr
ent c
ontr
acts
:
Cur
tis &
Ass
ocia
tes,
Inc
.
Forw
ard
Serv
ice
Cor
pora
tion
Kai
ser
Gro
up, I
nc.
Shaw
ano
Cou
nty
Job
Cen
ter
Inco
rpor
ated
Wor
kfor
ce C
onne
ctio
ns, I
nc.
165
Wau
kesh
a C
ount
y
Flor
ence
Cou
nty
Fore
st, O
neid
a, a
nd V
ilas
coun
ties,
oper
atin
g as
a c
onso
rtiu
mK
ewau
nee
Cou
nty
Wal
wor
th C
ount
y
Shaw
ano
Cou
nty
June
au C
ount
yM
onro
e C
ount
y
3-5
166
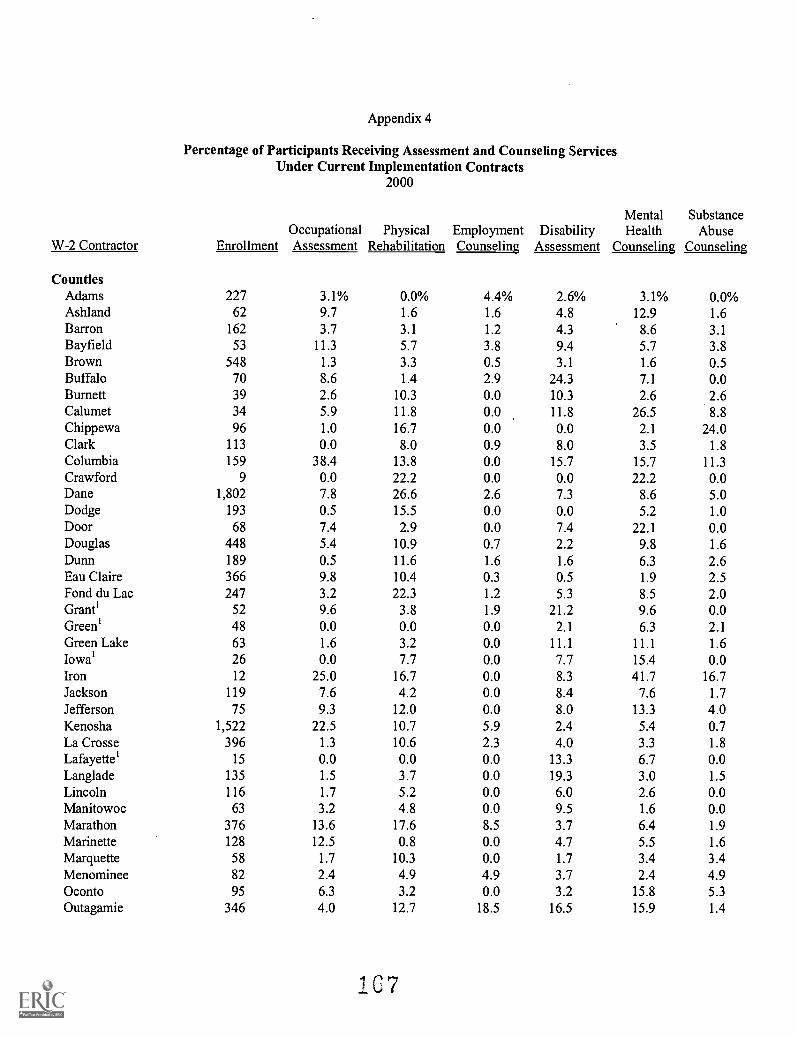
Appendix 4
Percentage of Participants Receiving Assessment and Counseling ServicesUnder Current Implementation Contracts
2000
W-2 ContractorOccupational Physical Employment Disability
Enrollment Assessment Rehabilitation Counseling Assessment
MentalHealth
Counseling
SubstanceAbuse
Counseling
CountiesAdams 227 3.1% 0.0% 4.4% 2.6% 3.1% 0.0%Ashland 62 9.7 1.6 1.6 4.8 12.9 1.6Barron 162 3.7 3.1 1.2 4.3 8.6 3.1Bayfield 53 11.3 5.7 3.8 9.4 5.7 3.8Brown 548 1.3 3.3 0.5 3.1 1.6 0.5Buffalo 70 8.6 1.4 2.9 24.3 7.1 0.0Burnett 39 2.6 10.3 0.0 10.3 2.6 2.6Calumet 34 5.9 11.8 0.0 11.8 26.5 8.8Chippewa 96 1.0 16.7 0.0 0.0 2.1 24.0Clark 113 0.0 8.0 0.9 8.0 3.5 1.8Columbia 159 38.4 13.8 0.0 15.7 15.7 11.3Crawford 9 0.0 22.2 0.0 0.0 22.2 0.0Dane 1,802 7.8 26.6 2.6 7.3 8.6 5.0Dodge 193 0.5 15.5 0.0 0.0 5.2 1.0Door 68 7.4 2.9 0.0 7.4 22.1 0.0Douglas 448 5.4 10.9 0.7 2.2 9.8 1.6Dunn 189 0.5 11.6 1.6 1.6 6.3 2.6Eau Claire 366 9.8 10.4 0.3 0.5 1.9 2.5Fond du Lac 247 3.2 22.3 1.2 5.3 8.5 2.0Grant' 52 9.6 3.8 1.9 21.2 9.6 0.0Green' 48 0.0 0.0 0.0 2.1 6.3 2.1Green Lake 63 1.6 3.2 0.0 11.1 11.1 1.6Iowa' 26 0.0 7.7 0.0 7.7 15.4 0.0Iron 12 25.0 16.7 0.0 8.3 41.7 16.7Jackson 119 7.6 4.2 0.0 8.4 7.6 1.7Jefferson 75 9.3 12.0 0.0 8.0 13.3 4.0Kenosha 1,522 22.5 10.7 5.9 2.4 5.4 0.7La Crosse 396 1.3 10.6 2.3 4.0 3.3 1.8Lafayette' 15 0.0 0.0 0.0 13.3 6.7 0.0Langlade 135 1.5 3.7 0.0 19.3 3.0 1.5Lincoln 116 1.7 5.2 0.0 6.0 2.6 0.0Manitowoc 63 3.2 4.8 0.0 9.5 1.6 0.0Marathon 376 13.6 17.6 8.5 3.7 6.4 1.9Marinette 128 12.5 0.8 0.0 4.7 5.5 1.6Marquette 58 1.7 10.3 0.0 1.7 3.4 3.4Menominee 82 2.4 4.9 4.9 3.7 2.4 4.9Oconto 95 6.3 3.2 0.0 3.2 15.8 5.3Outagamie 346 4.0 12.7 18.5 16.5 15.9 1.4
167

W-2 ContractorOccupational Physical Employment Disability
Enrollment Assessment Rehabilitation Counseling Assessment
MentalHealth
Counseling
SubstanceAbuse
Counseling
Ozaukee 41 48.8% 0.0% 0.0% 0.0% 2.4% 0.0%Pepin 17 58.8 0.0 0.0 5.9 0.0 0.0Pierce 32 3.1 15.6 3.1 9.4 6.3 9.4Polk 121 3.3 9.1 0.8 12.4 7.4 1.7Portage 144 0.0 16.7 0.0 6.3 0.7 0.0Price 109 1.8 1.8 0.0 4.6 3.7 0.9Racine 937 0.5 10.1 0.4 11.5 2.3 0.6Richland' 54 0.0 1.9 0.0 3.7 5.6 0.0Rock 596 0.5 19.6 13.3 3.0 6.7 1.3Rusk 48 2.1 14.6 0.0 6.3 0.0 0.0St. Croix 109 22.0 9.2 1.8 11.0 1.8 0.0Sauk 146 53.4 2.7 0.0 26.0 4.1 2.7Sawyer 69 1.4 7.2 5.8 1.4 5.8 0.0Sheboygan 216 0.0 13.9 0.0 0.0 6.5 1.9Taylor 40 12.5 0.0 0.0 10.0 7.5 0.0Trempealeau 79 1.3 24.1 1.3 0.0 3.8 0.0Vernon 65 6.2 9.2 0.0 7.7 1.5 0.0Washburn 64 10.9 6.3 0.0 7.8 9.4 1.6Washington 185 23.8 5.9 0.0 1.1 1.6 1.1Waupaca 103 9.7 37.9 1.9 2.9 29.1 2.9Waushara 80 32.5 1.3 0.0 5.0 0.0 2.5Winnebago 386 25.1 17.6 15.3 17.6 12.2 2.1Wood 368 7.3 15.5 7.3 5.2 6.3 0.3
TribesBad River Band 21 0.0 4.8 14.3 0.0 4.8 4.8Oneida Nation 71 0.0 15.5 0.0 1.4 0.0 1.4
Private Agencies inMilwaukee County2
Employment Solutions 7,237 2.0 14.7 2.2 6.8 5.4 2.8Maximus 4,560 24.2 8.9 12.7 13.0 5.3 3.3OIC-GM 4,038 21.7 5.5 0.5 8.6 3.8 4.2LIMOS 3,212 6.2 9.0 56.7 8.8 6.6 2.0YW Works 3,223 16.4 7.8 1.7 3.6 8.2 2.5
4-2
168

Occupational Physical Employment DisabilityMental SubstanceHealth Abuse
W-2 Contractor Enrollment Assessment Rehabilitation Counseling Assessment Counseling Counseling
Private Agencies in OtherCounties3
Florence-Fwd. Serv. 25 0.0% 8.0% 0.0% 8.0% 12.0% 0.0%Forest-Fwd. Serv. 31 3.2 0.0 0.0 16.1 16.1 3.2Juneau-Wkfce. Conn. 173 1.2 6.4 8.7 19.1 11.0 0.0Kewaunee-Fwd. Serv. 39 5.1 5.1 7.7 12.8 17.9 2.6Monroe- Wkfce. Conn. 162 0.6 12.3 12.3 6.2 8.6 1.2Oneida-Fwd. Serv. 142 7.0 2.1 1.4 35.2 1.4 1.4Shawano-Job Center 99 5.1 16.2 3.0 11.1 7.1 16.2Vilas-Fwd. Serv. 34 2.9 0.0 0.0 0.0 5.9 2.9Walworth-Kaiser 212 0.5 20.3 0.9 11.8 2.8 0.5Waukesha-Curtis 342 4.4 0.6 0.3 13.5 5.0 1.2
'These five county agencies contract to administer W-2 as a consortium.
2These agencies serve six regions in Milwaukee County:
Region I YW WorksRegion II United Migrant Opportunity Services, Inc.Region III Opportunities Industrialization Center of Greater MilwaukeeRegion IV Employment Solutions, Inc., a subsidiary of Goodwill Industries of
Southeastern Wisconsin and Metropolitan Chicago, Inc.Region V Employment Solutions, Inc., a subsidiary of Goodwill Industries of
Southeastern Wisconsin and Metropolitan Chicago, Inc.Region VI Maximus, Inc.
3Ten counties other than Milwaukee are served by these five private agencies under the current contracts:
Curtis & Associates, Inc. Waukesha County
Forward Service Corporation Florence CountyForest, Oneida, and Vilas counties,
operating as a consortiumKewaunee County
Kaiser Group, Inc. Walworth County
Shawano County Job Center Shawano CountyIncorporated
Workforce Connections, Inc. Juneau CountyMonroe County
4-3
169

Appendix 5
W-2 Agencies' CaseloadsSeptember 1997 and September 2000
September September PercentageW-2 Contractor 1997 2000 Change
CountiesAdams 20 7 -65.0%Ashland 33 5 -84.8Barron 23 9 -60.9Bayfield 10 3 -70.0Brown 273 38 -86.1Buffalo 16 10 -37.5Burnett 20 4 -80.0Calumet 17 10 -41.2Chippewa 67 28 -58.2Clark 4 8 100.0Columbia 13 27 107.7Crawford 2 1 -50.0Dane 945 542 -42.6Dodge 92 45 -51.1Door 18 17 -5.6Douglas 258 62 -76.0Dunn 81 40 -50.6Eau Claire 199 29 -85.4Fond du Lac 68 67 -1.5Grant-SW Consortium' 82 22 -73.2Green Lake 12 5 -58.3Iron 3 4 33.3Jackson 35 5 -85.7Jefferson 30 22 -26.7Kenosha 564 356 -36.9La Crosse 181 41 -77.3Langlade 32 18 -43.8Lincoln 32 7 -78.1Manitowoc 43 8 -81.4Marathon 213 67 -68.5Marinette 68 5 -92.6Marquette 5 6 20.0Menominee 99 15 -84.8Oconto 13 3 -76.9Outagamie 156 83 -46.8Ozaukee 14 3 -78.6Pepin 10 0 -100.0Pierce 11 8 -27.3Polk 14 26 85.7Portage 63 20 -68.3
170

W-2 ContractorSeptember
1997September
2000Percentage
Change
Price 27 5 -81.5%Racine 719 155 -78.4Rock 336 155 -53.9Rusk 14 6 -57.1St. Croix 13 15 15.4Sauk 58 13 -77.6Sawyer 57 8 -86.0Sheboygan 66 54 -18.2Taylor 18 5 -72.2Trempealeau 32 8 -75.0Vernon 29 6 -79.3Washburn 16 7 -56.3Washington 58 24 -58.6Waupaca 45 47 4.4Waushara 12 0 -100.0Winnebago 169 78 -53.8Wood 119 41 -65.5
Subtotal 5,627 2,303 -59.1%
TribesBad River Band 27 7 -74.1Lac du Flambeau Band2 56Oneida Nation 32 30 -6.3
Subtotal 115 37 -67.8%
Private Agencies in Milwaukee County3Employment Solutions 5,603 2,882 -48.6Maximus 2,861 1,592 -44.4OIC-GM 2,783 1,655 -40.5LIMOS 2,316 1,441 -37.8YW Works 1,851 1,002 -45.9Milwaukee-Unknown 1.011 6 -99.4
Subtotal 16,425 8,578 -47.8%
Private Agencies in Other Counties4Forest-Oneida-Vilas-Fwd. Serv. 119 19 -84.0Juneau-W. WI PIC 37 40 8.1Kewaunee-Fwd. Serv. 9 6 -33.3Shawano-Job Center 60 24 -60.0Walworth-Kaiser 68 33 -51.5Waukesha-Curtis 216 84 -61.1
Subtotal 509 206 -59.5%
5-2
171

September September PercentageW-2 Contractor 1997 2000 Change
OthersFlorenceFwd. Sew. 7 4 -42.9%MonroeWkfce. Conn. 78 43 -44.9
Subtotal 85 47 -44.7%
Total 22,761 11,171 -50.9%
The Southwest Consortium consists of Grant, Green, Iowa, Lafayette, and Richland counties.
2 The Lac du Flambeau Band of Chippewa was a W-2 agency through December 1999 but is not a W-2agency under the current contract.
3 Five agencies serve six regions in Milwaukee County:
4
Region I YW WorksRegion II United Migrant Opportunity Services, Inc.Region III Opportunities Industrialization Center of Greater MilwaukeeRegion IV Employment Solutions, Inc., a subsidiary of Goodwill Industries of
Southeastern Wisconsin and Metropolitan Chicago, Inc.Region V Employment Solutions, Inc., a subsidiary of Goodwill Industries of
Southeastern Wisconsin and Metropolitan Chicago, Inc.Region VI Maximus, Inc.
Participants whose region could not be determined at the time of the caseload count are included inMilwaukee Unknown.
Eight counties other than Milwaukee have been served by these five private agencies. The name ofone of the agencies changed from the first to the second implementation period.
Curtis & Associates, Inc. Waukesha County
Forward Service Corporation
Kaiser Group, Inc.
Shawano County Job CenterIncorporated
Western Wisconsin PrivateIndustry Council, Inc.
Workforce Connections, Inc.
Forest, Oneida, and Vilas (FOV) counties wereserved separately under the initial implementationcontract and as a consortium under the currentcontract
Kewaunee. County
Walworth County
Shawano County
Juneau County (initial implementation contract)
Juneau County (current implementation contract)
5 Programs in these counties were administered by county agencies in September 1997 but by thefollowing private agencies in September 2000:
Forward Service Corporation Florence County
Workforce Connections, Inc. Monroe County
5-3
172

Appendix 6
W-2 Agencies' Contract Amounts, Reported Expenditures,Profits, and Reinvestment Under Initial Implementation Contracts
September 1997 through December 1999
W-2 ContractorTotal Contract Percentage
Contract Amount Expenditures Spent Total ProfitTotal W-2
Reinvestment
CountiesAdams $ 2,312,112 $ 1,021,861 44.2% $ 270,513 $ 488,993Ashland 2,136,051 692,338 32.4 274,903 564,205Barron 2,840,732 1,495,363 52.6 308,232 492,213Bayfield 782,037 596,957 76.3 66,703 53,822Brown 18,684,322 6,202,482 33.2 2,388,793 4,864,008Buffalo 1,295,730 542,630 41.9 155,106 289,822Burnett 1,808,875 602,743 33.3 231,191 470,566Calumet 1,427,259 602,179 42.2 158,914 314,837Chippewa 5,732,223 1,864,498 32.5 736,975 1,510,736Clark 1,678,742 534,376 31.8 217,116 448,220Columbia 2,674,029 1,320,340 49.4 295,517 487,505Crawford 1,071,277 486,530 45.4 124,323 222,000Dane 27,230,397 17,996,730 66.1 2,600,226 3,123,444Dodge 3,407,516 1,278,458 37.5 420,093 817,050Door 1,176,133 776,119 66.0 112,464 135,608Douglas 8,153,131 2,884,783 35.4 1,024,699 2,042,911Dunn 4,265,318 1,896,181 44.5 481,867 824,826Eau Claire 11,558,545 3,986,320 34.5 1,464,886 2,951,044Florence 704,055 317,445 45.1 82,029 147,353Fond du Lac 3,994,910 .1,789,196 44.8 464,844 833,400Grant-SW Consortium' 7,184,439 3,455,244 48.1 812,823 1,394,605Green Lake 1,306,952 632,875 48.4 147,786 253,349Iron 665,495 242,729 36.5 83,213 164,827Jackson 2,057,637 824,584 40.1 249,239 473,419Jefferson 3,348,304 1,119,324 33.4 427,340 868,312Kenosha 19,637,922 15,700,903 80.0 1,619,021 1,099,651La Crosse 12,428,718 3,369,122 27.1 1,665,872 3,581,379Lang lade 2,149,597 853,071 39.7 261,232 498,418Lincoln 2,175,447 685,684 31.5 281,899 583,279Manitowoc 4,839,797 1,738,786 35.9 605,320 1,199,402Marathon 11,351,099 5,757,797 50.7 1,255,002 2,071,912Marinette 4,150,189 1,188,457 28.6 549,518 1,165,523Marquette 835,850 402,669 48.2 94,721 162,948Menominee 2,771,821 1,269,135 45.8 324,521 587,221Monroe 4,029,473 1,297,377 32.2 520,150 1,071,389Oconto 2,267,220 874,685 38.6 277,794 535,901Outagamie 7,488,589 3,264,434 43.6 866,044 1,612,263Ozaukee 1,518,109 733,630 48.3 171,443 293,290
173

W-2 ContractorTotal Contract Percentage
Contract Amount Expenditures Spent Total ProfitTotal W-2
Reinvestment
Pepin $ 481,360 $ 352,052 73.1% $ 42,071 $ 37,689Pierce 1,465,471 789,122 53.8 157,465 246,972Polk 3,107,064 915,180 29.5 393,146 790,434Portage 5,774,922 1,810,534 31.4 749,471 1,553,520Price 1,300,860 669,384 51.5 141,889 228,732Racine 28,657,639 12,014,359 41.9 3,435,008 6,430,381Rock 20,382,439 7,323,695 35.9 2,553,725 5,071,296Rusk 2,057,312 551,240 26.8 276,436 595,911St. Croix 2,369,276 956,050 40.4 286,457 542,735Sauk 3,581,617 1,400,950 39.1 433,834 824,044Sawyer 3,071,428 766,752 25.0 413,461 893,076Sheboygan 5,578,628 1,805,753 32.4 710,134 1,476,629Taylor 1,253,401 400,697 32.0 162,303 335,544Trempealeau 2,108,508 767,027 36.4 263,138 519,941Vernon 1,582,930 767,546 48.5 178,416 304,248Washburn 1,727,818 681,255 39.4 210,816 404,409Washington 4,171,711 2,011,722 48.2 470,911 805,012Waupaca 3,287,937 1,215,803 37.0 400,050 806,266Waushara 2,150,441 927,536 43.1 251,651 455,041Winnebago 10,583,824 4,540,575 42.9 1,234,593 2,295,735Wood 7,037,870 2,828,571 40.2 851,293 1,613,887
Subtotal $304,872,508 $133,793,838 43.9% $35,708,600 $64,931,153
TribesBad River Band $ 739,359 $ 501,427 67.8% $ 51,755 $ 80,479Lac du Flambeau Band 1,298,138 686,754 52.9 141,389 227,336Oneida Nation 1,402,988 503,834 35.9 176.189 350.909
Subtotal $ 3,440,485 $ 1,692,015 49.2% $ 369,333 $ 658,724
Private Agencies in Milwaukee County2Employment Solutions $112,425,421 $ 92,079,596 81.9% $ 9,452,143 $ 5,446,841Maximus 58,290,959 52,653,010 90.3 4,405,915 616,017OIC-GM 57,209,283 48,657,479 85.1 4,622,816 1,964,494UMOS 50,922,210 41,272,140 81.0 4,332,206 2,658,932YW Works 40,033,798 32,245,679 80.5 3,415,466 2,186,326
Subtotal $318,881,671 $266,907,904 83.7% $26,228,546 $12,872,610
6-2
174

W-2 ContractorTotal Contract Percentage
Contract Amount Expenditures Spent Total ProfitTotal W-2
Reinvestment
Private Agencies in Other Counties3ForestFwd. Serv. $ 1,143,977 $ 568,798 49.7% $ 128,233 $ 216,699JuneauW. WI PIC 2,275,855 981,293 43.1 268,288 490,401KewauneeFwd. Serv. 919,612 481,239 52.3 100,312 161,726OneidaFwd. Serv. 2,846,511 916,346 32.2 366,831 754,087ShawanoJob Center 2,503,609 1,322,489 52.8 272,769 438,824VilasFwd. Serv. 1,030,492 639,303 62.0 102,134 134,999WalworthKaiser 4,199,447 1,934,654 46.1 482,959 850,488WaukeshaCurtis 9,381,306 4,358,270 46.5 1,075.883 1,886,362
Subtotal $ 24,300,809 $ 11,202,392 46.1% $ 2,797,409 $ 4,933,586
Total $651,495,473 $413,596,149 63.5% $65,103,888 $83,396,073
The Southwest Consortium consists of Grant, Green, Iowa, Lafayette, and Richland counties.
These agencies served six regions in Milwaukee County:
Region IRegion IIRegion IIIRegion IV
Region V
Region VI
YW WorksUnited Migrant Opportunity Services, Inc.Opportunities Industrialization Center of Greater MilwaukeeEmployment Solutions, Inc., a subsidiary of Goodwill Industries of
Southeastern Wisconsin and Metropolitan Chicago, Inc.Employment Solutions, Inc., a subsidiary of Goodwill Industries of
Southeastern Wisconsin and Metropolitan Chicago, Inc.Maximus, Inc.
Eight counties other than Milwaukee were served by these five private agencies under the initialimplementation contracts:
Curtis & Associates, Inc. Waukesha County
Forward Service Corporation Forest CountyKewaunee CountyOneida CountyVilas County
Kaiser Group, Inc. Walworth County
Shawano County Job Center Shawano CountyIncorporated
Western Wisconsin Private Juneau CountyIndustry Council, Inc.
6-3
175
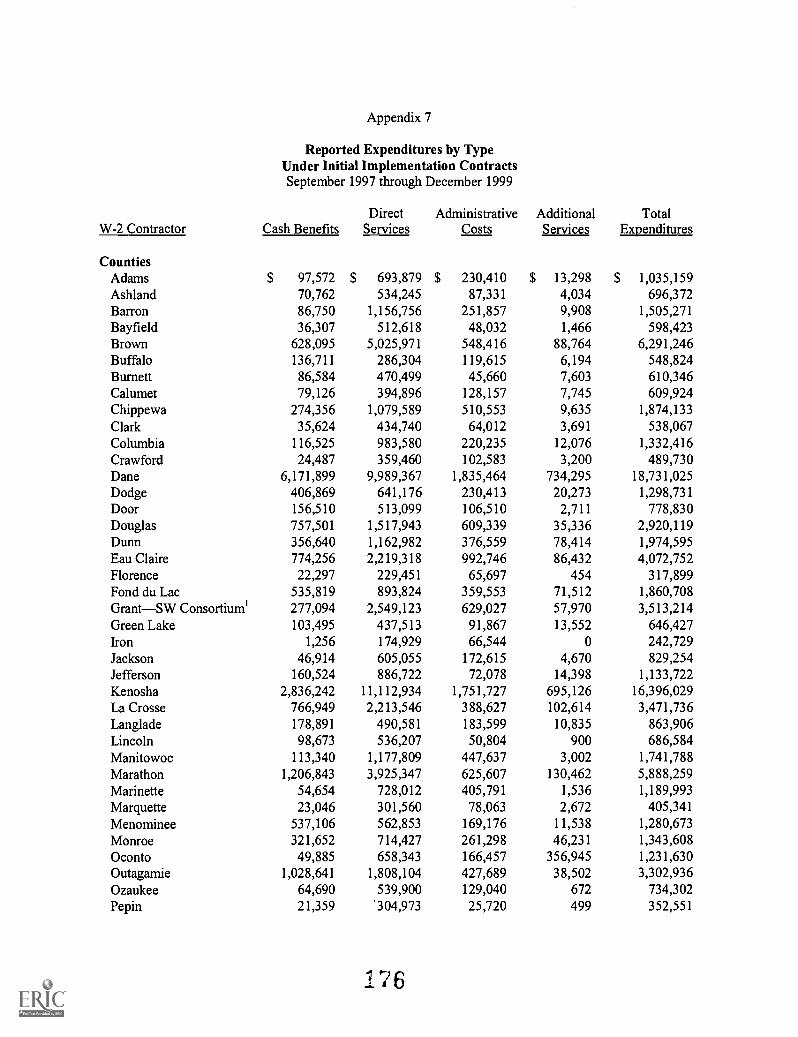
Appendix 7
Reported Expenditures by TypeUnder Initial Implementation ContractsSeptember 1997 through December 1999
W-2 Contractor Cash BenefitsDirect
ServicesAdministrative
CostsAdditionalServices
TotalExpenditures
CountiesAdams $ 97,572 $ 693,879 $ 230,410 $ 13,298 $ 1,035,159Ashland 70,762 534,245 87,331 4,034 696,372Barron 86,750 1,156,756 251,857 9,908 1,505,271Bayfield 36,307 512,618 48,032 1,466 598,423Brown 628,095 5,025,971 548,416 88,764 6,291,246Buffalo 136,711 286,304 119,615 6,194 548,824Burnett 86,584 470,499 45,660 7,603 610,346Calumet 79,126 394,896 128,157 7,745 609,924Chippewa 274,356 1,079,589 510,553 9,635 1,874,133Clark 35,624 434,740 64,012 3,691 538,067Columbia 116,525 983,580 220,235 12,076 1,332,416Crawford 24,487 359,460 102,583 3,200 489,730Dane 6,171,899 9,989,367 1,835,464 734,295 18,731,025Dodge 406,869 641,176 230,413 20,273 1,298,731Door 156,510 513,099 106,510 2,711 778,830Douglas 757,501 1,517,943 609,339 35,336 2,920,119Dunn 356,640 1,162,982 376,559 78,414 1,974,595Eau Claire 774,256 2,219,318 992,746 86,432 4,072,752Florence 22,297 229,451 65,697 454 317,899Fond du Lac 535,819 893,824 359,553 71,512 1,860,708Grant-SW Consortium' 277,094 2,549,123 629,027 57,970 3,513,214Green Lake 103,495 437,513 91,867 13,552 646,427Iron 1,256 174,929 66,544 0 242,729Jackson 46,914 605,055 172,615 4,670 829,254Jefferson 160,524 886,722 72,078 14,398 1,133,722Kenosha 2,836,242 11,112,934 1,751,727 695,126 16,396,029La Crosse 766,949 2,213,546 388,627 102,614 3,471,736Lang lade 178,891 490,581 183,599 10,835 863,906Lincoln 98,673 536,207 50,804 900 686,584Manitowoc 113,340 1,177,809 447,637 3,002 1,741,788Marathon 1,206,843 3,925,347 625,607 130,462 5,888,259Marinette 54,654 728,012 405,791 1,536 1,189,993Marquette 23,046 301,560 78,063 2,672 405,341Menominee 537,106 562,853 169,176 11,538 1,280,673Monroe 321,652 714,427 261,298 46,231 1,343,608Oconto 49,885 658,343 166,457 356,945 1,231,630Outagamie 1,028,641 1,808,104 427,689 38,502 3,302,936Ozaukee 64,690 539,900 129,040 672 734,302Pepin 21,359 304,973 25,720 499 352,551
176

W-2 ContractorDirect
Cash Benefits ServicesAdministrative
CostsAdditional TotalServices Expenditures
Pierce $ 100,388 $ 542,187 $ 146,547 $ 21,996 $ 811,118Polk 59,333 708,800 147,047 45,333 960,513Portage 317,636 1,055,816 437,082 272,997 2,083,531Price 71,235 537,377 60,772 114,234 783,618Racine 2,693,444 7,194,755 2,126,160 197,342 12,211,701Rock 1,264,838 4,941,420 1,117,437 242,022 7,565,717Rusk 29,691 353,862 167,687 6,615 557,855St. Croix 113,373 618,099 224,578 12,671 968,721Sauk 292,765 839,316 268,869 9,623 1,410,573Sawyer 104,839 578,405 83,508 31,001 797,753Sheboygan 308,936 1,362,767 134,050 115,628 1,921,381Taylor 60,727 315,125 24,845 7,192 407,889Trempealeau 136,253 458,410 172,364 3,776 770,803Vernon 115,688 497,706 154,152 6,678 774,224Washburn 52,295 476,575 152,385 7,989 689,244Washington 309,163 1,444,167 258,392 40,762 2,052,484Waupaca 277,411 658,849 279,543 210,578 1,426,381Waushara 29,359 680,593 217,584 24,115 951,651Winnebago 811,197 3,165,698 563,680 37,248 4,577,823Wood 508,098 1,824,484 495,989 44,931 2,873,502
Subtotal $ 26,402,613 $ 87,082,046 $20,309,179 $4,141,896 $137,935,734
TribesBad River Band $ 228,944 $ 243,167 $ 29,316 $ 7,835 $ 509,262Lac du Flambeau Band 252,259 343,597 90,898 9,089 695,843Oneida Nation 183,866 185,056 134,912 117,738 621,572
Subtotal $ 665,069 $ 771,820 $ 255,126 $ 134,662 $ 1,826,677
Private Agencies inMilwaukee County2
Employment Solutions $ 51,080,448 $ 37,233,469 $ 3,765,679 $ 2,694,959 $ 94,774,555Maximus 26,205,571 22,104,452 4,342,987 2,112,388 54,765,398OIC-GM 27,132,164 18,801,730 2,723,585 2,152,973 50,810,452UMOS 18,762,196 20,156,076 2,353,868 1,458,189 42,730,329YW Works 15,393,330 14,226,500 2,625,849 1,126,954 33,372,633
Subtotal $138,573,709 $112,522,227 $15,811,968 $9,545,463 $276,453,367
7-2
177

Direct Administrative Additional TotalW-2 Contractor Cash Benefits Services Costs Services Expenditures
Private Agencies in OtherCounties3
Forest-Fwd. Serv. $ 95,567 $ 401,895 $ 71,336 $ 788 $ 569,586Juneau-W. WI PIC 391,291 510,103 79,899 17,164 998,457Kewaunee-Fwd. Serv. 76,384 337,503 67,352 3,340 484,579Oneida-Fwd. Serv. 211,347 590,155 114,844 7,003 923,349Shawano-Job Center 296,270 889,262 136,957 4,749 1,327,238Vilas-Fwd. Serv. 140,277 428,482 70,544 898 640,201Walworth-Kaiser 403,560 1,196,919 334,175 25,912 1,960,566Waukesha-Curtis 675,987 3,036,996 645,287 204.281 4,562,551
Subtotal $ 2,290,683 $ 7,391,315 $ 1,520,394 $ 264,135 $ 11,466,527
Total $167,932,074 $207,767,408 $37,896,667 $14,086,156 $427,682,305
The Southwest Consortium consists of Grant, Green, Iowa, Lafayette, and Richland counties.
2 These agencies served six regions in Milwaukee County:
Region I YW WorksRegion II United Migrant Opportunity Services, Inc.Region III Opportunities Industrialization Center of Greater MilwaukeeRegion IV Employment Solutions, Inc., a subsidiary of Goodwill Industries of
Southeastern Wisconsin and Metropolitan Chicago, Inc.Region V Employment Solutions, Inc., a subsidiary of Goodwill Industries of
Southeastern Wisconsin and Metropolitan Chicago, Inc.Region VI Maximus, Inc.
3 Eight counties other than Milwaukee were served by these five private agencies under the initialimplementation contracts:
Curtis & Associates, Inc. Waukesha County
Forward Service Corporation
Kaiser Group, Inc.
Shawano County Job CenterIncorporated
Western Wisconsin PrivateIndustry Council, Inc.
Forest CountyKewaunee CountyOneida CountyVilas County
Walworth County
Shawano County
Juneau County
7-3
178
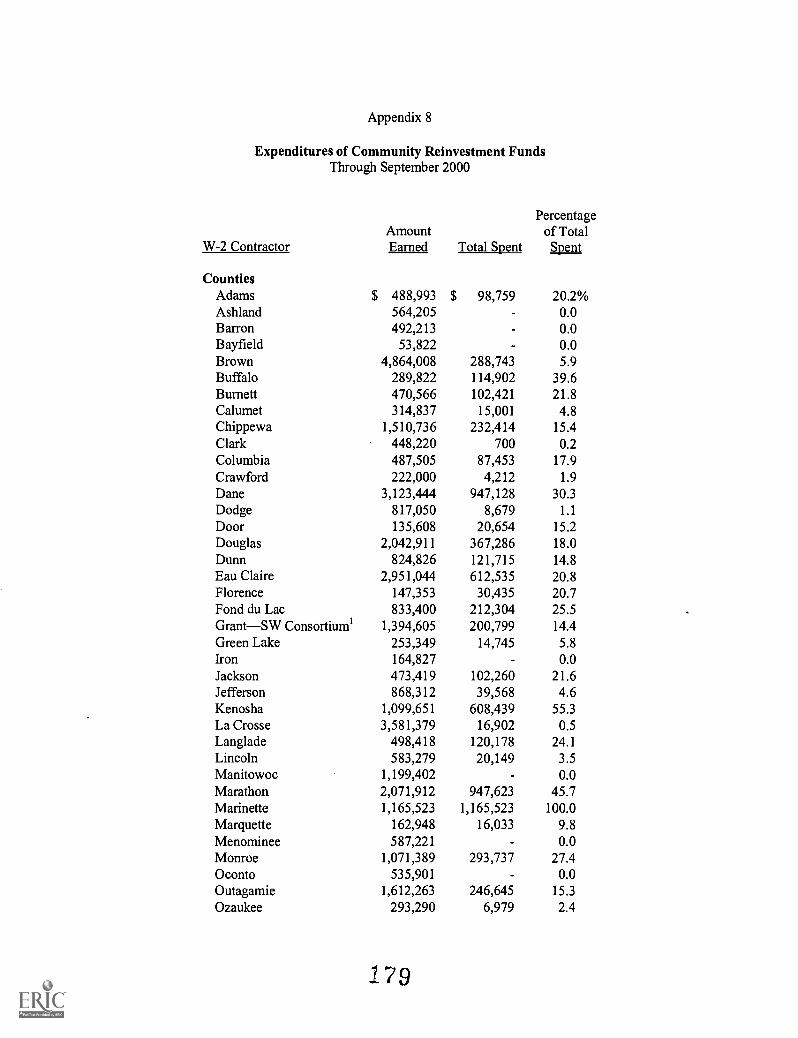
Appendix 8
Expenditures of Community Reinvestment FundsThrough September 2000
AmountPercentage
of TotalW-2 Contractor Earned Total Spent Spent
CountiesAdams $ 488,993 $ 98,759 20.2%Ashland 564,205 0.0Barron 492,213 - 0.0Bayfield 53,822 0.0Brown 4,864,008 288,743 5.9Buffalo 289,822 114,902 39.6Burnett 470,566 102,421 21.8Calumet 314,837 15,001 4.8Chippewa 1,510,736 232,414 15.4Clark 448,220 700 0.2Columbia 487,505 87,453 17.9Crawford 222,000 4,212 1.9Dane 3,123,444 947,128 30.3Dodge 817,050 8,679 1.1Door 135,608 20,654 15.2Douglas 2,042,911 367,286 18.0Dunn 824,826 121,715 14.8Eau Claire 2,951,044 612,535 20.8Florence 147,353 30,435 20.7Fond du Lac 833,400 212,304 25.5Grant-SW Consortium' 1,394,605 200,799 14.4Green Lake 253,349 14,745 5.8Iron 164,827 - 0.0Jackson 473,419 102,260 21.6Jefferson 868,312 39,568 4.6Kenosha 1,099,651 608,439 55.3La Crosse 3,581,379 16,902 0.5Langlade 498,418 120,178 24.1Lincoln 583,279 20,149 3.5Manitowoc 1,199,402 0.0Marathon 2,071,912 947,623 45.7Marinette 1,165,523 1,165,523 100.0Marquette 162,948 16,033 9.8Menominee 587,221 - 0.0Monroe 1,071,389 293,737 27.4Oconto 535,901 0.0Outagamie 1,612,263 246,645 15.3Ozaukee 293,290 6,979 2.4
1 7 9
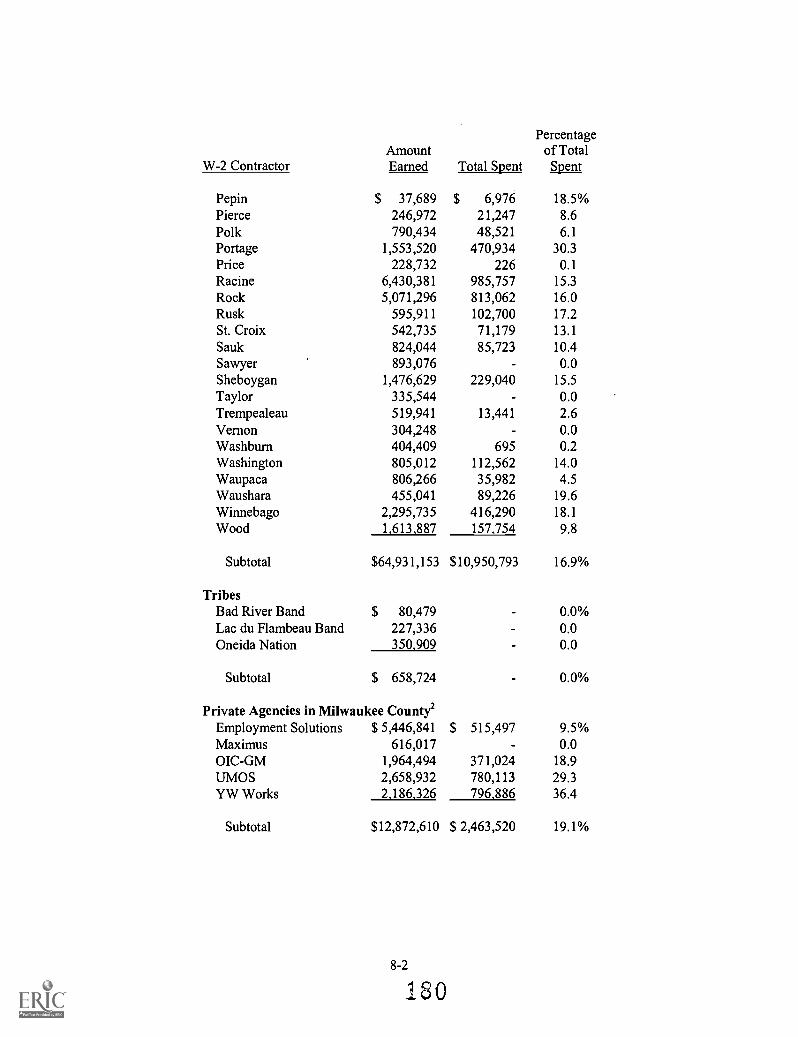
W-2 ContractorAmountEarned Total Spent
Percentageof TotalSpent
Pepin $ 37,689 $ 6,976 18.5%Pierce 246,972 21,247 8.6Polk 790,434 48,521 6.1Portage 1,553,520 470,934 30.3Price 228,732 226 0.1Racine 6,430,381 985,757 15.3Rock 5,071,296 813,062 16.0Rusk 595,911 102,700 17.2St. Croix 542,735 71,179 13.1Sauk 824,044 85,723 10.4Sawyer 893,076 0.0Sheboygan 1,476,629 229,040 15.5Taylor 335,544 0.0Trempealeau 519,941 13,441 2.6Vernon 304,248 0.0Washburn 404,409 695 0.2Washington 805,012 112,562 14.0Waupaca 806,266 35,982 4.5Waushara 455,041 89,226 19.6Winnebago 2,295,735 416,290 18.1Wood 1.613.887 157.754 9.8
Subtotal $64,931,153 $10,950,793 16.9%
TribesBad River Band $ 80,479 0.0%Lac du Flambeau Band 227,336 0.0Oneida Nation 350.909 0.0
Subtotal $ 658,724 0.0%
Private Agencies in Milwaukee County2Employment Solutions $ 5,446,841 $ 515,497 9.5%Maximus 616,017 0.0OIC-GM 1,964,494 371,024 18.9UMOS 2,658,932 780,113 29.3YW Works 2.186.326 796.886 36.4
Subtotal $12,872,610 $ 2,463,520 19.1%
8-2
180

AmountPercentage
of TotalW-2 Contractor Earned Total Spent Spent
Private Agencies in Other Counties3ForestFwd. Serv. $ 216,699 $ 14,750 6.8%JuneauW. WI PIC 490,401 82,074 16.7KewauneeFwd. Serv. 161,726 2,818 1.7OneidaFwd. Serv. 754,087 20,119 2.7ShawanoJob Center 438,824 0.0VilasFwd. Serv. 134,999 16,401 12.1
WalworthKaiser 850,488 303,558 35.7WaukeshaCurtis 1,886,362 346,600 18.4
Subtotal $ 4,933,586 $ 786,320 15.9%
Total $83,396,073 $14,200,633 17.0%
The Southwest Consortium consists of Grant, Green, Iowa, Lafayette, and Richland counties.
These agencies served six regions in Milwaukee County:
Region IRegion IIRegion IIIRegion IV
Region V
Region VI
YW WorksUnited Migrant Opportunity Services, Inc.Opportunities Industrialization Center of Greater MilwaukeeEmployment Solutions, Inc., a subsidiary of Goodwill Industries of
Southeastern Wisconsin and Metropolitan Chicago, Inc.Employment Solutions, Inc., a subsidiary of Goodwill Industries of
Southeastern Wisconsin and Metropolitan Chicago, Inc.Maximus, Inc.
Eight counties other than Milwaukee were served by these five private agencies under the initialimplementation contracts:
Curtis & Associates, Inc.
Forward Service Corporation
Kaiser Group, Inc.
Shawano County Job CenterIncorporated
Western Wisconsin PrivateIndustry Council, Inc.
Waukesha County
Forest CountyKewaunee CountyOneida CountyVilas County
Walworth County
Shawano County
Juneau County
8-3
181
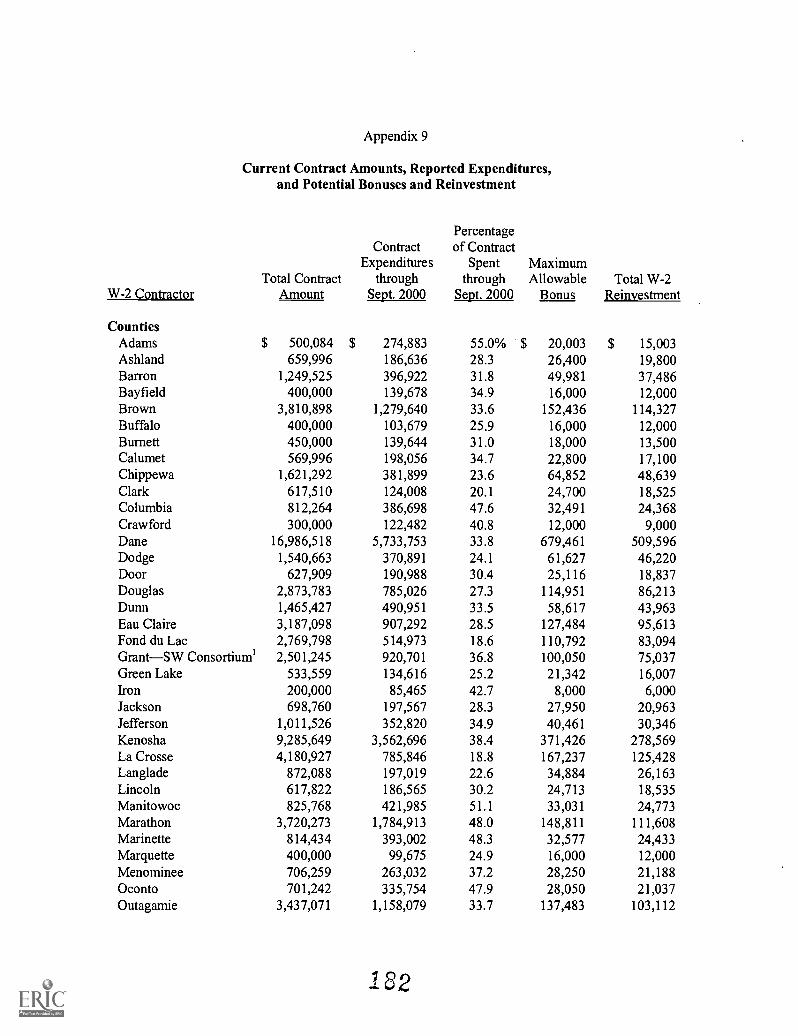
Appendix 9
Current Contract Amounts, Reported Expenditures,and Potential Bonuses and Reinvestment
W-2 ContractorTotal Contract
Amount
ContractExpenditures
throughSept. 2000
Percentageof Contract
Spentthrough
Sept. 2000
MaximumAllowable
BonusTotal W-2
Reinvestment
CountiesAdams $ 500,084 $ 274,883 55.0% $ 20,003 $ 15,003Ashland 659,996 186,636 28.3 26,400 19,800Barron 1,249,525 396,922 31.8 49,981 37,486Bayfield 400,000 139,678 34.9 16,000 12,000Brown 3,810,898 1,279,640 33.6 152,436 114,327Buffalo 400,000 103,679 25.9 16,000 12,000Burnett 450,000 139,644 31.0 18,000 13,500Calumet 569,996 198,056 34.7 22,800 17,100Chippewa 1,621,292 381,899 23.6 64,852 48,639Clark 617,510 124,008 20.1 24,700 18,525Columbia 812,264 386,698 47.6 32,491 24,368Crawford 300,000 122,482 40.8 12,000 9,000Dane 16,986,518 5,733,753 33.8 679,461 509,596Dodge 1,540,663 370,891 24.1 61,627 46,220Door 627,909 190,988 30.4 25,116 18,837Douglas 2,873,783 785,026 27.3 114,951 86,213Dunn 1,465,427 490,951 33.5 58,617 43,963Eau Claire 3,187,098 907,292 28.5 127,484 95,613Fond du Lac 2,769,798 514,973 18.6 110,792 83,094Grant-SW Consortium' 2,501,245 920,701 36.8 100,050 75,037Green Lake 533,559 134,616 25.2 21,342 16,007Iron 200,000 85,465 42.7 8,000 6,000Jackson 698,760 197,567 28.3 27,950 20,963Jefferson 1,011,526 352,820 34.9 40,461 30,346Kenosha 9,285,649 3,562,696 38.4 371,426 278,569La Crosse 4,180,927 785,846 18.8 167,237 125,428Lang lade 872,088 197,019 22.6 34,884 26,163Lincoln 617,822 186,565 30.2 24,713 18,535Manitowoc 825,768 421,985 51.1 33,031 24,773Marathon 3,720,273 1,784,913 48.0 148,811 111,608Marinette 814,434 393,002 48.3 32,577 24,433Marquette 400,000 99,675 24.9 16,000 12,000Menominee 706,259 263,032 37.2 28,250 21,188Oconto 701,242 335,754 47.9 28,050 21,037Outagamie 3,437,071 1,158,079 33.7 137,483 103,112
182

W-2 ContractorTotal Contract
Amount
ContractExpenditures
throughSept. 2000
Percentageof Contract
Spentthrough
Sept. 2000
MaximumAllowable
BonusTotal W-2
Reinvestment
Ozaukee $ 723,881 $ 208,255 28.8% $ 28,955 $ 21,716Pepin 250,000 66,944 26.8 10,000 7,500Pierce 641,554 214,461 33.4 25,662 19,247Polk 786,213 234,774 29.9 31,449 23,586Portage 1,295,757 382,949 29.6 51,830 38,873Price 682,015 173,174 25.4 27,281 20,460Racine 7,270,142 2,571,841 35.4 290,806 218,104Rock 4,696,860 2,131,320 45.4 187,874 140,906Rusk 400,000 76,134 19.0 16,000 12,000St. Croix 736,139 317,430 43.1 29,446 22,084Sauk 1,088,434 479,239 44.0 43,537 32,653Sawyer 760,784 200,680 26.4 30,431 22,824Sheboygan 736,139 432,073 27.8 62,183 46,637Taylor 450,000 123,096 27.4 18,000 13,500Trempealeau 745,057 170,878 22.9 29,802 22,353Vernon 537,192 145,249 27.0 21,488 16,116Washburn 500,086 174,347 34.9 20,004 15,002Washington 1,445,148 515,582 35.7 57,806 43,354Waupaca 1,114,279 335,644 30.1 44,571 33,428Waushara 713,956 304,105 42.6 28,558 21,419Winnebago 3,717,106 1,086,832 29.2 148,684 111,513Wood 2,418,077 826,567 34.2 96,723 72,542
Subtotal $103,876,637 $ 34,779,408 33.5% $ 4,155,066 $ 3,116,300
TribesBad River Band $ 350,000 $ 143,272 40.9% $ 14,000 $ 10,500Oneida Nation 530,286 187 953 35.4 21,211 15,909
Subtotal $ 880,286 $ 331,225 37.6% $ 35,211 $ 26,409
Private Agencies in Milwaukee County2Employment Solutions $ 87,467,255 $ 27,032,607 30.9% $ 3,498,690 $ 2,624,017Maximus 45,083,756 14,068,845 31.2 1,803,350 1,352,513OIC-GM 47,140,124 14,737,449 31.3 1,885,605 1,414,204UMOS 37,027,252 14,187,698 38.3 1,481,090 1,110,818YW Works 36,451.896 12,017,928 33.0 1,458,076 1,093,557
Subtotal $253,170,283 $ 82,044,527 32.4% $10,126,811 $ 7,595,109
9-2
183
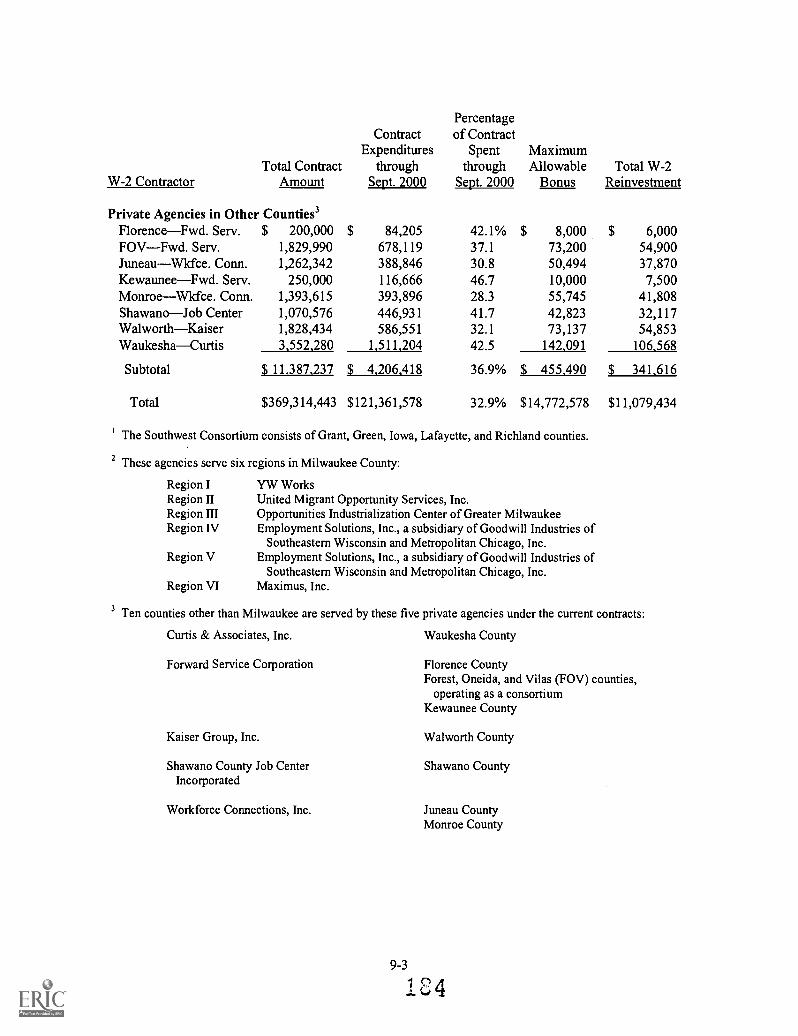
W-2 ContractorTotal Contract
Amount
ContractExpenditures
throughSept. 2000
Percentageof Contract
Spentthrough
Sept. 2000
MaximumAllowable
BonusTotal W-2
Reinvestment
Private Agencies in Other Counties3FlorenceFwd. Serv. $ 200,000 $ 84,205 42.1% $ 8,000 $ 6,000FOVFwd. Serv. 1,829,990 678,119 37.1 73,200 54,900JuneauWkfce. Conn. 1,262,342 388,846 30.8 50,494 37,870KewauneeFwd. Serv. 250,000 116,666 46.7 10,000 7,500Monroe Wkfce. Conn. 1,393,615 393,896 28.3 55,745 41,808ShawanoJob Center 1,070,576 446,931 41.7 42,823 32,117WalworthKaiser 1,828,434 586,551 32.1 73,137 54,853WaukeshaCurtis 3,552,280 1,511,204 42.5 142,091 106,568
Subtotal $ 11,387,237 $ 4,206,418 36.9% $ 455.490 $ 341,616
Total $369,314,443 $121,361,578 32.9% $14,772,578 $11,079,434
The Southwest Consortium consists of Grant, Green, Iowa, Lafayette, and Richland counties.
2 These agencies serve six regions in Milwaukee County:
Region I YW WorksRegion II United Migrant Opportunity Services, Inc.Region III Opportunities Industrialization Center of Greater MilwaukeeRegion IV Employment Solutions, Inc., a subsidiary of Goodwill Industries of
Southeastern Wisconsin and Metropolitan Chicago, Inc.Region V Employment Solutions, Inc., a subsidiary of Goodwill Industries of
Southeastern Wisconsin and Metropolitan Chicago, Inc.Region VI Maximus, Inc.
3 Ten counties other than Milwaukee are served by these five private agencies under the current contracts:
Curtis & Associates, Inc. Waukesha County
Forward Service Corporation Florence CountyForest, Oneida, and Vilas (FOV) counties,
operating as a consortiumKewaunee County
Kaiser Group, Inc. Walworth County
Shawano County Job Center Shawano CountyIncorporated
Workforce Connections, Inc. Juneau CountyMonroe County
9-3
4

Appendix 10
Reported Expenditures by TypeUnder Current Implementation Contracts
January 2000 through September 2000
W-2 Contractor Cash BenefitsDirect
ServicesAdministrative Additional
Costs ServicesTotal
Expenditures
CountiesAdams $ 25,111 $ 188,564 $ 61,208 $ 507 $ 275,390Ashland 13,725 160,073 12,838 5,678 192,314Barron 18,996 292,520 85,406 10,938 407,860Bayfield 19,679 113,963 6,036 600 140,278Brown 72,301 1,069,645 137,694 33,119 1,312,759Buffalo 8,839 68,192 26,648 2,037 105,716Burnett 18,622 76,067 44,955 2,202 141,846Calumet 33,269 115,935 48,852 1,824 199,880Chippewa 59,902 234,361 87,636 1,750 383,649Clark 13,124 94,255 16,629 6,228 130,236Columbia 37,757 295,079 53,862 11,161 397,859Crawford 4,923 99,020 18,539 122,482Dane 1,480,265 3,563,202 690,286 840,375 6,574,128Dodge 87,405 229,804 53,682 18,929 389,820Door 23,428 128,126 39,434 700 191,688Douglas 131,179 474,675 179,172 16,296 801,322Dunn 109,784 311,758 69,409 40,010 530,961Eau Claire 79,799 608,236 219,257 59,498 966,790Fond du Lac 182,714 270,928 61,331 34,410 549,383Grant-SW Consortium' 61,242 722,550 136,909 18,248 938,949Green Lake 7,001 103,120 24,495 3,775 138,391Iron 5,804 61,745 17,916 85,465Jackson 8,123 146,004 43,440 2,102 199,669Jefferson 26,424 303,202 23,194 3,913 356,733Kenosha 1,101,850 2,042,132 418,714 217,994 3,780,690La Crosse 107,577 553,573 124,696 33,939 819,785Lang lade 50,247 118,888 27,884 2,300 199,319Lincoln 17,626 155,501 13,438 3,225 189,790Manitowoc 7,682 336,403 77,900 14,270 436,255Marathon 208,270 1,344,569 232,074 66,996 1,851,909Marinette 11,220 238,966 142,816 393,002Marquette 3,385 74,592 21,698 5,250 104,925Menominee 67,397 125,420 70,215 1,269 264,301Oconto 19,451 280,714 35,589 2,277 338,031Outagamie 205,257 730,283 222,539 23,089 1,181,168Ozaukee 8,306 150,209 49,740 500 208,755Pepin 21 59,692 7,231 66,944Pierce 18,770 166,376 29,315 5,989 220,450
5

W-2 Contractor Cash BenefitsDirect
ServicesAdministrative Additional
Costs ServicesTotal
Expenditures
Polk $ 20,003 $ 181,213 $ 33,558 $ 21,959 $ 256,733Portage 23,951 260,937 98,061 115,220 498,169Price 23,775 140,503 8,896 62,175 235,349Racine 515,452 1,762,630 293,759 259,791 2,831,632Rock 414,024 1,496,031 221,265 113,673 2,244,993Rusk 6,525 50,872 18,737 2,203 78,337St. Croix 51,746 136,192 129,492 13,000 330,430Sauk 74,836 278,395 126,008 4,972 484,211Sawyer 15,275 177,787 7,618 10,578 211,258Sheboygan 101,452 287,340 43,281 69,192 501,265Taylor 10,687 92,664 19,745 3,442 126,538Trempealeau 14,872 112,024 43,982 2,240 173,118Vernon 28,806 87,983 28,460 3,063 148,312Washburn 22,634 110,087 41,626 6,877 181,224Washington 75,367 351,728 88,487 27,830 543,412Waupaca 105,465 178,919 51,260 77,267 412,911Waushara 2,713 222,960 78,432 23,945 328,050Winnebago 258,620 630,728 197,484 32,371 1,119,203Wood 151,233 549.971 125.363 27.037 853.604
Subtotal $ 6,273,911 $23,217,306 $ 5,288,191 $2,368,233 $37,147,641
TribesBad River Band $ 30,880 $ 94,101 $ 18,291 $ 2,759 $ 146,031Oneida Nation 65,633 60,816 61,504 - 187,953
Subtotal $ 96,513 $ 154,917 $ 79,795 $ 2,759 $ 333,984
Private Agencies in Milwaukee County2Employment Solutions $10,151,604 $15,452,156 $1,428,847 $ 489,731 $27,522,338Maximus 5,954,649 7,196,745 917,451 406,908 14,475,753OIC-GM 5,517,794 8,174,106 1,045,549 1,125,217 15,862,666UMOS 4,526,200 8,250,457 1,411,041 497,739 14,685,437YW Works 3.815.679 6.943.152 1,259.097 139.358 12.157,286
Subtotal $29,965,926 $46,016,616 $6,061,985 $2,658,953 $84,703,480

Direct Administrative Additional TotalW-2 Contractor Cash Benefits Services Costs Services Expenditures
Private Agencies in Other Counties3Florence-Fwd. Serv. $ 8,949 $ 66,621 $ 8,635 $ $ 84,205FOV-Fwd. Serv. 51,125 528,730 98,264 16,921 695,040Juneau- Wkfce. Conn. 101,062 248,474 39,310 3,484 392,330Kewaunee-Fwd. Serv. 15,663 87,936 13,067 450 117,116Monroe- Wkfce. Conn. 91,439 267,525 34,932 13,897 407,793Shawano-Job Center 90,783 295,669 60,479 3,826 450,757Walworth-Kaiser 133,776 355,253 97,522 6,781 593,332Waukesha-Curtis 201,078 1,110,915 199,211 79.012 1,590,216
Subtotal $ 693,875 $ 2,961,123 $ 551,420 $ 124,371 $ 4,330,789
Total $37,030,225 $72,349,962 $11,981,391 $5,154,316 $126,515,894
2
3
The Southwest Consortium consists of Grant, Green, Iowa, Lafayette, and Richland counties.
These agencies serve six regions in Milwaukee County:
Region I YW WorksRegion II United Migrant Opportunity Services, Inc.Region III Opportunities Industrialization Center of Greater MilwaukeeRegion IV Employment Solutions, Inc., a subsidiary of Goodwill Industries of
Southeastern Wisconsin and Metropolitan Chicago, Inc.Region V Employment Solutions, Inc., a subsidiary of Goodwill Industries of
Southeastern Wisconsin and Metropolitan Chicago, Inc.Region VI Maximus, Inc.
Ten counties other than Milwaukee are served by these five private agencies under the current contracts:
Curtis & Associates, Inc.
Forward Service Corporation
Kaiser Group, Inc.
Shawano County Job CenterIncorporated
Workforce Connections, Inc.
Waukesha County
Florence CountyForest, Oneida, and Vilas (FOV) counties,
operating as a consortiumKewaunee County
Walworth County
Shawano County
Juneau CountyMonroe County
10-3
1 87

Cri
teri
a
Ent
ered
Em
ploy
men
t
Ave
rage
Wag
e R
ate
Job
Ret
entio
n30
day
s
180
days
Full
and
App
ropr
iate
Eng
agem
ent
8
App
endi
x 11
Perf
orm
ance
Bon
us C
rite
ria
Bas
e Pe
rfor
man
ce L
evel
35%
or
mor
e of
all
part
icip
ants
serv
ed h
ave
been
pla
ced
in a
job.
Equ
al to
or
grea
ter
than
the
base
wag
e ra
te a
ttain
ed b
y al
lpa
rtic
ipan
ts d
urin
g 19
98.
At l
east
75%
of
all p
artic
ipan
tsre
mai
n em
ploy
ed a
fter
30
days
.
50%
or
mor
e of
all
part
icip
ants
rem
ain
empl
oyed
aft
er 1
80 d
ays.
At l
east
80%
of
adul
t W-2
and
FSE
T p
artic
ipan
ts in
sub
sidi
zed
empl
oym
ent a
re e
ngag
ed in
appr
opri
ate
activ
ities
for
the
requ
ired
num
ber
of h
ours
eac
hw
eek.
Firs
t Bon
us L
evel
40%
or
mor
e of
all
part
icip
ants
ser
ved
have
been
pla
ced
in a
job.
Equ
als
the
base
wag
e ra
tepl
us 2
.5 p
erce
nt o
f th
e ba
se.
At l
east
80%
of
part
icip
ants
rem
ain
empl
oyed
aft
er30
day
s.
At l
east
55%
of
part
icip
ants
rem
ain
empl
oyed
aft
er18
0 da
ys.
At l
east
85%
of
adul
t W-2
and
FSE
T p
artic
ipan
ts in
subs
idiz
ed e
mpl
oym
ent a
reen
gage
d in
app
ropr
iate
activ
ities
for
the
requ
ired
num
ber
of h
ours
eac
h w
eek.
Seco
nd B
onus
Lev
el
45%
or
mor
e of
all
part
icip
ants
ser
ved
have
been
pla
ced
in a
job.
Equ
als
the
base
wag
e ra
tepl
us 5
.0 p
erce
nt o
f th
e ba
se.
At l
east
85%
of
part
icip
ants
rem
ain
empl
oyed
aft
er30
day
s.
At l
east
60%
of
part
icip
ants
rem
ain
empl
oyed
aft
er18
0 da
ys.
At l
east
90%
of
adul
t W-2
and
FSE
T p
artic
ipan
ts in
subs
idiz
ed e
mpl
oym
ent a
reen
gage
d in
app
ropr
iate
activ
ities
for
the
requ
ired
num
ber
of h
ours
eac
h w
eek.
129

Cri
teri
aB
ase
Perf
orm
ance
Lev
el
Bas
ic E
duca
tiona
l Act
iviti
es
Em
ploy
er H
ealth
Ins
uran
ce B
enef
its
Opt
iona
lFai
th-B
ased
Con
trac
ts
Opt
iona
lAtta
inm
ent o
f B
asic
Skill
s/Jo
b Sk
ills
190
At l
east
80%
of
all F
SET
part
icip
ants
and
adu
lts in
W-2
subs
idiz
ed e
mpl
oym
ent p
ositi
ons
who
are
not
in h
igh
scho
ol a
reas
sign
ed to
app
ropr
iate
educ
atio
nal a
ctiv
ities
.
Em
ploy
er h
ealth
insu
ranc
e is
avai
labl
e to
at l
east
30%
of
all
part
icip
ants
who
are
em
ploy
ed.
Stan
dard
may
onl
y be
use
d to
repl
ace
a m
anda
tory
sta
ndar
d no
tac
hiev
ed f
or th
e se
cond
bon
usle
vel.
Stan
dard
may
onl
y be
use
d to
repl
ace
a m
anda
tory
sta
ndar
d no
tac
hiev
ed f
or th
e se
cond
bon
usle
vel.
11-2
Firs
t Bon
us L
evel
At l
east
85%
of
all F
SET
part
icip
ants
and
adu
lts in
W-2
sub
sidi
zed
empl
oym
ent
posi
tions
are
eng
aged
inap
prop
riat
e ac
tiviti
es f
or th
ere
quir
ed n
umbe
r of
hou
rs.
Em
ploy
er h
ealth
insu
ranc
e is
avai
labl
e to
at l
east
35%
of
all p
artic
ipan
ts w
ho a
reem
ploy
ed.
Stan
dard
may
onl
y be
use
dto
rep
lace
a m
anda
tory
stan
dard
not
ach
ieve
d fo
r th
ese
cond
bon
us le
vel.
Stan
dard
may
onl
y be
use
dto
rep
lace
a m
anda
tory
stan
dard
not
ach
ieve
d fo
r th
ese
cond
bon
us le
vel.
Seco
nd B
onus
Lev
el
At l
east
90%
of
all F
SET
part
icip
ants
and
adu
lts in
W-2
sub
sidi
zed
empl
oym
ent
posi
tions
are
eng
aged
inap
prop
riat
e ac
tiviti
es f
or th
ere
quir
ed n
umbe
r of
hou
rs.
Em
ploy
er h
ealth
insu
ranc
eis
ava
ilabl
e to
at l
east
40%
of a
ll pa
rtic
ipan
ts w
ho a
reem
ploy
ed.
Val
id c
ontr
act b
etw
een
the
W-2
age
ncy
and
a fa
ith-
base
d pr
ovid
er d
urin
g 7
ofth
e 8
quar
ters
of
the
cont
ract
peri
od, t
o pr
ovid
e di
rect
serv
ices
to W
-2 p
artic
ipan
ts.
At l
east
50%
of
the
part
icip
ants
ass
igne
d to
basi
c sk
ills
or jo
b sk
ills
trai
ning
com
plet
e th
ere
quir
ed tr
aini
ngsu
cces
sful
ly.
191

App
endi
x 12
Perf
orm
ance
Bon
uses
Ear
ned
and
Stan
dard
s M
etU
nder
Cur
rent
Im
plem
enta
tion
Con
trac
tsFr
om J
anua
ry 2
000
thro
ugh
Dec
embe
r 20
00
Max
imum
Perc
enta
geA
llow
able
of P
ossi
ble
Bon
us a
ndPo
tent
ial
Bon
usW
-2 C
ontr
acto
rR
einv
estm
ent
Bon
usE
arne
d
Cou
ntie
s
Ada
ms
$35
,006
$28
,339
81.0
%
Ash
land
46,2
0039
,600
85.7
Bar
ron
87,4
6774
,973
85.7
Bay
fiel
d28
,000
17,3
3361
.9
Bro
wn
266,
763
254,
060
95.2
Buf
falo
28,0
0028
,000
100.
0
Bur
nett
31,5
0016
,500
52.4
Cal
umet
39,9
0036
,100
90.5
Chi
ppew
a10
2,68
397
,279
90.5
Cla
rk43
,225
41,1
6795
.2
Col
umbi
a56
,859
55,5
0497
.6
192
Stan
dard
s M
et th
roug
h D
ecem
ber
2000
*
a, ° EE 44 -o a.)
i...
6) = w
Y f, ; a) to ao " s) <>
3 0 ..= = a) i=14
)
'-,.
>'., 3 c.,
00 g a.)
PI .o --
. .c o. a. a. E
< 2
-no
"=
4.)
atta
i)ad
^".
Oa o
w w
. a.)
.... .- o < i i = o ..= 0 c) -c,
t.LI
c.) . cn 4
..o it tu 41
)..
ajIl
l0
>, = o as 1.
..C
I. E w =
leve
l 1le
vel 2
leve
l 2le
vel 2
leve
l 2ba
sele
vel 1
base
leve
l 2le
vel 2
leve
l 2le
vel 1
leve
l 2le
vel 2
leve
l 1le
vel 2
leve
l 2le
vel 2
leve
l 2ba
sele
vel 2
leve
l 2le
vel 2
leve
l 2le
vel 2
leve
l 1no
neno
ne
leve
l 2le
vel 2
base
leve
l 2le
vel 2
leve
l 2le
vel 2
leve
l 2le
vel 2
leve
l 2le
vel 2
leve
l 2le
vel 2
leve
l 2
base
leve
l 2ba
seba
seba
seba
seba
se
leve
l 2le
vel 2
leve
l 2le
vel 2
base
leve
l 2le
vel 2
leve
l 2le
vel 2
leve
l 2le
vel 2
leve
l 2ba
sele
vel 2
leve
l 2le
vel 2
leve
l 2le
vel 2
leve
l 2le
vel 1
leve
l 2
leve
l 2le
vel 2
leve
l 1le
vel 2
leve
l 2le
vel 2
leve
l 2
* N
one:
The
age
ncy
did
not m
eet t
he p
erfo
rman
ce s
tand
ard
on a
ny le
vel.
Bas
e: T
he a
genc
y m
et th
e ba
se p
erfo
rman
ce s
tand
ard
for
the
rest
rict
ed-u
se b
onus
.L
evel
I: T
he a
genc
y m
et th
e fi
rst p
erfo
rman
ce s
tand
ard
for
the
unre
stri
cted
-use
bon
us.
Lev
el 2
: The
age
ncy
met
the
seco
nd p
erfo
rman
ce s
tand
ard
for
the
unre
stri
cted
-use
bon
us.
193

Max
imum
Perc
enta
geA
llow
able
of P
ossi
ble
Bon
us a
ndPo
tent
ial
Bon
usW
-2 C
ontr
acto
rR
einv
estm
ent
Bon
usE
arne
d
Cra
wfo
rd$
21,0
00$
16,5
0078
.6%
Dan
e1,
189,
057
1,13
2,43
495
.2
Dod
ge10
7,84
710
7,84
710
0.0
Doo
r43
,953
43,9
5310
0.0
Dou
glas
201,
164
182,
006
90.5
Dun
n10
2,58
087
,927
85.7
Eau
Cla
ire
223,
097
191,
226
85.7
Fond
du
Lac
193,
886
189,
270
97.6
Gra
ntSW
Con
sort
ium
'17
5,08
716
6,75
095
.2G
reen
Lak
e37
,349
31,1
2483
.3
Iron
14,0
0013
,334
95.2
Jack
son
48,9
1346
,584
95.2
Jeff
erso
n70
,807
67,4
3695
.2
Ken
osha
649,
995
541,
662
83.3
La
Cro
sse
292,
665
292,
665
100.
0
194
Stan
dard
s M
et th
roug
h D
ecem
ber
2000
*
a. a)
.., 0 fm.
11-1 "0 a) i... ai a' r.
.14
....0 0 00 C
O ; a.)
AO
ca 1...
cu > -,t
ed A c> =I
. .a. a)
1;14
) 0 '..
CO al A c> oo 1 0 .a.
a.)
PO4) o ..
0 co
. 0 s. r:14 ia..a
'< -
$-.
0 (1
)co
m co to-a
' 44.
4 41
. a) ....._ > ...., t..1 < 0 ... VI
ca 4 -0 1.1.
1
c.) _ ui C
O al
74 2 1:
44i-
. a) 0
>. o 0 o 1.
..cl
. 0 v)
w 4
leve
l 2le
vel 1
leve
l 2le
vel 2
leve
l 2no
nele
vel 2
leve
l 2le
vel 2
leve
l 2ba
sele
vel 2
leve
l 2le
vel 2
leve
l 2le
vel 2
leve
l 2le
vel 2
leve
l 2le
vel 2
leve
l 2
leve
l 2le
vel 2
leve
l 2le
vel 2
leve
l 2le
vel 2
leve
l 2
leve
l 1le
vel 2
leve
l 2le
vel 2
leve
l 2le
vel 1
leve
l 2
leve
l 2le
vel 2
base
leve
l 2le
vel 2
base
leve
l 2
leve
l 2le
vel 2
leve
l 1le
vel 1
leve
l 2ba
sele
vel 2
leve
l 2le
vel 2
leve
l 2le
vel 1
leve
l 2le
vel 2
leve
l 2
leve
l 1le
vel 2
leve
l 2le
vel 2
leve
l 2le
vel 2
leve
l 2le
vel 2
leve
l 2le
vel 1
base
base
leve
l 2le
vel 2
leve
l 2le
vel 2
leve
l 2le
vel 2
leve
l 2le
vel 2
leve
l 1
leve
l 2le
vel 2
leve
l 2le
vel 2
leve
l 2le
vel 1
leve
l 2
leve
l 2le
vel 2
leve
l 2le
vel 2
leve
l 2le
vel 1
leve
l 2
base
leve
l 2le
vel 1
leve
l 2le
vel 2
leve
l 2le
vel 1
leve
l 2le
vel 2
leve
l 2le
vel 2
leve
l 2le
vel 2
leve
l 2
12-2
*Non
e: T
he a
genc
y di
d no
t mee
t the
per
form
ance
sta
ndar
d on
any
leve
l.B
ase:
The
age
ncy
met
the
base
per
form
ance
sta
ndar
d fo
r th
e re
stri
cted
-use
bon
us.
Lev
el 1
: The
age
ncy
met
the
firs
t per
form
ance
sta
ndar
d fo
r th
e un
rest
rict
ed-u
se b
onus
.L
evel
2: T
he a
genc
y m
et th
e se
cond
per
form
ance
sta
ndar
d fo
r th
e un
rest
rict
ed-u
se b
onus
.
195

W-2
Con
trac
tor
Max
imum
Allo
wab
leB
onus
and
Rei
nves
tmen
tPo
tent
ial
Bon
us
Perc
enta
geof
Pos
sibl
eB
onus
Ear
ned
Lan
glad
e$
61,0
47$
40,6
9866
.7%
Lin
coln
43,2
4841
,188
95.2
Man
itow
oc57
,804
53,6
7492
.9
Mar
atho
n26
0,41
924
8,01
795
.2
Mar
inet
te57
,010
57,0
1010
0.0
Mar
quet
te28
,000
25,3
3290
.5
Men
omin
ee49
,438
21,1
8842
.9
Oco
nto
49,0
8746
,750
95.2
Out
agam
ie24
0,59
519
4,76
781
.0
Oza
ukee
50,6
7139
,814
78.6
Pepi
n17
,500
14,9
9985
.7
Pier
ce44
,909
43,8
4197
.6
Polk
55,0
3545
,862
83.3
Port
age
90,7
0377
,746
85.7
Pric
e47
,741
40,9
2085
.7
Rac
ine
508,
910
496,
793
97.6
196
Stan
dard
s M
et th
roug
h D
ecem
ber
2000
*
a' a.)
N., 0 o. E
..o0.
) 'a W
a) r:4 0 00 co CO ,... 0, > <
cd A o I = o o 0
c14) o
,..-,
`>!,
CO o 0. _ 1 o * 5 0 r:4 o ,--,
.....y s:1 0 ,.., a, ..
..o.
, =<
0"
.1:3
E
coba co
- 00
-5 =
li, w
0, 0 :- . ,.., < 7i = 0 .- Vo c.) o -cs
c.) ... RI
.= t
t4 al L 0 0 o;,,
,.E
v)
w =
base
leve
l 2le
vel 1
leve
l Iba
seba
sele
vel 2
leve
l 2le
vel 2
leve
l 2le
vel 2
leve
l 2le
vel 1
leve
l 2
leve
l 2le
vel 2
leve
l 1le
vel 2
leve
l 2le
vel 2
leve
l 1
leve
l 2le
vel 2
leve
l 2le
vel 2
leve
l 2le
vel 1
leve
l 2
leve
l 2le
vel 2
leve
l 2le
vel 2
leve
l 2le
vel 2
leve
l 2
leve
l 2le
vel 2
leve
l 2le
vel 2
leve
l 2ba
sele
vel 2
base
leve
l 2le
vel 2
base
none
none
base
leve
l 2le
vel 2
base
leve
l 2le
vel 2
leve
l 2le
vel 2
leve
l 2le
vel 2
leve
l 1le
vel 1
leve
l 1ba
sele
vel 2
leve
l 1le
vel 2
base
leve
l Iba
sele
vel 2
leve
l 2
leve
l 1le
vel 1
base
leve
l 2le
vel 2
leve
l 2le
vel 2
leve
l 2le
vel 2
leve
l 1le
vel 2
leve
l 2le
vel 2
leve
l 2
leve
l 2le
vel 2
leve
l 1le
vel 2
leve
l 1ba
sele
vel 2
leve
l 2le
vel 2
leve
l 1le
vel 1
leve
l 2le
vel 2
base
leve
l 2le
vel 2
base
leve
l 2le
vel 1
leve
l 1le
vel 2
leve
l 2le
vel 2
leve
l 1le
vel 2
leve
l 2le
vel 2
leve
l 2
12-3
*Non
e: T
he a
genc
y di
d no
t mee
t the
per
form
ance
sta
ndar
d on
any
leve
l.B
ase:
The
age
ncy
met
the
base
per
form
ance
sta
ndar
d fo
r th
e re
stri
cted
-use
bon
us.
Lev
el I
: The
age
ncy
met
the
firs
t per
form
ance
sta
ndar
d fo
r th
e un
rest
rict
ed-u
se b
onus
.L
evel
2: T
he a
genc
y m
et th
e se
cond
per
form
ance
sta
ndar
d fo
r th
e un
rest
rict
ed-u
se b
onus
.
197

Max
imum
Allo
wab
leB
onus
and
Pote
ntia
l
Perc
enta
geof
Pos
sibl
eB
onus
W-2
Con
trac
tor
Rei
nves
tmen
tB
onus
Ear
ned
Roc
k$
328,
780
$24
2,67
173
.8%
Rus
k28
,000
28,0
0010
0.0
St. C
roix
51,5
3044
,169
85.7
Sauk
76,1
9076
,190
100.
0
Saw
yer
53,2
5543
,112
81.0
Sheb
oyga
n10
8,82
010
6,22
897
.6
Tay
lor
31,5
0031
,500
100.
0
Tre
mpe
alea
u52
,155
49,6
7195
.2
Ver
non
37,6
0429
,546
78.6
Was
hbur
n35
,006
31,6
7390
.5
Was
hing
ton
101,
160
98,7
5197
.6
Wau
paca
77,9
9955
,714
71.4
Wau
shar
a49
,977
47,5
9795
.2
Win
neba
go26
0,19
719
2,05
073
.8
Woo
d16
9,26
514
5.08
585
.7
Subt
otal
$ 7,
271,
366
$ 6,
515,
533
89.6
%
198
Stan
dard
s M
et th
roug
h D
ecem
ber
2000
*
.4 a.) o 0. E 0 8... a) = u4
0 41 a) tAa 5 a) ea C
O . a) > <
cn, 3 c> cn 1 o a)
f=3.
2
...o 0 ,-,
cn, 8 . oo
I o° .- a.)
4) -0 0 .-,
a" 'Z 0 .. 0..4
-u1,
-.)
= ta
bca
cat
--.
bp =w
wi
. N .. -,-. . ..-> 115 < 74 = 0 Vs
-10
41 o u) CO
a0
..ctt-
1
73 0
(j (
1)cu
c)>
. oP.
5E
°) =
leve
l 1le
vel 2
leve
l 1ba
sele
vel 2
base
leve
l 1
leve
l 2le
vel 2
leve
l 2le
vel 2
leve
l 2le
vel 2
leve
l 2
leve
l 2le
vel 2
leve
l 1le
vel 1
leve
l 2ba
sele
vel 2
leve
l 2le
vel 2
leve
l 2le
vel 2
leve
l 2le
vel 2
leve
l 2
leve
l 2le
vel 2
leve
l 2le
vel 2
base
leve
l 2ba
se
leve
l 2le
vel 2
leve
l 1le
vel 2
leve
l 2le
vel 2
leve
l 2
leve
l 2le
vel 2
leve
l 2le
vel 2
leve
l 2le
vel 2
leve
l 2
leve
l 2le
vel 2
base
leve
l 2le
vel 2
leve
l 2le
vel 2
base
leve
l 2le
vel 1
base
leve
l 2le
vel 1
leve
l 2
leve
l 2le
vel 2
leve
l 2le
vel 2
leve
l 2ba
sele
vel 2
leve
l 2le
vel 2
leve
l 1le
vel 2
leve
l 2le
vel 2
leve
l 2
leve
l 1le
vel 2
base
base
leve
l 1ba
sele
vel 2
leve
l 2le
vel 2
leve
l 2ba
sele
vel 2
leve
l 2le
vel 2
base
leve
l 2le
vel 2
leve
l 1le
vel 2
base
leve
l 1
leve
l 2le
vel 2
leve
l 2le
vel 2
leve
l 1ba
sele
vel 2
12-4
*Non
e: T
he a
genc
y di
d no
t mee
t the
per
form
ance
sta
ndar
d on
any
leve
l.B
ase:
The
age
ncy
met
the
base
per
form
ance
sta
ndar
d fo
r th
e re
stri
cted
-use
bon
us.
Lev
el 1
: The
age
ncy
met
the
firs
t per
form
ance
sta
ndar
d fo
r th
e un
rest
rict
ed-u
se b
onus
.L
evel
2: T
he a
genc
y m
et th
e se
cond
per
form
ance
sta
ndar
d fo
r th
e un
rest
rict
ed-u
se b
onus
.
/99

Max
imum
Perc
enta
geA
llow
able
of P
ossi
ble
Bon
us a
ndPo
tent
ial
Bon
usW
-2 C
ontr
acto
rR
einv
estm
ent
Bon
usE
arne
d
Tri
bes
Bad
Riv
erB
and
$24
,500
$19
,833
81.0
%O
neid
aN
atio
n37
.120
28,2
8376
.2
Subt
otal
$61
,620
$48
,116
78.1
%
Priv
ate
Age
ncie
s in
Milw
auke
e C
ount
y2
Em
pl. S
olut
ions
$ 6
,122
,707
$ 5,
831,
150
95.2
%
Max
imus
3,15
5,86
32,
554,
746
81.0
OIC
-GM
3,29
9,80
92,
828,
407
85.7
UM
OS
2,59
1,90
82,
036,
499
78.6
YW
Wor
ks2,
551,
633
2,30
8,62
090
.5
Subt
otal
$17,
721,
920
$15,
559,
422
87.8
%
200
Stan
dard
s M
et th
roug
h D
ecem
ber
2000
*
NU o Or
E ,4 "0 a.)
cu 4.1
0 ms
cuf)
CO 0 bi)
1... tu <
IC
3 O M 1 . ._ -4' 0
(24) -0 0 -,
> ct,
A 0. 1 . . . 0 1:t4
)
.0 o "
. .c sa. 0 1. rzt. c -5
¢ 2
-0;-
. Ucz
to. t
a-
=fz
41
a.)
.,.. . > . r.) a 7,1 = 0 -- c,,
c.)
'V 44 cn CO
P:1
-= t:
-.--
-1. a
.)ed 6)
0=
co
.-,
0al
u.-
. =cD sa
.E 44
=
leve
l 1le
vel 2
leve
l 2le
vel 2
base
Lev
el 1
leve
l 2
leve
l 2le
vel 2
base
leve
l 2ba
seba
sele
vel 2
leve
l 1le
vel 2
leve
l 2le
vel 2
leve
l 2le
vel 2
leve
l 2
leve
l 1le
vel 2
leve
l 1le
vel 1
leve
l 2ba
sele
vel 2
leve
l 1le
vel 2
leve
l 2le
vel 2
leve
l 1le
vel 1
leve
l 2
base
leve
l 2le
vel 2
leve
l 1le
vel 1
leve
l 1le
vel 2
leve
l 2le
vel 2
leve
l 2le
vel 2
leve
l 1le
vel 1
leve
l 2
12-5
* N
one:
The
age
ncy
did
not m
eet t
he p
erfo
rman
ce s
tand
ard
onan
y le
vel.
Bas
e: T
he a
genc
y m
et th
e ba
se p
erfo
rman
ce s
tand
ard
for
the
rest
rict
ed-u
se b
onus
.L
evel
I: T
he a
genc
y m
et th
e fi
rst p
erfo
rman
ce s
tand
ard
for
the
unre
stri
cted
-use
bon
us.
Lev
el 2
: The
age
ncy
met
the
seco
nd p
erfo
rman
ce s
tand
ard
for
the
unre
stri
cted
-use
bon
us.
201

W-2
Con
trac
tor
Max
imum
Allo
wab
leB
onus
and
Pote
ntia
lR
einv
estm
ent
Bon
us
Perc
enta
geof
Pos
sibl
eB
onus
Ear
ned
Priv
ate
Age
ncie
sFl
oren
cein
Oth
er C
ount
ies3
Fwd.
Ser
v.14
,000
12,6
6790
.5%
FOV
Fwd.
Ser
v.$
128,
100
$12
2,00
095
.2Ju
neau
Wkf
ce. C
onn.
88,3
6486
,260
97.6
Kew
aune
eFw
d. S
erv.
17,5
0017
,083
97.6
Mon
roe
Wkf
ce. C
onn.
97,5
5395
,299
97.7
Shaw
ano
Job
Cen
ter
74,9
4067
,804
90.5
Wal
wor
thK
aise
r12
7,99
012
7,99
010
0.0
Wau
kesh
aC
urtis
248,
659
236.
819
95.2
Subt
otal
$79
7,10
6$
765,
852
96.1
%
Tot
al$2
5,85
2,01
2$2
2,88
8,92
388
.5%
202
Stan
dard
s M
et th
roug
h D
ecem
ber
2000
*
a 0 E w '0 0 i 0 0 w
6) cd 4) tIO
CO C) 00 CI
C)
-t
a) >,
CO A 0 en 1 0 0 = al 15 g ..0 o .-,
>,
CO 3 o 00 7. 1 0 0 = a) r14) .n, o .-,
cu cd .c 0 t... 06 a. t
¢ ,..
.0-c
, C=
(L) 00
eocd
''''00
-a' =
v.. w
to '-' . > -. t) <t
.0 ,-
.'a
l 0 0 w 0 ,.., cA CO A
Z., `1)
0 c
'1)
(241 a)
0 o
>, = 0 as ' Q'1
w =
leve
l 2le
vel 2
leve
l 2le
vel 2
leve
l 2le
vel 1
leve
l 1
leve
l 2le
vel 2
leve
l 2le
vel 2
leve
l 2le
vel 1
leve
l 2
leve
l 2le
vel 2
leve
l 2le
vel 1
leve
l 2le
vel 2
leve
l 2
leve
l 2le
vel 2
leve
l 1le
vel 2
leve
l 2le
vel 2
leve
l 2
leve
l 2le
vel 2
leve
l 1le
vel 2
leve
l 2le
vel 2
leve
l 2
base
leve
l 2le
vel 2
leve
l 2le
vel 2
leve
l 2le
vel 2
leve
l 2le
vel 2
leve
l 2le
vel 2
leve
l 2le
vel 2
leve
l 2
leve
l 21
leve
l 2le
vel 2
leve
l 2le
vel 2
leve
l 1le
vel 2
12-6
*Non
e: T
he a
genc
y di
d no
t mee
t the
per
form
ance
sta
ndar
d on
any
leve
l.B
ase:
The
age
ncy
met
the
base
per
form
ance
sta
ndar
d fo
r th
e re
stri
cted
-use
bon
us.
Lev
el 1
: The
age
ncy
met
the
firs
t per
form
ance
sta
ndar
d fo
r th
e un
rest
rict
ed-u
se b
onus
.L
evel
2: T
he a
genc
y m
et th
e se
cond
per
form
ance
sta
ndar
d fo
r th
e un
rest
rict
ed-u
se b
onus
.
203

2 3
204
The
Sou
thw
est C
onso
rtiu
m c
onsi
sts
of G
rant
, Gre
en, I
owa,
Laf
ayet
te, a
nd R
ichl
and
coun
ties.
The
se a
genc
ies
serv
e si
x re
gion
s in
Milw
auke
e C
ount
y:
Reg
ion
IY
W W
orks
Reg
ion
IIU
nite
d M
igra
nt O
ppor
tuni
ty S
ervi
ces,
Inc
.R
egio
n II
IO
ppor
tuni
ties
Indu
stri
aliz
atio
n C
ente
r of
Gre
ater
Milw
auke
eR
egio
n IV
Em
ploy
men
t Sol
utio
ns, I
nc.,
a su
bsid
iary
of
Goo
dwill
Ind
ustr
ies
ofSo
uthe
aste
rn W
isco
nsin
and
Met
ropo
litan
Chi
cago
, Inc
.R
egio
n V
Em
ploy
men
t Sol
utio
ns, I
nc.,
a su
bsid
iary
of
Goo
dwill
Ind
ustr
ies
ofSo
uthe
aste
rn W
isco
nsin
and
Met
ropo
litan
Chi
cago
, Inc
.R
egio
n V
IM
axim
us, I
nc.
Ten
cou
ntie
s ot
her
than
Milw
auke
e ar
e se
rved
by
thes
e fi
ve p
riva
te a
genc
ies
unde
r th
e cu
rren
t con
trac
ts:
Cur
tis &
Ass
ocia
tes,
Inc
.
Forw
ard
Serv
ice
Cor
pora
tion
Kai
ser
Gro
up, I
nc.
Shaw
ano
Cou
nty
Job
Cen
ter
Inco
rpor
ated
Wor
kfor
ce C
onne
ctio
ns, I
nc.
Wau
kesh
a C
ount
y
Flor
ence
Cou
nty
Fore
st, O
neid
a, a
nd V
ilas
(FO
V)
coun
ties,
oper
atin
g as
a c
onso
rtiu
mK
ewau
nee
Cou
nty
Wal
wor
th C
ount
y
Shaw
ano
Cou
nty
June
au C
ount
yM
onro
e C
ount
y
12-7
205

Appendix 13
Income and Poverty Status of Former W-2 Participants(Left W-2 in First Quarter 1998)
W-2 Contractor
NumberWho
Left W-2
NumberFiling
Returns
NumberClaiming
EITC
AverageState andFederalEITC
AverageIncome
PercentageAbove
Poverty
PercentageAbovePoverty
with EITC
CountiesAdams'Ashland'Barron 10 7 7 $2,875 $ 7,757 16.7% 33.3%Bayfield'Brown 74 49 38 2,360 14,326 40.0 53.3Buffalo'Burnett'Calumet 10 7 4 2,596 22,132 40.0 40.0Chippewa 14 10 8 1,257 9,857 25.0 25.0Clark'Columbia'Crawford'Dane 188 105 90 2,035 11,449 31.4 46.1Dodge 20 15 11 1,150 15,950 70.0 80.0Door'Douglas 106 68 58 2,283 11,284 37.9 50.0Dunn 9 5 5 6,063 8,486 0.0 33.3Eau Claire 55 45 37 3,081 12,542 28.6 45.7Florence'Fond du Lac 39 33 31 2,557 12,733 32.0 52.0Grant-SW
Consortiuml 2Green Lake'Iron'Jackson'Jefferson 9 7 6 626 15,980 80.0 80.0Kenosha 71 37 34 2,171 9,537 25.0 40.0La Crosse 19 14 10 1,755 5,939 0.0 11.1Lang lade 17 14 11 1,944 12,747 27.3 36.4Lincoln' -- --Manitowoc 7 3 2 1,976 10,201 33.3 66.7Marathon 39 28 24 3,002 12,864 23.8 42.9Marinette' -- --Marquette'Menominee 32 21 18 2,182 3,586 6.7 13.3Monroe 13 13 10 2,077 10,406 37.5 50.0Oconto' -- --Outagamie 35 27 20 2,498 17,961 33.3 40.0
206

W-2 Contractor
NumberWho
Left W-2
NumberFiling
Returns
NumberClaiming
EITC
AverageState andFederalEITC
AverageIncome
PercentageAbove
Poverty
PercentageAbovePoverty
with EITC
Ozaukee'Pepin'Pierce'Polk 6 3 2 $2,039 $21,022 66.7% 100.0%Portage 12 12 10 2,023 9,904 18.2 27.3Price 8 5 5 3,024 9,138 25.0 25.0Racine 104 82 68 2,557 11,394 38.6 50.0Rock 59 31 30 2,341 9,724 17.9 42.9Rusk' -- --St Croix 8 6 5 3,820 19,066 80.0 80.0Sauk 18 11 7 1,093 5,925 20.0 20.0Sawyer 26 20 17 2,277 6,997 12.5 25.0Sheboygan 20 14 9 2,435 21,680 40.0 60.0Taylor 11 5 5 1,664 9,462 50.0 50.0Trempealeau' -- --Vernon'Washburn 8 4 4 4,608 9,549 0.0 33.3Washington 13 10 9 1,927 9,281 14.3 14.3Waupaca 9 7 3 790 10,188 20.0 40.0Waushara 8 6 5 3,167 22,545 80.0 80.0Winnebago 77 62 47 2,214 15,400 40.4 51.9Wood 22 6 0 0 21,472 50.0 50.0
Subtotal 1,176 792 650 $2,312 $12,050 32.6% 45.8%
TribesLac du Flambeau
Band'Bad River Band'Oneida Nation 17 12 12 $3,156 $ 7,802 12.5% 25.0%
Subtotal 17 12 12 $3,156 $ 7,802 12.5% 25.0%
Private Agencies in Milwaukee County3
EmploymentSolutions 124 72 62 $2,389 $12,929 40.3% 52.8%
Maximus 186 123 101 2,277 12,979 42.3 55.3OIC-GM 60 27 24 2,041 10,980 33.3 37.0UMOS 186 113 93 2,275 12,919 33.6 48.7YW Works 77 35 33 2,200 11,926 31.4 48.6Other Milwaukee 22 16 16 2,685 9,598 31.3 43.8
Subtotal 655 386 329 $2,291 $12,577 37.3% 50.5%
13-2
207

W-2 Contractor
NumberWho
Left W-2
NumberFiling
Returns
NumberClaiming
EITC
AverageState andFederalEITC
AverageIncome
PercentageAbovePoverty
PercentageAbovePoverty
with EITC
Private Agencies inForestFwd.
Serv.1JuneauW. WI
Other Counties4
PIC 26 18 17 $2,660 $10,882 18.8% 37.5%KewauneeFwd.
Serv. IOneidaFwd.
Serv.'ShawanoJob
Center 25 16 8 2,181 14,978 33.3 50.0VilasFwd.
Serv. IWalworth
Kaiser 23 17 14 2,850 12,910 50.0 50.0Waukesha
Curtis 85 72 61 2,370 12,748 34.3 47.8
Subtotal 159 123 100 2,462 12,604 33.7 46.5%
Balance of State' 122 64 52 $ 2,300 $10,825 32.0% 43.9%
Total 2,129 1,377 1,143 $ 2,320 $11,988 33.8% 46.7%
In general, when agencies had fewer than eight participants, data are reported under Balance of State to protectparticipants' privacy.
The Southwest Consortium consists of Grant, Green, Iowa, Lafayette, and Richland counties.
These agencies served six regions in Milwaukee County:
Region IRegion IIRegion IIIRegion IV
Region V
Region VI
YW WorksUnited Migrant Opportunity Services, Inc.Opportunities Industrialization Center of Greater MilwaukeeEmployment Solutions, Inc., a subsidiary of Goodwill Industries of
Southeastern Wisconsin and Metropolitan Chicago, Inc.Employment Solutions, Inc., a subsidiary of Goodwill Industries of
Southeastern Wisconsin and Metropolitan Chicago, Inc.Maximus, Inc.

4 Eight counties other than Milwaukee were served by these five private agencies under the initialimplementation contracts:
Curtis & Associates, Inc. Waukesha County
Forward Service Corporation Forest CountyKewaunee CountyOneida CountyVilas County
Kaiser Group, Inc. Walworth County
Shawano County Job Center Shawano CountyIncorporated
Western Wisconsin Private Juneau CountyIndustry Council, Inc.

Appendix 14
Returning Participants by W-2 AgencyJuly 1998 and July 2000
PercentageW-2 Contractor July 1998 July 2000 Change
CountiesAdams 1 1 0.0%Ashland 0 0 --Barron 1 4 300.0Bayfield 0 1
Brown 4 3 (25.0)Buffalo 2 4 100.0Burnett 1 0 (100.0)Calumet 2 4 100.0Chippewa 4 2 (50.0)Clark 0 0 --Columbia 1 7 600.0Crawford 0 0Dane 36 156 333.3Dodge 7 7 0.0Door 0 5 0.0Douglas 4 13 225.0Dunn 2 11 450.0Eau Claire 7 7 0.0Fond du Lac 8 8 0.0GrantSW Consortium' 1 5 400.0Green Lake 0 2Iron 0 2Jackson 0 0
Jefferson 1 1 0.0Kenosha 15 101 573.3La Crosse 11 6 (45.5)Langlade 0 3 --Lincoln 1 1 0.0Manitowoc 0 1 --Marathon 10 8 (20.0)Marinette 0 0 --Marquette 1 1 0.0Menominee 7 6 (14.3)Oconto 0 1
Outagamie 8 17 112.5Ozaukee 0 1
Pepin 0 0Pierce 0 1
Polk 3 3 0.0
210

W-2 Contractor July 1998 July 2000Percentage
Change
Portage 2 1 (50.0)Price 5 3 (40.0%)Racine 25 37 48.0Rock 8 37 362.5Rusk 1 1 0.0St. Croix 0 4Sauk 0 5
Sawyer 1 4 300.0Sheboygan 2 3 50.0Taylor 2 0 (100.0)Trempealeau 0 0
Vernon 0 1
Washburn 0 1
Washington 1 4 300.0Waupaca 0 6
Waushara 0 0Winnebago 13 25 92.3Wood 5 14 180.0
Subtotal 203 539 165.5%
TribesBad River Band 2 4 100.0%Lac du Flambeau Band2 2Oneida Nation 6 5 (16.7)
Subtotal 10 9 (10.0%)
Milwaukee County3 361 3,501 869.8%
Private Agencies in Other Counties4FOVFwd. Serv. 2 4 100.0%JuneauW. WI PIC 4 10 150.0KewauneeFwd. Serv. 0 0 --Shawano Job Center 6 3 (50.0)WalworthKaiser 3 8 166.7WaukeshaCurtis 8 24 200.0
Subtotal 23 49 113.0%
OthersFlorenceFwd. Serv. 0 2MonroeWkfce. Conn. 2 8 300.0%
Subtotal 2 10 400.0%
Total 599 4,108 585.8
14-2
211

3
The Southwest Consortium consists of Grant, Green, Iowa, Lafayette, and Richland counties.
The Lac du Flambeau Band of Chippewa was a W-2 agency through December 1999 but is not a W-2agency under the current contract.
Data on returning participants are not available for the private W-2 agencies contracted to serve MilwaukeeCounty, but they are available for Milwaukee County in aggregate.
Eight counties other than Milwaukee have been served by these five private agencies. The name of one ofthe agencies changed from the first to the second implementation period.
Curtis & Associates, Inc. Waukesha County
Forward Service Corporation
Kaispr Group, Inc.
Shawano County Job CenterIncorporated
Western Wisconsin PrivateIndustry Council, Inc.
Workforce Connections, Inc.
Kewaunee CountyForest, Oneida, and Vilas (FOV) counties were
served separately under the initial implementationcontract and as a consortium under the currentcontract
Walworth County
Shawano County
Juneau County(initial implementation contract)
Juneau County(current implementation contract)
5 Programs in these counties were administered by county agencies in July 1998 but by the following privateagencies in July 2000:
Forward Service Corporation Florence County
Workforce Connections, Inc. Monroe County
14aZ.1,2

Scott McCallum OFFICE OF THE SECRETARYGovernor 201 East Washington Avenue
P.O. Box 7946Jennifer Reinert Madison, WI 53707-7946Secretary JObj Telephone: (608) 266-7552
Fax: (608) 266-1784http://www.dwd.state.wi.us/
State of Wisconsin e-mail: [email protected]
Department of Workforce Development
March 30, 2001
Janice MuellerState AuditorLegislative Audit Bureau22 E. Mifflin Street, Suite 500Madison, WI 53703
Dear Ms. Mueller:
Thank you for the opportunity to review and respond to the Legislative Audit Bureau's evaluationof the Wisconsin Works (W-2) program. The Department of Workforce Developmentappreciates the significant amount of effort invested by the Audit Bureau in completing thisreport, as well as five other related reports, regarding W-2. The resulting information has been,and will continue to be, of use to the Department in its efforts to ensure continuous improvementin our programs.
The report addresses several aspects of W-2, which is a complex program, making it difficult tocomment on the many observations included. I would, however, like to offer the followingobservations about its key findings. The information is intended to provide additionalbackground regarding W-2 as it exists today, recognizing that the program has evolved, and willcontinue to evolve, as we gain experience with this pioneering effort.
Indicators of Program Effectiveness
The report discusses W-2's success in light of two benchmarks: the extent to which participantshave achieved economic self-sufficiency and the extent to which former participants return tothe program. What should not be overlooked in considering the observations included in thereport is the fact that W-2 was designed as, and continues to be, a stepping stone into theworkforce for families with barriers to full employment. W-2, by itself, may not lead to self-sufficiency. W-2 is, however, designed to assist families in their efforts to take the first steptoward self-sufficiency by engaging families in the world of work.
Information included in the Audit Bureau's report bears out the success that has been achievedto date. According to the Audit Bureau, the average annual income, including state and federalearned income tax credits, of its sample of former W-2 participants was $14,308 in 1999. Incomparison, a family of three receiving Aid to Families with Dependent Children (AFDC) wouldhave received $6,204, while the annual cash grant amount under W-2 would have been at least$7,536. Clearly, this is progress.
In addition, a large portion of these families has the benefit of the necessary in-work supports topromote further efforts to achieve self-sufficiency. The report discounts the value of these in-work supports to former participants, as well as other low-income families, but they are critical tosupporting the transition into the world of work. Currently, 40,000 families with children receivefood stamps, almost 340,000 families receive Medical Assistance, and 22,500 families, withapproximately 40,000 children, receive child care assistance.
SEC-7792-E (R. 02/2001) File Ref:
213

Janice MuellerMarch 30, 2001Page 2
Are families that rely on these in-work supports self-sufficient? No. Are they on their way toachieving self-sufficiency? Yes.
The fact that participants return to W-2 reflects a basic underlying philosophy of W-2 rather thana failure of the program or of the program's participants. This philosophy is that it is moredesirable to go out and gain work experience, whether the job is temporary or expected to bepermanent, than to not work at all. The system is designed to support an individual as he or sheprogresses on the road to self-sufficiency and is available on an "as needed basis." Thus, W-2agencies encourage their participants to return for more help if the job doesn't work out or ifadditional assistance is needed. The fact that participants do return indicates the establishmentof a strong system of supports upon which families can rely when they need assistance in theirefforts to achieve self-sufficiency.
In considering the program's effectiveness, I believe we need to keep in mind that after onlythree and one-half years since W-2's statewide implementation, Wisconsin has made significantstrides toward eradicating the legacy of AFDC and in assisting families in their efforts to achieveeconomic self-sufficiency. We recognize, however, that while the initial connection to theworkforce breaks the cycle of dependence on cash assistance, it does not accomplish fullsufficiency. This is a laudable goal and is the continuing focus of the program.
Program Expenditures
The report provides a significant amount of information about program expenditures. I wouldlike to make several observations about the information provided, including some of thehistorical information.
First, while accurate, the information about the "profits" generated under the first implementationcontract does not recognize that, unlike most public sector contracts, the contracts with the W-2agencies required the agencies to assume a substantial risk. Rather than being reimbursedsimply because they spent money, the contracts required agencies to provide services to alleligible persons within the sum-certain funds provided. The W-2 agencies were expected toperform within established budget limits and the measure of performance under the contractswas moving people from welfare to work. Given the uncharted territory into which theseagencies, public and private, were entering, the contracts were structured as reasonably ascould be expected.
However, with additional experience and as noted in the report, the Department moved awayfrom the structure of the initial contract toward a more sophisticated model of assessingperformance. This model is reflected in the 2000-2001 contracts, which include performancerequirements each W-2 agency must meet. Performance bonuses will only be awarded basedon achievement of these benchmarks, none of which are directly tied to caseload reductions.
Second, it should be noted that the decrease in the cash benefit caseload has led to substantialbenefits for the state as well as for localities. The decline in the cash caseload has meant thatfunds are available to support expanded services for low-income families as well as otherservices. At the state level, these funds have been invested in a variety of activities, includingcommunity youth grants, the Early Childhood Excellence Initiative, literacy programs, servicesfor domestic violence victims, and nutritional programs.
X14

Janice MuellerMarch 30, 2001Page 3
Local investments have also been made as a result of the first contract's structure. Severalexamples of these are included in the report, some of which reflect investments in other thandirect services and include offsetting county tax levies and enhancing computer networks.Clearly, the funding that was made available as a result of the reduction in cash caseloads hasbeen of benefit to the taxpayers throughout the state and should not be considered money illspent.
Third, because there has been some confusion on this topic, it is important to note the AuditBureau's finding that administrative costs have been less than 10 percent during the life of theprogram. This level of expenditures is significantly less than the 15 percent cap established byfederal law.
Finally, in discussing program expenditures, the report references the Audit Bureau's previousfindings regarding unallowable and questioned costs in the context of the right of first selection.The Department plans to implement the Audit Bureau's recommendation in this area, whichsupports the actions we have taken to date to establish additional standards regarding eligibilityfor the right of first selection.
Sanctioning Participant Benefits
The report identifies limited situations in which participants may have been inappropriatelysanctioned and thus suffered a loss of benefits under the program. Although the Departmenthas provided the W-2 agencies with guidance regarding the sanction process, we areconcerned about the audit's findings. While the audit indicates we have already taken steps toaddress the issue, I would like to outline further the steps taken to address this situation.
First, we are examining all sanctions applied to W-2 participants since W-2 started and arehighlighting cases where the sanction appears to be questionable. We will give to theappropriate W-2 agency a list of all questionable sanctions and require that each agencyinvestigate the sanction to determine its appropriateness, reimburse the family if the sanctionwas not legitimate, and provide the Department with information about the final resolution.
Second, we have established a workgroup that is taking a comprehensive look at how sanctionsare processed to determine what modifications to our automated processes may be necessaryto ensure that inappropriate sanctions are not made in the future.
Third, we are developing a clarifying policy on the use of sanctions and plan to reinforce theproper sanction policy with all W-2 agencies immediately.
Finally, as recommended, we will report to the Joint Legislative Audit Committee bySeptember 1, 2001, regarding the results of our review, how participants who had beeninappropriately sanctioned were compensated, the procedures established to preventinappropriate sanctions in the future, and plans for ongoing monitoring of the situation.
In addition, although not related to the report's findings about sanctions, we will be implementingthe recommendations included in the report regarding trial job participants.
215

Janice MuellerMarch 30, 2001Page 4
Performance Standards
As noted in the discussion regarding program expenditures, the Department's development ofperformance standards under the W-2 contract has been evolutionary. At the time the programwas implemented, there was very little indication as to what to expect in terms of how theprogram would unfold. With additional experience, we developed a series of measurementsdesigned to evaluate program outcomes. These measurements are included in the currentcontract.
We are also continuing to modify the agency performance standards, as discussed in the report.The Department's proposed performance standards for the 2002-2003 contract period weresubject to public review and comment over the past several weeks, with the public commentperiod closing on Friday, March 23, 2001. The proposed performance standards build on thosethat currently exist and add additional components, including components related to customersatisfaction, case management, and agency accountability. As with the development of thestandards in the current contract, the proposed standards reflect the state's increasedexperienced with the program, as well as enhanced use of available data.
We will be reviewing each of the public comments received regarding the performancestandards and making modifications as appropriate, based on these comments. Therefore, wewill be able to report to the Joint Legislative Audit Committee by May 31, 2001, regarding futureperformance standards, as recommended in the audit.
Contract Oversight
The report outlines several concerns regarding program oversight, particularly in MilwaukeeCounty. As I have stated before in response to previous audits, the Department has invested asignificant amount of effort in this area over the past year. While programmatic oversight hasbeen ongoing, I would like to take this opportunity to again reiterate the steps we have taken inthe area of financial oversight. These steps include:
conducting a comprehensive review of all financial policies and procedures for W-2agencies to ensure expectations of prudent fiscal management are clearly outlined;
hosting fiscal roundtables across the state to ensure all W-2 agencies know whatexpenditures are appropriate and to clarify expectations;
developing additional requirements for certain expenditures that would need priorapproval by the department; and
updating audit guidelines to include specific requirements on sample size and scope,with expanded sampling required when unallowable costs are identified.
We have also been working aggressively with Private Industry Council of Milwaukee County toensure the appropriate level of oversight is being provided in the Milwaukee area, in conjunctionwith the efforts of our Milwaukee Regional Office staff.
Future Considerations
In considering the future, the Department does not believe that the success of the program inmoving families from welfare to work means our work is finished. We believe the efforts of theprogram must now turn toward ensuring that once the connection to work is made, that theconnection is sustained and that advancement is accomplished. At the same time, however,the core of W-2 must be maintained and efforts must be made to ensure those with multiplebarriers are served.
216

Janice MuellerMarch 30, 2001Page 5
The report discusses each of these, as well as other, issues. The Department welcomes thediscussion included in the report, as we have been grappling with these same issues in our ownconsideration of W-2's future. As part of our efforts, the Department commissioned a series ofWhite Papers, designed to develop a framework through which some of the questions mostrelevant to our continuing success could be addressed. The topics of these White Papersinclude the changing nature of the caseload, supporting job retention and advancement,addressing the needs of the hardest to serve, integrating non-custodial parents into the family,and breaking the cycle of dependency.
Based on our efforts to date, the Department had adopted a three-pronged approach to thefuture of W-2.
First, we are focusing on retention and advancement. To a great extent, these efforts lookbeyond W-2 to other programs housed within the Department. These programs include:
Workforce Attachment and Advancement (WAA) - WAA is a Wisconsin-specific programfunded with TANF funds. WAA provides funding to W-2 agencies and WorkforceDevelopment Boards (WDBs) to develop innovative employment retention andadvancement strategies for the TANF eligible population. The primary objective of theprogram is to promote upward mobility through training that prepares persons for higher-paying employment. WAA participants are not required to have received cashassistance under W-2; eligibility is based on income.
Welfare to Work (WtW) - WtW uses TANF funds, funneled through the U.S. Departmentof Labor to local WDBs and providers, to provide job placement, training, and post-employment services to long-term TANF recipients and non-custodial parents of childrenreceiving TANF assistance.
Workforce Investment Act - Title I (WIA) - WIA funding is administered by Wisconsin's 11WDBs. The full array of employment, training, and education-related training programsare to be coordinated through a unified planning process, with services provided at thelocal level through a one-stop delivery system.
Our efforts to integrate these programs along with W-2 into a seamless delivery systemdesigned to meet the needs of all workers, including low-income, led to the merger of the formerDivisions of Economic Support and Workforce Excellence into the Division of WorkforceSolutions. We believe that low-income workers need a workforce solution, not a welfaresolution, when they encounter difficulties in their efforts to achieve self-sufficiency.
Second, we believe that workforce connections and reconnections must continue to be madethrough W-2. W-2 should continue to be the "door" through which a person becomes amember of the world of work. This does not, however, mean that consideration cannot be givento issues related to service delivery, many of which are outlined in the report. It does mean thatW-2 should continue to be the stepping stone into the workforce for families with barriers to fullemployment.
Third, we are focusing on addressing the needs of the hardest to serve and those with moredifficult barriers to entering the workforce. In particular, we have invested a significant amountof time and effort, in conjunction with the W-2 Contract and Implementation Committee,designing policies and procedures regarding those who are approaching the 60-month timelimit. In large part, our efforts have built off of our experience in working with participants whohave approached their 24-month time limits.
217
Janice MuellerMarch 30, 2001Page 6
Our overall goal in this area is to recognize that some people do have more barriers toovercome than others do and that more intensive case services will be needed for thesepurposes. We will not, however, sell any family short by "setting them aside." We will requirecontinued aggressive case management on the part of the W-2 agencies.
The report specifically addresses three areas of concern in this area: assessing barriers toemployment, addressing the needs of participants nearing eligibility limits, and consideringfuture program modifications. Given our own interest in the topics addressed, we will implementthe recommendations included in this section of the report regarding the assessment of barriersand report to the Joint Legislative Audit Committee by September 1, 2001, regarding issuesrelating to the 60-month time limit.
Overall, we agree with the Audit Bureau that W-2 is at an important crossroads in itsdevelopment. While this crossroads provides us with an opportunity to reflect on ouraccomplishments, it also requires us to consider the challenges we must face in the future. Theinformation included in the report provides a basis from which we can work together to furtherpromote the goals of the program. We look forward to working with the Legislature and otherinterested parties to continue the evolution of the program and build on the success that hasbeen achieved thus far.
Again, thank you for the opportunity to respond to the audit as well as for the professionalism ofyour staff throughout the audit process.
Sincerely,
Jennifer ReinertSecretary
'2 II. 8

U.S. Department of EducationOffice of Educational Research and Improvement (OERI)
National Library of Education (NLE)Educational Resources Information Center (ERIC)
REPRODUCTION RELEASE(Specific Document)
I. DOCUMENT IDENTIFICATION:
Title: h eVa /1444/01 iscrnss;h tJorks ((,t.)-.) ) (Pr,oirar,
\ .-,Author(s): rau, frct; ber 1 e 4, a I,
Corporate Source:
'Scan,s;h Ai (14 84(e4(4
H. iiEPRODUCTION RELEASE:
Publication Date:
In order to disseminate as widely as possible timely and significant materials of interest to the educational community, documents announced in the
monthly abstract journal of the ERIC system, Resources in Education (RIE), are usually made available to users in microfiche, reproduced paper copy,
and electronic media, and sold through the ERIC Document Reproduction Service (EDRS). Credit is given to the source of each document, and, if
reproduction release is granted, one of the following notices is affixed to the document.
If permission is granted to reproduce and disseminate the identified document, please CHECK ONE of the following three options and sign at the bottom
of the page.
The sample slicker shown below WO beaffixed to ell Level 1 documents
1
PERMISSION TO REPRODUCE ANDDISSEMINATE THIS MATERIAL HAS
BEEN GRANTED BY
TO THE EDUCATIONAL RESOURCESINFORMATION CENTER (ERIC)
Level 1
Check hens for Level I release, permitting reproductionand dissemination in microfiche or other ERIC archival
media (e.g.. electronic) and paper copy.
Signhere,-"please
The sample sticker shown below will beaffixed to all Level 2A documents
PERMISSION TO REPRODUCE ANDDISSEMINATE THIS MATERIAL IN
MICROFICHE, AND IN ELECTRONIC MEDIAFOR ERIC COLLECTION SUBSCRIBERS ONLY,
HAS BEEN GRANTED BY
2A
TO THE EDUCATIONAL RESOURCESINFORMATION CENTER (ERIC)
Level 2A
Chedc here for Level 2A release, pernatang reproductionand dissemination In microfiche and In electronic media
for ERIC arohlval collection subscribed only .
The sample elicitor shown below will beof to all Level 28 documents
PERMISSION TO REPRODUCE ANDDISSEMINATE THIS MATERIAL IN
MICROFICHE ONLY HAS BEEN GRANTED BY
2B
TO THE EDUCATIONAL RESOURCESINFORMATION CENTER (ERIC)
Level 2B
Check here for Level 28 release. permittingreproduction and dissemination in microfiche only
Documents will be processed as Indicated provided reproduction quality permits.If permission to reproduce is granted, but no box Is checked. documents wiU be processed at Level I.
I hereby grant to the Educational Resources Information Center(ERIC) nonexclusive permission to reproduce and disseminate this document
as indicated above. Reproductio'n from the ERIC microfiche or electronic media by persons other than ERIC employees and its system
contractors requires permission from the copyright holder. Exception is made for non-profit reproduction by libraries and other service agencies
to satisfy information needs of ed rs in response to discrete Inquiries.
Ppr.Uccl Name/Position/Title:
el-rOu I 54(4; ter, rra, root 6,4,aikeN 1Yrec,-1-or
prom E. 0,-PPth re 14; ,5-00.
/1)adis , I ,53 703 -4,',2,25.Teni°0117) ad 9 9783 rA'Yo )04, 7-6./.80E.Mail Magnipao..ciwivrPicr:c..a
WS (over)

III. DOCUMENT AVAILABILITY INFORMATION (FROM NON-ERIC SOURCE):
If permission to reproduce is not granted to ERIC, or, if you wish ERIC to cite the availability of the document from another source, pleaseprovide the following information regarding the availability of the document. (ERIC will not announce a document unless it is publiclyavailable, and a dependable source can be specified. Contributors should also be aware that ERIC selection criteria are significantly morestringent for documents that cannot be made available through EDRS.)
Publisher/Distributor.
Address:
Price:
IV. REFERRAL OF ERIC TO COPYRIGHT/REPRODUCTION RIGHTS HOLDER:If the right to grant this reproduction release is held by someone other than the addressee, please provide the appropriate name andaddress:
Name:
Address:
V. WHERE TO SEND THIS FORM:
Send this form to the following ERIC Clearinghouse: Cheryl GrossmanProcessing Coordinator
ERIC Clearinghouse on Adult, Career, and Vocational EducationCenter on Education and Training for Employment
1900 Kenny RoadColumbus, OH 43210-1090
However, if solicited by the ERIC Facility, or if making an unsolicited contribution to ERIC, return this form (and the document beingcontributed) to:
EFF-088 (Rev. 9/97)