reproduction in any medium, provided the original work is...
TRANSCRIPT

J. Fluid Mech. (2014), vol. 756, pp. 716–727. c© Cambridge University Press 2014This is an Open Access article, distributed under the terms of the Creative Commons Attributionlicence (http://creativecommons.org/licenses/by/3.0/), which permits unrestricted re-use, distribution, andreproduction in any medium, provided the original work is properly cited.doi:10.1017/jfm.2014.455
716
Force acting on a square cylinder fixed in afree-surface channel flow
Z. X. Qi1, I. Eames1,† and E. R. Johnson1
1University College London, Torrington Place, London WC1E 7JE, UK
(Received 22 October 2013; revised 9 June 2014; accepted 1 August 2014;first published online 4 September 2014)
We describe an experimental study of the forces acting on a square cylinder (ofwidth b) which occupies 10–40 % of a channel (of width w), fixed in a free-surfacechannel flow. The force experienced by the obstacle depends critically on the Froudenumber upstream of the obstacle, Fr1 (depth h1), which sets the downstream Froudenumber, Fr2 (depth h2). When Fr1 <Fr1c, where Fr1c is a critical Froude number, theflow is subcritical upstream and downstream of the obstacle. The drag effect tendsto decrease or increase the water depth downstream or upstream of the obstacle,respectively. The force is form drag caused by an attached wake and scales asFD ' CDρbu2
1h1/2, where CD is a drag coefficient and u1 is the upstream flow speed.The empirically determined drag coefficient is strongly influenced by blocking, andits variation follows the trend CD =CD0(1+CD0b/2w)2, where CD0 = 1.9 correspondsto the drag coefficient of a square cylinder in an unblocked turbulent flow. Ther.m.s. lift force is approximately 10–40 % of the mean drag force and is generatedby vortex shedding from the obstacle. When Fr1 = Fr1c (< 1), the flow is chokedand adjusts by generating a hydraulic jump downstream of the obstacle. The dragforce scales as FD ' CKρbg(h2
1 − h22)/2, where experimentally we find CK ' 1. The
r.m.s. lift force is significantly smaller than the mean drag force. A consistent modelis developed to explain the transitional behaviour by using a semi-empirical form ofthe drag force that combines form and hydrostatic components. The mean drag forcescales as FD ' λρbg1/3u4/3
1 h4/31 , where λ is a function of b/w and Fr1. For a choked
flow, λ= λc is a function of blocking (b/w). For small blocking fractions, λc=CD0/2.In the choked flow regime, the largest contribution to the total drag force comes fromthe form-drag component.
Key words: channel flow, free-surface flow, hydraulics
1. Introduction
The Japan (2011) and Indian Ocean (2004) tsunami led to significant loss of lifeand destruction of city infrastructure, including businesses and homes. Building failureoccurred due to a combination of earthquake damage and inundation by sea water asthe tsunami moved inland. While the initial damage in coastal regions was largely
† Email address for correspondence: [email protected]

Force acting on a square cylinder fixed in a free-surface channel flow 717
caused by slamming forces, significant damage was caused by the quasi-steady flowof sea water around buildings, which generated stress on the building panels, torqueon the buildings and buoyancy forces that carried wooden buildings away. Part ofthe challenge in designing buildings that can resist these forces is in gaining a betterunderstanding of the physics and conservative estimates of the total force acting onthese structures.
Research on obstacles in free-surface channel flows is very well established. Earlytheoretical studies by Nagler (1918) and the large-scale experiments of Yarnell(1934a,b) focused on predicting changes in the upstream water depth – the backwatereffect – caused by streamlined piers. The key concept these authors introducedwas a classification of the flow types observed, which we describe here as beingeither subcritical or choked. For a subcritical flow, the change between upstream anddownstream water depth is small and the flow is essentially around the obstacle. Fora choked flow, the change in water depth is quite dramatic and is characterised by ahydraulic jump downstream.
This paper focuses on the force experienced by a rigid obstacle, which in this caseis taken to be a square cylinder, a shape that is representative of a building. Moststudies have focused on the subcritical regime (Azinfar & Kells 2009), which is atypical situation in civil engineering because the hydraulic jump in the choked regimepromotes scour, for example near the foundations of a bridge. Earlier work by Rajuet al. (1983) analysed the drag force on circular cylindrical structures in the subcriticalregime; the forces were determined by integrating the pressure distribution over thewhole surface of the cylinder. The one-dimensional model developed accounted forform drag, and experimental results were compared against it. The analysis of Rajuet al. (1983) was made tractable by assuming that the change in water depth issmall; such assumptions are not appropriate for choked flows. Most other studieshave estimated drag forces from the loss of momentum flux of the current stream,using measurements of average water depth (e.g. Henderson 1966). This techniquecannot be used for lift forces and is difficult to apply to three-dimensional bodiesbecause the wave field is unsteady.
In this paper we describe a detailed experimental study of the lift and drag forcesacting on a square obstacle, over a range of blocking fractions. In § 2, we describea one-dimensional model which is closed using a semi-empirical form for the dragforce, aspects of which have been briefly analysed by Fenton (2003). The purposeof the present work is to determine the empirical drag and hydrostatic coefficients,particularly in the choked flow regime. In § 3, the experimental methodology isdescribed, where an obstacle is mounted on an instrumented drag/lift cell. The resultsare described and compared with the one-dimensional theory in § 4, where we showconsistency of a priori predictions for the inferred drag and hydrostatic coefficientswith observed changes to the free surface. Finally, conclusions are drawn in § 5.
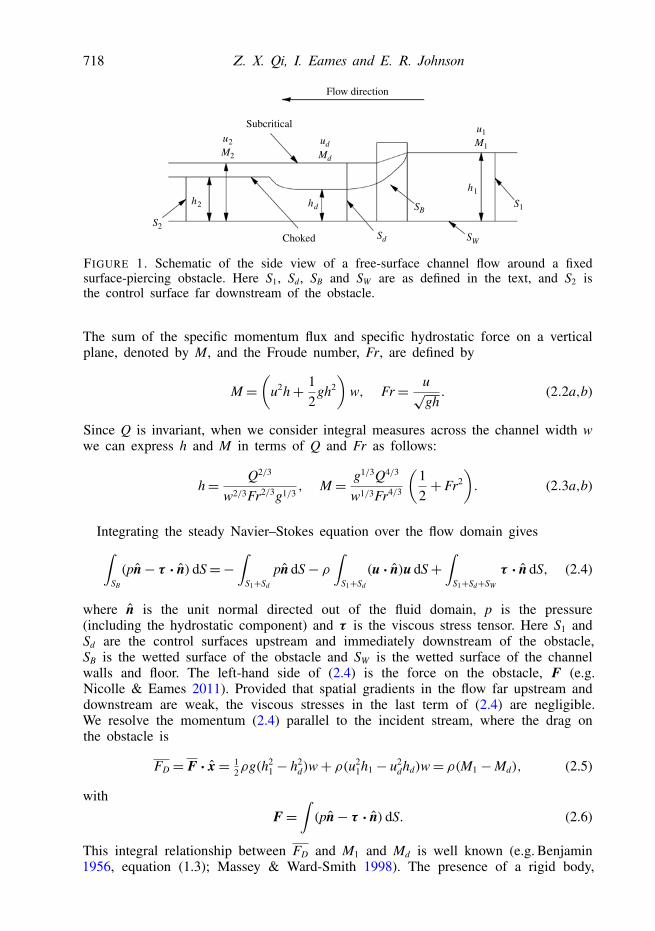
2. Mathematical modelWe develop a one-dimensional model with a semi-empirical form for the force
closure to understand the link between the force and changes in the free-surfaceshape. Figure 1 shows a schematic of the problem, which consists of a flow ina rectangular channel characterised by a water depth h and average speed u. Thechannel width far upstream and downstream of the square obstacle (of width b) is w,and the flow passes a constriction where the width decreases to a minimum of w− b.The volume flux Q is conserved, so that upstream and downstream of the obstacle,
Q= uwh. (2.1)
718 Z. X. Qi, I. Eames and E. R. Johnson
S2
S1
M1
u1
M2
u2
h2
h1
hd
Md
ud
Sd
SB
Flow direction
Subcritical
Choked
FIGURE 1. Schematic of the side view of a free-surface channel flow around a fixedsurface-piercing obstacle. Here S1, Sd, SB and SW are as defined in the text, and S2 isthe control surface far downstream of the obstacle.
The sum of the specific momentum flux and specific hydrostatic force on a verticalplane, denoted by M, and the Froude number, Fr, are defined by
M =(
u2h+ 12
gh2
)w, Fr= u√
gh. (2.2a,b)
Since Q is invariant, when we consider integral measures across the channel width wwe can express h and M in terms of Q and Fr as follows:
h= Q2/3
w2/3Fr2/3g1/3, M = g1/3Q4/3
w1/3Fr4/3
(12+ Fr2
). (2.3a,b)
Integrating the steady Navier–Stokes equation over the flow domain gives∫SB
(pn− τ · n) dS=−∫
S1+Sd
pn dS− ρ∫
S1+Sd
(u · n)u dS+∫
S1+Sd+SW
τ · n dS, (2.4)
where n is the unit normal directed out of the fluid domain, p is the pressure(including the hydrostatic component) and τ is the viscous stress tensor. Here S1 andSd are the control surfaces upstream and immediately downstream of the obstacle,SB is the wetted surface of the obstacle and SW is the wetted surface of the channelwalls and floor. The left-hand side of (2.4) is the force on the obstacle, F (e.g.Nicolle & Eames 2011). Provided that spatial gradients in the flow far upstream anddownstream are weak, the viscous stresses in the last term of (2.4) are negligible.We resolve the momentum (2.4) parallel to the incident stream, where the drag onthe obstacle is
FD = F · x= 12ρg(h2
1 − h2d)w+ ρ(u2
1h1 − u2dhd)w= ρ(M1 −Md), (2.5)
withF=
∫(pn− τ · n) dS. (2.6)
This integral relationship between FD and M1 and Md is well known (e.g. Benjamin1956, equation (1.3); Massey & Ward-Smith 1998). The presence of a rigid body,
Force acting on a square cylinder fixed in a free-surface channel flow 719
introduced into a channel flow, generates a perturbation. At low Fr, the change inwater depth upstream and downstream is negligible. But at high Fr, a bore initiallypropagates upstream and downstream from the body when the water is set in motion,leading to a change in the water depth upstream and downstream of the obstacle; thischange in water depth may be dramatic. This means that a reference, unperturbedupstream state will quickly be lost, especially in practice and in our experimentswithin a flume of finite length. For this reason, the model and observations areexpressed in terms of an upstream Froude number, Fr1. Given an upstream state(characterised by Fr1), the purpose is to determine the downstream state characterisedby Fr2 and the mean drag force on the obstacle.
There are a number of closures that could be applied to estimate the state ofthe flow, and these involve making assumptions about how energy or momentum isconserved across the throat of the flow. The momentum approach is the one which hasbeen favoured since the 1960s and is conceptually the closest to describing the actionof the obstacle. Fenton (2003, 2008) provided a clear description of these processes,mostly in the limit of small changes in the water depth, whereas the current studyfocuses on the nonlinear effects. The basis of the empirical closure is a mean dragforce, estimated by adding together a form drag, based on the wetted frontal areaof the obstacle (bh) and the mean flow u (area-averaged), and the hydrostatic force,so that
FD = 12 CDρbu2h+ 1
2 CHρbg(h21 − h2
d), (2.7)
where CD and CH are empirically determined constants. The left-hand side of (2.7)is equal to the right-hand side of (2.5). Henderson (1966) and Fenton (2003), forinstance, included only the first form-drag term, while Fenton (2008) included bothterms (although the second term far downstream was expressed in terms of h2). Theusual approach is to prescribe CD based on studies where obstacles are submerged ina channel flow. The blocking caused by the obstacle has a significant influence on thedrag force. Given the drag coefficient CD0 for an unbounded flow, we can estimate theinfluence of blocking. For an unbounded flow u, the drag on a body at high Reynoldsnumbers generates a volume flux Qw = CD0buh downstream in an unblocked flow(Betz 1925). The effect of blocking increases the average flow outside the wake. Theobstacle sees an average of the upstream flow u and the downstream flow u+Qw/hw,i.e. u(1 + CD0b/2w), generating a drag force of CD0bu2(1 + CD0b/2w)2/2, which isequivalent to a drag coefficient of
CD =CD0
(1+ CD0b
2w
)2
. (2.8)
(For circular cylinders, Raju et al. 1983 used an empirical form CD = CD0(1 −b/w)−1.35, whereas Maskel 1963 and Awbi 1978 used CD=CD0(1+ ηCD0b/w), whereη is a blockage factor dependent on the magnitude of the base-pressure coefficient.)The drag coefficient for square cylinders is influenced by ambient turbulence; fora turbulent intensity of 5 %, which is typical of the conditions of the experimentalflume described in § 3, CD0 drops from 2.1 to 1.9 (Tamura & Miyagi 1999). Thereare various ways to parameterise h and u; one is to take h= h1 and u=Q/h1w, andthis is the choice adopted here. Recasting (2.7) in a dimensionless form, we obtain
720 Z. X. Qi, I. Eames and E. R. Johnson
an implicit relationship between Fr1 and Frd,(1− CHb
w
)1
2Fr4/31
+(
1− CDb2w
)Fr2/3
1 =(
1− CHbw
)1
2Fr4/3d
+ Fr2/3d . (2.9)
Equation (2.9) is solved with Frd as a function of Fr1 to relate the state of thedownstream flow to that of the upstream flow. This yields a maximum value of Fr1cwhich corresponds to ∂Fr1/∂Frd = 0. Differentiating (2.9), we have
Frdc =(
1− CHbw
)1/2
. (2.10)
Under this formulation, Frdc depends only on CHb/w.The transition from Sd to S2 (the control surface far downstream of the obstacle) is
determined by the condition that (in the absence of friction) the momentum flux isconserved, i.e.
1
Fr4/3d
(12+ Fr2
d
)= 1
Fr4/32
(12+ Fr2
2
), (2.11)
which yields either Fr2 = Frd for a subcritical throat flow or Fr2 = Fr2c (>Frd) fora supercritical throat flow. Here Fr1c and Fr2c are determined from (2.9) and (2.11),respectively.
3. Experimental set-up and methodologyThe experiments were undertaken in a flume of width 0.50 m, depth 0.20 m and
length 3 m, whose inlet is tapered to minimise upstream disturbance. The volumeflux through the flume was estimated from a time-averaged measurement of velocityusing an acoustic doppler velocimeter (Nortek Vectrino Ltd). The turbulent intensity,It = urms/u (where urms is the r.m.s. velocity and u the time-averaged velocity), wasmeasured as It = 5.5 %. A number of square acrylic blocks (of widths b= 0.05, 0.10,0.15 and 0.20 m and of height 0.20 m) were mounted onto a rigid rod, connectedto two calibrated load cells. The voltage outputs from the local Wheatstone bridgesvaried linearly with the applied moments and were logged with two DSC USBdigitisers. Both the drag (FD) and lift (FL) forces may vary in time. These arecharacterised in terms of the mean drag and r.m.s. lift forces, defined as
FD = 1T
∫ T
0FD dt, FL,rms =
(1T
∫ T
0F2
L dt)1/2
. (3.1a,b)
The r.m.s. lift force is used because the average lift force is zero, i.e. (1/T)∫ T
0 FL dt=0. The water depth upstream and downstream of the rectangular obstacle wasmeasured directly from the sides of the tank far downstream of the hydraulic jump.
4. Experimental resultsTo examine the influence of the channel flow on the force acting on the obstacle,
both the channel volume flux Q and the initial channel water depth hI were varied.The initial water depth hI was varied from 0.02 to 0.18 m (in increments of 0.02 m),and Q varied from 0.013 to 0.065 m3 s−1 (in increments of 0.013 m3 s−1). For theshallowest downstream water depths, frictional effects appear to affect the results, andtherefore the results for hI 6 0.06 m were neglected in the data collation.

Force acting on a square cylinder fixed in a free-surface channel flow 721
0 0.2 0.4 0.6 0.8 1.0
0.5
1.0
1.5
2.0
2.5
0 0.2 0.4 0.6 0.8 1.0
0.5
1.0
1.5
2.0
2.5
Fr2
Fr1 Fr1
(a) (b)
FIGURE 2. (Colour online) Scatter plots of Fr2 versus Fr1 (defined by (2.2)) for anobstacle of width b = 0.05, 0.10, 0.15 or 0.20 m: (a) experimental; (b) model-predicted.The symbols in panel (a) correspond to hI = 0.08 (�), 0.10 (4), 0.12 (×), 0.14 (◦),0.16 (F) and 0.18 (+) m. The curves in panel (b) represent (2.9) with CD0 = 1.9 andCH = 0.58, and the filled circles correspond to choked flow.
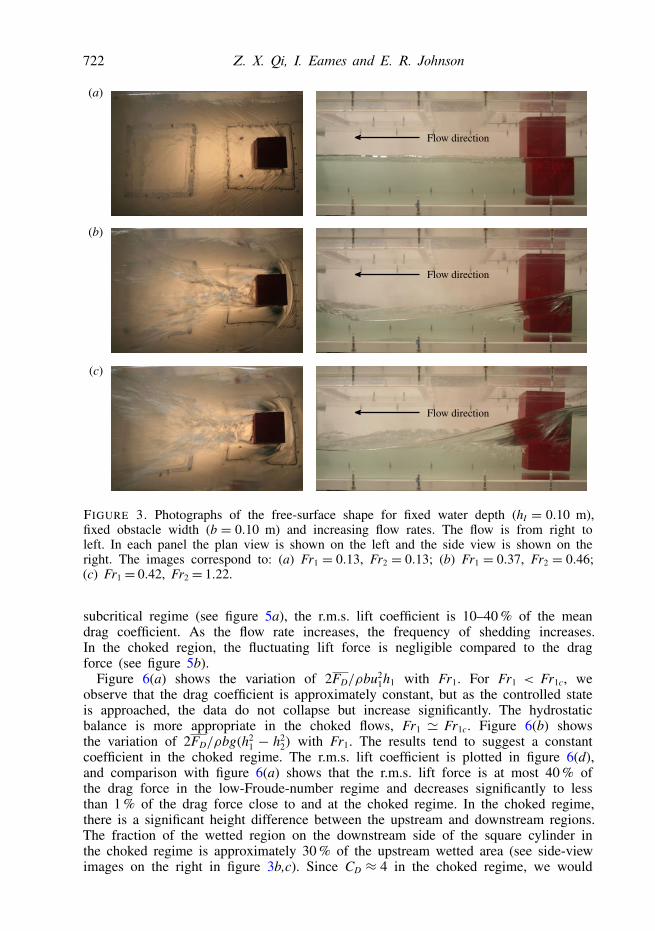
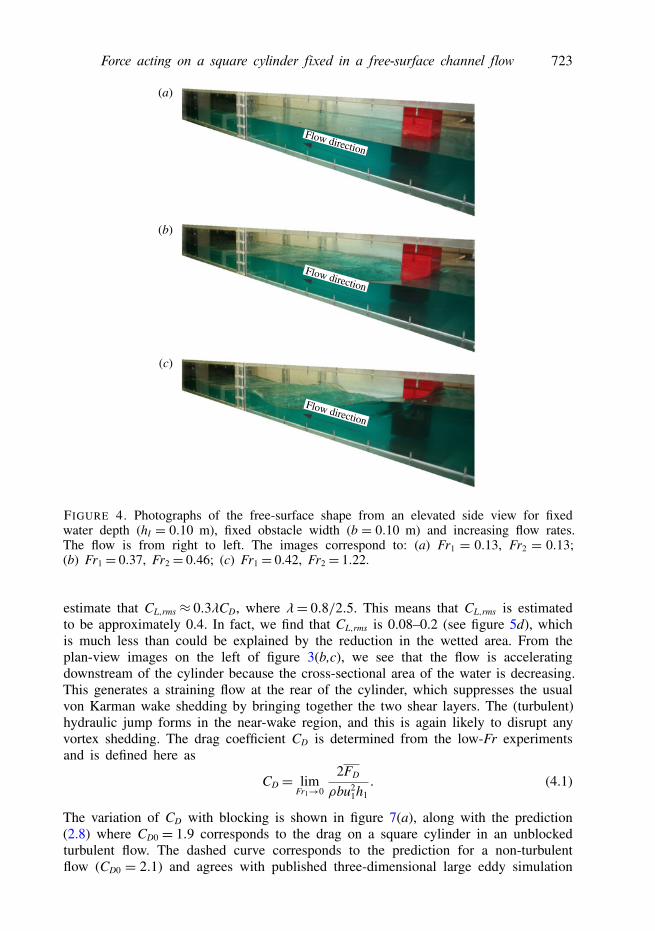
4.1. Water depthFigure 2 shows scatter plots of the experimental and model-predicted upstream anddownstream Froude numbers. The data tend to fall into two regions, as discussed inthe introduction and by Brocchini & Peregrine (2001). Below a subcritical upstreamFroude number, i.e. Fr1<Fr1c, Fr1 and Fr2 are correlated with Fr2/Fr1≈ 1, such thatthe difference between the upstream and downstream depths is small. This is reflectedin the forms of surface disturbance seen in figures 3(a) and 4(a). The small-amplitudeundulations observed are capillary waves whose form is fixed by the flow around theobstacle or which are shed from its corners. The free surface is slightly deformed bythe wake shedding and is turbulent, as is evident by the roughening of the free surface.At Fr1=Fr1c, the downstream Froude number jumps to Fr2c. These changes are clearlyobserved in the nature of the free-surface disturbance. As the Froude number Fr1
approaches a critical value, we observe that the water depth decreases rapidly aroundthe sides of the obstacle and a hydraulic jump is generated just downstream (seefigures 3b,c and 4b,c). In this region the water is shallow and recovers slightly furtherdownstream. Also evident is that the flow is clearly not one-dimensional. The modelis based on a one-dimensional analysis that ignores sidewall and floor friction. Fromfigure 4, we can see a standing wave field and the hydraulic jump downstream of thesquare cylinder. The difference between the simple model and the observations occursin the estimation of Fr2, and this is due to the challenge of measuring the water depthand the influence of the wave.
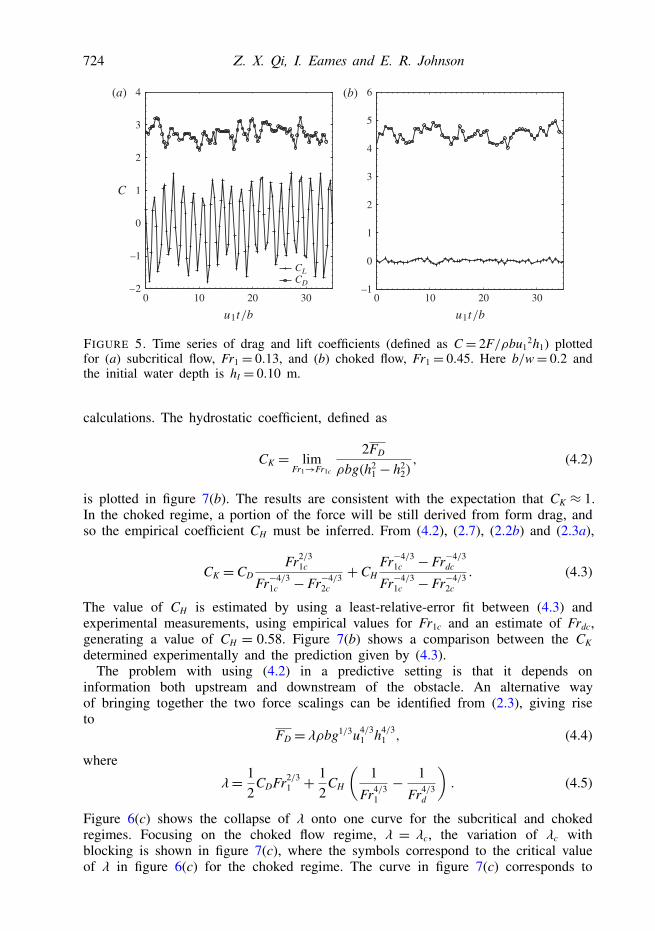
4.2. Force on the obstacleFigure 5 shows a typical time series for the drag and lift force coefficients of asquare cylinder (with b/w = 0.2) in the subcritical and choked regimes. For the
722 Z. X. Qi, I. Eames and E. R. Johnson
(b)
(c)
(a)
Flow direction
Flow direction
Flow direction
FIGURE 3. Photographs of the free-surface shape for fixed water depth (hI = 0.10 m),fixed obstacle width (b = 0.10 m) and increasing flow rates. The flow is from right toleft. In each panel the plan view is shown on the left and the side view is shown on theright. The images correspond to: (a) Fr1 = 0.13, Fr2 = 0.13; (b) Fr1 = 0.37, Fr2 = 0.46;(c) Fr1 = 0.42, Fr2 = 1.22.
subcritical regime (see figure 5a), the r.m.s. lift coefficient is 10–40 % of the meandrag coefficient. As the flow rate increases, the frequency of shedding increases.In the choked region, the fluctuating lift force is negligible compared to the dragforce (see figure 5b).
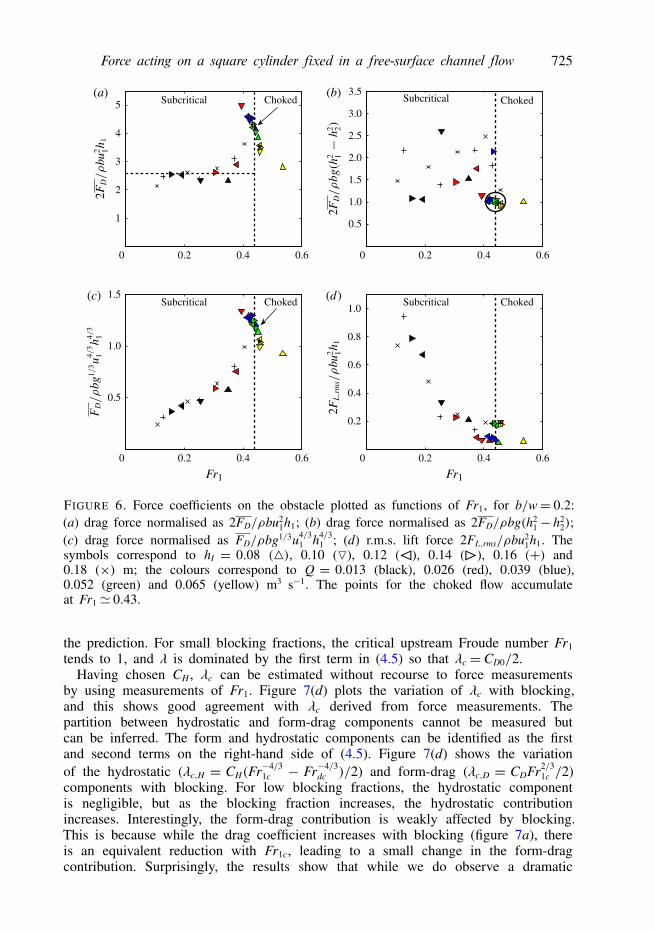
Figure 6(a) shows the variation of 2FD/ρbu21h1 with Fr1. For Fr1 < Fr1c, we
observe that the drag coefficient is approximately constant, but as the controlled stateis approached, the data do not collapse but increase significantly. The hydrostaticbalance is more appropriate in the choked flows, Fr1 ' Fr1c. Figure 6(b) showsthe variation of 2FD/ρbg(h2
1 − h22) with Fr1. The results tend to suggest a constant
coefficient in the choked regime. The r.m.s. lift coefficient is plotted in figure 6(d),and comparison with figure 6(a) shows that the r.m.s. lift force is at most 40 % ofthe drag force in the low-Froude-number regime and decreases significantly to lessthan 1 % of the drag force close to and at the choked regime. In the choked regime,there is a significant height difference between the upstream and downstream regions.The fraction of the wetted region on the downstream side of the square cylinder inthe choked regime is approximately 30 % of the upstream wetted area (see side-viewimages on the right in figure 3b,c). Since CD ≈ 4 in the choked regime, we would
Force acting on a square cylinder fixed in a free-surface channel flow 723
Flow direction
Flow direction
Flow direction
(b)
(c)
(a)
FIGURE 4. Photographs of the free-surface shape from an elevated side view for fixedwater depth (hI = 0.10 m), fixed obstacle width (b = 0.10 m) and increasing flow rates.The flow is from right to left. The images correspond to: (a) Fr1 = 0.13, Fr2 = 0.13;(b) Fr1 = 0.37, Fr2 = 0.46; (c) Fr1 = 0.42, Fr2 = 1.22.
estimate that CL,rms ≈ 0.3λCD, where λ= 0.8/2.5. This means that CL,rms is estimatedto be approximately 0.4. In fact, we find that CL,rms is 0.08–0.2 (see figure 5d), whichis much less than could be explained by the reduction in the wetted area. From theplan-view images on the left of figure 3(b,c), we see that the flow is acceleratingdownstream of the cylinder because the cross-sectional area of the water is decreasing.This generates a straining flow at the rear of the cylinder, which suppresses the usualvon Karman wake shedding by bringing together the two shear layers. The (turbulent)hydraulic jump forms in the near-wake region, and this is again likely to disrupt anyvortex shedding. The drag coefficient CD is determined from the low-Fr experimentsand is defined here as
CD = limFr1→0
2FD
ρbu21h1. (4.1)
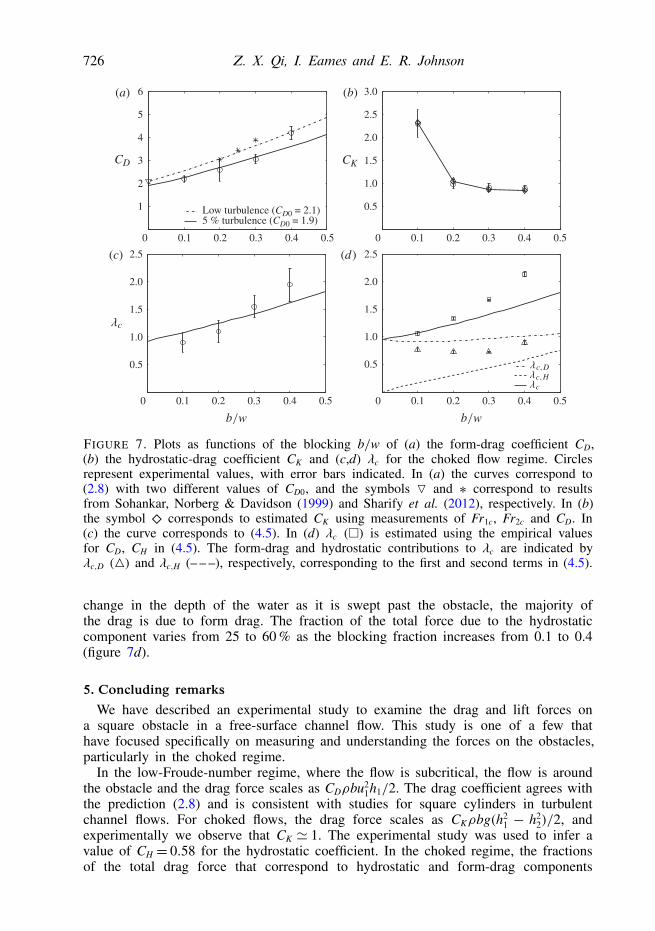
The variation of CD with blocking is shown in figure 7(a), along with the prediction(2.8) where CD0 = 1.9 corresponds to the drag on a square cylinder in an unblockedturbulent flow. The dashed curve corresponds to the prediction for a non-turbulentflow (CD0 = 2.1) and agrees with published three-dimensional large eddy simulation
724 Z. X. Qi, I. Eames and E. R. Johnson
(b)
0 10 20 30 0 10 20 30–1
0
1
2
3
4
5
6
–2
–1
0
1
2
3
4
CLCD
C
(a)
FIGURE 5. Time series of drag and lift coefficients (defined as C= 2F/ρbu12h1) plotted
for (a) subcritical flow, Fr1 = 0.13, and (b) choked flow, Fr1 = 0.45. Here b/w= 0.2 andthe initial water depth is hI = 0.10 m.
calculations. The hydrostatic coefficient, defined as
CK = limFr1→Fr1c
2FD
ρbg(h21 − h2
2), (4.2)
is plotted in figure 7(b). The results are consistent with the expectation that CK ≈ 1.In the choked regime, a portion of the force will be still derived from form drag, andso the empirical coefficient CH must be inferred. From (4.2), (2.7), (2.2b) and (2.3a),
CK =CDFr2/3
1c
Fr−4/31c − Fr−4/3
2c
+CHFr−4/3
1c − Fr−4/3dc
Fr−4/31c − Fr−4/3
2c
. (4.3)
The value of CH is estimated by using a least-relative-error fit between (4.3) andexperimental measurements, using empirical values for Fr1c and an estimate of Frdc,generating a value of CH = 0.58. Figure 7(b) shows a comparison between the CK
determined experimentally and the prediction given by (4.3).The problem with using (4.2) in a predictive setting is that it depends on
information both upstream and downstream of the obstacle. An alternative wayof bringing together the two force scalings can be identified from (2.3), giving riseto
FD = λρbg1/3u4/31 h4/3
1 , (4.4)
where
λ= 12
CDFr2/31 +
12
CH
(1
Fr4/31
− 1
Fr4/3d
). (4.5)
Figure 6(c) shows the collapse of λ onto one curve for the subcritical and chokedregimes. Focusing on the choked flow regime, λ = λc, the variation of λc withblocking is shown in figure 7(c), where the symbols correspond to the critical valueof λ in figure 6(c) for the choked regime. The curve in figure 7(c) corresponds to
Force acting on a square cylinder fixed in a free-surface channel flow 725
0.2 0.40 0.6 0.2 0.40 0.6
0.2 0.40 0.60.2 0.40 0.6
0.5
1.0
1.5
0.2
1.0
0.8
0.6
0.4
1
5
4
3
2
0.5
2.5
3.0
3.5
2.0
1.5
1.0
Subcritical
Subcritical Choked
Choked
Choked
Fr1 Fr1
Choked
Subcritical
Subcritical(a) (b)
(d)(c)
FIGURE 6. Force coefficients on the obstacle plotted as functions of Fr1, for b/w= 0.2:(a) drag force normalised as 2FD/ρbu2
1h1; (b) drag force normalised as 2FD/ρbg(h21− h2
2);(c) drag force normalised as FD/ρbg1/3u4/3
1 h4/31 ; (d) r.m.s. lift force 2FL,rms/ρbu2
1h1. Thesymbols correspond to hI = 0.08 (4), 0.10 (O), 0.12 (G), 0.14 (F), 0.16 (+) and0.18 (×) m; the colours correspond to Q = 0.013 (black), 0.026 (red), 0.039 (blue),0.052 (green) and 0.065 (yellow) m3 s−1. The points for the choked flow accumulateat Fr1 ' 0.43.
the prediction. For small blocking fractions, the critical upstream Froude number Fr1tends to 1, and λ is dominated by the first term in (4.5) so that λc =CD0/2.
Having chosen CH , λc can be estimated without recourse to force measurementsby using measurements of Fr1. Figure 7(d) plots the variation of λc with blocking,and this shows good agreement with λc derived from force measurements. Thepartition between hydrostatic and form-drag components cannot be measured butcan be inferred. The form and hydrostatic components can be identified as the firstand second terms on the right-hand side of (4.5). Figure 7(d) shows the variationof the hydrostatic (λc,H = CH(Fr−4/3
1c − Fr−4/3dc )/2) and form-drag (λc,D = CDFr2/3
1c /2)components with blocking. For low blocking fractions, the hydrostatic componentis negligible, but as the blocking fraction increases, the hydrostatic contributionincreases. Interestingly, the form-drag contribution is weakly affected by blocking.This is because while the drag coefficient increases with blocking (figure 7a), thereis an equivalent reduction with Fr1c, leading to a small change in the form-dragcontribution. Surprisingly, the results show that while we do observe a dramatic
726 Z. X. Qi, I. Eames and E. R. Johnson
0 0.1 0.2 0.3 0.4 0.5 0
0.5
1.0
1.5
2.0
2.5
0.5
1.0
1.5
2.0
2.5
3.0
1
2
3
4
5
6
0.5
1.0
1.5
2.0
2.5
0.1 0.2 0.3 0.4 0.5
0 0.1 0.2 0.3 0.4 0.50 0.1 0.2 0.3 0.4 0.5
Low turbulence (CD0 = 2.1)5 % turbulence (CD0 = 1.9)
CD CK
(a) (b)
(d)(c)
FIGURE 7. Plots as functions of the blocking b/w of (a) the form-drag coefficient CD,(b) the hydrostatic-drag coefficient CK and (c,d) λc for the choked flow regime. Circlesrepresent experimental values, with error bars indicated. In (a) the curves correspond to(2.8) with two different values of CD0, and the symbols O and ∗ correspond to resultsfrom Sohankar, Norberg & Davidson (1999) and Sharify et al. (2012), respectively. In (b)the symbol � corresponds to estimated CK using measurements of Fr1c, Fr2c and CD. In(c) the curve corresponds to (4.5). In (d) λc (�) is estimated using the empirical valuesfor CD, CH in (4.5). The form-drag and hydrostatic contributions to λc are indicated byλc,D (4) and λc,H (– – –), respectively, corresponding to the first and second terms in (4.5).
change in the depth of the water as it is swept past the obstacle, the majority ofthe drag is due to form drag. The fraction of the total force due to the hydrostaticcomponent varies from 25 to 60 % as the blocking fraction increases from 0.1 to 0.4(figure 7d).
5. Concluding remarksWe have described an experimental study to examine the drag and lift forces on
a square obstacle in a free-surface channel flow. This study is one of a few thathave focused specifically on measuring and understanding the forces on the obstacles,particularly in the choked regime.
In the low-Froude-number regime, where the flow is subcritical, the flow is aroundthe obstacle and the drag force scales as CDρbu2
1h1/2. The drag coefficient agrees withthe prediction (2.8) and is consistent with studies for square cylinders in turbulentchannel flows. For choked flows, the drag force scales as CKρbg(h2
1 − h22)/2, and
experimentally we observe that CK ' 1. The experimental study was used to infer avalue of CH = 0.58 for the hydrostatic coefficient. In the choked regime, the fractionsof the total drag force that correspond to hydrostatic and form-drag components

Force acting on a square cylinder fixed in a free-surface channel flow 727
were estimated. These results tend to show that the majority of the drag, even inthe choked regime, originates from form drag, with the hydrostatic drag forming afraction less than 60 % at high blocking fractions. In this regime, the total force canbe estimated from λρbg1/3u4/3
1 h4/31 using upstream measurements.
AcknowledgementsThe Erasmus Mundus External Cooperation Window Programme financed by the
European Commission is acknowledged. We thank Mr D. Mandal for designing theexperimental apparatus.
REFERENCES
AWBI, H. B. 1978 Wind-tunnel-wall constraint on two-dimensional rectangular-section prisms. J. Ind.Aerodyn. 3, 285–306.
AZINFAR, H. & KELLS, J. A. 2009 Flow resistance due to a single spur dike in an open channel.J. Hydraul. Res. 47, 755–763.
BENJAMIN, T. B. 1956 On the flow in channels when rigid obstacles are placed in the stream.J. Fluid Mech. 1, 227–248.
BETZ, A. 1925 A method for the direct determination of profile drag. Z. Flugtech. Motorluftschiffahrt16, 42–44 (in German).
BROCCHINI, M. & PEREGRINE, D. H. 2001 The dynamics of strong turbulence at free surfaces.Part 1. Description. J. Fluid Mech. 449, 225–254.
FENTON, J. D. 2003 The effects of obstacles on surface levels and boundary resistance inopen channels. In Proceedings of the 30th IAHR World Congress (Thessaloniki, Greece, 2003)(ed. J. Ganoulis & P. Prinos), vol. C2, pp. 9–16. Aristoteleio Panepistimio Thessalonikis.
FENTON, J. D. 2008 Obstacles in streams and their roles as hydraulic structures. In HydraulicStructures – Proceedings of the 2nd International Junior Researcher and Engineer Workshopon Hydraulic Structures (Pisa, Italy, 30 July–1 August 2008) (ed. S. Pagliara), pp. 15–22.Pisa University Press.
HENDERSON, F. M. 1966 Open Channel Flow. Macmillan.MASKEL, E. C. 1963 A theory of the blockage effects on bluff bodies and stalled wings in a closed
wind tunnel. Tech. Rep. Reports and Memoranda No. 3400, Aeronautical Research Council,London.
MASSEY, B. S. & WARD-SMITH, J. 1998 Mechanics of Fluids. Taylor & Francis.NAGLER, F. A. 1918 Obstruction of bridge piers to the flow of water. Trans. ASCE 82, 334–395.NICOLLE, A. & EAMES, I. 2011 Numerical study of flow through and around a circular array of
cylinders. J. Fluid Mech. 679, 1–31.RAJU, K. G. R., RANA, O. P. S., ASAWA, G. L. & PILLAI, A. S. N. 1983 Rational assessment of
blockage effect in channel flow past smooth circular cylinders. J. Hydraul. Res. 21, 289–302.SHARIFY, E. M., SAITO, H., TAIKAN, H., TAKAHASHI, S. & ARAI, N. 2012 Experimental and
numerical study of blockage effects on flow characteristics around a square-section cylinder.In ISEM-ACEM-SEM-7th ISEM Conference, Taipei, Taiwan.
SOHANKAR, A., NORBERG, C. & DAVIDSON, L. 1999 Large eddy simulation of flow past a squarecylinder. Trans. ASME J. Fluids Engng 122, 39–47.
TAMURA, T. & MIYAGI, T. 1999 The effect of turbulence on aerodynamic forces on a square cylinderwith various corner shapes. J. Wind Engng Ind. Aerodyn. 127, 657–662.
YARNELL, D. L. 1934a Pile trestles as channel obstructions. Tech. Rep. 429, US Department ofAgriculture, Washington.
YARNELL, D. L. 1934b Bridge piers as channel obstructions. Tech. Rep. 442, US Department ofAgriculture, Washington.