representation of climate in reanalyses: an
TRANSCRIPT

Representation of Climate in Reanalyses: An Intercomparison for Europe and North America
JAN D. KELLERa,b
AND SABRINA WAHLa,c
aHans-Ertel-Centre for Weather Research, Climate Monitoring and Diagnostics, GermanybDeutscher Wetterdienst, Offenbach, Germany
cUniversity of Bonn, Germany
(Manuscript received 31 July 2020, in final form 2 November 2020)
ABSTRACT: Atmospheric reanalysis datasets are a major tool to assess climate and its variability for past decades in a
broad spectrum of applications. Nowadays, global reanalysis systems are available in third- and fourth-generation versions.
They benefit from continuous improvements of numerical models and data assimilation schemes thus utilizing a growing
number of observing systems. In the past decade, global reanalyses have been complemented by several regional reanalyses
with enhanced horizontal resolution and appropriate model physics. Due to the considerable technical overhead associated
with the comparison of reanalyses, it is difficult for users to identify an optimal dataset for their needs. Therefore, this study
strives to provide a comprehensive intercomparison of the representation of climate in various reanalyses. The study
compares four global reanalyses and three regional reanalyses over Europe and North America with in situ observations.
The focus lies on the representation of near-surface temperature and precipitation expressed through various climate
indices. The comparison shows that performances of the different reanalyses vary considerably depending on the
parameter(s) of interest, the region, and the type of aggregation. The main findings are that regional reanalyses provide
added value especially with regard to precipitation. While ECMWF’s newest reanalysis ERA5 is in better agreement with
observations compared to the other global reanalyses for most climate indices over Europe, it is still outperformed by its
predecessorERA-Interim overNorthAmerica. To support users in identifying an appropriate reanalysis for their needs, the
study is complemented by comprehensive supplemental material.
KEYWORDS: Climate classification/regimes; Model comparison; Reanalysis data; Climate variability
1. Introduction
The major aim of reanalysis efforts is to generate the best
possible estimate of the atmospheric state given an observational
dataset and a numerical modeling system. In general, such a sys-
tem comprises a fixed state-of-the-art numerical weather predic-
tion (NWP) model (note that acronyms are expanded in the
appendix) and a corresponding data assimilation scheme (e.g.,
Kalnay et al. 1996). Compared to gridded observational datasets,
the procedure allows for generating a physically consistent spa-
tiotemporal reconstruction of the (atmospheric) system’s state.
Further, information from various observational sources can ef-
fectively be merged into the reanalysis. Through the use of the
physical NWP model, reanalyses also allow for estimates of
nonmeasurable quantities. Hence, reanalysis data considerably
improve the ability to investigate climate and its variability
compared to datasets created based solely on observational
data or model simulations (Trenberth et al. 2008).
Over the last two decades several generations of global at-
mospheric reanalyses have been produced by various
meteorological centers. The recent third generation includes
well-established datasets such as ERA-Interim (Dee et al.
2011), MERRA-2 (Gelaro et al. 2017), and JRA-55
(Kobayashi et al. 2015). Horizontal resolutions of global
reanalyses commonly lie between 100 and 200 km for the first-
and second-generation datasets, at or above 50 km for third-
generation reanalysesandat approximately 30kmforECMWF’snew
ERA5 (Hersbach et al. 2020), the first fourth-generation reanalysis.
With the increasing number of reanalyses, intercomparison
of the datasets has become more essential. In particular, users
depend on guidance in selecting a suitable dataset for their
respective application. In this regard, efforts such as theWCRP
Task Team on the Intercomparison of Reanalyses (TIRA) or the
SPARC Reanalysis Intercomparison Project (S-RIP; Fujiwara
et al. 2017) have emerged.
In general, there are three approaches to the evaluation and
comparison of reanalyses. The first is the intercomparison of
reanalyses among each other without using a reference dataset.
These studies aim at identifying similarities and differences
between the reanalyses in order to determine the uncertainty
in reanalysis estimates and identify outliers (e.g., Auger et al.
2018; Torralba et al. 2017;Martineau et al. 2018).Research using
this intercomparison method often focuses on parameters that
are not observed or are insufficiently observed (e.g., Trenberth
et al. 2011; Bosilovich et al. 2017; Boisvert et al. 2018).
Denotes content that is immediately available upon publica-
tion as open access.
Supplemental information related to this paper is available
at the Journals Online website: https://doi.org/10.1175/JCLI-D-20-
0609.s1.
Corresponding author: Jan D. Keller, [email protected]
This article is licensed under a Creative Commons
Attribution 4.0 license (http://creativecommons.org/
licenses/by/4.0/).
1 MARCH 2021 KELLER AND WAHL 1667
DOI: 10.1175/JCLI-D-20-0609.1
� 2021 American Meteorological SocietyUnauthenticated | Downloaded 02/22/22 10:01 PM UTC

The second approach employs gridded observational data-
sets, which have the advantage of a spatially continuous rep-
resentation of the parameter to be evaluated. Several recent
studies use such data as reference to compare reanalyses with
regard to specific parameters globally (e.g., Simmons et al.
2017; Sun et al. 2018) or for a certain region (e.g., Ghodichore
et al. 2018; Gupta et al. 2020; Krauskopf and Huth 2020). As
reanalyses use a grid representation, the comparison with
gridded observations seems in theory to be straightforward,
since both should reflect area averages. However, the area
average representation of gridded datasets strongly depends
on the density of observations (e.g., Prein and Gobiet 2017;
Zandler et al. 2019). Further, the interpolation may lead to
representation errors either in grid cells with and without ob-
servations (e.g., Kyselý and Plavcová 2010). To mitigate these
effects, the grid size of gridded observational data is often in-
creased enhancing the resolution error in the data (e.g.,
Willmott and Johnson 2005). Therefore, regional features and
spatial variability of a parameter are not reproduced on smaller
scales, as can for example be seen in Alexander et al. (2020).
Moreover, a gridded observation dataset is basically the result
of a statistical simulation employing certain assumptions on the
input data and its distribution. In contrast to model-based es-
timates, gridded datasets do not take into account dependen-
cies between different meteorological parameters.
The third approach uses point-based observations, which in
general exhibit a high quality with respect to errors in their
representation of the observed parameter. In comparison to
gridded observational datasets, local characteristics of the pa-
rameter in consideration are preserved. Recent intercompari-
sons of reanalyses with point-based data have been conducted
for various parameters, such as near-surface wind speed (Stopa
and Cheung 2014; Ramon et al. 2019), cloud cover (Free et al.
2016), snow depth (Wegmann et al. 2017; Orsolini et al. 2019),
temperature and precipitation (Lader et al. 2016; Diaconescu
et al. 2018; Sheridan et al. 2020), and surface solar radiation
(Slater 2016; Zhang et al. 2016).
All of the aforementioned studies focus on global rean-
alyses. However, the resolved scales and processes in the global
datasets do not necessarily allow for an assessment of regional
or local climate (e.g., Vidal et al. 2010) especially with regard to
complex topography or surface heterogeneity. In this respect,
regional reanalyses have been developed applying a limited
area model over specific regions. Due to their increased hori-
zontal resolution, it is expected that regional reanalyses are able
to better represent characteristics of local climate. The North
American Regional Reanalysis (NARR; North America at
35km; Mesinger et al. 2006) was the first such approach when
horizontal resolutions in global reanalyses were quite coarse
(.100 km). During the last decade, several new regional rean-
alyses at higher horizontal resolutions emerged for various re-
gions, including ASRv2 (Arctic at 15km; Bromwich et al. 2018),
COSMO-REA6 (Europe at 6 km; Bollmeyer et al. 2015),
HARMONIE (Europe at 11 km; Dahlgren et al. 2016), and
BARRA (Australia, New Zealand, and Southeast Asia at
12km; Su et al. 2019). The added value of regional reanalyses
has been shown especially for spatially heterogeneous parame-
ters such as precipitation (Bukovsky and Karoly 2007; Wahl
et al. 2017), near-surface and boundary layer wind speed
(Kaiser-Weiss et al. 2015; Moore et al. 2016; Frank et al. 2020),
temperature (Kaiser-Weiss et al. 2019; Scherrer 2020), or inte-
grated water vapor (Steinke et al. 2019). A shortcoming of the
aforementioned studies is that most of them evaluate the regional
reanalyses only against their respective forcing global reanalysis.
Further, the comparisons for regional reanalyses mostly focus on
general evaluation metrics and do not specifically take into ac-
count the representation of climate and its variability.
In summary, there are a number of open questions regarding
the intercomparison of reanalysis: 1) How do current rean-
alyses perform with respect to user-relevant aspects of local
climate and its variability? 2) Does ERA5 further increase the
quality of reanalysis estimates compared to its predecessor
ERA-Interim, which has often been one of the best performing
reanalyses in past intercomparisons? 3) Is there an added value
of regional reanalyses compared to various global products in
the representation of various aspects of local climate? Until
now, there has been no comprehensive intercomparison study
focused on the aforementioned issues especially with a focus
on local climate characteristics for continental regions.
In this regard, our study contributes a comprehensive eval-
uation and intercomparison of seven reanalysis systems (in-
cluding three regional reanalyses) using point-based station
observations in order to investigate the representation of local
climate and its variability. The intercomparison is performed
for two continents with sound observational data coverage
(Europe and North America) and two parameters relevant to
users (temperature and precipitation). Besides a general evalua-
tion with standard statistical tools, we provide a regional ranking
of the reanalyses that supports users in choosing a suitable dataset
for their specific needs.
The paper is organized as follows. Section 2 describes the
reanalysis datasets and verifying observations. Section 3 pro-
vides an overview of the intercomparison approach, the applied
ranking method, and the climate indices used in this study. The
results of the analysis are shown in section 4 and summarized
and discussed in section 5. Section 6 provides concluding re-
marks on the results. Comprehensive supplemental material
containing tables andmaps complements the study and provides
useful insights and guidance for users of reanalysis datasets.
2. Data
a. Reanalysis data
For the intercomparison in this study, we use data from four
global reanalyses, two European regional reanalyses, and one
North American regional reanalysis for the investigation pe-
riod from 1995 to 2018, which corresponds to the period of the
shortest available reanalysis dataset. The datasets used in the
study are described in the following subsections and in Table 1.
Information about data sources can be found in the data
availability statement at the end of the article.
1) ERA-INTERIM
The global reanalysis ERA-Interim (Dee et al. 2011) was de-
veloped and produced at the European Centre forMedium-Range
1668 JOURNAL OF CL IMATE VOLUME 34
Unauthenticated | Downloaded 02/22/22 10:01 PM UTC

Weather Forecasts (ECMWF). It utilizes ECMWF’s atmo-
spheric model IFS (version cy31r2) in combination with a
four-dimensional variational data assimilation system (4D-
Var). ERA-Interim’s original representation is spectral, but it
translates to a horizontal grid size of about 70–80 km in the
midlatitudes. Although it was thought to be an intermediate
version between the ERA-40 reanalysis and ECMWF’s latest
reanalysis installment (ERA5), it became immensely popular
with several tens of thousands of users worldwide (Hersbach
et al. 2019) due to its quality in representing the atmospheric
state. The dataset is available from 1979 to mid-2019.
2) ERA5
ERA5 is the new global reanalysis product of ECMWF. It is
based on a more current version of ECMWF’s atmospheric
model (cy41r2) with a hybrid incremental 4D-Var system and
is the successor of ERA-Interim. It contains a deterministic
realization at 31 km horizontal resolution and is the first
ECMWF reanalysis to also provide an ensemble (10 members)
albeit at a reduced resolution. Once completed, the ERA5
reanalysis will cover the time period from 1950 onward. Details
about the ERA5 implementation as well as improvements and
differences with respect to ERA-Interim can be found in
Hersbach et al. (2020).
3) MERRA-2
The Modern-Era Retrospective Analysis for Research and
Applications, version 2 (MERRA-2; Gelaro et al. 2017) is
NASA’s current reanalysis, which serves as a replacement of
the first version of MERRA. MERRA-2 is produced with the
Goddard Earth Observing System (GEOS) model and a three-
dimensional variational data assimilation (3D-Var) scheme.
As a distinct feature, it is the only current global reanalysis to
assimilate atmospheric aerosols. It has amidlatitude horizontal
resolution of approximately 50 km and is available for periods
from 1980 onward. MERRA-2 provides observations-corrected
precipitation fields (Reichle et al. 2017), which are used in this
study. The correction is based on a merged satellite–gauge
precipitation product (CPCU; Chen et al. 2008) with a full cor-
rection for latitudes below 42.58, a linear tapering between
CPCU and the MERRA-2 model precipitation between 42.58and 62.58, and no correction for latitudes at 62.58 and higher.
4) JRA-55
The JRA-55 reanalysis dataset is produced by the Japanese
55-Year Reanalysis project carried out by the Japan
Meteorological Agency (JMA). It is a global reanalysis based
on the JMA global spectral model (GSM) and uses a 4D-Var
assimilation system, implemented as a follow up to the JRA-25
reanalysis (Kobayashi et al. 2015; Harada et al. 2016). JRA-55
provides reanalyzed data for a long time period starting in 1958
at an approximate horizontal resolution of 55 km for the
midlatitudes.
5) COSMO-REA6
Recently, regional reanalysis datasets for Europe have be-
come available. These include the COSMO-REA6 reanalysis
(Bollmeyer et al. 2015), which was developed by the Climate
Monitoring and Diagnostics group of the Hans-Ertel-Centre
for Weather Research (HErZ). The reanalysis is produced
using the limited area model COSMO at a horizontal grid
resolution of 6.2 km on the EURO-CORDEX-11 domain
forced at the lateral boundaries by ERA-Interim. It uses a
continuous nudging scheme allowing only for a straightforward
inclusion of prognostic variables, and thus observational data
are restricted to conventional observations. The nudging
scheme is complemented by separate soil moisture, sea surface
temperature, and snow analysis modules. The COSMO-REA6
dataset is available from 1995 tomid-2019 and is an operational
climate monitoring product at the Deutscher Wetterdienst
(DWD; German Meteorological Service) with a new version
currently under development.
6) HARMONIE
The HARMONIE regional reanalysis system was devel-
oped at the SwedishMeteorological andHydrological Institute
(SMHI) in the framework of the EU FP7-funded project
UERRA.1 The system is based on the HARMONIE NWP
setup (system cycle 38h1.1) with the ALADIN physics scheme
(Dahlgren et al. 2016). It applies a 3D-Var data assimilation
scheme on its 11-km European model grid with data being
available since 1961. Between 1961 and 2001, the reanalysis is
based on the observational dataset of ECMWF’s ERA-40 re-
analysis complemented by Swedish and French data. After
2001, the system used available operational conventional ob-
servations. Lateral boundary conditions are obtained from
ERA-40 for the years 1961–79, and from ERA-Interim after
1979. While this may have a considerable impact on the con-
sistency of the dataset as a whole, it does not affect our period
under investigation.
TABLE 1. Details of reanalysis datasets used in this study.
ERA-Interim ERA5 MERRA-2 JRA-55 COSMO-REA6 HARMONIE NARR
Institution ECMWF ECMWF NASA JMA DWD SMHI NCEP
Period 1979–2019 1980–present 1980–present 1978–present 1995–2019 1961–2019 1979–2019
Output 6 h 1 h 1 h 6 h 1 h 6 h 3 h
Assimilation scheme 4D-Var 4D-Var 3D-Var-FGAT 4D-Var Nudging 3D-Var 3D-Var
Grid spacing 0.758 0.38 0.58 3 0.6258 0.6258 0.0558 0.18 0.38Levels 60 137 72 60 40 65 60
1 See UERRA D2.7 available from www.uerra.eu.
1 MARCH 2021 KELLER AND WAHL 1669
Unauthenticated | Downloaded 02/22/22 10:01 PM UTC

7) NORTH AMERICAN REGIONAL REANALYSIS
The North American Regional Reanalysis (NARR;
Mesinger et al. 2006) developed by the National Centers for
Environmental Prediction (NCEP) is the first ever produced
regional reanalysis dataset. The reanalysis system is based on a
2003 version of the Eta Model Data Assimilation System
(EDAS) based on 3D-VAR at a horizontal grid size of 32 km
with boundary data being provided by the NCEP–DOE
Reanalysis (R2). In addition to conventional observations, the
data assimilation scheme is supplied with various other ob-
servational data such as cloud drift winds from satellites, lake
surface temperatures and ice data, snow cover, and hourly
precipitation products. The data are available from 1979 on
and are still continued to the near present.
b. Observations
As a reference for the quality of the reanalysis estimates, we
calculate climate indices for a large number of observation sites
providing daily measurements. These are obtained from the
European Climate Assessment and Dataset (ECA&D; e.g.,
Klein Tank et al. 2002) database for Europe as well as the
Global Historical Climatology Network, version 4 (GHCNv4;
Menne et al. 2018) for North America.
All reanalyses assimilate a large amount of atmospheric
observations. The global reanalysis systems comprise many
observational datasets including multiple satellite platforms.
COSMO-REA6 and HARMONIE only employ conventional
observations (SYNOP, ship, buoy, airplane, balloon, radio-
sonde, etc.) in their data assimilation schemes. In contrast,
NARR is the only regional reanalysis that also includes satel-
lite observations.
However, the reanalysis estimates are not completely inde-
pendent from verifying observations. All reanalysis systems
except MERRA-2 use 2-m temperature observations in some
form in their data assimilation. Rain gauge observations
are independent for COSMO-REA6, HARMONIE, ERA-
Interim, and JRA-55, as well as for ERA5 over Europe. The
NARR assimilates precipitation over the continental United
States, Mexico, and Canada via a gridded analysis of rain gauge
observations. Since mid-2009 ERA5 assimilates the NCEP
Stage IV precipitation product, which is a combination of
radar and station observations, over the United States. The
precipitation-corrected fields of MERRA-2 are based mainly
on the CPCU product [see section 2a(3)] over both Europe and
North America.
3. Methodology
In this section, we describe our approach to compare the
various reanalysis datasets with the observations with respect
to the representation of climate.
a. Intercomparison approach
First, we build daily precipitation and minimum and maxi-
mum temperature time series from each reanalysis corre-
sponding to each of the observation locations. In this respect,
we employ a straightforward nearest neighbor approach (i.e.,
for every observation site, we take the value of the reanalysis
grid box in which the site is located). For the temperature data,
we intentionally did not include a height correction from re-
analysis orography to the station height as we do not expect
that a majority of users, especially from nonscientific applica-
tions, would go to such lengths but merely take the data as is.
Further, for precipitation such a correction would not be trivial
in any case due to the highly nonlinear processes involved.
While reanalyses always provide complete time series, the
observational data exhibit gaps andmissing values. To ensure a
sound analysis, we only use stations that provide annual time
series with more than 360 daily observations for at least 15 of
the 24 years in the comparison period.
From each of the reanalysis and observational time series,
we calculate annual values for selected climate indices (cf.
section 3c). Then, we employ two standard metrics, namely
bias and correlation, to evaluate the performance of the re-
analyses at the observation locations. Specifically, the bias at a
single location is calculated for each climate index as
bias5CIREA
2CIOBS
, (1)
where CIREA and CIOBS are the average value of a climate
index calculated from the reanalysis and observational data,
respectively. The correlation for each location is calculated as
the Pearson correlation coefficient
correlation5cov(CI
REACI
OBS)
sCIREA
sCIOBS
, (2)
with cov(.) denoting the covariance and s the standard devi-
ations of the respective annual climate index time series.
b. Ranking
To compare the performance of the reanalysis datasets for
the various stations, we employ a ranking on the reanalyses for
each station and climate index. This ranking takes into account
that the value of a metric at a station may differ numerically
between reanalyses but that these differences are probably not
statistically significant. The specific steps in order to obtain the
ranking for a certain climate index are the following:
1) Calculate the best reanalysis REA1 (with the smallest bias
or the largest correlation) at each station location.
2) Perform a t test for REA1 with every other reanalysis
measuring whether the average (expected) value of the metric
differs significantly across the two samples (reanalyses).
3) Assign the first rank for this climate index, station, and
metric to REA1 and all other reanalyses rejecting the t-test
hypothesis at the 1% significance level.
Due to the fact that multiple reanalyses can occupy the first
rank, the sum over all reanalyses for a certain rank may well
exceed 100%.
c. Climate indices
Climate indices are an essential tool to describe andmonitor
the state of the climate system. In this regard, theWMOExpert
Team on Climate Change Detection and Indices (ETCCDI)
1670 JOURNAL OF CL IMATE VOLUME 34
Unauthenticated | Downloaded 02/22/22 10:01 PM UTC

has defined a core set of 27 indices based on daily temperature
and precipitation which describe frequency, amplitude, and
persistence of certain climatic characteristics (Klein Tank
et al. 2009).
In our intercomparison approach estimates of climate indices
are derived from the reanalyses and compared to those calcu-
lated with observation time series. To allow for the inclusion of
various aspects, a set of different climate indices for temperature
and precipitation is employed and described in the following.
1) WARM AND COLD TEMPERATURE
d SD—Summer days: The number of days in a year with the
daily maximum temperature exceeding 258C.d HD—Hot days: The number of days in a year with the daily
maximum temperature exceeding 308C.d TR—Tropical nights: The number of days in a year with the
daily minimum temperature not being below 208C.d FD—Frost days: The number of days in a year with the daily
minimum temperature being below 08C.d ID—Ice days: The number of days in a year with the daily
maximum temperature not exceeding 08C.
2) PRECIPITATION AND ARIDITY
d RX1D—Maximum 1-day precipitation: The annual maxi-
mum of one-day precipitation.d RX5D—Maximum 5-day precipitation: The annual maxi-
mum of aggregated precipitation for five consecutive days.d CDD—Maximum length of dry spell: Themaximum number
of consecutive days in a year with precipitation below 1 mm.d CWD—Maximum length of wet spell: The maximum num-
ber of consecutive days in a year with precipitation above or
equal to 1 mm.
3) HEAT AND COLD WAVE INDEX
More complex indices describing extreme temperature
anomalies (i.e., heat or cold waves) are given by Lavaysse et al.
(2018). The indices are based on daily maximumTmax and daily
minimum temperature Tmin. Heat waves are identified as pe-
riods where the daily maximum and minimum temperature
exceed Tq90max and T
q90min on at least three consecutive days in the
extended Northern Hemisphere summer (April–September).
In the same way, cold waves are defined with daily maximum
and minimum temperature being below Tq10max and T
q10min in the
extended Northern Hemisphere winter (October–March).
Following Lavaysse et al. two heat (cold) waves are merged
into one if they are separated by just one day. The reference
thresholds are defined as the climatological 90% and 10%
quantiles determined for each location and each day of the year
separately using an 11-day window centered around the cal-
endar date in consideration. The climatological dataset used
for these calculations is taken from historic observations in the
time period before 1995 requiring aminimumof at least 110 (or
10 years) observations in the window.
With this definition, we obtain the two following indices:
d HWI—Heat wave days: Total number of days in a year
where a heat wave is detected.
d CWI—Cold wave days: Total number of days in a year
where a cold wave is detected.
4) STANDARDIZED PRECIPITATION INDEX
In addition to the other indices for precipitation, we also
apply the more complex standardized precipitation index (SPI;
McKee et al. 1993), which is designed to indicate periods with
drier or wetter conditions compared to climatology and is a
tool often employed to detect droughts. Following Guttman
(1999), the SPI is calculated at each station by
1) determining the empirical distribution function (ECDF) as
reference for a specific time scale (e.g., annual, seasonal)
from long-term historic records of precipitation,
2) transforming the obtained ECDF into a standard normal
distribution,
3) finding the corresponding ECDF value for the accumulated
precipitation in each year, and
4) assigning these values their respective standard normal
transformed values as the SPI.
The SPI is given in terms of standard deviations of observed
precipitation with respect to the climatological mean. Positive
(negative) SPI values indicate wetter (drier) conditions com-
pared to climatology at the respective location for a given time
scale. In this study, the analysis is focused on summer, winter,
and annual precipitation amounts. To obtain a reasonable
climatological reference, the respective ECDFs are estimated
from the available historic observations at each station with at
least 30 years of complete data for the respective time scale
(including the evaluation period).
4. Results
The climate indices derived from the reanalyses are com-
pared to the indices calculated with the observation time series.
Note that the number of stations for evaluation also varies with
the climate index in consideration, as indices such as hot days
or ice days cannot be observed in the far north or south, re-
spectively, of the domains.
The following subsections depict the results of the inter-
comparison and outline their main characteristics from an
overall (section 4a) as well as spatially differentiated (section 4b)
point of view. Section 5 then summarizes and discusses the key
findings.
a. Overall agreement of reanalyses and observations
To provide an overview of the performance of the reanalyses
with respect to climate, we calculate the metrics bias and corre-
lation at each station location for all climate indices and reanalyses
as described in section 3a. The results are presented as box plots in
Figs. 1, 2, 5, and 6. The box represents the interquartile range with
the horizontal line depicting the median, whereas the whiskers
denote the respective 10th and 90th percentile.
1) TEMPERATURE-BASED INDICES
Figure 1 shows box plots over all European stations for each
reanalysis with respect to bias (upper plot) and correlation
1 MARCH 2021 KELLER AND WAHL 1671
Unauthenticated | Downloaded 02/22/22 10:01 PM UTC

(lower plot) of the temperature-based indices. Negative sys-
tematic biases can be found with all reanalyses except
HARMONIE for summer days (SD) and hot days (HD) and
also for most stations for the heat wave index (HWI), while
positive biases prevail for ice days (ID). In general, large var-
iations of the reanalysis estimates can be found between the
different reanalyses for the same index. Further, the spread of
bias among the stations for each reanalysis also varies consid-
erably. For example, the median of COSMO-REA6 bias for
HWI is 21 with an interquartile range of about 64 days. In
contrast, the HARMONIE reanalysis exhibits a significant
cold bias with amedian of26 but with an interquartile range of
only about 62 days. For the correlation (lower plot in Fig. 1),
we also find large variations over stations for each reanalysis
but also among the different reanalyses. For tropical nights
(TR) all reanalyses have a large interquartile range of about
0.35 with the 10th percentile going down close to correlations
of 0.2. High correlations can especially be found for ID with
interquartile values above 0.9 for most reanalyses. Considerably
lower correlations compared to the other reanalyses can be seen
with SD, HD, and the cold wave index (CWI) for JRA-55 and
with HWI, ID, and to some extent frost days (FD) for
MERRA-2.
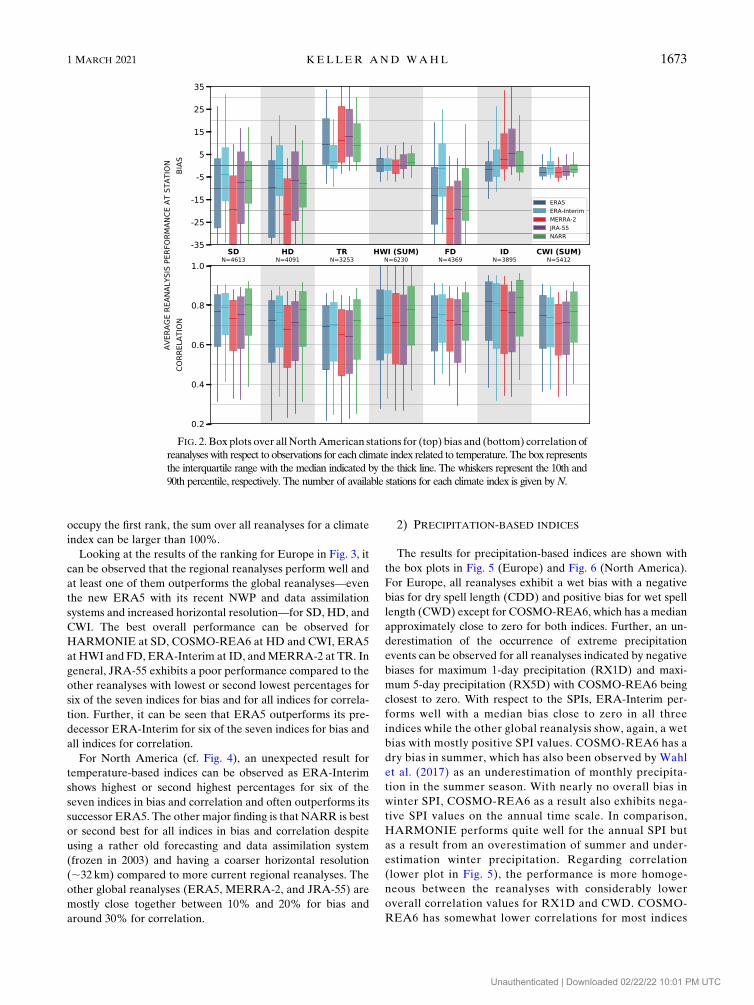
Results for temperature indices over North America are
shown in Fig. 2 (please note larger y-axis limits compared to
Fig. 1). Here, mostly negative biases occur with SD, HD, FD,
and CWI and positive biases for TRwhile for HWI, themedian
bias of all reanalyses is close to zero. While variations are quite
large among stations, a close to 0 median can be found with
ERA-Interim for most and with NARR for some indices. With
respect to the correlation of the temperature-based climate
indices over North America (lower plot in Fig. 2), large vari-
ations over the stations can be observed for each reanalysis
with slightly higher correlations for NARR compared to the
global reanalyses. In contrast to Europe, the correlations are
more homogeneous over the reanalyses for North America but
exhibit larger interquartile ranges over stations of about 0.25–
0.3 for all indices. However, the correlation values are in
general lower for North America (except for TR) with median
correlations being mostly below 0.8 while the median is gen-
erally above 0.8 for most indices and reanalyses over Europe.
It is rather difficult to draw useful conclusions for specific
applications from the results shown above. Therefore, we now
address the major question for reanalysis users: Which re-
analysis best represents the parameter(s) of interest?
Therefore, we employ the ranking described in section 3b for
each climate index, metric, and station. Figures 3 and 4 indicate
how often a reanalysis performs best (i.e., populates the first
rank) for each of the temperature-based climate indices.
Specifically, the plots show for each reanalysis the percentage
of stations where it obtains the first rank for bias (top) and
correlation (bottom). Hence, longer colored bars indicate a
better performance in the respective reanalysis–climate index
combination. Due to the fact that multiple reanalyses can
FIG. 1. Box plots over all European stations for (top) bias and (bottom) correlation of
reanalyses with respect to observations for each climate index related to temperature. The
box represents the interquartile range with the median indicated by the thick line. The
whiskers represent the 10th and 90th percentile, respectively. The number of available sta-
tions for each climate index is given by N.
1672 JOURNAL OF CL IMATE VOLUME 34
Unauthenticated | Downloaded 02/22/22 10:01 PM UTC
occupy the first rank, the sum over all reanalyses for a climate
index can be larger than 100%.
Looking at the results of the ranking for Europe in Fig. 3, it
can be observed that the regional reanalyses perform well and
at least one of them outperforms the global reanalyses—even
the new ERA5 with its recent NWP and data assimilation
systems and increased horizontal resolution—for SD, HD, and
CWI. The best overall performance can be observed for
HARMONIE at SD, COSMO-REA6 at HD and CWI, ERA5
at HWI and FD, ERA-Interim at ID, andMERRA-2 at TR. In
general, JRA-55 exhibits a poor performance compared to the
other reanalyses with lowest or second lowest percentages for
six of the seven indices for bias and for all indices for correla-
tion. Further, it can be seen that ERA5 outperforms its pre-
decessor ERA-Interim for six of the seven indices for bias and
all indices for correlation.
For North America (cf. Fig. 4), an unexpected result for
temperature-based indices can be observed as ERA-Interim
shows highest or second highest percentages for six of the
seven indices in bias and correlation and often outperforms its
successor ERA5. The other major finding is that NARR is best
or second best for all indices in bias and correlation despite
using a rather old forecasting and data assimilation system
(frozen in 2003) and having a coarser horizontal resolution
(;32 km) compared to more current regional reanalyses. The
other global reanalyses (ERA5, MERRA-2, and JRA-55) are
mostly close together between 10% and 20% for bias and
around 30% for correlation.
2) PRECIPITATION-BASED INDICES
The results for precipitation-based indices are shown with
the box plots in Fig. 5 (Europe) and Fig. 6 (North America).
For Europe, all reanalyses exhibit a wet bias with a negative
bias for dry spell length (CDD) and positive bias for wet spell
length (CWD) except for COSMO-REA6, which has a median
approximately close to zero for both indices. Further, an un-
derestimation of the occurrence of extreme precipitation
events can be observed for all reanalyses indicated by negative
biases for maximum 1-day precipitation (RX1D) and maxi-
mum 5-day precipitation (RX5D) with COSMO-REA6 being
closest to zero. With respect to the SPIs, ERA-Interim per-
forms well with a median bias close to zero in all three
indices while the other global reanalysis show, again, a wet
bias with mostly positive SPI values. COSMO-REA6 has a
dry bias in summer, which has also been observed by Wahl
et al. (2017) as an underestimation of monthly precipita-
tion in the summer season. With nearly no overall bias in
winter SPI, COSMO-REA6 as a result also exhibits nega-
tive SPI values on the annual time scale. In comparison,
HARMONIE performs quite well for the annual SPI but
as a result from an overestimation of summer and under-
estimation winter precipitation. Regarding correlation
(lower plot in Fig. 5), the performance is more homoge-
neous between the reanalyses with considerably lower
overall correlation values for RX1D and CWD. COSMO-
REA6 has somewhat lower correlations for most indices
FIG. 2. Box plots over all NorthAmerican stations for (top) bias and (bottom) correlation of
reanalyses with respect to observations for each climate index related to temperature. The box represents
the interquartile range with the median indicated by the thick line. The whiskers represent the 10th and
90th percentile, respectively. The number of available stations for each climate index is given byN.
1 MARCH 2021 KELLER AND WAHL 1673
Unauthenticated | Downloaded 02/22/22 10:01 PM UTC

compared to the other reanalyses, which may be a result of
the double penalty problem (cf. section 5c).
The results for North America as shown in Fig. 6 indicate
similar systematic biases (negative values for CDD, positive
values for CWD) for the reanalyses compared to Europe but
with larger variability among stations and a stronger underes-
timation of extreme precipitation events in RX1D and RX5D
(please note the different y-axis range compared to Fig. 5). In
terms of bias median over all stations, NARR is closest to zero
for RX1D, RX5D, and CWD while JRA-55 exhibits a very
FIG. 3. Percentage of European stations where each reanalysis is in the significantly in-
dependent top rank (with respect to a significance level of 1%) of (top) lowest bias and
(bottom) highest correlation for each climate index related to temperature.
FIG. 4. Percentage of North American stations where each reanalysis is in the significantly
independent top rank (with respect to a significance level of 1%) of (top) lowest bias and
(bottom) highest correlation for each climate index related to temperature.
1674 JOURNAL OF CL IMATE VOLUME 34
Unauthenticated | Downloaded 02/22/22 10:01 PM UTC

good performance for CDD. With respect to SPI, which eval-
uates aggregated long-term precipitation, MERRA-2 shows
very good overall performances, while JRA-55 (NARR) gen-
erally overestimates (underestimates) annual and seasonal
precipitation. ERA5 performs well in terms of bias for annual
SPI, but this performance comes as a result of an overestima-
tion (underestimation) of precipitation in winter (summer).
ERA-Interim underestimates annual precipitation as a con-
sequence of an underestimation in summer precipitation.
Correlations (lower plot of Fig. 6) are slightly lower compared
to the European stations with JRA-55 showing highest corre-
lations for RX1D, RX5D, and CDD while NARR performs
best for CWD and the SPI-based indices.
Turning again to the ranking of reanalyses at each station as
described for the temperature-based indices in the previous
subsection, results for the percentages of the first rank for
precipitation-based indices are shown in Fig. 7 for Europe and
Fig. 8 for North America.
For Europe, it can be found that the regional reanalyses
(especially COSMO-REA6) outperform the global reanalyses
for all indices except summer SPI for bias and RX5D, annual
SPI, and summer SPI for correlation. While the results are
more evenly distributed over the reanalyses for correlation,
there is much more variation in the performance of the rean-
alyses between the indices for bias. Here, each reanalysis has
the highest or second highest percentage for at least one index.
COSMO-REA6 shows the highest percentages in bias for five
indices and leads with a large margin for the indices RX1D,
CDD, and CWD, where it also exhibits the highest percentages
in correlation. HARMONIE and COSMO-REA6 are close
together for bias of the SPI-based indices with being the best
reanalyses for annual and winter SPI. Overall, ERA5 is per-
forming well for correlations having highest or second highest
percentages for five of the seven indices.
For North America, NARR is outperforming the global
reanalyses similar to the temperature-based indices having the
highest or second highest percentages of first rank for all in-
dices but CDD. In this index, JRA-55 clearly outperforms the
other reanalyses, which is in correspondencewith its significantly
smaller bias for CDD shown in Fig. 6. Further, MERRA-2
shows a good performance with respect to the longer-term-
based SPI indices for bias and correlation. ERA-Interim out-
performs its successor ERA5 at the three indices RX1D, RX5D,
and CDD while ERA5 has higher bias and correlation per-
centages for the SPI indices.
b. Spatial agreement of reanalyses and observations
While the previous evaluations focus on an aggregated
evaluation over all stations of a continent, this section aims at
indicating the spatial distribution of climate representation in
reanalyses. To that end, we split the stations into a set of 93
regions for Europe and 95 regions for North American.
For Europe, these regions are taken from European Union
NUTS-1 level definitions2 based on socioeconomic features
and are complemented by country level regions for non-EU
countries. However, due to the availability of data, the number
FIG. 5. As in Fig. 1, but for climate indices related to precipitation over Europe. For better
readability, the upper plot is split in two with RX1D, RX5D, CDD, and CWDon the left (left
axis ticks; dimensions are mm and days) and with SPI-related indices on the right (right axis
ticks; dimension is standard deviations).
2 Nomenclature des unités territoriales statistiques; https://ec.
europa.eu/eurostat/web/nuts/background.
1 MARCH 2021 KELLER AND WAHL 1675
Unauthenticated | Downloaded 02/22/22 10:01 PM UTC

of stations varies considerably among the regions and climate
indices. For Europe, the number of stations per region ranges
between 1 and 191 for temperature-based and between 1 and
1091 for precipitation-based indices. For North America, the
regions are obtained as the federal states for the United States
andMexico and the provinces and territories for Canada. Here,
the number of stations per region lies between 1 and 466 for
temperature-based and between 1 and 383 for precipitation-
based indices. Details on the number of stations per region can
be found in Tables S1–S28 in the online supplemental material.
To illustrate the spatial heterogeneity of the performance of
the reanalyses, exemplary maps indicating the best-performing
reanalysis in each region for bias and correlation of HD and
RX5D can be found in Figs. 9–16. The performance is esti-
mated using the same ranking as introduced before; that is, for
each reanalysis, the average rank over all stations in a region is
calculated for bias as well as correlation. A reanalysis is per-
forming best if it exhibits the lowest average rank over all sta-
tions within a region. Maps and comprehensive tables with
results for all indices can be found in the supplemental material.
Figure 9 shows the best ranking reanalyses of HD bias for
European regions where two reanalyses with the same average
rank are indicated by a hatched shading. COSMO-REA6 is
the best reanalysis in most regions with MERRA-2 and
HARMONIE exhibiting the best average rank for the rest.
For the HD correlation (cf. Fig. 10), the large majority of
regions goes either for ERA5 (mainly eastern Europe) or
COSMO-REA6 (mainly western Europe). The best per-
formance for the remaining regions are divided between
MERRA-2 (6 regions), HARMONIE (6 regions), and
ERA-Interim (3 regions).
For North America, the HD ranking is shown in Figs. 11 and
12. Mainly two reanalyses, NARR and ERA-Interim, domi-
nate the best average rank among regions. NARR performs
best for bias along the Pacific coast, the northwestern regions,
northeastern Canada, and southern Mexico whereas ERA-
Interim is superior along the U.S. Atlantic, in the central south
United States intoMexico, and some states in theU.S.Midwest
and central Canada. For the other regions, JRA-55 shows the best
performance of the reanalyses for some states along theU.S. Gulf
Coast and around Lake Michigan, with ERA5 (4 regions) and
MERRA-2 (2 regions) claiming the remaining regions.
The results are somewhat flipped for HD correlation (cf.
Fig. 12) as ERA-Interim performs best along the central and
southern Pacific coast and parts of the northwestern regions
while NARR is on average the best reanalysis from the central
south United States over the Midwest into the Great Lakes
region. Here, no pattern emerges for the remaining regions as
they are split up between JRA-55 (6 regions), ERA5 (5 re-
gions), and MERRA-2 (2 regions).
Looking at the bias of RX5D over Europe (Fig. 13),
COSMO-REA6 performs best in a majority of regions in-
cluding Scandinavia, being outperformed by JRA-55 in the
northern German states and parts of eastern Europe, while
ERA5 performs best over the Iberian Peninsula, western
England andWales, and several regions in central Europe. For
the correlation of RX5D (cf. Fig. 14), COSMO-REA6 has the
best rank only in three regions, whereas ERA5 (Scandinavia
FIG. 6. As in Fig. 2, but for climate indices related to precipitation over NorthAmerica. For
better readability, the upper plot is split in two with RX1D, RX5D, CDD, and CWD on the
left (left axis ticks; dimensions are mm and days) and with SPI-related indices on the right
(right axis ticks; dimension is standard deviations).
1676 JOURNAL OF CL IMATE VOLUME 34
Unauthenticated | Downloaded 02/22/22 10:01 PM UTC

and central Europe) and MERRA-2 (southern and eastern
Europe) exhibit an overall better performance compared to
the other reanalyses.
For North America, it is difficult to point out a clear winner
with regard to bias of RX5D (Fig. 15). The best average rank in
regions is mostly split up between ERA-Interim and NARR
followed by MERRA-2. Best performances can be found for
ERA-Interim along the U.S. Gulf Coast and most of the
Atlantic coast and the northwestern part of Canada, for NARR
in the U.S. Pacific coast and to the northern central United
States as well as to the north and the east of the Great Lakes,
and for MERRA-2 from the Mexican Pacific coast northeast-
ward into the central United States as well as in northern
Canada. ERA5 and JRA-55 perform best for four distinct re-
gions each. A very different pattern emerges for RX5D cor-
relation shown in Fig. 16 as JRA-55 performs best over the
continental United States as well as a few regions in Mexico
and Canada. There is no obvious reason for the good perfor-
mance over the United States with respect to the utilized ob-
serving systems but it might be based on the quality of the
forecast model used for JRA-55 in representing extreme pre-
cipitation (S. Kobayashi 2020, personal communication). In the
other regions, the best average rank is often taken by ERA-
Interim (Mexico and parts of Canada), NARR (western
Canada and Alaska), and MERRA-2 (northeastern Canada).
5. Summary: Intercomparison
In this section, we summarize the key findings of the inter-
comparison in three categories: (i) intercomparison of global
reanalyses, (ii) improvement of ERA5 over ERA-Interim, and
(iii) added value of regional reanalyses in Europe and North
America.
a. Global reanalyses intercomparison
With respect to a general intercomparison of the global
reanalyses over the European continent, ERA5 shows the best
correlation for all temperature-based indices. In terms of bias,
ERA5 is only outperformed by MERRA-2 among global
reanalyses for indices related to warm temperatures (SD, HD,
TR) and by ERA-Interim for ID. However, the best perfor-
mance for precipitation-based indices over Europe varies be-
tween the four global datasets. Each system performs best
among global reanalyses for at least one index either in terms
of bias or correlation.
For North America, ERA-Interim is superior over the other
global systems for nearly all temperature-based indices, and is
only outperformed by ERA5 for ID. With regard to precipi-
tation, the results are again quite diverse: In terms of bias,
ERA-Interim performs best for extreme precipitation (RX1D,
RX5D), JRA-55 for CDD and CWD, andMERRA-2 for long-
term aggregated precipitation (SPI). For correlation, the best
performance among global reanalyses is split between JRA-55
(RX1D, RX5D, CDD, CWD) and MERRA-2 (SPI). In North
America, ERA5 never performs best for precipitation indices
either in terms of bias or correlation.
b. ERA5 and ERA-Interim
With ERA5, ECMWF released the first fourth-generation
global reanalysis dataset, which was expected to outperform its
FIG. 7. Percentage of European stations where each reanalysis is in the significantly in-
dependent top rank (with respect to a significance level of 1%) of (top) lowest bias and
(bottom) highest correlation for each climate index related to precipitation.
1 MARCH 2021 KELLER AND WAHL 1677
Unauthenticated | Downloaded 02/22/22 10:01 PM UTC

predecessor ERA-Interim. ERA5 was therefore highly antic-
ipated as ERA-Interim has been quite popular among a broad
range of users. Over the European continent, the results
indicate a clear improvement in performance of ERA5 in
representing climate for nearly all temperature-based indices
in both bias and correlation. Only for ID ERA-Interim has a
smaller bias and performs better than all other reanalyses,
which points to daily maximum temperatures in winter being
well captured by ERA-Interim. With regard to precipitation
over Europe, ERA5 again shows better correlations for nearly
FIG. 8. Percentage of North American stations where each reanalysis is in the significantly
independent top rank (with respect to a significance level of 1%) of (top) lowest bias and
(bottom) highest correlation for each climate index related to precipitation.
FIG. 9. Map of European regions with the color shading indi-
cating the reanalysis with the lowest average rank for the bias of
index HD. Hatched areas denote regions where two reanalyses
have the same average rank.Gray regions are either not included in
the intercomparison or contain no valid station for this parameter. FIG. 10. As in Fig. 9, but for correlation of index HD.
1678 JOURNAL OF CL IMATE VOLUME 34
Unauthenticated | Downloaded 02/22/22 10:01 PM UTC

all indices, and better performance in terms of bias for extreme
precipitation (RX1D, RX5D) and CWD. However, aggre-
gated precipitation is better represented by ERA-Interim with
an SPI bias close to zero while ERA5 overestimates annual
precipitation (positive bias in SPI) despite having a slightly
better correlation.
For North America, the results are quite different. ERA-
Interim shows a better performance for nearly all temperature-
based indices in terms of bias and correlation. It also has a
better representation of extreme precipitation (RX1D,RX5D)
and dry days (CDD) compared to its successor ERA5. It is
unclear why this performance deficit of ERA5 manifests
as there is no obvious explanation known to ECMWF yet
(H. Hersbach 2020, personal communication). However,
ERA5 outperforms ERA-Interim in wet days (CWD) and
seasonal and annual aggregated precipitation (SPI), which
might be due to the assimilation of a ground-based radar gauge
composite over the United States starting in 2009.
c. Benefit of (high-resolution) regional reanalyses
With respect to regional reanalyses, we find an added value
in representing climate in Europe and North America com-
pared to global reanalysis datasets depending on the index in
consideration. While the results are quite similar for both
continents, we assume that the underlying reasons are different
as horizontal resolutions, data assimilation schemes, and in-
cluded observing systems differ significantly.
For temperature, COSMO-REA6 and HARMONIE out-
perform the global reanalyses in Europe at least for SD, HD,
and CWI and NARR outperforms the global reanalyses for
SD, ID, and CWI in North America. For precipitation-based
indices, the added value of regional reanalyses is much more
pronounced. COSMO-REA6 outperforms the global rean-
alyses for RX1D, RX5D (only bias), CDD, and CWD. Further,
COSMO-REA6 and HARMONIE show the best percentages
of rank for annual (only bias) and winter SPI. Similar results
are obtained for North America as NARR outperforms the
global reanalyses for most of the precipitation-based indices.
The benefit for temperature-related indices from COSMO-
REA6 and HARMONIE is quite surprising since both
reanalysis systems assimilate only conventional surface and
upper air variables but no satellite data as in global reanalyses.
FIG. 11. As in Fig. 9, but for North America.
FIG. 12. As in Fig. 11, but for correlation of index HD.
FIG. 13. As in Fig. 9, but for bias of index RX5D.
1 MARCH 2021 KELLER AND WAHL 1679
Unauthenticated | Downloaded 02/22/22 10:01 PM UTC

Further, the nudging data assimilation scheme used in
COSMO-REA6 allows for the assimilation of 2-m humidity
but not temperature. Therefore, a possible reason for the good
performances in temperature indices at least with respect to
bias is the better representation of surface orography and the
corresponding decrease in systematic biases for surface tem-
peratures. Similar findings are reported by Scherrer (2020)
especially over complex terrain. He shows that high-resolution
datasets indeed improve the representation of surface tem-
perature, but also assumes that the assimilation of surface
temperature can be problematic over elevated regions. This is
indicated by the fact thatCOSMO-REA6,which does not directly
assimilate surface temperature, is superior to HARMONIE or
MESCAN-SURFEX in his study.
For precipitation-based indices, improvements in COSMO-
REA6 and HARMONIE are mainly expected due to the
higher horizontal resolution and the associated enhanced
representation of nonlinear, small-scale processes. In contrast,
NARR assimilates additional observations from satellites and
uses latent heat nudging, which might explain the good per-
formance in precipitation indices despite the coarser horizon-
tal resolution.
In general, it is assumed that the smaller grid spacing allows
for a better representation of smaller scales; however, higher-
resolution reanalyses may experience a disadvantage in the
evaluation of their performance. The expected benefits may
not become apparent to the full extent in an evaluation due to
the well-known double penalty problem (e.g., Gilleland et al.
2009). With decreasing grid cell sizes, point-to-point agree-
ment to observations is presumed to deteriorate with small
displacement errors in the analysis fields being penalized twice,
once for issuing a false alarm and again for missing the
observation.
6. Conclusions
The representation of climate in reanalyses varies signifi-
cantly not only between the different reanalyses but also be-
tween the parameters (i.e., the climate indices) and regions.
Therefore, there is no general advice for users on the best re-
analysis dataset. The choice of the reanalysis is rather strongly
dependent on the specific application and location. To support
users in their decisions, we provide a ranking system for the
FIG. 16. As in Fig. 11, but for correlation of index RX5D.
FIG. 15. As in Fig. 11, but for bias of index RX5D.
FIG. 14. As in Fig. 9, but for correlation of index RX5D.
1680 JOURNAL OF CL IMATE VOLUME 34
Unauthenticated | Downloaded 02/22/22 10:01 PM UTC

reanalyses with respect to the representation of climate indices.
The comprehensive results of our analysis are provided as
online supplemental material. The information may serve as a
guideline for choosing an appropriate reanalysis for a specific
region and parameter.
In general, it would be expected that reanalyses assimilating
either 2-m temperature observations or precipitation would
benefit with respect to the representation of the respective
climate indices. This would mean that all reanalyses but
MERRA-2 and to some extent COMSO-REA6 should have
an advantage in representing temperature as well as NARR
and partly ERA5 for precipitation. Further, the higher hori-
zontal resolutions and the subsequently enhanced model rep-
resentation of the regional reanalyses are anticipated to give
them an edge over the coarser-resolution global reanalyses.
As the results show, regional reanalyses are indeed able to
outperform global reanalyses with respect to the representa-
tion of climate. For precipitation, this is a result of a better
representation of small-scale processes and/or latent heat
nudging (cf. Wahl et al. 2017). Regarding temperature, the
apparent added value is likely an effect of the more detailed
surface orography due to the higher horizontal resolution (e.g.,
Jacob et al. 2014; Scherrer 2020). For Europe, ERA5 is still
outperforming regional reanalyses for some parameters due to
its sophisticated data assimilation scheme and comprehensive
observational dataset. This effect is mostly visible in the cor-
relation of the indices where assimilation is clearly beneficial.
In contrast, the bias of the reanalyses is much more dependent
on the respective model physics.
Our study focuses on the representation of precipitation and
temperature in a climatological context. We are aware of some
limitations in our approach that should be addressed in future
research. In our intercomparison, we concentrate on the con-
tinents of Europe and North America. For these regions, large
observational datasets of high quality as well as continental-
scale regional reanalyses are available. For other continents,
these prerequisites are currently not yet fulfilled with ongoing
developments for an Asian regional reanalysis.
Moreover, our focus is on the most recent model-based
atmospheric reanalysis systems, which describe the four-
dimensional atmospheric state with a large set of physically
consistent variables. It should be noted that other reanalysis
products derived from these ‘‘full’’ reanalyses exist. These
products aim at enhancing the quality of the original estimates
for single or a set of parameters by applying some form of
postprocessing. Examples of such datasets are ERA5-Land,3
which is a downscaling using the ERA5 land component, or the
MESCAN-SURFEX4 surface reanalysis based on HARMONIE
on a 5-km grid. Current developments of such reanalysis-based
postprocessing datasets include MERRA-2-Land (M. Bosilovich
2020, personal communication) or a surface reanalysis scheme for
COSMO-REA6.A follow-on study including or focusing on these
data is intended.
As in most intercomparison studies, we are evaluating param-
eters separately neglecting the statistical or physical dependence
between the parameters. However, high-impact weather and ex-
treme events often involve multiple parameters (i.e., compound
events). With their physically consistent design, reanalyses pro-
vide the best data to correctly represent these events. Therefore,
future reanalyses intercomparisons should also include compound
events such as wildfires, heat stress, droughts, and floods. With
ongoing developments, better climate estimates from reanalyses
can be expected in the future. Efforts are under way to implement
regional reanalyses for other areas of theworld.Newer versions of
the HARMONIE and COSMO-REA6 datasets are currently
developed and it is expected that these data will further enhance
the representations of climate.
Acknowledgments. This work has been conducted in the
framework of the Hans-Ertel-Centre for Weather Research
funded by the German Federal Ministry for Transportation and
Digital Infrastructure (Grants BMVI/DWDDWD2014P5Aand
4818DWDP5A). The authors want to thank Arianna Valmassoi
and our two anonymous reviewers for their valuable comments
on the manuscript. We would further like to thank Mike
Bosilovich, Hans Hersbach, and Shinya Kobayashi for addi-
tional information on the reanalyses.
Data availability statement. All data used in the study are
freely available. The sources where the authors obtained the
datasets are given below:
ERA-Interimd Details: https://www.ecmwf.int/en/forecasts/datasets/reanalysis-
datasets/era-interimd Source: ECMWF Mars Archive
ERA5d Details: https://www.ecmwf.int/en/forecasts/datasets/reanalysis-
datasets/era5d Source: ECMWF Mars Archive
MERRA-2d Details: https://gmao.gsfc.nasa.gov/reanalysis/MERRA-2/d Source: https://disc.gsfc.nasa.gov/
JRA-55d Details: https://jra.kishou.go.jp/JRA-55/index_en.htmld Source: NCARResearchDataArchive (data set identifier
ds628.0, doi:10.5065/D6HH6H41)
NARRd Details: https://www.ncdc.noaa.gov/data-access/model-data/
model-datasets/north-american-regional-reanalysis-narrd Source: NCAR Research Data Archive (data set identi-
fier 608.0)
HARMONIEd Details: Deliverable D2.7 from UERRA project http://
uerra.eu/publications/deliverable-reports.htmld Source: ECMWF Mars Archive
COSMO-REA6d Details: https://reanalysis.meteo.uni-bonn.de/?COSMO-REA6d Source: DWD’s Climate Data Center (https://opendata.
dwd.de/climate_environment/REA)
3 See https://doi.org/10.24381/cds.e2161bac.4 Deliverable D2.8 from UERRA project: http://uerra.eu/publications/
deliverable-reports.html.
1 MARCH 2021 KELLER AND WAHL 1681
Unauthenticated | Downloaded 02/22/22 10:01 PM UTC

ECA&Dd Details: https://www.ecad.eud Source: https://www.ecad.eu/dailydata/predefinedseries.php
GHCNv4d Details: https://www.ncdc.noaa.gov/data-access/land-based-
station-data/land-based-datasets/global-historical-climatology-
network-monthly-version-4d Source: ftp://ftp.ncdc.noaa.gov/pub/data/ghcn/daily
APPENDIX
List of Acronyms and Abbreviations
3D-Var Three-dimensional variational data assimilation
4D-Var Four-dimensional variational data assimilation
ASRv2 Arctic System Reanalysis, version 2
ALADIN Aire Limitée Adaptation Dynamique
Développement International
BARRA Bureau of Meteorology Atmospheric High-
Resolution Regional Reanalysis for
Australia
CFSR Climate Forecast System Reanalysis
COSMO Consortium of Small-Scale Modeling
CPCU Climate Prediction Center Unified gauge-
based analysis of global daily precipitation
DOE Department of Energy
DWD DeutscherWetterdienst (GermanMeteorological
Service)
ECA&D European Climate Assessment and Dataset
ECDF Empirical cumulative distribution function
ECMWF European Centre for Medium-Range Weather
Forecasts
EDAS Eta Model Data Assimilation System
ERA-I ECMWF interim reanalysis
ERA5 Fifth major global reanalysis produced by
ECMWF
ERA40 ECMWF 40-Year Re-Analysis
ETCCDI Expert Team on Climate Change Detection
and Indices
GEOS Goddard Earth Observing System
GHCNv4 GlobalHistoricalClimatologyNetwork, version 4
GMS Global spectral model
HARMONIE HIRLAM–ALADIN Research on Mesoscale
Operational NWP in Europe
HErZ Hans-Ertel-Centre for Weather Research
HIRLAM High Resolution Limited Area Model
IFS Integrated Forecasting System
JMA Japan Meteorological Agency
JRA-25 Japanese 25-year Reanalysis Project
JRA-55 Japanese 55-year Reanalysis Project
MERRA Modern-Era Retrospective Analysis
MERRA-2 Modern-EraRetrospectiveAnalysis, version 2
NARR North American Regional Reanalysis
NASA National Aeronautics and SpaceAdministration
NCEP National Centers for Environmental Prediction
NWP Numerical weather prediction
R2 NCEP–DOE Reanalysis version 2
REA6 COSMO reanalysis at 6 km
S-RIP SPARC Reanalysis Intercomparison Project
SMHI Swedish Meteorological and Hydrological
Institute
SPARC Stratosphere–Troposphere Processes and their
Role in Climate
TIRA WCRPTask Team on the Intercomparison of
Reanalysis
UERRA Uncertainties in Ensembles of Regional
Reanalyses
WCRP Weather and Climate Research Program
WMO World Meteorological Organization
REFERENCES
Alexander, L. V., M. Bador, R. Roca, S. Contractor, M. G. Donat,
and P. L. Nguyen, 2020: Intercomparison of annual precipi-
tation indices and extremes over global land areas from in situ,
space-based and reanalysis products. Environ. Res. Lett., 15,
055002, https://doi.org/10.1088/1748-9326/ab79e2.
Auger, J. D., S. D. Birkel, K. A.Maasch, P. A.Mayewski, andK. C.
Schuenemann, 2018:An ensemblemean and evaluation of third
generation global climate reanalysis models. Atmosphere, 9,
236, https://doi.org/10.3390/atmos9060236.
Boisvert, L. N., M. A. Webster, A. A. Petty, T. Markus, D. H.
Bromwich, and R. I. Cullather, 2018: Intercomparison of
precipitation estimates over the Arctic Ocean and its periph-
eral seas from reanalyses. J. Climate, 31, 8441–8462, https://
doi.org/10.1175/JCLI-D-18-0125.1.
Bollmeyer, C., and Coauthors, 2015: Towards a high-resolution
regional reanalysis for the European CORDEX domain.
Quart. J. Roy. Meteor. Soc., 141 (686), 1–15, https://doi.org/
10.1002/qj.2486.
Bosilovich, M. G., F. R. Robertson, L. Takacs, A. Molod, and
D.Mocko, 2017: Atmospheric water balance and variability in
the MERRA-2 reanalysis. J. Climate, 30, 1177–1196, https://
doi.org/10.1175/JCLI-D-16-0338.1.
Bromwich, D. H., and Coauthors, 2018: The Arctic System
Reanalysis, version 2. Bull. Amer. Meteor. Soc., 99, 805–828,
https://doi.org/10.1175/BAMS-D-16-0215.1.
Bukovsky, M. S., and D. J. Karoly, 2007: A brief evaluation of pre-
cipitation from the North American Regional Reanalysis.
J. Hydrometeor., 8, 837–846, https://doi.org/10.1175/JHM595.1.
Chen,M.,W. Shi, P. Xie, V. B. S. Silva, V. E. Kousky, R.W.Higgins,
and J. E. Janowiak, 2008: Assessing objective techniques for
gauge-based analyses of global daily precipitation. J. Geophys.
Res., 113, D04110, https://doi.org/10.1029/2007JD009132.
Dahlgren, P., T. Landelius, P. Kållberg, and S. Gollvik, 2016: A
high-resolution regional reanalysis for Europe. Part I: Three-
dimensional reanalysis with the regional high-resolution lim-
ited-area model (HIRLAM).Quart. J. Roy. Meteor. Soc., 142,
2119–2131, https://doi.org/10.1002/qj.2807.
Dee, D. P., and Coauthors, 2011: The ERA-Interim reanalysis:
Configuration and performance of the data assimilation sys-
tem.Quart. J. Roy. Meteor. Soc., 137, 553–597, https://doi.org/10.1002/qj.828.
Diaconescu, E. P., A. Mailhot, R. Brown, and D. Chaumont, 2018:
Evaluation of CORDEX-Arctic daily precipitation and
temperature-based climate indices over Canadian Arctic
land areas. Climate Dyn., 50, 2061–2085, https://doi.org/
10.1007/s00382-017-3736-4.
1682 JOURNAL OF CL IMATE VOLUME 34
Unauthenticated | Downloaded 02/22/22 10:01 PM UTC

Frank, C. W., B. Pospichal, S. Wahl, J. D. Keller, A. Hense, and
S. Crewell, 2020: The added value of high resolution regional
reanalyses for wind power applications. Renewable Energy,
148, 1094–1109, https://doi.org/10.1016/j.renene.2019.09.138.
Free, M., B. Sun, and H. L. Yoo, 2016: Comparison between total
cloud cover in four reanalysis products and cloud measured by
visual observations at us weather stations. J. Climate, 29, 2015–
2021, https://doi.org/10.1175/JCLI-D-15-0637.1.
Fujiwara, M., and Coauthors, 2017: Introduction to the SPARC
Reanalysis Intercomparison Project (S-RIP) and overview of
the reanalysis systems. Atmos. Chem. Phys., 17, 1417–1452,
https://doi.org/10.5194/acp-17-1417-2017.
Gelaro, R., and Coauthors, 2017: The Modern-Era Retrospective
Analysis for Research and Applications, version 2 (MERRA-2).
J. Climate, 30, 5419–5454, https://doi.org/10.1175/JCLI-D-
16-0758.1.
Ghodichore, N., R. Vinnarasi, C. Dhanya, and S. B. Roy, 2018:
Reliability of reanalyses products in simulating precipitation
and temperature characteristics over India. J. Earth Syst. Sci.,
127, 115, https://doi.org/10.1007/s12040-018-1024-2.Gilleland, E., D. Ahijevych, B. G. Brown, B. Casati, and E. E.
Ebert, 2009: Intercomparison of spatial forecast verification
methods. Wea. Forecasting, 24, 1416–1430, https://doi.org/
10.1175/2009WAF2222269.1.
Gupta, P., S. Verma, R. Bhatla, A. S. Chandel, J. Singh, and
S. Payra, 2020: Validation of surface temperature derived
fromMERRA-2 reanalysis against IMD gridded data set over
India. Earth Space Sci., 7, e2019EA000910, https://doi.org/
10.1029/2019EA000910.
Guttman, N. B., 1999: Accepting the standardized precipitation in-
dex: A calculation algorithm. J. Amer.Water Resour. Assoc., 35,
311–322, https://doi.org/10.1111/j.1752-1688.1999.tb03592.x.
Harada,Y., andCoauthors, 2016:The JRA-55 reanalysis:Representation
of atmospheric circulation and climate variability. J. Meteor. Soc.
Japan, 94, 269–302, https://doi.org/10.2151/jmsj.2016-015.
Hersbach, H., and Coauthors, 2019: Global reanalysis: Goodbye
ERA-Interim, hello ERA5. ECMWF Newsletter, No. 159,
ECMWF, Reading, United Kingdom, 17–24.
——, and Coauthors, 2020: The ERA5 global reanalysis. Quart.
J. Roy. Meteor. Soc., 146, 1999–2049, https://doi.org/10.1002/
qj.3803.
Jacob, D., and Coauthors, 2014: EURO-CORDEX: New high-
resolution climate change projections for European impact
research. Reg. Environ. Change, 14, 563–578, https://doi.org/
10.1007/s10113-013-0499-2.
Kaiser-Weiss, A. K., F. Kaspar, V. Heene, M. Borsche, D. G. H.
Tan, P. Poli, A. Obregon, and H. Gregow, 2015: Comparison
of regional and global reanalysis near-surface winds with sta-
tion observations over Germany. Adv. Sci. Res., 12, 187–198,
https://doi.org/10.5194/asr-12-187-2015.
——, and Coauthors, 2019: Added value of regional reanalyses for
climatological applications. Environ. Res. Commun., 1, 071004,
https://doi.org/10.1088/2515-7620/ab2ec3.
Kalnay, E., and Coauthors, 1996: The NCEP/NCAR 40-Year
Reanalysis Project. Bull. Amer. Meteor. Soc., 77, 437–471,
https://doi.org/10.1175/1520-0477(1996)077,0437:TNYRP.2.0.
CO;2.
Klein Tank, A. M. G., and Coauthors, 2002: Daily dataset of 20th-
century surface air temperature and precipitation series for
the European climate assessment. Int. J. Climatol., 22, 1441–
1453, https://doi.org/10.1002/joc.773.
——, F. W. Zwiers, and X. Zhang, 2009: Guidelines on analysis of
extremes in a changing climate in support of informed deci-
sions for adaptation. WCDMP-72, WMO/TD-1500, 56 pp.,
www.wmo.int/datastat/documents/WCDMP_72_TD_1500_
en_1_1.pdf.
Kobayashi, S., and Coauthors, 2015: The JRA-55 reanalysis:
General specifications and basic characteristics. J. Meteor.
Soc. Japan, 93, 5–48, https://doi.org/10.2151/jmsj.2015-001.
Krauskopf, T., and R. Huth, 2020: Temperature trends in Europe:
Comparison of different data sources. Theor. Appl. Climatol.,
139, 1305–1316, https://doi.org/10.1007/s00704-019-03038-w.
Kyselý, J., and E. Plavcová, 2010: A critical remark on the appli-
cability of E-OBS European gridded temperature data set for
validating control climate simulations. J. Geophys. Res., 115,
D23118, https://doi.org/10.1029/2010JD014123.
Lader,R.,U. S.Bhatt, J. E.Walsh, T. S.Rupp, andP.A.Bieniek, 2016:
Two-meter temperature and precipitation from atmospheric re-
analysis evaluated for Alaska. J. Appl.Meteor. Climatol., 55, 901–
922, https://doi.org/10.1175/JAMC-D-15-0162.1.
Lavaysse, C., C. Cammalleri, A. Dosio, G. van der Schrier,
A. Toreti, and J. Vogt, 2018: Towards a monitoring system of
temperature extremes in Europe. Nat. Hazards Earth Syst.
Sci., 18, 91–104, https://doi.org/10.5194/nhess-18-91-2018.
Martineau, P., S.-W. Son, M. Taguchi, and A. H. Butler, 2018: A
comparison of the momentum budget in reanalysis datasets
during sudden stratospheric warming events. Atmos. Chem.
Phys., 18, 7169–7187, https://doi.org/10.5194/acp-18-7169-2018.McKee, T. B., N. J. Doesken, and J. Kleist, 1993: The relationship
of drought frequency and duration to time scale. Eighth Conf.
on Applied Climatology, Amer. Meteor. Soc., Anaheim, CA,
179–184.
Menne, M. J., C. N. Williams, B. E. Gleason, J. J. Rennie, and J. H.
Lawrimore, 2018: TheGlobalHistorical ClimatologyNetwork
monthly temperature dataset, version 4. J. Climate, 31, 9835–
9854, https://doi.org/10.1175/JCLI-D-18-0094.1.
Mesinger, F., and Coauthors, 2006: North American Regional
Reanalysis. Bull. Amer. Meteor. Soc., 87, 343–360, https://
doi.org/10.1175/BAMS-87-3-343.
Moore, G. W. K., D. H. Bromwich, A. B. Wilson, I. Renfrew, and
L. Bai, 2016: Arctic system reanalysis improvements in topo-
graphically forced winds near Greenland. Quart. J. Roy.
Meteor. Soc., 142, 2033–2045, https://doi.org/10.1002/qj.2798.
Orsolini, Y., and Coauthors, 2019: Evaluation of snow depth and
snow cover over the Tibetan Plateau in global reanalyses using
in situ and satellite remote sensing observations. Cryosphere,
13, 2221–2239, https://doi.org/10.5194/tc-13-2221-2019.
Prein, A. F., and A. Gobiet, 2017: Impacts of uncertainties in
European gridded precipitation observations on regional cli-
mate analysis. Int. J. Climatol., 37, 305–327, https://doi.org/
10.1002/joc.4706.
Ramon, J., L. Lledó, V. Torralba, A. Soret, and F. J. Doblas-Reyes,
2019: What global reanalysis best represents near-surface
winds? Quart. J. Roy. Meteor. Soc., 145, 3236–3251, https://
doi.org/10.1002/qj.3616.
Reichle, R. H., Q. Liu, R. D. Koster, C. S. Draper, S. P. P.
Mahanama, and G. S. Partyka, 2017: Land surface precipita-
tion in MERRA-2. J. Climate, 30, 1643–1664, https://doi.org/
10.1175/JCLI-D-16-0570.1.
Scherrer, S. C., 2020: Temperature monitoring in mountain regions
using reanalyses: Lessons from the Alps. Environ. Res. Lett.,
15, 044005, https://doi.org/10.1088/1748-9326/ab702d.Sheridan, S. C., C. C. Lee, and E. T. Smith, 2020: A comparison
between station observations and reanalysis data in the iden-
tification of extreme temperature events.Geophys. Res. Lett.,
47, e2020GL088120, https://doi.org/10.1029/2020GL088120.
1 MARCH 2021 KELLER AND WAHL 1683
Unauthenticated | Downloaded 02/22/22 10:01 PM UTC
Simmons, A. J., P. Berrisford, D. P. Dee, H. Hersbach, S. Hirahara,
and J.-N. Thépaut, 2017: A reassessment of temperature var-
iations and trends from global reanalyses and monthly surface
climatological datasets. Quart. J. Roy. Meteor. Soc., 143, 101–119, https://doi.org/10.1002/qj.2949.
Slater, A. G., 2016: Surface solar radiation in North America: A
comparison of observations, reanalyses, satellite, and derived
products. J. Hydrometeor., 17, 401–420, https://doi.org/10.1175/JHM-D-15-0087.1.
Steinke, S., S.Wahl, and S. Crewell, 2019: Benefit of high resolution
COSMO reanalysis: The diurnal cycle of column-integrated
water vapor over Germany. Meteor. Z., 28, 165–177, https://doi.org/10.1127/metz/2019/0936.
Stopa, J. E., and K. F. Cheung, 2014: Intercomparison of wind and
wave data from the ECMWF reanalysis interim and theNCEP
Climate Forecast System Reanalysis. Ocean Modell., 75, 65–
83, https://doi.org/10.1016/j.ocemod.2013.12.006.
Su, C.-H., and Coauthors, 2019: BARRA v1.0: The Bureau of
Meteorology atmospheric high-resolution regional reanalysis
for Australia. Geosci. Model Dev., 12, 2049–2068, https://
doi.org/10.5194/gmd-12-2049-2019.
Sun, Q., C. Miao, Q. Duan, H. Ashouri, S. Sorooshian, and K.-L.
Hsu, 2018: A review of global precipitation data sets: Data
sources, estimation, and intercomparisons. Rev. Geophys., 56,
79–107, https://doi.org/10.1002/2017RG000574.
Torralba, V., F. J. Doblas-Reyes, andN.Gonzalez-Reviriego, 2017:
Uncertainty in recent near-surface wind speed trends: A
global reanalysis intercomparison. Environ. Res. Lett., 12,
114019, https://doi.org/10.1088/1748-9326/aa8a58.
Trenberth, K. E., T. Koike, and K. Onogi, 2008: Progress and
prospects for reanalysis for weather and climate. Eos, Trans.
Amer. Geophys. Union, 89, 234–235, https://doi.org/10.1029/
2008EO260002.
——, J. T. Fasullo, and J. Mackaro, 2011: Atmospheric moisture
transports from ocean to land and global energy flows in re-
analyses. J. Climate, 24, 4907–4924, https://doi.org/10.1175/
2011JCLI4171.1.
Vidal, J.-P., E. Martin, L. Franchistéguy, M. Baillon, and J.-M.
Soubeyroux, 2010: A 50-year high-resolution atmospheric re-
analysis over France with the Safran system. Int. J. Climatol.,
30, 1627–1644, https://doi.org/10.1002/joc.2003.
Wahl, S., C.Bollmeyer, S. Crewell, C. Figura, P. Friederichs,A.Hense,
J. D. Keller, and C. Ohlwein, 2017: A novel convective-scale re-
gional reanalysis COSMO-REA2: Improving the representation
of precipitation. Meteor. Z., 26, 345–361, https://doi.org/10.1127/
metz/2017/0824.
Wegmann, M., Y. Orsolini, E. Dutra, O. Bulygina, A. Sterin, and
S. Brönnimann, 2017: Eurasian snow depth in long-term cli-
mate reanalyses. Cryosphere, 11, 923–935, https://doi.org/
10.5194/tc-11-923-2017.
Willmott, C. J., and M. L. Johnson, 2005: Resolution errors asso-
ciated with gridded precipitation fields. Int. J. Climatol., 25,
1957–1963, https://doi.org/10.1002/joc.1235.
Zandler, H., I. Haag, and C. Samimi, 2019: Evaluation needs and
temporal performance differences of gridded precipitation
products in peripheral mountain regions. Sci. Rep., 9, 15118,
https://doi.org/10.1038/s41598-019-51666-z.
Zhang, X., S. Liang, G.Wang, Y. Yao, B. Jiang, and J. Cheng, 2016:
Evaluation of the reanalysis surface incident shortwave radi-
ation products from NCEP, ECMWF, GSFC, and JMA using
satellite and surface observations.Remote Sens., 8, 225, https://doi.org/10.3390/rs8030225.
1684 JOURNAL OF CL IMATE VOLUME 34
Unauthenticated | Downloaded 02/22/22 10:01 PM UTC