reports on tasks for scientific cooperation · 2016-10-17 · reports on tasks for scientific...
TRANSCRIPT

Reports on tasks for scientific cooperation
Report of experts participating in Task 3.2.11
March 2004
Assessment of the dietary exposure to arsenic, cadmium, lead and mercury
of the population of the EU Member States
Directorate-General Health and Consumer Protection
SCOOP 3.2.11 – Intake of As, Cd, Pb and Hg
2
CONTENT PAGE 1 FOREWORD 4 1.1 SUMMARY 5 1.2 INTRODUCTION 8 1.3 LEGISLATION 9 1.4 ESTIMATION OF FOOD CONSUMPTION 10 1.5 DIETARY INTAKE OF ELEMENTS 10 1.6 EVALUATION OF THE RESULTS 11 1.7 LIMITINGS FACTORS 12 1.8 CONCLUSIONS FROM SCOOP – TASK 3.2.11 13 1.9 PARTICIPANTS 16 1.10 GLOSSARY 20 2. Dietary intake of arsenic 21 2.1 Toxicology 21 2.2 Recommendations on intake limitations 21 2.3 Intake of arsenic by the mean adult population 21 2.4 Intake of arsenic by children: Mean population 23 2.5 Legislation 23 2.6 Comments on the mean adult population intake of arsenic by Member State
24
2.7 Comments on arsenic in specific food groups 27 2.8 Estimated daily intake by other population groups 31 2.9 Occurrence summary table for arsenic 33 3. Dietary intake of cadmium 37 3.1 Toxicology 37 3.2 Recommendations on intake limitations 37 3.3 Intake of cadmium by the mean adult population 38 3.4 Intake of cadmium by children: Mean population 40 3.5 Legislation 40 3.6 Comments on the mean adult population intake of cadmium by Member State
41
3.7 Comments on cadmium in specific food groups 45 3.8 Estimated daily intake by other population groups 56 3.9 Occurrence summary table for cadmium 59 4. Dietary intake of lead 71 4.1 Toxicology 71 4.2 Recommendations on intake limitations 71 4.3 Intake of lead by the mean adult population 72

SCOOP 3.2.11 – Intake of As, Cd, Pb and Hg
3
4.4 Intake of lead by children: Mean population 74 4.5 Legislation 75 4.6 Comments on the mean adult population intake of lead by Member State
76
4.7 Comments on lead in specific food groups 79 4.8 Estimated daily intake by other population groups 87 4.9 Occurrence summary table for lead 89 5. Dietary intake of mercury 95 5.1 Toxicology 95 5.2 Recommendations on intake limitations 95 5.3 Intake of mercury by the mean adult population 96 5.4 Intake of mercury by children: Mean population 98 5.5 Legislation 99 5.6 Comments on the mean adult population intake of total mercury by Member State
99
5.7 Comments on mercury in specific food groups 103 5.8 Estimated daily intake by other population groups 110 5.9 Occurrence summary table for mercury 113 6. Food categorisation system 121 Annex A:Summary of Submissions and References Annex B: Occurrence Data, Consumption Data and Intake Data

SCOOP 3.2.11 – Intake of As, Cd, Pb and Hg
4
1. FOREWORD According to Council Directive 93/5/EEC "on the assistance to the Commission and cooperation by the Member States in the scientific examination of questions relating to food" Member States of the European Union can cooperate on problems facing the Commission in the area of food. Directive 93/5/EEC also indicates that an inventory of Tasks to be undertaken has to be published as a Commission Decision at least every six months. For each Task, the participating Member States, the Member State which provides coordination and time limit for completion will be indicated. The rationale for each Task is to provide harmonised and reliable information to be used by the Commission for the management of problems related to food. With this aim the Competent Authorities responsible for Scientific Cooperation in the Member States nominate experts in the specific field of interest that will provide the Coordinator with the information necessary to prepare a final report. In principle the final report should contain factual information, but it should be underlined that gathering and presenting scientific data, especially deriving from sources of different origin, can require a degree of interpretation by experts and by the Coordinators. It is therefore important to stress that the interpretation and views in the present report are not necessarily those of the participating Member States or those of the European Commission.
SCOOP 3.2.11 – Intake of As, Cd, Pb and Hg
5
1.1 Summary Data on occurrence, consumption and intake calculations for the mean adult population were submitted by BE, DK, FI, FR, DE, HE, IR, IT, NL, NO, PT, SE and UK. Several factors have an impact on the validity of the intake estimation. The most important is probably the limited amount of occurrence data, which in many countries left several food groups empty. DK and UK had sufficient data for a complete intake assessment. Other confounding factors are differences in analytical quality and different choices of age groups for the intake estimations. The results therefore have to be viewed with caution. The occurrence levels of Cd, Pb and Hg in foodstuffs, for which maximum limits (ML) have been established in Commission Regulation 466/2001, are generally well below the MLs. Arsenic. Nine Member States submitted occurrence and intake data for arsenic in fish, the main source of arsenic in the food, for the mean adult population. Very few data was provided on arsenic in other foodstuffs. An accurate estimation of the total intake is therefore not possible in most Member States. The results from DK and the UK, which cover all major food groups, indicate that fish and other seafood contribute more than 50% of the dietary arsenic. The mean daily intake of arsenic from fish and other seafood is below 0.35 mg. It is thus assumed that the total daily intake of arsenic by the mean adult population is below 1 mg. Consumers of fish and seafood may reach an intake of 1 mg/day from these foods alone. Data from FR and DE indicate that children have a lower intake of arsenic than adults. The burden/kg bodyweight of children may, however, be larger than for adults due to their lower bodyweight. The type of water in which the fish is caught, i.e. marine or fresh, is of major importance for the As-content, with the highest levels in marine species. No data was available on the inorganic arsenic-species, which are the most toxic species present in food. The ratio inorganic/total As in foodstuffs is thus largely unknown. Cadmium. Thirteen Member States submitted occurrence and intake data for the mean adult population. DK, FI, FR, DE and the UK had the best data to make an accurate intake estimation. IR had data for only two food categories. The mean intake in the Member States is less than 30% of the PTWI, with the exception of the Netherlands with 38%. The PTWI is 0.49 mg for a person weighing 70 kg. In the UK the intake by mean consumers is 22% of the PTWI, whereas for high consumers is 37% of the PTWI. Cereals and vegetables are the main sources of cadmium in the diet, representing approximately 2/3 of the mean cadmium intake. Data from FR and DE indicate that children have a lower intake of cadmium than adults. However, children have a larger burden/kg body weight, due to their lower body weight. The cadmium dietary intake of children 4-6 years old is estimated to 65% of the PTWI. Lead. Twelve Member States submitted occurrence and intake data for the mean adult population. Only DK and the UK had sufficient data to make a complete intake estimation. All other Member States were lacking data from one or several food groups. The results indicate,

SCOOP 3.2.11 – Intake of As, Cd, Pb and Hg
6
however, that in 11 Member States the average intake of lead via food by is less than 25% of the PTWI, which is 0.025 mg/kg bodyweight/week (equal to 1.75 mg for a person weighing 70 kg). In PT the intake was in the order of 50% of the PTWI. This high intake is due to certain food groups which were reported to contain unusually high lead levels. In PT these foods, e.g. potatoes, were analysed with methods with extremely high detection limits (<1 mg/kg). Since half of that limit is used as the occurrence level for the intake calculation, intake may erroneously appear to be very high. In e.g. IR the intake is underestimated (0.4% of the PTWI) since occurrence data were available only from a few food items. The mean intake in the Member States is 14% of the PTWI. In the UK the intake by the mean population is 11% of the PTWI, whereas the intake by mean consumers is 24% and for high level consumers 43% . Specific foodstuffs from some Member States were reported to contain very high lead levels (wine, game, fish and meat). If these high occurrence levels are confirmed, or the sampling found to be representative, consumers in these Member States may be at risk of exceeding the PTWI. Data from FR and DE indicate that children have a lower intake of lead than adults. However, children have a larger burden/kg body weight, due to their lower body weight, and may reach 35 % of the PTWI. Mercury. Thirteen Member States submitted occurrence and intake data for fish. DK, DE and the UK had the best data to make an accurate intake estimation. FI, IT and SE had data for only one food category. Fish is the main source of mercury in the food, for the mean adult population. In fish and shellfish, mercury is present mainly in the form of methylmercury, while its almost entirely inorganic mercury in other foodstuffs.Fruits and vegetables are the main source of mercury in FR, NL and DE. In FR and DE mushrooms is included in this category,which strongly affects the intake level. Dried fruit and vegetables also has an enhancing effect on the intake in DE. The mean intake for the Member States is less than 30% of the PTWI for total mercury, corresponding to 0.35 mg for a person weighing 70 kg. In the UK the intake by mean consumers is 6% of the PTWI, whereas for high consumers is 13% of the PTWI. The current PTWI (established 2003) for methylmercury is 1.6 µg/kg bodyweight, which corresponds to 0.112 mg/week for a person weighing 70 kg. Data were reported for total mercury, but as an overestimate assuming this was all methylmercury, the mean intake of methylmercury from fish and shellfish in the Member States would be less than 30% of the PTWI for methylmercury. In the UK the methylmercury intake by mean consumers would be 13% of the PTWI, whereas for high consumers it would be 41% of the PTWI for methylmercury. In NO the methylmercury intake by mean consumers would correspond to 78% of the PTWI for methylmercury, whereas for high consumers, the PTWI for methylmercury would be exceeded.
SCOOP 3.2.11 – Intake of As, Cd, Pb and Hg
7
Data from FR and DE indicate that children have a lower intake of mercury than adults. However, children have a larger burden/kg body weight due to their lower body weight. Depending upon the proportions of methylmercury present in the foods tested for total mercury, it is possible that the intake could exceed the PTWI for methylmercury . The results from the SCOOP task indicate that there is a risk that population-groups with a high consumption of fish and seafood may have intakes of methylmercury that are close or even exceed the PTWI for methylmercury of 1.6 µg/kg body weight/week. More information is needed on the relative proportions of methylmercury to total mercury in different foods.
SCOOP 3.2.11 – Intake of As, Cd, Pb and Hg
8
1.2 Introduction The project, Scientific Co-operation (SCOOP) Task 3.2.11: Assessment of the dietary exposure to arsenic, cadmium, lead and mercury of the population of the EU Member States, was decided in October 2001 and commenced in January 2002. The objective of the task is to provide the scientific basis for the evaluation and management of risk to public health arising from dietary exposure to arsenic, cadmium, lead and mercury. This requires the identification of the major dietary sources of these elements and the estimation of the intakes by both the whole population and by any high-risk subgroups for each Member State. The Joint FAO/WHO Expert Committee on Food Additives (JEFCA) has established Provisional Tolerable Weekly Intakes (PTWI) for cadmium, lead, mercury and methylmercury. These may be compared with the intake estimates obtained from the different Member States. The outcome of these comparisons is an indication of the risk for hazardous exposure run by the citizens in the Member States. The EU Scientific Committee for Food reports in its Opinion on Cadmium (thirty-sixth series. 1997) great concerns regarding its limited ability to assess the dietary exposure, due to lack of reliable consumption data. It concludes, however, that a significant part of the population has an intake of cadmium, from dietary sources alone, that is close to the PTWI. For lead the Committee concludes (Opinion on Lead, thirty-second series. 1994) that the level of contamination of foodstuffs does not seem to be a cause for alarm. It does, however, note that the reasons for extremely high levels, which are occasionally found in foodstuffs, need to be indentified. Long term action should follow with the objective of further lowering the lead levels in foodstuffs. In the context of the Scientific Co-operation the Commission of the Member States proposed a specific task on lead, cadmium, mercury and arsenic. Italy and Sweden accepted a joint Co-ordinatorship and were assigned the task by a Commission Decision of 26/10/2001. Member States contributing to the scoop project BELGIUM BE DENMARK DK FINLAND FI FRANCE FR GERMANY DE GREECE HE IRELAND IR ITALY IT THE NETHERLANDS NL NORWAY* NO PORTUGAL PT SWEDEN SE UNITED KINGDOM UK *Norway is not distinguished from Member States in this report.

SCOOP 3.2.11 – Intake of As, Cd, Pb and Hg
9
Intake data was primarily submitted for the mean adult population in the Member States. Some Member States submitted data also for certain other population and age groups. See Table 1.1. for details. Table 1.1. Arsenic, cadmium, lead and mercury. Intake data reported for different population and consumer groups in the Member States Population BE DK FI FR DE HE IR IT NL* NO PT SE UK
Adult. Mean X X X X X X X X X X X X Adult. High Level X X X X X X Children (4-6 years). Mean. X Children (4-6 years). High level. X Children (10-12 years). Mean. X Children (10-12 years). High level. X Children (3-14 years). Mean X Children (3-14 years). High level X Children (14-18 years). Mean X Children (14-18 years). High level X Consumers Adult. Mean X X X X X X Adult. High Level X X X X X X Children (3-14 years). Mean. X Children (3-14 years). High level. X Children (4-6 years). Mean. X Children (4-6 years). High level. X Children (10-12 years). Mean. X Children (10-12 years). High level. X Children (14-18 years). Mean. X Children (14-18 years). High level. X
*For cadmium and mercury only.
Spain declined further participation at an early stage of the project. Austria did not submit data. The Netherlands decided not to submit occurrence data for arsenic and lead. Institutes in the Member States provided the latest national information in accordance with the agreed format. The information to be collated was primarily concerned with:
The concentration of arsenic, cadmium, lead and mercury in foodstuffs. Food consumption data at the national levels. Dietary intake of the elements at Member State level.
1.3 Legislation Maximum levels The Commission Regulation (EC) No 466/2001 adopted in March 2001, established maximum levels (MLs) of cadmium and lead in certain foodstuffs and mercury in fish products. The regulation is in force since 5 April 2002. The Commission Regulation (EC) No 221/2002 of February 2002 amended maximum levels of cadmium, lead and mercury in certain fishery products. A revaluation of the MLs will begin in 2003. For arsenic no ML is yet established.

SCOOP 3.2.11 – Intake of As, Cd, Pb and Hg
10
Compliance with MLs for cadmium, lead and mercury in the Member States A comparison with the MLs for cadmium, lead and mercury will be made for foodstuffs for which MLs are established. The results will be found in sections 3.5, 4.5 and 5.5, repectively. When data in tables 3.6, 4.6 and 5.6 differ from those in other occurrence data tables it may be due to differences in reporting by the Member States, or by the interpretation by the coordinators. Criteria for sampling, sample treatment and methods of analysis The Commission Decision 90/515/EEC laid down the reference methods for detecting residues of cadmium, lead and arsenic. Subsequently, the Commission Directive 2001/22/EC of 8 March 2001 laid down criteria for the sampling methods and the requirement to be met in sample treatment and analysis of cadmium, lead, and mercury for the official control of their levels in foodstuffs. Several established analytical methods are available which comply with these requirements. 1.4 Estimation of food consumption There are various types of data describing food consumption. Household budget surveys generally cover amounts of foods brought into the household and refer to the food as purchased, i.e. no information on preparation methods and actually consumed amounts. In individual dietary surveys different methods are used covering short periods or more long-term intake. Here the aim is to cover the actual amounts consumed. Food consumption data derived from various studies were used to calculate the intake of mineral elements. Several Member States had access to national representative surveys, whereas others had more limited studies at their disposal. These data were combined with occurrence data, e.g., consumption of 0.25 kg of a foodstuff containing 0.100 mg As/kg represents an intake of 0.025 mg As. Only food consumption data for which occurrence data exist were used. Analytical data should according to agreement be validated and up to date. In certain cases older data could be used, provided their quality could be verified. 1.5 Dietary intake of elements The consumption of food within the various food groups, for which there are occurrence data available, varies considerably between the Member States and regions, as can be seen in Tables 2.1, 3.1, 4.1 and 5.1 These differences must, however, be viewed with caution since the number of specific food items in each food group can vary considerably between countries. For example, Greece has occurrence data only for dried and preserved fruit in the food group “Fruit and vegetables”, Sweden has occurrence data only for table wine in the food group “Beverages”. The consumption of milk in Germany appear to be only a fraction of what is consumed in the other Member States, but is based only on the consumption of dry milk. Information on the UK food groups can be found in the UK’s consumption and intake section in Annex A.

SCOOP 3.2.11 – Intake of As, Cd, Pb and Hg
11
Provisional Tolerable Weekly Intakes (PTWIs) has been established for cadmium, lead and mercury. They are based on per kg bodyweight, but, for simplicity, often given for a person weighing 70 kg. To facilitate a more precise calculation the mean body weight of adults in the participating Member States are shown in table 1.2. It should be noted that the mean weight is different between males and females and that the age brackets may vary between Member States. Table 1.2. Age brackets applied in the different Member States and the mean body weight of Member State subjects, in kg. Data from national surveys. Member State Age (years) Male (kg) Female
(kg) Mean M/F (kg)
Belgium 14-18 60.7 59.1 60 Denmark 15-80 72 Finland 25-64 84.3 69.9 77.1 France 3-14 31.26 31.96 31.6 France 15+ 73.88 60.11 66.4 France. Total population 3-15+ 55.09 49.46 52.18 Germany 10-14 41 Germany 18+ 70.5 Greece 70 Ireland 75 Italy 70 The Netherlands 1-97 65.8 Norway 16-79/18-79 73 Portugal Sweden 80.8 66.6 73.7 United Kingdom 70.1
The Member States may have national standards for intake estimations, based on criteria different from those used in this report. It may be noted that e.g. the UK does not use population estimates for comparison with safety guidelines, but merely to look at exposure trends over time. Total consumer estimates is used instead of comparison with the PTWI. The compilations used in this report are primarily made to facilitate comparison between Member States. It must be observed that occurrence and intake data are reported using different units throughout this report - mg and µg. 1.6 Evaluation of the results The occurrence data submitted by the participants were checked by the co-ordinators. In cases where analytical data showed signs of being unusual, or otherwise deviating from what is normally found in reports, they were discussed with the participant and in many cases verified. In some cases data were withdrawn.

SCOOP 3.2.11 – Intake of As, Cd, Pb and Hg
12
Most of the participants had reported information from their analytical quality control (AQC) programmes, i.e. results from the analysis of certified reference materials (CRMs) and from participation in proficiency testing (PT) programmes. These results were used to validate the occurrence data. All AQC-data are found in Annex A. The participants also submitted information on the methods of analysis. A large array of methods was used. Samples were mostly wet digested using mineral acids, either in closed vessels under pressure or open vessels at atmospheric pressure. Dry ashing was also utilised by some laboratories. The four elements were mostly determined by atomic absorption spectrometry (AAS), generally using graphite furnace techniques for Cd and Pb and vapour generation techniques for As and Hg. Many, but not all, laboratories reported the use of background correction during the analysis. Inductively coupled plasma – mass spectrometry (ICP-MS) was used by some laboratories. In PT certain foods, e.g. potatoes, were analysed with methods having extremely high detection limits (<1 mg/kg). Since half of that limit is used as the occurrence level for the intake calculation, intake may erroneously appear to be very high. All method descriptions are found in Annex A. The information submitted to the co-ordinators is in most cases freely accessible via reports or international publications. The references to available reports are found in Annex A. Information on occurrence, consumption and intake data for arsenic, cadmium, lead andmercury, as submitted by the Member States is found in Annex B. 1.7 Limiting factors During the course of the project several factors were identified that will affect the interpretation of the result of the SCOOP-project. The most important factors are listed below. Missing data. During the collection of occurrence data for the various foodstuffs it became clear that the Member States has no common approach for the acquisition of necessary analytical data. DK and the UK had sufficient occurrence data for a full intake study, whereas all other Member States were lacking data for some, or most, food groups. Skewed food groups. When food groups only contain a single, or a few, food items the intake calculation can be severely distorted by a food item with an unusually high/low level of the analyte and being consumed in small/large quantities. Quality of submitted data. In many cases unusually high (in some cases unusually low) occurrence data were not verified by submitted AQC-data. Unreliable occurrence data can result in both over- and underestimation of the intake of toxic elements.

SCOOP 3.2.11 – Intake of As, Cd, Pb and Hg
13
Limit of detection. For the purpose of intake calculations it was generally agreed to assign results below the LOD half of that value (e.g. <0.05 = 0.025). Some Member States, however, used other interpretations. In the UK, available data are calculated as equal to the LOD (e.g. <0.05 = 0.05). Denmark uses the the mean value of the actually measured individual determinations below the LOD. As a result some intake calculations may be under- or over-estimated. It also adds to the general uncertainty of the intake estimates. Estimation of consumption. The comparability of the exposure data is hampered by several factors, e.g. type of food consumption data, representativity of population studied, period of collection of analytical data and missing data. The method used for measuring food consumption influences the quality and reliability of data and also affects the interpretation of intake estimations. In many instances food consumption is underestimated, when methods such as dietary records, 24 h recall and fixed food frequency questionnaires are used. 1.8 Conclusions from SCOOP task 3.2.11 Arsenic. Fish and other seafood is the main source of As in the diet of the mean adult population. The daily intake from fish and other seafood is estimated to be below 0.35 mg (<2.5 mg/week). Marine species of fish may have As-levels more than ten times higher than that in fish from e.g. brackish water. Fish and other seafood contribute more than 50% to the mean intake. Consumers of fish and other seafood may reach an intake of 1 mg/day (7mg/week), or more. No data on the level of inorganic As in fish and other food is presently available. Children have a lower intake than adults, according to data from FR and DE, and young children (4-6 years) have the lowest intake. Since children have lower body weights, their body burden/kg may, however, be higher than that of adults. Cadmium. None of the most consumed foodstuffs are generally high in Cd. The intake by the mean adult population in the Member States is estimated to be less than 30% of the PTWI, with the exception of NL (38%). Cereals, fruit and vegetables, meat and fish are the main sources of cadmium in the diet, as they are highly consumed staple foods, even if the level of cadmium is generally low. Liver and kidney (especially equine) crustaceans, mollusc and cephalopods generally contain higher levels of cadmium. The contribution of offal and molluscs to the cadmium dietary mean intake is small, as the consumption is low. Regarding high level consumers of offals and molluscs, it is necessary to promote finalized study to assess the relative risk. Children have a lower intake than adults, according to data from FR and DE, and young children (4-6 years) have the lowest intake. Since children have lower body weights, their body burden/kg may, however, be higher than that of adults.

SCOOP 3.2.11 – Intake of As, Cd, Pb and Hg
14
Lead. None of the most consumed foodstuffs are generally high in Pb. The intake by the mean adult population in the Member States is estimated to be 0.042 mg/day (0.29 mg/week), which is equal to a mean of 17% of the PTWI. The intake in PT is considerably higher than the average (54% of the PTWI). This high intake is strongly influenced by use of inappropriate analytical methods resulting in very high LODs. In e.g. IR, the intake is underestimated (0.4% of the PTWI) since occurrence data were available only from a few food items. Specific foodstuffs from some Member States were reported to contain very high lead levels. If these high occurrence levels are confirmed, or the sampling found to be representative, consumers in these Member States may be at risk of exceeding the PTWI. Children have a lower intake than adults, according to data from FR and DE. Young children (4-6 years) have the lowest intake. Since children have lower body weights, their body burden/kg may, however, be higher than that of adults. In DE the body burden for children aged 4-6 years is 1µg/bodyweight/day (35% of PTWI), whereas the body burden for adults is 0.6 µg/kg bodyweight/day (19% of PTWI). Children who are high consumers of certain foodstuffs may run a risk of exceeding the PTWI.
Mercury. Fish is the main source of Hg in the diet, followed by fruit and vegetables. The daily intake of total Hg by the mean adult population is estimated to be below 0.015 mg/day. Six Member States presented mercury intake data on fish products only. No data was available for organic mercury-species (i.e. Methylmercury). Predatory fish species generally contain higher levels of mercury. However, the contribution of these foods to the dietary mean intake is small, since the consumption is low. Two Member States has reported high intakes from fruit and vegetables. These intakes, however, also include data from mushrooms and dried products which may increase the mean content in this food group more than relevant. Regarding high level consumers of these products, it is necessary to promote finalized study to know the consumption of the most contaminated foods for the higher consumers groups. Children have a lower intake than adults, according to data from FR and DE, and young children (4-6 years) have the lowest intake. Since children have lower body weights, their body burden/kg may, however, be higher than that of adults and intakes may appear to exceed the PTWI for methylmercury in 4-6 years old. However, the data submitted were for total mercury and the relative proportions of methylmercury to the total mercury in the different foods need further investigations. This would allow for more accurate intake estimates in relation to methylmercury. The Member States lack a common, co-ordinated, approach for the analysis of foodstuffs and collection of validated results for the purpose of establishing background data for intake calculation/estimation. A large number of confounding factors were identified during the work on the project. These confounding factors may artificially increase the intake levels considerably, or they may reduce the intake levels. The interpretation of the results from this project must therefore be viewed with caution.

SCOOP 3.2.11 – Intake of As, Cd, Pb and Hg
15
Commission regulation 466/2001. In some foodstuffs occurrence data are occasionally exceeding the ML. Exceedings give the appearance of being sporadic rather than systematic.

SCOOP 3.2.11 – Intake of As, Cd, Pb and Hg
16
1.9 Participants in SCOOP project 3.2.11
Member State Participant and institute
Austria Dr. ROLAND GROSSGUT Austrian Agency for Health and Food Safety Spargelfeldstrasse 191, 1226 Vienna [email protected] Tel. +43 1 73216 4150 Fax. +43 1 73216 2108
Belgium Dr. CHRISTINE VINKX
Ministry of Social Affaire Public Health and Environment Pachecolaan 19/5 1010 Brussels [email protected] Tel. +3222104837 Fax.+3222104816
Dr. JEAN MARIE DEGROODT Chef de section ff Section Denrées Alimentaires [email protected] Tel. 32 2 642 53 53 Fax. 32 2 642 56 91
Denmark Dr. ERIK H. LARSEN
Danish Veterinary and Food Administration Institute of Food Safety and Nutrition 19 Mørkhøj Bygade DK-2860 Søborg. [email protected] Tel. +45 3395 6631 Fax. +45 33956001
Finland Dr. ANJA HALLIKAINEN
National Food Agency,Vanha talvitie 5 FIN-00581 Helsinki [email protected] Tel. +358 9 3931 540 Fax. +358 9 3931 590 Mr. ESKO NIEMI Finnish Customs Laboratory Tekniikantie 13 FIN-02150 Espoo [email protected] Tel. +358 2049 23259 Fax. +358 9 46 3383

SCOOP 3.2.11 – Intake of As, Cd, Pb and Hg
17
Ms. EIJA-RIITTA VENÄLÄINEN National Veterinary and Food Research Institute (EELA) P.O.BOX 45 (Hämeentie 57) FIN-00581 Helsinki SF- [email protected] Tel. +358 9 3931903 Fax. +358 9 393 1920
France Dr. THIERRY GUÉRIN Agence Française de Sécurité Sanitaire des Aliments (AFSSA) Laboratoire d'études et de recherches sur l'hygiène et la qualité des aliments (LERQHA) – Unité Contaminants de l’Environnement 10, rue Pierre Curie F-94700 Maisons-Alfort cedex [email protected] Tel: +33 1 49 77 27 11 Fax: +33 1 49 77 26 95 Ms. ALEXANDRA TARD Agence Française de Sécurité Sanitaire des Aliments (AFSSA) DERNS/OCA 26-27, Av Gal LECLERC F-94701 Maisons-Alfort cedex [email protected] Tel: +33 1 49 77 26 27
Germany Dr. KATRIN KAPP Bundesinstitut für Risikobwertung Postfach 33 00 13 D-14191 Berlin [email protected] Tel-No. +49 30 8412 3299 Fax-No. +49 30 8412 3685 Dr. RICHARD PALAVINSKAS Bundesinstitut für Risikobewertung Postfach 33 00 13 D-14191 Berlin [email protected] Tel-No. +49 30 8412 3651 Fax-No. +49 30 8412 3510
Greece Dr. KOUTSODIMOU AGLAIA
General Chemical State Laboratory Division Of Environment An Tsoha 16 St. 115 21 Athens e-mail: [email protected] Tel: +30-10-6479450 (or) -457 Fax: +30-10-6466917 (or) 6465123

SCOOP 3.2.11 – Intake of As, Cd, Pb and Hg
18
Ireland Ms. CHRISTINA TLUSTOS Food Safety Authority of Ireland Abbey Court Lower Abbey St. Dublin 1. [email protected] Tel. +353 1 8171311 Fax. + 353 1 8171301
Italy Dr. PAOLO STACCHINI
Istituto Superiore di Sanità V.le Regina Elena 299. Roma. [email protected] Tel. +39649902533 Fax. +39649387101
the Netherlands Dr. ROB RITSEMA
State Institute for Public Health and the Environment (RIVM-LACEL) Postbus 1. NL-3720 BA Bilthoven [email protected] Tel.: 31.30.2742570 Fax: 31.30.2744455 Dr. PETRA KRYSTEK [email protected] Tel. +31-(0)30-274-2016
Norway Dr. CHRISTINA BERGSTEN
Norwegian Food Control Authority P.O. Box 8187 Dep. 0034 Oslo, Norway [email protected] Tel. +47 23 21 67 87 Fax. +47 23 21 70 00
Portugal Dr. MARIA ANTONIA CALHAU Centro de Segurança Alimentar e Nutrição Instituto Nacional De Saude Dr Ricardo Jorge Av. Padre Cruz. 1649-016 Lisboa [email protected] Tel. +351-217164111 Fax +351-217590441
SCOOP 3.2.11 – Intake of As, Cd, Pb and Hg
19
Sweden Dr. WULF BECKER
National Food Administration Information & nutrition Dept. Box 622 SE-751 26 Uppsala [email protected] Tel: +46 18 175731 Fax: +46 18 105848 Ms. BIRGITTA SUNDSTRÖM National Food Administration Research and development Dept. [email protected] Tel: +46 18 175677
United Kingdom Dr. SARAH J. ROWLES
Food Standards Agency Aviation House, 25 Kingsway, London WC2B 6NH [email protected] Tel. +44 (0) 20 7 276 8708 Ms. ELIZABETH RIPPON [email protected]
Co-ordinators: Mr. LARS JORHEM (Sweden)
National food Administration, Research and development Dept. Box 622 SE-751 26 Uppsala [email protected] Tel. +46 18 175673 Fax. +46 18 105848
Dr. MASSIMO BALDINI (Italy) Istituto Superiore di Sanità. V.le Regina Elena 299-Roma [email protected] Tel. +39649902533 Fax. +39649387101
Scientific secretary: Dr. FRANCESCO. CUBADDA
Istituto Superiore di Sanità. V.le Regina Elena 299-Roma [email protected] Tel. +39649902740 Fax. +39649387101
SCOOP 3.2.11 – Intake of As, Cd, Pb and Hg
20
1.10 Glossary AQA analytical quality assurance CRM certified reference material CV-AAS cold vapour - atomic absorption spectrometry DA dry ashing ETA-AAS atomic absorption spectrophotometry-electrothermal atomization FAAS flame atomic absorption spectrometry GC- QFAAS gas-chromatography-quartz furnace atomic absorption spectrometry GC-MS gas-chromatography-mass-spectrometry GF-AAS graphite furnace - atomic absorption spectrometry HG-AAS hydride generation – atomic absorption spectrometry ICP-AES inductively coupled plasma - atomic emission spectrometry ICP-MS inductively coupled plasma - mass spectrometry LOD limit of detection LOQ limit of quantification PT proficiency testing PTDI provisional tolerable daily intake PTWI provisional tolerable weekly intake SCF scientific committee for food SCOOP scientific co-operation on questions relating to food (directive 93/5/EEC) VM voltammetric methods WG wet digestion

SCOOP 3.2.11 – Intake of As, Cd, Pb and Hg
21
2. DIETARY INTAKE OF ARSENIC 2.1 Toxicology Arsenic is present in seafood at high concentration levels, presumably mainly as organically bound arsenic species. The methylated forms of the element (e.g. dimethylarsinate) have a low level of toxicity, and the principal arsenic species found in fish and crustaceans, arsenobetaine, is considered virtually non-toxic. In shellfish, molluscs and seaweed dimethylarsinyl-riboside derivatives, known as arsenosugars, are the dominating species. The toxicity of these species is not known in detail but appears to be reasonably low. Inorganic arsenic, present as As(III) and As (V), found in food are the most toxic forms. Therefore information about both inorganic and total (i.e. organic + inorganic) arsenic would have been valuable for the aim of the task. No data on the levels of inorganic As became available during the project, however. Symptoms of chronic arsenic poisoning include weakness, debility, and lassitude, loss of hair, hoarseness and loss of weight. Arsenic is also considered to be carcinogenic (ref. 1-6). 2.2 Recommendations on intake limitations A PTWI has been established for arsenic in drinking water (0.015 mg kg-1 bodyweight) in the form of inorganic arsenic, but not for other foodstuffs (WHO 1989) The report (WHO 1989) indicated that certain ethnical and regional populations with a large consumption of fish had arsenic intakes (in the form of organoarsenicals) of about 0.050 mg/kg body weight, without any report of ill effects. This corresponds to a daily intake of 3.5 mg for a person weighing 70 kg. No recommendations are presently given for the intake of arsenic by children. 2.3 Intake of arsenic by the mean adult population Eleven Member States submitted data for the mean adult population (BE for 14-18 year olds). In addition, several Member States submitted data for other population groups (Table 1.1) The total consumption of food for which there are occurrence data available are shown in Table 2.1. Most of the arsenic in our food comes from fish and other seafood (Table 2.2). Nine Member States have submitted data for these food groups. For most of the other food groups the available data are very limited, with the exception of DK and the UK, which has carried out complete dietary intake surveys. It is thus difficult to make an accurate estimate of the total intake of arsenic in the different Member States. The data from DK and the UK, however, indicate that fish and other seafood provide more than 50% of the As to the daily diet. The daily intake of As from fish and other seafood is below 350 µg /day in all Member States. Assuming that fish provides approximately 50 % of the As in our diet, the total intake would be below 1000 µg/day. Table 2.3 which describes the intake on a weekly basis is included to facilitate comparison, since the other elements in this project are shown in relation to the PTWI, which is based on the weekly consumption.

SCOOP 3.2.11 – Intake of As, Cd, Pb and Hg
22
Table 2.1. As. Consumption of food in g/day by the mean adult population in the Member States. The figures are based on products for which occurrence data for As are available. Food group BE DK FI FR DE HE IR IT PT SE UK MeanMilk and milk products 426 420 0.1 281 282 Condensed and milk powder, cheese, yoghurt
50 41 60 50
Fats and oils 79 21 27 42 Fruit and vegetables 424 353 352 0.472 379 302 Confectionary 44 5.9 25 Cereals and bakery wares 227 63 188 43 209 146 Meat 107 175 88 88 114 Offal 2.0 0.9 1 1.3 Fish 13 23 39 30 16 18 32 27 14 24 Bivalves, crustaceans and cephalopods
2.5 0.8 2.6 2.0
Eggs 36 33 14 28 Sweeteners 13 8.1 63 28 Salts and spices 9.3 2.3 5.8 Beverages 16531 7173 3761 0.2 937 737 Ready to eat 2 2 Sum 16 3069 458 1172 1227 21 89 82 0.2 27 2075 178 1Including drinking water. 2 Dried and preserved fruit. 3 Water + alcoholic beverages In Greece the As-intake is extremely low (Table 2.2), which is surprising since the consumption of fish and other seafood is of the same order of magnitude as in most other Member States. The occurrence data for fish from Greek studies indicate much lower As-levels than in all other Member States. Possible reasons for this will be discussed in section 2.6. Table 2.2. Arsenic. Daily Intake (µg/day) by the Mean Adult Population. Food BE DK FI FR DE HE IR IT PT SE UK MeanMilk and dairy products 3.9 1 0.16 0.11 1.3 Fats and oils 0.10 0.08 0.09 Fruits and vegetable 6.2 7.4 7.60 0.005 0.95 4.4 Cereals and bakery wares 8.3 0.8 9.40 0.76 2.0 4.2 Meat and offal 2.6 3.52 0.98 0.29 1.8 Fish 240 32.7 13.7 135 11.2 0.4 308 101 61.0 100 Bivalves, cephalopods, crustaceans
25 1.10 0.05 8.7
Eggs 0.2 0.17 0.01 0.13 Sweeteners 0.08 0.015 0.32 0.14 Salts and spice 2.0 0.17 1.1 Beverages 9.71 2.82 3.3 0.001 1.0 3.4 Ready to eat 0.01 0.01 Sum 265 64 15 148 37 0.5 0.98 309 0.001 101 65.8 125 1Including drinking water. 2 Water + alcoholic beverages

SCOOP 3.2.11 – Intake of As, Cd, Pb and Hg
23
Table 2.3. Arsenic. Weekly Intake (µg/week) by the Mean Adult Population Food BE DK FI FR DE HE IR IT PT SE UK MeanMilk and dairy products 27.3 7 1.10 0.77 9.0 Fats and oils 0.72 0.56 0.64 Fruit and vegetables 43.4 51.6 53.2 0.04 6.65 31 Cereals and bakery wares 58.1 5.5 65.8 5.32 14 30 Meat and offal 18.2 24.6 6.86 2.06 13 Fish 1680 228.9 95.9 943 78.4 2.8 2156 707 427 702 Bivalves, cephalopods, crustaceans,
175 7.69 0.35 61
Eggs 1.4 1.17 0.07 0.88 Sweeteners 0.55 0.105 2.24 0.97 Salts and spices 14.2 1.19 7.7 Beverages 67.91 19.42 22.9 0.007 7 23 Ready to eat 0.07 0.07 Sum 1885 445 103 1034 257 3.2 6.9 2161 0.007 707 460 880 1Including drinking water. 2 Water + alcoholic beverages The origin of the fish, i.e. the type of water in which it was caught is of great importance. Fish from marine waters have arsenic-levels up to ten times higher than fish from brackish waters, which in turn has levels up to ten times higher than fish from freshwater lakes and rivers. This makes an intake estimation very complicated and uncertain, since the same species of fish can live in different types of water. For example, cod and herring exist in both marine and brackish water, pike and perch in both brackish and fresh water (see reference SE 001 in Annex A). At the present time there are no data available describing how large is the part of the total arsenic in the diet that consists of the more toxic inorganic species (As(III) & As(V)). 2.4 Intake of arsenic by children: Mean population Data was reported for three different age groups by DE and FR (Table 2.4). However, no recommendations are presently given for the intake of arsenic by children. For the smaller children in DE the intake is in the order of 50% of the mean adult population, and for the older children approximately 75%. In FR the intake by children is near 70% of the mean adult population. This estimation is, however, based on very few food groups. In DE the As-intake is reported to be larger from cereals and bakery wares than from fish. High level daily intake intake by children in the mean population group, as well as by children in the consumers only group are shown in section 2.8, table 2.24. 2.5 Legislation There is presently no legislation in force for arsenic in foodstuffs within the EU.
SCOOP 3.2.11 – Intake of As, Cd, Pb and Hg
24
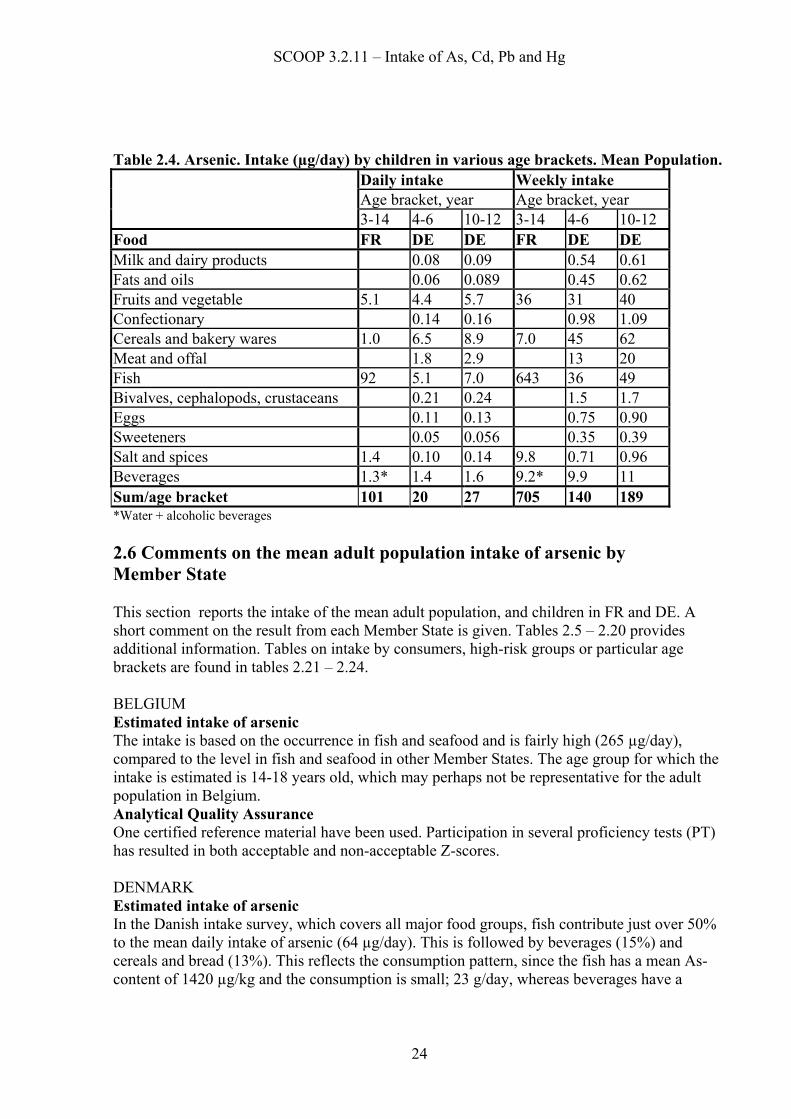
Table 2.4. Arsenic. Intake (µg/day) by children in various age brackets. Mean Population. Daily intake Weekly intake Age bracket, year Age bracket, year 3-14 4-6 10-12 3-14 4-6 10-12
Food FR DE DE FR DE DE Milk and dairy products 0.08 0.09 0.54 0.61 Fats and oils 0.06 0.089 0.45 0.62 Fruits and vegetable 5.1 4.4 5.7 36 31 40 Confectionary 0.14 0.16 0.98 1.09 Cereals and bakery wares 1.0 6.5 8.9 7.0 45 62 Meat and offal 1.8 2.9 13 20 Fish 92 5.1 7.0 643 36 49 Bivalves, cephalopods, crustaceans 0.21 0.24 1.5 1.7 Eggs 0.11 0.13 0.75 0.90 Sweeteners 0.05 0.056 0.35 0.39 Salt and spices 1.4 0.10 0.14 9.8 0.71 0.96 Beverages 1.3* 1.4 1.6 9.2* 9.9 11 Sum/age bracket 101 20 27 705 140 189 *Water + alcoholic beverages
2.6 Comments on the mean adult population intake of arsenic by Member State This section reports the intake of the mean adult population, and children in FR and DE. A short comment on the result from each Member State is given. Tables 2.5 – 2.20 provides additional information. Tables on intake by consumers, high-risk groups or particular age brackets are found in tables 2.21 – 2.24. BELGIUM Estimated intake of arsenic The intake is based on the occurrence in fish and seafood and is fairly high (265 µg/day), compared to the level in fish and seafood in other Member States. The age group for which the intake is estimated is 14-18 years old, which may perhaps not be representative for the adult population in Belgium. Analytical Quality Assurance One certified reference material have been used. Participation in several proficiency tests (PT) has resulted in both acceptable and non-acceptable Z-scores. DENMARK Estimated intake of arsenic In the Danish intake survey, which covers all major food groups, fish contribute just over 50% to the mean daily intake of arsenic (64 µg/day). This is followed by beverages (15%) and cereals and bread (13%). This reflects the consumption pattern, since the fish has a mean As-content of 1420 µg/kg and the consumption is small; 23 g/day, whereas beverages have a
SCOOP 3.2.11 – Intake of As, Cd, Pb and Hg
25
content of only 6 µg/kg, but the consumption is 1653 g/day. Data other than fish are considerably older (1987 and earlier), but considered valid for the purpose. Analytical Quality Assurance A marine CRM was analysed together with the fish survey. The results were acceptable. No results from PT-programmes were reported. FINLAND Estimated intake of arsenic Fish and milk are included. The mean As-intake is 15 µg/day, of which 14 µg comes from fish. This low intake from fish is probably due to consumption primarily of fish from fresh and brackish water. Analytical Quality Assurance Use of CRMs and participation in PT programmes is reported, but no analytical data were provided. FRANCE Estimated intake of arsenic The survey covers several types of foodstuffs, corresponding to a consumption of 1172 g/day on 2195 g/day in total. Fish and fish products contribute 135 µg to the mean daily intake of 148 µg/day (95%). For children (3-14 years) the daily intake is 101 µg, of which fish contribute 92 µg (91%). Analytical Quality Assurance Two certified reference materials has been used, as well as participation in relevant fish and fish products PTs, with acceptable results. GERMANY Estimated intake of arsenic The survey contains several different foodstuffs, including fish, crustaceans and bivalves that together provide 12.3 µg (33%) to the mean daily intake of 37 µg: The contribution from vegetables, fruits and cereals is 17 µg. (46 %). For children (4-6 years) the daily intake is 20 µg, of which fish, crustaceans and bivalves contribute 5.3 µg (26%). Older children (10-12 years) have an intake of 27µg/day, of which fish, crustaceans and bivalves contribute 7.2 µg/day (27%) Analytical Quality Assurance Acceptable results for several certified reference material and participation in PT-programmes are reported. GREECE Estimated intake of arsenic The mean daily intake of arsenic is extremely low, only 0.045 µg/day. This is several orders of magnitude lower than in any other country that has reported intake values based, wholly or partly, on fish. The reported arsenic level in fish is on average 19-22 µg/kg. Most of the fish analysed in Greece is assumed to be of Mediterranean origin. It is surprising to find such low levels in marine species. Concentrations at this level are usually only found in freshwater species. It is noteworthy that all the results come from one laboratory. The data has not been verified by, e.g., analysis in an independent laboratory and must be viewed with caution.
SCOOP 3.2.11 – Intake of As, Cd, Pb and Hg
26
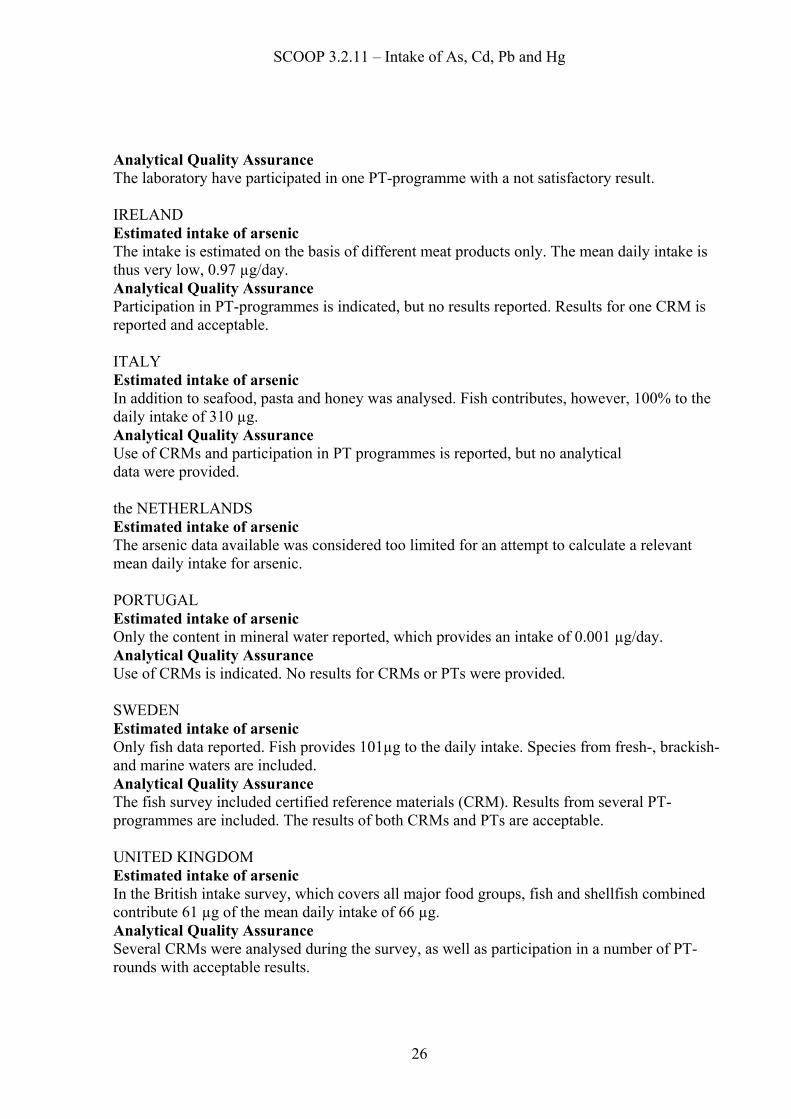
Analytical Quality Assurance The laboratory have participated in one PT-programme with a not satisfactory result. IRELAND Estimated intake of arsenic The intake is estimated on the basis of different meat products only. The mean daily intake is thus very low, 0.97 µg/day. Analytical Quality Assurance Participation in PT-programmes is indicated, but no results reported. Results for one CRM is reported and acceptable. ITALY Estimated intake of arsenic In addition to seafood, pasta and honey was analysed. Fish contributes, however, 100% to the daily intake of 310 µg. Analytical Quality Assurance Use of CRMs and participation in PT programmes is reported, but no analytical data were provided. the NETHERLANDS Estimated intake of arsenic The arsenic data available was considered too limited for an attempt to calculate a relevant mean daily intake for arsenic. PORTUGAL Estimated intake of arsenic Only the content in mineral water reported, which provides an intake of 0.001 µg/day. Analytical Quality Assurance Use of CRMs is indicated. No results for CRMs or PTs were provided. SWEDEN Estimated intake of arsenic Only fish data reported. Fish provides 101µg to the daily intake. Species from fresh-, brackish- and marine waters are included. Analytical Quality Assurance The fish survey included certified reference materials (CRM). Results from several PT-programmes are included. The results of both CRMs and PTs are acceptable. UNITED KINGDOM Estimated intake of arsenic In the British intake survey, which covers all major food groups, fish and shellfish combined contribute 61 µg of the mean daily intake of 66 µg. Analytical Quality Assurance Several CRMs were analysed during the survey, as well as participation in a number of PT-rounds with acceptable results.

SCOOP 3.2.11 – Intake of As, Cd, Pb and Hg
27
2.7 Comments on arsenic in specific food groups Only seafood has a major impact on the intake of arsenic (see Table 2.14 Arsenic in fish and fish products including MCE). Nine Member States reported results for fish and other seafood.The intake range from 0.4 (HE) to 308 µg/day (IT) for the mean adult population. For the high level the intake range up to 901 µg/day (BE). The daily consumption of fish is similar within the Member States and range between 13 – 39 g/day. Other food groups will therefore not be commented on. All specific results are shown in tables 2.5 – 2.20. Table 2.5. Arsenic in dairy products, excluding products of category 2: Milk (Cat. 1.1-1.5) Member State Consumption (g/day) Mean level in
food (µg/g) Intake (µg/day) % of total
dietary intake Mean level High level Mean l. High l. DENMARK 426 0.007 2.8 4.4 FINLAND 419.5 <0.005 1.00 6.8 U. K. 281 0.0004 0.11 <1 Table 2.6. Arsenic in dairy products, excluding products of category 2: Cheese (Cat. 1.6) Member State Consumption (g/day) Mean level in
food (µg/g) Intake (µg/day) % of total
dietary intake Mean level High level Mean l. High l. DENMARK 50 0.021 1.1 1.7 GERMANY 41.25 111.2 0.004 0.157 0.423 2.3 U. K. 60 0.002 0.12 <1 Table 2.7. Arsenic in fats and oils (Cat. 2) Member State Consumption (g/day) Mean level in
food (µg/g) Intake (µg/day) % of total
dietary intake Mean level High level Mean l. High l. GERMANY 20.53 50.7 0.005 0.103 0.254 1.1 U. K. 27 0.003 0.08 <1 Table 2.8. Arsenic in fruit (Cat. 4.1) Member State Consumption (g/day) Mean level in
food (µg/g) Intake (µg/day) % of total
dietary intake Mean level High level Mean l. High l. DENMARK 154 0.007 1.1 1.7 GERMANY 102 293 0.006 0.615 1.756 5.7 GREECE* 0.47 0 0.01 0.0047 0 1.04 U. K. 113 0.0015 0.18 <2 * Dried and preserved fruit

SCOOP 3.2.11 – Intake of As, Cd, Pb and Hg
28
Table 2.9. Arsenic in vegetables, incl. mushrooms & fungi, roots, tubers, pulses, legumes, nuts and seeds (Cat. 4.2) Member State Consumption (g/day) Mean level in
food (µg/g) Intake (µg/day) % of total
dietary intake Mean level High level Mean l. High l. DENMARK 270 0.019 5.1 8.0 FRANCE 353 702 0.021 7.4 14.6 5.0 GERMANY 250 508 0.014-0.009 6.99 15.15 13.9 U. K. 266 0.0028 0.77 <1 Table 2.10. Arsenic in confectioneries (Cat. 5) Member State Consumption (g/day) Mean level in
food (µg/g) Intake (µg/day) % of total
dietary intake Mean level High level Mean l. High l. GERMANY 5.86 28.6 0.015 0.088 0.429 0.3 Table 2.11. Arsenic in cereals and cereal products, incl. flours & starches from roots & tubers, pulses & legumes, excluding bakery wares (Cat. 6) Member State Consumption (g/day) Mean level in
food (µg/g) Intake (µg/day) % of total
dietary intake Mean level High level Mean l. High l. DENMARK* 227 0.037 8.3 13.1 FRANCE 62.9 164.3 0.013 0.8 2.1 0.53 GERMANY** 188 343 0.05 9.40 17.2 10.5 ITALY 42.5 47 0.018 0.765 0.846 0.25 U. K*. 209 0.006 2.0 4 *Cereals and bread. **Cereals and bakery wares Table 2.12. Arsenic in meat and meat products, including poultry and game (Cat. 8). Member State Consumption (g/day) Mean level in
food (µg/g) Intake (µg/day) % of total
dietary intake Mean level High level Mean l. High l. DENMARK 107 0.024 2.6 4.1 GERMANY 175 389 0.009-0.033 3.51 7.94 9.7 IRELAND 87.85 192.71 0.0037-0.01 0.97 2.02 U. K. 88 0.0033 0.29 <3 Table 2.13. Arsenic in offals (Cat. 8). Member State Consumption (g/day) Mean level in
food (µg/g) Intake (µg/day) % of total
dietary intake Mean level High level Mean l. High l. GERMANY 1.95 17.9 0.02 0.039 0.358 0.11 IRELAND 0.876 0 0.010 0.0088 0 U. K. 1 0.004 0.004 <1

SCOOP 3.2.11 – Intake of As, Cd, Pb and Hg
29
Table 2.14. Arsenic in fish and fish products, including molluscs, crustaceans and echinoderms (Cat. 9) Member State Consumption (g/day) Mean level in
food (µg/g) Intake (µg/day) % of total
dietary intake Mean level High level Mean l. High l. BELGIUM 16 61 3.4-18.0 265 901 100 DENMARK* 23 1.42 32.7 51.4 FINLAND* 38.8 0.017-1.0 13.71 93.2 FRANCE* 29.8 87.1 4.5 134.7 394.3 91.2 GERMANY 16.9 63.4 0.694-1.409 12.3 45.4 0.94 GREECE 20.6 89 0.019-0.022 0.445 1.904 97.98 ITALY 31.8 48.3 9.7 308.46 468.51 100 SWEDEN* 27.3 0.15-4.8 101 100 U. K. 14 4.4 61 94 * only fish and fish products Table 2.15. Arsenic in eggs and egg products (Cat.10) Member State Consumption (g/day) Mean level in
food (µg/g) Intake (µg/day) % of total
dietary intake Mean level High level Mean l. High l. DENMARK 36 0.006 0.2 0.3 GERMANY 33.4 81 0.005 0.167 0.405 1.9 U. K. 14 0.001 0.01 <1 Table 2.16. Arsenic in sweeteners including honey (Cat 11) Member State Consumption (g/day) Mean level in
food (µg/g) Intake (µg/day) % of total
dietary intake Mean level High level Mean l. High l. GERMANY 13.0 54.1 0.005-0.009 0.079 0.337 0.72 ITALY 8.1 16.9 0.0018 0.01458 0.0304 0.005 U. K. * 63 0.005 0.32 <1 *Including preserves Table 2.17 Arsenic in salt, spices, soups, sauces, salads, protein products etc (Cat 12) Member State Consumption (g/day) Mean level in
food (µg/g) Intake (µg/day) % of total
dietary intake Mean level High level Mean l. High l. FRANCE* 9.3 23.3 0.219 2.0 5.1 1.4 GERMANY 2.26 6.0 0.02-0.097 0.171 0.405 0.13 * Excluding soups

SCOOP 3.2.11 – Intake of As, Cd, Pb and Hg
30
Table 2.18. Arsenic in non-alcoholic ("soft") beverages (Cat. 14.1) Member State Consumption (g/day) Mean level in
food (µg/g) Intake (µg/day) % of total
dietary intake Mean level High level Mean l. High l. DENMARK* 1653 0.006 9.7 15.3 FRANCE** 556.9 1234.3 0.0028 1.6 3.5 1.1 GERMANY 329 1051 0.002-0.006 1.45 4.79 18.2 PORTUGAL 0.165 0.007885 0.0013 U. K 937 0.001 1.0 2 * Including drinking water. ** Only water. Table 2.19. Arsenic in alcoholic beverages, incl. alcohol-free and low-alcoholic counterparts (Cat. 14.2) Member State Consumption (g/day) Mean level in
food (µg/g) Intake (µg/day) % of total
dietary intake Mean level High level Mean l. High l. FRANCE 159.9 628.6 0.0075 1.2 4.7 0.81 GERMANY 47.0 222 0.039 1.83 8.67 2.6 * only wine Table 2.20. Arsenic in ready to eat (Cat 15) Member State Consumption (g/day) Mean level in
food (µg/g) Intake (µg/day) % of total
dietary intake Mean level High level Mean l. High l. U. K. 2 0.006 0.01 <1

SCOOP 3.2.11 – Intake of As, Cd, Pb and Hg
31
2.8 Estimated daily intake of arsenic by other population groups The UK has complete intake studies for consumers. The data from the UK, as well as data on high level intake for the mean adult population and consumers by other Member States, are presented in tables 2.21 – 2.23. The intake estimates for certain children groups in DE and FR are found in table 2.24. Table 2.21. Arsenic. Daily Intake (µg/day) by the Mean Adult Population. High Level. Food group BE FR DE HE IR IT Milk and dairy products 0.43 Fats and oils 0.25 Fruit and vegetables 14.6 16.9 0 Cereals and bakery wares 2.1 17.2 0.85 Meat and offal 8.30 2.02 Fish 858 394 42.7 1.56 469 Bivalves, cephalopods, crustaceans, squid 43 2.68 0.342 Eggs 0.41 Sweeteners 0.34 0.03 Salt and spices 5.1 0.40 Beverages 3.5-4.7* 13.5 *Water + alcoholic beverages Table 2.22. Arsenic Daily Intake (µg/day) by Adult Consumers Only. Mean level Food group BE FR DE HE IR UK Milk, milk products 0.09 Condensed, powder milk, cheese, yoghurt 0.17 0.11 Fats and oils 0.10 0.05 Fruits and vegetables 7.37 8.3 0.12 0.98 Confectionary 0.20 0.09 Cereals and bakery wares 0.9 9.4 1.4 Meat 4.3 2.36 0.47 Offal 0.29 0.07 Fish and fish products 424 170 20.6 0.902 146 Bivalve, crustaceans and cephalopods 455 20.6 0.703 61 Eggs 0.17 0.03 Sweeteners 0.139 Salts and spices 2.1 0,173 Beverages 1.7-1.7* 4.95 0.67 Ready to eat 0.03 Total intake 120 *Water + alcoholic beverages
SCOOP 3.2.11 – Intake of As, Cd, Pb and Hg
32
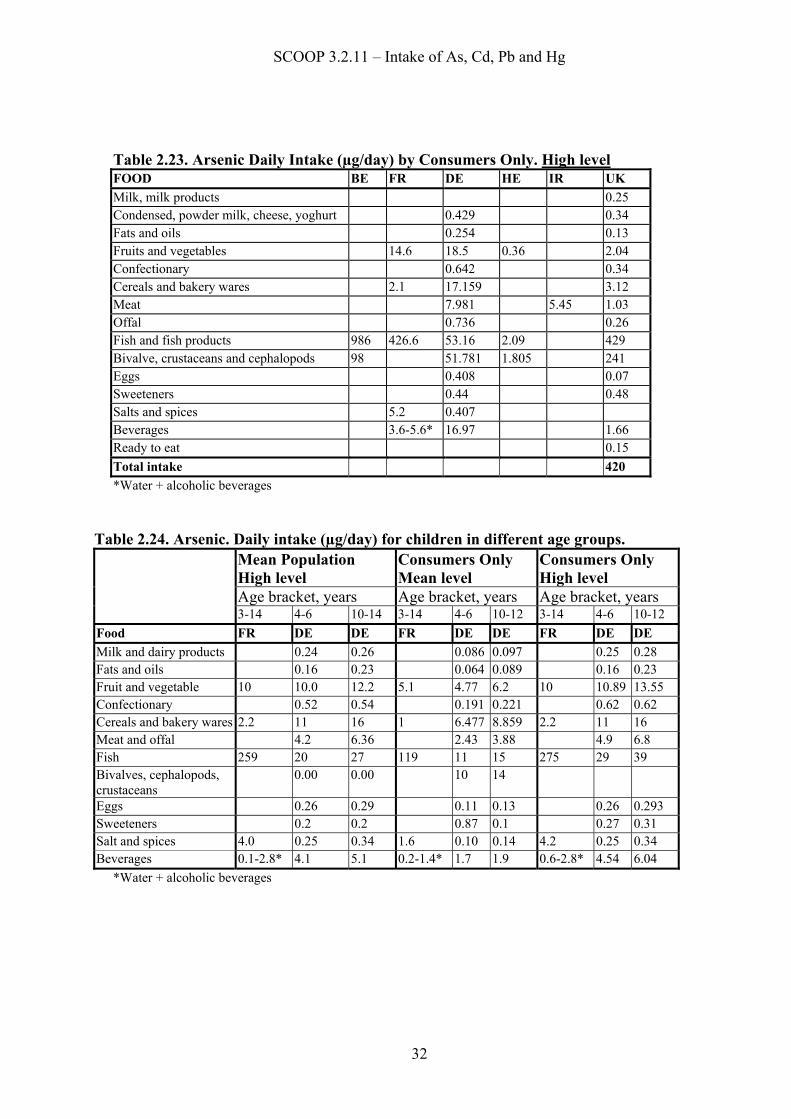
Table 2.23. Arsenic Daily Intake (µg/day) by Consumers Only. High level FOOD BE FR DE HE IR UK Milk, milk products 0.25 Condensed, powder milk, cheese, yoghurt 0.429 0.34 Fats and oils 0.254 0.13 Fruits and vegetables 14.6 18.5 0.36 2.04 Confectionary 0.642 0.34 Cereals and bakery wares 2.1 17.159 3.12 Meat 7.981 5.45 1.03 Offal 0.736 0.26 Fish and fish products 986 426.6 53.16 2.09 429 Bivalve, crustaceans and cephalopods 98 51.781 1.805 241 Eggs 0.408 0.07 Sweeteners 0.44 0.48 Salts and spices 5.2 0.407 Beverages 3.6-5.6* 16.97 1.66 Ready to eat 0.15 Total intake 420 *Water + alcoholic beverages
Table 2.24. Arsenic. Daily intake (µg/day) for children in different age groups. Mean Population High level
Consumers Only Mean level
Consumers Only High level
Age bracket, years Age bracket, years Age bracket, years 3-14 4-6 10-14 3-14 4-6 10-12 3-14 4-6 10-12
Food FR DE DE FR DE DE FR DE DE Milk and dairy products 0.24 0.26 0.086 0.097 0.25 0.28 Fats and oils 0.16 0.23 0.064 0.089 0.16 0.23 Fruit and vegetable 10 10.0 12.2 5.1 4.77 6.2 10 10.89 13.55 Confectionary 0.52 0.54 0.191 0.221 0.62 0.62 Cereals and bakery wares 2.2 11 16 1 6.477 8.859 2.2 11 16 Meat and offal 4.2 6.36 2.43 3.88 4.9 6.8 Fish 259 20 27 119 11 15 275 29 39 Bivalves, cephalopods, crustaceans
0.00 0.00 10 14
Eggs 0.26 0.29 0.11 0.13 0.26 0.293 Sweeteners 0.2 0.2 0.87 0.1 0.27 0.31 Salt and spices 4.0 0.25 0.34 1.6 0.10 0.14 4.2 0.25 0.34 Beverages 0.1-2.8* 4.1 5.1 0.2-1.4* 1.7 1.9 0.6-2.8* 4.54 6.04
*Water + alcoholic beverages

SCOOP 3.2.11 – Intake of As, Cd, Pb and Hg
33
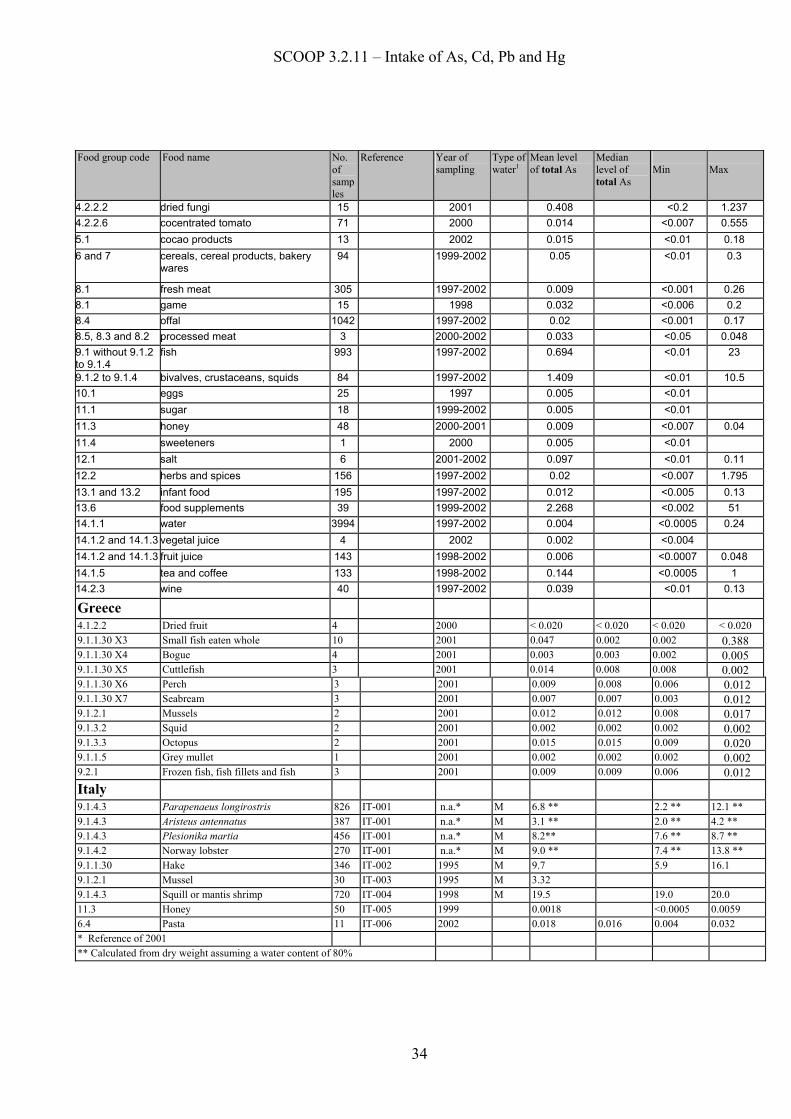
2.9 Occurrence summary table for arsenic This table contain summaries of occurrence data that has been used in the intake calculation. It provides information on the mean concentration level, median levels where available and minimum and maximum values.
Table 2.25. Arsenic. Occurrence, summary data for individual food samples. Unit: mg/kg Food group code Food name No.
of samples
Reference Year of sampling
Type of water1
Mean level of total As
Median level of total As
Min
Max
Belgium
1 dairy product 216 < 0.050 0.093 4 algae 10 42.732 31.805 20.51 97.18 8 meat 4 < 0.120 9 fish 165 17.95 0.513 132.23 10 bivalves, cephalopods 33 28.42 0.62 203.93 11 crustaceans 36 3.351 0.7 11.562 13 honey 1 < 0.050 15 dietetic formulae 5 < 0.12
Denmark
Fish 225 DK-004 1993-97 1.42 0.95 0.14 11.50
Finland
1.1.1 milk 10 FI 005 2001 <0.005 9.1.1 rainbow trout 8 FI 006 2001 1.01 0.579 1.52 9.1.1 pike 15 FI 007 2001-2002 0.092 0.022 0.17 9.1.1 perch 28 FI 007 2002 0.080 0.01 0.288 9.1.1 sprat 6 FI 007 2002 0.56 0.465 0.671 9.1.1 Pike perch 10 FI 007 2002 0.090 0.009 0.223 9.1.1 salmon 8 FI 007 2002 0.735 0.358 0.96 9.1.1 bream 4 FI 007 2002 0.037 0.021 0.052 9.1.1 vendace 7 FI 007 2002 0.062 0.044 0.103 9.1.1 burbot 7 FI 007 2002 0.093 0.027 0.149 9.1.1 powan 3 FI 007 2002 0.017 0.007 0.034 9.1.1 Baltic herring 32 FI 007 2002 0.414 0.155 1.08
France
4 Fruits and vegetables 30 FR 006 2000-2001 0.021 < 0.005 0.100 6 Cereals and cereal products 19 FR 006 2001 < 0.0125 < 0.0125 < 0.0125 9 Fish and fish products 60 FR 004 2000 4.52 0.68 23 14 Salts, spices, sauces, excl. Soups 130 FR 006 2000-2001 0.219 < 0.0015 2.2 16 Waters (mineral and spring) 76 FR 006 2000-2001 0.0028 < 0.00125 0.016 18 Alcoholic beverages 39 FR 006 2000-2001 0.0075 < 0.0015 0.019
Germany 1.1 milk 3 1999 0.003 <0.005 1.6 cheese 68 1997-2000 0.004 <0.001 <0.01 2 oil 1 2001 0.005 <0.01 4.1 fruits 963 1997-2002 0.006 <0.0002 0.055 4.2 nuts and seeds 163 1997-2001 0.029 <0.007 0.17 4.2 vegetable 1172 1997-2002 0.027 <0.0007 3.5 4.2 fungi 57 1999-2001 0.09 <0.01 1.2 4.2.2.2 dried algae 51 2000-2002 36.8 <0.025 105
SCOOP 3.2.11 – Intake of As, Cd, Pb and Hg
34
Food group code Food name No. of samples
Reference Year of sampling
Type of water1
Mean level of total As
Median level of total As
Min
Max
4.2.2.2 dried fungi 15 2001 0.408 <0.2 1.237 4.2.2.6 cocentrated tomato 71 2000 0.014 <0.007 0.555 5.1 cocao products 13 2002 0.015 <0.01 0.18 6 and 7 cereals, cereal products, bakery
wares 94 1999-2002 0.05 <0.01 0.3
8.1 fresh meat 305 1997-2002 0.009 <0.001 0.26 8.1 game 15 1998 0.032 <0.006 0.2 8.4 offal 1042 1997-2002 0.02 <0.001 0.17 8.5, 8.3 and 8.2 processed meat 3 2000-2002 0.033 <0.05 0.048 9.1 without 9.1.2 to 9.1.4
fish 993 1997-2002 0.694 <0.01 23
9.1.2 to 9.1.4 bivalves, crustaceans, squids 84 1997-2002 1.409 <0.01 10.5 10.1 eggs 25 1997 0.005 <0.01 11.1 sugar 18 1999-2002 0.005 <0.01 11.3 honey 48 2000-2001 0.009 <0.007 0.04 11.4 sweeteners 1 2000 0.005 <0.01 12.1 salt 6 2001-2002 0.097 <0.01 0.11 12.2 herbs and spices 156 1997-2002 0.02 <0.007 1.795 13.1 and 13.2 infant food 195 1997-2002 0.012 <0.005 0.13 13.6 food supplements 39 1999-2002 2.268 <0.002 51 14.1.1 water 3994 1997-2002 0.004 <0.0005 0.24 14.1.2 and 14.1.3 vegetal juice 4 2002 0.002 <0.004 14.1.2 and 14.1.3 fruit juice 143 1998-2002 0.006 <0.0007 0.048 14.1.5 tea and coffee 133 1998-2002 0.144 <0.0005 1 14.2.3 wine 40 1997-2002 0.039 <0.01 0.13
Greece
4.1.2.2 Dried fruit 4 2000 < 0.020 < 0.020 < 0.020 < 0.020 9.1.1.30 X3 Small fish eaten whole 10 2001 0.047 0.002 0.002 0.3889.1.1.30 X4 Bogue 4 2001 0.003 0.003 0.002 0.0059.1.1.30 X5 Cuttlefish 3 2001 0.014 0.008 0.008 0.0029.1.1.30 X6 Perch 3 2001 0.009 0.008 0.006 0.0129.1.1.30 X7 Seabream 3 2001 0.007 0.007 0.003 0.0129.1.2.1 Mussels 2 2001 0.012 0.012 0.008 0.0179.1.3.2 Squid 2 2001 0.002 0.002 0.002 0.0029.1.3.3 Octopus 2 2001 0.015 0.015 0.009 0.0209.1.1.5 Grey mullet 1 2001 0.002 0.002 0.002 0.0029.2.1 Frozen fish, fish fillets and fish 3 2001 0.009 0.009 0.006 0.012Italy
9.1.4.3 Parapenaeus longirostris 826 IT-001 n.a.* M 6.8 ** 2.2 ** 12.1 ** 9.1.4.3 Aristeus antennatus 387 IT-001 n.a.* M 3.1 ** 2.0 ** 4.2 ** 9.1.4.3 Plesionika martia 456 IT-001 n.a.* M 8.2** 7.6 ** 8.7 ** 9.1.4.2 Norway lobster 270 IT-001 n.a.* M 9.0 ** 7.4 ** 13.8 ** 9.1.1.30 Hake 346 IT-002 1995 M 9.7 5.9 16.1 9.1.2.1 Mussel 30 IT-003 1995 M 3.32 9.1.4.3 Squill or mantis shrimp 720 IT-004 1998 M 19.5 19.0 20.0 11.3 Honey 50 IT-005 1999 0.0018 <0.0005 0.0059 6.4 Pasta 11 IT-006 2002 0.018 0.016 0.004 0.032 * Reference of 2001 ** Calculated from dry weight assuming a water content of 80%

SCOOP 3.2.11 – Intake of As, Cd, Pb and Hg
35
Food group code Food name No.
of samples
Reference Year of sampling
Type of water1
Mean level of total As
Median level of total As
Min
Max
Ireland
acid casein powder 43 1995/1996 0.0200 <0.04 <0.04 Beef 157 1997/2001 0.0053 <0.001 <0.02 Beef (Muscle, Liver, Kidney) 56 2001 0.0100 <0.001 <0.001 Beef Liver 21 2001 0.0100 <0.02 <0.02 Farmed Game 7 2001 0.0100 <0.02 <0.02 Lamb (Muscle, Liver, Kidney) 23 2001 0.0100 <0.001 <0.02 Mackerel 1 2001 0.7900 Pork 100 1997/2001 0.0100 <0.02 <0.02 Pork (Muscle, Liver, Kidney) 9 2001 0.0100 <0.02 <0.02 Poultry 5 2001 0.0050 <0.01 <0.01 Poultry (Muscle, Liver, Kidney) 18 2001 0.0100 <0.02 <0.02 rennet casein powder 33 1995/1996 0.0200 <0.04 <0.04 skim milk powder 71 1995/1996 0.0200 <0.04 <0.04 Thyme 1 2001 0.7600 Wild Game Liver 36 2001 0.0100 <0.02 <0.02 Note: Table does not include all occurrence data, excluded are data for which reliable intake data could not be derived. Fuller occurrence dat are shown in Table 2.33.
Norway
8 Meat 81 2000-2001 0.023 <0.003 0.115 9 Shellfish 73 1994-1996 32.92 12.7 123
Portugal
fruits and vegetables (powder, concentrate and puree)
36 PT-010 1998-2002 <0.1 <0.1 <0.1 <0.1
frozen fruit 1 PT-010 2001 <0.1 <0.1 <0.1 <0.1 canned beans 3 PT-020 2001 <0.003 <0.005 chocolate 4 PT-020 2000-2002 0.0128 0.0062 0.017 cereals 4 PT-010 2000 <0.1 <0.1 <0.1 <0.1 cookies 1 PT-010 1998 <0.1 <0.1 <0.1 <0.1 sugars 80 PT-010-020 1997-2002 0.006 <0.1 artificial sweetners 2 PT-010 2000 <0.1 <0.1 <0.1 <0.1
natural mineral waters and source waters
13 PT-030 2000-2001 0.165 <0.005 0.025
beer 4 PT-010 1997 <0.1 <0.1 <0.1 <0.1 still wine 8 PT-020 2001-2002 0.004 0.004 0.003 0.007
Sweden
9.1.1 Fish 9 SE 001 1992-93 F* 0.089 0.018 0.21 9.2.4.2 Crayfish 6 SE 011 1992 F 0.17 0.15 0.19 9.1.1 Fish 16 SE 001 1992-93 B* 0.51 0.17 1.0 9.1.1 Fish 12 SE 001 1992-93 M* 4.67 0.59 17.0
*F=fresh water, B=brackish water, M=marine water
United Kingdom
Total Diet Study 7.1.1 Bread 20 UK/010 1997 0.005 0.002 0.007 6 Miscellaneous cereals 20 UK/010 1997 0.007 0.003 0.021 8 Carcase meat 20 UK/010 1997 0.003 0.001 0.006 8.4 Offal 20 UK/010 1997 0.004 <0.0009 0.0111 8.3 Meat Products 20 UK/010 1997 0.003 0.002 0.007 8 Poultry 20 UK/010 1997 0.004 <0.001 0.01 9 Fish 20 UK/010 1997 4.4 1.26 8.07 2 Oil & fats 20 UK/010 1997 0.003 <0.003 0.004

SCOOP 3.2.11 – Intake of As, Cd, Pb and Hg
36
Food group code Food name No. of samples
Reference Year of sampling
Type of water1
Mean level of total As
Median level of total As
Min
Max
United Kingdom cont.
10 Eggs 20 UK/010 1997 0.0009 <0.0009 <0.0009 4, 5, 11 Sugar and preserves 20 UK/010 1997 0.005 <0.003 0.009 4.2 Green vegetables 20 UK/010 1997 0.003 0.0006 0.0197 4.2 Potatoes 20 UK/010 1997 0.002 <0.001 0.007 4.2 Other Vegetables 20 UK/010 1997 0.005 0.0026 0.0112 4.2.2.4 Canned vegetables 20 UK/010 1997 0.0008 <0.0006 0.0023 4.1.1 Fresh fruit 20 UK/010 1997 0.0014 <0.0006 0.0055 4.1.2 Fruit products 20 UK/010 1997 0.0019 <0.0006 0.0065 14 Beverages 20 UK/010 1997 0.001 <0.0004 0.0019 1.1 Milk 20 UK/010 1997 0.0004 <0.0004 0.0004 1, 2.2.2 Dairy produce 20 UK/010 1997 0.002 <0.001 0.007 15.2 Nuts 20 UK/010 1997 0.006 <0.003 0.018
Ad hoc Surveys 9.1.1 Fish and Shellfish 110 UK/003 1996-1997 4.29 0.28 18.00 9.1.2 Fish and Shellfish 9 UK/003 1996-1997 2.20 0.63 3.40 9.1.3 Fish and Shellfish 3 UK/003 1996-1997 4.90 4.60 5.20 9.1.4 Fish and Shellfish 12 UK/003 1996-1997 14.04 7.90 34.00 9.1 - other Cockles and winkles 7 UK/003 1996-1997 2.35 1.40 3.20 9.2.2 Fish and Shellfish 3 UK/003 1996-1997 5.20 3.90 6.10 13 Infant Foods 96 UK/001/011 1997-1999 0.013 <0.0004 0.14 14 Beverages* 91 UK/004/005 1997 0.04 0.0002 0.15 4, 6, 14, 1, 16, 12, 2
Vegetarian Foods 99 UK/006/007 1997-1998 0.059 0.003 0.35
1, 7, 16, 15, 9, 18, 4, 12, 14, 6
Snack and Convenience foods 298 UK/002 1996-1999 0.224 0.003 16
1, 7, 16, 15, 9, 18, 4, 12, 14, 6
Snack and Convenience foods 298 UK/002 1996-1999 0.224 0.003 16
*Including 4 samples of 5.1(dried chocolate drinks) and 3 samples of 1.1.4 (flavoured milks/yoghurts) References for arsenic in 2.1 1. Medicine et Nutrition 1999, 35(2), 57-59. Arsenic in food: Consequences for human health Astier-Dumas M. 2. Kagaku Kogyo 1998, 49 (12), 941-947. Environmental effects of arsenic and antimony compounds. Maeda, Shigeru 3. Journal of Nutrition 2003, 133 (5s-1), 1536s-1538s. Health effects and risk assessment of arsenic. Abernathy, Carles O., Thomas, David J., Calderon, Rebecca L. 4. Recent Reasearch Developments in Agricultural & Food Chemistry 2001, 5, 55-71. Inorganic arsenic in foods; current overview and future challenges. Velez, Dinoraz, Montoro, Rosa. 5. Heavy Metals in the Environment 2002, 217-229. Environmental aspects of arsenic toxicity Hindmarsh, J. Thomas; Abernathy, Charles O.; Peters, Gregory R.; Mccurdy, Ross F. 6. Environmental Chemistry of Arsenic 2002, 95-116. Arsenic speciation in the environment and humans. Le, X Chris.

SCOOP 3.2.11 – Intake of As, Cd, Pb and Hg
37
3. DIETARY INTAKE OF CADMIUM
3.1 Toxicology
Cadmium may be present in high concentrations in shellfish and in kidneys, particularly from older animals. Certain wild mushrooms may also contain high levels. Cadmium accumulate primarily in the kidneys and may induce kidney dysfunction, skeletal changes and reproductive deficiencies. In 1993 IARC classified cadmium and cadmium compounds in Group I (Human Carcinogens); based on evidence from human studies, mainly those on lung cancer associated with cadmium inhalation in the work place, and from animal studies. The IARC classification is qualitative only. The SCF, in its opinion of 2 June 1995, recommended greater efforts to reduce dietary exposure to cadmium since foodstuffs are the main source of human intake of cadmium. (ref. 1-7). 3.2 Recommendations on intake limitations A Provisional Tolerable Weekly Intake (PTWI) have been decided for cadmium, 0.007 mg/kg (7 µg/kg) bodyweight. This is equal to 0.49 mg/week (490 µg/week) for a person weighing 70 kg. The average intake of cadmium by an adult in the Member States is, according to current infor-mation, 14.4 µg/day, which is equal to 101 µg/week (range 2.73 - 176µg /week). This corresponds to 0.52 – 38.2% of the PTWI, assuming an average weight of 70 kg for a Member State adult. (Note that IR presented data for only two food categories, fish meat, bivalves, crustaceans and cephalopodes).
Table 3.1. Cadmium. Consumption of food in g/day by the Mean Adult Population in the Member States. The figures are based on products for which occurrence data are available. Food BE DK FI FR DE HE IR IT NL NO PT SE UK Milk, milk products 238 357 420 158 41 112 130 344 281 Condensed, powder milk, cheese, yoghurt
28 33 83 43 407 28 60
Fats and oils 48 20 21 20 10 27 Fruits and vegetables 179 421 142 353 352 23 448 360 255 352 171 379 Confectionary 30 5 6 52 10 Cereals, bakery wares 199 217 183 253 188 23 66 220 175 27 142 209 Meat 137 136 71 148 175 37 18 143 80 101 88 Offal 0.3 3 3.2 2 1.6 6.5 0 1.0 Fish Meat 23 53 30 16 36 23 32 10 61 81 22 14 Bivalve, crustaceans and cephalopods
2.5 1.6 5 0.8 7.8 0.77 11 10
Eggs 21 1.1 20 33 14 17 15 14 Sweeteners 0.4 1.1 16 13 6 31 0.6 63 Salts and spices 9.3 2.3 79 Beverages 2003 476 1091 119 84 1091 693 149 937 Ready to eat 11 2 2.0 Composite food 282 Sum 782 3289 1351 2193 968* 240 24 861 2665 1310 660 823 2075*including water (260 g/day) sum is 1227 g/day
SCOOP 3.2.11 – Intake of As, Cd, Pb and Hg
38
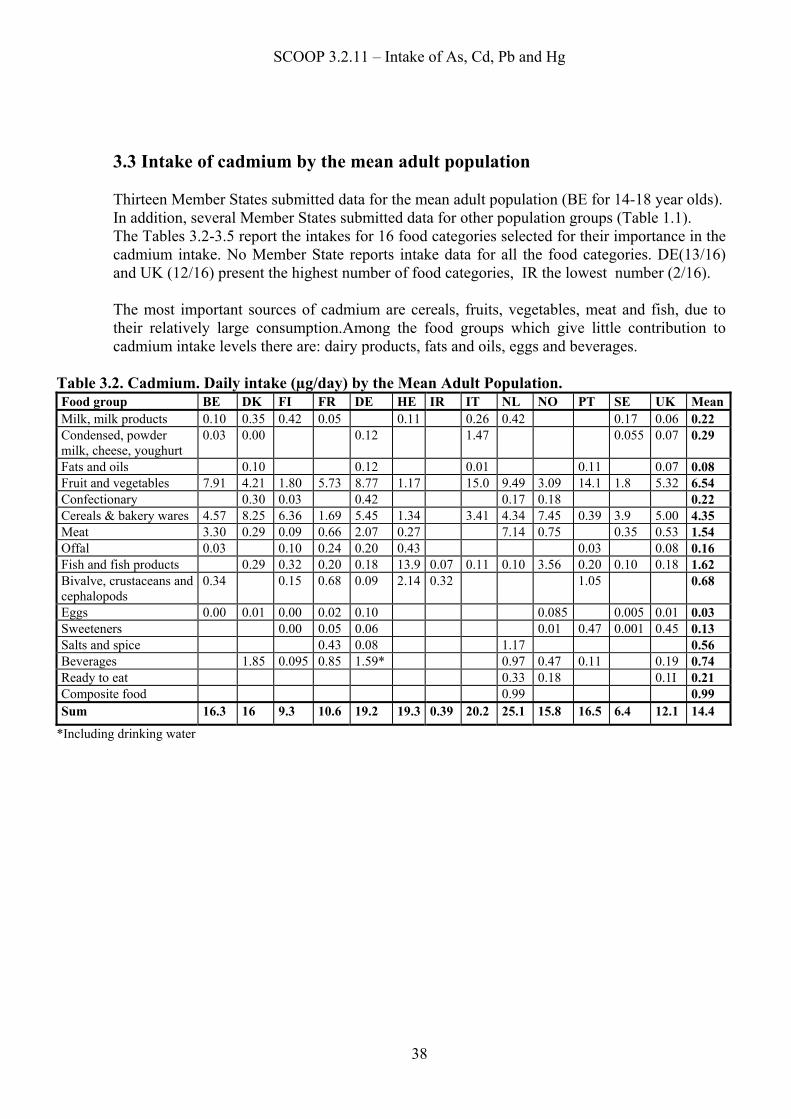
3.3 Intake of cadmium by the mean adult population Thirteen Member States submitted data for the mean adult population (BE for 14-18 year olds). In addition, several Member States submitted data for other population groups (Table 1.1). The Tables 3.2-3.5 report the intakes for 16 food categories selected for their importance in the cadmium intake. No Member State reports intake data for all the food categories. DE(13/16) and UK (12/16) present the highest number of food categories, IR the lowest number (2/16). The most important sources of cadmium are cereals, fruits, vegetables, meat and fish, due to their relatively large consumption.Among the food groups which give little contribution to cadmium intake levels there are: dairy products, fats and oils, eggs and beverages.
Table 3.2. Cadmium. Daily intake (µg/day) by the Mean Adult Population. Food group BE DK FI FR DE HE IR IT NL NO PT SE UK MeanMilk, milk products 0.10 0.35 0.42 0.05 0.11 0.26 0.42 0.17 0.06 0.22 Condensed, powder milk, cheese, youghurt
0.03 0.00 0.12 1.47 0.055 0.07 0.29
Fats and oils 0.10 0.12 0.01 0.11 0.07 0.08 Fruit and vegetables 7.91 4.21 1.80 5.73 8.77 1.17 15.0 9.49 3.09 14.1 1.8 5.32 6.54 Confectionary 0.30 0.03 0.42 0.17 0.18 0.22 Cereals & bakery wares 4.57 8.25 6.36 1.69 5.45 1.34 3.41 4.34 7.45 0.39 3.9 5.00 4.35 Meat 3.30 0.29 0.09 0.66 2.07 0.27 7.14 0.75 0.35 0.53 1.54 Offal 0.03 0.10 0.24 0.20 0.43 0.03 0.08 0.16 Fish and fish products 0.29 0.32 0.20 0.18 13.9 0.07 0.11 0.10 3.56 0.20 0.10 0.18 1.62 Bivalve, crustaceans and cephalopods
0.34 0.15 0.68 0.09 2.14 0.32 1.05 0.68
Eggs 0.00 0.01 0.00 0.02 0.10 0.085 0.005 0.01 0.03 Sweeteners 0.00 0.05 0.06 0.01 0.47 0.001 0.45 0.13 Salts and spice 0.43 0.08 1.17 0.56 Beverages 1.85 0.095 0.85 1.59* 0.97 0.47 0.11 0.19 0.74 Ready to eat 0.33 0.18 0.1I 0.21 Composite food 0.99 0.99 Sum 16.3 16 9.3 10.6 19.2 19.3 0.39 20.2 25.1 15.8 16.5 6.4 12.1 14.4
*Including drinking water

SCOOP 3.2.11 – Intake of As, Cd, Pb and Hg
39
Table 3.3. Cadmium. Weekly intake (µg/week) by the Mean Adult Population. Food BE DK FI FR DE HE IR IT NL NO PT SE UK Mean Milk, milk products 0.71 2.45 2.94 0.36 0.77 1.82 2.94 1.2 0.42 1.51 Condensed, powder milk, cheese, youghurt
0.18 0.00 0.871 10.3 0.38 0.49 2.04
Fats and oils 0.70 0.86 0.07 0.77 0.49 0.57 Fruit and vegetables 55.4 29.5 12.60 40.1 61.39 8.19 105 66.4 21.6 99.0 12 37.2 37.88 Confectionary 2.1 0.21 2.91 1.19 1.26 1.54 Cereals and bakery wares 32.0 57.8 44.5 11.8 38.15 9.38 23.9 30.4 52.2 2.70 27 35.0 30.42 Meat 23.1 2.03 0.63 4.63 14.49 1.89 50.0 5.25 2.4 3.71 10.81 Offal 0.24 0.73 1.65 1.40 3.01 0.21 0.56 1.11 Fish and fish products 2.03 2.2 1.43 1.24 97.0 0.49 0.77 0.70 24.9 1.42 0.67 1.26 11.33 Bivalve, crustaceans and cephalopods
2.35 1.085 4.74 0.63 15.0 2.24 7.35 4.77
Eggs 0 0.07 0.00 0.17 0.70 0.60 0.037 0.07 0.21 Sweeteners 0.00 0.38 0.43 0.07 3.29 0.007 3.15 1.04 Salt and spices 3.01 0.56 8.19 3.92 Beverages 13.0 0.67 5.95 11.1* 6.79 3.29 0.77 1.33 Ready to eat 2.31 1.26 0.84 1.47 Composite food 6.93 6.93 Sum 114 112 66 74 134.8 135 2.73 141 176 110 116 45 85 101
* Including drinking water
Table 3.4. Cadmium. Weekly Intake in % of the PTWI, by the Mean Adult Population (PTWI for Cd = 0.007mg/kg body weight = 7µg/kg body weight) Food group BE DK FI FR DE HE IR IT NL NO PT SE Mean
Mean body weight [kg] 60 72 77.1 66.4 70.5 70 75 70 65.8 73 70 73.7 70.3 Milk, milk products 0.17 0.49 0.54 0.08 0.16 0.37 0.64 0.23 0.335 Condensed, powder milk, cheese, youghurt
0.04 0 0.18 2.1 0.07 0.48
Fats and oils 0.14 0.17 0.01 0.16 0.12 Fruit and vegetables 13.2 5.85 2.33 8.64 12.44 1.67 21.4 14.4 4.23 20.2 2.4 9.7 Confectionary 0.42 0.04 0.59 0.26 0.25 0.31 Cereals and bakery wares 7.61 11.5 8.25 2.54 7.73 1.91 4.87 6.60 10.2 0.55 5.3 6.10 Meat 5.50 0.40 0.12 1.00 2.94 0.39 10.8 1.03 0.48 2.52 Offal 0.06 0.14 0.36 0.28 0.61 0.04 0.25 Fish and fish products 0.40 0.41 0.31 0.255 19.8 0.09 0.16 0.15 4.88 0.29 0.13 2.44 Bivalves, crustaceans and cephalopods
0.56 0.20 1.02 0.13 3.06 0.43 1.5 0.99
eggs 0 0.01 0.00 0.04 0.14 0.12 0.007 0.045 Sweeteners 0.00 0.08 0.087 0.01 0.67 0.001 0.14 Salt and spices 0.65 0.11 1.78 0.85 Beverages 2.57 0.12 1.28 2.25 1.47 0.64 0.16 1.22 Ready to eat 0.50 0.25 0.37 Composite food 1.50 1.5 Sum 27.1 22.2 12.2 16.0 27.3 27.6 0.52 28.9 38.2 21.6 23.6 8.68 22
*UK uses consumer intake estimates for comparison with safety guidelines.

SCOOP 3.2.11 – Intake of As, Cd, Pb and Hg
40
3.4 Intake of cadmium by children: Mean population Intake data were reported by FR and DE ( BE reported intake data for 14-18 year olds, but they are included in the tables for the mean adult population). The data are shown in Table 3.5, together with data on their percentage of the PTWI. Since children have a lower body mass, their body burden per kg bodyweight will generally be larger than that for adults. The cadmium dietary intake for children in FR is 54.8 µg/week, corresponding to 24.8% of the PTWI (31.6 kg x 7 = 221.2 µg/week). The dietary intake of the mean adult population in France is 74.3 µg/week, corresponding to 16.0% of the PTWI. The cadmium dietary intakes for two children groups in DE are 95.2 and 121.5µg/week, corresponding respectively to 65.0% and 42.4%of the PTWI (21 kg x 7 = 147µg/week-age 4-6 years; 41 kg x 7 = 287µg/week-age 10-12 years). The dietary intake of the mean adult population in Germany is 134.8µg/week, corresponding to the 27.3% of the PTWI. Note that the cadmium dietary intakes for children 4-6 years of age, is about 2/3 of the PTWI. In Germany children with a high consumption thus run a greater risk than adults, of exceeding the PTWI.
Table 3.5. Cadmium. Intake by children in various age brackets. Mean Population.
Daily intake, µg Weekly intake, µg % of PTWI Age bracket, year Age bracket, year Age bracket, year
3-14 4-6 10-12 3-14 4-6 10-12 3-14 4-6 10-12 Food FR DE DE FR DE DE FR DE DE Milk and milk products 0.08 0.59 0.27 Condensed, powder milk, cheese, yoghurt
0.060 0.069 0.42 0.483 0.28 0.17
Fats and oils 0.076 0.106 0.53 0.743 0.36 0.26 Fruits and vegetables 3.85 5.04 6.52 26.93 35 45.62 12.17 24.04 15.91 Confectionary 0.661 0.74 4.63 5.18 3.15 1.8 Cereals and bakery wares 2.03 3.756 5.138 14.21 26.29 35.966 6.43 17.88 12.55 Meat 0.46 1.023 1.622 3.25 7.161 11.354 1.47 4.88 3.96 Offal 0.12 0.087 0.17 0.82 0.609 1.19 0.37 0.42 0.41 Fish and fish products 0.14 0.081 0.111 0.97 0567 0.777 0.44 0.39 0.27 Bivalve, crustaceans and cephalopods
0.29 0.017 0.020 2.03 0.119 0.14 0.92 0.08 0.05
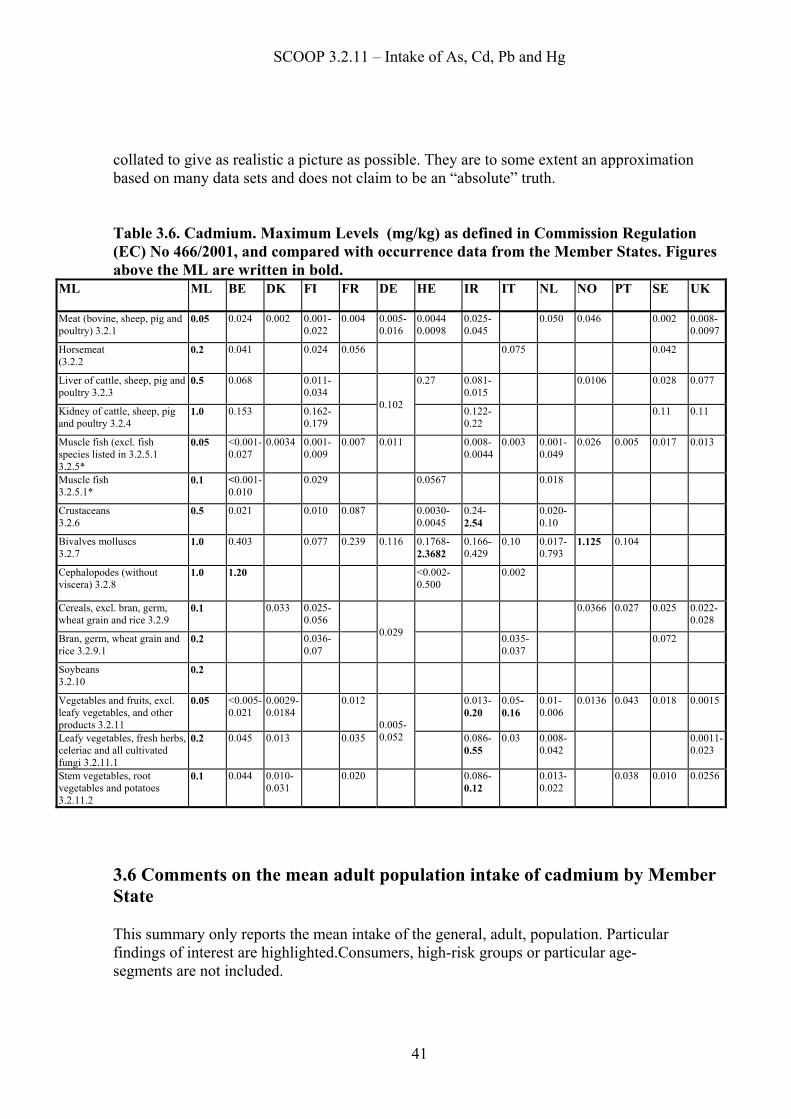
Eggs 0.02 0.064 0.077 0.11 0.448 0.539 0.05 0.31 0.19 Sweeteners 0.02 0.040 0.043 0.11 0.28 0.301 0.05 0.19 0.11 Salt and spices 0.29 0.054 0.063 2.06 0.378 0.439 0.93 0.26 0.15 Beverages 0.52 2.65 2.69 3.61 18.55 18.81 1.63 12.64 6.56 Sum 7.8 13.6 17.4 54.8 95.2 122 24.8% 65.0% 42.4% * Mean body weight 3.5 Legislation In Table 3.6 the MLs for cadmium, as defined in Commission Regulation (EC) No 466/2001, are compared with availabe occurrence data from the Member States. The occurrence data were
SCOOP 3.2.11 – Intake of As, Cd, Pb and Hg
41
collated to give as realistic a picture as possible. They are to some extent an approximation based on many data sets and does not claim to be an “absolute” truth. Table 3.6. Cadmium. Maximum Levels (mg/kg) as defined in Commission Regulation (EC) No 466/2001, and compared with occurrence data from the Member States. Figures above the ML are written in bold.
ML ML BE DK FI FR DE HE IR IT NL NO PT SE UK
Meat (bovine, sheep, pig and poultry) 3.2.1
0.05 0.024 0.002 0.001-0.022
0.004 0.005-0.016
0.0044 0.0098
0.025-0.045
0.050 0.046 0.002 0.008-0.0097
Horsemeat (3.2.2
0.2 0.041 0.024 0.056 0.075 0.042
Liver of cattle, sheep, pig and poultry 3.2.3
0.5 0.068 0.011-0.034
0.27 0.081-0.015
0.0106 0.028 0.077
Kidney of cattle, sheep, pig and poultry 3.2.4
1.0 0.153 0.162-0.179
0.102 0.122-
0.22 0.11 0.11
Muscle fish (excl. fish species listed in 3.2.5.1 3.2.5*
0.05 <0.001-0.027
0.0034 0.001-0.009
0.007 0.011 0.008-0.0044
0.003 0.001-0.049
0.026 0.005 0.017 0.013
Muscle fish 3.2.5.1*
0.1 <0.001-0.010
0.029 0.0567 0.018
Crustaceans 3.2.6
0.5 0.021 0.010 0.087 0.0030- 0.0045
0.24-2.54
0.020-0.10
Bivalves molluscs 3.2.7
1.0 0.403 0.077 0.239 0.116 0.1768- 2.3682
0.166-0.429
0.10 0.017-0.793
1.125 0.104
Cephalopodes (without viscera) 3.2.8
1.0 1.20 <0.002-0.500
0.002
Cereals, excl. bran, germ, wheat grain and rice 3.2.9
0.1 0.033 0.025-0.056
0.0366 0.027 0.025 0.022-0.028
Bran, germ, wheat grain and rice 3.2.9.1
0.2 0.036-0.07
0.029 0.035-
0.037 0.072
Soybeans 3.2.10
0.2
Vegetables and fruits, excl. leafy vegetables, and other products 3.2.11
0.05 <0.005-0.021
0.0029-0.0184
0.012 0.013-0.20
0.05-0.16
0.01-0.006
0.0136 0.043 0.018 0.0015
Leafy vegetables, fresh herbs, celeriac and all cultivated fungi 3.2.11.1
0.2 0.045 0.013 0.035
0.005-0.052
0.086-0.55
0.03 0.008-0.042
0.0011-0.023
Stem vegetables, root vegetables and potatoes 3.2.11.2
0.1 0.044 0.010-0.031
0.020 0.086-0.12
0.013-0.022
0.038 0.010 0.0256
3.6 Comments on the mean adult population intake of cadmium by Member State This summary only reports the mean intake of the general, adult, population. Particular findings of interest are highlighted.Consumers, high-risk groups or particular age-segments are not included.

SCOOP 3.2.11 – Intake of As, Cd, Pb and Hg
42
BELGIUM Estimated intake of cadmium: data for 8 food catagories. The most important are fruits and vegetables (55.38µg – 13.19 % PTWI), cereals and bakery wares (31.97µg – 7.61 % ptwi), meat (23.08µg – 5.50 % ptwi).The cadmium weekly intakes of the food categories is 114 µg/week, corresponding to 27.13 % of the PTWI. The cadmium daily intake is 16.28 µg/day. Vegetables (6.86 µg ), bakery wares (4.57 µg ), and meat (3.29 µg ) represent about 90% of the sum. The age group for which the intake is estimated is between 14 and 18 years, which may perhaps not be representative of the adult population in Belgium. Analytical Quality Assurance Certified reference materials have been used extensively as well as partecipation in proficiency tests. The results showed a good correlation beetween found and certified results. DENMARK Estimated intake of cadmium: data for 10 food categories.The most important are cereals and bakery wares (57.75 µg –11.46 %), fruits and vegetables (29.47µg –5.85 % PTWI ), beverages (12.95 µg – 2.57%), The sum of the cadmium intakes of food categories is 112 µg/week, corresponding to 22.22 % of the PTWI. In the Danish intake survey, which covers all major food groups, cereals and bread (8.25 µg) contribute by 52.7 % to the mean daily intake of cadmium, which is 16µg/day. Vegetables contribute 3.99 µg, which is equivalent to 25.5% of the daily intake. These two food categories represent about 80% of the daily intake. Analytical Quality Assurance Certified reference materials were analyzed along with the samples FINLAND Estimated intake of cadmium: data for 11 food categories. The most important are cereals and bakery wares (44.52 µg – 8.25% PTWI), fruits&vegetables (12.60 µg – 2.33% PTWI), The cadmium weekly intakes is 66µg/week, corresponding to 12.20 % of the PTWI. The daily intake is 9.3 µg/day. Cereals and bakery wares (6.36 µg /day, 68.4%) and fruits and vegetables (1.80 µg/day, 19.35%) represent about the 88 % of the sum. Analytical Quality Assurance Certified reference materials and proficiency tests were used but no result reported. FRANCE Estimated intake of cadmium: data for 11 food categories. The most important are fruit & vegetables (40.13 µg – 8.64% PTWI), cereals and bakery wares (11.82 µg – 2.54% PTWI), The sum of the cadmium intakes of food categories is 74.3 µg/week, corresponding to 16 % of the PTWI. The survey covers several types of foodstuffs which contribute to consumption levels equal to 1895 g/day with a total cadmium intakes amounting to 10.6µg/day. Fruit and vegetables, including mushrooms (5.73µg /day, 54% of the sum),cereals and cereal products (15.9% of the sum), non-alcoholic beverages (6.1%), meat (5.9%) and molluscs (4.5%) are the main sources. Analytical Quality Assurance Certified reference materials have been used extensively as well as participation in proficiency tests. The results showed a good correlation beetween found and certified results.
SCOOP 3.2.11 – Intake of As, Cd, Pb and Hg
43
GERMANY Estimated intake of cadmium: data for 13 food categories. The most important are fruit & vegetables (61.39 µg –12.44 %PTWI),cereals and bakery wares (38.15 µg–7.73% PTWI), meat (14.49 µg–2.94% PTWI), beverages (11.12 µg–2.25% PTWI). The sum of the cadmium intakes of food categories is 135µg/week, corresponding to 27.3 % of the PTWI. Vegetables ( 6.94 µg /day, 36% of the sum) and cereals & cereal products (5.45 µg /day, 28%) represent about 2/3 of the value of the cadmium intake for adults (19.2 µg /day). Analytical Quality Assurance Certified reference materials have been used extensively as well as partecipation in proficiency tests The results showed a good correlation beetween found and certified results. GREECE Estimated intake of cadmium: data for 7 food categories. The most important are fish meat (97.0 µg –19.8% PTWI), bivalve+crustaceans+cephalopoda (15.0 µg–3.1% PTWI), cereals and bakery wares (9.38 µg–1.9% PTWI), fruit & vegetables (8.19 µg–1.67 %PTWI).The sum of cadmium intake of food categories is 135 µg/week, corresponding to 27.63 % of the PTWI. The mean daily intake of cadmium is 19.3 µg/day. Fish (13.9µg /day)and fresh bivalve(1.54µg/day) represent about 80% of the sum intakes, corresponding to 71.7% and 7.96%, respectively. Analytical Quality Assurance Laboratories have participated in proficiency tests programs; results regarding use of certified reference materials are reported. IRELAND Estimated intake of cadmium: data for 2 food categories; fish meat (0.49 µg–0.09% PTWI) and bivalve + crustaceans + cephalopoda (2.24 µg –0.43% PTWI).The sum of the cadmium intakes of food categories is 2.73 µg/week, corresponding to 0.52% of the PTWI. The intake, estimated on the basis of only two food categories, fish (0.07µg /day) and the sum of bivalves, crustaceans, cephalopoda, (0.32 µg /day) is 0.39µg /day with fish. Analytical Quality Assurance Laboratories have partecipated in proficiency tests programs; results regarding use of certified reference materials are reported ITALY Estimated intake of cadmium: data for 6 food categories. The most important are fruit & vegetables (105 µg–21.4 % PTWI) cereals and bakery wares (23.87 µg –4.87% PTWI), condensed and powder milk, cheese (10.29 µg –2.1% PTWI). The sum of the cadmium intakes of food categories is 141 µg/week, corresponding to 28.9% of the PTWI. The sum of the food groups intake is 20.2 µg/day. fresh vegetables (with 15 µg/day corresponding to 74.2% of the sum) and followed by pasta (2.36 µg/day corresponding to 11.6% of the sum) represent about 85% of the sum. Analytical Quality Assurance Certified reference materials were analyzed along with the samples, as well as participation in proficiency tests. No data regarding correlation beetween found and certified results are reported.

SCOOP 3.2.11 – Intake of As, Cd, Pb and Hg
44
THE NETHERLANDS Estimated intake of cadmium: data for 10 food categories. The most important are fruit & vegetables (66.43 µg–14.4 %PTWI), meat (50.0 µg–10.8% PTWI), cereals and bakery wares (30.4 µg –6.6% PTWI), salt and spice (8.19 µg–1.78% PTWI), beverages (6.79 µg–1.47% PTWI). The sum of the cadmium intake of food categories is 176 µg/week, corresponding to 38.16 % of the PTWI. The sum of the food groups intakes is 25.1 µg/day. Fruits & vegetables (with 9.49µg /day, corresponding to 38% of the sum), meat (7.14 µg/day, 28%) and bakery wares (3.11µg/day, 12%) represent about 80% of the sum. Analytical Quality Assurance Certified reference materials were analyzed along with the samples, as well as participation in proficiency tests. No data regarding correlation beetween found and certified results are reported. NORWAY Estimated intake of cadmium: data for 9 food categories. The most important are cereals and bakery wares (52.2 µg–10.2% PTWI), fish meat (24.9 µg–4.9% PTWI), fruit & vegetables (21.63 µg–4.23 % PTWI), meat (5.25 µg–1.03% PTWI). The sum of the cadmium intake of food categories is 110 µg/week, corresponding to 21.6 % of the PTWI. The sum of the food group intakes is 15.8 µg/day. Cereals(7.45µg /day, corresponding to 47.2% of the sum), fish (3.56µg /day, 22.6%) and fruit & vegetables (3.09µg /day, 19.6%) represent 90% of the sum. Analytical Quality Assurance Certified reference materials were analyzed in parallel to the samples, as well as participation in proficiency tests. No data regarding correlation beetween found and certified results are reported. PORTUGAL Estimated intake of cadmium: data for 8 food categories. The most important are fruit & vegetables (99.0 µg–20.21 % PTWI) and bivalve+crustaceans+cephalopoda (7.35 µg–1.5% PTWI), The sum of the cadmium intake of food categories is 116 µg/week, corresponding to 23.6 % of the PTWI. The sum of the food groups intakes is 16.51 µg/day. Fruits&vegetables is about 90% of the sum. Analytical Quality Assurance No CRM-use reported. Participation in one PT programme reported with acceptable result. SWEDEN Estimated intake of cadmium: data for 8 food categories. The most important are: cereals and bakery wares (27.3 µg–5.3% PTWI), fruit & vegetables (12.5 µg –2.4 %PTWI). The sum of the cadmium intake of the food categories is 45 µg/week, corresponding to 8.7 % of the PTWI. The sum of the food group intake is 6.4 µg/day. Cereals & bakery wares (3.9µg /day, corresponding to 61% of the sum), potato (1.42µg /day, 22.3%), fruit & vegetables (0.37µg /day, 5.8%) and meat (0.35µg/day, 5.5%) represent about 95% of the sum. Analytical Quality Assurance Certified reference materials have been used extensively as well as participation in proficiency tests .The results showed a good correlation beetween found and certified results.

SCOOP 3.2.11 – Intake of As, Cd, Pb and Hg
45
UNITED KINGDOM Estimated intake of cadmium: data for 15 food categories. The most categories are: fruit & vegetables (37.24µg/week) cereals and bakery wares (35µg/week ). The sum of the cadmium intake of food categories is 85µg/week. The sum of the food groups intake is 12.1 µg/day. Fruit & vegetables (5.32µg /day) and cereals & bakery wares (5.00 µg /day) represent about 85% of the sum. Bread and potatoes each individually contribute 25% of total dietary exposure. Analytical Quality Assurance Certified reference materials have been used extensively as well as participation in proficiency tests. The results showed a good correlation beetween found and certified results. Regarding the intake for drinking water, it was calculated out of the intakes sum. Three countries present water intake data:FR (0.98 µg/week), DE (0.55 µg/week including the intake by mineral water) and PT (0 µg/week) The values of the sum of cadmium intakes, for all countries range between 2.73 µg/week (IR, 2 food categories), and 176 µg/week (NL, 10 food categories). Five countries have cadmium levels less than 85 µg/week (FI, FR, IR, SE, UK), while seven countries (BE, DK, DE, HE, IT, NO, PT) are in the range 110-141 µg Cd/week. the Netherlands has the highest values (176µg Cd/week). 3.7 Comments on cadmium in the specific food groups All specific results are shown in tables 3.7 – 3.31 Table 3.7.Cadmium in Dairy products, excluding products of category 2: Milk (Cat. 1.1-1.5) No data for AU, DE, NO, PT, SP. The mean cadmium intake was in the range 0.05 µg/day (FR) - 0. 40 µg/day (FI). HE and NL presented intake values referred to total dairy products (respectively 0.112 and 0.42 µg/day. BE, FR, HE, and IT presented high level intake in the range 0.1 µg/day (FR) – 0.393 µg/day (HE). HE and NL: total milk and dairy products. Table 3.8.Cadmium in Dairy products, excluding products of category 2: Cheese (Cat. 1.6) No data for AU, FI, HE, IR, NL, NO, PT. The mean cadmium intake was in the range 0 µg/day (DK) – 1.47 µg/day (IT). BE, FR, DE, IT presented high level intake in the range 0.07 µg/day (BE) - 1.49 µg/day (IT). Table 3.9. Cadmium in Fats and oils No data for AU, BE,FI, HE, IR, NL, NO, SP, UK. The mean cadmium intake was in the range 0 µg/day (FR) - 0.123 µg/day (DE). FR, DE, IT PT presented high level intake in the range 0.012 µg/day (IT) – 0,88µg/day(PT). Table 3.10 Cadmium in Edible ice (Cat. 3) Data only for BE with a mean cadmium intake of 1.05 µg/day.The high level intake value is 3.01 µg/day.
SCOOP 3.2.11 – Intake of As, Cd, Pb and Hg
46
Table 3.11. Cadmium in Fruit; Vegetables (incl. mushrooms & fungi, roots & tubers), and nuts & seeds. Excl. 3.2.11.1 and 3.2.11.2 of Regulation 466/2001 No data for AU, BE, IR, SP. The mean cadmium intake was in the range 0.034 µg/day (FI) - 15. 0 µg/day (IT). DK, DE,HE and NL presented intake value referred to total Vegetables + total Fruits. FR, DE, HE, IT and NO presented high level intake in the range 1.89 µg/day (NO) – 21.69 µg/day (DE). Table 3.12. Cadmium in 3.2.11.1 of Regulation 466/2001 (Leafy vegetables, fresh herbs, celeriac and all cultivated fungi) No data for AU, DK, DE, HE, IR,IT, SP, SE. The mean cadmium intake was in the range 0.04 µg/day (NO) – 1.05 µg/day (BE). BE, FR, NO and PT presented high level intake value respectively 3.01, 0.84 (excl. mushroom), 0.15, 10.56 µg/day. Table 3.13.Cadmium in 3.2.11.2 of Regulation 466/2001 (Stem vegetables, root vegetables and potatoes, excluding celeriac) No data for AU, DK, DE, HE, IR,IT, NL, SP. The mean cadmium intake was in the range 0.27 µg/day (UK) – 11.78 µg/day (PT). FI, NO, PT, SE and UK presented also values for potatoes, respectively: 1.727, 2.42, 11.78, 1.42, 0.27 µg/day. BE, FR, NO, PT and UK presented high level intake value respectively 13.43, 3.65, 6.20, 60,8, 0.63 µg/day Table 3.14. Cadmium in Confectionary (Cat. 5) No data for AU,BE, FR, HE, IR,IT, PT, SP, SE, UK. The mean cadmium intake was in the range 0.17 µg/day (NL) – 0.46 µg/day (DE). DE and NO presented high level intake value respectively 2.03 and 0.68 µg/day Table 3.15. Cadmium in Cereals and cereal products, incl. flours & starches from roots & tubers, pulses & legumes, excluding bakery (Cat. 6) No data for AU, BE, SP. DK, DE and SE presented intake values fo Cereals & Bakery wares. The mean cadmium intake was in the range 0.30 µg/day (PT) – 8.25 µg/day (DK). DE, HE and NO presented high level intake value respectively 9.95, 5.31, 14.65 µg/day Table 3.16. Cadmium in Bakery Wares (Cat 7) No data for AU, DK, FI, FR, DE, HE, IR,IT, NO, SP, SE. The mean cadmium intake was in the range 0.085 µg/day (PT) – 4.57 µg/day (BE). BE presented the only high level intake value of 7.73 µg/day Table 3.17. Cadmium in Meat and meat products, including poultry and game (Cat. 8). No data for AU, IR, IT, SP. The mean cadmium intake was in the range 0.09 µg/day (FI) – 7.14 µg/day (NL). BE, DE, FR, HE and NO presented high level intake value respectively 6.00, 4.57, 1.2, 0.82, 3.42 µg/day Table 3.18. Cadmium in Horse meat (3.2.2- Reg 466/2002) Only BE and FR presented data, respectively 0.01 and 0.04µg/day

SCOOP 3.2.11 – Intake of As, Cd, Pb and Hg
47
Table 3.19. Cadmium in Offals (CAT. 8) No data for AU, IR, IT, NL, NO, SP, SE. The mean cadmium intake was in the range 0.033µg/day (PT) – 0.43 µg/day (HE). FR, DE, HE, NO presented high level intake value respectively 1.6, 1.83, 2.41, 1.67 µg/day Table 3.20. Cadmium in Fish and fish products, including molluscs, crustaceans and echinoderms (MCE) (Cat. 9) No data for AU, BE, SP. The mean cadmium intake was in the range 0.08 µg/day (FI) – 13.86 µg/day (HE). FR, DE, HE, IR, IT and NO presented high level intake value respectively 0.6, 0.897, 54,68, 0.94, 0.16, 0.57 µg/day Table 3.21. Cadmium in Bivalves molluscs (3.2.7 - Reg 466/2001) No data for AU, DK, ,IT, NL, SP, SE. The mean cadmium intake was in the range 0.01 µg/day (UK) – 1.54 µg/day (HE). BE, FR, DE, HE, NO presented high level intake value in the range 0 µg/day (BE) – 10.67 µg/day (HE).DE: Bivalves molluscs + crustaceans + squid Table 3.22. Cadmium in Cephalopodes (3.2.8-Reg. 466/2001) Data only for BE, HE and IR The mean cadmium intake was, 0.05 µg/day for BE, 0.56 µg/day for HE and. 0.002 µg/day for IR. HE presented the only high level intake value (3.85 µg/day). Table 3.23. Cadmium in Crustaceans: 3.2.6 (Reg. 466/2001) No data for AU, DK, DE, IT,NL, PT, SP, SE, UK. The mean cadmium intake was in the range 0.04 µg/day (BE) – 2.69 µg/day (NO). IR, BE, FR, HE and NO presented high level intake value respectively 0.86, 0.27, 1.2, 0.31, 5.69 µg/day Table 3.24. Cadmium in Eggs and eggs products (Cat.10) No data for AU,BE, HE, IR, IT, NL, PT, SP. The mean cadmium intake was in the range 0.001 µg/day (FI) – 0.005 µg/day (SE). FR, DE, and NO presented high level intake value respectively 0.1, 0.243 0.245, 0.21 µg/day Table 3.25. Cadmium in Sweteners incl. honey (Cat 11) No data for AU, DK, HE, IR, IT, NL, PT,SP. The mean cadmium intake was in the range 0 µg/day (BE) 0.45 µg/day (UK). BE, FR, HE DE and NO presented high level intake value respectively 0.02, 0.2, 0.258, 0.04 µg/day Table 3.26. Cadmium in Salt, spices, soups, sauces, salads, protein products, etc (Cat 12) Data only for FR, DE and NL. The mean cadmium intake was, 0.43µg/day for FR, 0.08 µg/day for DE and 1.17µg/day for NL. FR and DE presented the only high level intake value (1.1 and 0.242 µg/day). Table 3.27. Cadmium in Non-alcoholic ("soft") beverages (Cat. 14.1) No data for AU,BE, HE, IR, , NL, PT, SP, SE, UK. DK presented the total beverages value. The mean cadmium intake was in the range 0.45 µg/day (NO ) – 1.85 µg/day (DK). FR DE and NO presented the high level intake value (respectively 1.7, 4.93 and 1.18 µg/day). 3 Countries

SCOOP 3.2.11 – Intake of As, Cd, Pb and Hg
48
presented mean cadmium intake for water: FR: 0.14 µg/day, DE: 0.078 µg/day (including the intake of Cd by mineral water), and PT (mineral water): 0.165 µg/day,DK: total beverages. FR and DE: escluded water. FR: 556.9 g/day-0.14µg/day. DE: 260 g/day-0.078µg/day(including the intake by mineral water).. Table 3.28. Cadmium in Alcoholic beverages, incl. alcohol-free and low-alcoholic counter (Cat. 14.2) No data for AU,BE, DK, FI, HE, IR, NL, SP, SE, UK. The mean cadmium intake was in the range 0.0094 µg/day (NO ) – 0.235 µg/day (DE). FR, DE, NO presented high level intake value respectively 0.2, 1.11, 0.04 µg/day). IT, DE: only wine. NO: only beer Table 3.29. Cadmium in Ready to eat (Cat 15) Only NL, NO and UK presented data, respectively 0.33 and 0.18 and 0.12 µg/day Table 3.30. Cadmium in composite foods (Cat 16) Only NL presented data: 0.99 µg/day Table 3.31. Cadmium in Potatoes Data for FI, NO, PT, SE, UK. The mean cadmium intake was in the range 3.0µg/day (UK), -11.78 (PT)
Table 3.7. Cadmium in Dairy products, excluding products of category 2: Milk (Cat. 1.1-1.5) Member State Consumption (g/day) Mean level in
food (µg/g) Intake (µg/day) % of total
dietary intake Mean level High level Mean l. High l. BELGIUM 238.36 674.73 0.0004 0.10 0.29 0.6 DENMARK 357 0.0010 0.35 2.2 FINLAND 419.5 0.001 0.400 4.0 FRANCE 158.1 410.7 0.000327 0.05 0.1 0.5 GREECE 112 393 0.001 0.112 0.393 0.58 IRELAND 310.62 660.84 ITALY 130 162.8 <0.004 0.26 0.33 The NETHERLANDS 407 0.001 0.42 2 SWEDEN 344 0.001 0.172 2.7 U. K. 281 0.0002 0.06 <1

SCOOP 3.2.11 – Intake of As, Cd, Pb and Hg
49
Table 3.8 Cadmium in Dairy products, excluding products of category 2: Cheese (Cat. 1.6) Member State Consumption (g/day) Mean level in
food (µg/g) Intake (µg/day) % of total
dietary intake Mean level High level Mean l. High l. BELGIUM 28.22 71.69 0.0009 0.03 0.07 0.2 DENMARK 33 0.0001 0 0 FRANCE 82.9 200 0.002 0.2 0.4 1.0 GERMANY 41.35 111.7 0.007-0.003 0.124 0.337 2.3 ITALY 43.6 43.9 0.034 1.47 1.49 SWEDEN 28 0.001-0.004 0.055 0.9 U. K.* 60 0.001 0.07 <1
* UK dairy produce
Table 3.9 Cadmium in Fats and Oils (Cat. 2) Member State Consumption (g/day) Mean level in
food (µg/g) Intake (µg/day) % of total
dietary intake Mean level High level Mean l. High l. DENMARK 48 0.0021 0.10 0.6 FRANCE 19.5 43.5 0.002 0 0.1 0.2 GERMANY 20.53 50.7 0.006 0.123 0.304 1.1 ITALY 19.8 20.5 <0.0012 0.012 0.012 PORTUGAL 9.9 40 0.011 0.1089 0.88 U.K. 27 0.003 0.07 <1
Table 3.10 Cadmium in Edible ice (Cat. 3) Member State Consumption (g/day) Mean level in
food (µg/g) Intake (µg/day) % of total
dietary intake Mean level High level Mean l. High l. BELGIUM 23.38 66.98 0.045 1.05 3.01 6.5

SCOOP 3.2.11 – Intake of As, Cd, Pb and Hg
50
Table 3.11. Cadmium in Fruit, Vegetables incl. mushrooms & fungi, roots & tubers, and nuts & seeds; Excl. 3.2.11.1 and 3.2.11.2 of Regulation 466/2001 Member State Consumption (g/day) Mean level in
food (µg/g) Intake (µg/day) % of total
dietary intake Mean level High level Mean l. High l. DENMARK 421 4.21 26.9 FINLAND 0.2 0.170 0.034 0.4 FRANCE** 243.0 567.9 0.012 2.95 6.90 27.8 FRANCE*** 3.8 25 0.081 0.31 2.03 2.9 GERMANY 352.00 800.35 0.005-0.198 8.77 21.69 19.6 GREECE 23 81 0.0508 1.1684 4.1148 6.04 ITALY 254.2 308.6 0.059 15.0 18.27 74 the NETHERLANDS 360 0.026 9.49 38 NORWAY 76 246 0.0069 0.63 1.89 4.0 PORTUGAL 30.3 0.053 1.6059 SWEDEN 29 <0.001-0.041 0.371 5.8 U. K.* 256 0.0120.0086 2.32 <20
*UK fruit and vegetables excluding potatoes ** excluding mushrooms *** only mushrooms Table 3.12. Cadmium in 3.2.11.1 of Regulation 466/2001 (Leafy vegetables, fresh herbs, celeriac and all cultivated fungi) Member State Consumption (g/day) Mean level in
food (µg/g) Intake (µg/day) % of total
dietary intake Mean level High level Mean l. High l. BELGIUM 23.38 66.98 0.045 1.05 3.01 6.5 FINLAND 5.0 0.014 0.070 0 FRANCE* 23.6 78.6 0.035 0.84 2.8 7.9 NORWAY 4 15 0.01 0.04 0.15 0.3 PORTUGAL 12.63 80 0.76 10.56 U. K. 0.14 1
*excluding mushrooms Table 3.13.Cadmium in 3.2.11.2 of Regulation 466/2001 (Stem vegetables, root vegetables and potatoes, excluding celeriac) Member State Consumption (g/day) Mean level in
food (µg/g) Intake (µg/day) % of total
dietary intake Mean level High level Mean l. High l. BELGIUM 155.88 305.26 0.044 6.86 13.43 42.1 FINLAND 137.0 1.727 18.9 FRANCE 82.5 184.0 0.020 1.63 3.65 15.4 NORWAY 174 440 0.012 2.42 6.20 15.3 PORTUGAL 309.3 800 0.0381 11.78 60.8 SWEDEN 142 0.010 1.42 22.3 U. K. 133.50 316.50 0.002 0.27 0.63

SCOOP 3.2.11 – Intake of As, Cd, Pb and Hg
51
Table 3.14. Cadmium in Confectionary (Cat. 5) Member State Consumption (g/day) Mean level in
food (µg/g) Intake (µg/day) % of total
dietary intake Mean level High level Mean l. High l. DENMARK 30 0.0100 0.30 1,9 FINLAND 0.20 0.17 0.34 0.4 GERMANY 5.86 28.6 0.071 0.416 2.03 0.3 ITALY the NETHERLANDS 52 0.003 0.17 1 NORWAY 10 38 0.018 0.18 0.684 1.1
Table 3.15. Cadmium in Cereals and cereal products, incl. flours & starches from roots & tubers, pulses & legumes, excluding bakery (Cat. 6) Member State Consumption (g/day) Mean level in
food (µg/g) Intake (µg/day) % of total
dietary intake Mean level High level Mean l. High l. DENMARK 217 0.0380 8.25 52.7 FINLAND 182.8 0.022-0.50 6.36 69.6 FRANCE 62.9 74-116 0.0038-0.021 1.69 2.8-2.4 15.9 GERMANY** 187.93 343.15 0.029 5.45 9.95 10.5 GREECE 23 91 0.0584 1.3432 5.3144 6.95 ITALY 66 89.2 0.036-0.07 3.41 the NETHERLANDS 42 0.029 1.23 5 NORWAY 175 359 0.013-0.1.41 7.45 14.65 47.2 PORTUGAL 18.8 0.015-0.025 0.30 SWEDEN 142 0.011-0.040 3.905 61.3 U. K.* 101 0.023 2.0 17
*miscellaneous cereals. **cereals and bakery wares Table 3.16. Cadmium in Bakery Wares (Cat 7) Member State Consumption (g/day) Mean level in
food (µg/g) Intake (µg/day) % of total
dietary intake Mean level High level Mean l. High l. BELGIUM 198.59 336.30 0.023 4.57 7.73 28.1 the NETHERLANDS 178 0.017 3.11 12 PORTUGAL 5,7 0,015 0,0855 U. K.* 108 0,028 3.0 25
*bread

SCOOP 3.2.11 – Intake of As, Cd, Pb and Hg
52
Table 3.17. Cadmium in Meat and meat products, including poultry and game (Cat. 8). Member State Consumption (g/day) Mean level in
food (µg/g) Intake (µg/day) % of total
dietary intake Mean level High level Mean l. High l. BELGIUM 137.03 249.93 0.024 3.29 6.00 20.2 DENMARK 136 0.0022 0.29 1.9 FINLAND 71.3 0.001-0.004 0.09 1.1 FRANCE 147. 7 287.1 0.004 0.62 1.2 5.9 GERMANY 174.98 389.4 0.007-0.016 2.072 4.57 9.7 GREECE 37 111 0.0074 0.2738 0.8214 1.42 the NETHERLAND 143 0.050 7.14 28 NORWAY 49 115 0.046 0.748 3.417 4.7 SWEDEN 101 <0.002-0.043 0.35 5.5 U. K. 88 0.0046 0.53 <6
Table 3.18.Cadmium in Horse meat (3.2.2- Reg 466/2002) Member State Consumption (g/day) Mean level in
food (µg/g) Intake (µg/day) % of total
dietary intake Mean level High level Mean l. High l. BELGIUM 0.22 0 0.041 0.01 0 0.1 FRANCE 0.7 0 0.056 0.04 0 0.4
Table 3.19. Cadmium in Offals (Cat. 8) Member State Consumption (g/day) Mean level in
food (µg/g) Intake (µg/day) % of total
dietary intake Mean level High level Mean l. High l. BELGIUM 0.32 0 0.068-0.153 0.02 0.2 FINLAND 3.0 0.035 0.105 1.1 FRANCE* 2.7 18.6 0.087 0.24 1.6 2.2 GERMANY 1.95 17.9 0.102 0.199 1.826 0.11 GREECE 1.6 8.9 0.2711 0.43376 2.41279 2.24 NORWAY 2 11 1.455 0.07 1.67 11.0 PORTUGAL 2.18 0.015 0.033 U. K. 1 0.077 0.08 <1
*only edible offal liver

SCOOP 3.2.11 – Intake of As, Cd, Pb and Hg
53
Table 3.20 cadmium in Fish and fish products, including molluscs, crustaceans and echinoderms (MCE) (Cat. 9) Member State Consumption (g/day) Mean level in
food (µg/g) Intake (µg/day) % of total
dietary intake Mean level High level Mean l. High l. DENMARK 23 0.0124 0.29 1.9 FINLAND 53 0.006 0.32 3,4 FRANCE* 29.8 87.1 0.007 0.2 0.6 1.9 GERMANY 16.9 63.4 0.011-0.116 0.268 0.897 0.94 GREECE 36 142 0.3021-0.468 13.86 54.677 71.69 IRELAND 23 75 0.03 0.38 0.94 ITALY 31.8 48.3 0.0033 0.105 0.159 the NETHERLANDS 10 0.010 0.10 0 NORWAY 61.3 181.0 0.001-0.05 0.1618 0.5677 0.9 PORTUGAL 40.5 0.005 0.2035 SWEDEN 21.5 0.004-0.034 0.096 1.5 U. K. 14 0.013 0.18 2
*excluding molluscs Table 3.21. Cadmium in Bivalves molluscs (3.2.7 - Reg 466/2001) Member State Consumption (g/day) Mean level in
food (µg/g) Intake (µg/day) % of total
dietary intake Mean level High level Mean l. High l. BELGIUM 0.61 0 0.403 0.25 0 1.5 FINLAND 0.2 0.077 0.015 0.2 FRANCE 2.0 13.9 0.239 0.48 3.3 4.5 GERMANY 0.78 1.9 0.116 0.090 0.220 0.04 GREECE 2.6 18 0.593 1.5418 10.674 7,97 IRELAND 0.084 0 0.25 0.02 0 NORWAY 1 5 0.718 0.714 3.59 4.5 PORTUGAL 10.1 0.1043 1.05343 U. K. 0.01 <1
Table 3.22. Cadmium in Cephalopodes (3.2.8-Reg. 466/2001) Member State Consumption (g/day) Mean level in
food (µg/g) Intake (µg/day) % of total
dietary intake Mean level High level Mean l. High l. BELGIUM 0.04 0 1.20 0.05 0 0.3 GREECE 2.6 18 0.214 0.5564 3.852 2.88 IRELAND 0.009 0 0.25 0.002 0

SCOOP 3.2.11 – Intake of As, Cd, Pb and Hg
54
Table 3.23. Cadmium in Crustaceans: (3.2.6 Reg. 466/2001) Member State Consumption (g/day) Mean level in
food (µg/g) Intake (µg/day) % of total
dietary intake Mean level High level Mean l. High l. BELGIUM 1.83 12.75 0.021 0.04 0.27 0.2 FINLAND 1.4 0.10 0.140 1.5 FRANCE* 2.3 14.3 0.087 0.2 1.2 1.9 GREECE 2.6 18 0.017 0.0442 0.306 0.23 IRELAND 0.56 2.3 0.11 0.3 0.86 NORWAY 10 32 0.045-1.125 2.688 5.688 17.1
* and echinoderms Table 3.24. Cadmium in Eggs and egg products (Cat.10) Member State Consumption (g/day) Mean level in
food (µg/g) Intake (µg/day) % of total
dietary intake Mean level High level Mean l. High l. DENMARK 21 0,0003 0.01 0 FINLAND 1.1 0.001 0.001 0 FRANCE 20.0 62.9 0.001 0.02 0.1 0.2 GERMANY 33.42 81 0.003 0.10 0.243 1.9 ITALY 13.8 18.3 NORWAY 17 42 0.005 0.085 0.21 0.5 SWEDEN 15 <0.0007 0.005 0.1 U. K. 14 0.0004 0.01 <1
Table 3.25 Cadmium in Sweteners including honey (Cat 11) Member State Consumption (g/day) Mean level in
food (µg/g) Intake (µg/day) % of total
dietary intake Mean level High level Mean l. High l. BELGIUM 0.37 2.14 0.009 0 0.02 0 FINLAND 1.1 0.002 0.002 0 FRANCE 15.9 49.7 0.003 0.05 0.2 0.51 GERMANY 13 54.1 0.002-0.007 0.061 0.258 0.72 NORWAY 6 30 0.007 0.007 0.042 0 SWEDEN 0.6 <0.002 0.001 0 U. K* 63 0.007 0.45 4
* sugar and preserves

SCOOP 3.2.11 – Intake of As, Cd, Pb and Hg
55
Table 3.26 Cadmium in Salts, spices, soups, sauces, salads, protein products, etc (Cat 12) Member State Consumption (g/day) Mean level in
food (µg/g) Intake (µg/day) % of total
dietary intake Mean level High level Mean l. High l. FRANCE* 9.3 23.3 0.046 0.43 1.1 4.1 GERMANY 2.26 6.0 0.023-0.068 0.080 0.242 0.13 the NETHERLANDS 79 0.015 1.17 5
* excluding soups Table 3.27. Cadmium in Non-alcoholic ("soft") beverages (Cat. 14.1) Member State Consumption (g/day) Mean level in
food (µg/g) Intake (µg/day) % of total
dietary intake Mean level High level Mean l. High l. DENMARK 2003 0.0009 1.85 11.8 FINLAND 476 0 0.095 1.0 FRANCE 373.8 962.9 0.00174 0.65 1.7 6.1 GERMANY 68.89 290 0.017-0.064 1.276 4.93 3.8 ITALY 83.7 148.6 NORWAY 599 1840 0.00005-0.0001 0.45 1.18 2.8 U.K. 937 0.0002 0.19 2
Table 3.28. Cadmium in Alcoholic beverages, incl. alcohol-free and low-alcoholic counterparts (Cat. 14.2) Member State Consumption (g/day) Mean level in
food (µg/g) Intake (µg/day) % of total
dietary intake Mean level High level Mean l. High l. FRANCE 159.9 628.6 0.00038 0.06 0.2 0.57 GERMANY* 46.95 222.2 0.005 0.235 1.111 2.6 ITALY 84 148.6 NORWAY 94 399 0.0001 0.0094 0.0399 0.06 PORTUGAL 149.3 0.00075 0.112
Table 3.29. Cadmium in Ready to eat (Cat 15) Member State Consumption (g/day) Mean level in
food (µg/g) Intake (µg/day) % of total
dietary intake Mean level High level Mean l. High l. the NETHERLANDS 11 0.030 0.33 1 NORWAY 2 9 0.091 0.182 0.819 1.2 U. K. 2 0.059 0.12 1

SCOOP 3.2.11 – Intake of As, Cd, Pb and Hg
56
Table 3.30. Cadmium in composite foods (Cat 16) Member State Consumption (g/day) Mean level in
food (µg/g) Intake (µg/day) % of total
dietary intake Mean level High level Mean l. High l. the NETHERLANDS 282 0.004 0.99
Table 3.31. Cadmium in Potatoes (Cat. 4.2) Member State Consumption (g/day) Mean level in
food (µg/g) Intake (µg/day) % of total
dietary intake Mean level High level Mean l. High l. FINLAND 120 0.010 1.2 13.1 NORWAY 123 261 0.012 1.476 3.132 9.4 PORTUGAL 309.3 800 0.038 11.784 60.8 SWEDEN 142 0.010 1.4 22.3 U. K. 123 0.026 3.00 25
3.8 Estimated daily intake of cadmium by other population groups The UK is the only Member State that has complete intake studies for other population groups. The data from the UK and the available data from other Member States are presented in tables 3.32 – 3.35. Table 3.32. Cadmium. Daily Intake (µg/day) by the Mean Adult Population. High Level
Food group BE FR DE HE NO PT Milk, milk products 0.29 0.1 0.39 Condensed, powder milk, cheese, youghurt
0.07 0.33
Fats and oils 0.30 0.88 Fruit and vegetables 16.44 21.66 4.11 8.39 93.2 Confectionary 2.03 0.68 Cereals and bakery wares 7.73 5.2 9.95 5.31 14.65 Fresh meat, poultry, game, processed 6.00 1.2 4.56 0.82 3.42 Offal 0.00 1.6 1.83 2.41 Fish and fish products 0.6 0.68 54.7 19.85 Bivalves, crustacean and cefalopods 0.27 4.5 0.22 14.8 Eggs 0.1 0.24 0.21 Sweeteners 0.02 0.2 0.26 0.04 Salts e spice 1.1 0.24 Beverages 2.2 6.27 1.215 Ready to eat 0.82

SCOOP 3.2.11 – Intake of As, Cd, Pb and Hg
57
Table 3.33. Cadmium. Daily Intake (µg/day) by Consumers Only. Mean level. Food group BE FR DE HE IT NO UK Milk, milk products 0.10 0.06 0.19 0.33 0.05 Condensed, powder milk, cheese, youghurt
0.03 0.14 1.49 0.06
Fats and oils 0.12 0.01 0.04 Fruit and vegetables 8.06 7.29 10.76 1.78 18.3 3.35 5.45 Confectionary 0.94 0.23 0.13 Cereals and bakery wares 4.57 2.42 5.45 2.92 7.03 7.48 5.86 Fresh meat ,poultry, game, processed 4.33 1.95 2.23 0.41 17.0 0.75 Offal 3.26 1.55 1.47 7.86 1.36 Fish, total 0.26 0.33 31.6 0.16 6.1 0.44 Bivalves, crustacean and cefalopods 14.4 4.16 1.69 30.5 0.18 Eggs 0.03 0.103 0.085 0.01 Sweeteners 0.04 0.06 0.104 0.035 0.20 Salts e spice 0.45 0.084 Beverages 0.90 5.33 0.57 0.13 Ready to eat 0.36 0.39 Total consumer dietary exposure 14
Table 3.34. Cadmium. Daily Intake (µg/day) by Consumers Only. High level. Food group BE FR DE HE NO UK Milk, milk products 0.29 0.14 0.43 0.12 Condensed, powder milk, cheese, youghurt
0.07 0.35 0.19
Fats and oils 0.30 0.11 Fruit and vegetables 16.54 16.99 25.59 4.775 8.66 11.02 Confectionary 3.04 0.70 0.49 Cereal and bakery wares 7.73 5.93 9.95 8.35 14.72 12.25 Fresh meat ,poultry, game, processed 6.00 3.3 4.88 0.98 45.07 2.01 Offal 3.50 3.75 21.15 4.72 Fish and fish products 0.64 0.84 73.16 20.63 1.28 Bivalves, crustacean and cefalopods 9.18 8.41 4.26 78.28 0.72 Eggs 0.08 0.245 0.21 0.03 Sweeteners 0.19 0.18 0.33 0.11 0.68 Salts e spice 1.10 0.25 Beverages excl dairy prod. 1.68 16.25 1.26 0.33 Alcool. Beverage 0.28 1.5 Ready to eat 1.18 1.58 Total consumers dietary exposure 24.0 *excluding kidneys

SCOOP 3.2.11 – Intake of As, Cd, Pb and Hg
58
Table 3.35. Cadmium. Daily intake (µg/day) by children in different age groups. Mean population. High level
Consumers only. Mean level
Consumers only. High level
3-14 4-6 10-12 3-14 4-6 10-12 3-14 4-6 10-12 FOOD FR DE DE FR DE DE FR DE DE Milk, milk products Condensed, powder milk, cheese, yoghurt
0.18 0.19 0.21 0.09 0.07 0.08 0.18 0.21 0.23
Fats and oils 0.19 0.27 0.08 0.11 0.19 0.27 Fruits and vegetables 10.13 12.94 15.27 5.07 6.19 7.93 12.51 15.28 18.35 Confectionary 2.46 2.53 0.90 1.05 2.92 2.92 Cereals and bakery wares 5.53 6.53 9.04 1.43 3.76 5.14 5.86 6.53 9.04 Meat 0.90 2.39 3.38 1.61 1.05 1.63 3.0 2.39 3.38 Offal 1.0 0.7 1.59 1.18 0.95 1.39 2.5 2.37 3.64 Fish and fish products 0.39 0.32 0.42 0.18 0.17 0.24 0.42 0.45 0.61 Bivalve, crustaceans, cephalopods
2.32 0 0 3.28 0.85 1.19 10.15
Eggs 0.05 0.155 0.175 0.02 0.07 0.08 0.06 0.16 0.17 Sweeteners 0.06 0.156 0.16 0.02 0.07 0.08 0.06 0.2 0.22 Salts and spices 0.84 0.18 0.19 0.33 0.06 0.07 0.89 0.19 0.2 Beverages 1.01 7.3* 8.26** 0.41 5.25*** 4.22**** 1.04 14.57
***** 8.47 ******
DE: * excl. water (0.25µg/d); ** excl. water (0.11µg/d); ***excl. water (0.04µg/d); ***excl. water (0.106µg/d); ***excl. water (0.05µg/d); ***excl. water (0.16µg/d);
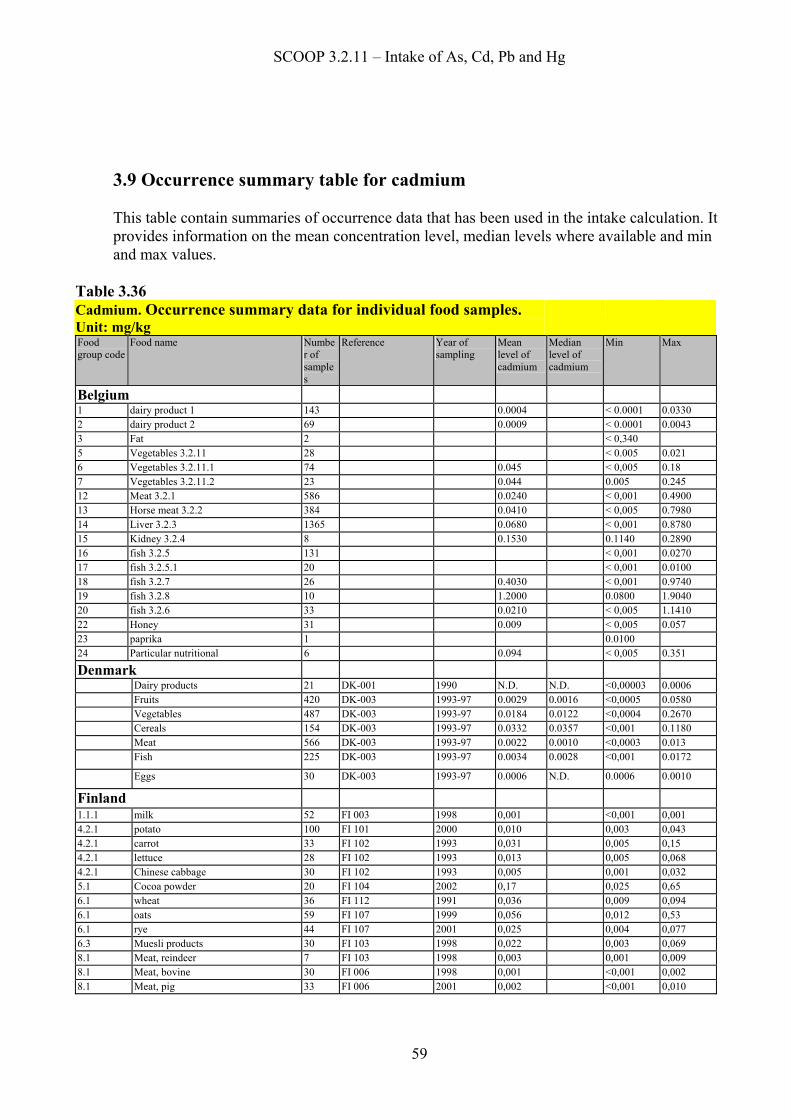
SCOOP 3.2.11 – Intake of As, Cd, Pb and Hg
59
3.9 Occurrence summary table for cadmium This table contain summaries of occurrence data that has been used in the intake calculation. It provides information on the mean concentration level, median levels where available and min and max values.
Table 3.36 Cadmium. Occurrence summary data for individual food samples. Unit: mg/kg
Food group code
Food name Number of samples
Reference Year of sampling
Mean level of cadmium
Median level of cadmium
Min Max
Belgium
1 dairy product 1 143 0.0004 < 0.0001 0.0330 2 dairy product 2 69 0.0009 < 0.0001 0.0043 3 Fat 2 < 0,340 5 Vegetables 3.2.11 28 < 0.005 0.021 6 Vegetables 3.2.11.1 74 0.045 < 0,005 0.18 7 Vegetables 3.2.11.2 23 0.044 0.005 0.245 12 Meat 3.2.1 586 0.0240 < 0,001 0.4900 13 Horse meat 3.2.2 384 0.0410 < 0,005 0.7980 14 Liver 3.2.3 1365 0.0680 < 0,001 0.8780 15 Kidney 3.2.4 8 0.1530 0.1140 0.2890 16 fish 3.2.5 131 < 0,001 0.0270 17 fish 3.2.5.1 20 < 0,001 0.0100 18 fish 3.2.7 26 0.4030 < 0,001 0.9740 19 fish 3.2.8 10 1.2000 0.0800 1.9040 20 fish 3.2.6 33 0.0210 < 0,005 1.1410 22 Honey 31 0.009 < 0,005 0.057 23 paprika 1 0.0100 24 Particular nutritional 6 0.094 < 0,005 0.351
Denmark
Dairy products 21 DK-001 1990 N.D. N.D. <0,00003 0.0006 Fruits 420 DK-003 1993-97 0.0029 0.0016 <0,0005 0.0580 Vegetables 487 DK-003 1993-97 0.0184 0.0122 <0,0004 0.2670 Cereals 154 DK-003 1993-97 0.0332 0.0357 <0,001 0.1180 Meat 566 DK-003 1993-97 0.0022 0.0010 <0,0003 0.013
Fish 225 DK-003 1993-97 0.0034 0.0028 <0,001 0.0172
Eggs 30 DK-003 1993-97 0.0006 N.D. 0.0006 0.0010
Finland 1.1.1 milk 52 FI 003 1998 0,001 <0,001 0,001 4.2.1 potato 100 FI 101 2000 0,010 0,003 0,043 4.2.1 carrot 33 FI 102 1993 0,031 0,005 0,15 4.2.1 lettuce 28 FI 102 1993 0,013 0,005 0,068 4.2.1 Chinese cabbage 30 FI 102 1993 0,005 0,001 0,032 5.1 Cocoa powder 20 FI 104 2002 0,17 0,025 0,65 6.1 wheat 36 FI 112 1991 0,036 0,009 0,094 6.1 oats 59 FI 107 1999 0,056 0,012 0,53 6.1 rye 44 FI 107 2001 0,025 0,004 0,077 6.3 Muesli products 30 FI 103 1998 0,022 0,003 0,069 8.1 Meat, reindeer 7 FI 103 1998 0,003 0,001 0,009 8.1 Meat, bovine 30 FI 006 1998 0,001 <0,001 0,002 8.1 Meat, pig 33 FI 006 2001 0,002 <0,001 0,010

SCOOP 3.2.11 – Intake of As, Cd, Pb and Hg
60
Food group code
Food name Number of samples
Reference Year of sampling
Mean level of cadmium
Median level of cadmium
Min Max
Finland cont. 8.1 Meat, sheep 3 FI 005 2000 0.001 0.001 0.002 8.1 Meat, horse 2 FI 005 2000 0.024 0.016 0.032 8.4 Liver, bovine 31 FI 006 2001 0.034 0.013 0.122 8.4 Liver, pig 34 FI 006 2001 0.029 0.008 0.173 8.4 Liver, elk 11 FI 005 2000 0.656 0.309 1.57 8.4 Liver, poultry 13 FI 005 2000 0.011 0.005 0.020 8.4 Kidney, bovine 30 FI 006 2001 0.179 0.065 0.446 8.4 Kidney, pig 30 FI 006 2001 0.162 0.065 0.361 8.4 Kidney, elk 49 FI 006 2001 6.03 0.633 21.3 9.1.1 pike 10 FI 007 2002 0.001 0.001 0.002 9.1.1 perch 15 FI 007 2002 0.002 0.001 0.007 9.1.1 Pike perch 10 FI 007 2002 0.001 <0.001 0.002 9.1.1 bream 4 FI 007 2002 0.003 0.001 0.006 9.1.1 salmon 8 FI 007 2002 0.001 0.001 0.001 9.1.1 vendace 7 FI 007 2002 0.008 0.003 0.024 9.1.1 burbot 7 FI 007 2002 0.001 <0.001 0.001 9.1.1 powan 3 FI 007 2002 0.005 0.005 0.005 9.1.1 Baltic herring 32 FI 007 2002 0.009 0.003 0.019 9.1.2.1 mussels 5 FI 104 2002 0.077 0.054 0.091 9.1.4.3 shrimp 6 FI 104 2002 0.010 0.002 0.035 9.4 Canned tuna 14 FI 104 2002 0.029 0.005 0.064 10.1 egg 30 FI 002 1997 0.001 0.001 0.003 11.3 honey 10 FI 004 1999 0.002 0.001 0.005 14.1.5 Ground coffee (drink) 14 FI 106 1994 0.005 0.003 0.0011
France 1 Dairy products 184 FR 004 2000 3.27E-04 < 7.5E-06 1.86E-03 5 Fruits and vegetables 382 FR 006 2000-2001 0.012 < 0.00025 0.245 6 Fruits and vegetables (a) excl.
Mushrooms 125 FR 006 2000-2001 0.035 < 0.001 0.320
6 bis Mushrooms 79 FR 006 2000-2001 0.081 0.002 0.480 7 Fruits and vegetables (b) 158 FR 006 2000-2001 0.020 < 0.0005 0.140 9 Cereals and cereal products 89 FR 006 2000-2001 0.038 0.0005 0.498 10 Cereals and cereal products cat.2 7 FR 006 2000-2001 0.021 0.003 0.050 12 Meat and meat products 5564 FR 004 2000-2001 0.004 < 0.00007 0.137 13 Horsemeat 468 FR 004 2000-2001 0.056 < 0.0005 0.566 14 Edible offal, liver 5987 FR 004 2000-2001 0.087 < 0.0005 2.75 15&16 Fish and fish products 891 FR 004 2000-2001 0.007 < 0.00025 0.080 18 Molluscs 145 FR 004 2000 0.239 < 0.0005 3.45 20 Crustaceans 7 FR 006 2000-2001 0.087 0.045 0.230 21 Eggs and egg products 300 FR 004 2000 0.0012 < 0.00001 0.014 22 Sweeteners, incl. honey 314 FR 004 + 006 2000-2001 0.003 < 0.0007 0.074 23 Salts, spices, sauces, excl. Soups 172 FR 006 2000-2001 0.046 < 0.00008 0.493 25 Waters 77 FR 006 2000-2001 < 0.00025 < 0.00025 < 0.00025 25 bis Non alcoholic beverages 143 FR 006 2000-2001 0.00174 < 0.00005 0.200 26 Alcoholic beverages 263 FR 006 2000-2001 0.00038 < 0.00003 0.0058
Germany 1.1 and 1.3
milk 151 1997-2002 0.006 <0.0006 0.21
1.5 milk powder 52 1998-2001 0.007 <0.002 0.023 1.6 cheese 297 1997-2001 0.003 <0.0004 0.018 2 oil 56 1998-2002 0.006 <0.002 0.023 4.1 fruits 1894 1997-2002 0.005 <0.0002 0.214

SCOOP 3.2.11 – Intake of As, Cd, Pb and Hg
61
Food group code
Food name Number of samples
Reference Year of sampling
Mean level of cadmium
Median level of cadmium
Min Max
Germany cont. 4.1.2.2 dried fruits 95 1997-2001 0.01 <0.0004 0.07 4.2 nuts and seeds 1712 1997-2002 0.198 <0.0004 1.96 4.2 vegetable 3505 1997-2002 0.029 <0.0002 4.23 4.2 fungi 310 1997-2002 0.052 <0.001 1.38 4.2.2.2 dried vegetables 55 2000-2001 0.269 <0.01 1.05 4.2.2.2 dried fungi 64 1998-2002 0.396 <0.005 2.04 4.2.2.2 dried algae 11 2000-2002 0.73 0.069 3.3 4.2.2.6 cocentrated tomato 61 1999-2001 0.04 0.006 0.102 5.1 cocao products 474 1997-2002 0.071 <0.0017 2.32 6 and 7 cereals, cereal products, bakery
wares 1462 1997-2002 0.029 <0.001 0.861
8.1 fresh meat 1211 1997-2002 0.016 <0.0004 0.787 8.1 game 383 1997-2001 0.005 <0.0006 0.121 8.4 offal 3089 1997-2002 0.102 0.002 2.9 8.5, 8.3 and 8.2
processed meat 328 1997-2002 0.007 <0.0006 0.055
9.1 without 9.1.2 to 9.1.4
fish 2778 1997-2002 0.011 <0.0006 0.834
9.1.2 to 9.1.4
bivalves, crustaceans, squids 718 1997-2002 0.116 <0.0006 4.8
10.1 eggs 46 1997-2000 0.003 <0.0004 0.027 11.1 sugar 22 1998-2001 0.004 <0.001 0.006 11.3 honey 133 1997-2002 0.007 <0.0004 0.059 11.4 sweeteners 32 1998-2000 0.002 <0.002 0.009 12.1 salt 13 1998-2002 0.023 <0.005 0.062 12.2 herbs and spices 484 1997-2002 0.068 <0.0004 1.01 13.1 and 13.2
infant food 1276 1997-2002 0.005 <0.001 0.62
13.4 and 13.5
dietetic food 175 1997-2002 0.088 <0.002 5.9
13.6 food supplements 44 1998-2002 0.193 <0.0008 1.4 14.1.1 water 2991 1997-2002 0.0003 <0.0001 0.003 14.1.2 and 14.1.3
vegetal juice 28 1997-2002 0.064 <0.005 0.266
14.1.2 and 14.1.3
fruit juice 197 1998-2002 0.017 <0.0004 0.122
14.1.5 tea and coffee 417 1997-2002 0.055 <0.0001 0.61 14.2.1 beer 126 1999-2002 0.001 <0.0004 0.005 14.2.3 wine 442 1997-2002 0.005 <0.0001 0.23
Greece 1.1.1 Milk and butter milk 95 2001-2002 0.0010 0.0002 0.0120 4.2.2 Processed vegetables, nuts, seeds 4 1999-2000 0.0677 <0.002 <0.002 0.2000 6.1 Whole, broken or flaked grain 5 2001-2002 0.0584 0.0180 0.1800
8.1.1+8.3.1 Fresh & processed comminuted meat 50 1999-2002 0.0074 < 0.002 0.0510
8.4 Offals 93 1999-2002 0.2711 0.0043 2.8660 9.1.1 Fresh fish Muscle meat of fish 14 1999-2000 0.0756 0.0013 0.9000 9.1.1.13 bass 4 2000 0.0072 0.0130 0.0130 0.0130 9.1.1.28 swordfish 3 2000-2002 0.0131 0.0013 0.0190 9.1.1.30X1 Chrysophrys auratus 48 1999-2002 0.0059 0.0013 0.0350 9.1.1.30X2 Common Pantora 1 2000 0.0640 0.0640 0.0640 0.0640 9.1.1.30X3 bogue 5 1999-2001 0.0185 0.0043 0.0250 9.1.1.30
X5 Cuttlefish
3 2001 0.4190 0.0380 0.0090 1.2110

SCOOP 3.2.11 – Intake of As, Cd, Pb and Hg
62
Food group code
Food name Number of samples
Reference Year of sampling
Mean level of cadmium
Median level of cadmium
Min Max
Greece cont. 9.1.1.30 X6 Perch 5 2001 0.0010 <0.002 0.0020 9.1.1.30 X7 Seabream 3 2001 0.0090 0.0080 <0.002 0.0180 9.1.1.30 X8 Small fish eaten whole 10 2001 0.0386 0.0250 0.0190 0.1440 9.1.1.5 Grey mullet 3 2002 0.0567 0.0500 0.0500 0.0700 9.1.2 Fresh bivalve molluscs 14 2000-2002 0.1826 0.0220 0.4564 9.1.2.1 mussels 57 1999-2002 0.6957 0.0479 2.4500 9.1.2.2 Oysters 1 2002 0.4920 0.4920 0.4920 0.4920 9.1.3 Fresh cephalopodes 2 2001 0.0022 <0.002 0.0042 9.1.3.1 Squid 2 2001 0.3860 0.3860 0.0580 0.7150 9.1.3.2 Octopus 37 1999-2001 0.1556 < 0.002 1.3000 9.1.3.3 Cattle-fish 10 1999-2000 0.4360 0.0500 1.3000 9.1.4.2 Lobsters 1 2000 0.0045 0.0045 0.0045 0.0045 9.1.4.3 Shrimp 3 1999-2000 0.0210 0.0200 0.0400 9.2.1+9.2.2 Frozen fish 458 1999-2002 0.1606 0.0005 6.2300 9.4 Fullly preserved fish 188 1999-2002 0.2950 < 0.002 9.4.1 Fish canned in oil 180 1999-2002 0.7355 <0.002 8.5600 9.4.2 Fish canned in brine 105 1998-2002 0.2028 <0.002 1.5000 9.4.3 Fermented fish 271 1998-2002 0.6604 <0.002 5.9200 9.4.4.X1 Smoked hering 3 2000-2002 0.0640 0.0640 0.0640 Ireland Milk 3 1999 0.005 0.0050 0.0050 acid casein powder 43 1995/1996 0.0025 <0.005 <0.005 rennet casein powder 33 1995/1996 0.0025 <0.005 <0.005 skim milk powder 71 1995/1996 0.0025 <0.005 <0.005 FLOUR 2 1999 0.0500 0.0500 0.0500 Beef 87 2000-2001 0.004 <0.002 <0.02 Lamb 7 2000-2001 0.001 <0.002 <0.002 Poultry 25 2000-2001 0.01 <0.002 <0.02 BEEFKIDNEY 3 2000-2001 0.1933 0.0500 0.4200 KIDNEY 5 2000-2001 0.1220 0.0800 0.2100 LAMBSKIDNEY 7 2000-2001 0.1814 0.0500 0.6300 LAMBSLIVER 8 2000-2001 0.0813 0.0500 0.1200 LIVER 1 2000-2001 0.1500 0.1500 0.1500 Pate 1 2000-2001 0.1200 0.1200 0.1200 PORKKIDNEY 2 2000-2001 0.2200 0.2100 0.2300 PORKLIVER 4 2000-2001 0.0850 0.0600 0.1300 ANCHOVIES 2 2000-2001 0.2400 0.1500 0.3300 C.Gigas 549 1996-2001 0.3325 0.0980 0.6310 Cod 130 1996-2001 0.0035 0.0040 0.0090 Crab 4 1996-2001 2.5425 0.1700 4.6000 haddock 70 1996-2001 0.0023 0.0040 0.0040 hake 10 1996-2001 0.0030 <0.006 <0.006 herring 10 1996-2001 0.0020 <0.004 <0.004 lemon sole 20 1996-2001 0.0020 <0.004 <0.004 ling 10 1996-2001 0.0020 <0.004 <0.004 M.edulis 2150 1996-2001 0.1662 0.0500 0.4400 Mackeral 40 1996-2001 0.0043 0.0040 0.0060 monk/angler fish 20 1996-2001 0.0020 <0.004 <0.004 O.edulis 275 1996-2001 0.4291 0.2600 0.5900 OYSTERS 1 1996-2001 0.2470 0.2470 0.2470 plaice 116 1996-2001 0.0023 <0.004 <0.006 prawns 51 1996-2001 0.0340 0.0080 0.0800 Saithe 5 1996-2001 0.0020 <0.004 0.0140

SCOOP 3.2.11 – Intake of As, Cd, Pb and Hg
63
Food group code
Food name Number of samples
Reference Year of sampling
Mean level of cadmium
Median level of cadmium
Min Max
Ireland cont. salmon 313 1996-2001 0.0044 0.0100 0.0300 SHRIMPS 1 1996-2001 0.2400 0.2400 0.2400 Trout 50 1996-2001 0.0045 <0.004 <0.01 whiting 10 1996-2001 0.0020 <0.004 <0.004 FROZEN PRAWNS 1 2000-2001 0.1100 0.1100 0.1100 prawns 1 2000-2001 0.2600 0.2600 0.2600 Smoked fish 1 2000-2001 0.0700 0.0700 0.0700 SMOKEDOYSTERS 1 2000-2001 0.6500 0.6500 0.6500 Allspice 1 2000-2001 0.0800 0.0800 0.0800 Chilli Powder 1 2000-2001 0.0800 0.0800 0.0800 Chinese 5 Spice 1 2000-2001 0.2400 0.2400 0.2400 Cinnamon 7 2000-2001 0.2329 0.0700 0.3300 Coriander 1 2000-2001 0.1800 0.1800 0.1800 Curry Powder 4 2000-2001 0.0900 0.0500 0.1300 Dill 1 2000-2001 0.3700 0.3700 0.3700 Dried Parsley 1 2000-2001 0.1000 0.1000 0.1000 Dried Rosemary 1 2000-2001 0.0700 0.0700 0.0700 Dried Thyme 1 2000-2001 0.0800 0.0800 0.0800 Ginger 2 2000-2001 0.1400 0.0700 0.2100 Ground Corriander 1 2000-2001 0.0800 0.0800 0.0800 Ground Ginger 1 2000-2001 0.1100 0.1100 0.1100 Ground Paprika 1 2000-2001 0.0700 0.0700 0.0700 Mixed Herbs 17 2000-2001 0.1400 0.0600 0.4800 Mixed Spice 9 2000-2001 0.2122 0.0600 0.2800 Mixed Spices 1 2000-2001 0.0700 0.0700 0.0700 Nutmeg 3 2000-2001 0.2167 0.1900 0.2500 Oregano 1 2000-2001 0.0800 0.0800 0.0800 Organic Spice 1 2000-2001 0.0700 0.0700 0.0700 Organic Whole Mace 1 2000-2001 0.0900 0.0900 0.0900 Paprika 5 2000-2001 0.1120 0.0700 0.1800 Parsley 8 2000-2001 0.1163 0.0600 0.1600 Seasoning 1 2000-2001 0.0500 0.0500 0.0500 Thai Spice 2 2000-2001 0.0650 0.0600 0.0700 Thyme 9 2000-2001 0.1633 0.0500 0.5700 Tumeric 1 2000-2001 0.0800 0.0800 0.0800 MUSTARD 10 2000-2001 0.0830 0.0500 0.2600 Sauce 1 2000-2001 0.0900 0.0900 0.0900 MUSSELSALAD 1 2000-2001 0.1100 0.1100 0.1100 SOYA BASED INFANT
FORMULA 2 2000-2001 0.0650 0.0600 0.0700
CHILLINUTS 1 2000-2001 0.0900 0.0900 0.0900 Colouring 1 2000-2001 0.0050 0.0050 0.0050 MILK 3 2000-2001 0.0050 0.0050 0.0050 Barley Drink 1 2000-2001 0.0900 0.0900 0.0900 BOTTLEDWATER 27 2000-2001 0.0005 0.0005 0.0005 Coffee 2 2000-2001 0.0700 0.0700 0.0700 Coffee - decaff 2 2000-2001 0.0700 0.0700 0.0700 Coffee (instant) organic 1 2000-2001 0.0700 0.0700 0.0700 FRUITDRINK 1 2000-2001 0.0050 0.0050 0.0050 Tea 6 2000-2001 0.1233 0.0500 0.2100 Tea (herbal) 3 2000-2001 0.1067 0.0700 0.1500 WATER 7 2000-2001 0.0005 0.0005 0.0005 CIDER 2 2000-2001 0.0175 0.0050 0.0300 APPLES 4 2000-2001 0.2025 0.1200 0.3500 GOOSEBERRIES 1 2000-2001 0.0130 0.0130 0.0130

SCOOP 3.2.11 – Intake of As, Cd, Pb and Hg
64
Food group code
Food name Number of samples
Reference Year of sampling
Mean level of cadmium
Median level of cadmium
Min Max
Ireland cont. RHUBARB 3 2000-2001 0.0870 0.0220 0.2000 CABBAGE 13 2000-2001 0.0862 0.0200 0.1790 CARROTS 3 2000-2001 0.1200 0.0600 0.1700 LETTUCE 9 2000-2001 0.1514 0.0260 0.4400 ONIONS 10 2000-2001 0.1288 0.0200 0.6600 PARSNIP 2 2000-2001 0.0750 0.0500 0.1000 Pesto Genovese Mill 1 2000-2001 0.0900 0.0900 0.0900 POTATOES 13 2000-2001 0.0686 0.0150 0.1600 SPINACH 2 2000-2001 0.5500 0.3300 0.7700 SPRING ONIONS 1 2000-2001 0.0900 0.0900 0.0900 TOMATO POWDER 2 2000-2001 0.1450 0.1300 0.1600 TOMATOES 1 2000-2001 0.0700 0.0700 0.0700 Pate 1 2000-2001 0.1000 0.1000 0.1000 TINNED CRAB MEAT 1 2000-2001 0.1600 0.1600 0.1600 TINNED CRABMEAT 1 2000-2001 0.1100 0.1100 0.1100
Note: Table does not include all occurrence data (excluded are not quantified data and data from highly contaminated areas. For these please see main table in the Annex.
Italy 9.1.2.1 Mussel 30 IT-003 1995 0,10 6.1 Durum wheat grain 239 IT-007/IT-008 1996 0,037 0,009 0,076 6.1 Soft wheat grain 178 IT-007/IT-008 1996 0,035 0,011 0,081 8.1.1 Horse muscle 62 IT-009 1996 0,075 0,003 0,490 14.2.3 White and red wines 60 IT-010 1996-98 <0,003 <0,003 0,006 9.1.3.2 Spider octopus 300 IT-011 1997 0,40 0,14 1,04 9.1.3.1 Broadtail squid 212 IT-011 1997 0,07 0,04 0,10 1.1.1 Cow milk 10 IT-012 1997 <0,004 <0,004 <0,004 13.1 Powdered milks for infants 18 IT-012 1997 <0,004 <0,004 0,007 6.4 Pasta 19 IT-013 1997-98 0,05 0,02 0,09 6.2 Wheat flour "0" type 2 IT-013 1997-98 0,03 0,02 0,04 7.1.1 Bread "0" type 2 IT-013 1997-98 0,04 0,03 0,05 4.2.1 Lettuce 13 IT-013 1997-98 0,03 0,01 0,06 4.2.1 Endive 5 IT-013 1997-98 0,03 <0,01 0,05 4.2.1 Celery 5 IT-013 1997-98 0,09 0,06 0,19 4.2.1 Spinach 5 IT-013 1997-98 0,16 0,09 0,29 4.2.1 Guinea pepper 13 IT-013 1997-98 0,03 0,02 0,05 4.2.1 Tomato 15 IT-013 1997-98 0,05 0,02 0,09 4.2.2.4 Canned tomatoes (peeled & sauce) 4 IT-013 1997-98 0,06 0,03 0,09 4.1.2.5 Fruit jam 4 IT-013 1997-98 <0,01 <0,01 0,03 4.2.2 Roasted pistachio 4 IT-013 1997-98 0,11 0,10 0,12 1.6.2 Pecorino (ewes' milk cheese) 7 IT-014 1998 0,025 1.6.6 Ricotta (ewes' milk cheese) 7 IT-014 1998 0,043 11.3 Honey 50 IT-005 1999 0,0009 <0,0004 0,0052 9.1.2.3 Striped venus 1260 IT-015 1999 0,09 0,07 0,12 2.1.2 Olive oil 4 IT-016 2000-2001 <0,0012 <0,0012 <0,0012 6.4 Pasta 11 IT-006 2002 0,047 0,036 0,020 0,092 6,1 Rice 42 IT 22 1997-2002 0,07 <0,002 0,36 9,1 Fresh Fish 90 IT-023 2001 0,0033 <0,00025 0,0077 9,1,3 Fresh cephalopodes 42 IT-023 2001 0,0021 0,0009 0,198 9,1,2 Fresh bivalve molluscs 30 IT-023 2001 0,091 0,028 0,366 the Netherlands potatoes 69 NL/002 1997 0,022 0,017 0,007 0,082 potatoes 7 NL/002 2002 0,018 0,02 0,007 0,033 potatoe-dish 4 NL/002 1997 0,015 0,015 0,01 0,02 strawberry 6 NL/002 2002 0,006 0,005 0,002 0,012 endive 1 NL/002 1999 0,025

SCOOP 3.2.11 – Intake of As, Cd, Pb and Hg
65
Food group code
Food name Number of samples
Reference Year of sampling
Mean level of cadmium
Median level of cadmium
Min Max
the Netherlands cont. endive 1 NL/002 2001 0,042 endive 4 NL/002 2002 0,034 0,034 0,021 0,046 anise 1 NL/002 1997 0,15 anchovy 4 NL/002 1998 0,353 0,382 0,075 0,572 anchovy 3 NL/002 1999 0,17 0,183 0,041 0,287 anchovy 24 NL/002 2001 0,077 0,05 0,005 0,38 vinegar 49 NL/002 1997 0,05 special herbs- and mixtures 5 NL/002 1997 0,116 0,14 0,04 0,15 cauliflower 1 NL/002 1997 0,01 cauliflower 1 NL/002 1998 0,26 cauliflower 1 NL/002 1999 0,013 cauliflower 15 NL/002 2001 0,02 0,024 0,005 0,032 cauliflower 4 NL/002 2002 0,025 0,02 0,005 0,053 onion 1 NL/002 2002 0,002 flounder 22 NL/002 1999 0,005 0,005 0,005 0,02 cayenne, chilipowder 2 NL/002 1997 0,31 0,31 0,03 0,59 mushrooms 2 NL/002 1998 0,016 0,016 0,005 0,03 tuber 1 NL/002 1997 0,01 green pea 1 NL/002 1997 0,01 drinking water 15 NL/002 1997 april 0,00005 0,00005 0,00005 0,00005 drinking water 27 NL/002 1997 mei 0,0005 0,0005 0,0005 0,0037 drinking water 14 NL/002 1998 mei 0,0005 0,0005 0,0005 0,001 drinking water 13 NL/002 1998 juni 0,0005 0,0005 0,0005 0,0005 pigeon 1 NL/002 2001 0,02 pigeon 1 NL/002 1998 0,009 duck 2 NL/002 1997 0,006 0,006 0,005 0,012 duck 2 NL/002 1998 0,135 0,135 0,005 0,265 duck 4 NL/002 2001 0,005 0,005 0,005 0,005 pheasant 1 NL/002 1997 0,01 pheasant 5 NL/002 2001 0,005 0,005 0,005 0,005 mace 1 NL/002 1997 0,06 trout 1 NL/002 1999 0,02 shrimp 14 NL/002 1999 0,024 0,025 0,005 0,07 mixed vegetables 1 NL/002 1998 0,008 mixed spices 3 NL/002 1997 0,073 0,06 0,06 0,1 green coal 2 NL/002 1997 0,01 0,01 0,01 0,01 green coal 1 NL/002 1998 0,08 shark 1 NL/002 1999 0,02 hare 3 NL/002 1997 0,004 0,001 0,005 0,011 hare 14 NL/002 2001 0,019 0,02 0,005 0,04 herring 1 NL/002 1998 0,005 herring 3 NL/002 1999 0,049 0,049 0,044 0,055 herring 8 NL/002 2001 0,02 0,02 0,01 0,04 hake 1 NL/002 1999 0,005 deer 2 NL/002 1997 0,001 0,001 0,001 0,001 deer 15 NL/002 2001 0,012 0,01 0,005 0,05 ice berg lettuce 1 NL/002 2002 0,008 cuttle fish 1 NL/002 1998 2,52 cuttle fish 19 NL/002 1999 0,153 0,17 0,02 0,26 cuttle fish 6 NL/002 2001 0,585 0,39 0,09 1,591 hard cheese 2 NL/002 2000 0,0125 0,0125 0,0125 0,0125 codfish 9 NL/002 1999 0,005 0,005 0,005 0,005 cinnamon 4 NL/002 1997 0,13 0,105 0,08 0,23 chestnut 1 NL/002 1998 0,01

SCOOP 3.2.11 – Intake of As, Cd, Pb and Hg
66
Food group code
Food name Number of samples
Reference Year of sampling
Mean level of cadmium
Median level of cadmium
Min Max
the Netherlands cont. curry 2 NL/002 1997 0.065 0.065 0.03 0.1 chicken 7 NL/002 1998 0.013 0.011 0.005 0.024 rooted celery 1 NL/002 1997 0.01 rooted celery 1 NL/002 1998 0.51 cockle 15 NL/002 1999 0.024 0.02 0.005 0.08 cummin 1 NL/002 1997 0.06 cucumber 1 NL/002 2002 0.002 rabbit 12 NL/002 2001 0.01 0.005 0.005 0.03 crab 1 NL/002 1997 0.028 crab 2 NL/002 1999 0.075 0.075 0.02 0.13 crab 3 NL/002 2000 0.1 0.1 0.1 0.1 crab 3 NL/002 2001 0.083 0.06 0.05 0.14 lobster 1 NL/002 1999 0.02 red beetroot 1 NL/002 1997 0.01 red beetroot 2 NL/002 2002 0.14 0.014 0.013 0.014 lettuce 9 NL/002 2002 0.036 0.031 0.016 0.087 clove 1 NL/002 1997 0.02 crinkly lettuce 1 NL/002 2002 0.069 koenjit 1 NL/002 1997 0.16 lollo bianco 1 NL/002 2002 0.031 mackerel 3 NL/002 1998 0.01 0.008 0.005 0.02 mackerel 9 NL/002 1999 0.008 0.01 0.005 0.02 mackerel 6 NL/002 2001 0.017 0.015 0.01 0.03 mussels 1 NL/002 1998 0.793 mussels 47 NL/002 1999 0.079 0.06 0.04 0.31 nutmeg 1 NL/002 1997 0.03 oysters 11 NL/002 1999 0.131 0.08 0.06 0.62 olives 1 NL/002 1998 0.01 organs 13 NL/002 1998 0.033 0.021 0.015 0.124 organs 38 NL/002 2000 0.106 0.035 0.03 1.33 rest feral and poultry 3 NL/002 1997 0.006 0.01 0.005 0.017 wheatproducts 2 NL/002 2001 0.02 0.02 0.015 0.025 vegetables and products 1 NL/002 1997 0.01 vegetables and products 1 NL/002 1999 0.05 vegetables and products 5 NL/002 1998 0.04 0.04 0.005 0.07 vegetables and products 5 NL/002 2001 0.155 0.021 0.005 0.7 nuts and seedproduct 1 NL/002 2001 0.7 nuts and seedproduct 1 NL/002 1998 0.03 other shell fish 10 NL/002 1999 0.042 0.04 0.005 0.08 other shell fish 1 NL/002 2001 0.19 other flavours 1 NL/002 1997 0.1 tropical fruit 1 NL/002 1998 0.01 other fishproducts 3 NL/002 1997 0.026 0.033 0.05 0.038 other fishproducts 2 NL/002 1998 0.026 0.026 0.016 0.036 other fishproducts 6 NL/002 1999 0.046 0.053 0.005 0.08 other fishproducts 28 NL/002 2001 0.096 0.03 0.005 0.7 other fishspecies 42 NL/002 1999 0.026 0.005 0.005 0.81 other fishspecies 6 NL/002 2001 0.042 0.025 0.01 0.14 other meatproducts 1 NL/002 1998 0.191 eel 22 NL/002 1999 0.012 0.005 0.005 0.17 paprica sharp 2 NL/002 1997 0.01 0.01 0.01 0.02 paprica powder 17 NL/002 1997 0.163 0.2 0.1 0.3
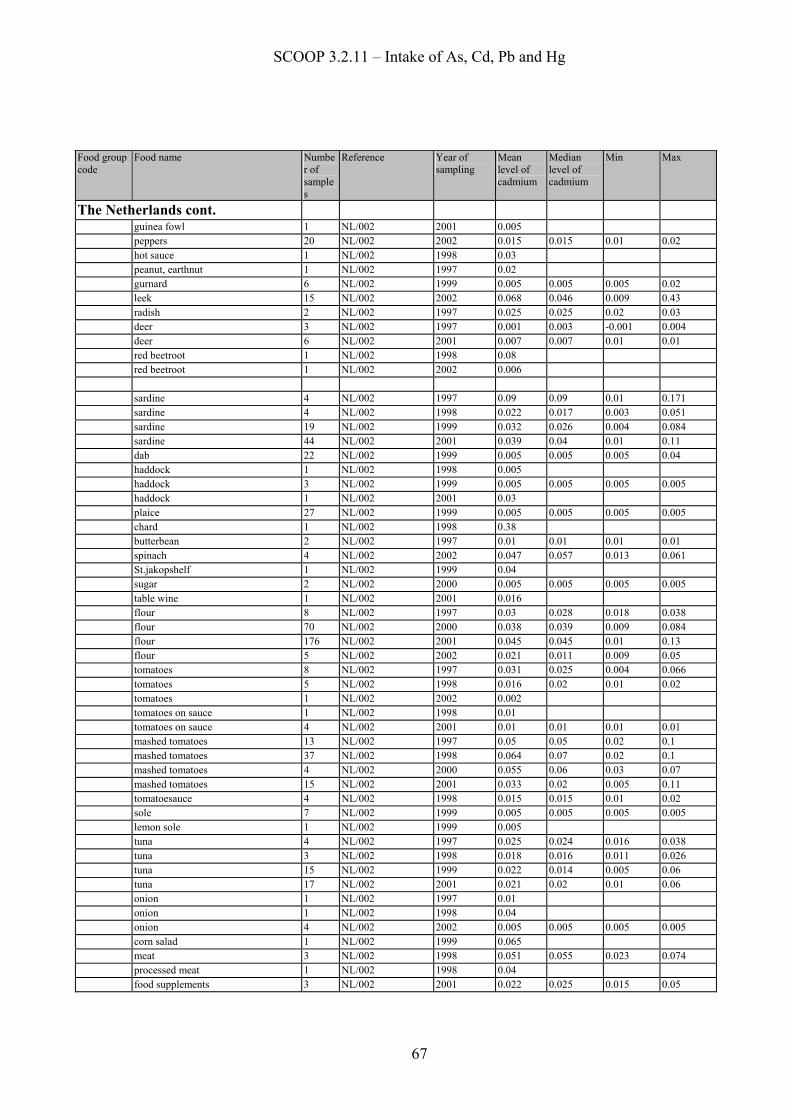
SCOOP 3.2.11 – Intake of As, Cd, Pb and Hg
67
Food group code
Food name Number of samples
Reference Year of sampling
Mean level of cadmium
Median level of cadmium
Min Max
The Netherlands cont. guinea fowl 1 NL/002 2001 0.005 peppers 20 NL/002 2002 0.015 0.015 0.01 0.02 hot sauce 1 NL/002 1998 0.03 peanut, earthnut 1 NL/002 1997 0.02 gurnard 6 NL/002 1999 0.005 0.005 0.005 0.02 leek 15 NL/002 2002 0.068 0.046 0.009 0.43 radish 2 NL/002 1997 0.025 0.025 0.02 0.03 deer 3 NL/002 1997 0.001 0.003 -0.001 0.004 deer 6 NL/002 2001 0.007 0.007 0.01 0.01 red beetroot 1 NL/002 1998 0.08 red beetroot 1 NL/002 2002 0.006 sardine 4 NL/002 1997 0.09 0.09 0.01 0.171 sardine 4 NL/002 1998 0.022 0.017 0.003 0.051 sardine 19 NL/002 1999 0.032 0.026 0.004 0.084 sardine 44 NL/002 2001 0.039 0.04 0.01 0.11 dab 22 NL/002 1999 0.005 0.005 0.005 0.04 haddock 1 NL/002 1998 0.005 haddock 3 NL/002 1999 0.005 0.005 0.005 0.005 haddock 1 NL/002 2001 0.03 plaice 27 NL/002 1999 0.005 0.005 0.005 0.005 chard 1 NL/002 1998 0.38 butterbean 2 NL/002 1997 0.01 0.01 0.01 0.01 spinach 4 NL/002 2002 0.047 0.057 0.013 0.061 St.jakopshelf 1 NL/002 1999 0.04 sugar 2 NL/002 2000 0.005 0.005 0.005 0.005 table wine 1 NL/002 2001 0.016 flour 8 NL/002 1997 0.03 0.028 0.018 0.038 flour 70 NL/002 2000 0.038 0.039 0.009 0.084 flour 176 NL/002 2001 0.045 0.045 0.01 0.13 flour 5 NL/002 2002 0.021 0.011 0.009 0.05 tomatoes 8 NL/002 1997 0.031 0.025 0.004 0.066 tomatoes 5 NL/002 1998 0.016 0.02 0.01 0.02 tomatoes 1 NL/002 2002 0.002 tomatoes on sauce 1 NL/002 1998 0.01 tomatoes on sauce 4 NL/002 2001 0.01 0.01 0.01 0.01 mashed tomatoes 13 NL/002 1997 0.05 0.05 0.02 0.1 mashed tomatoes 37 NL/002 1998 0.064 0.07 0.02 0.1 mashed tomatoes 4 NL/002 2000 0.055 0.06 0.03 0.07 mashed tomatoes 15 NL/002 2001 0.033 0.02 0.005 0.11 tomatoesauce 4 NL/002 1998 0.015 0.015 0.01 0.02 sole 7 NL/002 1999 0.005 0.005 0.005 0.005 lemon sole 1 NL/002 1999 0.005 tuna 4 NL/002 1997 0.025 0.024 0.016 0.038 tuna 3 NL/002 1998 0.018 0.016 0.011 0.026 tuna 15 NL/002 1999 0.022 0.014 0.005 0.06 tuna 17 NL/002 2001 0.021 0.02 0.01 0.06 onion 1 NL/002 1997 0.01 onion 1 NL/002 1998 0.04 onion 4 NL/002 2002 0.005 0.005 0.005 0.005 corn salad 1 NL/002 1999 0.065 meat 3 NL/002 1998 0.051 0.055 0.023 0.074 processed meat 1 NL/002 1998 0.04 food supplements 3 NL/002 2001 0.022 0.025 0.015 0.05

SCOOP 3.2.11 – Intake of As, Cd, Pb and Hg
68
Food group code
Food name Number of samples
Reference Year of sampling
Mean level of cadmium
Median level of cadmium
Min Max
The Netherlands cont. fruit on juice 1 NL/002 2001 0.003 fruit on syrup 1 NL/002 1997 0.01 whiting 23 NL/002 1999 0.005 0.005 0.005 0.04 wild product 3 NL/002 1997 0.005 0.005 0.005 0.019 winter carrot 1 NL/002 2001 0.029 winter carrot 1 NL/002 2002 0.083 chicory 5 NL/002 1997 0.005 0.005 0.005 0.005 white cabbage 2 NL/002 1997 0.005 0.005 0.005 0.005 white cabbage 1 NL/002 1998 0.04 white cabbage 3 NL/002 2002 0.004 0.004 0.004 0.005 white pepper 3 NL/002 1997 0.023 0.03 0.01 0.03 carrot 1 NL/002 1997 0.02 carrot 1 NL/002 1999 0.013 carrot 3 NL/002 2002 0.019 0.008 0.005 0.011 salmon 5 NL/002 1997 0.005 0.005 0.005 0.005 salmon 6 NL/002 1999 0.016 0.02 0.005 0.02 salmon 3 NL/002 2001 0.008 0.01 0.01 0.01 salt 3 NL/002 1997 0.005 0.005 0.005 0.005 salt 21 NL/002 2000 0.001 0.001 0.001 0.01 sauerkraut 9 NL/002 1997 0.005 0.005 0.005 0.01 black pepper 3 NL/002 1997 0.005 0.005 0.005 0.06 black coal fisf 3 NL/002 1999 0.005 0.005 0.005 0.005 swine 1 NL/002 1997 0.007 swine 1 NL/002 1998 0.0025 swine 8 NL/002 2001 0.006 0.005 0.01 0.01
Norway 2 Fats and oils 6 2001 0 0 0 4 Vegetables and fungi 504 1993-1995 0.01365 <0.001 0.122 5 Confectionary 6 1999 0.01800 <0.001 0.031 6 Cereals 269 1995-2001 0.03660 0.001 0.164 8 Meat 856 2001-2001 0.67129 <0.01 16.5 9 Fish 766 1994-1997 0.025961 <0.0005 0.038 9.1.4 Shellfish 148 1994-2000 1.124875 0.01 8 10 Egg 27 2000-2001 0.005 <0.01 0.01 11 Sweeteners 21 1999-2001 0.0035 0 0.03 14 Beverages 94 1999-2001 0.00039 0 0.005
Portugal vegetable oil 9 PT-040 2000-2001 0.011 <0.02 <0.03
fruits and vegetables 148 PT-10,040,120 1998-2002 0.043 0.004 <0.4
potato 53 PT-010 1998-2000 0.0381 <0.07 <0.1
chocolate 3 PT-020 2002 0.007 0.016
cereals and flour 71 PT-020,040 1999-2002 0.027 0.003 0.085
breakfast cereals 20 PT-040 2001 <0.05
pasta and noodles 2 PT-040 2000 <0.03
cakes 2 PT-040 2000 <0.03
liver(bovine,caprine,quail,rabbit,chicken, wild boar,ovine,turkey,pork,deer)
259 PT-050 2001 0.0106 0.00004 52.8
equine liver 15 PT-050 2001 5.7 5.9 0.6 14.1
fresh fish 194 PT-060 1998-2001 0.005 <0.01 0.1
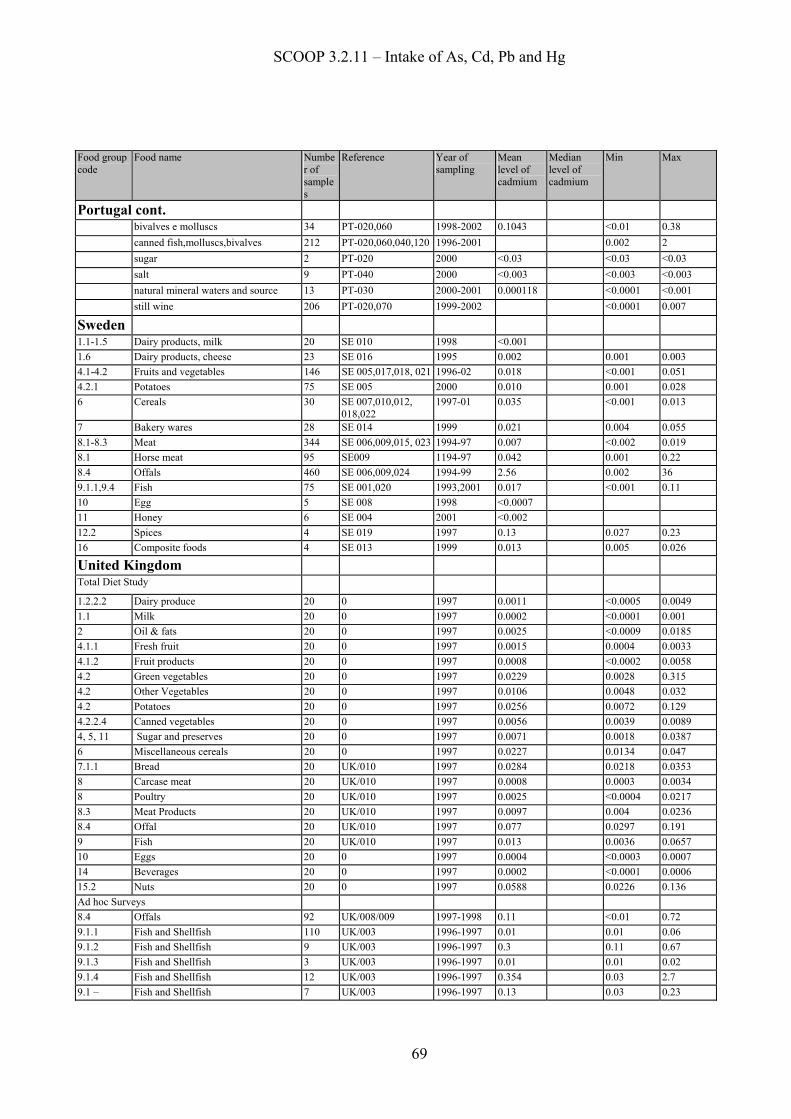
SCOOP 3.2.11 – Intake of As, Cd, Pb and Hg
69
Food group code
Food name Number of samples
Reference Year of sampling
Mean level of cadmium
Median level of cadmium
Min Max
Portugal cont. bivalves e molluscs 34 PT-020,060 1998-2002 0.1043 <0.01 0.38
canned fish,molluscs,bivalves 212 PT-020,060,040,120 1996-2001 0.002 2
sugar 2 PT-020 2000 <0.03 <0.03 <0.03
salt 9 PT-040 2000 <0.003 <0.003 <0.003
natural mineral waters and source 13 PT-030 2000-2001 0.000118 <0.0001 <0.001
still wine 206 PT-020,070 1999-2002 <0.0001 0.007
Sweden 1.1-1.5 Dairy products, milk 20 SE 010 1998 <0.001 1.6 Dairy products, cheese 23 SE 016 1995 0.002 0.001 0.003 4.1-4.2 Fruits and vegetables 146 SE 005,017,018, 021 1996-02 0.018 <0.001 0.051 4.2.1 Potatoes 75 SE 005 2000 0.010 0.001 0.028 6 Cereals 30 SE 007,010,012,
018,022 1997-01 0.035 <0.001 0.013
7 Bakery wares 28 SE 014 1999 0.021 0.004 0.055 8.1-8.3 Meat 344 SE 006,009,015, 023 1994-97 0.007 <0.002 0.019 8.1 Horse meat 95 SE009 1194-97 0.042 0.001 0.22 8.4 Offals 460 SE 006,009,024 1994-99 2.56 0.002 36 9.1.1,9.4 Fish 75 SE 001,020 1993,2001 0.017 <0.001 0.11 10 Egg 5 SE 008 1998 <0.0007 11 Honey 6 SE 004 2001 <0.002 12.2 Spices 4 SE 019 1997 0.13 0.027 0.23 16 Composite foods 4 SE 013 1999 0.013 0.005 0.026
United Kingdom Total Diet Study 1.2.2.2 Dairy produce 20 0 1997 0.0011 <0.0005 0.0049 1.1 Milk 20 0 1997 0.0002 <0.0001 0.001 2 Oil & fats 20 0 1997 0.0025 <0.0009 0.0185 4.1.1 Fresh fruit 20 0 1997 0.0015 0.0004 0.0033 4.1.2 Fruit products 20 0 1997 0.0008 <0.0002 0.0058 4.2 Green vegetables 20 0 1997 0.0229 0.0028 0.315 4.2 Other Vegetables 20 0 1997 0.0106 0.0048 0.032 4.2 Potatoes 20 0 1997 0.0256 0.0072 0.129 4.2.2.4 Canned vegetables 20 0 1997 0.0056 0.0039 0.0089 4, 5, 11 Sugar and preserves 20 0 1997 0.0071 0.0018 0.0387 6 Miscellaneous cereals 20 0 1997 0.0227 0.0134 0.047 7.1.1 Bread 20 UK/010 1997 0.0284 0.0218 0.0353 8 Carcase meat 20 UK/010 1997 0.0008 0.0003 0.0034 8 Poultry 20 UK/010 1997 0.0025 <0.0004 0.0217 8.3 Meat Products 20 UK/010 1997 0.0097 0.004 0.0236 8.4 Offal 20 UK/010 1997 0.077 0.0297 0.191 9 Fish 20 UK/010 1997 0.013 0.0036 0.0657 10 Eggs 20 0 1997 0.0004 <0.0003 0.0007 14 Beverages 20 0 1997 0.0002 <0.0001 0.0006 15.2 Nuts 20 0 1997 0.0588 0.0226 0.136 Ad hoc Surveys 8.4 Offals 92 UK/008/009 1997-1998 0.11 <0.01 0.72 9.1.1 Fish and Shellfish 110 UK/003 1996-1997 0.01 0.01 0.06 9.1.2 Fish and Shellfish 9 UK/003 1996-1997 0.3 0.11 0.67 9.1.3 Fish and Shellfish 3 UK/003 1996-1997 0.01 0.01 0.02 9.1.4 Fish and Shellfish 12 UK/003 1996-1997 0.354 0.03 2.7 9.1 – Fish and Shellfish 7 UK/003 1996-1997 0.13 0.03 0.23

SCOOP 3.2.11 – Intake of As, Cd, Pb and Hg
70
other*–
Food group code
Food name Number of samples
Reference Year of sampling
Mean level of cadmium
Median level of cadmium
Min Max
United Kingdom cont. 9.2.2 Fish and Shellfish 3 UK/003 1996-1997 0.01 0.01 0.01 13 Infant Foods 96 UK/001/011 1997-1999 0.011 <0.0001 0.096 14 Beverages** 91 UK/004/005 1997 0.005 0.00003 0.03 4, 6, 14, 16, 12, 2
Vegetarian Foods 99 UK/006/007 1997-1998 0.014 0.0006 0.2
1, 7, 16, 15, 9, 8, 4, 12,
Snack and Convenience foods 298 UK/002 1996-1999 0.017 0.01 0.27
* Cockles and winkles.** Including 4 samples of 5.1(dried chocolate drinks) and 3 samples of 1.1.4 (flavoured milks/yoghurts)
References for cadmium in 3.1 1. Evaluation of certain food additives and contaminants 41st report of JECFA. WHO Technical Report Series 837 (1993). 2. Science and Techniques- Report on Task for Scientific Co-operation - European Commission “Dietary Exposure to Cadmium” 1996. 3. Toxicology Letters 2003, 137(1-2), 65-83. A global perspective on cadmium pollution and toxicity in non-occupationally exposed population. Satarug, Soisungwan; Baker, Jason R.; Urbenjapol, Supanee; Haswell-Elkins, Melissa; Reilly Paul E. B.; Williams, David J.; Moore, Micheal R. 4. Mitteilungen aus Lebensmitteluntersuchung und Hygiene 1999, 90(6), 734-750. Toxicity of dietary cadmium. Daniel O.; Schlatter J. 5. Journal of Commodity Science 2002, 41(1), 41-63. Intake and effects of cadmium, chromium and nickel in humans. Anke, Manfred; Mueller, Mario; Truepschuch, Annett; Mueller, Ralf. 6. Megen- und Spurenelemente, Arbeitstaging, 19th, Jena, Germany, Dec. 3-4, 1999, 95-103 Cadmium and lead in the food chain of industrial point source in Eastern Europé. Willecke-Wetstein, C. Steinbach, J. Luker, E. Bacon, J. Breen. 7. Journal of Enviromental Science and Healt, part B: Pesticides, Food Contaminant, and Agricultural Waste 1999, B34 (4), 681-708. Accumulation of potentially toxic element in plants and their transfer to human food chain. Dudka, S., Miller, W. P.

SCOOP 3.2.11 – Intake of As, Cd, Pb and Hg
71
4. DIETARY INTAKE OF LEAD Over the past decades, the lead level in food has decreased significantly owing to source-related efforts to reduce the emission of lead, and improvements in quality assurance of chemical analysis. Lead is present at low concentrations in most foods. Offal and molluscs may contain higher levels. Contamination of food during processing or food production in contaminated areas are the main reasons for enhanced lead intake via foodstuffs. 4.1 Toxicology Absorption of ingested lead may constitute a serious risk to public health. Some chronic effects of lead poisoning are colic, constipation and anaemia. It may also induce increased blood pressure and cardiovascular disease in adults. Foetal neuro-developmental effects and reduced learning capacity in children are among the most serious effects. (ref. 1-3) 4.2 Recommendations on intake limitations A Provisional Tolerable Weekly Intake (PTWI) of 0.025 mg/kg (25 µg/kg) bodyweight have been decided for lead. This is equal to 1.75 mg/week (1750 µg/week) for a person weighing 70 kg. The average intake of lead by adults in the Member States is, according to current information, 42 µg/day (Table 4.2), which is equal to 296 µg/week (range 7 - 973 µg/week. Table 4.3). This corresponds to 14% (0.5 – 56%) of the PTWI (Table 4.4), assuming an average Table 4.1. Lead. Consumption of food in g/day by the mean adult population in the Member States. The figures are based on products for which occurrence data for Pb are available. Food group BE DK FI FR DE HE IR IT NO PT SE UK MeanMilk and milk products 238 357 420 158 112 130 463 344 281 278 Condensed, powder milk, cheese, yoghurt
28 33 83 41 43 31 28 60 43
Fats and oils 48 20 21 20 9.9 27 24 Fruits and vegetables 336 421 149 353 352 0.5 448 255 332 171 379 290 Confectionary 30 5 5.9 10 1.0 10 Cereals and bakery wares 217 2.8 253 188 23 216 175 290 142 209 172 Meat 136 71 148 175 37 87 110 49 101 88 100 Offal 0.2 3.0 3.2 2.0 1.6 0.9 6.5 2.0 2.2 1.0 2.2 Fish and fish products 23 53 30 16 36 20 32 61 40 22 14 32 Bivalves, crustaceans and cephalopods
1.6 4.7 0.78 5.2 0.65 11 10 4.8
Eggs 21 19 20 33 14 17 15 14 19 Sweeteners 0.4 1.1 16 13 6.0 31 0.6 63 16 Salts and spices 9.3 2.3 5.8 Beverages 1020 2003* 476 1091 376 84 693 176 39 937 690 Ready to eat 2.0 2.0 2.0 Sum/Member State 1623 3289 1196 2194 1227 215 109 1104 1775 892 863 2075 1380 *Including drinking water.
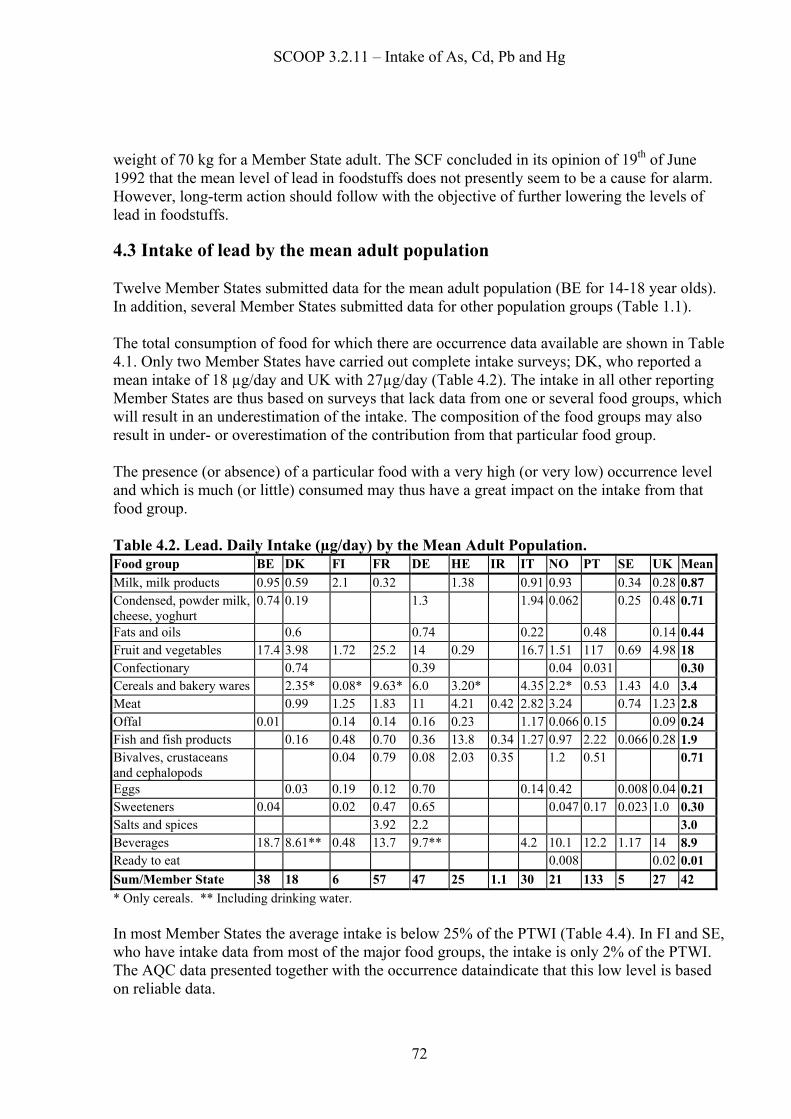
SCOOP 3.2.11 – Intake of As, Cd, Pb and Hg
72
weight of 70 kg for a Member State adult. The SCF concluded in its opinion of 19th of June 1992 that the mean level of lead in foodstuffs does not presently seem to be a cause for alarm. However, long-term action should follow with the objective of further lowering the levels of lead in foodstuffs. 4.3 Intake of lead by the mean adult population Twelve Member States submitted data for the mean adult population (BE for 14-18 year olds). In addition, several Member States submitted data for other population groups (Table 1.1). The total consumption of food for which there are occurrence data available are shown in Table 4.1. Only two Member States have carried out complete intake surveys; DK, who reported a mean intake of 18 µg/day and UK with 27µg/day (Table 4.2). The intake in all other reporting Member States are thus based on surveys that lack data from one or several food groups, which will result in an underestimation of the intake. The composition of the food groups may also result in under- or overestimation of the contribution from that particular food group. The presence (or absence) of a particular food with a very high (or very low) occurrence level and which is much (or little) consumed may thus have a great impact on the intake from that food group. Table 4.2. Lead. Daily Intake (µg/day) by the Mean Adult Population. Food group BE DK FI FR DE HE IR IT NO PT SE UK MeanMilk, milk products 0.95 0.59 2.1 0.32 1.38 0.91 0.93 0.34 0.28 0.87 Condensed, powder milk, cheese, yoghurt
0.74 0.19 1.3 1.94 0.062 0.25 0.48 0.71
Fats and oils 0.6 0.74 0.22 0.48 0.14 0.44 Fruit and vegetables 17.4 3.98 1.72 25.2 14 0.29 16.7 1.51 117 0.69 4.98 18 Confectionary 0.74 0.39 0.04 0.031 0.30 Cereals and bakery wares 2.35* 0.08* 9.63* 6.0 3.20* 4.35 2.2* 0.53 1.43 4.0 3.4 Meat 0.99 1.25 1.83 11 4.21 0.42 2.82 3.24 0.74 1.23 2.8 Offal 0.01 0.14 0.14 0.16 0.23 1.17 0.066 0.15 0.09 0.24 Fish and fish products 0.16 0.48 0.70 0.36 13.8 0.34 1.27 0.97 2.22 0.066 0.28 1.9 Bivalves, crustaceans and cephalopods
0.04 0.79 0.08 2.03 0.35 1.2 0.51 0.71
Eggs 0.03 0.19 0.12 0.70 0.14 0.42 0.008 0.04 0.21 Sweeteners 0.04 0.02 0.47 0.65 0.047 0.17 0.023 1.0 0.30 Salts and spices 3.92 2.2 3.0 Beverages 18.7 8.61** 0.48 13.7 9.7** 4.2 10.1 12.2 1.17 14 8.9 Ready to eat 0.008 0.02 0.01 Sum/Member State 38 18 6 57 47 25 1.1 30 21 133 5 27 42 * Only cereals. ** Including drinking water. In most Member States the average intake is below 25% of the PTWI (Table 4.4). In FI and SE, who have intake data from most of the major food groups, the intake is only 2% of the PTWI. The AQC data presented together with the occurrence dataindicate that this low level is based on reliable data.

SCOOP 3.2.11 – Intake of As, Cd, Pb and Hg
73
Table 4.3. Lead. Weekly Intake (µg/week) by the Mean Adult Population. Food group BE DK FI FR DE HE IR IT NO PT SE UK Mean Milk, milk products 6.65 4.13 14.7 2.24 9.66 6.37 6.51 2.38 1.96 6.1 Condensed, powder milk, cheese, yoghurt
5.18 1.33 9.0 13.6 0.43 1.75 3.36 4.9
Fats and oils 4.2 5.2 1.54 3.36 0.98 3.1 Fruit and vegetables 122 27.9 12 176 96 2.03 117 10.6 819 4.83 34.9 129 Confectionary 5.18 2.8 0.28 0.217 2.1 Cereals and bakery wares 16.5* 0.56* 67.4* 42 22.3* 30.4 15.4* 3.76 10.0 28 24 Meat 6.93 8.75 12.8 78 29.5 2.94 19.7 22.7 5.18 8.61 20 Offal 0.07 0.98 0.98 1.1 1.61 8.19 0.46 1.05 0.63 1.7 Fish and fish products 1.12 3.40 4.88 2.5 96.3 2.38 8.89 6.79 15.5 0.462 1.96 13 Bivalve, crustaceans and cephalopods
0.28 5.56 0.54 14.2 2.45 8.4 3.57 5.0
Eggs 0.21 1.33 0.85 4.9 0.98 2.94 0.056 0.28 1.4 Sweeteners 0.28 0.14 3.31 4.6 0.33 1.19 0.161 7.0 2.1 Salts and spices 27.5 15 21 Beverages 131 60.3** 3.36 95.7 68** 29.4 70.7 85.2 8.19 98 62 Ready to eat 0.06 0.14 0.1 Sum/Member State 265 128 46 397 330 176 7.8 208 146 933 33 186 296 * Only cereals. **Including drinking water In PT the intake is in the order of 50% of the PTWI. Possible reasons for this high intake will be discussed in section 4.6. Table 4.4. Lead. Weekly Intake in % of the PTWI by the Mean Adult Population. (PTWI for Pb = 0.025 mg/kg bodyweight = 25 µg/kg bodyweight) Food group BE DK FI FR DE HE IR IT NO PT SE UK Mean
Mean body weight 60 72 77.1 66.4 70.5 70 75 70 73 70 73.7 70.1 70.6 Milk, milk products 0.44 0.23 0.76 0.14 0.55 0.36 0.36 0.13 0.11 0.34 Condensed, powder milk, cheese, yoghurt
0.35 0.07 0.51 0.78 0.02 0.09 0.19 0.29
Fats and oils 0.23 0.29 0.09 0.19 0.06 0.17 Fruits and vegetables 8.12 1.5 0.62 10.6 5.42 0.12 6.68 0.58 46.8 0.26 1.99 7.52 Confectionary 0.29 0.16 0.02 0.01 0.12 Cereals and bakery wares 0.91 0.03 4.06 2.39 1.28 1.74 0.84 0.21 0.54 1.60 1.36 Meat 0.39 0.45 0.77 4.43 1.68 0.16 1.13 1.24 0.28 0.49 1.10 Offal 0.00 0.05 0.06 0.06 0.09 0.47 0.03 0.06 0.04 0.10 Fish and fish products 0.062 0.17 0.29 0.14 5.50 0.13 0.51 0.37 0.89 0.03 0.11 0.75 Bivalve, crustaceans and cephalopods
0.01 0.34 0.03 0.81 0.13 0.46 0.20 0.28
Eggs 0.012 0.07 0.05 0.28 0.06 0.16 0.003 0.02 0.08 Sweeteners 0.02 0.01 0.20 0.26 0.02 0.07 0.01 0.40 0.12 Salts and spices 1.65 0.86 1.26 Beverages 8.74 3.3 0.17 5.76 3.87 1.68 3.87 4.87 0.44 5.59 3.67 Ready to eat 0.003 0.01 0.01 Sum %/Member State 18 7 2.4 24 19 10 0.4 12 8.0 53.3 1.8 11 14
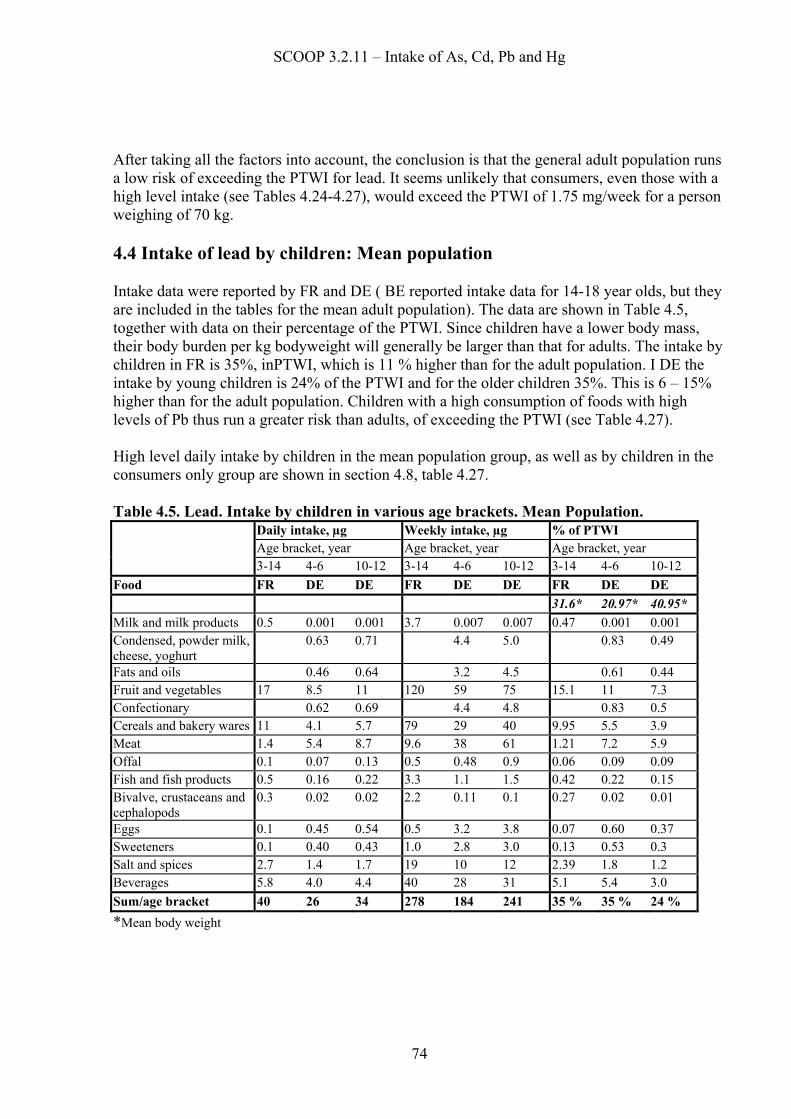
SCOOP 3.2.11 – Intake of As, Cd, Pb and Hg
74
After taking all the factors into account, the conclusion is that the general adult population runs a low risk of exceeding the PTWI for lead. It seems unlikely that consumers, even those with a high level intake (see Tables 4.24-4.27), would exceed the PTWI of 1.75 mg/week for a person weighing of 70 kg. 4.4 Intake of lead by children: Mean population Intake data were reported by FR and DE ( BE reported intake data for 14-18 year olds, but they are included in the tables for the mean adult population). The data are shown in Table 4.5, together with data on their percentage of the PTWI. Since children have a lower body mass, their body burden per kg bodyweight will generally be larger than that for adults. The intake by children in FR is 35%, inPTWI, which is 11 % higher than for the adult population. I DE the intake by young children is 24% of the PTWI and for the older children 35%. This is 6 – 15% higher than for the adult population. Children with a high consumption of foods with high levels of Pb thus run a greater risk than adults, of exceeding the PTWI (see Table 4.27). High level daily intake by children in the mean population group, as well as by children in the consumers only group are shown in section 4.8, table 4.27. Table 4.5. Lead. Intake by children in various age brackets. Mean Population.
Daily intake, µg Weekly intake, µg % of PTWI Age bracket, year Age bracket, year Age bracket, year
3-14 4-6 10-12 3-14 4-6 10-12 3-14 4-6 10-12 Food FR DE DE FR DE DE FR DE DE 31.6* 20.97* 40.95* Milk and milk products 0.5 0.001 0.001 3.7 0.007 0.007 0.47 0.001 0.001 Condensed, powder milk, cheese, yoghurt
0.63 0.71 4.4 5.0 0.83 0.49
Fats and oils 0.46 0.64 3.2 4.5 0.61 0.44 Fruit and vegetables 17 8.5 11 120 59 75 15.1 11 7.3 Confectionary 0.62 0.69 4.4 4.8 0.83 0.5 Cereals and bakery wares 11 4.1 5.7 79 29 40 9.95 5.5 3.9 Meat 1.4 5.4 8.7 9.6 38 61 1.21 7.2 5.9 Offal 0.1 0.07 0.13 0.5 0.48 0.9 0.06 0.09 0.09 Fish and fish products 0.5 0.16 0.22 3.3 1.1 1.5 0.42 0.22 0.15 Bivalve, crustaceans and cephalopods
0.3 0.02 0.02 2.2 0.11 0.1 0.27 0.02 0.01
Eggs 0.1 0.45 0.54 0.5 3.2 3.8 0.07 0.60 0.37 Sweeteners 0.1 0.40 0.43 1.0 2.8 3.0 0.13 0.53 0.3 Salt and spices 2.7 1.4 1.7 19 10 12 2.39 1.8 1.2 Beverages 5.8 4.0 4.4 40 28 31 5.1 5.4 3.0 Sum/age bracket 40 26 34 278 184 241 35 % 35 % 24 % *Mean body weight
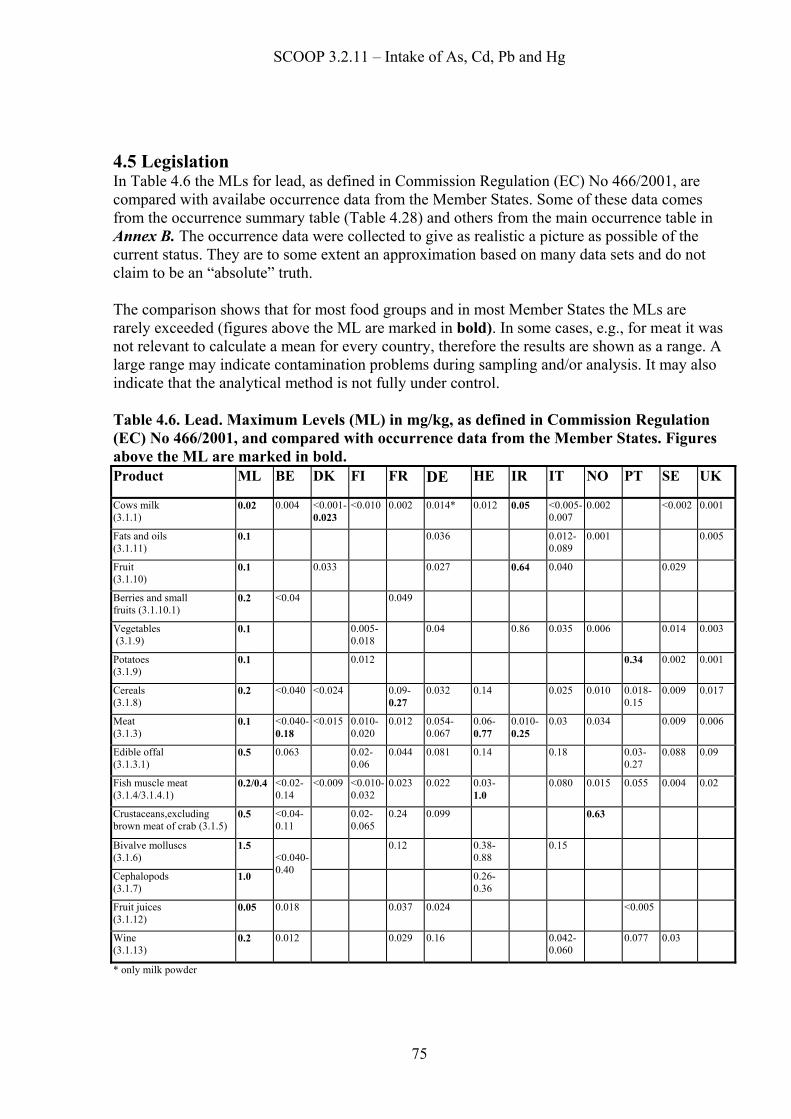
SCOOP 3.2.11 – Intake of As, Cd, Pb and Hg
75
4.5 Legislation In Table 4.6 the MLs for lead, as defined in Commission Regulation (EC) No 466/2001, are compared with availabe occurrence data from the Member States. Some of these data comes from the occurrence summary table (Table 4.28) and others from the main occurrence table in Annex B. The occurrence data were collected to give as realistic a picture as possible of the current status. They are to some extent an approximation based on many data sets and do not claim to be an “absolute” truth. The comparison shows that for most food groups and in most Member States the MLs are rarely exceeded (figures above the ML are marked in bold). In some cases, e.g., for meat it was not relevant to calculate a mean for every country, therefore the results are shown as a range. A large range may indicate contamination problems during sampling and/or analysis. It may also indicate that the analytical method is not fully under control. Table 4.6. Lead. Maximum Levels (ML) in mg/kg, as defined in Commission Regulation (EC) No 466/2001, and compared with occurrence data from the Member States. Figures above the ML are marked in bold. Product ML BE DK FI FR DE HE IR IT NO PT SE UK
Cows milk (3.1.1)
0.02 0.004 <0.001-0.023
<0.010 0.002 0.014* 0.012 0.05 <0.005- 0.007
0.002 <0.002 0.001
Fats and oils (3.1.11)
0.1 0.036 0.012-0.089
0.001 0.005
Fruit (3.1.10)
0.1 0.033 0.027 0.64 0.040 0.029
Berries and small fruits (3.1.10.1)
0.2 <0.04 0.049
Vegetables (3.1.9)
0.1 0.005-0.018
0.04 0.86 0.035 0.006 0.014 0.003
Potatoes (3.1.9)
0.1 0.012 0.34 0.002 0.001
Cereals (3.1.8)
0.2 <0.040 <0.024 0.09-0.27
0.032 0.14 0.025 0.010 0.018-0.15
0.009 0.017
Meat (3.1.3)
0.1 <0.040- 0.18
<0.015 0.010-0.020
0.012 0.054-0.067
0.06-0.77
0.010-0.25
0.03 0.034 0.009 0.006
Edible offal (3.1.3.1)
0.5 0.063 0.02-0.06
0.044 0.081 0.14 0.18 0.03-0.27
0.088 0.09
Fish muscle meat (3.1.4/3.1.4.1)
0.2/0.4 <0.02-0.14
<0.009 <0.010-0.032
0.023 0.022 0.03-1.0
0.080 0.015 0.055 0.004 0.02
Crustaceans,excluding brown meat of crab (3.1.5)
0.5 <0.04-0.11
0.02-0.065
0.24 0.099 0.63
Bivalve molluscs (3.1.6)
1.5 0.12 0.38-0.88
0.15
Cephalopods (3.1.7)
1.0
<0.040- 0.40 0.26-
0.36
Fruit juices (3.1.12)
0.05 0.018 0.037 0.024 <0.005
Wine (3.1.13)
0.2 0.012 0.029 0.16 0.042-0.060
0.077 0.03
* only milk powder

SCOOP 3.2.11 – Intake of As, Cd, Pb and Hg
76
4.6 Comments on the intake of lead by the mean adult population by Member State This summary only reports the mean intake of the adult population in the individual Member State. Particular findings are highlighted. Consumers, high-risk groups or particular age-segments are not included. The comments relate mainly to the contents of Tables 4.1-4.4. BELGIUM Estimated intake of lead: Data reported for 6 food categories. Several important groups are missing. The mean daily intake of 38 µg is relatively high, 18% of the PTWI, compared to other Member States. Although several major food groups are missing the sampled food groups provide 1623 g of food/day, of which non-alcoholic beverages is 1014 g. The major contribution to the diet comes from fruit and vegetables (17 µg) and non-alcoholic beverage (19 µg). Analytical Quality Assurance Certified reference materials have been used extensively, with good correlation between found and certified results. Participation in several proficiency tests has resulted in acceptable Z-scores. DENMARK Estimated intake of lead: The Danish survey includes all major food groups and provides a consumption of 3289 g of food/day, Beverages (including drinking water) make up 2003 g of the total consumption. The mean lead intake which is fairly low, 18 µg/day (7% of the PTWI), is on the same order of magnitude as in the other Nordic countries. The major source of lead in the diet appears to be beverages, that contribute nearly 50% to the daily intake of lead. Denmark did not follow the agreed model for calculating results below the LOD. Instead they used the LOD as the assigned value, which results in a slightly different estimation of the intake. Analytical Quality Assurance A number of different certified reference materials, relevant for the survey, was analysed in parallel to the samples. The results showed good agreement with the certified levels. No results from proficiency tests were reported. FINLAND Estimated intake of lead: Data reported for 10 food groups, including all major groups. The mean intake is very low, 6 µg/day, which is only 2.4 % of the PTWI. The intake represents a daily food consumption of 1196 gram. Milk contributes 2.1 µg and 1.7 µg comes from fruit and vegetables. Analytical Quality Assurance Use of CRMs and participation in PT programmes is reported, but no analytical data were provided. FRANCE Estimated intake of lead: Data reported for 11 food groups, including all major groups, which corresponds to a food consumption of 1895 g/day, out of a total of 2193 g/day. The mean intake of 56.8 µg/day constitute 24 % of the PTWI. This is relatively high, compared with other
SCOOP 3.2.11 – Intake of As, Cd, Pb and Hg
77
Member States. The main contributor is fruit and vegetables, with a mean content of 66 µg/kg. It appears, however, that some dried fruits and certain mushrooms increase the mean level considerably. Unexpectedly high levels are also reported for cereals and cereal products which contribute 17% to the daily intake. The dietary intake calculation is, however, based on only 6 occurrence data on 4 items.This therefore represents an approximation for this group. These two groups contribute 61% of the daily intake of lead, followed by beverages (including waters and wine) with 24%. Analytical Quality Assurance Certified reference materials has been used extensively, as well as participation in proficiency tests. Most of these have, however, involved animal tissues and milk powder. GERMANY Estimated intake of lead: Data reported for 13 food groups, including all major groups. The mean daily intake is relatively high, 47 µg/day, which is 19% of the PTWI. This primarily due to a very high level in wine, 156 µg/kg. It is assumed that these wine samples were not ordinary wine off the shelf, but sampled due to some suspicion of contamination. The other major source is meat from game, with a mean level of 1370 µg/kg. The only probable source for such high levels is gunshot residues. Omitting these food groups the daily intake is reduced to 27 µg/day, or 11% of the PTWI. Analytical Quality Assurance Certified reference materials has been used extensively, as well as participation in proficiency tests. The results are generally acceptable. GREECE Estimated intake of lead: Data reported for 7 food groups. Several major food groups are missing. Considering that the intake is based on a food consumption of only 215 g/day, the mean daily intake of 25 µg, corresponding to 10% of the PTWI, is very high. All food groups, with the exception of milk, display very high lead levels. Fruit and vegetables have a mean level of 0.61 mg/kg, which is a factor of 10 higher than in other Member States. Occurrence data for this group consists only of dried fruit and canned vegetables. The dried fruit will have a high lead level due to the higher dry matter content. Meat (fermented) is reported to contain 0.78 mg/kg, which is extraordinary. Fish alone provide 14 µg to the daily diet, due to an occurrence level of 0.2-0.5 mg/kg. This is also intriguing, since it must be assumed that most fish is of mediterranean origin. Consumers of fish may thus risk to exceed the PTWI for lead. If more food groups were included it can be assumed that the mean intake of lead would be even higher. Analytical Quality Assurance The different laboratories have participated in several PT-programmes and have used a number of different certified reference materials. It can, however, not be concluded that these results verify the above mentioned abnormal results.

SCOOP 3.2.11 – Intake of As, Cd, Pb and Hg
78
IRELAND Estimated intake of lead: Data reported for 4 food groups. The mean daily intake is 1 µg (0.4% of the PTWI), which is very low. It is, however, only based on a daily consumption of 109 g of meat and seafood. Analytical Quality Assurance The two laboratories have analysed several certified reference materials. Both have participated in several PT-programmes, with acceptable result. ITALY Estimated intake of lead: Data reported for 10 food groups, including all major groups, making a total consumption of 1303 g/day The mean daily intake is 30 µg, which corresponds to 12% of the PTWI. The major source is fruit, which contribute 17 µg/day. Cereals and bakery ware is the 2nd largest source with 4 µg/day. Analytical Quality Assurance Use of CRMs and participation in PT programmes is indicated. However, no analytical data are reported. the NETHERLANDS Estimated intake of lead: The data available was considered too limited for an attempt to calculate a relevant mean daily intake and was withdrawn by the participant. NORWAY Estimated intake of lead: Data reported for 13 food groups, including all major groups. The mean daily intake of lead is 21 µg (8% of the PTWI). Beverages (as coffee ) contributes 10 µg/day and meat products 3 µg/day. Beef is reported to contain an average of 0.034 mg/kg, which must be considered to be rather high for uncontaminated meat. Analytical Quality Assurance Use of CRMs and participation in PT programmes is indicated. However, no analytical data are reported. PORTUGAL Estimated intake of lead: Data reported for 8 food groups, including most major food groups. The reported daily intake is 133 µg (54% f the PTWI). This is very high, considering that a food consumption of 892 g/day is indicated. Potatoes are reported to contain, on average, 0.363 mg/kg, which provides 117 µg to the total intake. Lettuce is reported to contain 0.426 mg/kg. The LOD is reportedly very high, < 1 mg/ kg, for products in this food group. Since half the LOD is assigned the product as its occurrence level the intake may be erroneously high. If the fruit and vegetables group is omitted, the intake decreases to 22 µg/day (9% of the PTWI). Analytical Quality Assurance Use of CRMs and participation in PT programmes indicated. CRM-results for wine shown with results. PT-result for tomato paste shown, also with acceptable result. SWEDEN Estimated intake of lead: Data reported for 9 food groups, including all major groups. The reported daily intake is 5 µg. This corresponds to 2% of the PTWI. The daily intake of food is
SCOOP 3.2.11 – Intake of As, Cd, Pb and Hg
79
reportedly 863 g, which is comparatively low. Beverages (wine) and cereals are the main contributors with 1.4 and 1.2 µg/day, respectively. Although the wine consumption has increased in Sweden, it is not so large as to make its lead content a serious problem. Analytical Quality Assurance Extensive use of CRMs. Regular participation in PT-programmes. The presented results show acceptable agreement. UNITED KINGDOM Estimated intake of lead: The UK Total Diet Study shows a mean population intake of 27 µg/day, which corresponds to 11% of the PTWI. The average food consumption is 2075 g/day. Beverages are the main contributor to the mean dietary exposure with 14 µg/day. For mean level consumers the intake corresponds to 9.6% (24 µg/day) of the PTWI, and for high level consumers the intake corresponds to 17% (43 µg/day) of the PTWI. Analytical Quality Assurance Several CRMs were analysed during the survey, as well as frequent participation in PT-rounds. The presented results show acceptable agreement.
4.7 Comments on lead in the specific food groups All specific results are shown in tables 4.7 – 4.23. The comments are intended to highlight particular/unusual findings and to describe the food groups impact in terms of % PTWI. Table 4.7: Lead in dairy products, excluding products of category 2: Milk (Cat. 1.1-1.5) Data reported by 10 Member States. All mean levels (occurrence) are below the maximum residue level of 0.020 mg/kg for milk decided in EU Decision 466/2001. In FI this food group provides 34% of the total intake of lead. The mean contribution from milk is less than 1% of the PTWI. Table 4.8. Lead in dairy products, excluding products of category 2: Cheese (Cat. 1.6) Data reported by 6 Member States. The mean intake ranges between 0.06 – 2µg/day. The mean contribution from cheese is less than 1% of the PTWI. Table 4.9. Lead in fats and oils (Cat. 2) Data reported by 5 Member States. The levels in food are consistently low, <0.05 µg/g. Its contribution to the daily intake of lead is thus very low. The mean contribution is less than 0.5% of the PTWI. Table 4.10. Lead in fruit (Cat. 4.1) Data reported by 4 Member States. The occurrence data from DK, 0.008 µg/g is by far lower than what is reported by other Member States. The mean contribution is up to 3% of the PTWI. Table 4.11. Lead in vegetables including mushrooms & fungi, roots, tubers, pulses, legumes, nuts and seeds (Cat. 4.2) Data reported by 11 Member States. The occurrence data show a considerable variation and range between 0.004 and 0.6 µg/g. The data from FR and HE also show a large variation

SCOOP 3.2.11 – Intake of As, Cd, Pb and Hg
80
withing the country. When such variations are not caused by agricultural practices, they are indicating that the quality control activities in the reporting laboratory may not be sufficient. Other factors may also play a role. The mean contribution is up to 10% of the PTWI (FR), with the exception of PT with 47% of the PTWI. Table 4.12. Lead in confectionary (Cat. 5) Data reported by 4 Member States.The occurrence levels in this group are low, as is the consumption. It thus has very little impact on the total intake of lead. The mean contribution is less than 0.5 % of the PTWI. Table 4.13. Lead in cereals and cereal products, incl. flours & starches from roots & tubers, pulses & legumes, excluding bakery (Cat. 6) Data reported by 10 Member States. As the consumption, on average, is large, its impact on the total intake is considerable, although the mean level in food generally is low, with the exception of Greece and France(see annexes pp. 80). The mean contribution is up to 10% of the PTWI (FR). Table 4.14. Lead in bakery wares (Cat 7) Data reported by 3 Member States. The food group provides 4 µg to the daily intake in IT. The contribution is less than 1.5% of the PTWI. Table 4.15. Lead in meat and meat products, including poultry and game (Cat. 8). Data reported by 10 Member States. The contribution to the total intake of lead is generally very small. In HE intake from meat is large, despite the small consumption of only 37 g/day. The occurrence data show an extremely large variation. The highest occurrence results are probably due to lead from gunshot residues (DE). The mean contribution is generally less than 2 % of the PTWI, in DE 4.5% of the PTWI. Table 4.16. Lead in offal (8.4) Data reported by 10 Member States. The consumption of offal is low in all Member States and its impact on the total intake is very small. It is noteworthy that the occurrence results from GE and HE are on the same level as in meat. The mean contribution is less than 0.5 % of the PTWI Table 4.17. Lead in fish and fish products, including molluscs, crustaceans and echinoderms (Cat. 9) Data reported by 11 Member States. The occurrence level in fish meat is usually well below 0.1 µg/g. The exception is HE who has reported extremely high levels, < 0.55 mg/kg. These results remain to be verified. The mean contribution is generally less than 1% of the PTWI, in HE 6.3% of the PTWI. Table 4.18. Lead in eggs and egg products (Cat.10) Data reported by 8 Member States.The concentration in eggs is generally very low, with the exception of HE, who has reported a mean concentration of 0.21 mg/kg. The mean contribution is less than 0.5 % of the PTWI

SCOOP 3.2.11 – Intake of As, Cd, Pb and Hg
81
Table 4.19. Lead in sweeteners, including honey (Cat 11) Data reported by 8 Member States. The contribution to the intake is 1µg/day, or lower. The consumption varies from 0.4 to 63 g/day. The mean contribution is less than 0.5 % of the PTWI Table 4.20. Lead in salt, spices, soups, sauces, salads, protein products etc (Cat. 12). Data reported by 2 Member States. The contribution to the daily intake is 2-4 µg. The mean contribution is 0.9-1.6 % of the PTWI Table 4.21. Lead in non-alcoholic ("soft") beverages (Cat. 14.1) Data reported by 8 Member States. The consumption in certain countries is very large, up to 2 kg/day. This food group therefore has a great impact on the daily intake, although the occurrence level is very low, <0.02 mg/kg. The contribution is up to 7.5% of the PTWI. Table 4.22. Lead in alcoholic beverages, including alcohol-free and low-alcohol (Cat. 14.2) Data reported by 6 Member States. Wine is a well known source of lead in our diet, and is the main source in this group. The mean contribution ranges from 0-4.6% of the PTWI Table 4.23. Lead in ready to eat (Cat 15) Data reported by 2 Member States. Gives no measurable addition to the intake and thus no measurable addition to the PTWI.
Table 4.7. Lead in dairy products, excluding products of category 2: Milk (Cat. 1.1-1.5) Member State
Consumption (g/day) Intake (µg/day) % of PTWI
Mean level High level
Mean level in food (µg/g) Mean l. High l.
% of total dietary intake Mean l. High l.
BELGIUM 238 675 0.0040 0.95 2.70 3 0.4 1.1 DENMARK 357 0.0017 0.59 3.2 0.2 FINLAND 420 0.005 2.10 34.4 0.8 FRANCE 158 411 0.002 0.32 0.83 0.56 0.1 0.3 GERMANY* 0.1 0.5 0.014 0.001 0.007 0.006 0.0 0.0 GREECE 112 393 0.012 1.38 4.83 5.49 0.6 1.9 ITALY 130 163 0.007 0.91 1.14 0.4 0.5 NORWAY 463 1141 0.002 0.926 2.28 4.5 0.4 0.9 SWEDEN 344 <0.002 0.344 7.3 0.1 U. K. 281 0.001 0.28 1 0.1
• Only milk powder
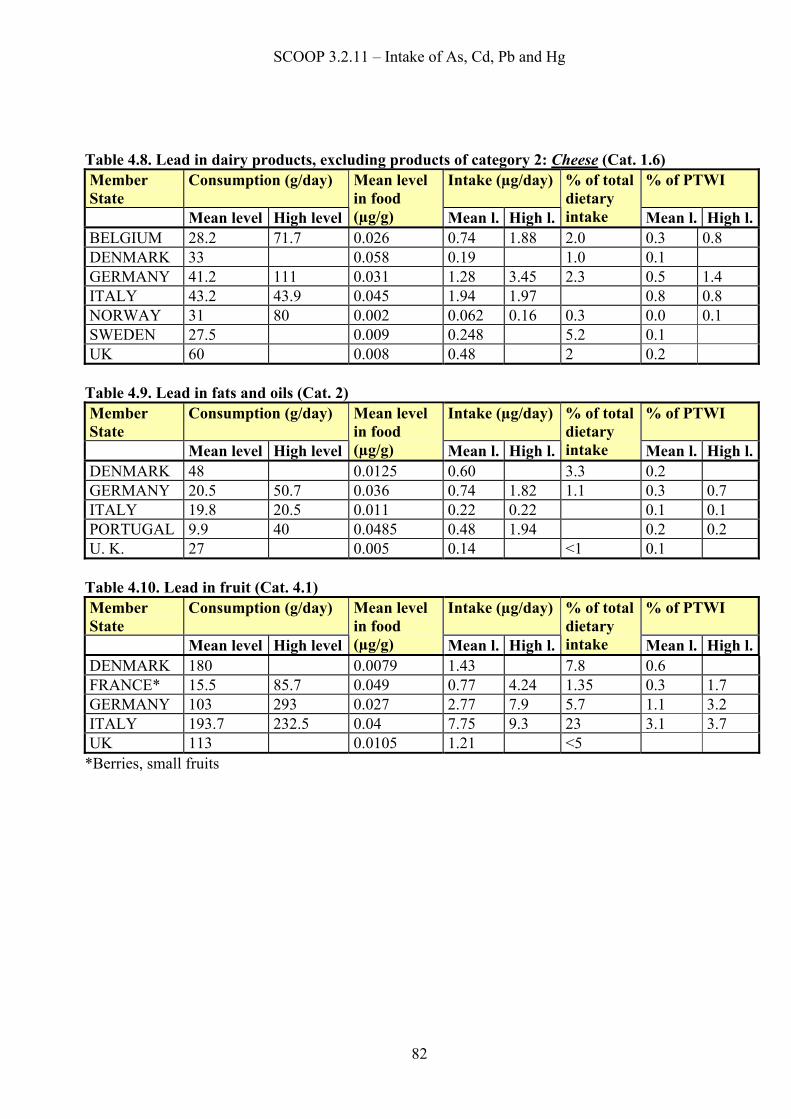
SCOOP 3.2.11 – Intake of As, Cd, Pb and Hg
82
Table 4.8. Lead in dairy products, excluding products of category 2: Cheese (Cat. 1.6) Member State
Consumption (g/day) Intake (µg/day) % of PTWI
Mean level High level
Mean level in food (µg/g) Mean l. High l.
% of total dietary intake Mean l. High l.
BELGIUM 28.2 71.7 0.026 0.74 1.88 2.0 0.3 0.8 DENMARK 33 0.058 0.19 1.0 0.1 GERMANY 41.2 111 0.031 1.28 3.45 2.3 0.5 1.4 ITALY 43.2 43.9 0.045 1.94 1.97 0.8 0.8 NORWAY 31 80 0.002 0.062 0.16 0.3 0.0 0.1 SWEDEN 27.5 0.009 0.248 5.2 0.1 UK 60 0.008 0.48 2 0.2
Table 4.9. Lead in fats and oils (Cat. 2) Member State
Consumption (g/day) Intake (µg/day) % of PTWI
Mean level High level
Mean level in food (µg/g) Mean l. High l.
% of total dietary intake Mean l. High l.
DENMARK 48 0.0125 0.60 3.3 0.2 GERMANY 20.5 50.7 0.036 0.74 1.82 1.1 0.3 0.7 ITALY 19.8 20.5 0.011 0.22 0.22 0.1 0.1 PORTUGAL 9.9 40 0.0485 0.48 1.94 0.2 0.2 U. K. 27 0.005 0.14 <1 0.1
Table 4.10. Lead in fruit (Cat. 4.1) Member State
Consumption (g/day) Intake (µg/day) % of PTWI
Mean level High level
Mean level in food (µg/g) Mean l. High l.
% of total dietary intake Mean l. High l.
DENMARK 180 0.0079 1.43 7.8 0.6 FRANCE* 15.5 85.7 0.049 0.77 4.24 1.35 0.3 1.7 GERMANY 103 293 0.027 2.77 7.9 5.7 1.1 3.2 ITALY 193.7 232.5 0.04 7.75 9.3 23 3.1 3.7 UK 113 0.0105 1.21 <5
*Berries, small fruits

SCOOP 3.2.11 – Intake of As, Cd, Pb and Hg
83
Table 4.11. Lead in vegetables including mushrooms & fungi, roots, tubers, pulses, legumes, nuts and seeds (Cat. 4.2) Member State
Consumption (g/day) Intake (µg/day) % of PTWI
Mean level High level
Mean level in food (µg/g) Mean l. High l.
% of total dietary intake
Mean l.
High l.
BELGIUM* 335.7 633 0.041 17.39 32.81 42 7.0 13.1 DENMARK 241 0.0106 2.55 14.0 1.0 FINLAND 149 0.005-0.012 1.72 28.2 0.7 FRANCE* 338 594 – 64 –
89 -25 0.066-0.226 24.4 39– 6.6 –
8.2- 5.7 43 10.03 2.4-
16.6 GERMANY 250 508 0.03-0.16 10.9 25.3 13.9 4.4 10.1 GREECE** 0.47 0 0.61 0.2867 0 1.14 0.1 ITALY 254.2 309.6 0.035 8.9 10.84 26.4 3.6 4.3 NORWAY* 255 701 0.052 1.51 3.91 7.3 0.6 1.6 PORTUGAL 332 880 0.004-0.426 117 324 84 46.8 130 SWEDEN* 171 0.009 0.691 14.6 0.3 U. K*. 266 0.023 3.77 15 1.5
*Fruit and vegetables. **Dried and preserved fruit. Table 4.12. Lead in confectionary (Cat. 5) Member State
Consumption (g/day) Intake (µg/day) % of PTWI
Mean level High level
Mean level in food (µg/g) Mean l. High l.
% of total dietary intake Mean l. High l.
DENMARK 30 0.0247 0.74 4.1 0.3 GERMANY 5.86 28.6 0.067 0.39 1.92 0.3 0.2 0.8 NORWAY 10 38 0.004 0.04 0.684 0.2 0.0 0.3 PORTUGAL 1 0.031 0.031 0.02 0.0
Table 4.13. Lead in cereals and cereal products, incl. flours & starches from roots & tubers, pulses & legumes, excluding bakery wares (Cat. 6) Member State
Consumption (g/day) Intake (µg/day) % of PTWI
Mean level High level
Mean level in food (µg/g) Mean l. High l.
% of total dietary intake Mean l. High l.
DENMARK 217 0.0108 2.35 12.9 0.9 FINLAND 2.8 0.029 0.08 1.3 0.0 FRANCE 62.9 74-116 0.092-0.269 9.63 10.6-20 17 4.1 8.4-4.5 GERMANY* 188 343 0.032 6.01 10.98 10.5 2.4 4.4 GREECE 23 91 0.139 3.197 12.649 12.75 1.3 5.1 ITALY 66 89.2 <0.050-0.014 0.61 1.0 1.8 0.2 0.4 NORWAY 175 359 0.018 2.20 4.77 10.6 0.9 1.9 PORTUGAL 285 30 0.02-0.04 0.54 0.6 4.5 0.2 SWEDEN 126 <0.005-0.017 1.17 30.2 0.5 U.K. 101 0.017 2.00 8 0.8
*Including bakery wares

SCOOP 3.2.11 – Intake of As, Cd, Pb and Hg
84
Table 4.14. Lead in bakery wares (Cat 7) Member State
Consumption (g/day) Intake (µg/day) % of PTWI
Mean level High level
Mean level in food (µg/g) Mean l. High l.
% of total dietary intake Mean l. High l.
ITALY 149.5 151.6 0.025 3.74 3.79 11.1 1.5 1.5 PORTUGAL 5.7 0.02 0.114 0,08 0.0 SWEDEN 15 0.017 0.26 5.4 0.1 UK 108 0.02 2.00 8 0.8
Table 4.15. Lead in meat and meat products, including poultry and game (Cat. 8). Member State
Consumption (g/day) Intake (µg/day) % of PTWI
Mean level High level
Mean level in food (µg/g) Mean l. High l.
% of total dietary intake Mean l. High l.
DENMARK 136 0.0073 0.99 5.4 0.4 FINLAND 71.3 0.01-0.03 1.25 20.5 0.5 FRANCE 148.4 287.9 0.012 1.83 3.56 3.2 0.8 1.5 GERMANY 175 389 0.054-1.32 11.2 23.7 9.7 4.5 9.5 GREECE 37 111 0.1137 4.2069 12.621 16.77 1.7 5.0 IRELAND 87 193 0.02 0.42 0.97 0.2 0.4 ITALY 109.5 48.9 0.038 2.82 5.23 8.4 1.1 2.1 NORWAY 49 115 0.034 3.24 7.38 15.6 1.3 6.2 SWEDEN 101 <0.00-0.035 0.745 15.8 0.3 U. K. 88 0.0073 1.23 <6 0.5
Table 4.16. Lead in offals (8.4) Member State
Consumption (g/day) Intake (µg/day) % of PTWI
Mean level High level
Mean level in food (µg/g) Mean l. High l.
% of total dietary intake Mean l. High l.
BELGIUM 0.17 0.0626 0.01 0 0.0 FINLAND 3 0.03-0.06 0.14 2.3 0.1 FRANCE 3.2 21.4 0.044 0.14 0.93 0.25 0.1 0.4 GERMANY 1.95 17.9 0.081 0.16 1.45 0.11 0.1 0.6 GREECE 1.6 8.9 0.1436 0.22976 1.2780 0.92 0.1 0.5 IRELAND 0.876 0 0.0049 0.0043 0 0.0 ITALY 6.5 28.5 0.18 1.17 5.13 3.5 0.5 2.1 NORWAY 2 11 0.163 0.066 1.07 0.32 0.0 0.4 PORTUGAL 2.185 0.068 0.149 0.11 0.1 U. K. 1 0.09 0.09 <1 0.0

SCOOP 3.2.11 – Intake of As, Cd, Pb and Hg
85
Table 4.17. Lead in fish and fish products, including molluscs, crustaceans and echinoderms (Cat. 9) Member State
Consumption (g/day) Intake (µg/day) % of PTWI
Mean level High level
Mean level in food (µg/g) Mean l. High l.
% of total dietary intake Mean l. High l.
DENMARK 23 0.0070 0.16 0.9 0.1 FINLAND 53 0.02-0.069 0.48 8.1 0.2 FRANCE 34.1 14-87 0.023-0.240 1.49 1.7-3.4 2,6 0.63 0.7-1.4 GERMANY 16.9 63.4 0.022-0.099 0.43 1.54 0.94 0.2 0.6 GREECE 36 178 0.214-0.55 13.8 68.3 62.3 5.5 27.3 IRELAND 20 74.9 0.34 1.88 0.1 0.48 ITALY 31.8 48.3 0.04 1.27 1.93 3.8 0.5 0.8 NORWAY 61 190 0.0175 0.97 2.89 4.69 0.4 1.2 PORTUGAL 40 0.051-0.055 2.22 1.97 0.9 SWEDEN 21.5 <0.006 0.066 1.4 0.0 U. K. 14 0.02 0.28 <1 0.1
Table 4.18. Lead in eggs and egg products (Cat.10) Member State
Consumption (g/day) Intake (µg/day) % of PTWI
Mean level High level
Mean level in food (µg/g) Mean l. High l.
% of total dietary intake Mean l. High l.
DENMARK 21 0.0014 0.03 0.2 0.0 FINLAND 19 0.01 0.19 3.1 0.1 FRANCE 20.0 62.9 0.006 0.12 0.38 0.21 0.0 0.2 GERMANY 33.4 81 0.21 0.70 1.70 1.9 0.3 0.7 ITALY 13.8 18.3 0.01 0.14 0.18 0.4 0.1 0.2 NORWAY 17 42 0.025 0.425 1.05 2.0 0.2 0.8 SWEDEN 15 <0.001 0.008 0.2 0.0 U. K. 14 0.003 0.04 <1 0.0
Table 4.19. Lead in sweeteners, including honey (Cat 11) Member State
Consumption (g/day) Intake (µg/day) % of PTWI
Mean level High level
Mean level in food (µg/g) Mean l. High l.
% of total dietary intake Mean l. High l.
BELGIUM 0.37 2.14 0.0958 0.04 0.21 0 0.0 0.1 FINLAND 1.1 0,02 0.02 0.3 0.0 FRANCE 15.9 49.7 0.030 0.47 1.48 0.83 0.2 0.6 GERMANY 13.0 54.1 0.039-0.104 0.65 2.89 0.72 0.3 1.2 NORWAY 6 30 0.047 0.047 0.282 0.2 0.0 0.1 PORTUGAL 31.3 0.0054 0.169 0.12 0.1 SWEDEN 0.6 0.038 0.023 0.5 0.0 U. K.* 63 0.014 1.0 4 0.4
*Including preserves

SCOOP 3.2.11 – Intake of As, Cd, Pb and Hg
86
Table 4.20. Lead in salt, spices, soups, sauces, salads, protein products etc (Cat. 12). Member State
Consumption (g/day) Intake (µg/day) % of PTWI
Mean level High level
Mean level in food (µg/g) Mean l. High l.
% of total dietary intake Mean l. High l.
FRANCE* 9.3 23.3 0.422 3.92 9.83 6.9 1.6 4.1 GERMANY 2.26 6.0 0.94-1.02 2.17 5.81 0.12 0.9 2.3
Excluding soups Table 4.21. Lead in non-alcoholic ("soft") beverages (Cat. 14.1) Member State
Consumption (g/day) Intake (µg/day) % of PTWI
Mean level High level
Mean level in food (µg/g) Mean l. High l.
% of total dietary intake Mean l. High l.
BELGIUM 1014 1718 0.018 18.7 31.6 49 8.7 12.6 DENMARK* 2003 0.0043 8.61 47.2 3.4 FINLAND 476 0.001 0.48 7.9 0.2 FRANCE* 931 963-1234 0.0013-0.022 9.03 1.54-
21.5 15.9 3.8 0.65-
9.05 GERMANY 329 1051 0.003-0.024 2.41 9.24 18.2 1.0 3.7 NORWAY 599 1840 0.011 10.0 25.7 48.2 4.0 10.2 PORTUGAL 26.96 64.25 0.017 0.670 1.61 0.26 0.3 0.6 U. K. 937 0.015 14 54 5.6
* Total beverages, including drinking water.
Table 4.22. Lead in alcoholic beverages, including alcohol-free and low-alcohol (Cat. 14.2) Member State
Consumption (g/day) Intake (µg/day) % of PTWI
Mean level High level
Mean level in food (µg/g) Mean l. High l.
% of total dietary intake Mean l. High l.
BELGIUM 5.73 26.39 0.0124 0.07 0.33 0 0.0 0.1 FRANCE 159.9 628.6 0.029 4.64 18.23 8.2 1.9 7.3 GERMANY* 47 222 0.156 7.32 34.7 2.6 2.9 13.9 ITALY* 84 148.6 0.05 4.2 7.43 12.5 1.7 3.0 NORWAY 94 399 0.0005 0.047 0.20 0.2 0.0 0.1 PORTUGAL 149.3 0.077 11.496 8.25 4.6 SWEDEN* 39 0.030 1.17 24.8 0.5
*Wine only
Table 4.23. Lead in ready to eat (Cat 15) Member State
Consumption (g/day) Intake (µg/day) % of PTWI
Mean level High level
Mean level in food (µg/g) Mean l. High l.
% of total dietary intake Mean l. High l.
NORWAY 2 9 0.004 0.008 0.036 0 0.0 0.0 U. K. 2 0.01 0.02 <1 0.0
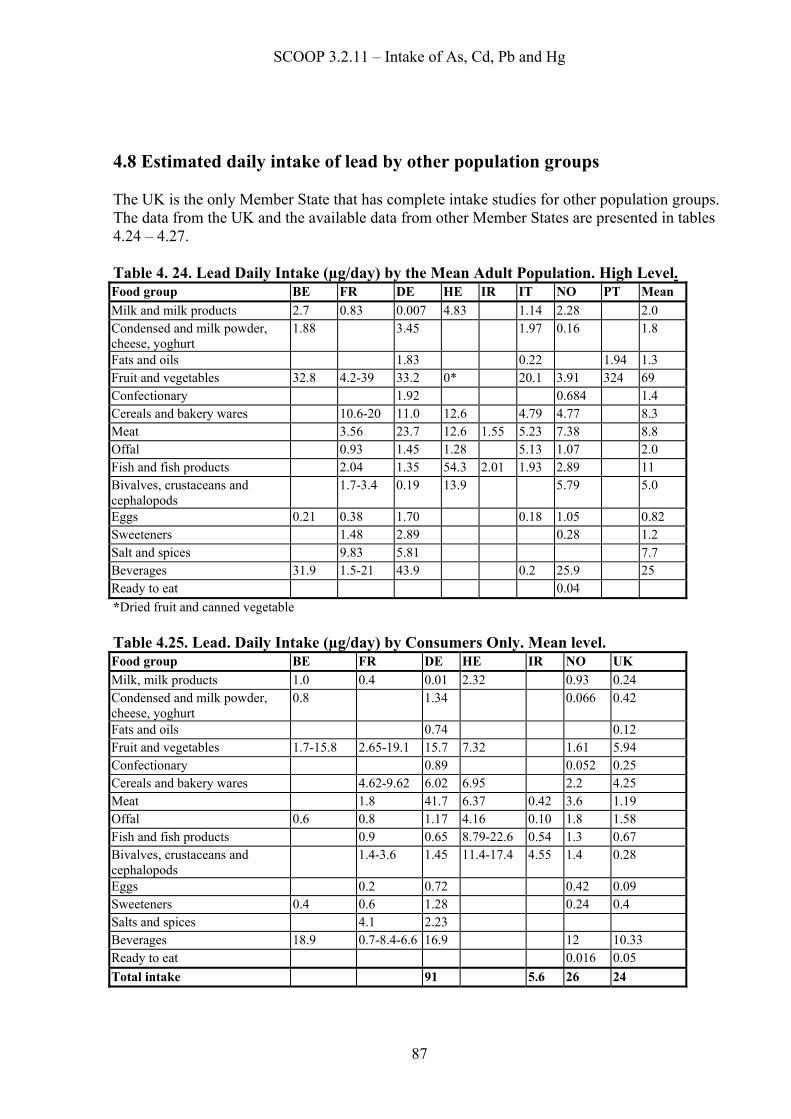
SCOOP 3.2.11 – Intake of As, Cd, Pb and Hg
87
4.8 Estimated daily intake of lead by other population groups The UK is the only Member State that has complete intake studies for other population groups. The data from the UK and the available data from other Member States are presented in tables 4.24 – 4.27. Table 4. 24. Lead Daily Intake (µg/day) by the Mean Adult Population. High Level. Food group BE FR DE HE IR IT NO PT Mean Milk and milk products 2.7 0.83 0.007 4.83 1.14 2.28 2.0 Condensed and milk powder, cheese, yoghurt
1.88 3.45 1.97 0.16 1.8
Fats and oils 1.83 0.22 1.94 1.3 Fruit and vegetables 32.8 4.2-39 33.2 0* 20.1 3.91 324 69 Confectionary 1.92 0.684 1.4 Cereals and bakery wares 10.6-20 11.0 12.6 4.79 4.77 8.3 Meat 3.56 23.7 12.6 1.55 5.23 7.38 8.8 Offal 0.93 1.45 1.28 5.13 1.07 2.0 Fish and fish products 2.04 1.35 54.3 2.01 1.93 2.89 11 Bivalves, crustaceans and cephalopods
1.7-3.4 0.19 13.9 5.79 5.0
Eggs 0.21 0.38 1.70 0.18 1.05 0.82 Sweeteners 1.48 2.89 0.28 1.2 Salt and spices 9.83 5.81 7.7 Beverages 31.9 1.5-21 43.9 0.2 25.9 25 Ready to eat 0.04 *Dried fruit and canned vegetable Table 4.25. Lead. Daily Intake (µg/day) by Consumers Only. Mean level. Food group BE FR DE HE IR NO UK Milk, milk products 1.0 0.4 0.01 2.32 0.93 0.24 Condensed and milk powder, cheese, yoghurt
0.8 1.34 0.066 0.42
Fats and oils 0.74 0.12 Fruit and vegetables 1.7-15.8 2.65-19.1 15.7 7.32 1.61 5.94 Confectionary 0.89 0.052 0.25 Cereals and bakery wares 4.62-9.62 6.02 6.95 2.2 4.25 Meat 1.8 41.7 6.37 0.42 3.6 1.19 Offal 0.6 0.8 1.17 4.16 0.10 1.8 1.58 Fish and fish products 0.9 0.65 8.79-22.6 0.54 1.3 0.67 Bivalves, crustaceans and cephalopods
1.4-3.6 1.45 11.4-17.4 4.55 1.4 0.28
Eggs 0.2 0.72 0.42 0.09 Sweeteners 0.4 0.6 1.28 0.24 0.4 Salts and spices 4.1 2.23 Beverages 18.9 0.7-8.4-6.6 16.9 12 10.33 Ready to eat 0.016 0.05 Total intake 91 5.6 26 24
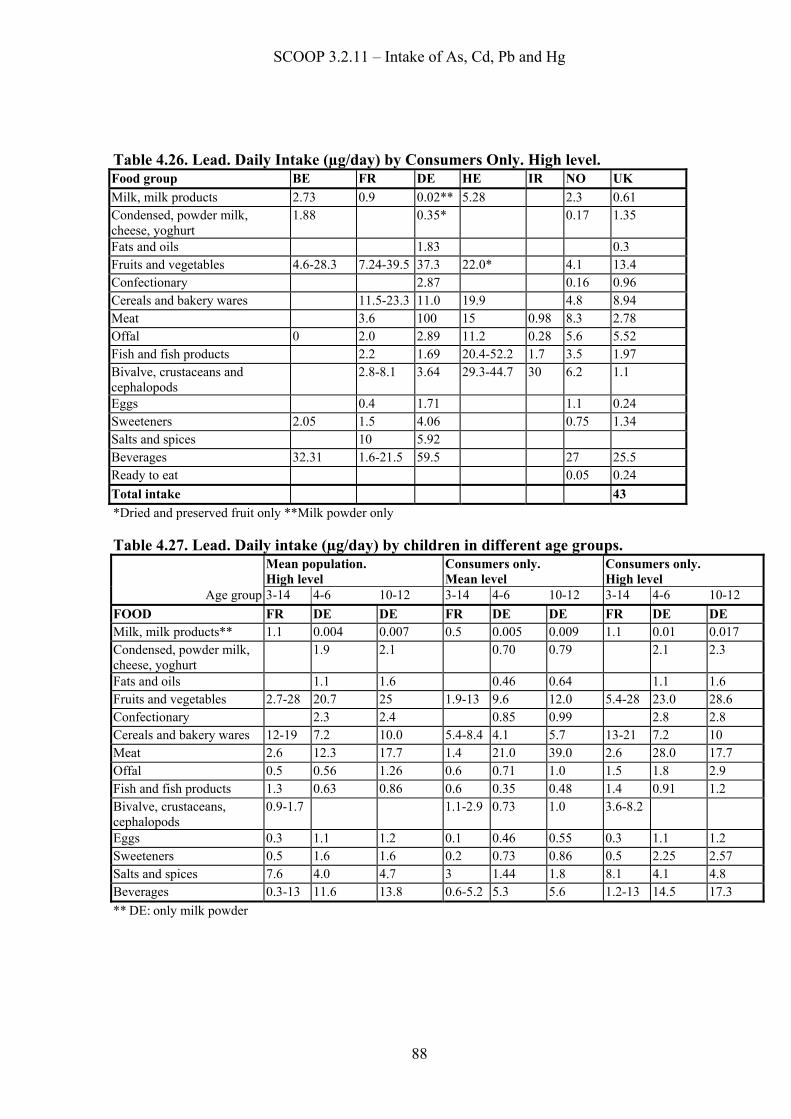
SCOOP 3.2.11 – Intake of As, Cd, Pb and Hg
88
Table 4.26. Lead. Daily Intake (µg/day) by Consumers Only. High level. Food group BE FR DE HE IR NO UK Milk, milk products 2.73 0.9 0.02** 5.28 2.3 0.61 Condensed, powder milk, cheese, yoghurt
1.88 0.35* 0.17 1.35
Fats and oils 1.83 0.3 Fruits and vegetables 4.6-28.3 7.24-39.5 37.3 22.0* 4.1 13.4 Confectionary 2.87 0.16 0.96 Cereals and bakery wares 11.5-23.3 11.0 19.9 4.8 8.94 Meat 3.6 100 15 0.98 8.3 2.78 Offal 0 2.0 2.89 11.2 0.28 5.6 5.52 Fish and fish products 2.2 1.69 20.4-52.2 1.7 3.5 1.97 Bivalve, crustaceans and cephalopods
2.8-8.1 3.64 29.3-44.7 30 6.2 1.1
Eggs 0.4 1.71 1.1 0.24 Sweeteners 2.05 1.5 4.06 0.75 1.34 Salts and spices 10 5.92 Beverages 32.31 1.6-21.5 59.5 27 25.5 Ready to eat 0.05 0.24 Total intake 43 *Dried and preserved fruit only **Milk powder only Table 4.27. Lead. Daily intake (µg/day) by children in different age groups.
Mean population. High level
Consumers only. Mean level
Consumers only. High level
Age group 3-14 4-6 10-12 3-14 4-6 10-12 3-14 4-6 10-12 FOOD FR DE DE FR DE DE FR DE DE Milk, milk products** 1.1 0.004 0.007 0.5 0.005 0.009 1.1 0.01 0.017 Condensed, powder milk, cheese, yoghurt
1.9 2.1 0.70 0.79 2.1 2.3
Fats and oils 1.1 1.6 0.46 0.64 1.1 1.6 Fruits and vegetables 2.7-28 20.7 25 1.9-13 9.6 12.0 5.4-28 23.0 28.6 Confectionary 2.3 2.4 0.85 0.99 2.8 2.8 Cereals and bakery wares 12-19 7.2 10.0 5.4-8.4 4.1 5.7 13-21 7.2 10 Meat 2.6 12.3 17.7 1.4 21.0 39.0 2.6 28.0 17.7 Offal 0.5 0.56 1.26 0.6 0.71 1.0 1.5 1.8 2.9 Fish and fish products 1.3 0.63 0.86 0.6 0.35 0.48 1.4 0.91 1.2 Bivalve, crustaceans, cephalopods
0.9-1.7 1.1-2.9 0.73 1.0 3.6-8.2
Eggs 0.3 1.1 1.2 0.1 0.46 0.55 0.3 1.1 1.2 Sweeteners 0.5 1.6 1.6 0.2 0.73 0.86 0.5 2.25 2.57 Salts and spices 7.6 4.0 4.7 3 1.44 1.8 8.1 4.1 4.8 Beverages 0.3-13 11.6 13.8 0.6-5.2 5.3 5.6 1.2-13 14.5 17.3 ** DE: only milk powder

SCOOP 3.2.11 – Intake of As, Cd, Pb and Hg
89
4.9 Occurrence summary table for lead This table contain summaries of occurrence data that has been used in the intake calculation. It provides information on the mean concentration level, median levels where available and min and max values. Table 4.28. Lead Occurrence summary data for individual food samples. Unit: mg/kg Food group code
Food No. of samples
Reference Year of sampling
Mean level of lead
Median level of lead
Min
Max
Belgium
1 Dairy product 1 143 0.0040 < 0.001 0.0248 2 Dairy product 2 74 0.0262 0.0025 0.0540 5 fruit, vegetables 3,1,19 46 0.052 < 0.040 0.326 6 vegetables 3,1,8 8 < 0.040 7 vegetables 3,1,9,1 18 0.051 < 0.040 0.172 8 Berries 14 < 0.040 9 fish 154 < 0.02 0.1370 10 bivalves,cephalopods 28 < 0.040 0.401 11 crustaceans 36 < 0.04 0.11 12 bread 4 < 0.040 13 meat 1128 < 0.040 0.176 14 liver 1089 0.0626 0.0497 < 0.02 0.5510 21 honey 35 0.096 < 0.040 0.533 23 particular foodstuffs 6 0.189 < 0.040 0.466 25 fruit juices 40 0.0184 < 0.020 0.0750 26 wine 15 0.0124 0.0111 < 0.025 0.0271
Denmark
Dairy products 21 DK-001 1990 n.d. n.d. <0.0007 0.023 Fruits 440 DK-003 1993-97 0.033 0.015 <0.005 0.719 Vegetables 796 DK-003 1993-97 0.033 0.011 <0.003 0.719 Cereals 601 DK-003 1993-97 <0.024 <0.024 <0.024 0.164 Meat 1409 DK-003 1993-97 <0.015 <0.015 <0.014 0.172 Fish 766 DK-003 1993-97 <0.009 <0.009 <0.009 0.326 Eggs 30 DK-003 1993-97 <0.005 <0.005 <0.005 0.006 Beverages 60 DK-003 1993-97 n.d. n.d. <0.003 0.006
Finland
1.1 milk 52 FI 003 1998 <0.010 4.2.1 potato 100 FI 101 2000 0.012 <0.005 0.027 4.2.1 carrot 33 FI 102 1993 0.011 0.005 0.041 4.2.1 lettuce 28 FI 102 1993 0.018 0.005 0.063 4.2.1 Chinese cabbage 30 FI 102 1993 0.005 <0.005 0.011 6.3 Muesli products 30 FI 103 1998 0.065 <0.005 0.33 8.1 Meat, reindeer 7 FI 007 2001 0.010 <0.01 0.02 8.1 Meat, bovine 30 FI 006 2001 0.010 <0.01 0.030 8.1 Meat, pig 33 FI 006 2001 0.020 0.010 0.090 8.1 Meat, sheep 3 FI005 2000 0.020 0.010 0.020 8.1 Meat, horse 2 FI 005 2000 0.020 0.010 0.020 8.4 Liver,bovine 31 FI 006 2001 0.050 0.020 0.12 8.4 Liver, pig 34 FI 006 2001 0.050 0.020 0.11 8.4 Liver, elk 11 FI 005 2000 0.060 <0.010 0.39
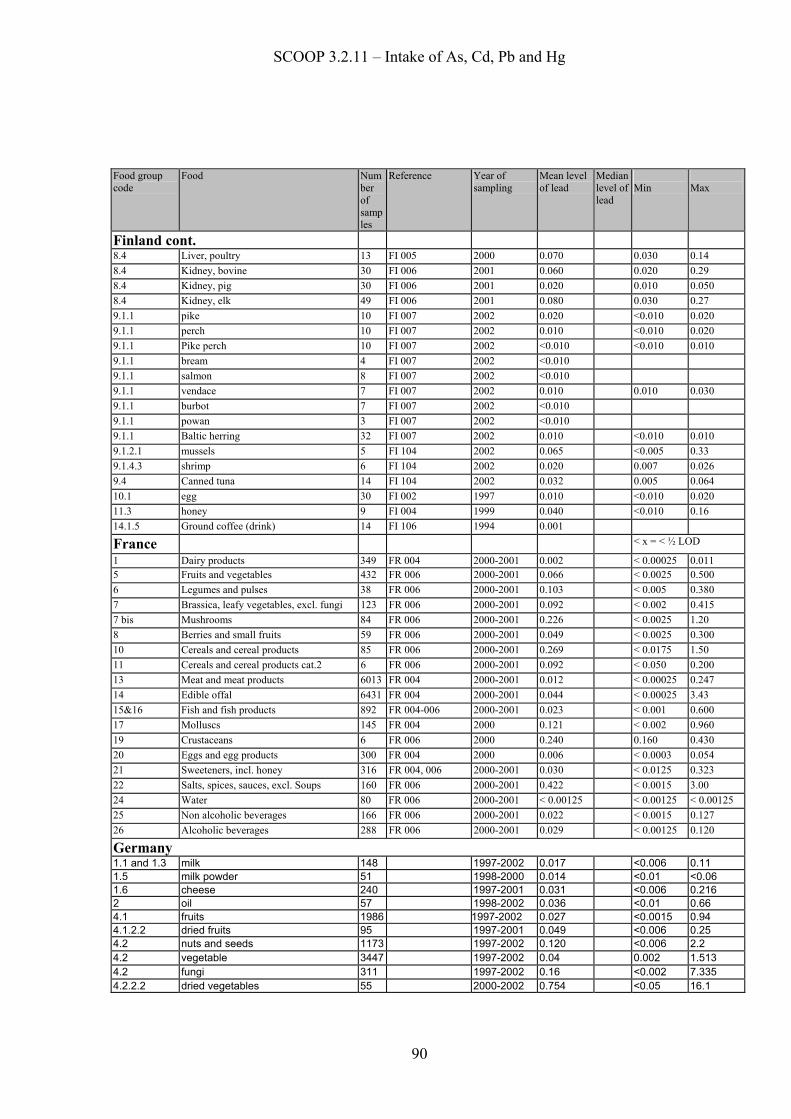
SCOOP 3.2.11 – Intake of As, Cd, Pb and Hg
90
Food group code
Food Number of samples
Reference Year of sampling
Mean level of lead
Median level of lead
Min
Max
Finland cont.
8.4 Liver, poultry 13 FI 005 2000 0.070 0.030 0.14 8.4 Kidney, bovine 30 FI 006 2001 0.060 0.020 0.29 8.4 Kidney, pig 30 FI 006 2001 0.020 0.010 0.050 8.4 Kidney, elk 49 FI 006 2001 0.080 0.030 0.27 9.1.1 pike 10 FI 007 2002 0.020 <0.010 0.020 9.1.1 perch 10 FI 007 2002 0.010 <0.010 0.020 9.1.1 Pike perch 10 FI 007 2002 <0.010 <0.010 0.010 9.1.1 bream 4 FI 007 2002 <0.010 9.1.1 salmon 8 FI 007 2002 <0.010 9.1.1 vendace 7 FI 007 2002 0.010 0.010 0.030 9.1.1 burbot 7 FI 007 2002 <0.010 9.1.1 powan 3 FI 007 2002 <0.010 9.1.1 Baltic herring 32 FI 007 2002 0.010 <0.010 0.010 9.1.2.1 mussels 5 FI 104 2002 0.065 <0.005 0.33 9.1.4.3 shrimp 6 FI 104 2002 0.020 0.007 0.026 9.4 Canned tuna 14 FI 104 2002 0.032 0.005 0.064 10.1 egg 30 FI 002 1997 0.010 <0.010 0.020 11.3 honey 9 FI 004 1999 0.040 <0.010 0.16 14.1.5 Ground coffee (drink) 14 FI 106 1994 0.001
France < x = < ½ LOD
1 Dairy products 349 FR 004 2000-2001 0.002 < 0.00025 0.011 5 Fruits and vegetables 432 FR 006 2000-2001 0.066 < 0.0025 0.500 6 Legumes and pulses 38 FR 006 2000-2001 0.103 < 0.005 0.380 7 Brassica, leafy vegetables, excl. fungi 123 FR 006 2000-2001 0.092 < 0.002 0.415 7 bis Mushrooms 84 FR 006 2000-2001 0.226 < 0.0025 1.20 8 Berries and small fruits 59 FR 006 2000-2001 0.049 < 0.0025 0.300 10 Cereals and cereal products 85 FR 006 2000-2001 0.269 < 0.0175 1.50 11 Cereals and cereal products cat.2 6 FR 006 2000-2001 0.092 < 0.050 0.200 13 Meat and meat products 6013 FR 004 2000-2001 0.012 < 0.00025 0.247 14 Edible offal 6431 FR 004 2000-2001 0.044 < 0.00025 3.43 15&16 Fish and fish products 892 FR 004-006 2000-2001 0.023 < 0.001 0.600 17 Molluscs 145 FR 004 2000 0.121 < 0.002 0.960 19 Crustaceans 6 FR 006 2000 0.240 0.160 0.430 20 Eggs and egg products 300 FR 004 2000 0.006 < 0.0003 0.054 21 Sweeteners, incl. honey 316 FR 004, 006 2000-2001 0.030 < 0.0125 0.323 22 Salts, spices, sauces, excl. Soups 160 FR 006 2000-2001 0.422 < 0.0015 3.00 24 Water 80 FR 006 2000-2001 < 0.00125 < 0.00125 < 0.00125 25 Non alcoholic beverages 166 FR 006 2000-2001 0.022 < 0.0015 0.127 26 Alcoholic beverages 288 FR 006 2000-2001 0.029 < 0.00125 0.120
Germany 1.1 and 1.3 milk 148 1997-2002 0.017 <0.006 0.11 1.5 milk powder 51 1998-2000 0.014 <0.01 <0.06 1.6 cheese 240 1997-2001 0.031 <0.006 0.216 2 oil 57 1998-2002 0.036 <0.01 0.66 4.1 fruits 1986 1997-2002 0.027 <0.0015 0.94 4.1.2.2 dried fruits 95 1997-2001 0.049 <0.006 0.25 4.2 nuts and seeds 1173 1997-2002 0.120 <0.006 2.2 4.2 vegetable 3447 1997-2002 0.04 0.002 1.513 4.2 fungi 311 1997-2002 0.16 <0.002 7.335 4.2.2.2 dried vegetables 55 2000-2002 0.754 <0.05 16.1

SCOOP 3.2.11 – Intake of As, Cd, Pb and Hg
91
Food group code
Food Number of samples
Reference Year of sampling
Mean level of lead
Median level of lead
Min
Max
Germany cont. 4.2.2.2 dried fungi 63 1998-2002 0.653 <0.15 5.12 4.2.2.2 dried algae 11 2000-2002 0.51 0.08 1.5 4.2.2.6 cocentrated tomato 61 1999-2001 0.03 <0.006 0.382
5.1 cocao products 148 1998-2002 0.067 <0.01 0.279 6 and 7 cereals, cereal products, bakery
wares 1455 1997-2002 0.032 <0.005 0.751
8.1 fresh meat 840 1997-2002 0.067 <0.006 14 8.1 game 605 1997-2002 1.32 <0.006 188 8.4 offal 3086 1997-2002 0.081 <0.006 1.57 8.5, 8.3, 8.2 processed meat 311 1997-2002 0.054 <0.006 0.876 9.1 without 9.1.2 to 9.1.4
fish 2289 1997-2002 0.022 <0.005 0.57
9.1.2 to 9.1.4 bivalves, crustaceans, squids 620 1997-2002 0.099 <0.006 1.35
10.1 eggs 46 1997-2002 0.021 <0.006 0.259 11.1 sugar 28 1999-2002 0.039 <0.01 0.32 11.3 honey 133 1997-2002 0.07 <0.006 2.74 11.4 sweeteners 32 1998-2000 0.104 <0.01 0.276 12.1 salt 12 1998-2002 0.94 <0.05 2.7 12.2 herbs and spices 501 1997-2002 1.015 <0.006 379.2 13.1, 13.2 infant food 1275 1997-2002 0.035 <0.005 0.34 13.4, 13.5 dietetic food 137 1997-2002 0.791 <0.01 34.8 13.6 food supplements 44 1998-2002 1.57 <0.0022 18 14.1.1 water 2910 1997-2002 0.003 <0.0005 0.6 14.1.2,14.1.3 vegetal juice 28 1997-2002 0.017 <0.01 0.127 14.1.2,14.1.3 fruit juice 195 1998-2002 0.024 <0.006 0.25 14.1.5 tea and coffee 413 1997-2002 0.537 <0.0015 5.83 14.2.1 beer 125 1999-2002 0.007 <0.006 0.081 14.2.3 wine 433 1997-2002 0.156 0.0044 16.8 Greece
1.1.1 Milk and butter milk 95 2000-2002 0.0123 0.0042 0.1460 4.1.2.2 Dried fruit 4 2000 0.6100 0.5000 0.4100 1.0900 4.2.2.4 Canned vegetables 3 1999-2000 0.7587 0.1490 1.8500 6.1 Whole, broken or flaked grain, incl. Rice 4 2001-2002 0.1390 0.0100 0.3500 8.1.1 Whole pieces or cuts 28 1999-2002 0.1305 0.0230 0.7140 8.1.2 Whole pieces or cuts 21 2001 0.0599 0.0280 0.0094 0.4530 8.3.1.3 Fermented meat 1 1999 0.7750 0.7750 0.7750 0.7750 8.4 Offals 93 1999-2002 0.1437 0.0110 0.8150 9.1.1.30 Small fish eaten whole 10 2001 0.4272 0.1400 0.0100 1.7610 Greece cont.
9.1.1.30 Bogue 4 2001 0.1400 0.1470 0.0480 0.2650 9.1.1.30 Cuttlefish 3 2001 0.4300 0.4100 0.3910 0.4880 9.1.1.30 Perch 3 2001 0.1620 0.1830 0.0100 0.2040 9.1.1.30 Seabream 3 2001 0.0300 0.0400 0.0100 0.0400 9.1.1.5 Grey mullet 4 2001-2002 0.3328 0.0100 1.1000 9.1.2 Fresh bivalve molluscs 2 2002 0.5565 0.5565 0.4550 0.6580 9.1.2.1 mussels 26 2001-2002 0.3826 0.0990 0.8150 9.1.2.1 Mussels 5 2001-2002 0.8838 0.0630 3.1810 9.1.2.2 Oysters 1 2002 0.5420 0.5420 0.5420 0.5420 9.1.3.2 Squid 2 2001 0.3600 0.3600 0.3570 0.3640 9.1.3.3 Octopus 2 2001 0.2560 0.2560 0.0610 0.4500 9.2.1 Frozen fish, fish fillets and fish products incl. 11 2001-2002 0.1535 0.0100 0.4130 9.4 canned fish 22 1999-2002 1.0113 0.1320 6.8200 9.4.1 Fish canned in oil 1 2002 0.0100 0.0100 0.0100 0.0100 9.4.2 Fish canned in brine (tuna) 4 2001 0.0002 0.0001 0.0005 9.4.2 Fish canned in brine 5 1999 0.4660 0.2500 0.6200
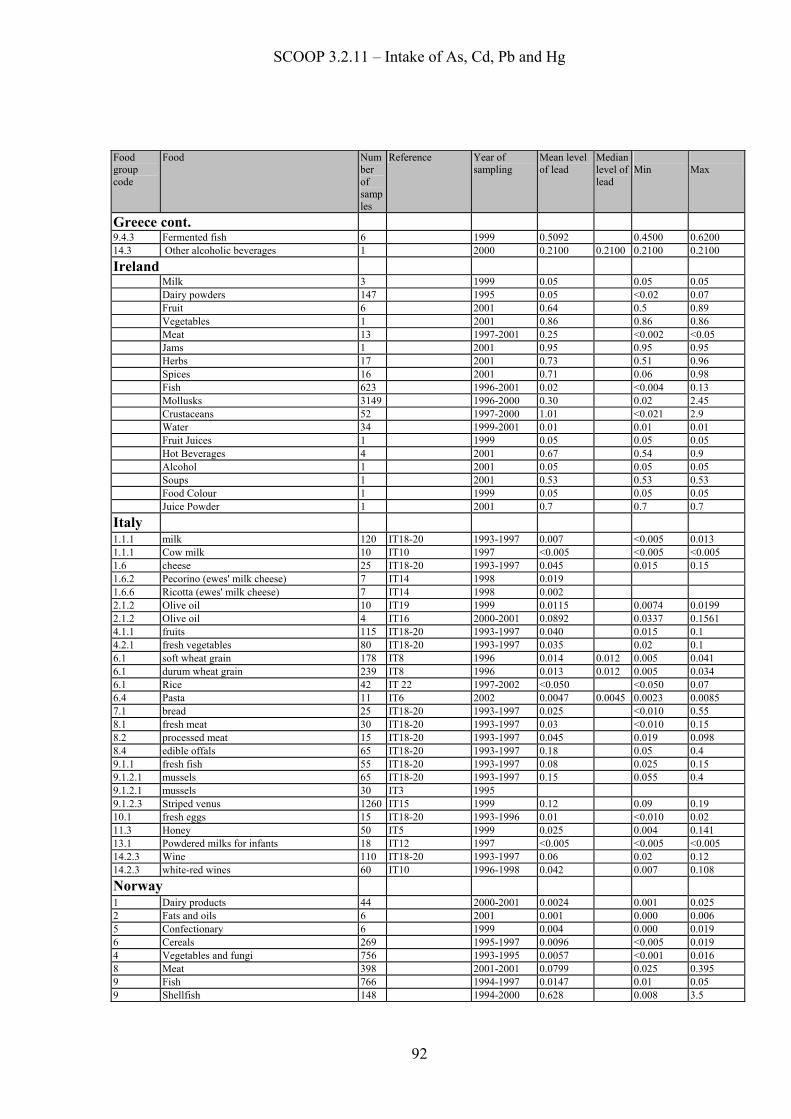
SCOOP 3.2.11 – Intake of As, Cd, Pb and Hg
92
Food group code
Food Number of samples
Reference Year of sampling
Mean level of lead
Median level of lead
Min
Max
Greece cont.
9.4.3 Fermented fish 6 1999 0.5092 0.4500 0.6200 14.3 Other alcoholic beverages 1 2000 0.2100 0.2100 0.2100 0.2100 Ireland
Milk 3 1999 0.05 0.05 0.05 Dairy powders 147 1995 0.05 <0.02 0.07 Fruit 6 2001 0.64 0.5 0.89 Vegetables 1 2001 0.86 0.86 0.86 Meat 13 1997-2001 0.25 <0.002 <0.05 Jams 1 2001 0.95 0.95 0.95 Herbs 17 2001 0.73 0.51 0.96 Spices 16 2001 0.71 0.06 0.98 Fish 623 1996-2001 0.02 <0.004 0.13 Mollusks 3149 1996-2000 0.30 0.02 2.45 Crustaceans 52 1997-2000 1.01 <0.021 2.9 Water 34 1999-2001 0.01 0.01 0.01 Fruit Juices 1 1999 0.05 0.05 0.05 Hot Beverages 4 2001 0.67 0.54 0.9 Alcohol 1 2001 0.05 0.05 0.05 Soups 1 2001 0.53 0.53 0.53 Food Colour 1 1999 0.05 0.05 0.05 Juice Powder 1 2001 0.7 0.7 0.7 Italy 1.1.1 milk 120 IT18-20 1993-1997 0.007 <0.005 0.013 1.1.1 Cow milk 10 IT10 1997 <0.005 <0.005 <0.005 1.6 cheese 25 IT18-20 1993-1997 0.045 0.015 0.15 1.6.2 Pecorino (ewes' milk cheese) 7 IT14 1998 0.019 1.6.6 Ricotta (ewes' milk cheese) 7 IT14 1998 0.002 2.1.2 Olive oil 10 IT19 1999 0.0115 0.0074 0.0199 2.1.2 Olive oil 4 IT16 2000-2001 0.0892 0.0337 0.1561 4.1.1 fruits 115 IT18-20 1993-1997 0.040 0.015 0.1 4.2.1 fresh vegetables 80 IT18-20 1993-1997 0.035 0.02 0.1 6.1 soft wheat grain 178 IT8 1996 0.014 0.012 0.005 0.041 6.1 durum wheat grain 239 IT8 1996 0.013 0.012 0.005 0.034 6.1 Rice 42 IT 22 1997-2002 <0.050 <0.050 0.07 6.4 Pasta 11 IT6 2002 0.0047 0.0045 0.0023 0.0085 7.1 bread 25 IT18-20 1993-1997 0.025 <0.010 0.55 8.1 fresh meat 30 IT18-20 1993-1997 0.03 <0.010 0.15 8.2 processed meat 15 IT18-20 1993-1997 0.045 0.019 0.098 8.4 edible offals 65 IT18-20 1993-1997 0.18 0.05 0.4 9.1.1 fresh fish 55 IT18-20 1993-1997 0.08 0.025 0.15 9.1.2.1 mussels 65 IT18-20 1993-1997 0.15 0.055 0.4 9.1.2.1 mussels 30 IT3 1995 9.1.2.3 Striped venus 1260 IT15 1999 0.12 0.09 0.19 10.1 fresh eggs 15 IT18-20 1993-1996 0.01 <0.010 0.02 11.3 Honey 50 IT5 1999 0.025 0.004 0.141 13.1 Powdered milks for infants 18 IT12 1997 <0.005 <0.005 <0.005 14.2.3 Wine 110 IT18-20 1993-1997 0.06 0.02 0.12 14.2.3 white-red wines 60 IT10 1996-1998 0.042 0.007 0.108 Norway 1 Dairy products 44 2000-2001 0.0024 0.001 0.025 2 Fats and oils 6 2001 0.001 0.000 0.006 5 Confectionary 6 1999 0.004 0.000 0.019 6 Cereals 269 1995-1997 0.0096 <0.005 0.019 4 Vegetables and fungi 756 1993-1995 0.0057 <0.001 0.016 8 Meat 398 2001-2001 0.0799 0.025 0.395 9 Fish 766 1994-1997 0.0147 0.01 0.05 9 Shellfish 148 1994-2000 0.628 0.008 3.5

SCOOP 3.2.11 – Intake of As, Cd, Pb and Hg
93
Food group code
Food Number of samples
Reference Year of sampling
Mean level of lead
Median level of lead
Min
Max
Norway cont.
10 Egg 27 2000-2001 0.005 <0.01 0.01 11 Sweeteners 11 1999-2001 0.0155 0 0.2 14 Beverages 94 1999-2001 0.0077 0.0004 0.022 Portugal
vegetable oil 26 PT-040,020 2001-2002 <0.001 0.01 fruits and vegetables 102 PT-10,040,120 1997-2002 0.189 0.012 <1.0 potato 57 PT-010 1997-2000 0.34 <0.2 <1.0
fruits and egetables(powder,concentrate and puree)
110 PT-010,020,040 1999-2002 0.082 <0.007 1.8
chocolate 4 PT-020 2000-2002 0.031 <0.057 <0.080 cereals and flour 36 PT-020,040 2000-2002 0.040 <0.007 0.373 breakfast cereals 20 PT-040 2001 0.04 pasta and noodles 2 PT-040 2000 0.04 cakes 2 PT-040 2000 0.04
liver(bovine,caprine,quail,rabbit,chicken,wild boar,ovine,turkey,pork,deer)
258 PT-050 2001 0.132 <0.0012 9.1
equine liver 15 PT-050 2001 0.267 0.100 0.045 2.0 fresh fish 194 PT-060 1998-2001 0.055 <0.1 0.3 bivalves e molluscs 34 PT-020,060 1998-2002 0.051 0.051 0.4
canned fish,molluscs,bivalves 244 PT-020,060, 040,120
1996-2001 0.050 0.001 1
sugar 281 PT-010,020 1997-2002 0.0054 <0.004 <0.4 pizza sauce 5 PT-120 1998 0.08 0.008 0.174
natural mineral waters and source waters 13 PT-030 2000-2001 0.001 <0.0005 <0.005
Fruit juices 12 PT-020 2001 <0.005 <0.005 Water based drink 6 PT-020 2002 <0.005 <0.005 still wine 307 PT-020/PT-070 1999-2002 0.077 0.004 0.435 Porto wine 247 PT-080/PT-100 2000 0.018 0.453 Spirituous beverage 5 PT-020 2000-2002 0.168 0.655
Sweden 1.1-1.5 Dairy products, milk 20 SE 010 1998 <0.002 1.6 Dairy products, cheese 23 SE 016 1995 0.058 0.004 0.21 4.1-4.2 Fruits and vegetables 146 SE 005,017,018,
021 1996-97, 2000-02
0.013 <0.003 0.12
6 Cereals 112 SE 007,010,012, 018, 022
1997-98, 2000-01
0.009 <0.005 0.057
7 Bakery wares 28 SE 014 1999 0.017 0.006 0.038 8.1-8.3 Meat 334 SE 009,015,023 1994-1997 0.009 <0.002 0.081 8.4 Offals 340 SE 006.009.024 1994-99 0.058 <0.004 0.34 9.1.1 Fish 75 SE 001.020 1993.2001 0.004 <0.006 0.018 10 Egg 5 SE 008 1998 <0.001 11 Honey 5 SE 004 2001 0.038 <0.004 0.15 12 Spices 4 SE 019 1997 1.2 0.07 4.5 14 Beverages 570 SE 025 1997-98 0.03 - - 16 Composite foods 4 SE 013 1999 0.019 0.012 0.026 United Kingdom
Total Diet Study
1.2.2.2 Dairy produce 20 UK/010 1997 0.008 <0.002 0.019 1.1 Milk 20 UK/010 1997 0.001 <0.0006 0.0019 2 Oil & fats 20 UK/010 1997 0.005 <0.005 0.019 4.5.11 Sugar and preserves 20 UK/010 1997 0.014 0.006 0.041 4.1.1 Fresh fruit 20 UK/010 1997 0.003 0.001 0.007 4.1.2 Fruit products 20 UK/010 1997 0.018 0.006 0.049 4.2 Green vegetables 20 UK/010 1997 0.061 0.0026 1
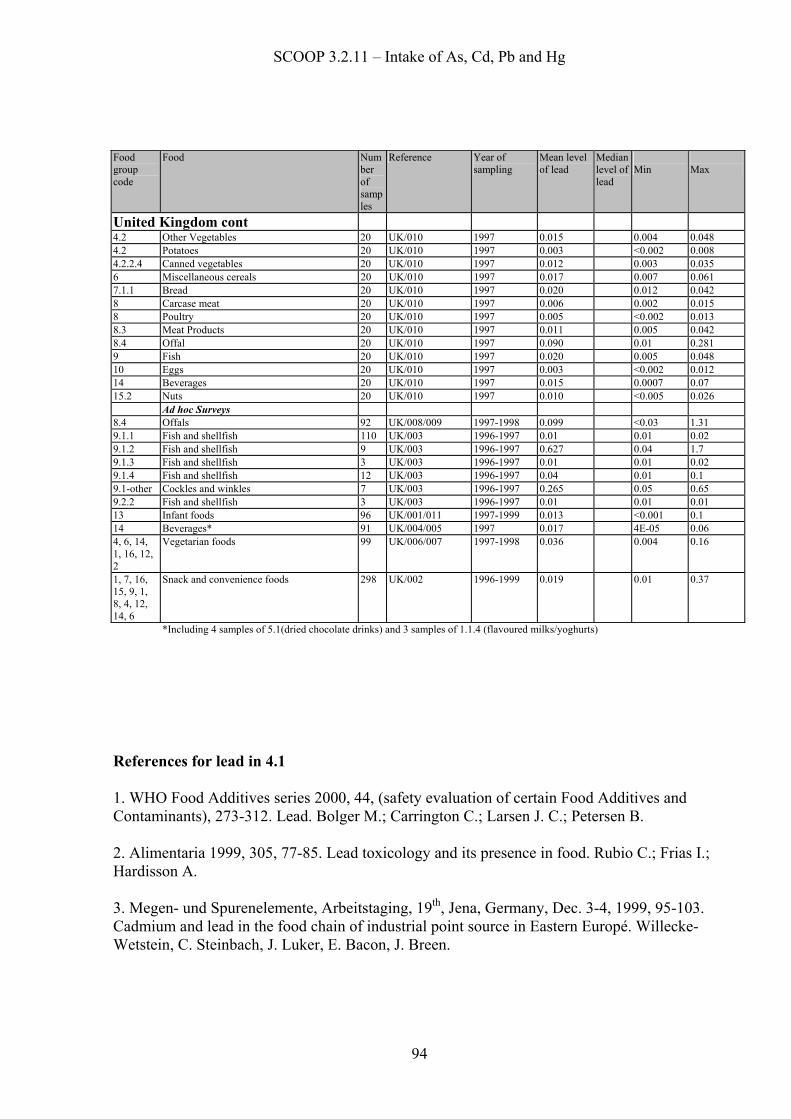
SCOOP 3.2.11 – Intake of As, Cd, Pb and Hg
94
Food group code
Food Number of samples
Reference Year of sampling
Mean level of lead
Median level of lead
Min
Max
United Kingdom cont
4.2 Other Vegetables 20 UK/010 1997 0.015 0.004 0.048 4.2 Potatoes 20 UK/010 1997 0.003 <0.002 0.008 4.2.2.4 Canned vegetables 20 UK/010 1997 0.012 0.003 0.035 6 Miscellaneous cereals 20 UK/010 1997 0.017 0.007 0.061 7.1.1 Bread 20 UK/010 1997 0.020 0.012 0.042 8 Carcase meat 20 UK/010 1997 0.006 0.002 0.015 8 Poultry 20 UK/010 1997 0.005 <0.002 0.013 8.3 Meat Products 20 UK/010 1997 0.011 0.005 0.042 8.4 Offal 20 UK/010 1997 0.090 0.01 0.281 9 Fish 20 UK/010 1997 0.020 0.005 0.048 10 Eggs 20 UK/010 1997 0.003 <0.002 0.012 14 Beverages 20 UK/010 1997 0.015 0.0007 0.07 15.2 Nuts 20 UK/010 1997 0.010 <0.005 0.026
Ad hoc Surveys 8.4 Offals 92 UK/008/009 1997-1998 0.099 <0.03 1.31 9.1.1 Fish and shellfish 110 UK/003 1996-1997 0.01 0.01 0.02 9.1.2 Fish and shellfish 9 UK/003 1996-1997 0.627 0.04 1.7 9.1.3 Fish and shellfish 3 UK/003 1996-1997 0.01 0.01 0.02 9.1.4 Fish and shellfish 12 UK/003 1996-1997 0.04 0.01 0.1 9.1-other Cockles and winkles 7 UK/003 1996-1997 0.265 0.05 0.65 9.2.2 Fish and shellfish 3 UK/003 1996-1997 0.01 0.01 0.01 13 Infant foods 96 UK/001/011 1997-1999 0.013 <0.001 0.1 14 Beverages* 91 UK/004/005 1997 0.017 4E-05 0.06 4, 6, 14, 1, 16, 12, 2
Vegetarian foods 99 UK/006/007 1997-1998 0.036 0.004 0.16
1, 7, 16, 15, 9, 1, 8, 4, 12, 14, 6
Snack and convenience foods 298 UK/002 1996-1999 0.019 0.01 0.37
*Including 4 samples of 5.1(dried chocolate drinks) and 3 samples of 1.1.4 (flavoured milks/yoghurts)
References for lead in 4.1 1. WHO Food Additives series 2000, 44, (safety evaluation of certain Food Additives and Contaminants), 273-312. Lead. Bolger M.; Carrington C.; Larsen J. C.; Petersen B. 2. Alimentaria 1999, 305, 77-85. Lead toxicology and its presence in food. Rubio C.; Frias I.; Hardisson A. 3. Megen- und Spurenelemente, Arbeitstaging, 19th, Jena, Germany, Dec. 3-4, 1999, 95-103. Cadmium and lead in the food chain of industrial point source in Eastern Europé. Willecke-Wetstein, C. Steinbach, J. Luker, E. Bacon, J. Breen.

SCOOP 3.2.11 – Intake of As, Cd, Pb and Hg
95
5. DIETARY INTAKE OF MERCURY 5.1 Toxicology Mercury is a toxic element found mostly in fish and fishery products. Methylmercury, the main form in which mercury is present in seafood is the most toxic among mercury species. The methylmercury content in fish and shellfish varies, but it is generally assumed that over 90% is in the form of methylmercury. It may induce alterations in the normal development of the brain of infants and may, at higher levels, induce neurological changes in adults. Children exposed to methyl mercury prior to birth may experience negative effects on their mental development. Therefore, the levels of mercury and methylmercury in food should be as low as reasonably achievable, (taking into account that for physiological reasons certain fish species concentrate mercury more easily in their tissues than others).(ref.1-7) 5.2 Recommendations on intake limitations A PTWI of 0.005 mg/kg (5 µg/kg) bodyweight have been decided for total mercury. This is equal to 0.35 mg/week (350 µg/week) for a person weighing 70 kg. The average intake of total mercury by an adult in the Member States is, according to current information, 5.53 µg/day, which is equal to 38.7 µg/week.
Table 5. 1. Mercury. Consumption of food in g/day by the mean adult population in the Member States. The figures are based on products for which occurrence data are available. Food BE DK FI FR DE HE IR IT NL NO PT SE UK Milk, milk products 238 357 112 281 Condensed and milk powder, cheese, yoghurt
33 41 60
Fats and oils 48 21 27 Edible ice Fruits and vegetables 421 353 352 0.5* 360 379 Confectionary 30 5.9 Cereals and bakery wares 217 63** 188 23 220 209 Meat 136 175 37 88 88 Offal 1.6 0.87 2.2 1 Fishmeat 13 23 53 30 16 36 20 32 10 70 40 30 14 Bivalves, crustaceans and cephalopods
1.8 4.7 0.8 5.2 0.05 10 10
Eggs 21 33 14 Sweeteners 13 31 63 Salt and spices 9.3 2.3 79 Beverages 2003 1091 376 937 Ready to eat 2 Composite food 282 Sum 253 3289 53 1551 1227 215 109 32 951 80 83 30 2075 * dried fruit. ** excluding bakery wares

SCOOP 3.2.11 – Intake of As, Cd, Pb and Hg
96
In its sixtieth meeting in Rome, (10-19 June 2003), JECFA established a new PTWI-value for methylmercury, corresponding to 1.6 µg/kg bw, which covers also pregnant women and their fetuses (the previous value was 3.3 µg/kg bw, and did not protect this risk group). 5.3 Intake of mercury by the mean adult population Thirteen Member States submitted data for the mean adult population (BE for 14-18 year olds). In addition, several Member States submitted data for other population groups (Table 1.1) The Tables 5.2 - 5.4 report the intakes for 13 food categories.
Table 5.2 Mercury daily intake (µg/day). Mean Adult population. Food BE DK FI FR DE HE IR IT NL NO PT SE UK MeanMilk and dairy products 0.13 0.38 0.165 0.23 0.23 Fats and oils 0.02 0.12 0.08 0.07 Fruits and vegetable 0.61 3.49 3.27 1.05 0.29 1.74 Cereals and bakery ware 0.58 1.16
** 1.32 0.42 0.62 0.82
Meat and offal 0.20 1.62 0.42 0.09 0.21 0.51 Fish and fish products 2.53 0.96 6.2 2.73 2.80 4.51 0.92 8.6 0.19 3.34 13.1 2.7 1.00 3.81 Bivalves, cephalopoda, crustaceans, squid
0.12 0.15 0.02 0.66 0.03 0.72 0.80 0.36
Eggs 0.03 0.17 0.02 0.07 Sweeteners 0.05 0.39 0.19 0.21 Salts, spice 0.49 0.02 0.09 0.2 Beverages 0.73 0.45
* 0.36* 0.37 0.46
Ready to eat 0.01 0.01 Composite food 0.04 0.04 Sum 2.78 3.5 6.2 8.48 9.91 5.17 1.37 8.6 1.79 4.06 14.4 2.7 3.02 5.53
* Including drinking water. ** Excluding bakery ware No Country reports intake data for all the food categories. DE presents the higher number of food categories (11/13), IT and SE the lower (1/13).
Table 5.3 Mercury. Weekly intake (µg/week). Mean Adult population. Food BE DK FI FR DE HE IR IT NL NO PT SE UK Mean Milk and dairy products 0.88 2.66 1.15 1.61 1.57 Fats and oils 0.14 0.86 0.56 0.52 Fruit and vegetable 4.27 24.4 22.9 7.35 2.03 12.2 Cereals and bakery ware 4.06 8.15*
* 9.21 2.94 4.34 5.74
Meat and offal 1.40 11.4 2.94 0.63 1.47 3.56 Fish 17.7 6.72 43.4 19.1 19.6 31.6 6.44 60.2 1.33 23.4 91.7 18.9 7.00 26.7 Bivalves, cephalopods, crustaceans, squid
0.83 1.06 0.12 4.62 0.21 5.04 5.6 2.50
Eggs 0.21 1.17 0.14 0.51 Sweeteners 0.35 2.73 1.33 1.47 Salts and spices 3.44 0.14 0.63 1.4 Beverages 5.11 3.12* 2.52 2.59 3.26 Ready to eat 0.07 0.07
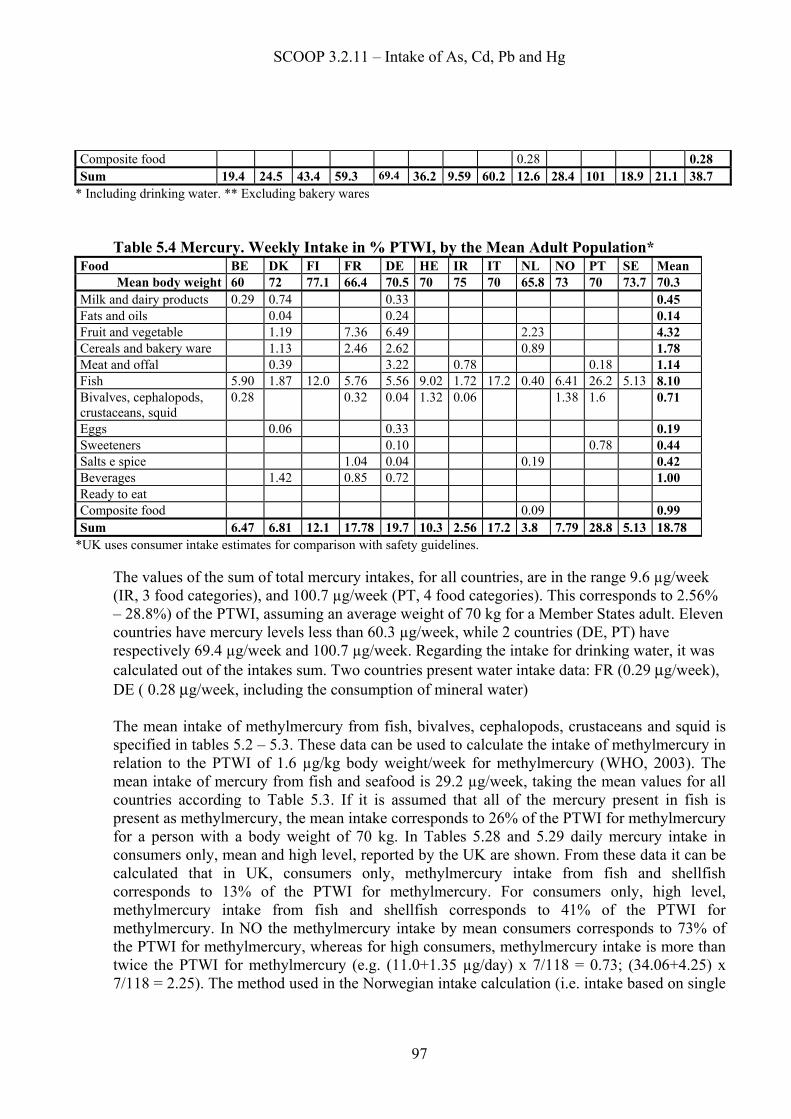
SCOOP 3.2.11 – Intake of As, Cd, Pb and Hg
97
Composite food 0.28 0.28 Sum 19.4 24.5 43.4 59.3 69.4 36.2 9.59 60.2 12.6 28.4 101 18.9 21.1 38.7
* Including drinking water. ** Excluding bakery wares Table 5.4 Mercury. Weekly Intake in % PTWI, by the Mean Adult Population*
Food BE DK FI FR DE HE IR IT NL NO PT SE Mean Mean body weight 60 72 77.1 66.4 70.5 70 75 70 65.8 73 70 73.7 70.3
Milk and dairy products 0.29 0.74 0.33 0.45 Fats and oils 0.04 0.24 0.14 Fruit and vegetable 1.19 7.36 6.49 2.23 4.32 Cereals and bakery ware 1.13 2.46 2.62 0.89 1.78 Meat and offal 0.39 3.22 0.78 0.18 1.14 Fish 5.90 1.87 12.0 5.76 5.56 9.02 1.72 17.2 0.40 6.41 26.2 5.13 8.10 Bivalves, cephalopods, crustaceans, squid
0.28 0.32 0.04 1.32 0.06 1.38 1.6 0.71
Eggs 0.06 0.33 0.19 Sweeteners 0.10 0.78 0.44 Salts e spice 1.04 0.04 0.19 0.42 Beverages 1.42 0.85 0.72 1.00 Ready to eat Composite food 0.09 0.99 Sum 6.47 6.81 12.1 17.78 19.7 10.3 2.56 17.2 3.8 7.79 28.8 5.13 18.78
*UK uses consumer intake estimates for comparison with safety guidelines.
The values of the sum of total mercury intakes, for all countries, are in the range 9.6 µg/week (IR, 3 food categories), and 100.7 µg/week (PT, 4 food categories). This corresponds to 2.56% – 28.8%) of the PTWI, assuming an average weight of 70 kg for a Member States adult. Eleven countries have mercury levels less than 60.3 µg/week, while 2 countries (DE, PT) have respectively 69.4 µg/week and 100.7 µg/week. Regarding the intake for drinking water, it was calculated out of the intakes sum. Two countries present water intake data: FR (0.29 µg/week), DE ( 0.28 µg/week, including the consumption of mineral water) The mean intake of methylmercury from fish, bivalves, cephalopods, crustaceans and squid is specified in tables 5.2 – 5.3. These data can be used to calculate the intake of methylmercury in relation to the PTWI of 1.6 µg/kg body weight/week for methylmercury (WHO, 2003). The mean intake of mercury from fish and seafood is 29.2 µg/week, taking the mean values for all countries according to Table 5.3. If it is assumed that all of the mercury present in fish is present as methylmercury, the mean intake corresponds to 26% of the PTWI for methylmercury for a person with a body weight of 70 kg. In Tables 5.28 and 5.29 daily mercury intake in consumers only, mean and high level, reported by the UK are shown. From these data it can be calculated that in UK, consumers only, methylmercury intake from fish and shellfish corresponds to 13% of the PTWI for methylmercury. For consumers only, high level, methylmercury intake from fish and shellfish corresponds to 41% of the PTWI for methylmercury. In NO the methylmercury intake by mean consumers corresponds to 73% of the PTWI for methylmercury, whereas for high consumers, methylmercury intake is more than twice the PTWI for methylmercury (e.g. (11.0+1.35 µg/day) x 7/118 = 0.73; (34.06+4.25) x 7/118 = 2.25). The method used in the Norwegian intake calculation (i.e. intake based on single

SCOOP 3.2.11 – Intake of As, Cd, Pb and Hg
98
point estimates for consumption of each of the relevant foods combined with single point estimates for Hg-concentration in those foods) is known to overestimate the intake, in particular the high-level intakes. However, the results from the SCOOP task indicate that there is a risk that population-groups with a high consumption of fish and seafood may have intakes of methylmercury that are close or even exceed the PTWI of 1.6 µg/kg body weight/week 5.4 Intake of mercury by children: Mean population Intake data were reported by FR and DE ( BE reported intake data for 14-18 year olds, but they are included in the tables for the mean adult population). The data are shown in Table 5.5, together with data on their percentage of the PTWI for total mercury. Since children have a lower body mass, their body burden per kg bodyweight will generally be larger than that for adults. The total mercury dietary intake for children in FR is 41.02 µg/week, corresponding to 25.96% of the PTWI (31.6 kg x 5 = 158 µg/week). The dietary intake of the mean adult population in France is 59.4 µg/week, corresponding to 17.88% of the PTWI. The mercury dietary intakes for two children groups in DE are 38.95 and 52.55 µg/week, corresponding respectively to 37.15% and 25.66% of the PTWI (21 kg x 5 = 105 µg/week-age 4-6 years; 41 kg x 5 = 205 µg/week-age 10-12 years). The dietary intake of the mean adult population in Germany is 69.37 µg/week, corresponding to 19.7 % of the PTWI. The intake of mercury from fish and shellfish can also be compared with the PTWI for methylmercury. For a 4-6 year-old child weighing 21 kg, the PTWI for methylmercury corresponds to 33.6 µg. Similarly, for a 10-12 year-old child the PTWI for methylmercury Table 5.5. Total mercury. Intake by children in various age brackets. Mean Population.
Daily intake, µg Weekly intake, µg % of PTWI Age bracket, year Age bracket, year Age bracket, year
3-14 4-6 10-12 3-14 4-6 10-12 3-14 4-6 10-12 Food FR DE DE FR DE DE FR DE DE Milk and milk products Condensed, powder milk, cheese, yoghurt
0.081 0.092 0.567 0.637 0.54 0.31
Fats and oils 0.076 0.106 0.532 0.742 0.51 0.36 Fruits and vegetables 2.16 1.81 2.39 15.12 12.67 16.74 9.57 12.11 8.17 Cereals and bakery wares 1.45 0.907 1.24 10.15 6.349 8.68 6.42 6.05 4.23 Meat 0.80 1.267 5.6 8.87 5.33 4.33 Offal 0.004 0.008 0.028 0.056 0.03 0.027 Fish and fish products 1.70 1.273 1.739 11.9 8.91 12.17 7.53 8.48 4.86 Bivalve, crustaceans and cephalopods
0.06 0.004 0.005 0.42 0.028 0.035 0.26 0.03 0.017
Eggs 0.107 0.128 0.75 0.896 0.71 0.44 Sweeteners 0.033 0.036 0.23 0.254 0.21 0.12 Salt and spices 0.34 0.012 0.016 2.38 0.084 0.111 1.51 0.018 0.054 Beverages 0.147 0.453 0.478 1.03 3.169 3.345 0.65 3.02 1.63 Sum 5.86 5.56 7.51 41.02 38.95 52.55 24.4 37.15 25.66

SCOOP 3.2.11 – Intake of As, Cd, Pb and Hg
99
corresponds to 65.6 µg. Using the data from FR and DE in Table 5.5, the percentage of PTWI for methylmercury for children is 26% and 19% for children aged 4-6 and 10-12 years, respectively (as a worst case assuming that all mercury is methylmercury). Intake data in Table 5.30, shows daily mercury intake in children, consumers only, mean or high level,or mean population, high level. Using these data for comparison with PTWI for methylmercury, gives that PTWI is reached or exceeded in children (e.g. for 10-12 year-old children; 9.64 x 7/65.6). 5.5 Legislation In Table 5.6 the MLs for mercury, as defined in The Commission Regulation (EC) No 466/2001, are compared with availabe occurrence data from the Member States. The occurrence data were collated to give as realistic a picture as possible. They are to some extent an approximation based on many data sets and do not claim to be an “absolute” truth. Table 5.6. Mercury. Maximum Levels (ML) in mg/kg, as defined in Commission Regulation (EC) No 466/2001, and compared with occurrence data from the Member States.
Product ML BE DK FI FR DE HE IR IT NL NO PT SE UK
3.3.1 0,5 0.024- 0.255 <0.005/ 1.35
0.060 <0.00003/0.857
<0.01- 0.286 0.0015/ 3.70
0.005- 0.34 <0.01/ 0. 34*
0.07-0.270.05/ 0.42
0.01-0.14 0.005/ 0.56
<0.05- 0.278 0.01/ 3.14
0.16 0.01/1.26
3.3.1.1 1.0 0.16- 0.412 <0.01/ 0.849
0.381 <0.004/4.30
0.377 0.268/ 0.432
0.030- 0.1667 0.030/ 0.55**
0.21- 0.45
0.019- 0.28 0.22/ 0.77
0.01- 0.598 0.03/ 3.98
0.35 0.01/2.2
Fish. Mean Min/max
0.189 <0.01/ 2.12
0.052 0.011 /0.20
0.173 <0.001/5.8
0.323 0.01/ 1.66
0.016- 0.129 0.001/ 0.49
Bivalves, Cephalopods Mean Min/max
0.5 <0.01/ 0.22
0.024 <0.001/ 0.325
0.029 <0.001/0.66
0.0795 0.01/ 0.19
Crustaceans Mean Min/max
0.5 0.065 <0.01/ 0.159
0.041 0.030/ 0.065
*IR. One sample of butterfish: 1.05 mg/kg. **IR. One sample of smoked fish: 1.26 mg/kg
5.6 Comments on the mean adult population intake of total mercury by Member State: This section only reports the mean intake of the adult population. Particular findings of interest are highlighted. Consumers, high-risk groups or particular age-segments are not included. A brief comment of the result from each Member State is given. Tables 5.7 – 5.26 provides additional information.
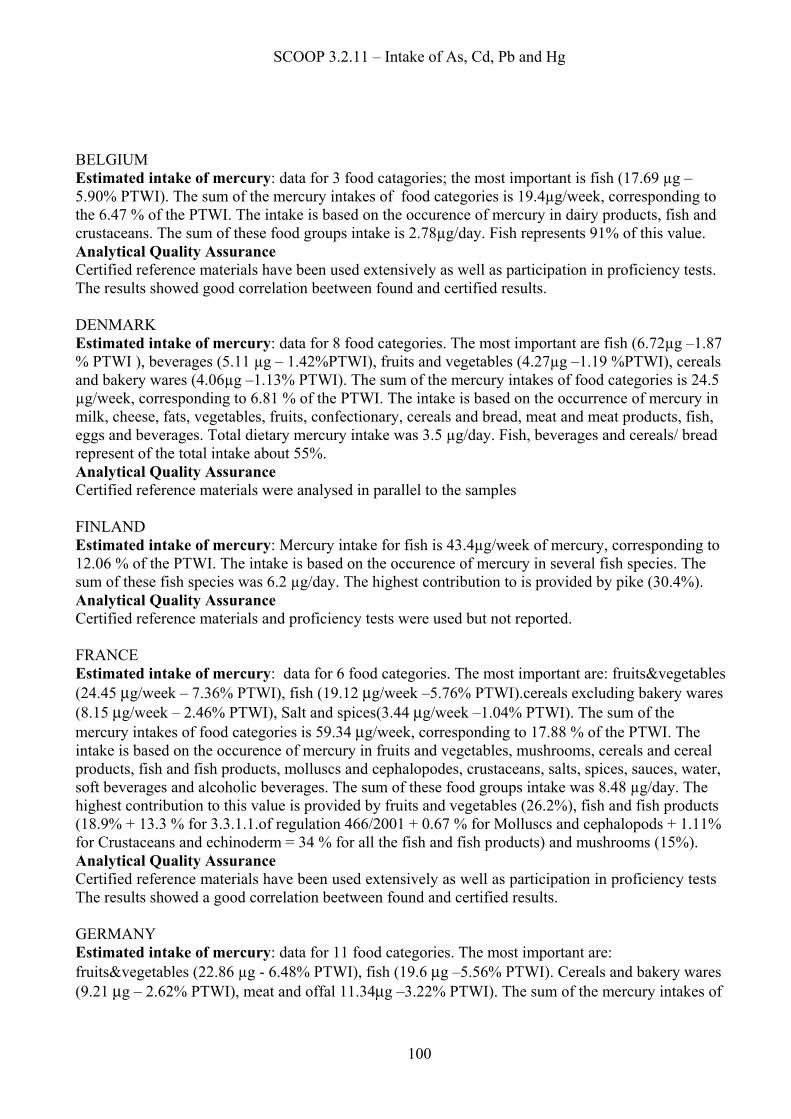
SCOOP 3.2.11 – Intake of As, Cd, Pb and Hg
100
BELGIUM Estimated intake of mercury: data for 3 food catagories; the most important is fish (17.69 µg – 5.90% PTWI). The sum of the mercury intakes of food categories is 19.4µg/week, corresponding to the 6.47 % of the PTWI. The intake is based on the occurence of mercury in dairy products, fish and crustaceans. The sum of these food groups intake is 2.78µg/day. Fish represents 91% of this value. Analytical Quality Assurance Certified reference materials have been used extensively as well as participation in proficiency tests. The results showed good correlation beetween found and certified results. DENMARK Estimated intake of mercury: data for 8 food categories. The most important are fish (6.72µg –1.87 % PTWI ), beverages (5.11 µg – 1.42%PTWI), fruits and vegetables (4.27µg –1.19 %PTWI), cereals and bakery wares (4.06µg –1.13% PTWI). The sum of the mercury intakes of food categories is 24.5 µg/week, corresponding to 6.81 % of the PTWI. The intake is based on the occurrence of mercury in milk, cheese, fats, vegetables, fruits, confectionary, cereals and bread, meat and meat products, fish, eggs and beverages. Total dietary mercury intake was 3.5 µg/day. Fish, beverages and cereals/ bread represent of the total intake about 55%. Analytical Quality Assurance Certified reference materials were analysed in parallel to the samples FINLAND Estimated intake of mercury: Mercury intake for fish is 43.4µg/week of mercury, corresponding to 12.06 % of the PTWI. The intake is based on the occurence of mercury in several fish species. The sum of these fish species was 6.2 µg/day. The highest contribution to is provided by pike (30.4%). Analytical Quality Assurance Certified reference materials and proficiency tests were used but not reported. FRANCE Estimated intake of mercury: data for 6 food categories. The most important are: fruits&vegetables (24.45 µg/week – 7.36% PTWI), fish (19.12 µg/week –5.76% PTWI).cereals excluding bakery wares (8.15 µg/week – 2.46% PTWI), Salt and spices(3.44 µg/week –1.04% PTWI). The sum of the mercury intakes of food categories is 59.34 µg/week, corresponding to 17.88 % of the PTWI. The intake is based on the occurence of mercury in fruits and vegetables, mushrooms, cereals and cereal products, fish and fish products, molluscs and cephalopodes, crustaceans, salts, spices, sauces, water, soft beverages and alcoholic beverages. The sum of these food groups intake was 8.48 µg/day. The highest contribution to this value is provided by fruits and vegetables (26.2%), fish and fish products (18.9% + 13.3 % for 3.3.1.1.of regulation 466/2001 + 0.67 % for Molluscs and cephalopods + 1.11% for Crustaceans and echinoderm = 34 % for all the fish and fish products) and mushrooms (15%). Analytical Quality Assurance Certified reference materials have been used extensively as well as participation in proficiency tests The results showed a good correlation beetween found and certified results. GERMANY Estimated intake of mercury: data for 11 food categories. The most important are: fruits&vegetables (22.86 µg - 6.48% PTWI), fish (19.6 µg –5.56% PTWI). Cereals and bakery wares (9.21 µg – 2.62% PTWI), meat and offal 11.34µg –3.22% PTWI). The sum of the mercury intakes of
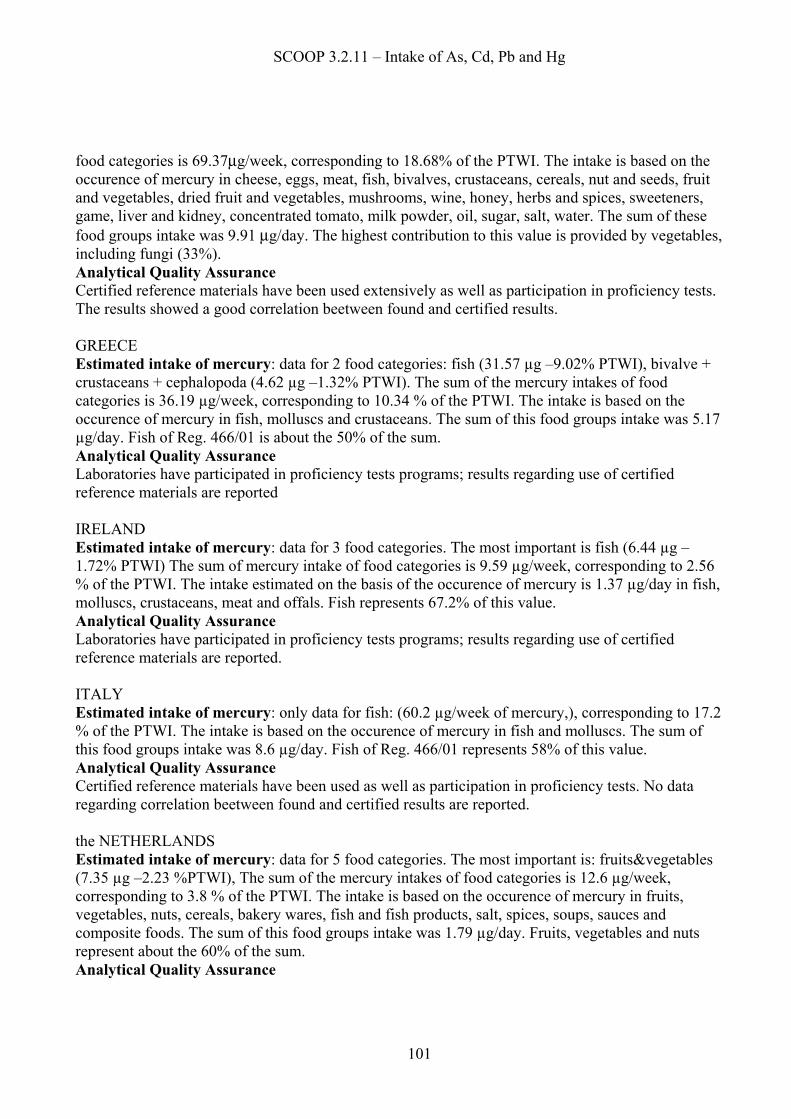
SCOOP 3.2.11 – Intake of As, Cd, Pb and Hg
101
food categories is 69.37µg/week, corresponding to 18.68% of the PTWI. The intake is based on the occurence of mercury in cheese, eggs, meat, fish, bivalves, crustaceans, cereals, nut and seeds, fruit and vegetables, dried fruit and vegetables, mushrooms, wine, honey, herbs and spices, sweeteners, game, liver and kidney, concentrated tomato, milk powder, oil, sugar, salt, water. The sum of these food groups intake was 9.91 µg/day. The highest contribution to this value is provided by vegetables, including fungi (33%). Analytical Quality Assurance Certified reference materials have been used extensively as well as participation in proficiency tests. The results showed a good correlation beetween found and certified results. GREECE Estimated intake of mercury: data for 2 food categories: fish (31.57 µg –9.02% PTWI), bivalve + crustaceans + cephalopoda (4.62 µg –1.32% PTWI). The sum of the mercury intakes of food categories is 36.19 µg/week, corresponding to 10.34 % of the PTWI. The intake is based on the occurence of mercury in fish, molluscs and crustaceans. The sum of this food groups intake was 5.17 µg/day. Fish of Reg. 466/01 is about the 50% of the sum. Analytical Quality Assurance Laboratories have participated in proficiency tests programs; results regarding use of certified reference materials are reported IRELAND Estimated intake of mercury: data for 3 food categories. The most important is fish (6.44 µg –1.72% PTWI) The sum of mercury intake of food categories is 9.59 µg/week, corresponding to 2.56 % of the PTWI. The intake estimated on the basis of the occurence of mercury is 1.37 µg/day in fish, molluscs, crustaceans, meat and offals. Fish represents 67.2% of this value. Analytical Quality Assurance Laboratories have participated in proficiency tests programs; results regarding use of certified reference materials are reported. ITALY Estimated intake of mercury: only data for fish: (60.2 µg/week of mercury,), corresponding to 17.2 % of the PTWI. The intake is based on the occurence of mercury in fish and molluscs. The sum of this food groups intake was 8.6 µg/day. Fish of Reg. 466/01 represents 58% of this value. Analytical Quality Assurance Certified reference materials have been used as well as participation in proficiency tests. No data regarding correlation beetween found and certified results are reported. the NETHERLANDS Estimated intake of mercury: data for 5 food categories. The most important is: fruits&vegetables (7.35 µg –2.23 %PTWI), The sum of the mercury intakes of food categories is 12.6 µg/week, corresponding to 3.8 % of the PTWI. The intake is based on the occurence of mercury in fruits, vegetables, nuts, cereals, bakery wares, fish and fish products, salt, spices, soups, sauces and composite foods. The sum of this food groups intake was 1.79 µg/day. Fruits, vegetables and nuts represent about the 60% of the sum. Analytical Quality Assurance

SCOOP 3.2.11 – Intake of As, Cd, Pb and Hg
102
Certified reference materials were analyzed in parallel to the samples, as well as participation in proficiency tests. No data regarding correlation beetween found and certified results are reported. NORWAY Estimated intake of mercury: data for 2 food categories: fish (23.4µg –6.3% PTWI), bivalve+crustaceans+cephalopoda (5.04µg –1.38% PTWI). The sum of mercury intake of food categories is 28.4µg/week corresponding to 7.79 % of the PTWI. The intake is based on the occurence of mercury in several fish species. The sum of these fish species intake was 4.06 µg/day. Lake trout represents 20.5% of this value. Analytical Quality Assurance Certified reference materials have been used as well as partecipation in proficiency tests. No data regarding correlation beetween found and certified results are reported. PORTUGAL Estimated intake of mercury: data for 4 food categories. The most important are fish (91.7µg –26.2 % PTWI), bivalve +crustaceans+cephalopoda (5.6 µg –1.6% PTWI). The sum of mercury intake of food categories is 100.66 µg/week, corresponding to 28.76 % of the PTWI. The intake is based on the occurence of mercury in liver, sugar, fresh fish and molluscs. The sum of this food groups intake was 14.38 µg/day. Fresh fish represent 91.6%. Analytical Quality Assurance Certified reference materials have been used as well participation in proficiency tests. Methods validated. SWEDEN Estimated intake of mercury: only data for fish: (18.9µg/week of mercury,), corresponding to 5.13 % of the PTWI. The intake is based on the occurence of mercury in several fish species. The sum of these fish species intake was 2.7 µg/day. The highest contribution to this value is provided by cod type fish represent 22.6% of the sum. Analytical Quality Assurance Certified reference materials have been used extensively as well as participation in proficiency tests. The results showed a good correlation beetween found and certified results. UNITED KINGDOM Estimated intake of mercury: data for 10 food categories. The most important categories are: fish (7 µg), cereals and bakery wares (4.34 µg). The sum of the mercury intakes of food categories is 21.14 µg/week. The intake is based on total diet study. Total population intake was 3.02 µg/day. The highest contribution to the intake is provided by fish (33%). Analytical Quality Assurance Certified reference materials have been used extensively as well as participation in proficiency test. The results showed a good correlation beetween found and certified results.

SCOOP 3.2.11 – Intake of As, Cd, Pb and Hg
103
5.7 Comments on total mercury in specific food groups All specific results are shown in tables 5.7 – 5.26 The comments are intended to highlight particular/unusual findings. Table 5.7. Mercury in Dairy products, excluding products of category 2: Milk (Cat. 1.1-1.5) No data for AU, FI, FR, DE, HE, IR, IT, NL, NO, PT, SP, SE. BE: Total dairy products. FR: dairy products The mean mercury intake was in the range 0.11 µg/day (UK) – 0.35 µg/day (DK). DK presented the only high level intake value: 0.36 µg/day. Table 5.8. Mercury in Dairy products, excluding products of category 2: Cheese (Cat. 1.6) No data for AU, BE, FI, FR, HE, IR, IT, NL, NO, PT, SP, SE. The mean mercury intake was in the range 0.03 µg/day (DK) – 0.165 µg/day (DE). DE presented the only high level intake value: 0.446 µg/day Table 5.9. Mercury in Fats and oils (Cat. 2) No data for AU, BE, FI, FR, ,HE, IR, IT, NL, NO, PT, SP, SE. The mean mercury intake was in the range 0.02 µg/day (DK) – 0.123 µg/day (DE). DE presented the only high level intake value: 0.304 µg/day Table 5.10. Mercury in Fruit (Cat. 4.1) No data for AU, BE, FI, HE, IR, IT, SP, SE. FR and NL presented intake value referred to total Vegetables +total Fruits, (respectively 2.22+ 1.27 for mushrooms, and 1.05 µg/day. The mean mercury intake was in the range 0.05 µg/day (NO) – 3.49 µg/day (FR). FR and DE presented high level intake (respectively 4.43+ 8.34 for only mushrooms, and 0.585 µg/day). FR and NL: fruits and vegetables. Table 5.11. Mercury in vegetables incl. mushrooms & fungi, roots, tubers, pulses, legumes, nuts and seeds: (Cat. 4.2). No data for AU, BE, FI, FR, HE, IR, IT, NL, NO, PT, SP, SE. The mean mercury intake was in the range 0.21 µg/day (UK) – 3.27µg/day (DE). Table 5.12. Mercury in Confectionary (Cat. 5) No intake data for all countries. Table 5.13. Mercury in Cereals and cereal products, incl. flours & starches from roots & tubers, pulses & legumes, excluding bakery (Cat. 6) No data for AU, BE, FI, HE, IR, IT, NO, PT, SP, SE. DK and DE presented intake value referred to Cereals & Bakery Wares. The mean intake was in the range 0.12 µg/day (NL) – 1.32 µg/day (DE). FR and DE presented high level intake (respectively 3.04, and 2.40 µg/day. DK: cereals+bread, total. DE: cereals+bakery wares. Table 5.14 Mercury in Bakery Wares (Cat 7) Data only for NL, UK. The mean intake was, 0.30 µg/day for NL and 0.22 µg/day for UK. Table 5.15. Mercury in Meat and meat products, including poultry and game (Cat. 8).

SCOOP 3.2.11 – Intake of As, Cd, Pb and Hg
104
No data for AU, BE, FI, FR, HE, IT, NL, NO, PT, SP, SE. The mean mercury intake was in the range 0.20 µg/day (DK) – 1.62 µg/day (DE). IR: meat + offals. Table 5.16 Mercury in Offals (Cat. 8). No data for AU, BE, DK, FI, FR, HE, IT, NL, NO, SP, SE. The mean mercury intake was in the range 0.087 µg/day (PT) – 0.01 µg/day (UK, DE). DE presented the only high level intake value: 0.09 µg/day Table 5.17. Mercury in Fish and fish products, including molluscs, crustaceans and echinoderms (MCE) (Cat. 9) No data for AU, SP, DK and DE presented intake value referred to Fish incl. 3.3.1.1 Reg. 466/2001. The mean intake was in the range 0.19 µg/day (NL) – 13.1 µg/day (PT). BE, FR DE, IR, NO presented high level intake (respectively 9.02, 13.12, 10.695, 3.5, 16.08 and µg/day). FR: included 3.3.1.1 reg. 466/2001 (8.16µg/day). HE: included reg. 466/2001 (2.58µg/day). IT: included reg. 466/2001 (5µg/day). Table 5.18. Mercury in Bivalve molluscs No data for AU, BE, DK, FI, NL, NO, SP, SE. FR, HE, IT presented intake value referred to Bivalve Molluscs & Cephalopodes. DE presented intake value referred to Bivalve Molluscs & Crustaceans. The mean intake was in the range 0.023µg/day (DE) – 0.60 µg/day (UK). FR, DE, HE, NL, and PT presented high level intake in the range 0µg/day (IT) –0.803 µg/day(PT). FR and IT: bivalves molluscs + cephalopodes. DE: bivalve molluscs + crustaceans. HE: fresh bivalve molluscs + fresh cephalopodes Table 5.19 Mercury in Crustaceans No data for AU, DK, FI, DE, NL, PT, SP, SE, UK. The mean mercury intake was in the range 0.09µg/day (FR) – 0.724 µg/day (NO). BE, FR, HE, IR, NO presented high level intake in the range 0.29 µg/day (IR) –4.17 µg/day(HE). Table 5.20. Mercury in Egg and egg products (Cat.10) No data for AU, BE, FI, FR, HE, IR, IT, NL, NO, PT, SP, SE. The mean intake was in the range 0.03µg/day (UK) – 0.167 µg/day (DE). DE presented the only high level intake value: 0.405 µg/day Table 5.21. Mercury in Sweteners incl. honey (Cat 11) Data only for DE, UK. The mean mercury intake was 0.051 µg/day for DE and 0.19 µg/day for UK.. Table 5.22. Mercury in salt, spices, soups, sauces, salads, protein products, etc (Cat 12) No data for AU, BE, DK, FI, HE, IR, IT, NO, PT, SP, SE, UK. The mean mercury intake was in the range 0.09µg/day (NL) – 0.49 µg/day (FR). FR and DE presented high level intake (respectively 1.23 and 0.05 µg/day. FR: excluding soups Table 5.23. Mercury in Non-alcoholic ("soft") beverages (Cat. 14.1) No data for AU, BE, FI, HE, IR, IT, NL, NO, PT, SP, SE. The mean intake was in the range 0.18µg/day (FR) – 0.73 µg/day (DK). FR and DE presented the only high level intake value: 0.46 µg/day (FR), 0.84 µg/day (DE). FR and DE presented values for water, respectively 0.042 and n.d?.

SCOOP 3.2.11 – Intake of As, Cd, Pb and Hg
105
DK and UK: total beverages. FR and DE: excluded water. FR: 556g/day – 0.042 µg/day. DE: 260g/day – 0.049 µg/day including mineral water. Table 5.24. Mercury in Alcoholic beverages, incl. alcohol-free and low-alcoholic counter (Cat. 14.2) FR and DE presented the mean mercury intake values (0.23 µg/day, FR - 0.117 µg/day, DE). Table 5.25. Mercury in Ready to eat (Cat 15) UK presented the only mean mercury intake value: 0.01 µg/day. Table 5.26. Mercury in composite foods (Cat 16) Only NL and NO presented mean mercury intake, respectively 0.04 and 4.06µg/day. NO presented the only high level mercury intake value: 18.47 µg/day. Table 5.7. Mercury in Dairy products, excluding products of category 2: Milk (Cat. 1.1-1.5) Member State Consumption (g/day) Mean level in
food (µg/g) Intake (µg/day) % of total
dietary intake Mean level High level Mean l. High l. BELGIUM 238.36 674.73 0.00053 0.127 0.360 5 DENMARK 357 0.0010 0.35 10.0 U. K. 281 0.0004 0.11 4
Table 5.8. Mercury in Dairy products, excluding products of category 2: Cheese (Cat. 1.6) Member State Consumption (g/day) Mean level in
food (µg/g) Intake (µg/day) % of total
dietary intake Mean level High level Mean l. High l. DENMARK 33 0.0009 0.03 0.9 GERMANY 41.35 111.7 0,003-0.004 0.165 0.446 2.3 U. K. 60 175.50 0.002 0.12 4
Table 5.9. Mercury in Fats and Oils (Cat. 2) Member State Consumption (g/day) Mean level in
food (µg/g) Intake (µg/day) % of total
dietary intake Mean level High level Mean l. High l. DENMARK 48 0.0004 0.02 0.6 GERMANY 20.53 50.7 0.006 0.123 0.304 1.1 U. K. 27 0.003 0.08 3

SCOOP 3.2.11 – Intake of As, Cd, Pb and Hg
106
Table 5.10. Mercury in Fruit (Cat. 4.1) Member State Consumption (g/day) Mean level in
food (µg/g) Intake (µg/day) % of total
dietary intake Mean level High level Mean l. High l. DENMARK 180 0.0017 0.31 8.8% FRANCE* 349.2 695.7 0.006 2.22 4.43 26.2 FRANCE** 3.8 25.0 0.334 1.27 8.34 15 GERMANY 102.5 292.7 0.002 0.205 0.585 5.7 the NETHERLANDS 360 0.003 1.05 58 NORWAY 83.70 279.30 0.001 0.05 PORTUGAL 78.10 287.50 0.001 0.06 U. K. 113 0.001 0.08 2
* excluding mushrooms. ** mushrooms only
Table 5.11. Mercury in Vegetables incl. mushrooms & fungi, roots , tubers, pulses, legumes, nuts and seeds (Cat. 4.2) Member State Consumption (g/day) Mean level in
food (µg/g) Intake (µg/day) % of total
dietary intake Mean level High level Mean l. High l. DENMARK 241 0.0012 0.30 8.5% GERMANY 249.62 507.65 0.002-0.103 3.27 8.03 13.9 U. K. 266 0.00085 0.21 <8
Table 5.12.Mercury in Confectionary (Cat. 5) Member State Consumption (g/day) Mean level in
food (µg/g) Intake (µg/day) % of total
dietary intake Mean level High level Mean l. High l. DENMARK 30 0 0 0 GERMANY 5.86 28.6 0.3
Table 5.13 Mercury in Cereals and cereal products, incl. flours & starches from roots & tubers, pulses & legumes, excluding bakery (Cat. 6) Member State Consumption (g/day) Mean level in
food (µg/g) Intake (µg/day) % of total
dietary intake Mean level High level Mean l. High l. DENMARK 217 0.0027 0.58 16.5% FRANCE 62.9 164.3 0.019 1.16 3.04 13.7 GERMANY 187.93 343.15 0.007 1.316 2.402 10.5 the NETHERLANDS 42 0.003 0.12 7 U. K. 101 0.004 0.4 13

SCOOP 3.2.11 – Intake of As, Cd, Pb and Hg
107
Table 5.14. Mercury in Bakery Wares (Cat 7) Member State Consumption (g/day) Mean level in
food (µg/g) Intake (µg/day) % of total
dietary intake Mean level High level Mean l. High l. the NETHERLANDS 178 0.002 0.30 17 U. K. 108 261.30 0.002 0.22 7
Table 5.15. Mercury in Meat and meat products, including poultry and game (Cat. 8). Member State Consumption (g/day) Mean level in
food (µg/g) Intake (µg/day) % of total
dietary intake Mean level High level Mean l. High l. DENMARK 136 0.0015 0.20 5.7% FRANCE 153.7 291.4 GERMANY 174.96 389.4 0.004-0.012 1.615 3.64 9.7% IRELAND 87 193 0.006 0.41 0.94 U. K. 88 0.002 0.2 <7
Table 5.16. Mercury in Offals (Cat. 8) Member State Consumption (g/day) Mean level in
food (µg/g) Intake (µg/day) % of total
dietary intake
Mean level High level Mean l. High l. GERMANY 1.95 17.9 0.005 0.010 0.090 0.11 IRELAND 0.88 0.01 0.009 PORTUGAL 2.185 0.04 0.0874 U. K. 1 0.005 0.01 <1

SCOOP 3.2.11 – Intake of As, Cd, Pb and Hg
108
Table 5.17. Mercury in Fish and fish products, including molluscs, crustaceans and echinoderms (MCE) (Cat. 9) Member State Consumption (g/day) Mean level
in food (µg/g)
Intake (µg/day) % of total dietary intake
Mean level High level Mean l. High l. BELGIUM 13.37 47.79 0.189 2.523 9.019 91 DENMARK 23 0.0417 0.96 27.4 FINLAND 53 0.035-0.380 6.2 100 FRANCE* 29.8 82.9 – 21.4 0.06-0.381 2.73 4.96 – 8.16 32.2 GERMANY 16.9 63.4 0.029-0.173 2.819 10.695 0.94 GREECE 18 71 0.108-0.143 4.513 87.18 IRELAND 23.31 74.86 0.07 0.96 3.5 ITALY 0.10-0.33 8.6 100 the NETHERLANDS 10 0.019 0.19 11 NORWAY* 70.4 237.6 0.005-1.082 3.3374 18.48 82.1 PORTUGAL 40.5 0.32 13.10 SWEDEN 30.1 0.02—0.23 2.7 100 U. K. 14 0.043 1.00 33
* excluding molluscs, crustaceans and echinoderms (MCE) Table 5.18. Mercury in Bivalves molluscs Member State Consumption (g/day) Mean level in
food (µg/g) Intake (µg/day) % of total
dietary intake Mean level High level Mean l. High l. FRANCE* 2.4 16.4 0.024 0.06 0.40 0.7 GERMANY 0.78 1.9 0.029 0.023 0.055 0.04 GREECE 2.6 18 0.0234 0.06084 0.4212 1.18 IRELAND 0.084 0.02 0.002 PORTUGAL 10.1 0.0795 0.0795 0.803 U. K. 14.00 55.20 0.043 0.60
* molluscs and cephalopods Table 5.19. Mercury in Crustaceans Member State Consumption (g/day) Mean level in
food (µg/g) Intake (µg/day) % of total
dietary intake Mean level High level Mean l. High l. BELGIUM 1.83 12.75 0.065 0.119 0.829 4 FRANCE 2.3 14.3 0.041 0.09 0.58 1.1 GREECE 2.6 18 0.2318 0.60268 4.1724 11.64 IRELAND 0.57 2.59 0.09 0.05 0.29 NORWAY 10 37 0.02-.185 0.724 2.396 17.9
Table 5.20. Mercury in Eggs and eggs products (Cat.10)

SCOOP 3.2.11 – Intake of As, Cd, Pb and Hg
109
Member State Consumption (g/day) Mean level in food (µg/g)
Intake (µg/day) % of total dietary intake
Mean level High level Mean l. High l. DENMARK 21 0.0014 0.03 0.9 FRANCE 20.0 62.9 GERMANY 33.42 81 0.005 0.167 0.405 1.9 U. K. 14 0.001 0.02 <1
Table 5.21. Mercury in Sweteners incl. honey (Cat 11) Member State Consumption (g/day) Mean level in
food (µg/g) Intake (µg/day) % of total
dietary intake Mean level High level Mean l. High l. FRANCE 15.9 49.7 GERMANY 13.020 54.050 <0.002-0.004 0,051 0.208 0.72 PORTUGAL 31.3 0.00125 0.391 U. K.* 63 0.003 0.19 6
* Sugar and preserves Table 5.22. Mercury in Salt, spices, soups, sauces, salads, protein products, etc (Cat 12) Member State Consumption (g/day) Mean level in
food (µg/g) Intake (µg/day) % of total
dietary intake Mean level High level Mean l. High l. FRANCE* 9.3 23.3 0.053 0.49 1.23 5.8 GERMANY 2.26 6.0 0.003-0.011 0.020 0.048 0.13 the NETHERLANDS 79 0.001 0.09 5
* Excluding soups Table 5.23. Mercury in Non-alcoholic ("soft") beverages (Cat. 14.1) Member State Consumption (g/day) Mean level in
food (µg/g) Intake (µg/day) % of total
dietary intake Mean level High level Mean l. High l. DENMARK 2003 0.0004 0.73 20.8 FRANCE* 373.8 962.9 0.00048 0.18 0.46 2.1 GERMANY 68.89 290 n.d. 0.193 0.841 3.8 GERMANY* 329 1051 n.d. 0.193
0.242 0.841 0.605
3.8 18.2
U. K. 937 0.0004 0.37 12 * including water

SCOOP 3.2.11 – Intake of As, Cd, Pb and Hg
110
Table 5.24. Mercury in Alcoholic beverages, incl. alcohol-free and low-alcoholic (Cat. 14.2) Member State Consumption (g/day) Mean level in
food (µg/g) Intake (µg/day) % of total
dietary intake
Mean level High level Mean l. High l. FRANCE* 159.9 628.6 0.00141 0.23 0.88 2.7 GERMANY* 46.95 222.2 <0.005 0.117 0.556 2.6
* only wine Table 5.25. Mercury in Ready to eat (Cat. 15) Member State Consumption (g/day) Mean level in
food (µg/g) Intake (µg/day) % of total
dietary intake Mean level High level Mean l. High l. U. K. 2 0.003 0.01 <1
Table 5.26. Mercury in composite foods (Cat 16) Member State Consumption (g/day) Mean level in
food (µg/g) Intake (µg/day) % of total
dietary intake Mean level High level Mean l. High l. the NETHERLANDS 282 0.0002 0.04 2 NORWAY 4.061* 18.474 100
5.8 Estimated daily intake of total mercury by other population groups The UK is the only Member State that has complete intake studies for other population groups. The data from the UK and the available data from other Member States are presented in tables 5.27 – 5.30. Table 5.27. Mercury Daily Intake (µg/day) by the Mean Adult Population. High Level. Food group BE FR DE HE IR NO Milk and Dairy Products 0.36 0.445 Fats and oils 0.30 Fruit and vegetables 4.43 – 8.34 8.63 Cereals and Bakery Ware 3.04 2.40 Meat and offal 3.65 0.96 Fish 9.02 4.96 – 8.16 10.64 17.80 3.5 16.08 Bivalves, cephalopods and crustaceans
0.83 0.4 - 0.58 0.06 4.59 0.28 2.40
Eggs 0.405 Sweeteners 0.021 Salt and spices 1.23 0.05 Beverages 0.09 – 0.46 –
0.88 1.51

SCOOP 3.2.11 – Intake of As, Cd, Pb and Hg
111
Table 5.28. Mercury Daily Intake (µg/day) by Consumers Only. Mean level. Food group BE FR DE HE IR IT NO UK Milk and milk products 0.132 0.09 Condensed, powder milk, cheese, youghurt
0.17 0.11
Fats and oils 0.12 0.05 Fruit and vegetables 2.22 – 6.41 3.8 0.30 Confectionary 0.05 Cereals and bakery wares 1.26 1.32 0.71 Meat 1.73 0.42 0.3 Offal 0.07 0.2 0.09 Fish and fish products 4.46 2.18 – 5.77 5.14 10.30 .1.41 8.6 11.0 1.44 Bivalves, cephalopods and crustaceans
0.60 0.31 – 0.61 0.42 9.44 0.7 1.35 0.6
Eggs 0.17 0.04 Sweeteners 0.03 0.08 0.08 Salts and spices 0.52 0.52 0.02 Beverages 0.05 0.04 – 0.18
– 0.32 0.49 0.27
Ready to eat 0.02 Total consumery intake 3.1 Table 5.29. Mercury Daily Intake (µg/day) by Consumers Only. High level. Food group BE FR DE HE IR NO UK Milk, milk products 0.365 0.25 Condensed, powder milk, cheese, youghurt
0.45 0.34
Fats and oils 0.30 0.13 Fruits and vegetables 4.43 – 14.3 9.30 0.59 Confectionary 0.21 Cereals and bakery wares 3.07 2.40 1.64 Meat 3.18 0.95 0.71 Offal 0.18 0.57 0.32 Fish and fish products 10.36 5.4 – 16.3 13.25 23.82 4.1 34.06 4.23 Bivalve, crustaceans and cephalopods
1.90 0.74 – 1.37 1.07 24.24 1.94 4.25 2.37
Eggs 0.41 0.1 Sweeteners 0.25 0.29 Salts and spices 1.25 0.05 Beverages 0.10 – 0.46 –
1.05 1.81 0.66
Ready to eat 0.07
Total Consumer Intake 6.4
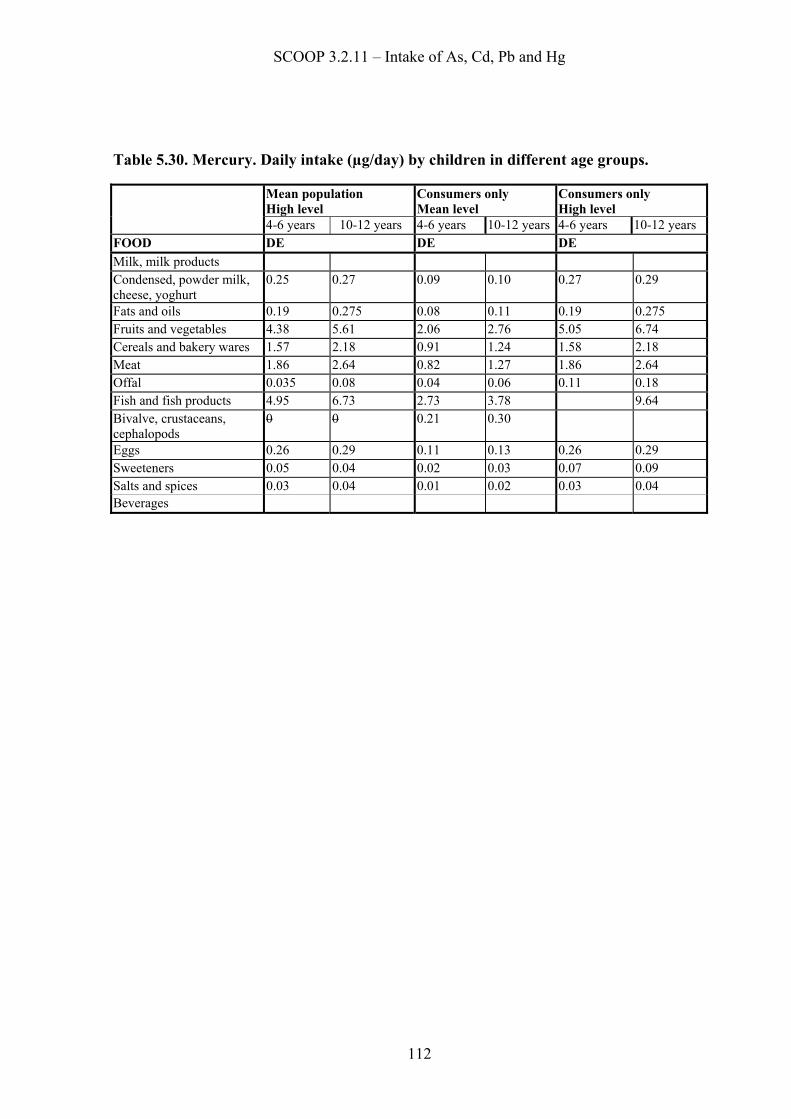
SCOOP 3.2.11 – Intake of As, Cd, Pb and Hg
112
Table 5.30. Mercury. Daily intake (µg/day) by children in different age groups.
Mean population High level
Consumers only Mean level
Consumers only High level
4-6 years 10-12 years 4-6 years 10-12 years 4-6 years 10-12 years FOOD DE DE DE Milk, milk products Condensed, powder milk, cheese, yoghurt
0.25 0.27 0.09 0.10 0.27 0.29
Fats and oils 0.19 0.275 0.08 0.11 0.19 0.275 Fruits and vegetables 4.38 5.61 2.06 2.76 5.05 6.74 Cereals and bakery wares 1.57 2.18 0.91 1.24 1.58 2.18 Meat 1.86 2.64 0.82 1.27 1.86 2.64 Offal 0.035 0.08 0.04 0.06 0.11 0.18 Fish and fish products 4.95 6.73 2.73 3.78 9.64 Bivalve, crustaceans, cephalopods
0 0 0.21 0.30
Eggs 0.26 0.29 0.11 0.13 0.26 0.29 Sweeteners 0.05 0.04 0.02 0.03 0.07 0.09 Salts and spices 0.03 0.04 0.01 0.02 0.03 0.04 Beverages

SCOOP 3.2.11 – Intake of As, Cd, Pb and Hg
113
5.9 Occurrence summary table for total mercury This table contain summaries of occurrence data that has been used in the intake calculation. It provides information on the mean concentration level, median levels where available and min and max values.
Table 5.31. Mercury. Occurrence summary data for individual food samples. Unit: mg/kg. Food group code
Food name No. of samples
Reference Year of sampling
Type of water1
Mean level of total Hg
Median level of total Hg
Min Max
Belgium
1 Dairy product 1 125 0.000533 < 0.001 0.0038 2 Dairy product 2 91 < 0.004 0.0044 8 wild muscle 2 2001 < 0,01 9 fish 188 0.188743 < 0.01 2.121 10 bivalves.cephalopods 42 < 0.01 0.221 11 crustaceans 40 0.065054 < 0.01 0.159 15 Dietetic formulae 5 2002 0.034 0.015 0.1
Denmark
Meat 566 DK-002 1993-97 <0,007 <0,007 <0,007 0.391 Fish 225 DK-002 1993-97 0.052 0.051 0.011 0.201 Eggs 30 DK-002 1993-97 0.002 0.002 0.000 0.007
Finland 9.1.1 pike 8 FI 007 2002 0.412 0.152 0.849 9.1.1 perch 15 FI 007 2002 0.255 0.078 1.35 9.1.1 sprat 6 FI 007 2002 0.024 0.005 0.030 9.1.1 pike perch 10 FI 007 2002 0.203 0.057 0.369 9.1.1 bream 2 FI 007 2002 0.083 0.08 0.085 9.1.1 salmon 15 FI 007 2002 0.068 0.046 0.096 9.1.1 Rainbow trout 18 FI 007 2002 0.031 <0.005 0.048 9.1.1 vendace 7 FI 007 2002 0.084 0.019 0.137 9.1.1 burbot 7 FI 007 2002 0.240 0.019 0.349 9.1.1 powan 3 FI 007 2002 0.083 0.061 0.096 9.1.1 Baltic herring 32 FI 007 2002 0.035 <0.005 0.107 9.4 Canned tuna 13 FI 104 2002 0.16 <0.05 0.48
France 4 Fruits and vegetables,
excl. Mushrooms 57 FR 006 2000-2001 0.006 < 0.001 0.099
4 bis Mushrooms 65 FR 006 2000-2001 0.334 0.002 2.40 6 Cereals and cereal
products 68 FR 006 2000-2001 0.019 0.003 0.115
9 Fish and fish products 617 FR 004-FR 006
2000-2001 0.060 < 0.0003 0.857
10 3.3.1.1.of regulation 466/2001
142 FR 004-FR 006
2000-2001 0.381 < 0.004 4.30
11 Molluscs and cephalopods
145 FR 004-FR 006
2000-2001 0.024 < 0.0013 0.325
12 Crustaceans and echinoderm
6 FR 006 2000 0.041 0.030 0.065
15 Salts, spices, sauces, excl. Soups
149 FR 006 2000-2001 0.053 < 0.000075 0.590

SCOOP 3.2.11 – Intake of As, Cd, Pb and Hg
114
Food group code
Food name No. of samples
Reference Year of sampling
Type of water1
Mean level of total Hg
Median level of total Hg
Min Max
France cont. 17 Waters 133 FR 006 2000-2001 < 0.000075 < 0.000075 < 0.00008 18 Soft beverages 33 FR 006 2000-2001 0.00048 < 0.000075 0.0025 19 Alcoholic beverages 43 FR 006 2000-2001 0.00141 < 0.000075 0.009 Germany 1.1 &1.3 milk 89 1997-2002 0.004 <0.002 <0.01 1.5 Milk powder 9 1998 0.003 <0.005 1.6 cheese 155 1997-2000 0.004 <0.001 0.02 2 oil 36 1998-2002 0.006 <0.002 0.065 4.1 fruits 104 1997-2001 0.002 <0.0002 0.018 4.1.2.2 dried fruits 28 1997-2001 0.002 <0.001 0.023 4.2 nuts and seeds 483 1997-2002 0.004 <0.001 0.06 4.2 vegetable 626 1997-2002 0.011 <0.0002 1.77 4.2 fungi 203 1997-2002 0.103 <0.001 1.31 4.2.2.2 dried vegetables 53 2000-2002 0.736 <0.002 4.7 4.2.2.2 dried algae 13 2000 0.009 <0.01 0.14 4.2.2.2 dried fungi 36 1998-2002 1.22 0.01 4.45 4.2.2.6 cocentrated tomato 36 2000-2001 0.002 <0.001 <0.01 6 and 7 cereals, cereal products,
bakery wares 191 1998-2002 0.007 <0.001 0.49
8.1 fresh meat 574 1997-2002 0.012 <0.001 1 8.1 game 328 1997-2002 0.004 <0.0008 0.05 8.4 offal 1935 1997-2002 0.005 <0.0008 0.1 8.5, 8.3 and 8.2
processed meat 246 1998-2002 0.006 <0.0008 0.25
9.1 without 9.1.2 to 9.1.4
fish 3296 1997-2002 0.173 <0.0008 5.8
9.1.2 to 9.1.4
bivalves, crustaceans, squids
687 1997-2002 0.029 <0.0008 0.66
10.1 eggs 26 1997-2000 0.005 <0.01 0.01 11.1 sugar 12 1998-2001 0.004 <0.01 11.3 honey 99 1997-2002 0.004 <0.001 0.045 11.4 sweeteners 2 1998-2000 0.002 <0.002 12.1 salt 5 2001-2002 0.011 <0.002 0.024 12.2 herbs and spices 226 1997-2002 0.003 <0.001 0.051 13.1 & 13.2
infant food 267 1997-2002 0.004 <0.001 0.02
13.6 food supplements 37 1998-2002 0.03 <0.001 0.317 14.1.1 water 2092 1997-2002 0.00019 <0.0001 <0.05 14.1.2 & 14.1.3
fruit juice 21 1998-2000 0.003 <0.002 <0.005
14.1.5 tea and coffee 148 1997-2002 0.01 <0.002 0.041 14.2.3 wine 13 2000 0.003 <0.005
Greece 9.1.1 Fresh fish 18 1999-2000 0.1387 0.0250 0.8230 9.1.1.5 Grey mullet 4 2002 0.1275 0.1300 0.1200 0.1300 9.1.1.13 bass 6 1999-2000 0.0478 0.0300 0.0800 9.1.1.28 swordfish 3 2000-2002 0.3773 0.2680 0.4320

SCOOP 3.2.11 – Intake of As, Cd, Pb and Hg
115
Food group code
Food name No. of samples
Reference Year of sampling
Type of water1
Mean level of total Hg
Median level of total Hg
Min Max
Greece cont. 9.1.1.30X1 Chrysophrys auratus 40 1998-2002 0.0619 0.0040 0.1140 9.1.1.30X2 Common Pantora 1 2000 0.1650 0.1650 0.1650 0.1650 9.1.1.30X3 bogue 5 1999-2001 0.0577 0.0205 0.0900 9.1.1.30 X5 Cuttlefish 3 2001 0.1000 0.0520 0.0170 0.2320 9.1.1.30 X6 Perch 3 2001 0.1627 0.1290 0.1140 0.2450 9.1.1.30 X7 Seabream 3 2001 0.1470 0.1300 0.0800 0.2310 9.1.1.30 X8 Small fish eaten whole 10 2001 0.0830 0.0570 0.0350 0.2050 9.1.2.1 Mussels 2 2001 0.0285 0.0285 0.0160 0.0410 9.1.3.2 Squid 2 2001 0.0365 0.0365 0.0350 0.0380 9.1.3.3 Octopus 2 2001 0.0515 0.0515 0.0250 0.0780 9.1.2 Fresh bivalve molluscs 15 2000-2002 0.0231 0.0052 0.0490 9.1.2.1 Mussels 54 2001-2002 0.0215 0.0015 0.0310 9.1.2.2 Oysters 1 2002 0.0120 0.0120 0.0120 0.0120 9.1.3 Fresh cephalopodes 1 2001 <0.01 9.1.3.2 Octopus 2 2000 0.0450 0.0450 0.0200 0.0700 9.1.4 Fresh crustaceans 2 1998 0.2500 0.2500 0.2000 0.3000 9.1.4.2 Lobsters 1 2000 0.1010 0.1010 0.1010 0.1010 9.1.4.3 shrimp 6 1999 0.2476 0.2300 0.1657 0.3900
9.2.1
Frozen fish. fish fillets and fish products incl. MCE 580 1999-2002 0.1200 <0.003 3.7020
9.4 canned fish 17 1999 0.2721 0.0100 0.4700 9.4.1 Fish canned in oil 28 1999-2002 0.1020 0.0030 0.4500 9.4.2 Fish canned in brine 22 1999-2002 0.0992 <0.003 0.6150 9.4.3 Fermented fish 136 1999-2002 0.0652 <0.003 0.5450 9.4.4.X1 Smoked hering 3 2000-2002 0.0457 0.0370 0.0630
Ireland acid casein powder 43 1995 0.0050 < 0.01 < 0.01
rennet casein powder 33 1995 0.0050 < 0.01 < 0.01
skim milk powder 71 1995 0.0050 < 0.01 < 0.01
Beef 125 1997 0.0050 < 0.01 < 0.01
Beef (Muscle, Liver, Kidney)
89 2000 - 2001 0.0037 < 0.001 < 0.02
Lamb (Muscle, Liver, Kidney)
22 2000 - 2001 0.0053 < 0.001 < 0.02
Pork 100 1997 0.0050 < 0.01 < 0.01
Pork (Muscle, Liver, Kidney)
10 2000 0.0005 < 0.001 < 0.001
Poultry 28 2000 - 2001 0.0088 < 0.015 < 0.02
FARM GAME LIVER 7 2001 0.0100 < 0.02 < 0.02
Anchovies 1 2001 0.0500 0.0500 0.0500
Black jack 10 1998 0.0400 0.0400 0.0400
Black sole 99 1996 - 2000 0.0830 0.0300 0.2100
Butterfish/Bass 1 2001 1.0500 1.0500 1.0500
C.Gigas 724 1996 - 2000 0.0279 0.0200 0.0500
Cod 193 1996 - 2001 0.0634 0.0100 0.1900

SCOOP 3.2.11 – Intake of As, Cd, Pb and Hg
116
Food group code
Food name No. of samples
Reference Year of sampling
Type of water1
Mean level of total Hg
Median level of total Hg
Min Max
Ireland cont. Cuckoo ray 30 1996 0.0800 0.0700 0.0900
Forkbeard 10 1997 0.0900 0.0900 0.0900
Gurnard 10 1999 0.0900 0.0900 0.0900
Haddock 154 1996 - 2001 0.0795 0.0100 0.2700
Hake 82 1996 - 2001 0.0790 0.0300 0.1500
Herring 32 1996 - 2001 0.0760 0.0400 0.1000
John dory 10 1996 0.0700 0.0700 0.0700
Kipper Fillets 2 2001 0.0400 0.0200 0.0600
Lemon sole 71 1996 - 2001 0.0713 0.0300 0.1400
Ling 49 1996 - 2000 0.1680 0.1100 0.2900
LOBSTER 1 2001 0.3400 0.3400 0.3400
M.edulis 2150 1996 - 2000 0.0209 0.0200 0.0400
Mackerel 129 1996 - 2001 0.0410 0.0200 0.0800
Megrim 110 1996 - 2000 0.0900 0.0200 0.3300
monk/angler fish 90 1996 - 2000 0.1267 0.0800 0.1800
Norway lobster 50 1996 0.0900 0.0800 0.1000
O.edulis 300 1996 - 2000 0.0309 0.0200 0.0500
Plaice 187 1996 - 2001 0.0474 0.0100 0.1000
Pollack 10 1996 0.0500 0.0500 0.0500
Pollock 19 2000 0.1250 0.0500 0.2000
Prawns 121 1997 - 2001 0.1143 0.0200 0.2400
Rainbow Trout 1 2001 0.0500 0.0500 0.0500
Saithe 5 1999 0.2500 0.2500 0.2500
Salmon 321 1999 - 2001 0.0381 0.0200 0.0900
Salmon (tinned) 1 2001 0.0200 0.0200 0.0200
Sardines 4 2001 0.0263 0.0200 0.0500
Scottish Brisling 1 2001 0.0200 0.0200 0.0200
Skate/Ray 45 1998 - 2000 0.0800 0.0300 0.1000
Skippers 1 2001 0.0500 0.0500 0.0500
Sole Fillet Loose 1 2001 0.0200 0.0200 0.0200
Torsk 9 1999 0.1600 0.1600 0.1600
Trout 51 1999 - 2001 0.0459 0.0256 0.1000
Tuna 14 1998 - 2001 0.1667 0.0600 0.5500
Tuna (tinned) 1 2001 0.0300 0.0300 0.0300
White Crab Meat 2 2001 0.0850 0.0700 0.1000
White sole 20 1996 0.2000 0.1300 0.2700
Whiting 161 1996 - 2001 0.0733 0.0100 0.2000
Witch 20 2000 0.0850 0.0800 0.0900
Wolf-fish 10 1999 0.1900 0.1900 0.1900
Cod (processed) 28 2001 0.0280 0.0100 0.0600

SCOOP 3.2.11 – Intake of As, Cd, Pb and Hg
117
Food group code
Food name No. of samples
Reference Year of sampling
Type of water1
Mean level of total Hg
Median level of total Hg
Min Max
Ireland cont. Crab Flakes 1 2001 0.0050 < 0.01 < 0.01
Fish portions, fingers, etc.
9 2001 0.0156 <0.0100 0.0500
Frozen Fish 1 2001 0.0300 0.0300 0.0300
Frozen Prawns 1 2001 0.0900 0.0900 0.0900
Salmon Pate 1 2001 0.0300 0.0300 0.0300
Whiting 2 2001 0.0200 0.0200 0.0200
Kippers 1 2001 0.0400 0.0400 0.0400
Roolmop Herring 1 2001 0.0100 0.0100 0.0100
Smoked Fish 1 2001 1.2600 1.2600 1.2600
Smoked Haddock 2 2001 0.1400 0.1000 0.1800
Smoked Kippers 5 2001 0.0520 0.0100 0.0800
Smoked Mackerel 9 2001 0.0622 0.0300 0.0900
Smoked Mussels 1 2001 0.0050 < 0.01 < 0.01
Smoked Salmon 2 2001 0.0350 0.0200 0.0500
Smoked Tuna 1 2001 0.0300 0.0300 0.0300
Woodoak Smoked Sprat
1 2001 0.0500 0.0500 0.0500
Brisling (tinned) 1 2001 0.0400 0.0400 0.0400
Mackerel (tinned) 1 2001 0.0400 0.0400 0.0400
Pink Salmon 5 2001 0.0320 0.0200 0.0500
Red Salmon 5 2001 0.0460 0.0200 0.0800
Salmon (tinned) 3 2001 0.0217 0.0300 0.0300
Sardines (tinned) 5 2001 0.0430 0.0400 0.0700
Tuna (tinned) 14 2001 0.1071 0.0100 0.2900
Cinnamon 1 2001 0.0100 0.0100 0.0100
Tuna Salad 1 2001 0.0300 0.0300 0.0300
Haddock & Pasta Bake
1 2001 0.0400 0.0400 0.0400
Note: Table does not include all occurrence data (excluded are not quantified data and data from highly contaminated areas. For these please see main table in the Annex Italy 9.1.3.2 Spider octopus 300 IT-011 1997 0.27 0.18 0.42 9.1.3.1 Broadtail squid 212 IT-011 1997 0.07 0.05 0.12 9.1.1.29 Tuna 97 IT-017 1997 0.21* 9.1.1.25 Shark (all species) 54 IT-017 1997 0.45* 9.1.3.1 Calamary 109 IT-017 1997 0.09* 9.1.3.2 Octpus 118 IT-017 1997 0.11* 9.1.3.3 Cuttle-fish 92 IT-017 1997 0.10* 9.1.3.1 Squid 45 IT-017 1997 0.13* 9.1.4.3 Prawn & shrimp 111 IT-017 1997 0.10* 9.1.1.30 Cod & hake 233 IT-017 1997 0.12* 9.1.1.30 Sole 106 IT-017 1997 0.11* 9.1.1.30 Plaice 11 IT-017 1997 0.10* 9.1.1.30 Salmon 12 IT-017 1997 0.09* 9.1.1.8 Pilchard 164 IT-017 1997 0.11*

SCOOP 3.2.11 – Intake of As, Cd, Pb and Hg
118
Food group code
Food name No. of samples
Reference Year of sampling
Type of water1
Mean level of total Hg
Median level of total Hg
Min Max
Italy cont. 9.1.1.9 European anchovy 198 IT-017 1997 0.09* 9.1.1.30 Mackerel 61 IT-017 1997 0.13* 9.1.2.1 Mussel 209 IT-017 1997 0.10* 9.1.2.3 Venus & Carpet shell 96 IT-017 1997 0.08* 9.1.4.3 Squill or mantis shrimp 720 IT-004 1998 0.14 0.05 0.23
the Netherlands anchovy 1 NL/003 1998 0.05 anchovy 10 NL/003 2001 0.051 0.045 0.01 0.13 flounder 1 NL/003 1999 0.14 trout 2 NL/003 1999 0.015 0.015 0.01 0.02 shrimp 6 NL/003 1999 0.027 0.03 0.02 0.03 mixed vegetables 1 NL/003 1998 0.003 herring 1 NL/003 1998 0.04 herring 2 NL/003 1999 0.03 0.03 0.03 0.03 herring 8 NL/003 2001 0.032 0.03 0.1 0.08 heek 2 NL/003 1999 0.05 0.05 0.04 0.06 squid 1 NL/003 1998 0 Squid 1 NL/003 1999 0.01 squid 3 NL/003 2001 0.03 0.03 0.01 0.05 cod fish 4 NL/003 1999 0.062 0.055 0.03 0.11 crab 1 NL/003 1997 0.033 crab 3 NL/003 2001 0.05 0.05 0.04 0.06 mackerel 3 NL/003 1998 0.034 0.03 0.02 0.052 mackerel 1 NL/003 1999 0.02 mackerel 5 NL/003 2001 0.04 0.03 0.01 0.08 Nile perch 1 NL/003 1999 0.06 oysters 1 NL/003 2001 0.01 other shelfish 1 NL/003 2001 0.02 other fish products 3 NL/003 1997 0.02 0.03 0.005 0.03 other fish products 1 NL/003 1999 0.03 other fish products 16 NL/003 2001 0.037 0.02 0.005 0.17 other fish species 13 NL/003 1999 0.085 0.05 0.01 0.34 other fish species 5 NL/003 2001 0.155 0.08 0.005 0.42 other fish species 9 NL/003 2002 0.314 0.31 0.2 0.56 eel 3 NL/003 1999 0.057 0.04 0.02 0.11 eel 1 NL/003 2001 0.08 gurnard 1 NL/003 1999 0.16 sardines 3 NL/003 1997 0.035 0.037 0.029 0.038 sardines 4 NL/003 1998 0.071 0.086 0.01 0.101 sardines 26 NL/003 2001 0.03 0.01 0.01 0.16 dab 7 NL/003 1999 0.08 0.08 0.02 0.15 haddock 1 NL/003 2001 0.01 haddock 3 NL/003 1999 0.05 0.05 0.04 0.06 plaice 9 NL/003 1999 0.038 0.04 0.02 0.06 St jacob shells 1 NL/003 1999 0.01 lemon sole 6 NL/003 1999 0.063 0.04 0.01 0.19 tuna 4 NL/003 1997 0.123 0.138 0.036 0.178 tuna 4 NL/003 1998 0.019 0.19 0.03 0.035 tuna 1 NL/003 1999 0.28 tuna 14 NL/003 2001 0.196 0.105 0.05 0.77 whiting 3 NL/003 1999 0.043 0.02 0.02 0.09

SCOOP 3.2.11 – Intake of As, Cd, Pb and Hg
119
Food group code
Food name No. of samples
Reference Year of sampling
Type of water1 Mean level of total Hg
Median level of total Hg
Min Max
the Netherlands cont. salmon 5 NL/003 1997 0.036 0.037 0.031 0.04 salmon 1 NL/003 1999 0.02 salmon 3 NL/003 2001 0.043 0.04 0.01 0.08
Norway 9 Saltwater fish 580 1994-2000 0.0595 0.004 0.26 9 Freshwater fish 1135 1997-2001 0.2936 0.024 3.98 9 Shellfish 75 1994-1996 0.0908 0.02 0.191
Portugal tomate paste 1 PT-040 2001 0.03 0.03 0.03 0.03 cereal flour 7 PT-050 200-2001 0.056 0.03 0.09 breakfast cereals 10 PT-040 2001 0.001 0.003 bread 3 PT-040 2001 0.001 0.062
liver(bovine,caprine,quail,rabbit,chicken,wild boar, ovine, turkey, pork, deer equine)
274 PT-050 2001 0.03 0.01 0.10
fresh fish 515 PT040,020, 061,110,064,062,063,064
1998-2002 0.3235 0.01 1.66
bivalves e molluscs 62 PT-020, 061,110,062
1998-2002 0.0795 0.01 0.19
canned fish 7370 PT-020, 065,110,120,040
1990-2002 <0.005 1.27
sugar 11 PT-020 2002 <0.025 <0.025 <0.025 <0.025 salt 9 PT-040 2000 0.03
Sweden 9.1.1 Fish 333 SE 002.003 1992-93, 2001 0.21 0.01 2.2
United Kingdom Total Diet Study 1.2.2.2 Dairy produce 20 0 1997 0.002 <0.001 0.002 1.1 Milk 20 0 1997 0.0004 <0.0004 0.0004 2 Oil & fats 20 0 1997 0.003 <0.003 0.004 4.1.1 Fresh fruit 20 0 1997 0.0006 <0.00006 0.0006 4.1.2 Fruit products 20 0 1997 0.0008 <0.0006 0.003 4.2 Green vegetables 20 0 1997 0.0004 <0.0004 0.0005 4.2 Other Vegetables 20 0 1997 0.0006 <0.0006 0.0008 4.2 Potatoes 20 0 1997 0.001 <0.001 <0.001 4.2.2.4 Canned vegetables 20 0 1997 0.0009 <0.0006 0.0067 4, 5, 11 Sugar and preserves 20 0 1997 0.003 <0.003 <0.003 6 Miscellaneous cereals 20 0 1997 0.004 <0.001 0.009 7.1.1 Bread 20 UK/010 1997 0.002 <0.001 0.004 8 Carcase meat 20 UK/010 1997 0.001 <0.001 0.003 8 Poultry 20 UK/010 1997 0.002 <0.001 0.006 8.3 Meat Products 20 UK/010 1997 0.003 0.002 0.006 8.4 Offal 20 UK/010 1997 0.0052 0.002 0.0103 9 Fish 20 UK/010 1997 0.043 0.017 0.092 10 Eggs 20 0 1997 0.0013 <0.0009 0.0028 14 Beverages 20 0 1997 0.0004 <0.0004 <0.0004 15.2 Nuts 20 0 1997 0.003 <0.003 <0.003 Ad hoc 9.1.1 Fish and Shellfish 110 UK/003 1996-1997 0.08 0.016 0.24 9.1.2 Fish and Shellfish 9 UK/003 1996-1997 0.03 0.008 0.11

SCOOP 3.2.11 – Intake of As, Cd, Pb and Hg
120
Food group code
Food name No. of samples
Reference Year of sampling
Type of water1 Mean level of total Hg
Median level of total Hg
Min Max
United Kingdom cont. 9.1.3 Fish and Shellfish 3 UK/003 1996-1997 0.04 0.016 0.058 9.1.4 Fish and Shellfish 12 UK/003 1996-1997 0.129 0.051 0.49 9.1 - other2
Fish and Shellfish 7 UK/003 1996-1997 0.032 0.001 0.046
9.2.2 Fish and Shellfish 3 UK/003 1996-1997 0.016 0.006 0.025 13 Infant Foods 96 UK/001/011 1997-1999 0.001 <0.0003 0.01 14 Beverages3 91 UK/004/005 1997 0.002 0.00002 0.03 4, 6, 14, 1, 16, 12, 2
Vegetarian Foods 99 UK/006/007 1997-1998 0.005 0.001 0.008
1, 7, 16, 15, 9, 1, 8, 4, 12, 14, 6
Snack and Convenience foods
298 UK/002 1996-1999 0.007 0.005 0.082
1 Upper bound mean. 2 Cockles and winkles. 3 Including 4 samples of 5.1(dried chocolate drinks) and 3 samples of 1.1.4 (flavoured milks/yoghurts)
References for mercury in 5.1 1. WHO Food Additives series 2000, 44, (safety evaluation of certain Food Additives and Contaminants),313-391. Methylmercury. Bellinger, D. C.; Bolger M.; Carrington C.; Dewailly E.; Magos L. P. A.; Petersen B. 2. Journal of trace elements in experimental medicine 1998, 11(2/3), 303-317. Human toxicology of mercury. Clarkson, Thomas W. 3. Plomb, Cadmium et Mercure dans l’Alimentation: Evaluation et Gestion du Rique 1996,181-183. Toxicological aspects of food contamination by mercury.Part 4.Epidemiological aspects of mercury and methylmercury exposure in the general population. Boisset, M. 4. Journal of Nutrition 2003, 133 (5s-1), 1539s-1543s. Nutitional factors may modify the toxic action of methyl mercury in fish-eating populations. Abernathy, Carles O., Thomas, David J., Calderon, Rebecca L. 5. Plomb, Cadmium et Mercure dans l’Alimentation: Evaluation et Gestion du Rique 1996,171-176. Toxicological aspects of food contamination by mercury. Major toxic effects of mercury and methylmercury in animal and humans. Boisset, M. 6. Neurotoxicology 1998, 19(2), 313-328. A review of methylmercury and child development. Myers Gray J.; Davidson Philip W.; Shamlaye Conrad F. 7. WHO. 2003. Joint FAO/WHO Expert Committee on Food Additives and Contaminants. Sixty-first meeting. Summary and conclusions. Published on the web: ftp://ftp.fao.org/es/esn/jecfa/jecfa61sc.pdf

SCOOP 3.2.11 – Intake of As, Cd, Pb and Hg
121
6. Food Categorisation System
Code Description
0 Food in general, unless otherwise specified
1 Dairy products, excluding products of category 2 1.1 Milk and dairy-based drinks
1.1.1 Milk and buttermilk 1.1.2 Milk, incl, sterilised and UHT goats milk 1.1.3 Buttermilk (Plain) 1.1.4 Dairy-based drinks, flavoured and/or fermented (e.g. chocolate, milk, cocoa, eggnog) 1.2 Fermented and renneted milk products (plain) excluding drinks
1.2.1 Fermented milks (plain) 1.2.2 Non heat-treated after fermentation 1.2.3 Heat-treated after fermentation 1.2.4 Renneted milk 1.3 Condensed milk (plain) and analogues
1.3.1 condensed milk (plain) 1.3.2 Beverage whiteners 1.4 Cream (plain) and the like
1.4.1 Pasteurised cream 1.4.2 Sterilised, UHT, whipping or whipped cream and reduced fat creams 1.4.3 Clotted cream 1.4.4 Cream analogues 1.5 Milk powder and cream powder (plain)
1.5.1 Milk and cream powder 1.5.2 Powder analogues 1.6 Cheese
1.6.1 Unripened cheese 1.6.2 Ripened cheese 1.6.3 Total ripened cheese, includes rind 1.6.4 Rind of ripened cheese 1.6.5 Cheese powder (for reconstitution; e.g., for cheese sauces). 1.6.6 Whey cheese 1.6.7 Processed cheese 1.6.8 Cheese analogues 1.7 Dairy-based desserts (e.g. ice cream, ice milk, pudding, fruit or flavoured yoghurt) 1.8 Whey and whey products, excl, whey cheese 2 Fats and oils, and fat emulsions (type water-in-oil)
2.1 Fats and oils essentially free from water 2.1.1 Butter oil, anhydrous milk fat, ghee 2.1.2 Vegetable oils and fats 2.1.3 Lard, tallow and fish oil, and other animal fats 2.2 Fat emulsions mainly of type water in oil
2.2.1 Emulsions containing at least 80% fat 2.2.2 Butter and concentrated butter 2.2.3 Margarine and similar products (e.g. butter-margarine blends) 2.2.4 Emulsions containing less than 80% fat (e.g. minarine) 2.3 Fat emulsions other than 2.2, incl. mixed and/or flavoured products based on fat emulsions. 2.4 Fat based desserts (excl,. dairy based desserts) 3 Edible ices, including sherbet and sorbet 4 Fruits and vegetables (incl. mushrooms & fungi, roots and tubers, pulses and legumes),
and nuts & seeds 4.1 Fruit
4.1.1 Fresh fruit Untreated fruit Surface-treated fruit Peeled or cut fruit
4.1.2 Processed fruit 4.1.2.1 Frozen fruit

SCOOP 3.2.11 – Intake of As, Cd, Pb and Hg
122
4.1.2.2 Dried fruit 4.1.2.3 Fruit in vinegar, oil or brine 4.1.2.4 Canned or bottled (pasteurised) fruit 4.1.2.5 Jams, jellies, marmalades 4.1.2.6 Fruit-based spreads other than 4.1.2.5 (e.g. chutney) 4.1.2.7 Candied fruit 4.1.2.8 Fruit preparations, incl. pulp and fruit toppings 4.1.2.9 Fruit-based desserts, incl. fruit-flavoured water-based desserts 4.1.2.10 Fermented fruit products 4.1.2.11 Fruit fillings for pastries 4.1.2.12 Cooked or fried fruit
4.2 Vegetables incl. mushrooms & fungi, roots & tubers, pulses and legumes), and nuts & seeds
4.2.1 Fresh vegetables Untreated vegetables Surface-treated vegetables Peeled or cut vegetables
4.2.2 Processed vegetables, and nuts and seeds 4.2.2.1 Frozen vegetables 4.2.2.2 Dried vegetables 4.2.2.3 Vegetables in vinegar, oil or brine 4.2.2.4 Canned or bottled (pasteurised) vegetables 4.2.2.5 Vegetable, and nut & seed purees and spreads (e.g. peanut butter) 4.2.2.6 Vegetable, and nut & seed pulps and preparations other than 4.2.2.5 4.2.2.7 Fermented vegetable products 4.2.2.8 Cooked or fried vegetables
5 Confectionery 5.1 Cocoa products and chocolate products incl. limitations and chocolate substitutes
Cocoa mixes (powders and syrups) Cocoa based spread, incl. fillings Imitation chocolate, chocolate substitute products
5.2 Sugar based confectionery other than 5.1, 5.3 and 5.4, incl. hard and soft candy, nougats, etc. 5.3 Chewing gum 5.4 Decorations (e.g. for fine bakery wares), toppings (non-fruit) and sweet sauces. 6 Cereals and cereal products, incl. flours & starches from roots & tubers, pulses & legumes,
excluding bakery. 6.1 Whole, broken or flaked grain, incl. rice 6.2 Flours and starch 6.3 Breakfast cereals, incl. rolled oats 6.4 Pastas and noodles 6.5 Cereal and starch-based desserts (e.g. rice pudding, tapioca pudding) 6.6 Batters (e.g. for breading or batters for fish or poultry) 7 Bakery wares
7.1 Bread and ordinary bakery wares 7.1.1 Breads and rolls 7.1.2 Crackers, excluding sweet crackers 7.1.3 Other ordinary bakery products (e.g. bagels, pita, English muffins) 7.1.4 Bread-type products, incl. bread stuffing & bread crumbs 7.2 Fine bakery wares
7.2.1 Cakes, cookies and pies (e.g. fruit-filled or custard types) 7.2.2 Other fine bakery products (e.g. doughnuts, sweet rolls, scones and muffins) 7.2.3 Mixes for fine bakery wares (e.g. cakes, pancakes)
8 Meat and meat products, including poultry and game 8.1 Fresh meat, poultry and game
8.1.1 Whole pieces or cuts 8.1.2 Comminuted 8.2 Processed meat, poultry and game products in whole pieces or cuts
8.2.1 Non-heat treated 8.2.1.1 Cured (incl. salted) 8.2.1.2 Cured (incl. salted) and dried. 8.2.1.3 Fermented

SCOOP 3.2.11 – Intake of As, Cd, Pb and Hg
123
8.2.2 Heat-treated 8.2.3 Frozen 8.3 Processed comminuted meat, poultry and game products
8.3.1 Non-heat treated 8.3.1.1 Cured (incl. salted) 8.3.1.2 Cured (incl. salted) and dried 8.3.1.3 Fermented 8.3.2 Heat-treated 8.3.3 Frozen 8.4 Edible offal 8.5 Edible casings (e.g. sausage casings) 9 Fish and fish products, including molluscs, crustaceans and echinoderms (MCE)
9.1 Fresh fish and fish products, incl. MCE 9.1.1 Fresh fish Muscle meat of fish
9.1.1.1 Muscle meat of wedge sole (Dicoglossa cuneata,), 9.1.1.2 eel (Anguilla anguilla) 9.1.1.3 spotted seabass (Dicentrarchus punctatus) 9.1.1.4 horse mackerel or scad(Trachurus trachurus) 9.1.1.5 grey mullet (Mugil labrosus labrosus) 9.1.1.6 common two-banded seabream (Diplodus vulgaris) 9.1.1.7 grunt (Pomadasys benneti) 9.1.1.8 european pilchard or sardine (Sardina pilchardus), 9.1.1.9 european anchovy (Eneraulis encrasicholus) 9.1.1.10 luvar or louvar (Luvarus imperialis 9.1.1.11 Anglerfish (Lophius spp.) 9.1.1.12 atlantic catfish (Anarhichas lupus) 9.1.1.13 bass (Dicentratus labrax 9.1.1.14 blue line(Molva dipterygia), 9.1.1.15 halibut (Hippoglossus hippoglossus), 9.1.1.16 little tuna (Eutynnus spp.), 9.1.1.17 marlin (Makaira), 9.1.1.18 pike (Esox lucius), 9.1.1.19 plain bonito (Orgynopsis unicolor), 9.1.1.20 poruguese dogfih (Centroscymnes coelolepis), 9.1.1.21 rays (raja spp.), 9.1.1.22 redfish (Sebstes marinus, S. mentella S. viviparus), 9.1.1.23 sail fish (Istiophorus platypterus), 9.1.1.24 scabbard fish (Lepidopus caudatus, Aphanopus carbo), 9.1.1.25 shark (all species), 9.1.1.26 snake mackerel (Lepidocybium flavobrunneum, Ruvettus pretiosus, gempylus serpens) 9.1.1.27 sturgeon (Acipenser spp.), 9.1.1.28 swordfish (Xiphias gladius) 9.1.1.29 tuna (Thunnus spp.). 9.1.1.30 Other
9.1.2 Fresh bivalve molluscs 9.1.2.1 Mussels 9.1.2.2 Oysters 9.1.2.3 Clams 9.1.2.4 Other 9. 1.3 Fresh cephalopodes (with or without viscera)
9.1.3.1 Squid 9.1.3.2 Octopus 9.1.3.3 Cattle-fish 9.1.3.4 Other 9.1.4 Fresh crustaceans,
9.1.4.1 Crab (tested whole, white and brown meat, or just white meat) 9.1.4.2 Lobsters (tested whole, white and brown meat, or just white meat) 9.1.4.3 Shrimp 9.1.4.4 Other 9.1.5 Echinoderm 9.2 Processed fish and fish products, incl. MCE
9.2.1 Frozen fish, fish fillets and fish products, incl. MCE
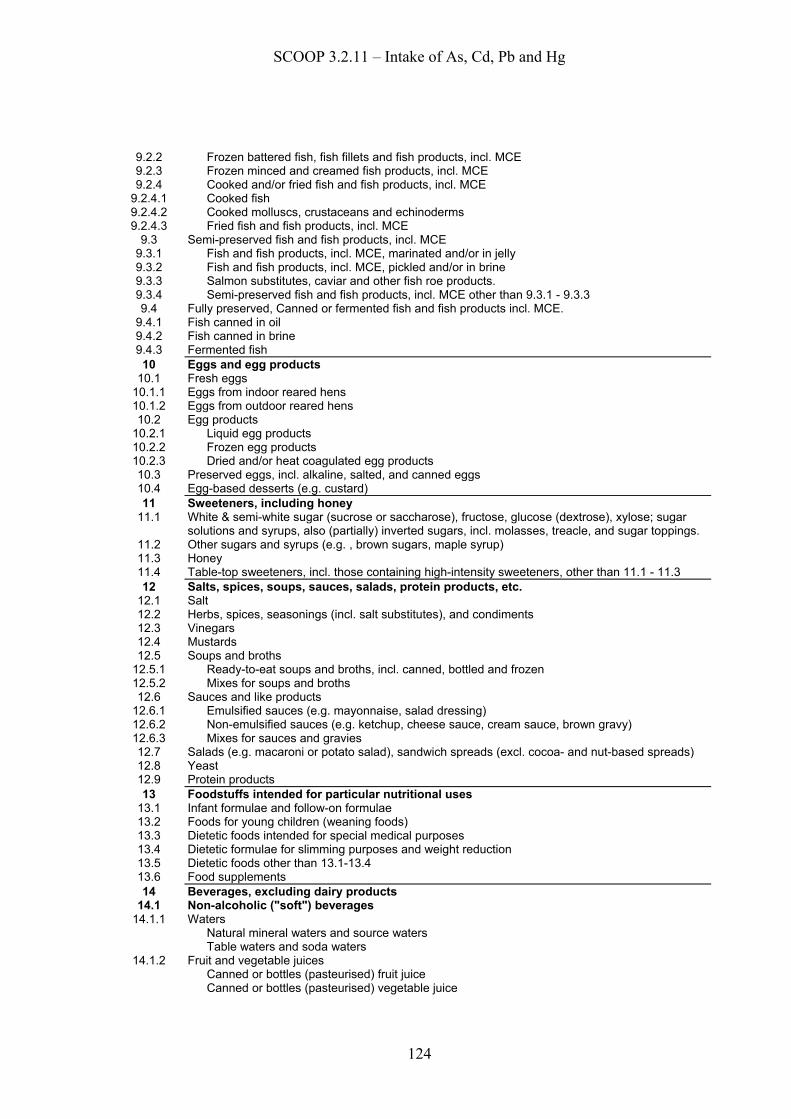
SCOOP 3.2.11 – Intake of As, Cd, Pb and Hg
124
9.2.2 Frozen battered fish, fish fillets and fish products, incl. MCE 9.2.3 Frozen minced and creamed fish products, incl. MCE 9.2.4 Cooked and/or fried fish and fish products, incl. MCE
9.2.4.1 Cooked fish 9.2.4.2 Cooked molluscs, crustaceans and echinoderms 9.2.4.3 Fried fish and fish products, incl. MCE
9.3 Semi-preserved fish and fish products, incl. MCE 9.3.1 Fish and fish products, incl. MCE, marinated and/or in jelly 9.3.2 Fish and fish products, incl. MCE, pickled and/or in brine 9.3.3 Salmon substitutes, caviar and other fish roe products. 9.3.4 Semi-preserved fish and fish products, incl. MCE other than 9.3.1 - 9.3.3 9.4 Fully preserved, Canned or fermented fish and fish products incl. MCE.
9.4.1 Fish canned in oil 9.4.2 Fish canned in brine 9.4.3 Fermented fish 10 Eggs and egg products
10.1 Fresh eggs 10.1.1 Eggs from indoor reared hens 10.1.2 Eggs from outdoor reared hens 10.2 Egg products
10.2.1 Liquid egg products 10.2.2 Frozen egg products 10.2.3 Dried and/or heat coagulated egg products 10.3 Preserved eggs, incl. alkaline, salted, and canned eggs 10.4 Egg-based desserts (e.g. custard) 11 Sweeteners, including honey
11.1 White & semi-white sugar (sucrose or saccharose), fructose, glucose (dextrose), xylose; sugar solutions and syrups, also (partially) inverted sugars, incl. molasses, treacle, and sugar toppings.
11.2 Other sugars and syrups (e.g. , brown sugars, maple syrup) 11.3 Honey 11.4 Table-top sweeteners, incl. those containing high-intensity sweeteners, other than 11.1 - 11.3 12 Salts, spices, soups, sauces, salads, protein products, etc.
12.1 Salt 12.2 Herbs, spices, seasonings (incl. salt substitutes), and condiments 12.3 Vinegars 12.4 Mustards 12.5 Soups and broths
12.5.1 Ready-to-eat soups and broths, incl. canned, bottled and frozen 12.5.2 Mixes for soups and broths 12.6 Sauces and like products
12.6.1 Emulsified sauces (e.g. mayonnaise, salad dressing) 12.6.2 Non-emulsified sauces (e.g. ketchup, cheese sauce, cream sauce, brown gravy) 12.6.3 Mixes for sauces and gravies 12.7 Salads (e.g. macaroni or potato salad), sandwich spreads (excl. cocoa- and nut-based spreads) 12.8 Yeast 12.9 Protein products 13 Foodstuffs intended for particular nutritional uses
13.1 Infant formulae and follow-on formulae 13.2 Foods for young children (weaning foods) 13.3 Dietetic foods intended for special medical purposes 13.4 Dietetic formulae for slimming purposes and weight reduction 13.5 Dietetic foods other than 13.1-13.4 13.6 Food supplements 14 Beverages, excluding dairy products
14.1 Non-alcoholic ("soft") beverages 14.1.1 Waters
Natural mineral waters and source waters Table waters and soda waters
14.1.2 Fruit and vegetable juices Canned or bottles (pasteurised) fruit juice Canned or bottles (pasteurised) vegetable juice

SCOOP 3.2.11 – Intake of As, Cd, Pb and Hg
125
Concentrates (liquid or solid) for fruit juice Concentrates (liquid or solid) for vegetable juice
14.1.3 Fruit and vegetable nectars Canned or bottled (pasteurised) fruit nectar Canned or bottles (pasteurised) vegetable nectar Concentrates (liquid or solids) for fruit nectar Concentrates (liquid or solids) for vegetable nectar
14.1.4 Water-based flavoured drinks, incl. "sport" or "electrolyte" drinks 14.1.4.1 Carbonated drinks 14.1.4.2 Non-carbonated, incl. punches and ades 14.1.4.3 Concentrates (liquid or solid) for drinks 14.1.5 Coffee, coffee substitutes, tea, herbal infusions, and other hot cereal beverages, excl cocoa. 14.2 Alcoholic beverages, incl. alcohol-free and low-alcoholic counterparts
14.2.1 Beer and malt beverages 14.2.2 Cider and perry 14.2.3 Wines
14.2.3.1 Still wine 14.2.3.2 Sparkling and semi-sparkling wines 14.2.3.3 Fortified wine and liqueur wine 14.2.3.4 Aromatized wine 14.2.4 Fruit wine 14.2.5 Mead 14.2.6 Spirituous beverages 14.3 Other alcoholic beverages (e.g. beer, wine, or spirit coolers. etc.) 15 Ready-to-eat savouries
15.1 Snacks - potato, cereal, flour or starch based (from roots & tubes, pulses & legumes) 15.2 Processed nuts, incl. coated nuts and nut mixtures (with e.g., dried fruit) 16 Composite foods (e.g. casseroles, meat pies) -foods that can not be placed in categories 1-15.