report: understanding morocco’s climate futures
TRANSCRIPT


REPORT: UNDERSTANDING MOROCCO’s CLIMATE FUTURES
Using National Climate Change Data Sets to Support Planning and Investment
2
Contents
1. CHANGING CLIMATE IN MOROCCO: PROJECT CONTEXT AND OBJECTIVES ....................... 5
2. PAST CLIMATE CHANGE ANALYSIS IN MOROCCO-LITERATURE REVIEW ............................ 6
2.1 Introduction .................................................................................................................................................. 6
2.2 Climate and Hydrogeological Characteristics ................................................................................................ 6
2.3 Recent Climate Characteristics ..................................................................................................................... 9
2.4 Impact of Climate Change- Application of Global Circulation Models (GCMs) ............................................. 9
2.5 Impact analysis-regional circulation models (RCMs) .................................................................................. 12
3. MOROCCO CLIMATE ANALYSIS: METHODS ...................................................................... 12
3.1 Data Download............................................................................................................................................ 14
3.2 Observational Data Comparisons ................................................................................................................ 15
3.3 Bias Correction ............................................................................................................................................ 22
4. DATA POST-PROCESSING AND OUTPUT GENERATION ..................................................... 23
5. RESULTS ............................................................................................................................ 26
5.1 Ensemble Selection ..................................................................................................................................... 26
5.2 Average Climate-Base Variables ................................................................................................................. 28
5.2.1 Absolute Values ................................................................................................................................. 28
5.2.2 Delta Changes .................................................................................................................................... 31
5.3 Extreme Indices ........................................................................................................................................... 36
5.4 Uncertainty ................................................................................................................................................. 38
5.5 Limitations ................................................................................................................................................... 38
5.6 Conclusions ................................................................................................................................................. 38
REFERENCES ............................................................................................................................. 39
REPORT: UNDERSTANDING MOROCCO’s CLIMATE FUTURES
Using National Climate Change Data Sets to Support Planning and Investment
3
List of Tables
Table 1. GCM/RCM combinations used in the study------------------------------------------------------------------------------ 14
Table 2 Institutions approached on their climate change data needs ------------------------------------------------------- 23
Table 3. Summary of precipitation and temperature related climate indices and base variables-------------------- 25
List of Figures
Figure 1. Geographical distribution of hydrological basins in Morocco ------------------------------------------------------ 8
Figure 2. Geographic distribution of Aquifers in Morocco (Source: https://water.fanack.com/morocco/water-resources-morocco/) ----------------------------------------------------------------------------------------------------------------------- 8
Figure 3 Annual mean temperature change (2081-2100) vs. (1986-2005) as projected by the CMIP5 models for the RCP8.5 scenario. (Source: KNMI Climate Explorer; https://climexp.knmi.nl/start.cgi; Verner et al, 2018) --- 11
Figure 4 Annual mean relative precipitation change (2081- 2100) vs. (1986-2005) as projected by the CMIP5 models for the RCP8.5 scenario. [Source: KNMI Climate Explorer; https://climexp.knmi.nl/start.cgi; Verner et al 2018] ------------------------------------------------------------------------------------------------------------------------------------ 11
Figure 5. Methodological framework for study. ----------------------------------------------------------------------------------- 13
Figure 6. Data stored in a Net CDF file. ----------------------------------------------------------------------------------------------- 15
Figure 7. CORDEX EUR-11 domain overlaid with final re-projected grid. Overlaid with GSOD weather stations.16
Figure 8. Data comparison using quantile-quantile plot between precipitation observed in ERA5-Land and station datasets. ---------------------------------------------------------------------------------------------------------------------------- 18
Figure 9. Data comparison between annual total precipitation observed in ERA5-Land and station datasets. -- 19
Figure 10. Data comparison using quantile-quantile plot between maximum daily temperature observed in ERA5-Land and station datasets. ------------------------------------------------------------------------------------------------------- 20
Figure 11. Data comparison using quantile-quantile plot between minimum daily temperature observed in ERA5-Land and station datasets. ------------------------------------------------------------------------------------------------------- 21
Figure 12. Delta changes in precipitation and temperature predicted by different GCM-RCM combinations for the entire model domain for the months DJF. ------------------------------------------------------------------------------------- 27
Figure 13. Delta changes in precipitation and temperature predicted by different GCM-RCM combinations for the entire model domain for the months JJA. -------------------------------------------------------------------------------------- 27
Figure 14. Delta changes in precipitation and temperature predicted by different GCM-RCM combinations for the entire model domain for annual data. ------------------------------------------------------------------------------------------ 28
Figure 15. Absolute mean Precipitation for the coastal, mountainous and desert areas for the peak dry months (June, July August) and remaining months as well as for the annual period. ---------------------------------------------- 29
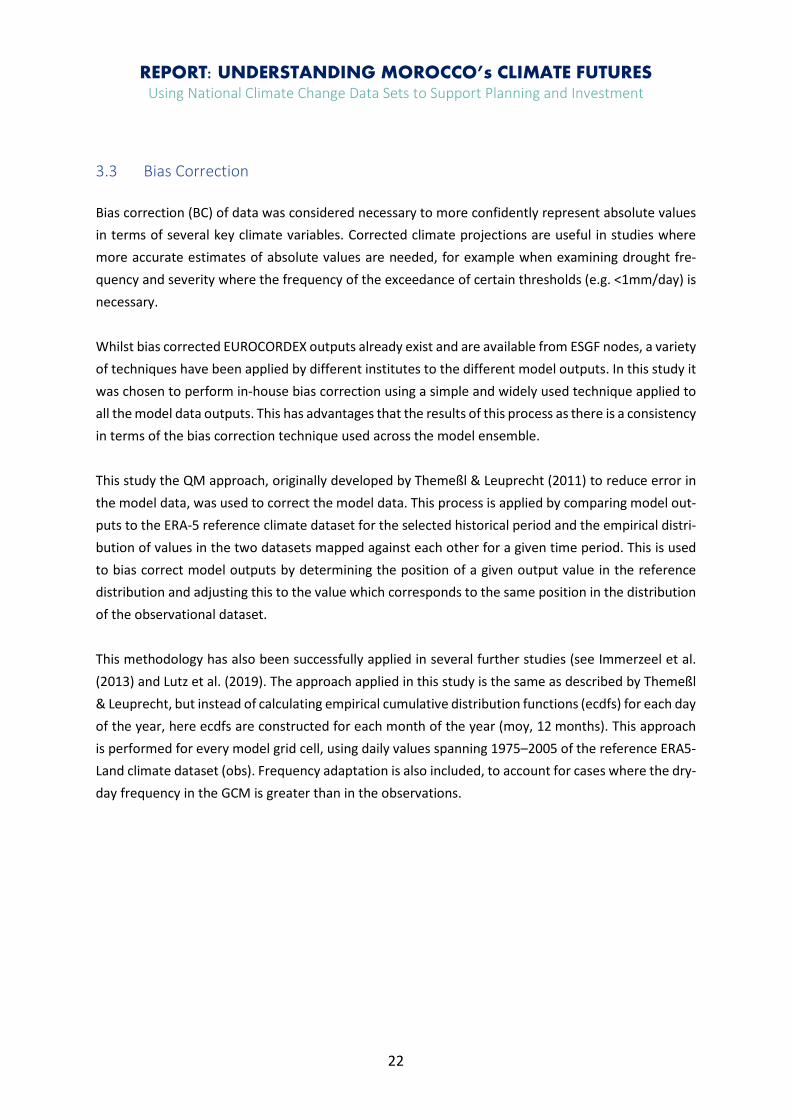
Figure 16. Absolute mean temperature for the coastal, mountainous and desert areas for the peak dry months (June, July August) and remaining months as well as for the annual period RCP 4.5 and RCP8.5 -------------------- 30
REPORT: UNDERSTANDING MOROCCO’s CLIMATE FUTURES
Using National Climate Change Data Sets to Support Planning and Investment
4
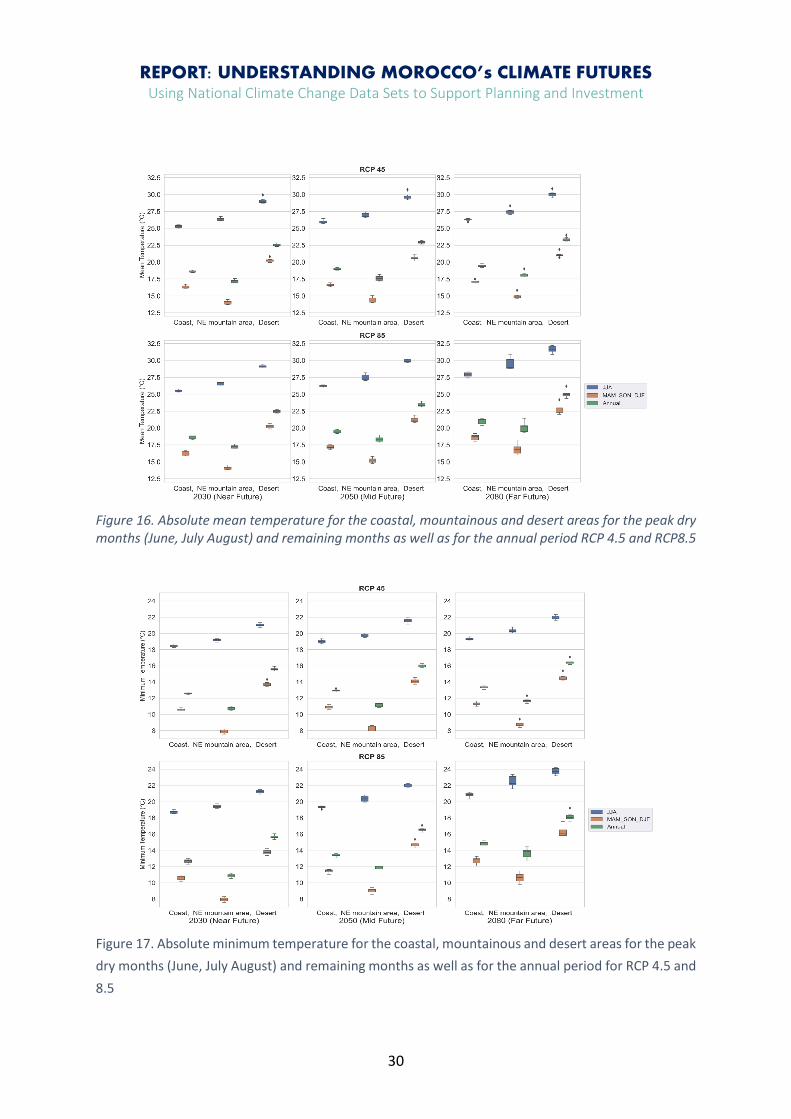
Figure 17. Absolute minimum temperature for the coastal, mountainous and desert areas for the peak dry months (June, July August) and remaining months as well as for the annual period for RCP 4.5 and 8.5 --------- 30
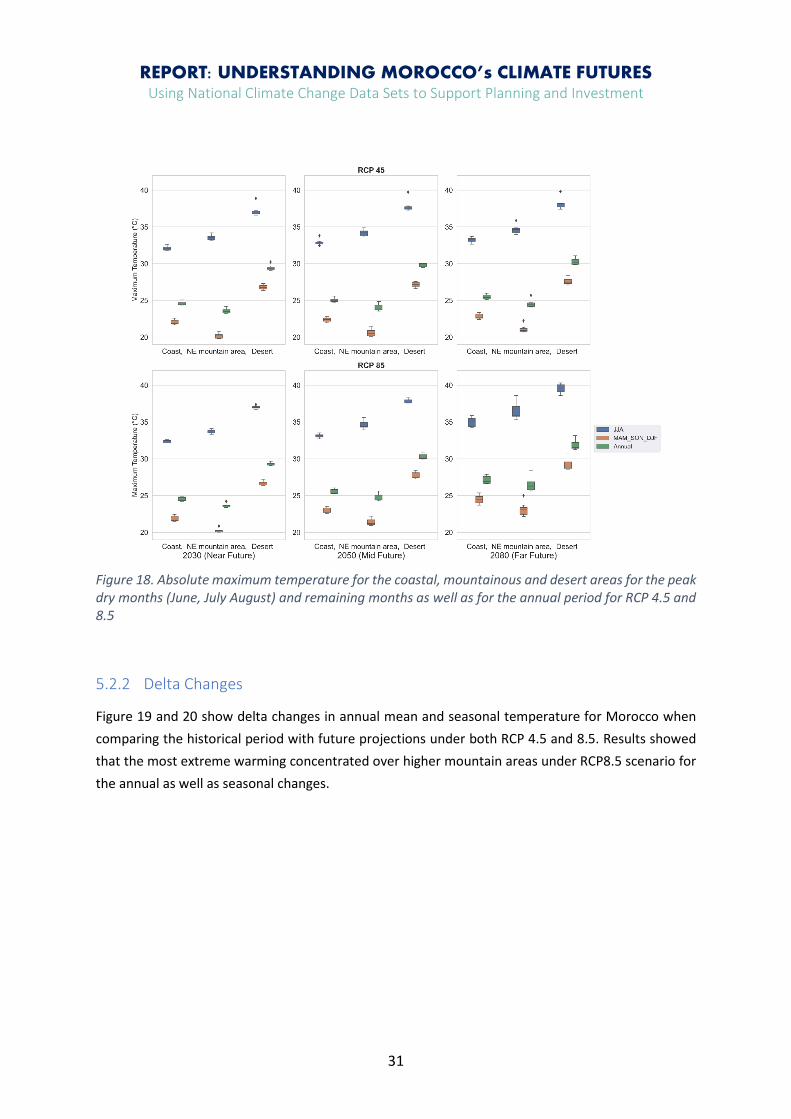
Figure 18. Absolute maximum temperature for the coastal, mountainous and desert areas for the peak dry months (June, July August) and remaining months as well as for the annual period for RCP 4.5 and 8.5 --------- 31
Figure 19. Delta changes in annual mean temperature when comparing the historical period with future projections under both RCP 4.5 and 8.5. White colour indicates regions with no RCM data available ------------- 32
Figure 20. Delta changes in seasonal mean temperature when comparing the historical period with future projections under both RCP 4.5 and 8.5. White colour indicates regions with no RCM data available. Order (top to bottom): DJF, MAM, JJA, SON ------------------------------------------------------------------------------------------------------- 33
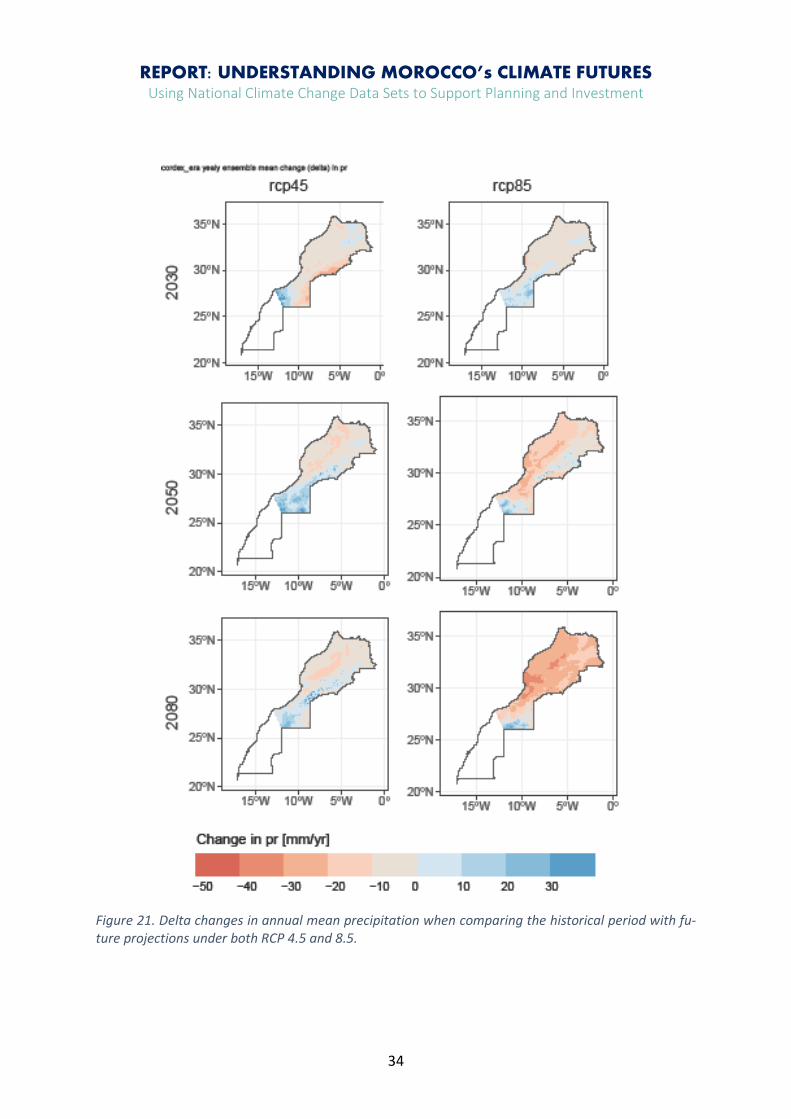
Figure 21. Delta changes in annual mean precipitation when comparing the historical period with future projections under both RCP 4.5 and 8.5. --------------------------------------------------------------------------------------------- 34
Figure 22. Delta changes in seasonal precipitation when comparing the historical period with future projections under both RCP 4.5 and 8.5 scenarios. Order (top to bottom): DJF, MAM, JJA, SON. ------------------- 35
Figure 23. Delta changes at various time horizons and RCP pathways in ensemble mean of extreme indices relating to temperature outputs for TXx, Tnn, SU_25, SU_40, FD and XFD (from top to bottom) ------------------- 36
Figure 24. Delta changes at various time horizons and RCP pathways in ensemble mean of extreme indices relating to precipitation outputs for SDII, CDD, CWD, Rx5day, R10mm (From top to bottom) ----------------------- 37
REPORT: UNDERSTANDING MOROCCO’s CLIMATE FUTURES
Using National Climate Change Data Sets to Support Planning and Investment
5
1. Changing Climate in Morocco: Project Context and Objectives
Climate change adds a new complexity to water and food insecurity, human mobility and settlement by exacerbating environmental degradation, and acting as a threat multiplier across already stressed natural resource base. Thee environmental deterioration impacts the social capital and livelihoods of many affected people, particularly the most vulnerable. The interlinkages between increased climate variability, water and livelihood insecurity, population growth and mobility, employment, political and geo-strategic challenges are complex and inter-related. Specifically, when addressing water scarcity and its relation to fragility, there are no easy answers, but rather a complex and shifting set of socio-economic, governance and environmental relationships that are context-specific and locally, nation-ally and regionally embedded. Indeed, water scarcity and fragility can create a cycle of feedbacks, in which a worsening of one exacerbates the other. The increasingly arid climate conditions of North Africa, and water scarcity challenges exacerbated by rapidly growing populations, and economic developments are needing new planning and investments. The impacts of a changing climate are all too apparent to farmers and water managers across the region. There has been a gradual decrease in precipitation and an increase in temperatures since the 1990s with a steeper trend in the last decade or so. Given the importance of rainfall to agriculture and water resource systems in the country, the changes are bringing perplexing questions for managing supply and demand. Within the general drying of the climate, there have been a series of droughts that are proving very costly to the economy, communities and the environment. Droughts are pernicious extreme events that jeopardize the integrity of critical infrastructure, cause extensive economic and health impacts, harm ecosystems, and increase water, energy and food costs. Drought impacts vary across economic sectors, rainfed/irrigated agriculture systems, renewable and non-renewable groundwater/surface water-based resource services, and rural/urban communities. The recent droughts in Morocco, increasing in frequency over the last few decades, have led to volatile economic growth rates in the country. In Souss Messa, Om er Rabia and other key river basins, the drought is now into its fourth year and reservoir levels are low. The earlier drought of 2016 was dev-astating, with a rainfall deficit of more than 60% over much of the country causing a drop in national economic growth of more than 3% from the decrease in agricultural production and relief measures needed (Economist Intelligence Unit, 2016). In the preceding season (2014-2015) when there had been good rainfall, cereal production had reached bumper levels of 11.5 million tonnes. By the end of the 2015-2016 season, figures published by the United States Department of Agriculture Foreign Ad-visory Service, showed that crop production was down to 1.86 m tonnes of common wheat, roughly 870,000 tonnes of durum wheat and 620,000 tonnes of barley—all together, totalling less than one third of the output of the 2014/2015 season.

REPORT: UNDERSTANDING MOROCCO’s CLIMATE FUTURES
Using National Climate Change Data Sets to Support Planning and Investment
6
To support government agencies and other stakeholders develop strategic plans to adapt to the change climate conditions, there is a need for a more developed evidence base to support decision-making. There are no climate change datasets available within the critical agencies. Therefore, the main objective of this current research work is to provide a bias corrected, high resolution future cli-mate dataset covering the critical agriculture and water-management areas of Morocco. The study especially focuses on the impacts of climate change on extreme low precipitation, which is directly linked to water shortages and drought events. The study adds valuable new insights to climate change impact analysis in Morocco as so far, there are very few studies focusing on extreme low precipitation trends. This is also the first study to use EUROCORDEX data for Morocco to specifically focus on sector wise impacts. Furthermore, the study also has the objective to transfer the climate change projection data to the various agencies and train Moroccan officials on the application of climate change data for future planning.
2. Past Climate Change Analysis in Morocco-Literature Review 2.1 Introduction
The consensus of climate scientists is that the earth is warming and as the global temperatures in-crease, the hydrologic cycle is accelerating and becoming more vigorous. Climate change is expected to significantly impact Morocco on multiple dimensions. The Mediterranean basin is particularly vul-nerable to present and future climate variability as well as climate change. Morocco is located in a transition zone between the arid climate of North Africa and humid climate of Central Europe (Figure 1). Four mountain chains dominate the topography and divide the country into three geographic re-gions: the mountainous interior, including plateaus and fertile valleys; Atlantic coastal lowlands; semi-arid and arid areas of eastern and southern Morocco, where the mountains descend gradually into the Sahara Desert (Hssaisoune et al., 2020). Due to its unique geographical location, past studies have predicted that warming of the hot season and drought will result in the development of arid and semi-arid regimes in the region (Gao & Giorgi, 2008).
2.2 Climate and Hydrogeological Characteristics The Moroccan climate is mainly controlled by three different climate systems, the humid Mediterra-nean and Atlantic climates in the North and Northwest and the arid Saharan climate in the South. These climate systems define five bioclimatic zones: humid; sub-humid; semi-arid; arid and Saharan. In general, precipitation decreases from North to South and from West to East. The North-western region receives the greatest amount of precipitation where the annual average rainfall exceeds 1000 mm in the northern Rif, Middle and High Atlas Mountains; precipitation is less than 200 mm in most
REPORT: UNDERSTANDING MOROCCO’s CLIMATE FUTURES
Using National Climate Change Data Sets to Support Planning and Investment
7
other parts of Morocco (Hssaisoune et al., 2020). Therefore, precipitation follows a sharp gradient, decreasing from the North to the South. Furthermore, precipitation is concentrated in the winter months and there is high inter-annual variability with the presence of frequent droughts (Lionello et al., 2006). Water is therefore a scarce resource, not only in absolute terms but also due to the uneven spatial and temporal distribution. Figure 2 shows the major rivers basins in Morocco. The mountainous chain of the High Atlas in Mo-rocco constitutes a “water tower” providing most of the water supply for the neighbouring arid plains (Chehbouni et al. 2008, Jarlan et al. 2015). The current total renewable water resources of Morocco (surface and groundwater) are estimated at 29 billion cubic meters (BCM) per year (Hssaisoune et al., 2020). The utilizable component is 20 BCM, with 16 BCM from surface water and 4 BCM from ground-water. About 70% of this potential is currently exploited (i.e., 11 BCM of surface water and 2.7 BCM of groundwater) (Hssaisoune et al., 2020). The country has 120 major natural lakes, the majority of which are located between the two mountain ranges of the Middle Atlas and High Atlas. The coastal area contains many lagoons and marshes. The Ramsar Convention has classified 24 sites with a total area of 272,010 hectares (ha) (FAO, 2015). In Morocco, groundwater is available within unconsolidated material (e.g., gravel, sand, or silt), frac-tured rocks (e.g., granite, schist), weathered rocks, karst, and many geological formations throughout the country. Due to its geological diversity, Morocco offers a wide range of hydrogeological environ-ments (M’Bark et al., 2004, Hssaisoune et al., 2020). Six major hydrogeological domains can be iden-tified: Saharan; South Atlas, including the Anti-Atlas; Atlas, including the High and Middle Atlas; East-ern in the northeast (Eastern Meseta); Atlantic in the Western Meseta, along the Atlantic coast and Rif in the north (Figure 3).There are 32 deep aquifers (200 to 1000 m below surface) and more than 98 shallow aquifers (<200 m)(Hssaisoune et al., 2020).

REPORT: UNDERSTANDING MOROCCO’s CLIMATE FUTURES
Using National Climate Change Data Sets to Support Planning and Investment
8
Figure 1. Geographical distribution of hydrological basins in Morocco
Figure 2. Geographic distribution of Aquifers in Morocco (Source: https://water.fanack.com/mo-
rocco/water-resources-morocco/)

REPORT: UNDERSTANDING MOROCCO’s CLIMATE FUTURES
Using National Climate Change Data Sets to Support Planning and Investment
9
2.3 Recent Climate Characteristics
Several studies assessing historical trends in the recent past show that for north-eastern Morocco, below average annual rainfall rates have prevailed since about the mid-1970s (Hertig, 2004; Fink et al, 2010; Schilling et al., 2012; Driouech, 2010). For the southern parts of the Moroccan Atlantic coast as well as for the Atlas Mountain area, several periods of below average precipitation occurred in the second half of the 20th century in the winter season, for example in the period 1971 to 1975 and in the period 1979 to 1983, but also some positive anomalies can be found around the late 1980s and 1990s (Hertig, 2017). A study by Khomsi et al. (2015) to analyse the frequency and the trends of tem-perature and rainfall extreme events in two contrasted Moroccan regions (the Tensift in the semi-arid South, and the Bouregreg in the sub-humid North), during the second half of the 20th century showed that during the second half of the 20th century, upward trends in maximum and minimum tempera-tures of both regions and no generalized trends in rainfall amounts occurred. More recently Driouech et al. (2020), investigated country-wide trends of precipitation and temperature extreme events using data issued from a set of 30 meteorological stations across Morocco. An evolution toward drier con-ditions in the rainiest region of the country (West of Atlas Mountains) has been highlighted. Increasing trends in high temperature events and drought due to both temperature and precipitation effects have also been found. Furthermore, the number of nighttime cold events decrease significantly in the whole studied area. The trends found in heavy rainfall events are spatially contrasted with weak mag-nitudes even though not statistically significant (Donat et al., 2014) Due to the observed changes, a general tendency toward warmer and drier conditions can be found in the last decades for the above mentioned regions (Greve et al., 2014; Driouech et al., 2013, 2020).
2.4 Impact of Climate Change- Application of Global Circulation Models (GCMs) Future climate projections are obtained from general circulation models (GCMs) and regional circula-tion models (RCMs). Due to their coarse spatial resolution (Meehl et al., 2007), GCMs can resolve only the broader scales of atmospheric circulation (around 100–200km grid resolution). They provide val-uable information on climate change at the global to sub-continental scales (IPCC, 2007). However, they are not able to capture the effects of local aspects (e.g. complex topography, coastlines, snowfall in mountain areas and land cover), which modulates the climate signal at finer scales, and have diffi-culties in providing an accurate description of extreme events that are of fundamental importance for local climate change impact studies (Giorgi et al., 2009). The Intergovernmental Panel on Climate Change (IPCC) Fifth Assessment Report (AR5) well recognizes that, like GCMs, RCMs have inherent limitations and are a work in progress (IPCC 2013). Nonetheless, the IPCC reports with high confidence that RCMs “add value to the simulation of spatial climate detail in regions with highly variable topog-raphy and for mesoscale phenomena such as orographic effect, convection etc.” (Flato et al., 2013, p.

REPORT: UNDERSTANDING MOROCCO’s CLIMATE FUTURES
Using National Climate Change Data Sets to Support Planning and Investment
10
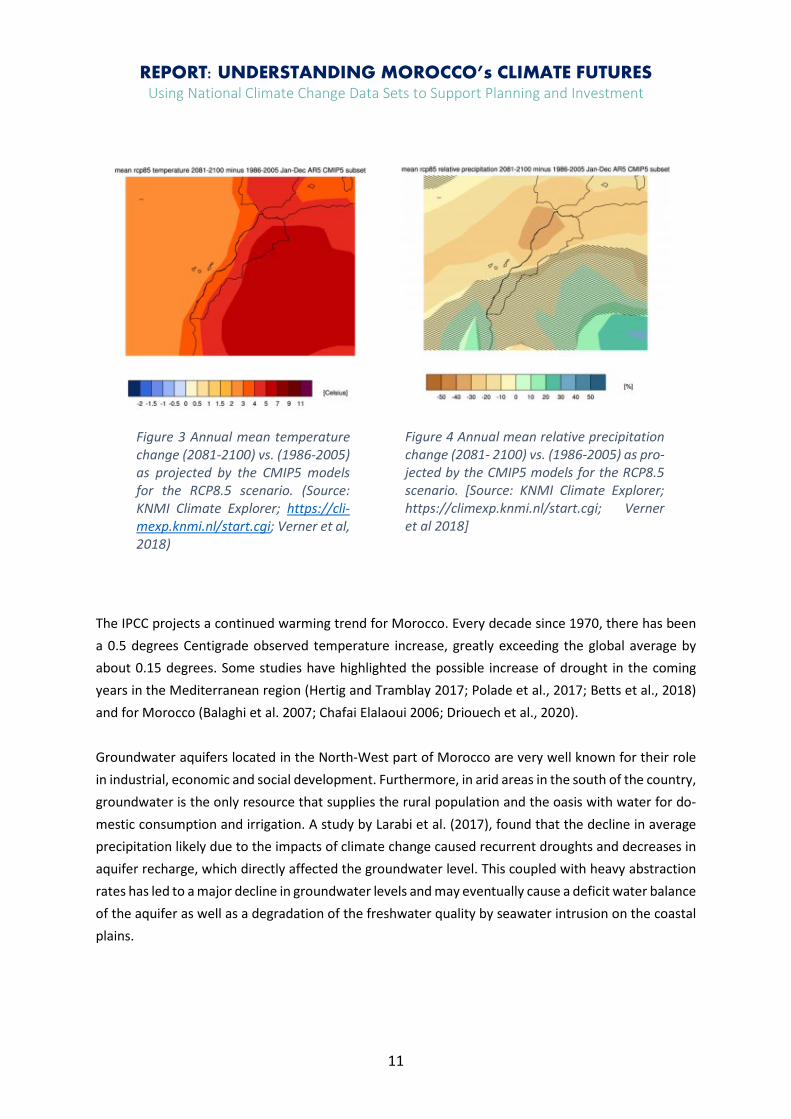
815). Although there have been several initiatives providing regional climate models (RCMs) to dy-namically downscale GCM information with the goal to deliver local high-resolution climate infor-mation (Giorgi, 2006; Jacob et al., 2013). Laprise et al. (2008), Schmidli et al. (2007), Giorgi (2010) and Wang et al. (2004), Morocco has rarely been the focus of climate numerical simulation studies (Dri-ouech al.,2009, 2010). The projections generated under the last IPCC AR5 report (2013) are based on GCM runs from climate centres across the world and brought together into the Combined Model Intercomparison Project (CMIP) 5 (CMIP5) database. The mapped data are expressed as anomalies with respect to the refer-ence period of 1986–2005 (i.e. differences between the future period and the reference period). Thus, the changes are relative to the climate change that has already occurred since the pre-industrial pe-riod. In its AR5 the IPCC states that the African continent is poised to be among the most vulnerable regions to climate change and climate variability. The report also states that exceedance of the 2°C threshold could occur as early as mid-century and reach between 3°C and 6°C by the end of the cen-tury (IPCC 2013). In the IPCC AR5 report (2013), maps for four different future scenarios for greenhouse gas emissions named Representative Concentration Pathways (RCPs), RCP2.6, RCP4.5, RCP6.0 and RCP8.5, were pre-sented. These scenarios represent increased forcings from the strongly mitigated scenario RCP2.6 (constructed to keep temperatures below 2.0 ⁰C) to a non-mitigated business-as-usual scenario RCP8.5. In Figures 3 and 4, scenarios for Morocco for RCP8.5 annual changes for the end of the century are shown. Hatching denotes areas where the 20-year mean differences of the percentiles are less than the standard deviation of model-estimated present-day natural variability of 20-year mean dif-ferences – a measure of robustness of the results; hatching indicates that the change is not statistically significant, yet the sign and magnitude may still be relevant given the geographical pattern of the overall changes. In summary, the CMPI5 models indicates that for the RCP8.5 scenario, country scales temperatures by the end of the 21st century could increase by 3-6 ⁰C, 3-6 ⁰C, 4-7 ⁰C, and 3.5-6 ⁰C during December-January-February (DJF), March-April-May (MAM); June-July-August (JJA), September-October-Novem-ber (SON), respectively. Precipitation amounts may be reduced by 10-40% annually, 10-30% in wet season (October-April) and 10-40% in the dry season (May-September). Such kind of changes have also been found by other studies done using GCMs (Driouech et al., 2010; Polade et al.; 2017; Betts et al., 2018).
REPORT: UNDERSTANDING MOROCCO’s CLIMATE FUTURES
Using National Climate Change Data Sets to Support Planning and Investment
11
The IPCC projects a continued warming trend for Morocco. Every decade since 1970, there has been a 0.5 degrees Centigrade observed temperature increase, greatly exceeding the global average by about 0.15 degrees. Some studies have highlighted the possible increase of drought in the coming years in the Mediterranean region (Hertig and Tramblay 2017; Polade et al., 2017; Betts et al., 2018) and for Morocco (Balaghi et al. 2007; Chafai Elalaoui 2006; Driouech et al., 2020). Groundwater aquifers located in the North-West part of Morocco are very well known for their role in industrial, economic and social development. Furthermore, in arid areas in the south of the country, groundwater is the only resource that supplies the rural population and the oasis with water for do-mestic consumption and irrigation. A study by Larabi et al. (2017), found that the decline in average precipitation likely due to the impacts of climate change caused recurrent droughts and decreases in aquifer recharge, which directly affected the groundwater level. This coupled with heavy abstraction rates has led to a major decline in groundwater levels and may eventually cause a deficit water balance of the aquifer as well as a degradation of the freshwater quality by seawater intrusion on the coastal plains.
Figure 3 Annual mean temperature change (2081-2100) vs. (1986-2005) as projected by the CMIP5 models for the RCP8.5 scenario. (Source: KNMI Climate Explorer; https://cli-mexp.knmi.nl/start.cgi; Verner et al, 2018)
Figure 4 Annual mean relative precipitation change (2081- 2100) vs. (1986-2005) as pro-jected by the CMIP5 models for the RCP8.5 scenario. [Source: KNMI Climate Explorer; https://climexp.knmi.nl/start.cgi; Verner et al 2018]

REPORT: UNDERSTANDING MOROCCO’s CLIMATE FUTURES
Using National Climate Change Data Sets to Support Planning and Investment
12
2.5 Impact analysis-regional circulation models (RCMs) Few studies have assessed projected changes in temperature and precipitation indices in Morocco from high-resolution RCMs (Départment Météorologie Nationale (DMN), 2017, 2018; Filahi, et al., 2017). The studies indicated marked increases in temperature were likely from the mid-21st century onwards, for the RCP 8.5. Furthermore, minimum temperatures were expected to increase, more than maximum temperatures, in most parts of the country, except in the Eastern regions (Filahi, et al., 2017 The future climate change signal was found to be less homogenous for most of the precipitation indi-ces. Nevertheless, analysis found a clear decrease of precipitation totals, following a north-west to south-east gradient. However, for heavy rainfall events, there were strong uncertainties in projections and there no clear agreement among models especially for the south of the country. Spatiotemporal characterizations of current and future droughts in the High Atlas basins were carried out by Zkhiri et. al. 2018. The study used the projected precipitation (2006–2100) from five high-res-olution CORDEX regional climate simulations, under two emission scenarios (RCP 4.5 and RCP 8.5). A relative Standardized Precipitation Index (SPI) was computed to evaluate the climate change impacts on drought occurrence. The study showed a decrease (up to − 65%) in precipitation in the future when compared to the historical period. In terms of drought events, the study reported a strong increase in the frequency of SPI events below − 2, which is considered as severe drought conditions. The study however; was only limited to the Tensift basin in the High Atlas (N’Fis, Rhéraya, Ourika, Zat, and R’dat), as well in the Haouz plains (Figure 1).
3. Morocco Climate Analysis: Methods The method adopted for the work followed three main steps shown in Figure 5. First data sets from different models and RCPS were downloaded for the MENA domain from the CORDEX portal (https://cordex.org/domains/cordexregion-mena-cordex/) to ensure the results represented a range of possible values for future conditions and were not biased by the modelling outputs from one centre. The current study focused on RCP 4.5 (Slowly Declining Emissions) and RCP 8.5. (Rising Emissions). An ensemble with 9 GCMs/RCMs combinations were downloaded from the EUROCORDEX dataset covering Europe and some of North Africa at 0.11-degree resolution(~12km) at daily temporal scale. Four variables i.e. Max. Daily Temp. (TMax), Min. Daily Temp. (TMin.), Precipitation (Pr) and Shortwave Radiation (SWdn) were identified for the analysis. In the second part of the analysis, a comparison was undertaken using quantile mapping between the model data for the historical period and available from measured sources to check for accuracy and possible bias in the data. Two datasets from sources of measured data - European Centre For Mid-Range Weather Forecasting’s ERA5 and observed station data - were used in the evaluation. The

REPORT: UNDERSTANDING MOROCCO’s CLIMATE FUTURES
Using National Climate Change Data Sets to Support Planning and Investment
13
selected data set was then used to configure a bias correction exercise which was undertaken to help reduce inaccuracies in the model data that would be used in the final data generation. The quantile mapping (QM) method was used for comparing the data sets and for the bias correction. It is a widely recognized bias correction approach in the climate science community as it reduces bias in extreme values (as well as means) predicted by climate models. There exist several approaches that researchers have adopted in implementing bias correction for fitting GCM/RCM data with observed ground data. Some have conducted comparative studies to assess the effectiveness and reliability of such a method, concluding that probability mapping or statistical downscaling (often regarded as quantile mapping) produces the best form of optimized results (Hawkins and Sutton 2011; Teutschbein and Seibert 2012; Lafon et al. 2013). Numerous advantages offered by the quantile mapping method over other approaches have been identified by various researchers such as 1) correcting standard variation, mean and wet-day intensities and frequencies; 2) adjusting events in the form of non-linearity; and 3) building consistency between variabilities original data and corrected data (Gudmundsson et al. 2012; Lafon et al. 2013). In the final stage of the methodology, new data sets from the bias corrected values were generated based on stakeholders needs and standard indices approaches. The data were output into various formats including maps and graphs.
Figure 5. Methodological framework for study.
Datadownloaded
processed
•Cordex Data downloaded and processed 10 RCMs/GCMS, 3 variables (Tmax, TMin, Precipitation, Solar Radiation
•Historical Data from ECMWF ERA5 •Cumulative Distribution Function Comparison
Bias correction
•Using selected historial period ERA5 data and quantile mapping
Results
•New data sets generated for averages (e.g. precip, temperature) and extreme indices (e.g. extreme temperature, consecutive dry days) selected by Moroccan national partners
REPORT: UNDERSTANDING MOROCCO’s CLIMATE FUTURES
Using National Climate Change Data Sets to Support Planning and Investment
14
3.1 Data Download Climate change datasets were downloaded using wget scripting from the German Climate Computing Centre node of the Earth System Grid Federation (ESGF)1 system. The following criteria were used to download data:
• Project: CORDEX (un-corrected GCM/RCM output) • Domain: EUR-11 (EUROCORDEX domain at 11km resolution) • Experiment (scenario): historical, rcp45, rcp85 • Ensemble: r1i1p1 • Downscaling realisation: v1 • Time frequency: Day • Variable: pr, tasmax, tasmin, rsds
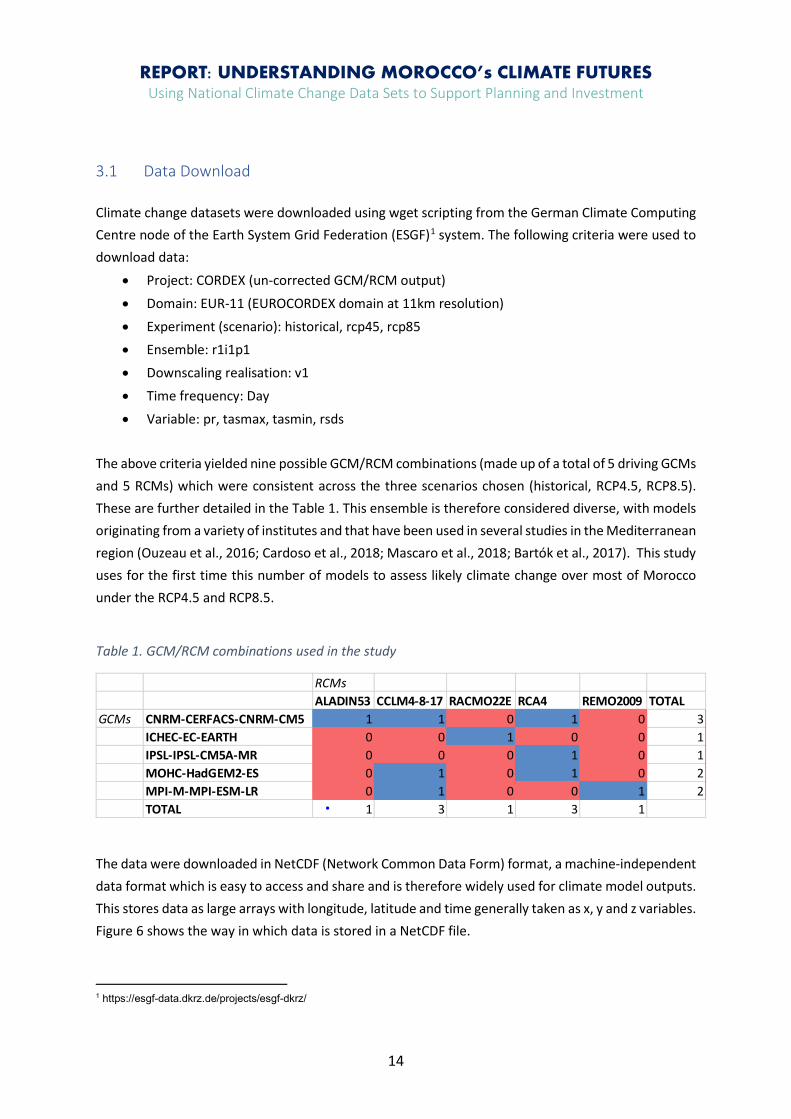
The above criteria yielded nine possible GCM/RCM combinations (made up of a total of 5 driving GCMs and 5 RCMs) which were consistent across the three scenarios chosen (historical, RCP4.5, RCP8.5). These are further detailed in the Table 1. This ensemble is therefore considered diverse, with models originating from a variety of institutes and that have been used in several studies in the Mediterranean region (Ouzeau et al., 2016; Cardoso et al., 2018; Mascaro et al., 2018; Bartók et al., 2017). This study uses for the first time this number of models to assess likely climate change over most of Morocco under the RCP4.5 and RCP8.5.
Table 1. GCM/RCM combinations used in the study
The data were downloaded in NetCDF (Network Common Data Form) format, a machine-independent data format which is easy to access and share and is therefore widely used for climate model outputs. This stores data as large arrays with longitude, latitude and time generally taken as x, y and z variables. Figure 6 shows the way in which data is stored in a NetCDF file.
1 https://esgf-data.dkrz.de/projects/esgf-dkrz/
RCMsALADIN53 CCLM4-8-17 RACMO22E RCA4 REMO2009 TOTAL
GCMs CNRM-CERFACS-CNRM-CM5 1 1 0 1 0 3ICHEC-EC-EARTH 0 0 1 0 0 1IPSL-IPSL-CM5A-MR 0 0 0 1 0 1MOHC-HadGEM2-ES 0 1 0 1 0 2MPI-M-MPI-ESM-LR 0 1 0 0 1 2TOTAL 1 3 1 3 1

REPORT: UNDERSTANDING MOROCCO’s CLIMATE FUTURES
Using National Climate Change Data Sets to Support Planning and Investment
15
Figure 6. Data stored in a Net CDF file.
3.2 Observational Data Comparisons To characterize accurately past changes in climate, two historical datasets were reviewed and com-pared to determine which would be used in subsequent analysis. This data comparison is valuable in determining the most useful dataset to be used to bias correct model outputs (further described in Section 0). The two datasets:
1. ERA5-Land2, a high-resolution climate reanalysis product from Copernicus. This dataset has spatial resolution of around 9km and daily timesteps for maximum, minimum and average temperature and precipitation. This dataset is widely used in climate change studies and is currently being used to perform statistical downscaling of CMIP6 datasets.
2. Station data from the Global Surface Summary of the Day (GSOD)3 network of openly available station data. This product was used as data issued from national institutions was not accessi-ble. 20 stations were selected from this network (see in Figure 6), based on them having cov-erage for the same period as ERA-5 Land (1981-2020).
2 https://cds.climate.copernicus.eu/cdsapp#!/dataset/reanalysis-era5-land?tab=overview 3 https://catalog.data.gov/dataset/global-surface-summary-of-the-day-gsod

REPORT: UNDERSTANDING MOROCCO’s CLIMATE FUTURES
Using National Climate Change Data Sets to Support Planning and Investment
16
Figure 7. CORDEX EUR-11 domain overlaid with final re-projected grid. Overlaid with GSOD weather stations.
In general, the strengths of reanalysis products are in their completeness in terms of both space and time, but it is widely acknowledged that these products are susceptible to biases of their own. Station data, in contrast, have the advantage that they are direct measurements of climatic conditions but are often limited in terms of both spatial and temporal coverage, and may be susceptible to human error (Parker, 2016). To begin the work the downloaded RCM/GCM model data and ERA5-Land reanalysis data underwent various pre-processing to support their comparison using the following steps:
i. Re-projection to a uniform grid across models based on un-rotated Aladin-53 RCM grid. This was necessary as RCMs are in differing coordinate reference systems (CRS) when down-loaded, with some in rotated-pole formats. Therefore, a single common grid was needed for all RCM data, this was chosen as that of the Aladin-53 RCM.
ii. Data trimmed to uniform time periods (1975-2005 for historical, 2006-2090 for future) iii. Leap days removed from calendars to standardise outputs iv. Unit conversion (Kelvin – Celsius for temperature, kg s-1 m-2 – mm day-1 for precipitation)
REPORT: UNDERSTANDING MOROCCO’s CLIMATE FUTURES
Using National Climate Change Data Sets to Support Planning and Investment
17
This methodology was applied to raw NetCDF files using the CDO library4 – an open source, command line library widely used in the climate community.
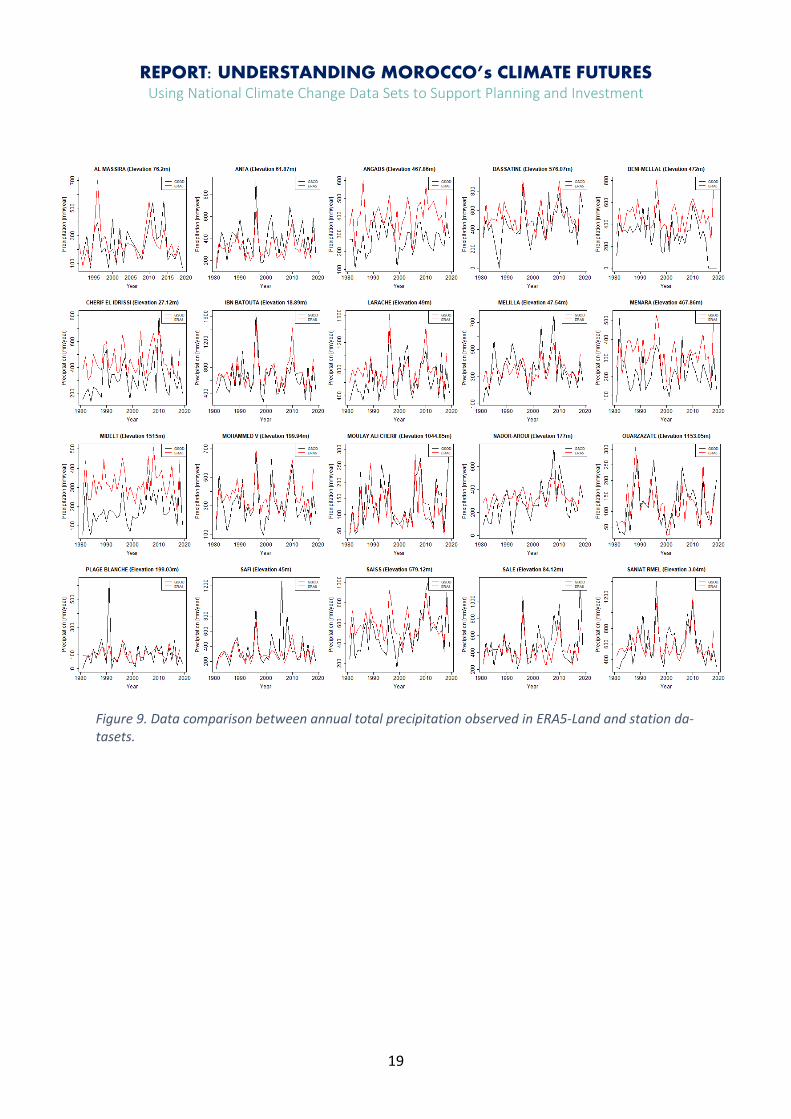
Then to support the comparison between the two possible data sources, data series were extracted from the ERA5-Land grid at the location of each station in the network, giving comparable daily time series for each. The datasets were compared using the quantile mapping approach with quantile-quantile plot generated to look at the different biases found in each product. The results of data com-parison are presented in Figure 8. Data comparison using quantile-quantile plot between precipitation observed in ERA5-Land and station datasets. Figures 8, 9, 10 and 11. When precipitation is considered (Figures 8 and 9) the analysis shows that ERA5-Land products are prone to biases when compared to station data – especially when higher precipitation is considered. However, the ERA5-Land data predicts extreme low precipitation values well (Figure 8. Data comparison using quantile-quantile plot between precipitation observed in ERA5-Land and station datasets.). As one of the core objectives of the current study was to focus on droughts and low pre-cipitation, the ERA5-Land was therefore considered to perform well. Furthermore, when annual pre-cipitation totals are considered, it is shown that ERA5-Land performs well for most stations, except for some which fall in complex (elevated) terrain. In terms of temperature (Figures 10 and 11) it is shown that ERA5-Land performs very well when com-pared to station data, with quantile-quantile plots showing a high level of alignment for almost all stations and for both maximum and minimum daily temperatures. Overall, this data comparison step showed that ERA5-Land represents an acceptable product for use in the bias correction of model data. It must be acknowledged in all subsequent use of the data, how-ever, the limits around extreme high values in precipitation shown in ERA5-Land and station datasets. This may play a role in influencing the outputs of bias corrected models and may limit the accuracy of predictions of extreme high precipitation events going forward. It is also worth noting that, if station data had been used for bias correcting the RCMs, a dense observation network with available long timeseries to provide climate scenarios with homogeneous spatial coverage would have been needed. This was not available.
4 https://code.mpimet.mpg.de/projects/cdo/embedded/index.html

REPORT: UNDERSTANDING MOROCCO’s CLIMATE FUTURES
Using National Climate Change Data Sets to Support Planning and Investment
18
Figure 8. Data comparison using quantile-quantile plot between precipitation observed in ERA5-Land and station datasets.
REPORT: UNDERSTANDING MOROCCO’s CLIMATE FUTURES
Using National Climate Change Data Sets to Support Planning and Investment
19
Figure 9. Data comparison between annual total precipitation observed in ERA5-Land and station da-tasets.

REPORT: UNDERSTANDING MOROCCO’s CLIMATE FUTURES
Using National Climate Change Data Sets to Support Planning and Investment
20
Figure 10. Data comparison using quantile-quantile plot between maximum daily temperature ob-served in ERA5-Land and station datasets.

REPORT: UNDERSTANDING MOROCCO’s CLIMATE FUTURES
Using National Climate Change Data Sets to Support Planning and Investment
21
Figure 11. Data comparison using quantile-quantile plot between minimum daily temperature ob-served in ERA5-Land and station datasets.
REPORT: UNDERSTANDING MOROCCO’s CLIMATE FUTURES
Using National Climate Change Data Sets to Support Planning and Investment
22
3.3 Bias Correction Bias correction (BC) of data was considered necessary to more confidently represent absolute values in terms of several key climate variables. Corrected climate projections are useful in studies where more accurate estimates of absolute values are needed, for example when examining drought fre-quency and severity where the frequency of the exceedance of certain thresholds (e.g. <1mm/day) is necessary. Whilst bias corrected EUROCORDEX outputs already exist and are available from ESGF nodes, a variety of techniques have been applied by different institutes to the different model outputs. In this study it was chosen to perform in-house bias correction using a simple and widely used technique applied to all the model data outputs. This has advantages that the results of this process as there is a consistency in terms of the bias correction technique used across the model ensemble. This study the QM approach, originally developed by Themeßl & Leuprecht (2011) to reduce error in the model data, was used to correct the model data. This process is applied by comparing model out-puts to the ERA-5 reference climate dataset for the selected historical period and the empirical distri-bution of values in the two datasets mapped against each other for a given time period. This is used to bias correct model outputs by determining the position of a given output value in the reference distribution and adjusting this to the value which corresponds to the same position in the distribution of the observational dataset. This methodology has also been successfully applied in several further studies (see Immerzeel et al. (2013) and Lutz et al. (2019). The approach applied in this study is the same as described by Themeßl & Leuprecht, but instead of calculating empirical cumulative distribution functions (ecdfs) for each day of the year, here ecdfs are constructed for each month of the year (moy, 12 months). This approach is performed for every model grid cell, using daily values spanning 1975–2005 of the reference ERA5-Land climate dataset (obs). Frequency adaptation is also included, to account for cases where the dry-day frequency in the GCM is greater than in the observations.

REPORT: UNDERSTANDING MOROCCO’s CLIMATE FUTURES
Using National Climate Change Data Sets to Support Planning and Investment
23
4. Data post-processing and output generation Following bias correction, the study produced two kinds of outputs in NetCDF form:
• Raw (uncorrected CORDEX outputs) • CORDEX bias corrected using ERA-5 Land reanalysis product
All datasets had the following attributes:
• Scenarios: Historical, RCP4.5 and RCP8.5 • Variables: Tasmax (maximum daily temp), Tasmin (minimum daily temp), Precipitation • Resolution: around 11km • Periodicity: Daily • Time period: 1985:2090
Note: Downward shortwave radiation was also downloaded, but is non-bias corrected due to lack of observational dataset The resulting datasets were in large and were not easily useable for non-experts. Therefore, the next step was to convert this data to more easily accessible formats to ensure the outputs could be. To determine the different data that would be most useful a consultation through email, online meetings or telephone with 10 government agencies stakeholders (Table 2) was undertaken to determine which would be important to their operations and decision-making in relation to climate change adaptation, mitigation and resilience. Table 2 Institutions approached on their climate change data needs
Institution
Direction of Climate Change, Biodiversity and Green Economy Ministry of Energy, Mining and Environment
Agence de Bassin Hydraulique Oum Er-Rbia (ABH-OER)
Agence de Bassin Hydraulique Tensift (ABHT)
Agence de Bassin Hydraulique Souss Massa (ABHSM)
Direction of Research and Water Planning (DRPE)
Hassania School of Public Works (EHTP)
Office régionale de la mise en valeur agricole -Haouz (ORMVAH)
National Institute for Agricultural Research (INRA)

REPORT: UNDERSTANDING MOROCCO’s CLIMATE FUTURES
Using National Climate Change Data Sets to Support Planning and Investment
24
Direction of Strategy and Statistics, Agriculture Ministry
Hassan II Agronomics and Veterinary Institute
National Forestry School of Engineers (ENFI)
Not all responded but from those that did various data sets were generated/extracted that captured the likely trends average and extremes for key climate variables, particularly that would affect water and agriculture management.
The data were first divided into subsets to cover only the specific horizons identified as important to cover during consultation with the relevant stakeholders, these are as follows:
• 2020-2040 (2030) Short term (Near future) • 2050-2070 (2060) Medium term (Mid future) • 2070-2090 (2080) Long term (Far Future)
These horizons are considered relevant to stakeholders in that they cover time periods relevant to a range of planning cycles and therefore can be useful in future climate risk analysis. Then various CLIMDEX5 indicators, widely used to summarise extremes in daily climate datasets, were used to generate the data in useable forms. These take as input daily datasets and output indicators which are informative in relation to important climate phenomena such as drought or flooding. Ex-tracting these indicators from the CORDEX datasets for Morocco is a logical step as it produces easily interpretable outputs and reduces the size and complexity of the dataset to a series of simple indica-tors. To accomplish this, the command-line CDO library6 was utilised. This library is extremely useful in that it offers a computationally light, ready-made solution to extract CLIMDEX indicators from large climate datasets (such as the Morocco datasets). It works with NetCDF files as input and output. A series of indicators were thus generated (Table 3). Output variables were divided into two groups giving insight on future changes of both average clima-tology and extreme climate events (these often relate to drought, flooding or extreme temperature). These groups are summarised as such:
• Extreme Indices • Base variables: Mean temperature, minimum daily temperature, maximum daily tempera-
ture, precipitation and downward shortwave radiation.
5 https://www.climdex.org/ 6 https://code.mpimet.mpg.de/projects/cdo/

REPORT: UNDERSTANDING MOROCCO’s CLIMATE FUTURES
Using National Climate Change Data Sets to Support Planning and Investment
25
Variables were extracted for differing subsets of time depending on their proposed use. This ranges from daily to seasonal to annual timesteps. Table 3 presents a summary table of the base variables and extreme indices.
Table 3. Summary of precipitation and temperature related climate indices and base variables
Base Variables
Variable Full Name Format Period Absolute / Delta
Units
Tasmax Maximum Daily Temperature NetCDF, txt, tif
Annual, seasonal, daily
Absolute, Delta
ºC, ºC
Tasmin Minimum Daily Temperature NetCDF, txt, tif
Annual, seasonal, daily
Absolute, Delta
ºC, ºC
Tas Mean Daily Temperature NetCDF, txt, tif
Annual, seasonal, daily
Absolute, Delta
ºC, ºC
Pr Precipitation NetCDF, txt, tif
Annual, seasonal, daily
Absolute, Delta
mm, %
Precipitation related extreme indices
SDII Simple precipitation intensity index txt, tif Annual, DJF Absolute - CDD Annual maximum consecutive dry
days txt, tif Annual Absolute,
Delta days, %
CWD Annual maximum consecutive wet days
txt, tif Annual Absolute, Delta
days, %
R5day Annual maximum 5-day consecutive precipitation
txt, tif Annual Absolute mm
R10mm Annual count of days where daily precipitation exceeds 10 mm per day
txt, tif Annual Delta %
Temperature related extreme indices
TXx Annual maximum of daily maximum temperature
txt, tif Annual Absolute, Delta
ºC, ºC
TNn Annual minimum of daily minimum temperature
txt, tif Annual Absolute, Delta
ºC, ºC
SU_25 Number of hot days (Tmax ≥ 25C) txt, tif Annual Delta %
SU_40 Number of extreme heat days (Tmax ≥ 40C)
txt, tif Annual, JJA Delta %
FD Number of frost days (Tmin <0C) txt, tif Annual, FMA Delta % XFD Number of days of severe frost (Tmin
<-5C) txt, tif Annual Delta %

REPORT: UNDERSTANDING MOROCCO’s CLIMATE FUTURES
Using National Climate Change Data Sets to Support Planning and Investment
26
Mostly, these indicators were extracted at the annual level, but the following month-specific requests were also received:
• Number of spring frost days from February to April • Number of hot days (Tmax ≥ 25 ° C) from April to June • Number of days of extreme heat (Tmax > 40 °C) from June to August
In some cases, it was useful to have data outputs in absolute values and in others in “delta” values. The delta values are the change in a variable compared to the selected historical period. Where delta change is produced, outputs will be for each time horizon and each RCP (3 x 2 RCPs = 6 outputs) and for absolute, this will be for each time horizon, RCP and the historical period (3 x 2 RCPs + 1 historical = 7 outputs).
From the consultation with the stakeholders it was agreed the data would be delivered in two formats, for use by both experts and non-experts:
• Package 1 will include full datasets listed in Section 1 in NetCDF format, for use by experts • Package 2 will consist of simplified outputs for use by non-experts
To simplify outputs for non-experts, some reductions of the datasets are needed. These focus on re-ducing the spatial and temporal complexity of the datasets and are described in the sections below. After discussion with stakeholders, the following output formats were determined:
• Delimited format (.csv), with longitude, latitude and variable value listed as x,y,z • Spatially referenced rasters in Geotiff (.tif) format
These were chosen to be suitable given the specific technical expertise and experience working with climate data shown by the stakeholders to which the data is to be delivered.
5. Results The results were analysed across the nine models and RCP scenarios to gain an understanding to the trends as well as deviations in predictions of the outputs.
5.1 Ensemble Selection MOHC-HadGEM2 produced anomalous results for DJF and JJA following bias correction and therefore the two GCM-RCM combinations using this model were deselected from the model ensemble. All re-sults from this point are created with an ensemble consisting of 9 GCM-RCM combinations. Figures 12, 13 and 14 present delta changes in precipitation and temperature predicted by different GCM-

REPORT: UNDERSTANDING MOROCCO’s CLIMATE FUTURES
Using National Climate Change Data Sets to Support Planning and Investment
27
RCM combinations for the entire model domain for the months December, January, February (DJF) and June, July and August (JJA) and Annual time series respectively.
Figure 12. Delta changes in precipitation and temperature predicted by different GCM-RCM combina-tions for the entire model domain for the months DJF.
Figure 13. Delta changes in precipitation and temperature predicted by different GCM-RCM combina-tions for the entire model domain for the months JJA.

REPORT: UNDERSTANDING MOROCCO’s CLIMATE FUTURES
Using National Climate Change Data Sets to Support Planning and Investment
28
Figure 14. Delta changes in precipitation and temperature predicted by different GCM-RCM combina-tions for the entire model domain for annual data.
5.2 Average Climate-Base Variables
5.2.1 Absolute Values
In order to analyse the results, data was spatially aggregated into coastal, desert and mountain regions and temporarily aggregated between the peak dry months of June, July and August and the remaining wetter months between September and May. Figure 15 shows absolute mean precipitation for Mean Precipitation for the coastal, mountain and desert areas for the peak dry months (June, July August) and remaining months as well as for the annual period. Results show that for RCP 4.5, clear trends between the near, mid and far futures in the coast, mountain and desert areas cannot be identified. Results for RCP 8.5 show that a slightly decreasing trend in mean precipitation in the coastal and mountain areas from September to May. Results for RCP 8.5 also show that the range of mean pre-cipitation increases when compared to results from RCP 4.5 indicating an increase in variability in pre-cipitation for RCP 8.5. Variability increases are more pronounced for the coastal areas in near, mid and far futures and for the mountain areas in the far future.

REPORT: UNDERSTANDING MOROCCO’s CLIMATE FUTURES
Using National Climate Change Data Sets to Support Planning and Investment
29
Figure 15. Absolute mean Precipitation for the coastal, mountainous and desert areas for the peak dry months (June, July August) and remaining months as well as for the annual period.
Figure 16, 17 and 18 present absolute mean, minimum and maximum temperature graphs respec-tively for the coastal, mountain and desert areas for the peak dry months (June, July August) and re-maining months as well as for the annual period. Results show that the mean, maximum and minimum temperature for both RCP 4.5 and 8.5 will increase in the coast mountains and desert areas. The in-crease in absolute terms is higher for the summer months of June, July and August.
REPORT: UNDERSTANDING MOROCCO’s CLIMATE FUTURES
Using National Climate Change Data Sets to Support Planning and Investment
30
Figure 16. Absolute mean temperature for the coastal, mountainous and desert areas for the peak dry months (June, July August) and remaining months as well as for the annual period RCP 4.5 and RCP8.5
Figure 17. Absolute minimum temperature for the coastal, mountainous and desert areas for the peak dry months (June, July August) and remaining months as well as for the annual period for RCP 4.5 and 8.5
REPORT: UNDERSTANDING MOROCCO’s CLIMATE FUTURES
Using National Climate Change Data Sets to Support Planning and Investment
31
Figure 18. Absolute maximum temperature for the coastal, mountainous and desert areas for the peak dry months (June, July August) and remaining months as well as for the annual period for RCP 4.5 and 8.5
5.2.2 Delta Changes
Figure 19 and 20 show delta changes in annual mean and seasonal temperature for Morocco when comparing the historical period with future projections under both RCP 4.5 and 8.5. Results showed that the most extreme warming concentrated over higher mountain areas under RCP8.5 scenario for the annual as well as seasonal changes.

REPORT: UNDERSTANDING MOROCCO’s CLIMATE FUTURES
Using National Climate Change Data Sets to Support Planning and Investment
32
Figure 19. Delta changes in annual mean temperature when comparing the historical period with fu-ture projections under both RCP 4.5 and 8.5. White colour indicates regions with no RCM data available

REPORT: UNDERSTANDING MOROCCO’s CLIMATE FUTURES
Using National Climate Change Data Sets to Support Planning and Investment
33
Figure 20. Delta changes in seasonal mean temperature when comparing the historical period with future projections under both RCP 4.5 and 8.5. White colour indicates regions with no RCM data avail-able. Order (top to bottom): DJF, MAM, JJA, SON
Figure 21 and 22 show the delta changes in annual and seasonal mean precipitation when comparing the historical period with future projections under both RCP 4.5 and 8.5. The precipitation results show changes towards drier conditions in the future, especially in areas which currently have higher rainfall and is most prominent for distant future horizon (2080) and higher RCP scenario (RCP8.5).The results show quite high delta change values especially in areas with low rainfall. Therefore, when as-sessing the impact of cc on precipitation, absolute values are more useful.
REPORT: UNDERSTANDING MOROCCO’s CLIMATE FUTURES
Using National Climate Change Data Sets to Support Planning and Investment
34
Figure 21. Delta changes in annual mean precipitation when comparing the historical period with fu-ture projections under both RCP 4.5 and 8.5.

REPORT: UNDERSTANDING MOROCCO’s CLIMATE FUTURES
Using National Climate Change Data Sets to Support Planning and Investment
35
Figure 22. Delta changes in seasonal precipitation when comparing the historical period with future projections under both RCP 4.5 and 8.5 scenarios. Order (top to bottom): DJF, MAM, JJA, SON.

REPORT: UNDERSTANDING MOROCCO’s CLIMATE FUTURES
Using National Climate Change Data Sets to Support Planning and Investment
36
5.3 Extreme Indices Figures 23 and 24 present selected extreme indices for Temperature and Precipitation respectively. Generally, the results point to hotter and drier conditions in mountainous areas. More extended pe-riods of Annual maximum consecutive dry days (CDD) indicate an increased risk of droughts in the future.
Figure 23. Delta changes at various time horizons and RCP pathways in ensemble mean of extreme indices relating to temperature outputs for TXx, Tnn, SU_25, SU_40, FD and XFD (from top to bottom)

REPORT: UNDERSTANDING MOROCCO’s CLIMATE FUTURES
Using National Climate Change Data Sets to Support Planning and Investment
37
Figure 24. Delta changes at various time horizons and RCP pathways in ensemble mean of extreme indices relating to precipitation outputs for SDII, CDD, CWD, Rx5day, R10mm (From top to bottom)
In summary the trends shown in the data, and confirm the more local studies already undertaken by others, highlight:
o Drier and hotter over mountain areas o Hotter and drier over plains o Contrasting: Increases in max precip in dry areas

REPORT: UNDERSTANDING MOROCCO’s CLIMATE FUTURES
Using National Climate Change Data Sets to Support Planning and Investment
38
5.4 Uncertainty Modelled climate project data always contain elements of uncertainty that arise from various sources:
• Initial uncertainties in modelling • Downscaling • Reprojection/resampling • Bias correction
In order to reduce uncertainty, the study utilized multiple RCM and GCM projections. The individual projections were also assessed. As MOHC-HadGEM2 produced anomalous results for DJF and JJA fol-lowing bias correction, the two GCM-RCM combinations using this model were deselected from the model ensemble.
5.5 Limitations Bias correction produced some anomalously high 1-day precipitation values in desert areas – this is due to overcorrection of precipitation events in future model outputs outside of ecdf generated for historical period. If historical period was very dry, large precip event in future in a 99% dry area will be overcorrected. Bias correction should, as always, be approached with some caution – it has improved absolute values for some indicators but has introduced further uncertainty in others (especially intense-precip related indices in desert areas). In further studies, it is recommended to do more direct comparisons with bias corrected models from the CORDEX-Adjust project
5.6 Conclusions
The new data generated under this project will support climate change adaptation and resilience building discussions and planning in Morocco, particularly by those involved with managing water and food security. The model predictions highlight in particular that temperature increase is likely and this has important implications for the crops and livestock production possibilities because of heat stress at critical times, as well as irrigation needs as a result of increased evapotranspiration. The tempera-tures have also important implications for human activities particularly by the most vulnerable and energy consumption. The likely changes in precipitation indicate a decrease in some of the critical agriculture areas, and an increase in droughts. Solutions that integrate across technology, economics, and political innovations will be critical to ensure Morocco’s continued economic growth and the well-being of its people.

REPORT: UNDERSTANDING MOROCCO’s CLIMATE FUTURES
Using National Climate Change Data Sets to Support Planning and Investment
39
References Balaghi R., Jlibene M., Mrabet R., (2007). Gestion du risque de sécheresse agricole au Maroc. Sécheresse vol. 18, n°3, p1-8
Bartók, B., Wild, M., Folini, D., Lüthi, D., Kotlarski, S., Schär, C., Vautard, R., Jerez, S., Imecs, Z., (2017). Projected changes in surface solar radiation in CMIP5 global climate models and in EURO-CORDEX regional climate models for Europe. Climate Dynamics, 49 (7-8), pp. 2665-2683.
Betts R. A., L. Alfieri, C. Bradshaw, J. Caesar, L. Feyen, P. Friedlingstein, L. Gohar, A. Koutroulis, K. Lewis, C. Morfopoulos, L. Papadimitriou, K. J. Richardson, I. Tsanis, K. Wyser (2018) Changes in climate ex-tremes, fresh water availability and vulnerability to food insecurity projected at 1.5°C and 2°C global warming with a higher-resolution global climate model. Phil. Trans.R. Soc.A376:20160452. http://dx.doi.org/10.1098/rsta.2016.0452
Bizdaz A., Driouech F., El Rhaz K., Ilmen, R. (2020) Évaluation des simulations climatiques corrigées d’EURO-CORDEX sur le Maroc et changements futurs. Mémoire du Travail de Fin d'Études pour l'obtention du diplôme d'Ingénieur d'État de l'EHTP. Réalisé par A. Bizdaz, Encadré par Driouech F., El Rhaz K., et Suivi par R. Ilmen.
Cardoso, R.M., Soares, P.M.M., Lima, D.C.A., Miranda, P.M.A. (2018). Mean and extreme temperatures in a warming climate: EURO CORDEX and WRF regional climate high-resolution projections for Portu-gal Climate Dynamics, pp. 1-29. Article in Press.
Casanueva, A., Kotlarski, S., Herrera, S., Fernández, J., Gutiérrez, J.M., Boberg, F., Colette, A., Christen-sen, O.B., Goergen, K., Jacob, D., Keuler, K., Nikulin, G., Teichmann, C., Vautard, R. (2016). Daily pre-cipitation statistics in a EURO-CORDEX RCM ensemble: added value of raw and bias-corrected high-resolution simulations, Climate Dynamics, 47 (3-4), pp. 719-737.
Chahbouni, A. (2008). Penser Management de Développent Durable au Maroc. Tanger : Edition Maraya.
Chafai Elalaoui A (2006) Gestion du Risque Sécheresse au Maroc : Mise au point d’un Indicateur pour une Alerte Précoce à la Sécheresse. Proceedings 14th International Soil Conservation Organization Conference Water Management and Soil Conservation in Semi-Arid Environments Marrakech, Mo-rocco, May 14-19, 2006 (ISCO 2006)
DMN (2017) Evaluation des changements climatiques futurs au niveau du bassin versant de l’Oum Er-Rbia. Composante climatique du projet ABH-OER et la Banque Mondiale sur Mise en place d’actions d’adaptation appuyant la gestion des ressources en eau au niveau du bassin. Réalisé par la DMN au profit de l’ABH-OE [F. Driouech, K. El Rhaz, S. Moutia, W. Badi].

REPORT: UNDERSTANDING MOROCCO’s CLIMATE FUTURES
Using National Climate Change Data Sets to Support Planning and Investment
40
DMN (2018) Evaluation des changements climatiques futurs au niveau du bassin versant du Bouregreg et de la Chaouia. Réalisé par DMN au profit de l’ABHBC. [K. El Rhaz et S. Moutia].
Donat, M. G., Peterson, T. C., Brunet, M., King, A. D., Almazroui, M., Kolli, R. K., Boucherf, D., Al-Mulla, A. Y., Nour, A. Y., Aly, A. A., Nada, T. A. A., Semawi, M. M., Al Dashti, H. A., Salhab, T. G., El Fadli, K. I., Muftah, M. K., Dah Eida, S., Badi, W., Driouech, F., El Rhaz, K., Abubaker, M. J. Y., Ghulam, A. S., Erayah, A. S., Mansour, M. B., Alabdouli, W. O., Al Dhanhani, J. S. and Al Shekaili, M. N. (2014) Changes in extreme temperature and precipitation in the Arab region: long-term trends and variability related to ENSO and NAO. International Journal of Climatology, 34: 581–592. doi: 10.1002/joc.3707.
Dosio, A. (2016), Projections of climate change indices of temperature and precipitation from an en-semble of bias-adjusted high-resolution EURO-CORDEX regional climate models, J. Geophys. Res. At-mos., 121, 5488– 5511, doi:10.1002/2015JD024411.
Dosio A. (2017) Projection of temperature and heat waves for Africa with an ensemble of CORDEX Regional Climate Models. Climate Dynamics 49:493–519. DOI 10.1007/s00382- 016-3355-5.
Driouech F. (2010): Distribution des précipitations hivernales sur le Maroc dans le cadre d’un change-ment climatique : descente d’échelle et incertitudes, Thèse de Doctorat de l’Université de Toulouse, Institut National Polytechnique de Toulouse.
Driouech F., Déqué M., Mokssit A. (2009) Numerical simulation of the probability distribution function of precipitation over Morocco, Climate Dynamics, 32, 1055-1063. DOI 10.1007/s00382-008-04310-6.
Driouech. F., Ben Rached S., Al Hairech T (2013) Climate variability and change in North African Coun-tries. Chap9, In Climate Change and Food Security in West Asia and North Africa. Mannava V.K. Siva-kumar- Rattan Lal Ramasamy Selvaraju – Ibrahim Hamdan Editors. DOI 10.1007/978-94-007-6751-5. Springer Dordrecht Heidelberg New York London.
Driouech. F, Stafi H, Khouakhi A, et al. 2020 Recent observed country-wide climate trends in Morocco International Journal of Climatology, to be publishied 1-20
Economist Intelligence Unit, 2016, Drought conditions create risks for North Africa, http://country.eiu.com/article.aspx?articleid=353972019&Country=Morocco&topic=Economy&subtopic=Fo_1
Filahi, S., Tramblay ., Y., Mouhir,. L.,and Diaconescu, EP.,(2017) Projected changes in temperature and precipitation indices in Morocco from high-resolution regional climate models International Journal of Climatology, DOI: 10.1002/joc.5127

REPORT: UNDERSTANDING MOROCCO’s CLIMATE FUTURES
Using National Climate Change Data Sets to Support Planning and Investment
41
Fink AH, Brücher T, Krüger A, Leckebush GC, Pinto JG, Ulbrich U (2004) The 2003 European summer heatwaves and drought—synoptic diagnosis and impacts. Weather 59(8):209–216.
Flato, G., J. Marotzke, B. Abiodun, P. Braconnot, S.C. Chou, W. Collins, P. Cox, F. Driouech, S. Emori, V. Eyring, C. Forest, P. Gleckler, E. Guilyardi, C. Jakob, V. Kattsov, C. Reason and M. Rummukainen, (2013). Evaluation of Climate Models. In: Climate Change 2013: The Physical Science Basis. Contribution of Working Group I to the Fifth Assessment Report of the Intergovernmental Panel on Climate Change
Stocker, T.F., D. Qin, G.-K. Plattner, M. Tignor, S.K. Allen, J. Boschung, A. Nauels, Y. Xia, V. Bex and P.M. Midgley (eds.). Cambridge University Press, Cambridge, United Kingdom and New York, NY, USA.
Gao, X. and Giorgi, F. (2008) Increased Aridity in the Mediterranean Region under Greenhouse Gas Forcing Estimated from High Resolution Simulations with a Regional Climate Model. Global and Plan-etary Change, 62, 195-209.
Giorgi, F., Jones, C. and Asrar, G.R. (2009). Addressing climate information needs at the regional level: the CORDEX framework. WMO Bulletin 58 (3)
Giorgi, F., and E. Coppola, (2010): Does the model regional bias affect the projected regional climate change? An analysis of global model projections. Clim. Change, 100, 787–795.
Greve P., B. Orlowsky, B. Mueller, J. Sheeld, M. Reichstein, S. I. Seneviratne (2014): Global assessment of trends in wetting and drying over land. Nature Geoscience 7. 10.1038/ngeo2247.
Gudmundsson, L.; Bremnes, J.; Haugen, J.; Skaugen, T.E. (2012). Downscaling RCM precipitation to the station scale using quantile mapping–a comparison of methods. Hydrology and Earth System Sciences Discussion. 9(5): 6185-6201.
Hawkins, E.; Sutton, R. (2011). The potential to narrow uncertainty in projections of regional precipitation change. Climate Dynamics 37(1-2): 407-418.
Hertig E. and Tramblay Y., (2017) Regional downscaling of Mediterranean droughts under past and future climatic conditions. Global Planet Change 151:36–48.
Hssaisoune, M.; Bouchaou, L.; Sifeddine, A.; Bouimetarhan, I.; Chehbouni, A. (2020). Moroccan Groundwater Resources and Evolution with Global Climate Changes. Geosciences 10, 81.
Immerzeel, W., Pellicciotti, F. & Bierkens, M. (2013). Rising river flows throughout the twenty-first century in two Himalayan glacierized watersheds. Nature Geoscience 6, 742–745). https://doi.org/10.1038/ngeo1896

REPORT: UNDERSTANDING MOROCCO’s CLIMATE FUTURES
Using National Climate Change Data Sets to Support Planning and Investment
42
IPCC, (2007): Climate Change 2007: Synthesis Report. Contribution of Working Groups I, II and III to the Fourth Assessment Report of the Intergovernmental Panel on Climate Change [Core Writing Team, Pachauri, R.K and Reisinger, A. (eds.)]. IPCC, Geneva, Switzerland, 104 pp.
IPCC, 2013: Climate Change 2013: The Physical Science Basis. Contribution of Working Group I to the Fifth Assessment Report of the Intergovernmental Panel on Climate Change.,Stocker, T.F., D. Qin, G.-K. Plattner, M. Tignor, S.K. Allen, J. Boschung, A. Nauels, Y. Xia, V. Bex and P.M. Midgley (eds.). Cambridge University Press, Cambridge, United Kingdom and New York, NY, USA, 1535 pp.
Jakob Themeßl, M., Gobiet, A., & Leuprecht, A. (2011). Empirical-statistical downscaling and error correction of daily precipitation from regional climate models. International Journal of Climatology, 31(10), 1530-1544.
Jarlan, L., et al., (2015). Remote sensing of water resources in semi-arid mediterranean areas: the joint international laboratory TREMA. International Journal of Remote Sensing, 36 (19–20), 4879–4917. doi:10.1080/01431161.2015.1093198
Khomsi, K.; Mahe, G.; Tramblay, Y.; Sinan, M.; Snoussi, M. (2015) Trends in Rainfall and Temperature Extremes in Morocco. Nat. Hazards Earth Syst. Sci. Discuss., 3, 1175–1201
Lafon, T.; Dadson, S.; Buys, G.; Prudhomme, C. (2013). Bias correction of daily precipitation simulated by a regional climate model: a comparison of methods. International Journal of Climatology 33(6): 1367-1381.
Laprise, R., (2008). Regional climate modelling. J. Comput. Phys., 227, 3641–3666
Larabi, A., Elhamidi M. J., Faouzi, M and Bouaamlat I. (2017). Modeling the Impacts of Climate Change on the Aquifers in Morocco. International Journal of Water Resources and Arid Environments 6(2): 133-142
Lionello, P., P. Malanotte and R. Boscolo, (Eds.), (2006) Mediterranean Climate Variability Hydrogeology journal. DOI 10.1007/ s10040-016-1409-2006.Elsevier, 8.Amsterdam.
Lutz, A.F., ter Maat, H.W., Wijngaard, R.R. et al. (2019). South Asian river basins in a 1.5 °C warmer world. Reg Environ Change 19, 833–847 https://doi.org/10.1007/s10113-018-1433-4
Mascaro, G., Viola, F., Deidda, R. (2018). Evaluation of Precipitation From EURO-CORDEX Regional Climate Simulations in a Small-Scale Mediterranean Site Journal of Geophysical Research: Atmos-pheres, 123 (3), pp. 1604-1625.
M’Bark, A.; Bouchaou, L. (2004). Les Problèmes Majeurs de La Gestion de l’eau Au Maroc. Sécheresse (Montrouge), 15, 187–194.

REPORT: UNDERSTANDING MOROCCO’s CLIMATE FUTURES
Using National Climate Change Data Sets to Support Planning and Investment
43
Meehl, G.A., T.F. Stocker, W.D. Collins, P. Friedlingstein, A.T. Gaye, J.M. Gregory, A. Kitoh, R. Knutti ... I.G. Watterson, A.J. Weaver and Z.-C. Zhao, (2007). Global climate projections. In: Solomon S, et al., (eds). Climate Change 2007: The Physical Science Basis. Cambridge, UK, and New York: Cambridge Univ Pres. pp. 747–845.
Ouzeau, G., Soubeyroux, J.-M., Schneider, M., Vautard, R., Planton, S. (2016) Heat waves analysis over France in present and future climate: Application of a new method on the EURO-CORDEX ensemble, Climate Services, 4, pp. 1-12.
Parkers, W.S. (2016). Reanalyses and observations: what’s the difference? Bulletin of the American Meteorological Society, 97(9):160128144638003. DOI: 10.1175/BAMS-D-14-00226.1
Polade S. D., A. Gershunov, D. R. Cayan, M. D. Dettinger, D. W. Pierce (2017) Precipitation in a warming world: Assessing projected hydro-climate changes in California and other Mediterranean climate re-gions. Scientific Reports 7: 10783. DOI:10.1038/s41598-017-11285-y.
Schilling J, Freier KP, Hertig E, Scheffran J. (2012). Climate change, vulnerability and adaptation in North Africa with focus on Morocco. Agric. Ecosyst. Environ. 156: 12–26.
Schmidli, J., C. Goodess, C. Frei, M. Haylock, Y. Hundecha, J. Ribalaygua, and T. Schmith, (2007). Statis-tical and dynamical downscaling of precipitation: An evaluation and comparison of scenarios for the European Alps. J. Geophys. Res. Atmos., 112, D04105.
Teutschbein, C.; Seibert, J. (2012). Bias correction of regional climate model simulations for hydrological climate-change impact studies: Review and evaluation of different methods. Journal of hydrology 456: 12-29.
Wang, B., H. Wan, Z. Z. Ji, X. Zhang, R. C. Yu, Y. Q. Yu, and H. T. Liu, (2004). Design of a new dynamical core for global atmospheric models based on some efficient numerical methods. Sci. China A, 47, 4–21.

REPORT: UNDERSTANDING MOROCCO’s CLIMATE FUTURES
Using National Climate Change Data Sets to Support Planning and Investment
44