report to the national measurement system …publications.npl.co.uk/npl_web/pdf/cmsc20.pdfhuman...
TRANSCRIPT

NPL Report CMSC 20/03
Report to the National Measurement System Directorate, Department of Trade and Industry
New Directions – Soft Metrology – Requirements for support from Mathematics, Statistics and Software
Michael R Pointer
April 2003


NPL Report CMSC 20/03
Page i of iv
New Directions – Soft Metrology requirements for Support from
Mathematics, Statistics and Software: recommendations for the Software Support for Metrology programme
2004-2007
Michael R Pointer Centre for Optical and Analytical Metrology
April 2003
ABSTRACT
A study has been conducted to elicit future requirements for mathematical analysis and relevant software applied to the area of Soft Metrology, to identify the generic support needed from the Software Support for Metrology (SSfM) programme, and to propose potential topics for inclusion in the formulation of the SSfM 2004-2007 programme.
Soft metrology is defined as: measurement techniques and models which enable the objective quantification of properties which are determined by human perception. The human response may be in any of the five senses: sight, smell, sound, taste and touch.
Thus, soft metrology includes aspects of appearance (colour and gloss), noise quality, texture of food (such as creaminess) and, more broadly, topics such as biometrics and usability of systems.

NPL Report CMSC 20/03
Page ii of iv
� Crown Copyright 2003
Reproduced by Permission of the Controller of HMSO
ISSN 1471-0005
National Physical Laboratory Queens Road, Teddington, Middlesex, TW11 0LW
Extracts from this report may be reproduced provided the source is acknowledged and the extract is not taken out of context.
Approved on behalf of the Managing Director, NPL by Dr Dave Rayner,
Head of the Centre for Mathematics and Scientific Computing
NPL Report CMSC 20/03
Page iii of iv
CONTENTS
Executive Summary ............................................................................................1
1. Introduction ..................................................................................................2
1.1 A definition ................................................................................................................2
1.2 Examples....................................................................................................................3
1.3 Measurement scales ...................................................................................................4
1.4 Economic relevance of soft metrology ......................................................................6
1.5 Report scope...............................................................................................................6
2 Soft Metrology Process and Issues .............................................................7
3 Potential Applications..................................................................................7
4 Questionnaire, Response and Discussion...................................................8
5 Another approach ........................................................................................9
5.1 An example ..............................................................................................................10
6 Standardisation ..........................................................................................11
7 Relationship between Soft Metrology and Biometrics ...........................12
8. Soft Metrology and Data Visualisation ....................................................13
9. Conclusions .................................................................................................13
10. Recommendations...................................................................................14
11. Acknowledgements .................................................................................14
Appendix 1 - Questionnaire .............................................................................15

NPL Report CMSC 20/03
Page iv of iv
Appendix 2 – Responses to the Questionnaire from within NPL.................18
Appendix 3 – External Responses to the Questionnaire ...............................22

NPL Report CMSC 20/03
Page 1 of 25
EXECUTIVE SUMMARY
A study has been conducted to elicit future requirements for mathematical analysis and relevant software applied to the area of Soft Metrology, to identify the generic support needed from the Software Support for Metrology (SSfM) programme, and to propose potential topics for inclusion in a future SSfM programme.
Soft metrology is defined as:
measurement techniques and models which enable the objective quantification of properties which are determined by human perception. (The human response may be in any of the five senses: sight, smell, sound, taste and touch.)
Thus, soft metrology includes aspects of appearance (colour and gloss), noise quality, texture of food (such as creaminess) and, more broadly, topics such as biometrics and usability of systems. Key conclusions indicate a need for: �� Case Studies based on real industrial applications �� Best Practice to be demonstrated from a position of leadership �� Extending work on biometric testing to soft metrology �� The development of a mathematical techniques toolkit �� Understanding of uncertainty in subjective and objective data comparison and correlation
The questionnaire responses indicate: �� An interest in soft metrology, and a belief that it is applicable to a variety of
measurement problems �� The lack of a clear methodology for formulating soft metrology solutions �� A current dearth of objective and subjective data to enable analysis �� The mathematical requirements and techniques to be used are not clearly defined. Most
possible methods suggested were selected at least once, although some respondents admitted that they did not have a view as to what techniques should be used to analyse their data.
�� The lack of understanding of the problem suggests an education role for NPL. NPL has some experience of soft metrology in appearance measurement and is also beginning an effort to measure tactile responses.
�� A major deficiency is the lack of awareness on how to derive the subjective data. Many industrial companies do not have the knowledge, facilities or staff to do this.
�� Many questionnaire respondents expressed a wish to see the production of Case Studies and Best Practice Guides. NPL could show leadership by writing these documents, aimed at specific industrial solutions. This effort could perhaps be carried out in conjunction with those industries and should include a strong emphasis on the design of the necessary experiments to gather suitable human response data, as well as good physical measurements.
NPL Report CMSC 20/03
Page 2 of 25
1. INTRODUCTION 1.1 A definition
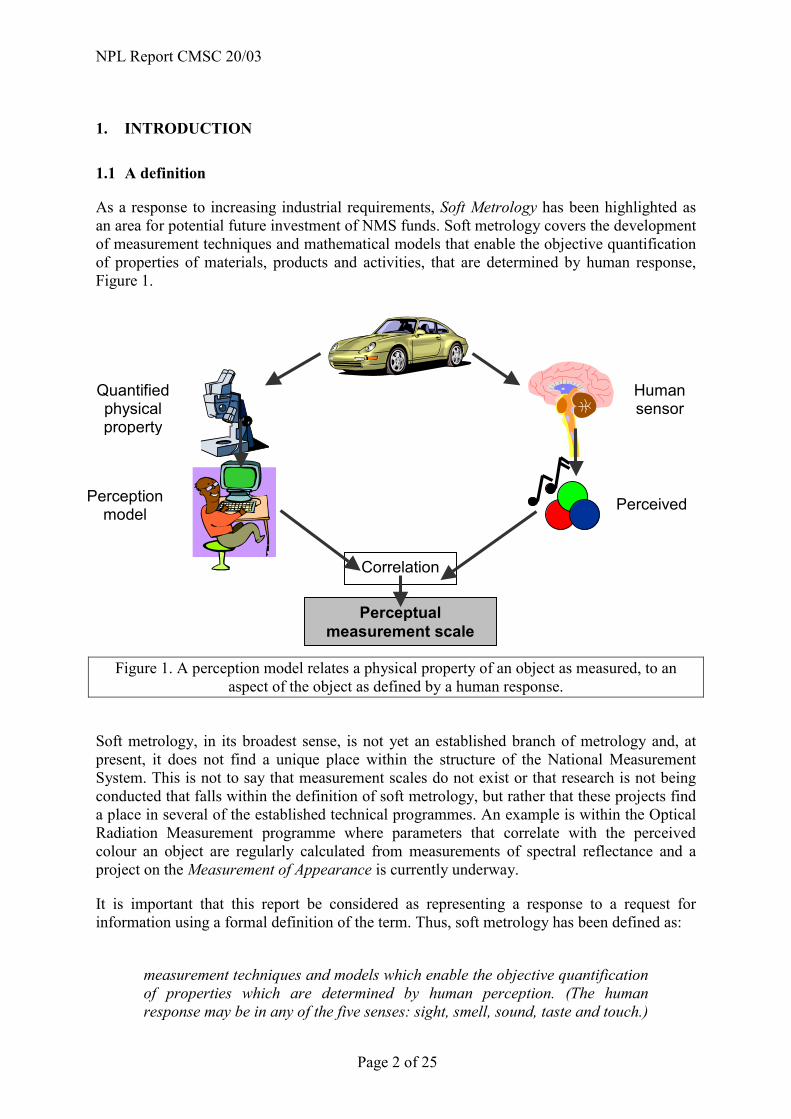
As a response to increasing industrial requirements, Soft Metrology has been highlighted as an area for potential future investment of NMS funds. Soft metrology covers the development of measurement techniques and mathematical models that enable the objective quantification of properties of materials, products and activities, that are determined by human response, Figure 1.
Figure 1. A perception model relates a physical property of an object as measured, to an aspect of the object as defined by a human response.
Soft metrology, in its broadest sense, is not yet an established branch of metrology and, at present, it does not find a unique place within the structure of the National Measurement System. This is not to say that measurement scales do not exist or that research is not being conducted that falls within the definition of soft metrology, but rather that these projects find a place in several of the established technical programmes. An example is within the Optical Radiation Measurement programme where parameters that correlate with the perceived colour an object are regularly calculated from measurements of spectral reflectance and a project on the Measurement of Appearance is currently underway.
It is important that this report be considered as representing a response to a request for information using a formal definition of the term. Thus, soft metrology has been defined as:
measurement techniques and models which enable the objective quantification of properties which are determined by human perception. (The human response may be in any of the five senses: sight, smell, sound, taste and touch.)
Humansensor
Correlation
Perception model Perceived
Quantified physical property
Perceptual measurement scale

NPL Report CMSC 20/03
Page 3 of 25
Soft metrology entails the measurement of appropriate physical parameters and the development of models to correlate them to perceptual quantities. Traceable soft metrology is achieved both through the traceable measurement of the physical parameters and the development of accurate correlation models.
1.2 Examples
One way of thinking about the subject of soft metrology is to consider, as an example, the perception and measurement of length. Consider a series of boxes perceived to increase in size, Figure 2.
Figure 2. A set of boxes that are perceived to increase in SIZE: the corresponding physical measurement is of LENGTH (for example, in metres).
A human observer could be asked to denote a number that relates to their impression of the size. Equally, a device could be constructed, for example a ruler, which could be used to ‘measure’ the size of each box. It is likely that the human responses, the ‘soft’ measure, will correlate with the measurements made using the ruler, the physical measure. Thus, soft metrology can be considered the formulation of a correlation between the human response and the physical measure. This example may be thought trivial because we all understand the concept of using a ruler as a readily available measuring device. If required, the ruler can be calibrated and form part of a traceable measurement system with associated measurement uncertainties.
A second example might prove a little more demanding. Consider the series of boxes shown in Figure 3.
Figure 3. A set of boxes that differ in a systematic manner.
To the human observer, something is changing as the boxes are scanned from left to right – but what is it? How can it be described? Some may call it lightness, some brightness, some density; others may think in terms of the amount of ink that has been laid down on the paper in reproducing each box. It has been shown by experiment that human observers, after a little training, can give a consistent response to the changes they see. Equally, a number of physical measures, for example the reflectance, the density or even the luminance, can be made of each box using a suitable meter, and a scale constructed that relates the two ‘measures’.

NPL Report CMSC 20/03
Page 4 of 25
1.3 Measurement scales
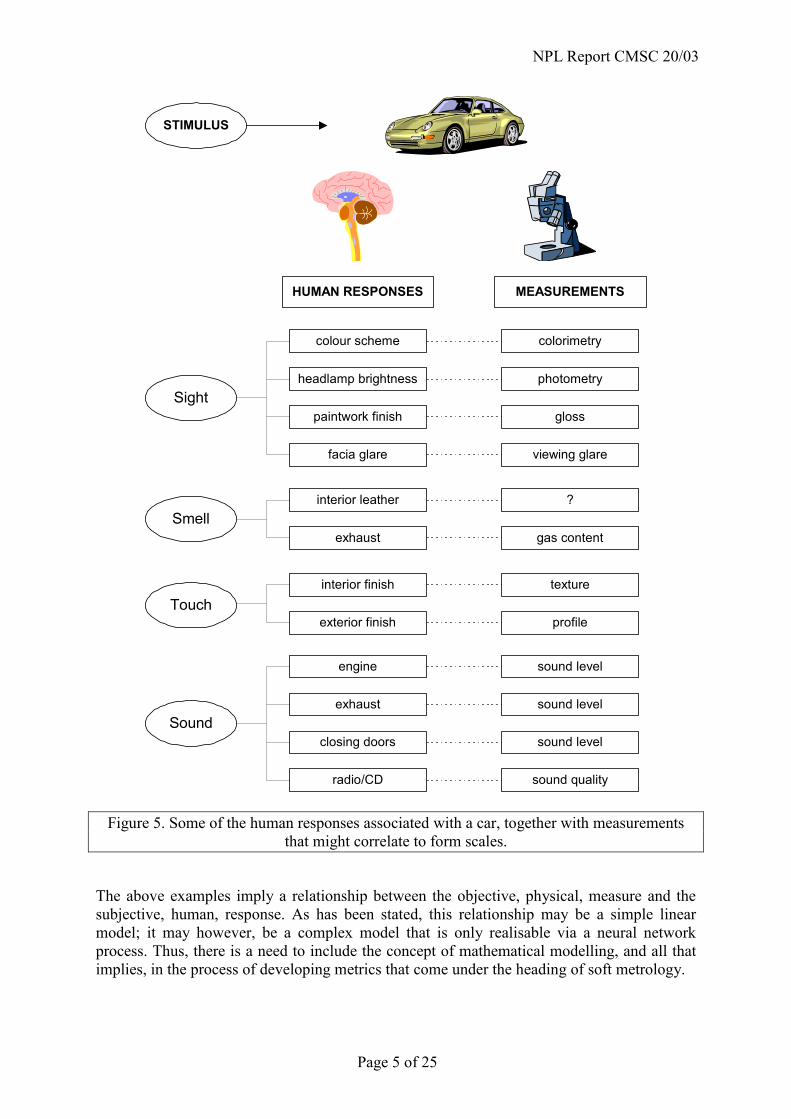
Thus, soft metrology can be considered as the investigation of correlation between human, subjective, responses and physical, objective, measures. What is generated is a measurement scale, a number series, which allows the subjective response to be predicted from the objective measure, Figure 4. Thus, in the example in Figure 3, the perceived lightness of each box can be predicted from a measure of its relative luminance. It should be noted that the relationship between the subjective and the objective measures that defines the scale does not have to be linear, may involve more than one objective measure, may involve more than one subjective response, and may be probabilistic in nature reflecting the inconsistencies in human judgements. For example, the appearance of the boxes in Figure 3 may change according to the level and colour of the illumination used to view them as well as by the variation in the reflectance of the surface. There are many examples that could be given of human responses and their associated measurements. To date most of these examples are associated with visual and aural response because it is in these areas that most advances have been made in seeking correlations between the subjective and objective measures. Figure 5 provides an illustrations of the soft metrology associated with a typical consumer product; a car.
HUMANRESPONSES MEASUREMENTS
Visual response
STIMULUS
Subjective
Perceptual
Olfactory response
Aural response
Flavoural response
Tactile response
Sight
Smell
Sound
Taste
Touch
Objective
Physical
Colorimetry
Photometry
Sound level
?
MEASUREMENTSCALECorrelation
Figure 4. The relationship between the human responses to a stimulus, the physical measurements made from that stimulus, and the derived measurement scale.
NPL Report CMSC 20/03
Page 5 of 25
HUMAN RESPONSES
interior leather
interior finish
colour scheme
headlamp brightness
exhaust
paintwork finish
exterior finish
closing doors
exhaust
engine
radio/CD
facia glare
colorimetry
photometry
gloss
viewing glare
?
gas content
texture
profile
sound level
sound level
sound level
sound quality
MEASUREMENTS
Sound
Touch
Smell
Sight
STIMULUS
Figure 5. Some of the human responses associated with a car, together with measurements that might correlate to form scales.
The above examples imply a relationship between the objective, physical, measure and the subjective, human, response. As has been stated, this relationship may be a simple linear model; it may however, be a complex model that is only realisable via a neural network process. Thus, there is a need to include the concept of mathematical modelling, and all that implies, in the process of developing metrics that come under the heading of soft metrology.
NPL Report CMSC 20/03
Page 6 of 25
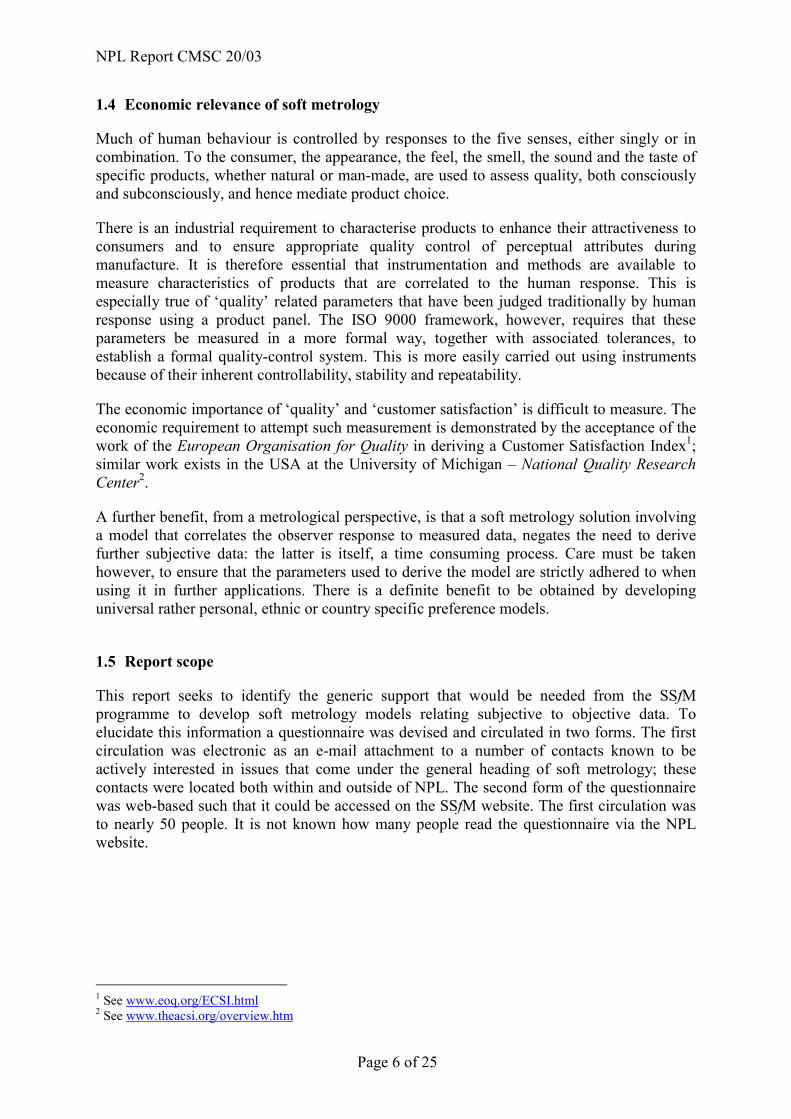
1.4 Economic relevance of soft metrology
Much of human behaviour is controlled by responses to the five senses, either singly or in combination. To the consumer, the appearance, the feel, the smell, the sound and the taste of specific products, whether natural or man-made, are used to assess quality, both consciously and subconsciously, and hence mediate product choice.
There is an industrial requirement to characterise products to enhance their attractiveness to consumers and to ensure appropriate quality control of perceptual attributes during manufacture. It is therefore essential that instrumentation and methods are available to measure characteristics of products that are correlated to the human response. This is especially true of ‘quality’ related parameters that have been judged traditionally by human response using a product panel. The ISO 9000 framework, however, requires that these parameters be measured in a more formal way, together with associated tolerances, to establish a formal quality-control system. This is more easily carried out using instruments because of their inherent controllability, stability and repeatability.
The economic importance of ‘quality’ and ‘customer satisfaction’ is difficult to measure. The economic requirement to attempt such measurement is demonstrated by the acceptance of the work of the European Organisation for Quality in deriving a Customer Satisfaction Index1; similar work exists in the USA at the University of Michigan – National Quality Research Center2.
A further benefit, from a metrological perspective, is that a soft metrology solution involving a model that correlates the observer response to measured data, negates the need to derive further subjective data: the latter is itself, a time consuming process. Care must be taken however, to ensure that the parameters used to derive the model are strictly adhered to when using it in further applications. There is a definite benefit to be obtained by developing universal rather personal, ethnic or country specific preference models.
1.5 Report scope
This report seeks to identify the generic support that would be needed from the SSfM programme to develop soft metrology models relating subjective to objective data. To elucidate this information a questionnaire was devised and circulated in two forms. The first circulation was electronic as an e-mail attachment to a number of contacts known to be actively interested in issues that come under the general heading of soft metrology; these contacts were located both within and outside of NPL. The second form of the questionnaire was web-based such that it could be accessed on the SSfM website. The first circulation was to nearly 50 people. It is not known how many people read the questionnaire via the NPL website.
1 See www.eoq.org/ECSI.html 2 See www.theacsi.org/overview.htm

NPL Report CMSC 20/03
Page 7 of 25
2 SOFT METROLOGY PROCESS AND ISSUES The process involved in developing a solution to a soft metrology application can be summarised as follow:
�� Understanding the customer requirement – what needs to be ‘measured’? o Does prior art exist in the form of a partial model?
�� Devise a procedure to obtain the required subjective data and establish the associated uncertainty
o Potential influencing factors need to be considered, for example: ��illumination, background, ��type of question asked, ��age, sex, etc. of human subjects, …
�� Devise a procedure to obtain the required objective measurements and establish the associated uncertainty
�� Collect the subjective and objective data �� Model the relationship between the subjective data and the objective measurements
o Variety of techniques are available: ��regression ��data fitting ��optimisation ��finite element or difference techniques ��image processing ��data fusion ��data mining ��genetic algorithms ��Fourier analysis ��wavelets ��neural networks ��Monte Carlo simulation ��Bayesian statistics ��principal component analysis
�� Verify the model using different human subjects, different objective data, etc.
3 POTENTIAL APPLICATIONS Potential applications of soft metrology are almost limitless. The following represent some known real problems, some of which (those denoted with an asterisk) are being investigated as part of present NPL programmes:
�� The measurement of the apparent change in a fabric after multiple washing, and the correlation with perceived quality*.
�� The measurement and comparison of the ‘grittiness’ of a range of similar food products but from different manufacturers.
�� The measurement of the appearance of an industrial floor covering + polish and its relation to perceived quality and safety*.
�� The measurement of the feel of a surgical dressing according the materials used to manufacture it*.
�� The measurement of the ‘hang’ of curtains.
NPL Report CMSC 20/03
Page 8 of 25
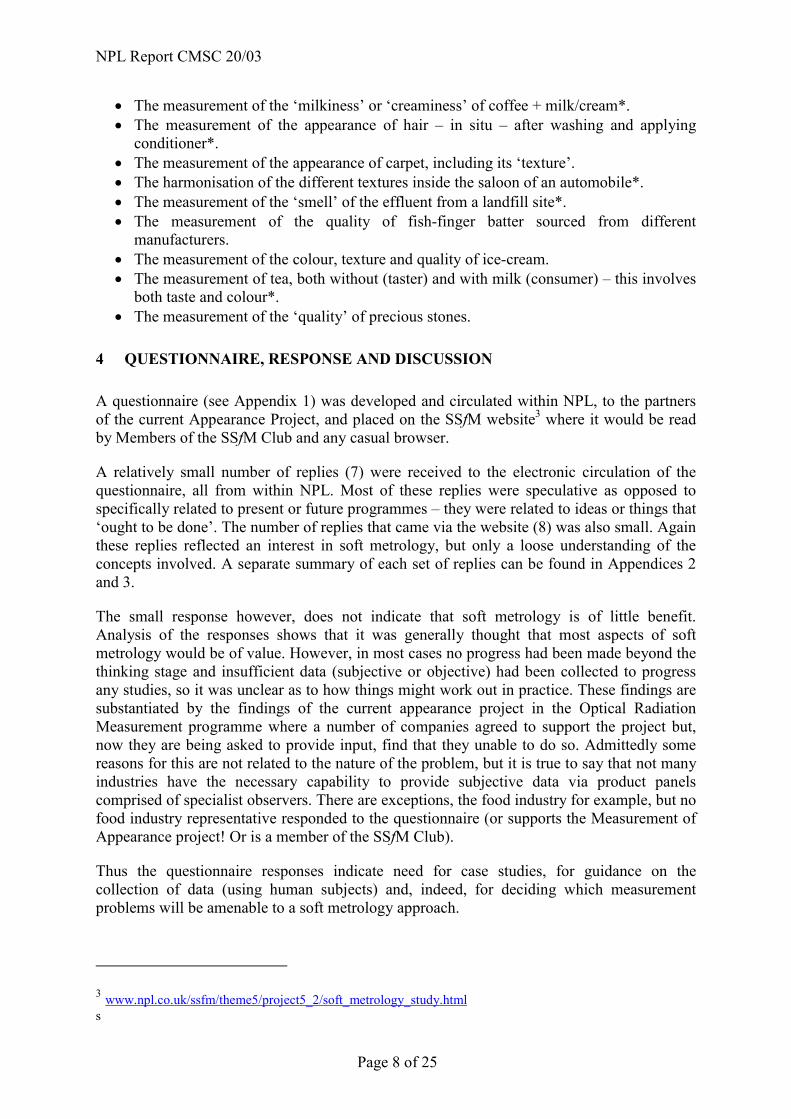
�� The measurement of the ‘milkiness’ or ‘creaminess’ of coffee + milk/cream*. �� The measurement of the appearance of hair – in situ – after washing and applying
conditioner*. �� The measurement of the appearance of carpet, including its ‘texture’. �� The harmonisation of the different textures inside the saloon of an automobile*. �� The measurement of the ‘smell’ of the effluent from a landfill site*. �� The measurement of the quality of fish-finger batter sourced from different
manufacturers. �� The measurement of the colour, texture and quality of ice-cream. �� The measurement of tea, both without (taster) and with milk (consumer) – this involves
both taste and colour*. �� The measurement of the ‘quality’ of precious stones.
4 QUESTIONNAIRE, RESPONSE AND DISCUSSION
A questionnaire (see Appendix 1) was developed and circulated within NPL, to the partners of the current Appearance Project, and placed on the SSfM website3 where it would be read by Members of the SSfM Club and any casual browser.
A relatively small number of replies (7) were received to the electronic circulation of the questionnaire, all from within NPL. Most of these replies were speculative as opposed to specifically related to present or future programmes – they were related to ideas or things that ‘ought to be done’. The number of replies that came via the website (8) was also small. Again these replies reflected an interest in soft metrology, but only a loose understanding of the concepts involved. A separate summary of each set of replies can be found in Appendices 2 and 3.
The small response however, does not indicate that soft metrology is of little benefit. Analysis of the responses shows that it was generally thought that most aspects of soft metrology would be of value. However, in most cases no progress had been made beyond the thinking stage and insufficient data (subjective or objective) had been collected to progress any studies, so it was unclear as to how things might work out in practice. These findings are substantiated by the findings of the current appearance project in the Optical Radiation Measurement programme where a number of companies agreed to support the project but, now they are being asked to provide input, find that they unable to do so. Admittedly some reasons for this are not related to the nature of the problem, but it is true to say that not many industries have the necessary capability to provide subjective data via product panels comprised of specialist observers. There are exceptions, the food industry for example, but no food industry representative responded to the questionnaire (or supports the Measurement of Appearance project! Or is a member of the SSfM Club).
Thus the questionnaire responses indicate need for case studies, for guidance on the collection of data (using human subjects) and, indeed, for deciding which measurement problems will be amenable to a soft metrology approach.
3 www.npl.co.uk/ssfm/theme5/project5_2/soft_metrology_study.html s

NPL Report CMSC 20/03
Page 9 of 25
The questionnaire responses on the mathematical requirements were inconclusive. This must be because, even if there is a genuine interest in the problem, there is no strong knowledge, from a mathematical or statistical perspective, on how to provide the solution. Indeed there may be no strong knowledge on how to formulate the problem! Thus, any input from this direction must be from a position of leadership rather than acceding to requirement.
The following quote is from a scoping study for another NMS programme; it seems to substantiate the findings reported above:
“We asked if enough ‘soft’ metrology was included in the current programme. In one sense of ‘soft’, namely metrology taking account of human factors, there was support for including more work on appearance. Working Group members knew of some applications in the automotive industry, but in general (e.g. food, where there were thought to be great opportunities) the industrial needs are poorly articulated.”
In order for the NMS to make any progress in the area of ‘soft metrology’, it seems reasonable that effort needs to be expended, not just in providing mathematically-based solutions, but also in the provision of skills to help in problem formulation, experimental design, data gathering and all that this implies. It seems reasonable that a positive way forward is to gather suitable data, such that a series of Case Studies can be written to demonstrate what can be done.
It is clear, both from the results of the survey and from other industrial contacts interested in soft metrology, that there is a lack of understanding on how to specify and design experiments suitable for gathering subjective data that relates to the human response. These experiments are not trivial because of the nature of the requirement. There are many factors that influence, perhaps indirectly, the results: the sample selection, the viewing conditions, the choice of observers (race, ethnic origin, sex, number etc.), the design of the data gathering session (length, number of samples for response, number of questions asked, repetition, the actual questions asked, etc.). In this respect, the problems are remarkably similar to those in biometric4 systems, where such effects considerably complicate performance estimation and prediction. The Best Practices for Biometric System Evaluation, already produced by NPL, could potentially be broadened to apply to development and assessment of other pattern or feature recognition systems used for soft metrology rather than identification. This is discussed further in Section 7 below.
5 ANOTHER APPROACH
If industry is unsure as to its requirements, it is, perhaps, relevant to approach the subject of ‘soft metrology’ from the other direction. Rather than ask industry what it would like to ‘measure’, it might be useful to derive a set or sets of measurements within NPL to offer to industry as an example of what could be achieved. This is the approach that has been adopted within the present project on the Measurement of Appearance in the Optical Radiation Measurement programme, where a portfolio of samples is being assembled, each with an 4 The terms "Biometrics" and "Biometry" have been used since early in the 20th century to refer to the field of development of statistical and mathematical methods applicable to data analysis problems in the biological sciences. Recently, the term "Biometrics" has also been used to refer to the emerging field of technology devoted to identification of individuals using biological traits, such as those based on retinal or iris scanning, fingerprints, or face recognition. It is in this latter sense that NPL has developed a Best Practice Guide.

NPL Report CMSC 20/03
Page 10 of 25
associated large body of data, and its interpretation in terms of the ‘appearance’ of the coloured sample. This is, however, relatively easy to do for the assessment of visual appearance, because the subjective and objective measurement of colour, gloss, etc., are both established sciences and, for example, colour appearance models have found some acceptance in deriving true correlates of visual appearance.
Thus, it might be reasonable for NPL to instigate a series of experiments to derive data sets for specific industries to demonstrate what is achievable. The publication of these data in a suitable learned journal would further serve to describe the concept of the correlation between subjective and objective data. It is imperative that any experiments of this type be supported by the relevant industry, which would supply the samples for evaluation. It would also be most useful if they were able to supply some of the observers, although it would be equally useful if some observers came from within NPL, so that relevant experience is obtained.
5.1 An example
Within the current appearance programme at NPL the subject of ‘texture’ has been highlighted as potential area needing a greater understanding. The concept of texture is intuitively obvious but is difficult to define. The American Society for Testing and Materials has:
The visible surface structure depending on the size and organisation of small constituent parts of a material; typically, the surface of a woven fabric.
While this definition is satisfactory, it is by no means complete and is, perhaps, spoilt by the example. If this is a definition of visual texture, it is necessary to differentiate between what is becoming known as physical texture, texture associated with physical, topological, variability in a surface, and optical texture, texture associated with spatial variation in appearance caused by non-uniformity of colorant. An example of the former is a woven fabric and of the latter is a metallic automobile finish where the variation caused by the spatial distribution of the discrete metallic flakes is visible through an acrylic varnish overcoat which itself gives a smooth, high gloss, finish. The human response to texture is syntactic and can use terms like fine, coarse, grained, and smooth. Alternatively, texture can be described as a variation in tone (intensity or lightness) and structure. Other responses to a physical surface may be in terms of its roughness, smoothness, ripple or ‘orange peel’ – its apparent mottle or speckle.
Whichever scheme is used, the words are attempting to describe a variation and it is pertinent to try to establish what it is that is actually varying. The building blocks of texture can be considered as texture elements – those elements of the physical surface that are perceived to be different. Texture can then be described by the number and types of primitives, and by their relative spatial relationships, a process called texture classification. It should also be noted that the perception of physical texture is scale dependent; the viewing distance from the physical surface will influence the perception: it is also heavily dependent on the combination of the angles of illumination and viewing.
Thus, to progress towards the ‘measurement’ of texture it is necessary to devise an experiment that goes some way towards scaling a particular set of samples that vary in a
NPL Report CMSC 20/03
Page 11 of 25
defined manner. The scaling has to be carried by human observers who might need training to refine their skills.
An obvious way of progressing with the ‘measurement’ of the textures is to take a suitable digital image of the structure and then analyse it in a statistical manner. Suggested techniques include spatial variation, run-length variation, Fourier analysis, fractal analysis, and several more. These analyses can be used to derive a set of numbers that characterise the texture. The numbers can then be used as the input to a second software routine that attempts to classify the texture – this could be a neural network type of program. A further step is to investigate the concept of texture harmonisation that involves describing what textures are acceptable when placed together.
Thus, there are four requirements:
�� a derivation of the objects, and their associated texture(s), as stimuli for the experiment,
�� a procedure to obtain the physical measurements – perhaps via analysis of a series of digital images of the objects,
�� a procedure to obtain the psychophysical responses – the scaling of the samples using human observers,
�� a derivation of the psychological requirement – an investigation into the harmonisation of different textures in a specific application.
The first three requirements are probably within the scope of a possible project at NPL; the latter, however, is in the realm of the customer and requires the input of a true ‘expert’!
6 STANDARDISATION
It can be argued that standardisation via, for example, ISO, would be a useful way forward such that similar techniques, experimental designs, etc., are applied to different situations. This enables regularity of practice and ease of comparison of data. NPL is already involved in taking forward best practice and reporting performance of biometric systems via ISO/JTC1/SC37.
There is a potential danger in taking this as a way forward, in that it is important that the method should not restrict the industrial requirement and the subsequent data collection. As an example of this restriction, there is a move within the world of image quality metrics to restrict, via a series of ISO standards, the experimental methodologies that can be used to assess visually the ‘quality’ of an image, either as a single stimulus (acceptability) or in direct comparison with a reference image (perceptibility). This restriction is such that some methods currently used by industry are no longer recommended, even though they are valid experimental techniques, with clear methodologies for the statistical analysis of the resulting data.
NPL has a clear leadership path to follow in recommending and unifying good practice and the availability of suitable data to support this effort would be most useful.

NPL Report CMSC 20/03
Page 12 of 25
7 RELATIONSHIP BETWEEN SOFT METROLOGY AND BIOMETRICS
Biometric techniques are used to identify or authenticate the identity of individual people. These techniques involve measuring some physical characteristic of a person, where that characteristic is believed to be unique to an individual. Examples that are in use today are face recognition, fingerprints, iris patterns, retina patterns, hand geometry, vein geometry, voice recognition, signatures and other hand-writing recognition, and DNA fingerprinting.
Some of these, particularly face, voice and signature recognition, are techniques that humans use to recognise one another. In these cases, there is a correlation between the human subjective perception and the physical objective measurements made by biometric systems. In this sense, there is a relationship between these biometric measurements and soft metrology. However, the difference is that the biometric measurement techniques do not aim to emulate only the human perception, but rather they aim to perform the recognition task more reliably, repeatability and accurately than could ever be achieved by a human observer. Nevertheless, this is an area in which subjective and objective data can be collected and correlated, and we note several similarities between soft metrology and biometrics:
�� The mathematical and statistical techniques used in current biometric systems are the same generic techniques that are suggested for soft metrology;
�� In both there is the need to collect data from human subjects, and the same inherent problems of variability due to person-type (age, sex, nationality, occupation, affects of mood etc.) and the environment in which the data is collected.
�� In both cases collected data is used to develop the biometric or soft metrology system, as well as to verify the accuracy of such systems.
�� There is a similar statistical or probabilistic nature of the physiological and behavioural measurements.
There is already an NPL Best Practice Guide on how to conduct objective evaluations of biometric devices. The areas that this guide covers include how to collect and analyse the data from human subjects, the metrics to be used to compare alternative devices irrespective of the biometric being used, and guidance on estimating the uncertainties in these measures. Much of this would be equally relevant to data collection and analyses in soft metrology.
The SSfM programme could have a useful role in investigating how lessons learned in biometric device evaluation could benefit soft metrology. Candidate activities that have been suggested are as follows:
�� Investigate how the biometric device evaluation Best Practice Guide might be adapted to produce a guide on the conduct of soft metrology evaluations.
�� Facilitate a trial comparison of the effectiveness of various biometric devices and a trial evaluation of soft metrology measurement systems, with the aim of collecting both subjective and objective data, using a large set of volunteer users, and publishing the results of the analysis of the data (including the correlation between subjective and objective data).

NPL Report CMSC 20/03
Page 13 of 25
�� Compare techniques in use for analysis of biometric device data and soft metrology data, with the aim of identifying lessons and potential areas for improvement.
8. SOFT METROLOGY AND DATA VISUALISATION
Many areas of metrology make use of data visualisation techniques, often using complex software packages with high quality full-colour graphics images. It is important that the human perception of these visualisations enables the user to obtain valid understandings of the underlying data. The SSfM programme has a role in giving guidance and training on the use of appropriate visualisation techniques. What has not yet been considered however, is the “soft metrology” aspect of visualisation, that is the characteristics of the display used (colour, contrast, sharpness of image, etc.) and the effects of the geometry, scaling and orientation of the image on the human’s perception of that image.
There would seem to be a case for conducting a joint study — jointly between the SSfM programme, the Measurement of Appearance part of the Optical Radiation Measurement programme and the Displays part of the Photonics programme — which would:
1. Develop recommendations on visualisation pitfalls to be avoided; and
2. Develop the means for making objective measurements of visualisation systems in order to rate their ability to deliver a clear and correct image to the observer (or conversely their ability to delude the observer, causing wrong inferences to be drawn).
9. CONCLUSIONS
�� The overall number of responses to the questionnaires was small. This tends to indicate that while there is some interest in the subject, there is, as yet, no clear understanding of the procedure for considering matters to do with soft metrology.
�� The mathematical requirements of those who did respond were also not clearly defined. Most subjects offered were selected at least once, although some respondents admitted that they didn’t know what techniques should be used to analyse their data.
�� Objective and subjective data were not usually available. This suggests a lack of understanding of the problem and suggests an education role for NPL. NPL has some experience in appearance measurement and is beginning an effort to measure tactile responses.
�� Many respondents expressed a wish to see the production of Best Practice Guides and Case Studies. NPL could show leadership by writing these documents aimed at specific industrial solutions. This effort could perhaps be done in conjunction with the relevant industries and should include a strong emphasis on the design of the necessary experiments to gather suitable human response data.

NPL Report CMSC 20/03
Page 14 of 25
10. RECOMMENDATIONS
1. Case Studies. There is a clear need for Case Studies to be written that are based on real industrial applications. This will serve to demonstrate what can be achieved to those industries faced with a soft metrology-based problem. 2. Best Practice. A guide needs to be written to demonstrate best practice from a position of leadership. 3. Extending work on biometric testing to soft metrology. The knowledge gained in the area of biometrics has obvious synergy with that required for soft metrology and this prior art should be exploited. 4. The development of a mathematical techniques toolkit. While the results from the questionnaire were not conclusive, there is a definite need to do something to aid the correlation of subjective and objective data. The development of a tool kit presents a logical way forward. 5. Understanding of uncertainty in subjective and objective data comparison and correlation Any measurement has an associated uncertainty. A methodology needs to be formulated to derive the uncertainty associated with the data derived within soft metrology application, specifically for the subjective data.
11. ACKNOWLEDGEMENTS
The author would like to acknowledge the time taken by several people to complete the questionnaires: without their input, this report would not have possible. The author would also like to thank Dave Rayner and Tony Mansfield of the Centre for Mathematics and Scientific Computing for a very constructive discussion on the importance of data gathering and experimental design, and Teresa Goodman of the Centre for Optical and Analytical Measurement for a useful discussion on the practical aspects of soft metrology.

NPL Report CMSC 20/03
Page 15 of 25
APPENDIX 1 - QUESTIONNAIRE Software Support for Metrology – Project 5.2: New Directions – Soft Metrology Study The Software Support for Metrology programme run by NPL (led by CMSC but increasingly involving other Centres and other contractors in its delivery) is required to respond in a timely way to the needs of industry and to the needs of others within the NMS. This project is designed to elicit information concerning future needs for mathematical and software support. My specific interest is in the need for support in the form of mathematics, statistics and software for the various areas of Soft Metrology. Soft metrology has been defined as
measurement techniques and models which enable the objective quantification of properties which are determined by human perception. (The human response may be in any of the five senses: sight, smell, sound, taste and touch.)
If this subject is of interest to you, will you please take the time to answer the questions below – you are not limited to one response per question – please tick all relevant boxes. Which human response is your main area of interest? Sight Smell Sound Taste Touch What industrial area is involved? What is the specific application? What is the goal of that application? Please give a brief overview of your interest

NPL Report CMSC 20/03
Page 16 of 25
What support might you require from the SSfM programme to help you achieve the above goal? (tick all those required) Best practice in Soft Metrology Case studies Mathematical techniques Numerical analysis Statistical analysis and uncertainty evaluation Physical modelling Signal processing Feature analysis Data visualisation Software development techniques Software testing and validation Use of the Internet Other (please specify) What mathematical and statistical techniques might be of special interest? (tick all those required) Don’t know Regression Data fitting Optimisation Finite element or difference techniques Image processing Data fusion Data mining Genetic algorithms Fourier analysis Wavelets Neural networks Monte Carlo simulation Bayesian statistics Principal components Other (please specify) Please give a brief overview of your potential need Will you have physical (objective) data available? Yes No

NPL Report CMSC 20/03
Page 17 of 25
If yes, what form will these data take? Will you have human response (subjective) data available? Yes No If yes, what form will these data take? When do you envisage requiring support from SSfM? 2003 2004 2005 2006 2007 As part of which programme? In which Centre? What is the status of that programme? Being formulated now – anticipated programme start date To be formulated – formulation start date Just an idea Name Centre Telephone Can you recommend anyone else I should contact? Many thanks for your valuable input. Mike Pointer COAM B11, Rm 116, Tel 6716 30-Sep-2002
NPL Report CMSC 20/03
Page 18 of 25
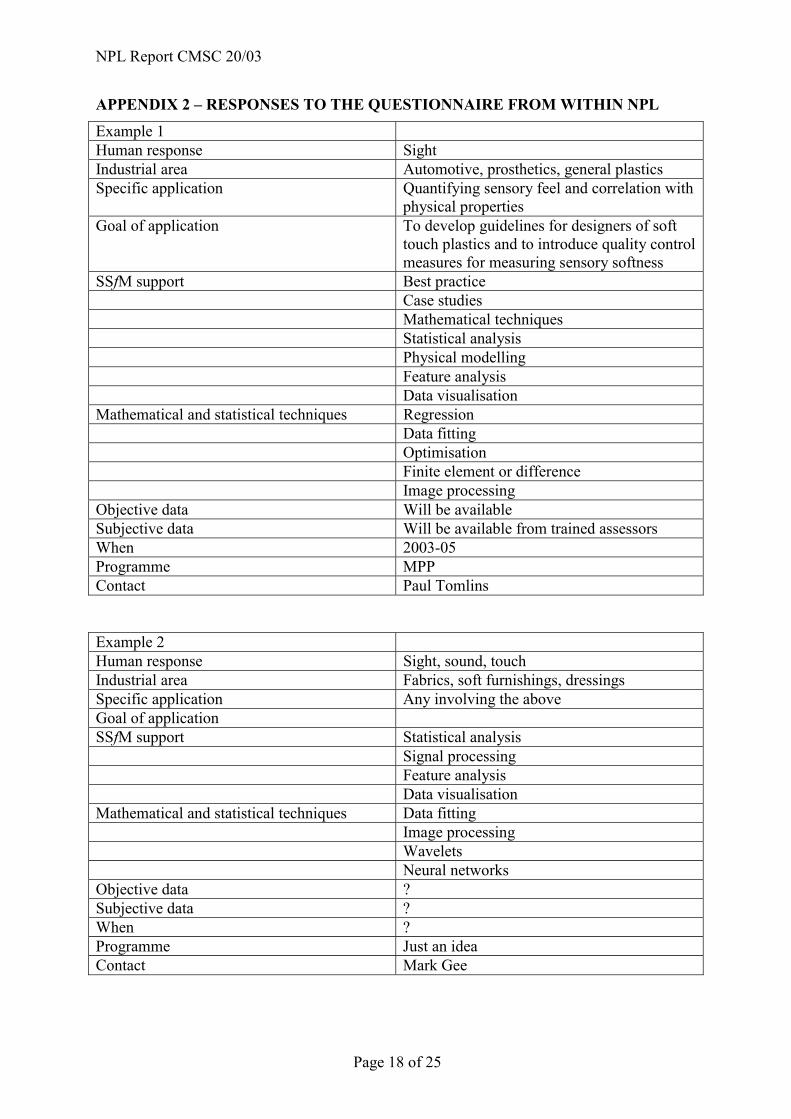
APPENDIX 2 – RESPONSES TO THE QUESTIONNAIRE FROM WITHIN NPL
Example 1 Human response Sight Industrial area Automotive, prosthetics, general plastics Specific application Quantifying sensory feel and correlation with
physical properties Goal of application To develop guidelines for designers of soft
touch plastics and to introduce quality control measures for measuring sensory softness
SSfM support Best practice Case studies Mathematical techniques Statistical analysis Physical modelling Feature analysis Data visualisation Mathematical and statistical techniques Regression Data fitting Optimisation Finite element or difference Image processing Objective data Will be available Subjective data Will be available from trained assessors When 2003-05 Programme MPP Contact Paul Tomlins Example 2 Human response Sight, sound, touch Industrial area Fabrics, soft furnishings, dressings Specific application Any involving the above Goal of application SSfM support Statistical analysis Signal processing Feature analysis Data visualisation Mathematical and statistical techniques Data fitting Image processing Wavelets Neural networks Objective data ? Subjective data ? When ? Programme Just an idea Contact Mark Gee

NPL Report CMSC 20/03
Page 19 of 25
Example 3 Human response Touch Industrial area All environments where conditions are
controlled, or where thermal stress can be experienced by humans or animals
Specific application Thermal stress monitoring Goal of application Measure/minimise physiological impact of
adverse thermal and humidity conditions SSfM support Don’t know Mathematical and statistical techniques Don’t know Objective data ? Subjective data ? When ? Programme Just an idea Contact Stephanie Bell Example 4 Human response Sight Industrial area Specific application Underpinning measurements for visual scales Goal of application Improved visual scales SSfM support Statistical analysis Mathematical and statistical techniques Regression Data fitting Objective data Will be available Subjective data ? When 2003-06 Programme ORM Contact Chris Chunnilall
NPL Report CMSC 20/03
Page 20 of 25
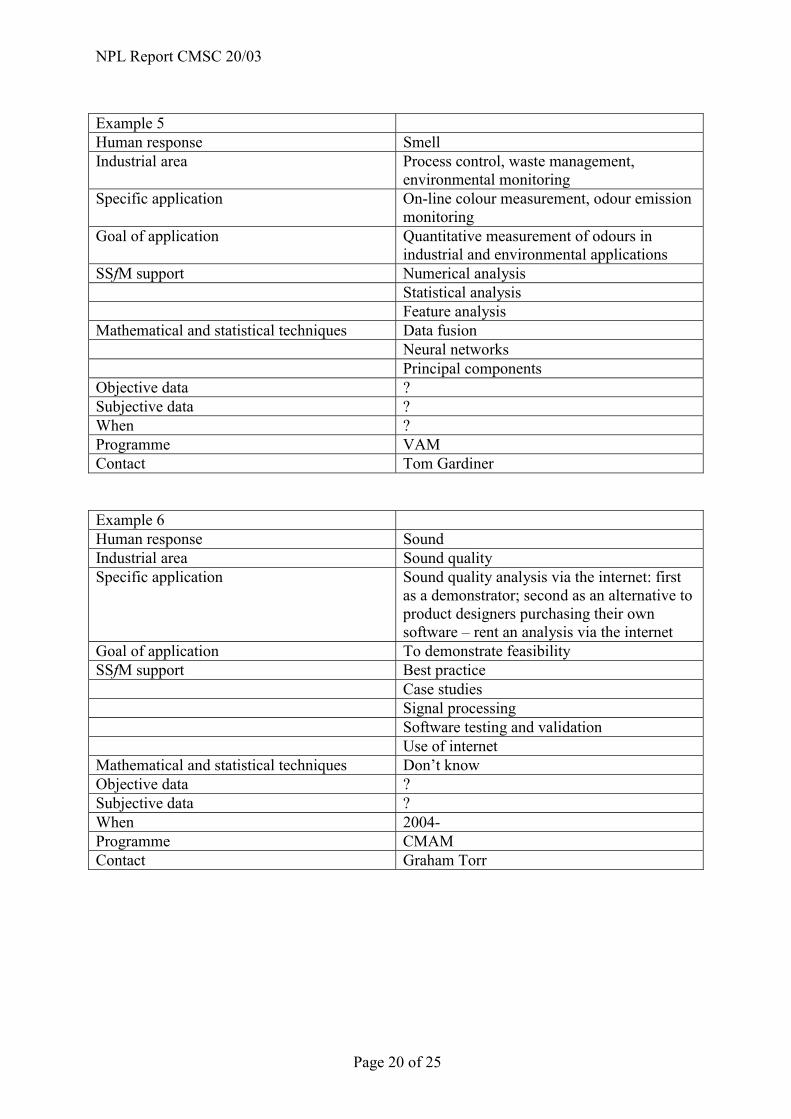
Example 5 Human response Smell Industrial area Process control, waste management,
environmental monitoring Specific application On-line colour measurement, odour emission
monitoring Goal of application Quantitative measurement of odours in
industrial and environmental applications SSfM support Numerical analysis Statistical analysis Feature analysis Mathematical and statistical techniques Data fusion Neural networks Principal components Objective data ? Subjective data ? When ? Programme VAM Contact Tom Gardiner Example 6 Human response Sound Industrial area Sound quality Specific application Sound quality analysis via the internet: first
as a demonstrator; second as an alternative to product designers purchasing their own software – rent an analysis via the internet
Goal of application To demonstrate feasibility SSfM support Best practice Case studies Signal processing Software testing and validation Use of internet Mathematical and statistical techniques Don’t know Objective data ? Subjective data ? When 2004- Programme CMAM Contact Graham Torr

NPL Report CMSC 20/03
Page 21 of 25
Example 7 Human response Sight Industrial area Industrial product process monitoring,
quality control and product feature description
Specific application Quality in automotive finishes, floor polishes, shampoos, cleaners, baking, confectionary etc.
Goal of application To improve measurement techniques such that procedures can be written
SSfM support Best practice Case studies Mathematical techniques Statistical analysis Mathematical and statistical techniques Regression Data fitting Optimisation Image processing Fourier analysis Neural networks Objective data Will be available Subjective data Should be available from trained assessors When 2004-05 Programme ORM Contact Mike Pointer

NPL Report CMSC 20/03
Page 22 of 25
APPENDIX 3 – EXTERNAL RESPONSES TO THE QUESTIONNAIRE
Example 1 Human response Sight Industrial area Fluid measurement in al industrial areas
especially oil and gas Specific application Measurement of flowing fluid and quantity of
fluid SSfM support Best practice Mathematical techniques Statistical analysis Physical modelling Signal processing Data visualisation Testing and validation Use of internet Mathematical and statistical techniques Regression Data fitting Monte Carlo Bayesian statistics Objective data ? Subjective data ? When ? Company NEL Contact Jane Sattary Example 2 Human response Sight, sound, smell, touch, taste Industrial area Biomedical engineering Specific application Hearing aids, medical diagnostic apparatus SSfM support Best practice Statistical analysis Physical modelling Signal processing Data visualisation Development techniques Use of internet Mathematical and statistical techniques Regression Optimisation Image processing Wavelets Bayesian statistics Principal components Objective data No Subjective data Yes When 2003 Company AIST Contact Tetsuo Moriya

NPL Report CMSC 20/03
Page 23 of 25
Example 3 Human response Smell, touch Industrial area Automotive Specific application Interior parts research and development SSfM support Best practice Case studies Mathematical techniques Numerical analysis Statistical analysis Physical modelling Development techniques Testing and validation Mathematical and statistical techniques Don’t know Objective data ? Subjective data ? When 2003 Company Honda R&D UK Limited Contact David Abraham Example 4 Human response Sight, sound Industrial area Robotic and electronic systems Specific application Image and speech recognition SSfM support Best practice Mathematical techniques Statistical analysis Physical modelling Data visualisation Mathematical and statistical techniques Regression Data fitting Image processing Data fusion Data mining General algorithms Neural networks Monte Carlo Objective data No Subjective data No When 2003 Company Centro Español Metrología Contact Jorge Pérez García
NPL Report CMSC 20/03
Page 24 of 25
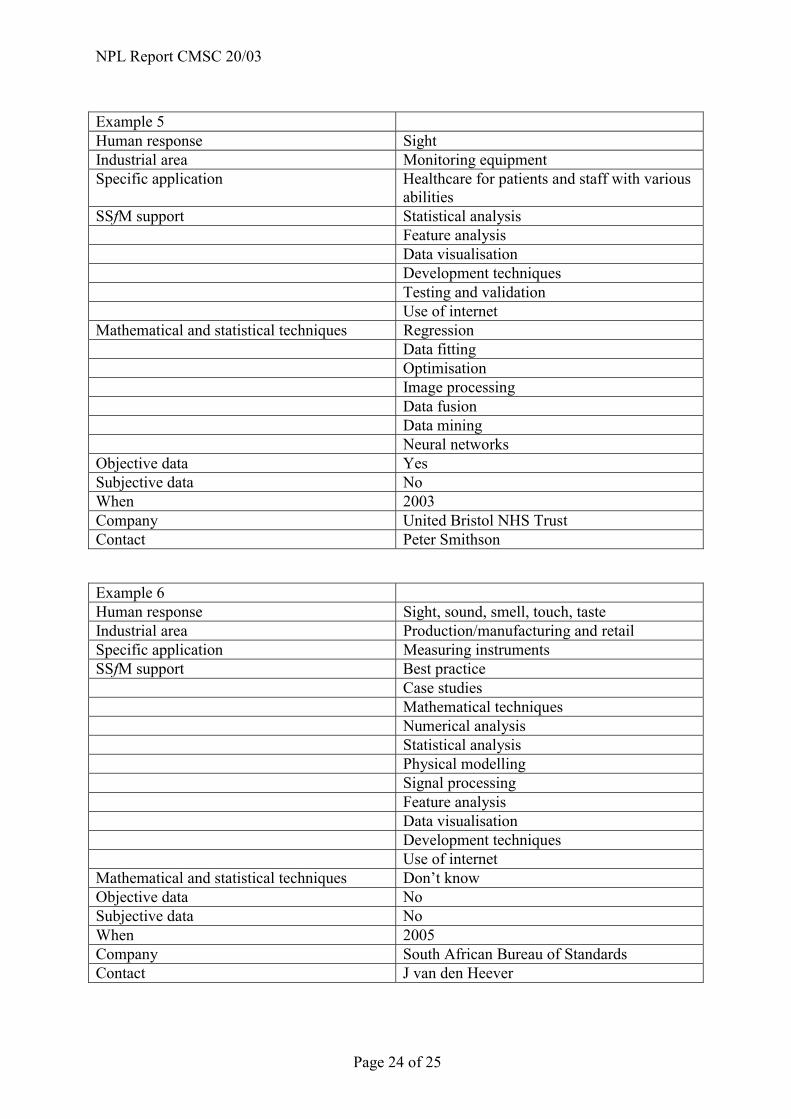
Example 5 Human response Sight Industrial area Monitoring equipment Specific application Healthcare for patients and staff with various
abilities SSfM support Statistical analysis Feature analysis Data visualisation Development techniques Testing and validation Use of internet Mathematical and statistical techniques Regression Data fitting Optimisation Image processing Data fusion Data mining Neural networks Objective data Yes Subjective data No When 2003 Company United Bristol NHS Trust Contact Peter Smithson Example 6 Human response Sight, sound, smell, touch, taste Industrial area Production/manufacturing and retail Specific application Measuring instruments SSfM support Best practice Case studies Mathematical techniques Numerical analysis Statistical analysis Physical modelling Signal processing Feature analysis Data visualisation Development techniques Use of internet Mathematical and statistical techniques Don’t know Objective data No Subjective data No When 2005 Company South African Bureau of Standards Contact J van den Heever
NPL Report CMSC 20/03
Page 25 of 25
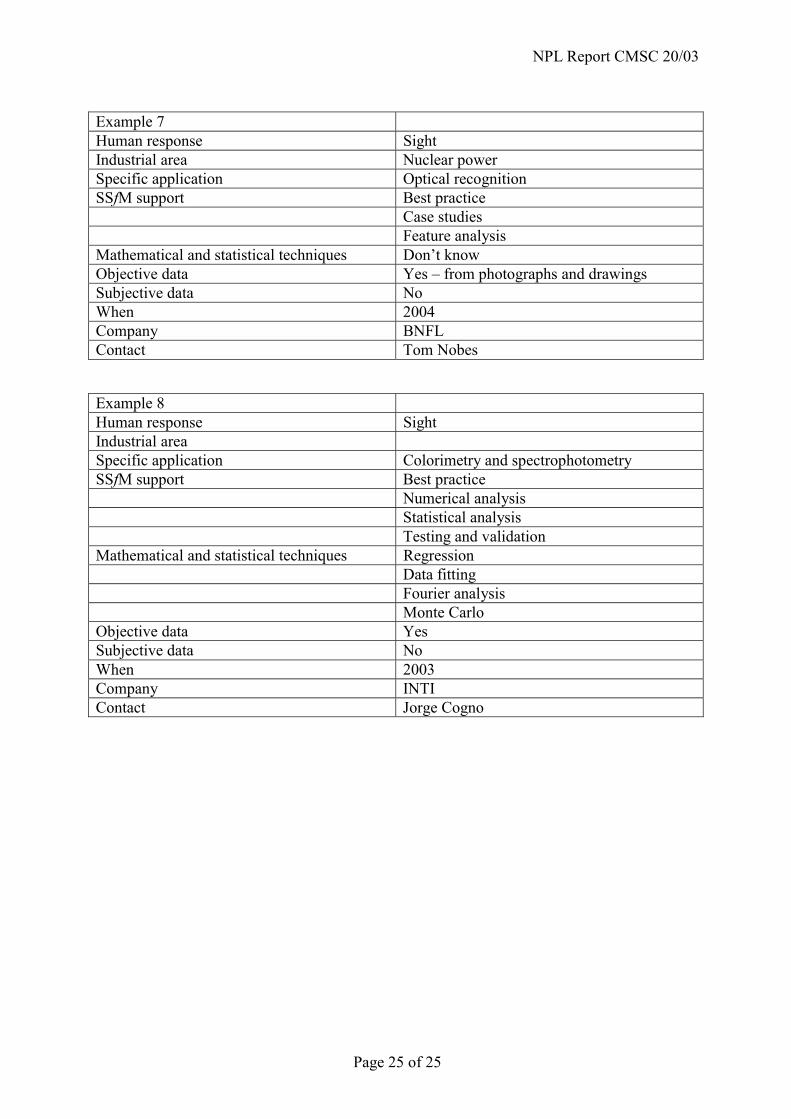
Example 7 Human response Sight Industrial area Nuclear power Specific application Optical recognition SSfM support Best practice Case studies Feature analysis Mathematical and statistical techniques Don’t know Objective data Yes – from photographs and drawings Subjective data No When 2004 Company BNFL Contact Tom Nobes Example 8 Human response Sight Industrial area Specific application Colorimetry and spectrophotometry SSfM support Best practice Numerical analysis Statistical analysis Testing and validation Mathematical and statistical techniques Regression Data fitting Fourier analysis Monte Carlo Objective data Yes Subjective data No When 2003 Company INTI Contact Jorge Cogno