report to shareholders second quarter 2016 national bank ... · the operations of the credigy ltd....
TRANSCRIPT

REPORT TO SHAREHOLDERS SECOND QUARTER 2016
National Bank reports its results for the Second Quarter of 2016 and raises its quarterly dividend by 2% to 55 cents per share The financial information reported herein is based on the unaudited interim condensed consolidated financial statements for the quarter and six-month period ended April 30, 2016 and prepared in accordance with International Financial Reporting Standards (IFRS), as issued by the International Accounting Standards Board (IASB). All amounts are presented in Canadian dollars. MONTREAL, June 1, 2016 – National Bank is reporting net income of $210 million for the second quarter of 2016, down from $404 million in the same quarter of 2015, essentially as a result of a sectoral provision for credit losses recorded for producers and service companies in the oil and gas sector. Diluted earnings per share stood at $0.52 in the second quarter of 2016 compared to $1.13 in the second quarter of 2015. Excluding the sectoral provision of $183 million, net of income taxes, and excluding the specified items described on page 4, the 2016 second-quarter net income totalled $420 million, up 2% from $411 million in the second quarter of 2015, and the 2016 second-quarter diluted earnings per share stood at $1.14, relatively stable compared to $1.15 in the second quarter of 2015. For the first six months of fiscal 2016, the Bank’s net income totalled $471 million versus $819 million in the same period of 2015, and its first-half diluted earnings per share stood at $1.19 versus $2.29 in the same period of 2015. Excluding the sectoral provision and specified items, the Bank’s first-half net income totalled $847 million, up 3% from $821 million in the same period of 2015, and its first-half diluted earnings per share stood at $2.31, essentially unchanged from $2.30 in the same period of 2015. “In the second quarter of 2016, the Bank continued to benefit from good growth in personal and commercial loan and deposit volumes and maintained tight cost control,” said Louis Vachon, President and Chief Executive Officer of National Bank. “In addition, the Bank took action, by way of a sectoral provision, to address credit uncertainties in its oil and gas producer and service company loan portfolio. The credit quality of the overall loan portfolio, excluding the oil and gas producer and service company loan portfolio, remains within expectations,” added Mr. Vachon.
Highlights (millions of Canadian dollars) Quarter ended April 30 Six months ended April 30
2016 2015 % Change 2016 2015 % Change
Net income 210 404 (48) 471 819 (42) Diluted earnings per share (dollars) $ 0.52 $ 1.13 (54) $ 1.19 $ 2.29 (48) Return on common shareholders’ equity 7.7 % 17.6 % 8.6 % 17.7 % Dividend payout ratio 61 % 44 % 61 % 44 % Excluding specified items(1) Net income 237 411 (42) 664 821 (19) Diluted earnings per share (dollars) $ 0.60 $ 1.15 (48) $ 1.77 $ 2.30 (23) Net income excluding sectoral provision(2) 420 411 2 847 821 3 Diluted earnings per share excluding sectoral provision(2) (dollars) $ 1.14 $ 1.15 (1) $ 2.31 $ 2.30 − Return on common shareholders’ equity 8.9 % 17.9 % 12.8 % 17.7 % Dividend payout ratio 50 % 42 % 50 % 42 %
As at April 30,
2016 As at October 31,
2015
CET1 capital ratio under Basel III 9.8 % 9.9 % Leverage ratio under Basel III 3.7 % 3.7 %
(1) See the Financial Reporting Method section on page 4. (2) During the second quarter of 2016, a $250 million ($183 million net of income taxes) sectoral provision for credit losses was recorded for producers and service companies in the oil and gas
sector.

National Bank of Canada 2 Report to Shareholders, Second Quarter 2016
REPORT TO SHAREHOLDERS SECOND QUARTER 2016
Personal and Commercial — The segment posted a net loss of $9 million in the second quarter of 2016 compared to net income of $164 million in the second quarter of 2015 as a result
of the sectoral provision for credit losses recorded for producers and service companies in the oil and gas sector. — Excluding the sectoral provision of $183 million, net of income taxes, the segment’s 2016 second-quarter net income totalled $174 million, up $10 million
or 6% from the second quarter of 2015. — At $698 million, the segment’s 2016 second-quarter total revenues rose $15 million or 2% year over year. — Rising 6% from a year ago, personal lending experienced sustained growth, with the most significant increases coming from mortgage lending, and
commercial lending grew 6% from a year ago. — The net interest margin was 2.20% in the second quarter of 2016 versus 2.24% in the second quarter of 2015 and 2.22% in the first quarter of 2016. — Before provisions for credit losses and income taxes, the segment’s second-quarter contribution rose $23 million or 8% year over year. — At 56.6%, the efficiency ratio improved from 59.0% in the same quarter of 2015.
Wealth Management — Net income totalled $80 million in the second quarter of 2016, down 22% from $103 million in the same quarter of 2015, as a gain on the disposal of Fiera
Capital Corporation shares had been recorded in the second quarter of 2015. — Excluding specified items(1), the 2016 second-quarter net income totalled $86 million, up $2 million or 2% year over year. — Excluding specified items(1), the 2016 second-quarter total revenues amounted to $355 million, down $4 million or 1% from $359 million in the second
quarter of 2015, mainly due to decreases in transaction-based and other revenues, partly offset by growth in net interest income. — Excluding specified items(1), the 2016 second-quarter non-interest expenses stood at $238 million, down from $245 million in the second quarter of 2015. — Excluding specified items(1), the efficiency ratio was 67.0%, an improvement from 68.2% in the second quarter of 2015.
Financial Markets — Net income totalled $169 million in the second quarter of 2016, a 7% increase from $158 million in the same quarter of 2015. — Excluding specified items(1), net income was $169 million, down $5 million or 3% year over year. — Excluding specified items(1), total revenues amounted to $429 million, a $1 million year-over-year increase owing to revenues from banking services and
the operations of the Credigy Ltd. subsidiary, tempered by decreases in trading activity revenues, financial market fees, and gains on investments. — At $195 million, the 2016 second-quarter non-interest expenses increased $6 million year over year. — Excluding specified items(1), the efficiency ratio was 45.5%, increasing by 1.3 percentage points when compared to the second quarter of 2015.
Other — The Other heading posted a net loss of $30 million in the second quarter of 2016 versus a $21 million net loss in the same quarter of 2015. The higher net
loss stems mainly from a tax provision recorded to reflect the impact of changes to tax measures.
Capital Management — As at April 30, 2016, the Common Equity Tier 1 (CET1) capital ratio under Basel III was 9.8%, relatively stable compared to 9.9% as at October 31, 2015. — As at April 30, 2016, the Basel III leverage ratio was 3.7%, unchanged from October 31, 2015. (1) See the Financial Reporting Method section on page 4.

National Bank of Canada 3 Report to Shareholders, Second Quarter 2016
MANAGEMENT’S DISCUSSION
AND ANA LYSIS
May 31, 2016
The following Management’s Discussion and Analysis (MD&A) presents the financial condition and operating results of National Bank of Canada (the Bank). This analysis was prepared in accordance with the requirements set out in National Instrument 51-102 Continuous Disclosure Obligations released by the Canadian Securities Administrators (CSA). It is based on the unaudited interim condensed consolidated financial statements (the consolidated financial statements) for the quarter and six-month period ended April 30, 2016 prepared in accordance with International Financial Reporting Standards (IFRS), as issued by the International Accounting Standards Board (IASB). This MD&A should be read in conjunction with the consolidated financial statements and accompanying notes for the quarter and six-month period ended April 30, 2016 and with the 2015 Annual Report. All amounts are presented in Canadian dollars. Additional information about the Bank, including the Annual Information Form, can be obtained from the Bank’s website at nbc.ca and SEDAR’s website at sedar.com.
Caution Regarding Forward-Looking Statements From time to time, the Bank makes written and oral forward-looking statements, such as those contained in the Outlook for National Bank and the Major Economic Trends sections of the 2015 Annual Report, in other filings with Canadian securities regulators, and in other communications, for the purpose of describing the economic environment in which the Bank will operate during fiscal 2016 and the objectives it hopes to achieve for that period. These forward-looking statements are made in accordance with current securities legislation in Canada and the United States. They include, among others, statements with respect to the economy—particularly the Canadian and U.S. economies—market changes, observations regarding the Bank’s objectives and its strategies for achieving them, Bank-projected financial returns and certain risks faced by the Bank. These forward-looking statements are typically identified by future or conditional verbs or words such as “outlook,” “believe,” “anticipate,” “estimate,” “project,” “expect,” “intend,” “plan,” and similar terms and expressions. By their very nature, such forward-looking statements require assumptions to be made and involve inherent risks and uncertainties, both general and specific. Assumptions about the performance of the Canadian and U.S. economies in 2016 and how that will affect the Bank’s business are among the main factors considered in setting the Bank’s strategic priorities and objectives and in determining its financial targets, including provisions for credit losses. In determining its expectations for economic growth, both broadly and in the financial services sector in particular, the Bank primarily considers historical economic data provided by the Canadian and U.S. governments and their agencies. There is a strong possibility that express or implied projections contained in these forward-looking statements will not materialize or will not be accurate. The Bank recommends that readers not place undue reliance on these statements, as a number of factors, many of which are beyond the Bank’s control, could cause actual future results, conditions, actions or events to differ significantly from the targets, expectations, estimates or intentions expressed in the forward-looking statements. These factors include credit risk, market risk, liquidity and funding risk, operational risk, regulatory compliance risk, reputation risk, strategic risk and environmental risk (all of which are described in more detail in the Risk Management section beginning on page 55 of the 2015 Annual Report), the general economic environment and financial market conditions in Canada, the United States and certain other countries in which the Bank conducts business, including regulatory changes affecting the Bank’s business, capital and liquidity; changes in the accounting policies the Bank uses to report its financial condition, including uncertainties associated with assumptions and critical accounting estimates; tax laws in the countries in which the Bank operates, primarily Canada and the United States (including the U.S. Foreign Account Tax Compliance Act (FATCA)); changes to capital and liquidity guidelines and to the manner in which they are to be presented and interpreted; changes to the credit ratings assigned to the Bank; and potential disruptions to the Bank’s information technology systems, including evolving cyber attack risk. The foregoing list of risk factors is not exhaustive. Additional information about these factors can be found in the Risk Management section of the 2015 Annual Report. Investors and others who rely on the Bank’s forward-looking statements should carefully consider the above factors as well as the uncertainties they represent and the risk they entail. Except as required by law, the Bank does not undertake to update any forward-looking statements, whether written or oral, that may be made from time to time, by it or on its behalf. The forward-looking information contained in this document is presented for the purpose of interpreting the information contained herein and may not be appropriate for other purposes.
Financial Reporting Method 4 Accounting Policies and Financial Disclosure 15 Highlights 5 Accounting Policies and Critical Accounting Estimates 15 Financial Analysis 6 Accounting Policy Changes 15 Consolidated Results 6 Changes in Accounting Estimates 16 Results by Segment 9 Future Accounting Policy Changes 16 Consolidated Balance Sheet 12 Financial Disclosure 17 Events After the Consolidated Balance Sheet Date 14 Additional Financial Disclosure 17 Related Party Transactions 14 Risk Disclosures 18 Securitization and Off-Balance-Sheet Arrangements 14 Capital Management 19 Risk Management 26 Quarterly Financial Information 39

MANAGEMENT’S DISCUSSION AND ANALYSIS
National Bank of Canada 4 Report to Shareholders, Second Quarter 2016
FINANCIAL REPORTING METHOD The Bank’s unaudited interim condensed consolidated financial statements have been prepared in accordance with IFRS, as issued by the IASB. The Bank also uses non-IFRS financial measures when assessing its results and measuring Bank-wide performance. Presenting such information helps readers to better understand how management analyzes results, shows the impacts of specified items on the results of the reported periods, and allows readers to assess results without the specified items if they consider such items to not be reflective of ordinary operations. Securities regulators require companies to caution readers that net income and other measures adjusted using non-IFRS criteria are not standard under IFRS and cannot be easily compared with similar measures used by other companies.
Financial Information (millions of Canadian dollars, except per share amounts) Quarter ended April 30 Six months ended April 30
2016 2015 % Change 2016 2015 % Change
Net income excluding specified items Personal and Commercial (9) 164 175 335 (48) Wealth Management 86 84 2 170 165 3 Financial Markets 169 174 (3) 355 351 1 Other (9) (11) (36) (30) Net income excluding specified items 237 411 (42) 664 821 (19) Items related to holding restructured notes(1) (3) 23 (4) 36 Acquisition-related items(2) (6) (6) (26) (14) Write-off of an equity interest in an associate(3) − − (145) − Impact of changes to tax measures(4) (18) − (18) − Gain on disposal of Fiera Capital shares(5) − 25 − 25 Share of current tax asset write-down of an associate(6) − (16) − (16) Impairment losses on intangible assets(7) − (33) − (33) Net income 210 404 (48) 471 819 (42) Diluted earnings per share excluding specified items $ 0.60 $ 1.15 (48) $ 1.77 $ 2.30 (23) Items related to holding restructured notes(1) (0.01) 0.07 (0.01) 0.11 Acquisition-related items(2) (0.02) (0.02) (0.08) (0.05) Write-off of an equity interest in an associate(3) − − (0.43) − Impact of changes to tax measures(4) (0.05) (0.05) Premium paid on preferred shares redeemed for cancellation(8) − − (0.01) − Gain on disposal of Fiera Capital shares(5) − 0.08 − 0.08 Share of current tax asset write-down of an associate(6) − (0.05) − (0.05) Impairment losses on intangible assets(7) − (0.10) − (0.10) Diluted earnings per share $ 0.52 $ 1.13 (54) $ 1.19 $ 2.29 (48) Return on common shareholders' equity Including specified items 7.7 % 17.6 % 8.6 % 17.7 % Excluding specified items 8.9 % 17.9 % 12.8 % 17.7 %
(1) During the quarter ended April 30, 2016, the Bank recorded $3 million in financing costs ($3 million net of income taxes) related to holding restructured notes (2015: $4 million, $4 million net of
income taxes). In addition, for the quarter ended April 30, 2015, the Bank had recorded a gain of $37 million ($27 million net of income taxes) upon the disposal of the restructured notes of the MAV III conduits. During the six-month period ended April 30, 2016, the Bank recorded $5 million in financing costs ($4 million net of income taxes) related to holding restructured notes (2015: $9 million, $8 million net of income taxes). In the same six-month period of 2015, the Bank had recorded $23 million in revenues ($17 million net of income taxes) to reflect a rise in the fair value of these notes as well as a gain of $37 million ($27 million net of income taxes) upon the disposal of the restructured notes of the MAV III conduits.
(2) During the quarter ended April 30, 2016, the Bank recorded $7 million ($6 million net of income taxes) in acquisition-related charges (2015: $8 million, $6 million net of income taxes). For the six months ended April 30, 2016, these charges amounted to $34 million ($26 million net of income taxes) compared to $18 million ($14 million net of income taxes) for the same six-month period of 2015. These charges consisted mostly of retention bonuses and also included the Bank’s share in the integration costs incurred by Fiera Capital Corporation (Fiera Capital) as well as the Bank’s share in the charges related to its equity interest in TMX Group Limited (TMX), particularly goodwill and intangible asset impairment losses of $18 million ($13 million net of income taxes) recorded in the first quarter of 2016.
(3) During the six-month period ended April 30, 2016, the Bank wrote off its equity interest in associate Maple Financial Group Inc. (Maple) in an amount of $164 million ($145 million net of income taxes) following the February 6, 2016 event described in the Consolidated Balance Sheet section on page 14.
(4) During the quarter ended April 30, 2016, an $18 million tax provision was recorded to reflect the impact of substantively enacted changes to tax measures. (5) During the quarter ended April 30, 2015, the Bank had recorded a $29 million gain ($25 million net of income taxes), net of underwriting fees, on the disposal of Fiera Capital shares through one
of its subsidiaries. (6) During the quarter ended April 30, 2015, a loss of $18 million ($16 million net of income taxes) had been recorded following a write-down of an associate’s current tax assets. (7) During the quarter ended April 30, 2015, the Bank had recorded $46 million ($33 million net of income taxes) in intangible asset impairment losses on technological developments. (8) During the six-month period ended April 30, 2016, a $3 million premium was paid on the Series 20 First Preferred Shares redeemed for cancellation.
MANAGEMENT’S DISCUSSION AND ANALYSIS
National Bank of Canada 5 Report to Shareholders, Second Quarter 2016
HIGHLIGHTS
(millions of Canadian dollars, except per share amounts ) Quarter ended April 30 Six months ended April 30
2016 2015 % Change 2016 2015 % Change
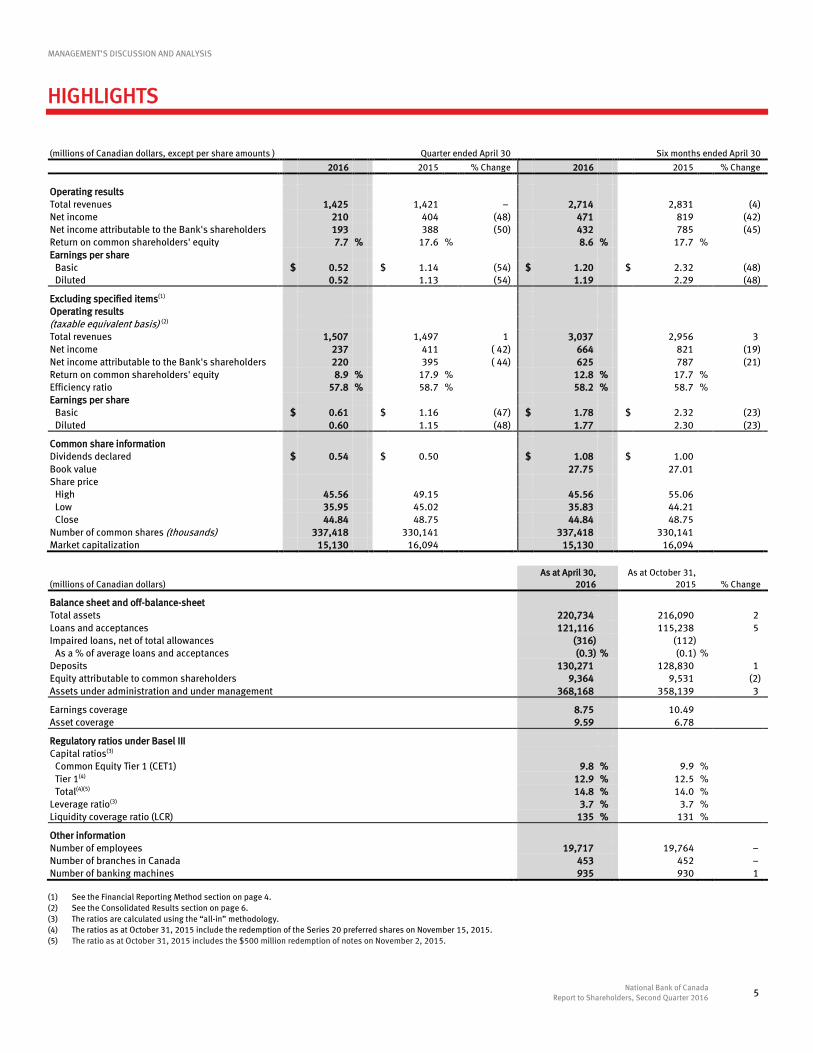
Operating results Total revenues 1,425 1,421 − 2,714 2,831 (4) Net income 210 404 (48) 471 819 (42) Net income attributable to the Bank's shareholders 193 388 (50) 432 785 (45) Return on common shareholders' equity 7.7 % 17.6 % 8.6 % 17.7 % Earnings per share Basic $ 0.52 $ 1.14 (54) $ 1.20 $ 2.32 (48) Diluted 0.52 1.13 (54) 1.19 2.29 (48) Excluding specified items(1) Operating results (taxable equivalent basis) (2) Total revenues 1,507 1,497 1 3,037 2,956 3 Net income 237 411 ( 42) 664 821 (19) Net income attributable to the Bank's shareholders 220 395 ( 44) 625 787 (21) Return on common shareholders' equity 8.9 % 17.9 % 12.8 % 17.7 % Efficiency ratio 57.8 % 58.7 % 58.2 % 58.7 % Earnings per share Basic $ 0.61 $ 1.16 (47) $ 1.78 $ 2.32 (23) Diluted 0.60 1.15 (48) 1.77 2.30 (23) Common share information Dividends declared $ 0.54 $ 0.50 $ 1.08 $ 1.00 Book value 27.75 27.01 Share price High 45.56 49.15 45.56 55.06 Low 35.95 45.02 35.83 44.21 Close 44.84 48.75 44.84 48.75 Number of common shares (thousands) 337,418 330,141 337,418 330,141 Market capitalization 15,130 16,094 15,130 16,094
(millions of Canadian dollars)
As at April 30, 2016
As at October 31, 2015 % Change
Balance sheet and off-balance-sheet Total assets 220,734 216,090 2 Loans and acceptances 121,116 115,238 5 Impaired loans, net of total allowances (316) (112) As a % of average loans and acceptances (0.3) % (0.1) % Deposits 130,271 128,830 1 Equity attributable to common shareholders 9,364 9,531 (2) Assets under administration and under management 368,168 358,139 3 Earnings coverage 8.75 10.49 Asset coverage 9.59 6.78 Regulatory ratios under Basel III Capital ratios(3) Common Equity Tier 1 (CET1) 9.8 % 9.9 % Tier 1(4) 12.9 % 12.5 % Total(4)(5) 14.8 % 14.0 % Leverage ratio(3) 3.7 % 3.7 % Liquidity coverage ratio (LCR) 135 % 131 % Other information Number of employees 19,717 19,764 − Number of branches in Canada 453 452 − Number of banking machines 935 930 1
(1) See the Financial Reporting Method section on page 4. (2) See the Consolidated Results section on page 6. (3) The ratios are calculated using the “all-in” methodology. (4) The ratios as at October 31, 2015 include the redemption of the Series 20 preferred shares on November 15, 2015. (5) The ratio as at October 31, 2015 includes the $500 million redemption of notes on November 2, 2015.

MANAGEMENT’S DISCUSSION AND ANALYSIS
National Bank of Canada 6 Report to Shareholders, Second Quarter 2016
FINANCIAL ANALYSIS Consolidated Results
As at November 1, 2015, the Bank reclassified certain amounts in the Consolidated Statement of Income to better reflect the nature of reported revenues in the Personal and Commercial segment. Accordingly, for the quarter ended April 30, 2015, an amount of $10 million presented in the Non-interest income – Credit fees item was reclassified to Net interest income ($19 million for the six-month period ended April 30, 2015). This reclassification had no impact on Net income. (millions of Canadian dollars) Quarter ended April 30 Six months ended April 30
2016 2015 % Change 2016 2015 % Change
Operating results Net interest income 709 650 9 1,415 1,315 8 Non-interest income 716 771 (7) 1,299 1,516 (14) Total revenues 1,425 1,421 − 2,714 2,831 (4) Non-interest expenses 876 936 (6) 1,779 1,799 (1) Contribution 549 485 13 935 1,032 (9) Provisions for credit losses 317 57 380 111 Income before income taxes 232 428 (46) 555 921 (40) Income taxes 22 24 (8) 84 102 (18) Net income 210 404 (48) 471 819 (42) Diluted earnings per share (dollars) 0.52 1.13 (54) 1.19 2.29 (48) Taxable equivalent(1) Net interest income 75 123 130 186 Non-interest income 2 − 2 − Income taxes 77 123 132 186 Net income − − − − Specified items(2) Items related to holding restructured notes (3) 33 (5) 51 Acquisition-related items (7) (8) (34) (18) Write-off of an equity interest in an associate − − (164) − Gain on disposal of Fiera Capital shares − 29 − 29 Share of current tax asset write-down of an associate − (18) − (18) Impairment losses on intangible assets − (46) − (46) Specified items before income taxes (10) (10) (203) (2) Income taxes on specified items(3) 17 (3) (10) − Specified items after income taxes(4) (27) (7) (193) (2) Operating results on a taxable equivalent basis excluding specified items(1)(2) Net interest income 787 777 1 1,550 1,510 3 Non-interest income 720 720 − 1,487 1,446 3 Total revenues 1,507 1,497 1 3,037 2,956 3 Non-interest expenses 871 879 (1) 1,767 1,736 2 Contribution 636 618 3 1,270 1,220 4 Provisions for credit losses 317 57 380 111 Income before income taxes 319 561 (43) 890 1,109 (20) Income taxes 82 150 (45) 226 288 (22) Net income 237 411 (42) 664 821 (19) Diluted earnings per share (dollars) (4) 0.60 1.15 (48) 1.77 2.30 (23)
Net income excluding sectoral provision(5) 420 411 2 847 821 3 Diluted earnings per share excluding sectoral provision(5) (dollars) 1.14 1.15 (1) 2.31 2.30 −
Average assets 230,593 222,931 3 231,412 220,694 5 Average loans and acceptances 119,422 106,581 12 118,362 105,686 12 Impaired loans, net of total allowances (316) (117) (316) (117) Average deposits 137,203 126,341 9 138,808 124,911 11 Efficiency ratio excluding specified items(2) 57.8 % 58.7 % 58.2 % 58.7 %
(1) The Bank uses the taxable equivalent basis to calculate net interest income, non-interest income and income taxes. This calculation method consists of grossing up certain tax-exempt income
(particularly dividends) by the income tax that would have been otherwise payable. An equivalent amount is added to income taxes. This adjustment is necessary in order to perform a uniform comparison of the return on different assets regardless of their tax treatment.
(2) See the Financial Reporting Method section on page 4. (3) For the quarter and six-month period ended April 30, 2016, the income taxes on specified items included an $18 million tax provision recorded to reflect the impact of substantively enacted
changes to tax measures. (4) For the six months ended April 30, 2016, the specified items included a premium of $3 million, or $0.01 per share, on the redemption of the Series 20 preferred shares for cancellation. (5) During the second quarter of 2016, a sectoral provision for credit losses of $250 million ($183 million net of income taxes) was recorded for producers and service companies in the oil and
gas sector.

MANAGEMENT’S DISCUSSION AND ANALYSIS FINANCIAL ANALYSIS
National Bank of Canada 7 Report to Shareholders, Second Quarter 2016
Financial Results The Bank is reporting net income of $210 million for the second quarter of fiscal 2016, down from $404 million in the second quarter of 2015, essentially because a sectoral provision for credit losses was recorded for producers and service companies in the oil and gas sector. Second-quarter diluted earnings per share stood at $0.52 compared to $1.13 in the second quarter of 2015. Excluding the sectoral provision of $183 million, net of income taxes, and excluding the specified items, the Bank’s 2016 second-quarter net income totalled $420 million, up 2% from $411 million in the second quarter of 2015, and second-quarter diluted earnings per share stood at $1.14, relatively stable compared to $1.15 in the second quarter of 2015. For the second quarter of 2016, the specified items, net of income taxes, consisted of the following items: $3 million in financing costs (2015: $4 million) related to holding restructured notes, $6 million in acquisition-related items (2015: $6 million), and an $18 million tax provision recorded to reflect the impact of changes to tax measures. For the second quarter of 2015, the specified items, net of income taxes, had also consisted of the following: a $27 million gain on the disposal of restructured notes of the MAV III conduits, a $25 million gain, net of underwriting fees, on the disposal of Fiera Capital shares, a $16 million loss on a current tax asset write-down of an associate in the Financial Markets segment, and $33 million in intangible asset impairment losses. For the first six months of fiscal 2016, the Bank’s net income totalled $471 million versus $819 million in the same period of 2015, and its first-half diluted earnings per share stood at $1.19 versus $2.29 in the same period of 2015. Excluding the sectoral provision and the specified items, the Bank’s first-half net income totalled $847 million, up 3% from $821 million in the same period of 2015, and its first-half diluted earnings per share stood at $2.31 compared to $2.30 in the same period of 2015. For the six months ended April 30, 2016, the specified items, net of income taxes, consisted of the following items: $4 million in financing costs (2015: $8 million) related to holding restructured notes; $26 million in charges (2015: $14 million) related to the Wealth Management acquisitions, including an amount of $13 million for the Bank’s share in goodwill and intangible asset impairment losses stemming from its interest in TMX; and a $145 million write-off of the Bank’s equity interest in associate Maple. For the same six-month period in 2015, the specified items had also consisted of the following: a $27 million gain on the disposal of restructured notes of the MAV III conduits, $17 million in revenues to reflect a rise in the fair value of restructured notes, a $25 million gain, net of underwriting fees, on the disposal of Fiera Capital shares, a $16 million loss on a current tax asset write-down of an associate, and $33 million in intangible asset impairment losses. Excluding specified items, return on common shareholders’ equity was 12.8% for the six months ended April 30, 2016 compared to 17.7% in the same period of 2015; this change was essentially due to the write-off of the Bank’s equity interest in associate Maple and to the sectoral provision. Total Revenues For the second quarter of 2016, the Bank’s total revenues amounted to $1,425 million, up $4 million year over year. Excluding the specified items related to holding restructured notes, to the Wealth Management acquisitions, to the gain on the disposal of Fiera Capital shares, and to the loss resulting from the share in the current tax asset write-down of an associate recorded in the second quarter of 2015, total revenues on a taxable equivalent basis amounted to $1,507 million, up 1% from $1,497 million in the second quarter of 2015. Growth in net interest income came mainly from increases in personal and commercial loans and deposits, tempered by lower deposit margins, as well as from net interest income growth in the Wealth Management segment that was partly driven by the CashPerformer account. Second-quarter non-interest income was stable year over year. There were second-quarter year-over-year decreases in underwriting and advisory fee revenues, securities brokerage commission revenues (particularly because of customer migration towards fee-based services), and trading revenues. Conversely, there were second-quarter year-over-year increases in mutual fund revenues, gains on available-for-sale securities, insurance revenues, and other revenues, mainly owing to revenue growth at the Credigy Ltd. subsidiary. For the six months ended April 30, 2016, total revenues amounted to $2,714 million, down 4% from $2,831 million in the same period of 2015. Excluding the specified items related to holding restructured notes, to the Wealth Management acquisitions in the first six-month periods of 2016 and 2015, to the Bank’s share in the goodwill and intangible asset impairment losses resulting from its interest in TMX, to the write-off of its equity interest in Maple during the first quarter of 2016, to the gain on the disposal of Fiera Capital shares, and to the loss resulting from the share in the current tax asset write-down of an associate recorded in the first six months of 2015, total revenues on a taxable equivalent basis amounted to $3,037 million for the six months ended April 30, 2016, up 3% from $2,956 million in the same period of 2015. The increase was driven, in part, by 3% growth in net interest income attributable to the same reasons provided for the quarter. Non-interest income rose $41 million, mainly due to an increase in other revenues (essentially from revenue growth at the Credigy Ltd. subsidiary), and to increases in revenues from credit fees, gains on available-for-sale securities, insurance revenues, and revenues from the Bank’s proportionate shares of international investments. These increases were tempered by decreases in trading revenues, Wealth Management segment revenues, and card revenues.

MANAGEMENT’S DISCUSSION AND ANALYSIS FINANCIAL ANALYSIS
National Bank of Canada 8 Report to Shareholders, Second Quarter 2016
Provisions for Credit Losses For the second quarter of 2016, the Bank recorded $317 million in provisions for credit losses, $260 million more than in the same quarter of 2015. This increase was largely attributable to the $250 million sectoral provision for credit losses recorded for producers and service companies in the oil and gas sector. Also contributing to the increase were higher provisions for credit losses on Commercial Banking loans. For the six months ended April 30, 2016, the Bank recorded $380 million in provisions for credit losses, $269 million more than in the same period of 2015. This increase was attributable to the same reasons provided above for the second quarter. As at April 30, 2016, gross impaired loans stood at $521 million, rising $64 million since October 31, 2015. This increase came primarily from Commercial Banking loan portfolios, particularly loans to oil and gas sector companies. Impaired loans represented 6.7% of the tangible capital adjusted for allowances as at April 30, 2016, up 0.8 percentage points from 5.9% as at October 31, 2015. As at April 30, 2016, allowances for credit losses exceeded gross impaired loans by $316 million compared to $112 million as at October 31, 2015. Non-Interest Expenses For the second quarter of 2016, non-interest expenses stood at $876 million, a $60 million or 6% year-over-year decrease due to a lower compensation and employee benefits expense and to intangible asset impairment losses that had been recorded in the second quarter of 2015. These decreases were partly offset by increases in technology investments and professional fees, specifically the management fees associated with business growth at the Credigy Ltd. subsidiary. Excluding specified items, the 2016 second-quarter non-interest expenses stood at $871 million compared to $879 million in the same quarter of 2015. For the six months ended April 30, 2016, non-interest expenses were down $20 million or 1% year over year; this decrease was attributable to the same reasons provided for the second quarter. Other expenses were up, particularly due to sales tax recoveries recorded in the first quarter of 2015. Excluding the specified items recorded in the six-month periods ended April 30, 2016 and 2015, non-interest expenses were up $31 million or 2%. Income Taxes For the second quarter of 2016, income taxes stood at $22 million compared to $24 million in the same quarter of 2015. The 2016 second-quarter effective tax rate was 9% compared to 6% in the same quarter of 2015. These effective tax rates were attributable to the tax exempt dividend income in both second quarters. The change in the effective tax rate came mainly from a tax provision recorded to reflect the impact of substantively enacted changes to tax measures during the quarter ended April 30, 2016, from a year-over-year decrease in tax-exempt dividend income, and from the gain on the disposal of Fiera Capital shares in the second quarter of 2015. For the six months ended April 30, 2016, the effective tax rate stood at 15% compared to 11% in the same six-month period of 2015. This increase was attributable to the same reasons provided above for the second quarter.

MANAGEMENT’S DISCUSSION AND ANALYSIS FINANCIAL ANALYSIS
National Bank of Canada 9 Report to Shareholders, Second Quarter 2016
Results by Segment
The Bank carries out its activities in three business segments. For presentation purposes, other operating activities as well as Corporate Treasury activities are grouped in the Other heading. Each reportable segment is distinguished by services offered, type of clientele and marketing strategy. Personal and Commercial (millions of Canadian dollars) Quarter ended April 30 Six months ended April 30
2016 2015 % Change 2016 2015 % Change
Operating results Net interest income 465 440 6 940 890 6 Non-interest income 233 243 (4) 482 485 (1) Total revenues 698 683 2 1,422 1,375 3 Non-interest expenses 395 403 (2) 805 807 − Contribution 303 280 8 617 568 9 Provisions for credit losses(1) 315 56 377 110 Income before income taxes (12) 224 240 458 Income taxes (3) 60 65 123 Net income (9) 164 175 335 (48) Net income excluding sectoral provision(1) 174 164 6 358 335 7 Net interest margin(2) 2.20 % 2.24 % 2.21 % 2.24 % Average interest-bearing assets 85,859 80,531 7 85,498 80,033 7 Average assets 91,021 86,147 6 90,765 85,521 6 Average loans and acceptances 90,677 85,762 6 90,405 85,137 6 Net impaired loans 293 246 19 293 246 19 Net impaired loans as a % of average loans and acceptances 0.3 % 0.3 % 0.3 % 0.3 % Average deposits 47,424 43,714 8 46,916 43,771 7 Efficiency ratio 56.6 % 59.0 % 56.6 % 58.7 %
(1) For the second quarter and six-month period ended April 30, 2016, the provisions for credit losses included a $250 million ($183 million net of income taxes) sectoral provision on non-
impaired loans recorded for the oil and gas producer and service company loan portfolio. (2) Net interest margin is calculated by dividing net interest income by average interest-bearing assets.
In the Personal and Commercial segment, there was a net loss of $9 million in the second quarter of 2016 compared to net income of $164 million in the second quarter of 2015. This change was mainly due to the sectoral provision on non-impaired loans recorded for the oil and gas producer and service company loan portfolio during the second quarter of 2016. Excluding this sectoral provision, the 2016 second-quarter net income totalled $174 million, up $10 million or 6% year over year. The segment’s second-quarter total revenues increased by $15 million year over year owing to higher net interest income, which rose $25 million, partly offset by a $10 million decrease in non-interest income in the second quarter of 2016. The higher net interest income came mainly from growth in personal and commercial loans and deposits, tempered by a narrowing of the net interest margin, which was 2.20% in the second quarter of 2016 versus 2.24% in the second quarter of 2015, a decrease stemming mainly from deposit margins.
Personal Banking’s total revenues rose by $22 million, essentially due to loan growth, particularly mortgage loans, as well as to growth in credit card transactions. Non-interest income also posted growth, mainly due to deposit and payment service charges. Commercial Banking's total revenues were down $7 million, mainly due to a decline in loan and deposit margins, credit fees on lending transactions, and foreign exchange and derivatives revenues. This decrease was partly offset by growth in loan and deposit volumes.
The segment's 2016 second-quarter non-interest expenses decreased by $8 million, or 2%, from the same quarter in 2015, mainly due to compensation and employee benefits. The 2016 second-quarter contribution therefore increased 8% year over year. At 56.6%, the efficiency ratio for the second quarter of 2016 improved by 2.4 percentage points when compared to the same quarter of 2015.
The segment’s second-quarter provisions for credit losses were $315 million, $259 million more than in the same quarter of 2015. Most of this increase stems from the sectoral provision on non-impaired loans recorded for the oil and gas producer and service company loan portfolio. Also contributing to this increase were higher provisions for credit losses on Commercial Banking loans.
For the six months ended April 30, 2016, the Personal and Commercial segment posted net income of $175 million, down from $335 million in the same period of 2015. Excluding the sectoral provision, net income totalled $358 million for the six months ended April 30, 2016, up 7% year over year. The segment’s total revenues grew 3%. Personal Banking’s first-half total revenues grew year over year for the same reasons provided above for the quarter. Commercial Banking’s first-half revenues also increased, partly due to growth in loan and deposit volumes, tempered by smaller loan and deposit margins and by lower credit fees. The segment’s first-half contribution rose by $49 million or 9%, and its first-half provisions for credit losses were $267 million higher than in the same period of 2015. Most of this increase came from the $250 million sectoral provision recorded during the second quarter of 2016 and from higher provisions for credit losses on Commercial Banking loans. At 56.6% for the six months ended April 30, 2016, the efficiency ratio improved by 2.1 percentage points when compared with the same six-month period of 2015.
MANAGEMENT’S DISCUSSION AND ANALYSIS FINANCIAL ANALYSIS
National Bank of Canada 10 Report to Shareholders, Second Quarter 2016
Wealth Management (millions of Canadian dollars) Quarter ended April 30 Six months ended April 30
2016 2015 % Change 2016 2015 % Change
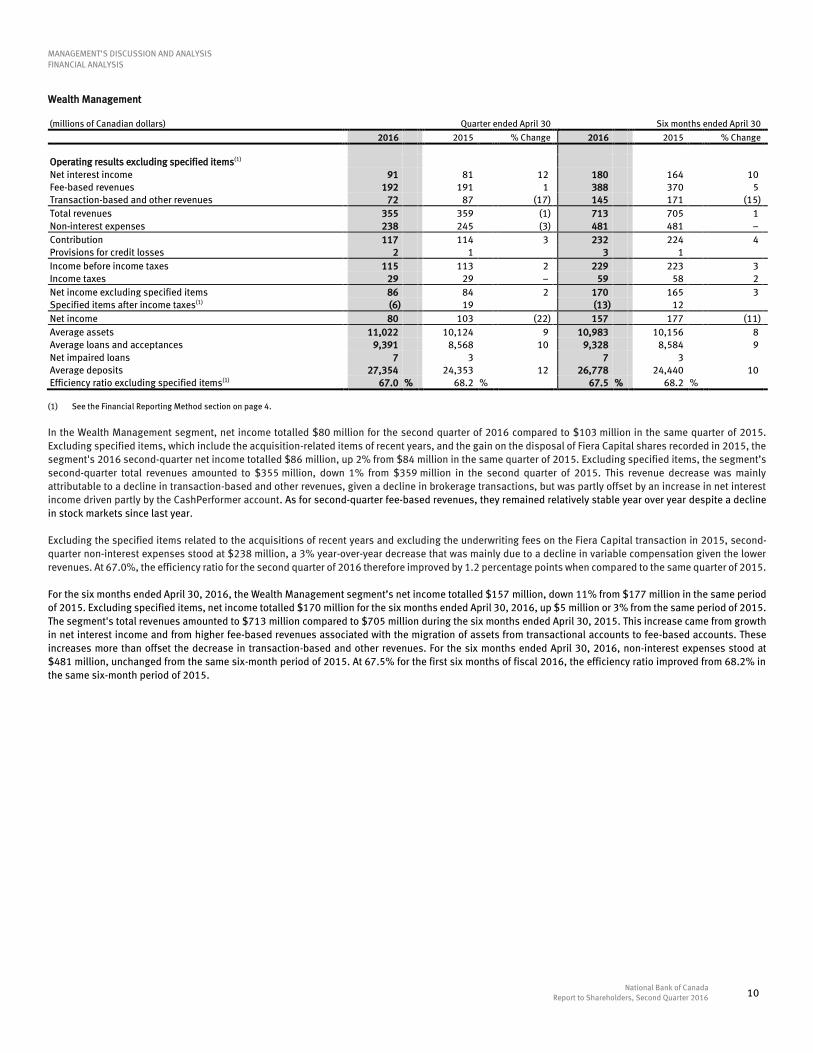
Operating results excluding specified items(1) Net interest income 91 81 12 180 164 10 Fee-based revenues 192 191 1 388 370 5 Transaction-based and other revenues 72 87 (17) 145 171 (15) Total revenues 355 359 (1) 713 705 1 Non-interest expenses 238 245 (3) 481 481 − Contribution 117 114 3 232 224 4 Provisions for credit losses 2 1 3 1 Income before income taxes 115 113 2 229 223 3 Income taxes 29 29 − 59 58 2 Net income excluding specified items 86 84 2 170 165 3 Specified items after income taxes(1) (6) 19 (13) 12 Net income 80 103 (22) 157 177 (11) Average assets 11,022 10,124 9 10,983 10,156 8 Average loans and acceptances 9,391 8,568 10 9,328 8,584 9 Net impaired loans 7 3 7 3 Average deposits 27,354 24,353 12 26,778 24,440 10 Efficiency ratio excluding specified items(1) 67.0 % 68.2 % 67.5 % 68.2 %
(1) See the Financial Reporting Method section on page 4.
In the Wealth Management segment, net income totalled $80 million for the second quarter of 2016 compared to $103 million in the same quarter of 2015. Excluding specified items, which include the acquisition-related items of recent years, and the gain on the disposal of Fiera Capital shares recorded in 2015, the segment's 2016 second-quarter net income totalled $86 million, up 2% from $84 million in the same quarter of 2015. Excluding specified items, the segment’s second-quarter total revenues amounted to $355 million, down 1% from $359 million in the second quarter of 2015. This revenue decrease was mainly attributable to a decline in transaction-based and other revenues, given a decline in brokerage transactions, but was partly offset by an increase in net interest income driven partly by the CashPerformer account. As for second-quarter fee-based revenues, they remained relatively stable year over year despite a decline in stock markets since last year. Excluding the specified items related to the acquisitions of recent years and excluding the underwriting fees on the Fiera Capital transaction in 2015, second-quarter non-interest expenses stood at $238 million, a 3% year-over-year decrease that was mainly due to a decline in variable compensation given the lower revenues. At 67.0%, the efficiency ratio for the second quarter of 2016 therefore improved by 1.2 percentage points when compared to the same quarter of 2015. For the six months ended April 30, 2016, the Wealth Management segment’s net income totalled $157 million, down 11% from $177 million in the same period of 2015. Excluding specified items, net income totalled $170 million for the six months ended April 30, 2016, up $5 million or 3% from the same period of 2015. The segment's total revenues amounted to $713 million compared to $705 million during the six months ended April 30, 2015. This increase came from growth in net interest income and from higher fee-based revenues associated with the migration of assets from transactional accounts to fee-based accounts. These increases more than offset the decrease in transaction-based and other revenues. For the six months ended April 30, 2016, non-interest expenses stood at $481 million, unchanged from the same six-month period of 2015. At 67.5% for the first six months of fiscal 2016, the efficiency ratio improved from 68.2% in the same six-month period of 2015.

MANAGEMENT’S DISCUSSION AND ANALYSIS FINANCIAL ANALYSIS
National Bank of Canada 11 Report to Shareholders, Second Quarter 2016
Financial Markets (taxable equivalent basis)(1) (millions of Canadian dollars) Quarter ended April 30 Six months ended April 30
2016 2015 % Change 2016 2015 % Change
Operating results excluding specified items(2) Trading activity revenues Equities 128 117 9 235 226 4 Fixed-income 43 55 (22) 108 121 (11) Commodities and foreign exchange 27 29 (7) 71 86 (17) 198 201 (1) 414 433 (4) Financial market fees 71 81 (12) 121 139 (13) Gains (losses) on available-for-sale securities, net 5 3 4 (4) Banking services 75 63 19 147 132 11 Other 80 80 − 194 146 33 Total revenues 429 428 – 880 846 4 Non-interest expenses 195 189 3 385 365 5 Contribution 234 239 (2) 495 481 3 Provisions for credit losses − − − − Income before income taxes 234 239 (2) 495 481 3 Income taxes 65 65 140 130 8 Net income excluding specified items 169 174 (3) 355 351 1 Specified items after income taxes(2) − (16) (145) (16) Net income 169 158 7 210 335 (37) Non-controlling interests 4 2 12 5 Net income attributable to the Bank's shareholders 165 156 6 198 330 (40) Average assets 86,526 89,329 (3) 88,122 89,491 (2) Average loans and acceptances (Corporate Banking only) 11,863 9,655 23 11,797 9,421 25 Average deposits 12,353 12,504 (1) 13,321 12,328 8 Efficiency ratio excluding specified items(2) 45.5 % 44.2 % 43.8 % 43.1 %
(1) See Note 23 to the consolidated financial statements. (2) See the Financial Reporting Method section on page 4.
In the Financial Markets segment, net income totalled $169 million for the second quarter of 2016 compared to $158 million in the same quarter of 2015. Excluding the 2015 specified item ($18 million ($16 million net of income taxes) for the share in the current tax asset write-down of an associate), the segment's 2016 second-quarter net income totalled $169 million, down 3% from $174 million in the same quarter of 2015. On a taxable equivalent basis and excluding the 2015 specified item, the segment’s second-quarter total revenues amounted to $429 million compared to $428 million in the second quarter of 2015. Second-quarter banking service revenues grew 19% year over year, particularly due to more robust credit activity, partly offset by a 12% year-over-year decrease in financial market fees. There was a slight decrease in trading activity revenues that came from fixed-income securities and commodities and foreign exchange contracts, while revenues from equity securities increased year over year. The segment’s second-quarter other revenues were unchanged, as revenue growth at the Credigy Ltd. subsidiary was offset by lower year-over-year gains on investments. At $195 million, the segment’s 2016 second-quarter non-interest expenses increased $6 million year over year, particularly due to higher management fees at the Credigy Ltd. subsidiary. Excluding specified items, the efficiency ratio for the second quarter was 45.5%, up 1.3 percentage points from the same quarter of 2015. Provisions for credit losses were nil for both the second quarters of 2016 and 2015. For the six months ended April 30, 2016, the segment’s net income totalled $210 million, down $125 million from the same six-month period in 2015. Excluding the write-off of its equity interest in associate Maple and the 2015 specified item described above, the segment’s first-half net income totalled $355 million, up 1% from the same period in 2015. On a taxable equivalent basis and excluding specified items, the segment’s first-half total revenues amounted to $880 million, rising $34 million or 4% from $846 million in the first half of 2015. This increase came primarily from the segment’s Other revenue category, which saw a $48 million year-over-year increase owing mainly to higher revenues at the Credigy Ltd. subsidiary. In addition, banking service revenues grew by 11%. Given market conditions, trading activity revenues and financial market fees decreased year over year. The first-half decrease in trading activity revenues came from fixed-income securities and commodities and foreign exchange contracts, the revenues from which decreased by 11% and 17%, respectively, year over year. For the six months ended April 30, 2016, the segment’s non-interest expenses increased year over year, particularly due to higher expenses at the Credigy Ltd. subsidiary as a result of its revenue growth. The segment did not record any provisions for credit losses for the six months ended April 30, 2016 and 2015.

MANAGEMENT’S DISCUSSION AND ANALYSIS FINANCIAL ANALYSIS
National Bank of Canada 12 Report to Shareholders, Second Quarter 2016
Other (taxable equivalent basis)(1)
(millions of Canadian dollars) Quarter ended April 30 Six months ended April 30
2016 2015 2016 2015
Operating results excluding specified items(2)
Net interest income (31) (29) (68) (67)
Non-interest income 56 56 90 97
Total revenues 25 27 22 30
Non-interest expenses 43 42 96 83
Income before income taxes (18) (15) (74) (53)
Income taxes (recovery) (9) (4) (38) (23)
Net income excluding specified items (9) (11) (36) (30)
Specified items after income taxes(2) (21) (10) (35) 2
Net income (30) (21) (71) (28)
Non-controlling interests 13 14 27 29
Net income attributable to the Bank’s shareholders (43) (35) (98) (57)
Average assets 42,024 37,331 41,542 35,526
(1) See Note 23 to the consolidated financial statements. (2) See the Financial Reporting Method section on page 4.
For the Other heading of segment results, there was a net loss of $30 million in the second quarter of 2016 compared to a net loss of $21 million in the same quarter of 2015. The higher net loss stems essentially from specified items, net of income taxes, particularly of an $18 million tax provision recorded in the second quarter of 2016 to reflect the impact of changes to tax measures compared to a $27 million gain realized upon the disposal of restructured notes that was more than offset by $33 million in intangible asset impairment losses recorded in the second quarter of 2015. For the six months ended April 30, 2016, there was a net loss of $71 million compared to a net loss of $28 million in the same six-month period of 2015; this change was attributable to the same reasons provided above for the quarter as well as to the Bank’s share in the charges related to its interest in TMX (particularly an amount of $13 million, net of income taxes, in goodwill and intangible asset impairment losses), to the higher compensatory tax on salaries, and to business development expenses. In addition, revenues of $17 million, net of income taxes, related to the rise in the fair value of restructured notes had been recorded in the first quarter of 2015.
Consolidated Balance Sheet
Consolidated Balance Sheet Summary (millions of Canadian dollars) As at April 30, 2016 As at October 31, 2015 % Change
Assets Cash and deposits with financial institutions 7,452 7,567 (2) Securities 58,088 56,040 4 Securities purchased under reverse repurchase agreements and securities borrowed 13,760 17,702 (22) Loans and acceptances (net of allowances for credit losses) 121,116 115,238 5 Other 20,318 19,543 4 220,734 216,090 2
Liabilities and equity Deposits 130,271 128,830 1 Other 78,038 74,383 5 Subordinated debt 1,015 1,522 (33) Equity attributable to the Bank's shareholders 10,614 10,554 1 Non-controlling interests 796 801 (1) 220,734 216,090 2
Assets As at April 30, 2016, the Bank had total assets of $220.7 billion compared to $216.1 billion as at October 31, 2015, a $4.6 billion or 2% increase. Cash and deposits with financial institutions decreased slightly by $0.1 billion. Securities increased by $2.1 billion since October 31, 2015, particularly due to the purchase of $1.7 billion in held-to-maturity securities in the second quarter of 2016, whereas securities purchased under reverse repurchase agreements and securities borrowed decreased by $3.9 billion.

MANAGEMENT’S DISCUSSION AND ANALYSIS FINANCIAL ANALYSIS
National Bank of Canada 13 Report to Shareholders, Second Quarter 2016
As at April 30, 2016, loans and acceptances, net of allowances for credit losses, increased by $5.9 billion since October 31, 2015 owing to growth in mortgage lending (including home equity lines of credit) and in loans to businesses. The following table provides a breakdown of the main loan and acceptance portfolios. (millions of Canadian dollars) As at April 30, 2016 As at October 31, 2015 As at April 30, 2015 Loans and acceptances Consumer 30,855 29,864 28,890 Residential mortgage 45,096 43,520 40,507 Credit card receivable 2,080 2,069 1,994 Business and government 43,922 40,354 37,994 121,953 115,807 109,385
Consumer loans increased by 3%, primarily due to home equity lines of credit and personal loans, and residential mortgages also grew, rising 4% since October 31, 2015. Loans and acceptances to businesses increased by $3.6 billion or 9% since October 31, 2015, mainly because of corporate loan financing and the activities of the Credigy Ltd. subsidiary. When compared to a year ago, loans and acceptances increased by $12.6 billion or 12%. Consumer loans and residential mortgage loans rose, respectively, by 7% and 11% from a year ago. Loans and acceptances to businesses also contributed to the growth, rising 16% from a year ago and due to the same reasons provided for the change since October 31, 2015. As at April 30, 2016, derivative financial instruments amounted to $12.2 billion, an increase of $1.4 billion since October 31, 2015. This increase should be analyzed along with the derivative financial instruments presented in liabilities, which, at $9.4 billion, were up $1.6 billion, resulting in a net decrease of $0.2 billion since October 31, 2015.
Liabilities As at April 30, 2016, the Bank had total liabilities of $209.3 billion compared to $204.7 billion as at October 31, 2015. As at April 30, 2016, the Bank’s total deposit liability was $130.3 billion versus $128.8 billion as at October 31, 2015, an increase of $1.5 billion or 1%. The following table provides a breakdown of total personal savings. (millions of Canadian dollars) As at April 30, 2016 As at October 31, 2015 As at April 30, 2015 Balance sheet Deposits 47,972 45,981 45,133 Off-balance-sheet Full-service brokerage 107,900 105,395 109,878 Mutual funds 26,707 25,783 20,625 Other 707 636 4,136 135,314 131,814 134,639 Total personal savings 183,286 177,795 179,772
At $48.0 billion as at April 30, 2016, personal deposits increased by 4% since October 31, 2015 and were up $2.9 billion from a year ago. Since the beginning of the fiscal year, personal savings included in assets under administration and under management increased 3% and were up slightly by $0.7 billion or 1% from a year ago given a stock market recovery last quarter. At $76.0 billion, business and government deposits rose $1.6 billion since October 31, 2015 as a result of Bank initiatives to grow this type of deposit. At $6.3 billion, deposits from deposit-taking institutions decreased $2.1 billion since October 31, 2015, mainly attributable to deposits from U.S. government financial institutions and other international financial institutions. Other funding activities increased $3.6 billion since October 31, 2015, essentially due to obligations related to securities sold under repurchase agreements and securities loaned. Equity As at April 30, 2016, the Bank’s equity totalled $11.4 billion, stable when compared to October 31, 2015. A decrease in retained earnings, essentially due to remeasurements of pension plans and other post-employment benefit plans as well as to a $176 million redemption of Series 20 preferred shares, was offset by a $400 million issuance of Series 34 preferred shares. As at May 27, 2016, there were 337,435,081 common shares and 17,935,159 stock options outstanding. For additional information on share capital, see Note 18 to the audited annual consolidated financial statements for the year ended October 31, 2015 and Note 15 to the consolidated financial statements of this quarter.

MANAGEMENT’S DISCUSSION AND ANALYSIS FINANCIAL ANALYSIS
National Bank of Canada 14 Report to Shareholders, Second Quarter 2016
Maple Financial Group Inc. The Bank has a 24.9% equity interest in Maple Financial Group Inc., a privately owned Canadian company that operates in Canada, Germany, the United Kingdom and the United States. Maple Bank GmbH, an indirectly wholly owned subsidiary of the company, is being investigated by German prosecutors regarding alleged tax irregularities. On February 6, 2016, the German Federal Financial Supervisory Authority, BaFin, placed a moratorium on the business activities of Maple Bank GmbH, preventing it from carrying out its normal business activities. This situation is the result of ongoing investigations launched by German authorities in September 2015 focusing on selected trading activities made by Maple Bank GmbH and some of its current and former employees during taxation years 2006 to 2010. The German authorities have alleged that these trading activities violated German tax laws. Neither the Bank nor its employees were involved in these trading activities and to our knowledge are not the subject of these investigations. In light of the situation, the Bank wrote off the carrying value of its equity interest in Maple Financial Group Inc. in an amount of $164 million ($145 million net of income taxes) during the first quarter of 2016. The $164 million write-off of the equity interest in this associate was recognized in the Non-interest income – Other item of the Consolidated Statement of Income for the six-month period ended April 30, 2016 and is presented in the Financial Markets segment. The Bank has advised the German authorities that if it is determined that portions of dividends received from Maple Financial Group Inc. could be reasonably attributable to tax fraud by Maple Bank GmbH, arrangements will be made to repay those amounts to the relevant authority. If any repayments are required, they are not expected to be material to the Bank’s financial position.
Events After the Consolidated Balance Sheet Date
Acquisition of Advanced Bank of Asia Limited On May 16, 2016, the Bank completed the acquisition of Advanced Bank of Asia Limited (ABA), a major Cambodian financial institution that offers financial products and services to individuals and businesses. This acquisition is part of the Bank’s international growth strategy and, upon completion, brings the Bank’s common share equity interest in ABA to 90%. The sum of the $119 million cash purchase price, of the fair value of the previously held interest, and of the estimated value of the non-controlling interest established at the acquisition date exceeds the fair value of the net assets acquired by $125 million. This excess amount will be recorded on the Consolidated Balance Sheet as goodwill and mainly represents ABA’s expected business growth in Cambodia. The goodwill from this acquisition is not deductible for tax purposes. The acquired receivables, consisting mainly of personal and commercial loans, had an estimated acquisition-date fair value of $754 million. This amount also represents the gross contractual amounts receivable that the Bank expects to fully recover. The amount of the acquisition-related cost was negligible and included in Non-interest expenses in the Consolidated Statement of Income for the six-month period ended April 30, 2016. Had the Bank completed the acquisition on November 1, 2015, total revenues would have been approximately $2,744 million and net income approximately $480 million for the six-month period ended April 30, 2016. Redemption of NBC Capital Trust Units On May 16, 2016, NBC Capital Trust, an open-end trust established by the Bank, announced its intention to redeem the 225,000 Trust Capital Securities – Series 1, or NBC CapS – Series 1, issued and outstanding on June 30, 2016 at a redemption price of $1,000 per trust capital security plus the unpaid distributions as at the redemption date of June 30, 2016. After the redemption, holders of NBC CapS – Series 1 will no longer be entitled to receive distributions or exercise any other rights. Given this redemption, the authorized but not issued Series 17 and 18 First Preferred Shares will be withdrawn from the Bank’s authorized capital, and the Bank will redeem the $225 million deposit note from NBC Capital Trust. For additional information, see Notes 13 and 28 to the audited annual consolidated financial statements for the year ended October 31, 2015.
Related Party Transactions
The Bank’s policies and procedures regarding related party transactions have not significantly changed since October 31, 2015. For additional information, see Note 29 to the audited annual consolidated financial statements for the year ended October 31, 2015.
Securitization and Off-Balance-Sheet Arrangements
In the normal course of business, the Bank is party to various financial arrangements that, under IFRS, are not required to be recorded on the Consolidated Balance Sheet or are recorded at amounts other than their notional or contractual values. These arrangements include, among others, transactions with structured entities, derivative financial instruments, issuances of guarantees, the margin funding facility of the master asset vehicle (MAV) conduits, credit instruments, and financial assets received as collateral. A complete analysis of these types of arrangements, including their nature, business purpose and importance, is provided on pages 43 and 44 of the 2015 Annual Report. For additional information on guarantees and a description of obligations under certain indemnification agreements, see Note 27 to the audited annual consolidated financial statements for the year ended October 31, 2015. For additional information about financial assets transferred but not derecognized and structured entities, see Notes 7 and 22, respectively, to the consolidated financial statements.

MANAGEMENT’S DISCUSSION AND ANALYSIS
National Bank of Canada 15 Report to Shareholders, Second Quarter 2016
ACCOUNTING POLICIES AND FINANCIAL DISCLOSURE Accounting Policies and Critical Accounting Estimates
The Bank’s consolidated financial statements are prepared in accordance with section 308(4) of the Bank Act (Canada), which states that, except as otherwise specified by the Office of the Superintendent of Financial Institutions (Canada) (OSFI), the financial statements are to be prepared in accordance with IFRS, as issued by the IASB. None of the OSFI accounting requirements are exceptions to IFRS. These consolidated financial statements have been prepared in accordance with IAS 34 – Interim Financial Reporting using the accounting policies described in Note 1 to the audited annual consolidated financial statements for the year ended October 31, 2015, except the accounting policies described below. Future accounting policy changes are described on the following page. As at November 1, 2015, the Bank reclassified certain amounts in the Consolidated Statement of Income to better reflect the nature of reported revenues in the Personal and Commercial segment. Accordingly, for the quarter ended April 30, 2015, an amount of $10 million presented in the Non-interest income – Credit fees item was reclassified to Net interest income ($19 million for the six-month period ended April 30, 2015). This reclassification had no impact on Net income. In preparing consolidated financial statements in accordance with IFRS, management must exercise judgment and make estimates and assumptions that affect the reporting date carrying amounts of assets and liabilities, net income and related information. Certain accounting policies are considered critical given their importance to the presentation of the Bank’s financial position and operating results and require difficult, subjective and complex judgments and estimates because they relate to matters that are inherently uncertain. Any change in these judgments and estimates could have a significant impact on the Bank’s consolidated financial statements. The critical accounting estimates remain substantially unchanged from those described on pages 90 to 93 of the 2015 Annual Report, except for the change in accounting estimate described on the following page.
Accounting Policy Changes
During the quarter ended April 30, 2016, the Bank adopted the IFRS 9 provisions on own credit risk and updated one of its significant accounting policies, as described below. IFRS 9 – Financial Instruments (own credit risk) On February 1, 2016, the Bank early adopted, on a prospective basis, the own credit risk provisions set out in IFRS 9 – Financial Instruments. According to these provisions, changes in the fair value of financial liabilities designated at fair value through profit or loss that are attributable to changes in an entity’s own credit risk must be recognized in Other comprehensive income unless these changes offset the amounts recognized in Net income. Fair value changes not attributable to an entity’s own risk continue to be recognized in Non-interest income in the Consolidated Statement of Income. The amounts recognized in Other comprehensive income will not be subsequently reclassified to Net income. For the interim and annual periods prior to February 1, 2016, changes in the fair value of financial liabilities designated at fair value through profit or loss had been recognized in Non-interest income in the Consolidated Statement of Income. Held-to-Maturity Securities During the quarter ended April 30, 2016, the Bank classified securities in the held-to-maturity category. Held-to-maturity securities are financial assets with fixed or determinable payments and a fixed maturity that the Bank intends and is able to hold until maturity. The Bank accounts for held-to-maturity securities transactions on the trade date, and the related transaction costs are capitalized. These securities are initially recognized at fair value. In subsequent periods, they are recognized at amortized cost using the effective interest rate method, less any impairment loss measured using the same impairment model used for loans. Interest income and the amortization of premiums and discounts on these securities are recognized in Net interest income in the Consolidated Statement of Income.

MANAGEMENT’S DISCUSSION AND ANALYSIS ACCOUNTING POLICIES AND FINANCIAL DISCLOSURE
National Bank of Canada 16 Report to Shareholders, Second Quarter 2016
Changes in Accounting Estimates
Impairment of Available-for-Sale Securities During the quarter ended January 31, 2016, following an assessment of market conditions, the Bank revisited the definition of the terms “significant” and “prolonged” in order to provide a better estimate of impairment losses, when applicable, on the equity securities classified in available-for-sale securities. As defined in Note 1 to the audited annual consolidated financial statements for the year ended October 31, 2015, the term “significant” represents a decline in fair value of more than 30% over a consecutive period of at least six months, and the term “prolonged” represents a decline in fair value of more than 5% over a consecutive period of at least 12 months. Considering the facts and circumstances, the definitions were changed to the following: a decline in fair value of more than 40% over a consecutive period of at least six months for the term “significant” and a decline in fair value of more than 5% over a consecutive period of at least 18 months for the term “prolonged.” This change in definitions, effective November 1, 2015, is considered a change in accounting estimate and is therefore applied prospectively. This change had the effect of decreasing the impairment losses on the equity securities classified in available-for-sale securities from $9 million to $3 million for the quarter ended January 31, 2016. Sectoral Provision on Non-Impaired Loans During the quarter ended April 30, 2016, following a significant increase in the credit risk of a group of loans of a specific industry, the Bank recorded a sectoral provision on non-impaired loans. When the credit risk of a loan portfolio with similar credit risk characteristics or of a group of loans of a specific industry increases significantly but the loans have yet to be individually identified as impaired, a sectoral provision is established collectively for the entire loan portfolio or loan group. This sectoral provision reflects the impairment losses that the Bank has incurred as a result of events that have occurred but where the individual loss has not been identified.
Future Accounting Policy Changes
The Bank is currently assessing the impact that the adoption of the following standards will have on its consolidated financial statements. Effective Date – Early Adoption on November 1, 2017 IFRS 9 – Financial Instruments In July 2014, the IASB issued a complete and final version of IFRS 9, which replaces the current standard on financial instruments. IFRS 9 sets out requirements for the classification and measurement of financial assets and financial liabilities, for the impairment of financial assets, and for general hedge accounting. Macro hedge accounting has been decoupled from IFRS 9 and will be considered and issued as a separate standard. IFRS 9 provides a single model for financial asset classification and measurement that is based on contractual cash flow characteristics and on the business model for holding financial assets. IFRS 9 also introduces a new, single impairment model for financial assets not measured at fair value through profit or loss that requires recognition of expected credit losses rather than incurred losses as applied under the current standard. This model requires the recognition of 12-month expected credit losses as of the initial recognition date of a financial asset and recognition of lifetime expected losses if the financial instrument’s credit risk has increased significantly since initial recognition. In December 2015, the Basel Committee on Banking Supervision issued Guidance on Credit Risk and Accounting for Expected Credit Losses. As for the new hedge accounting model, it provides better alignment of hedge accounting with risk management activities. However, the current hedge accounting requirements may continue to be applied until the IASB finalizes its macro hedge accounting project. The IASB is requiring IFRS 9 to be applied as of November 1, 2018 and is permitting early adoption. On January 9, 2015, OSFI issued a final version of Early Adoption of IFRS 9 Financial Instruments for Domestic Systemically Important Banks, stating, however, that it expects Domestic Systemically Important Banks, a group that includes the Bank, to adopt IFRS 9 as of November 1, 2017. In general, IFRS 9 is to be applied retrospectively. The Bank will therefore adopt the IFRS 9 provisions as of November 1, 2017. Its first financial statements presented in accordance with these provisions will be its unaudited interim condensed consolidated financial statements for the quarter ending January 31, 2018 and will include an opening consolidated balance sheet as at November 1, 2017. In preparation for the adoption of IFRS 9, the Bank has established an enterprise-wide project, assembled a dedicated team, and established a formal governance structure. It has started implementing a detailed project plan comprising key activities and a corresponding schedule. The project is proceeding according to schedule. As interpretations of the new standard are still evolving, the Bank continues to monitor the interpretations and revisit its preliminary conclusions.

MANAGEMENT’S DISCUSSION AND ANALYSIS ACCOUNTING POLICIES AND FINANCIAL DISCLOSURE
National Bank of Canada 17 Report to Shareholders, Second Quarter 2016
Effective Date – November 1, 2018 IFRS 15 – Revenue from Contracts with Customers In May 2014, the IASB issued a new standard, IFRS 15, which replaces the current revenue recognition standards and interpretations. IFRS 15 provides a single comprehensive model to use when accounting for revenue arising from contracts with customers. The new model applies to all contracts with customers except those that are within the scope of other IFRS standards such as leases, insurance contracts and financial instruments. IFRS 15 is to be applied retrospectively.
At its meeting on July 22, 2015, the IASB unanimously confirmed its proposal to defer the effective date of IFRS 15 to fiscal years beginning on or after January 1, 2018. Early application of IFRS 15 is still permitted. Effective Date – November 1, 2019 IFRS 16 – Leases In January 2016, the IASB issued a new standard, IFRS 16 – Leases. The new standard requires lessees to recognize most leases on the balance sheet using a single model, thereby eliminating the distinction between operating and finance leases. Lessor accounting, however, remains similar to current accounting practice, and the distinction between operating and finance leases is retained. Early application is permitted if IFRS 15 – Revenue from Contracts with Customers has also been applied.
Financial Disclosure
During the second quarter of 2016, no changes were made to the policies, procedures and other processes that comprise the Bank’s internal control over financial reporting that had or could reasonably have a significant impact on the Bank’s internal control over financial reporting.
ADDITIONAL FINANCIAL DISCLOSURE The Financial Stability Board (FSB) develops financial stability standards and seeks to promote cooperation in the oversight and monitoring of financial institutions. OSFI has asked Canadian banks to apply certain recommendations issued by the FSB. The recommendations seek to enhance the transparency and measurement of certain exposures, in particular structured entities, subprime and Alt-A exposures, collateralized debt obligations, residential and commercial mortgage-backed securities, and leveraged financing structures. The Bank does not market any specific mortgage financing program to subprime or Alt-A clients. Subprime loans are generally defined as loans granted to borrowers with a higher credit risk profile than prime borrowers, and the Bank does not grant this type of loan. Alt-A loans are granted to borrowers who cannot provide standard proof of income. The Bank’s Alt-A loan volume was $536 million as at April 30, 2016 ($568 million as at October 31, 2015). The Bank does not have any significant direct position in residential and commercial mortgage-backed securities that are not insured by the Canadian Mortgage and Housing Corporation (CMHC). Credit derivative positions are presented in the Supplementary Regulatory Capital Disclosure report, which is available on the Bank’s website at nbc.ca. Leveraged financing structures are defined by the Bank as loans granted to large corporate and financial sponsor-backed companies that are typically non-investment grade with much higher levels of debt relative to other companies in the same industry. Leveraged finance is commonly employed to achieve a specific objective, for example, to make an acquisition, complete a buy-out or repurchase shares. Leveraged finance risk exposure takes the form of both funded and unfunded commitments. As at April 30, 2016, total commitments for this type of loan stood at $2,463 million ($1,859 million as at October 31, 2015). Details about other exposures are provided in the table on structured entities in Note 22 to the consolidated financial statements. The FSB created the Enhanced Disclosure Task Force (EDTF), a working group that, on October 29, 2012, published a report entitled Enhancing the Risk Disclosures of Banks, which contains 32 recommendations. The Bank makes sure it is in full compliance with those recommendations and is continuing to enhance its risk disclosures to meet the best practices on an ongoing basis. The risk disclosures required by the EDTF are provided in the 2015 Annual Report, in this Report to Shareholders, and in the documents entitled Supplementary Regulatory Capital Disclosure for the Second Quarter Ended April 30, 2016, and Supplementary Financial Information for the Second Quarter Ended April 30, 2016, which are available on the Bank’s website at nbc.ca. In addition, on the following page is a table of contents that users can use to locate information relative to the 32 recommendations.

MANAGEMENT’S DISCUSSION AND ANALYSIS ADDITIONAL FINANCIAL DISCLOSURE
National Bank of Canada 18 Report to Shareholders, Second Quarter 2016
Risk Disclosures
The following table lists the references where users can find information that responds to the EDTF’s 32 recommendations. Pages
2015
Annual Report Report to
Shareholders(1)
Supplementary Regulatory Capital
Disclosure(1) General 1 Location of risk disclosures 10 18 Management’s Discussion and Analysis 46 to 89, 100 and 104 19 to 38 Consolidated Financial Statements Notes 1, 7, 16, 23 and 30 Notes 6 and 17 Supplementary Regulatory Capital Disclosure 4 to 29 2 Risk terminology and risk measures 55 to 89 3 Top and emerging risks 55 and 56 4 New key regulatory ratios 47 to 49, 75, 77 and 82 19 to 21, 30 and 68 Risk governance and risk management 5 Risk management organization, processes and key functions 58 to 61 6 Risk management culture 58 and 59 7 Key risks by business segment, risk management and risk appetite 54, 58 and 59 8 Stress testing 46, 59, 67 and 75 to 79 Capital adequacy and risk-weighted assets (RWA) 9 Minimum Pillar 1 capital requirements 47 to 49 19 to 21 10 Reconciliation of the accounting balance sheet to the regulatory balance sheet 4 to 7 11 Movements in regulatory capital 51 22 12 Capital planning 46 to 54 13 RWA by business segment and by risk type 52 and 54 23 8 14 Capital requirements by risk and RWA calculation method 52 and 62 to 67 23 8 15 Banking book credit risk 52 23 8 and 11 to 16 16 Movements in RWA by risk type 53 24 9 17 Assessment of credit risk model performance 61, 65 and 73 11 to 17 Liquidity 18 Liquidity management and components of the liquidity buffer 77 to 83 30 to 34 Funding 19 Summary of encumbered and unencumbered assets 80 and 81 32 20 Residual contractual maturities of balance sheet items and off-balance-sheet commitments 191 to 194 35 to 38 21 Funding strategy and funding sources 83 to 85 34 Market risk 22 Linkage of market risk measures to balance sheet 71 and 72 27 and 28 23 Market risk factors 70, 73 to 76, 177 to 179 28 to 30 24 VaR: Assumptions, limitations and validation procedures 73 to 75 25 Stress tests, stressed VaR and backtesting 73 to 76 Credit risk 26 Credit risk exposures 63, 66 and 147 to 150 26 and 59 to 61 10 to 24 and 17 to 23(2) 27 Policies for identifying impaired loans 68, 120 and 121 28 Movements in impaired loans and allowances for credit losses 100, 104 and 147 to 150 59 to 61 20 29 Counterparty credit risk relating to derivatives transactions 68, 69 and 161 to 163 25 and 26 30 Credit risk mitigation 67 to 69 22 and 24 Other risks 31 Other risks: Governance, measurement and management 56, 57 and 86 to 89 32 Publicly known risk events 86 No risk event
(1) For the second quarter ended April 30, 2016. (2) These pages are included in the document entitled Supplementary Financial Information for the Second Quarter Ended April 30, 2016.

MANAGEMENT’S DISCUSSION AND ANALYSIS
National Bank of Canada 19 Report to Shareholders, Second Quarter 2016
CAPITAL MANAGEMENT Capital management has a dual role of ensuring a competitive return to the Bank’s shareholders while maintaining a solid capital foundation that covers risks inherent to the Bank’s business, supports its business segments and protects its clients. The Bank’s capital management policy defines guiding principles as well as the roles and responsibilities of its internal capital adequacy assessment process. This process aims to determine the capital that the Bank needs to pursue its business operations and accommodate unexpected losses arising from extremely adverse economic and operational conditions. For additional information on the capital management framework, see the Capital Management section on pages 46 to 54 of the Bank’s 2015 Annual Report. Basel Accord The Basel III regulatory framework sets out transitional arrangements for the period of 2013 to 2019. OSFI has introduced two methodologies for determining capital. The “all-in” methodology includes all of the regulatory adjustments that will be required by 2019 while retaining the phase-out rules for non-qualifying capital instruments. The “transitional” methodology adheres to the guidelines of the Basel Committee on Banking Supervision (BCBS) and, in addition to applying the phase-out rules for non-qualifying capital instruments, also applies a more flexible and steady phasing in of the required regulatory adjustments. The Bank will disclose its capital ratios calculated according to both methodologies for each quarter until the start of 2019. However, OSFI is requiring Canadian banks to meet the minimum “all-in” thresholds rather than the minimum thresholds calculated using the “transitional” method. OSFI designated Canada’s six largest banks, a group that includes National Bank, as Domestic Systemically Important Banks (D-SIBs). Consequently, the Bank and all other major Canadian banks have to maintain a CET1 capital ratio of at least 8.0%, a Tier 1 capital ratio of at least 9.5%, and a Total capital ratio of at least 11.5%, all determined using the “all-in” methodology.
In addition to those measures, OSFI is requiring that regulatory capital instruments other than common equity have a non-viability contingent capital (NVCC) clause to ensure that investors bear losses before taxpayers should the government determine that it is in the public interest to rescue a non-viable financial institution. Instruments issued before January 1, 2013 that would be Basel III compliant if it were not for the absence of the NVCC clause are grandfathered and will be phased out over a period of ten years. The Bank expects to phase out all of its non-NVCC instruments without resorting to any regulatory event redemption. To ensure an implementation similar to that in other countries, OSFI has decided to phase in the Credit Valuation Adjustment (CVA) charge over a period of five years beginning in 2014. For fiscal 2016, 64%, 71% and 77% of total CVA will be applied to the calculation of the CET1, Tier 1 and Total capital ratios, respectively, and these percentages will gradually increase each year thereafter until they reach 100% by 2019. Since January 1, 2015, OSFI has been requiring Canadian banks to meet a Basel III leverage ratio of at least 3.0%. The leverage ratio is a measure independent of risk that is calculated by dividing the amount of Tier 1 capital by total exposure. Total exposure is defined as the sum of on-balance-sheet assets (including derivative exposures and securities financing transaction exposures) and off-balance-sheet items. The assets deducted from Tier 1 capital are also deducted from total exposure. The Bank ensures that its capital levels are always above the minimum regulatory capital requirements for OSFI’s “all-in” ratios. By maintaining a strong capital structure, the Bank can cover the risks inherent to its business activities, support its business segments and protect its clients. Other disclosure requirements pursuant to Pillar 3 of the Basel Accord and a set of recommendations defined by the EDTF are presented in the Supplementary Regulatory Capital Disclosure report published quarterly and available on the Bank’s website at nbc.ca. Furthermore, a complete list of capital instruments and their main features is also available on the Bank’s website under Investor Relations > Capital and Debt Information > Regulatory Capital > Main Features of Regulatory Capital Instruments.

MANAGEMENT’S DISCUSSION AND ANALYSIS CAPITAL MANAGEMENT
National Bank of Canada 20 Report to Shareholders, Second Quarter 2016
Regulatory Environment In December 2014, the BCBS issued the final securitization framework rules in Revisions to the Securitisation Framework. The rules will be implemented as of January 2018. Then, in November 2015, the BCBS issued a consultative paper, Capital Treatment for ‘Simple, Transparent and Comparable’ Securitisations, which proposes to amend the rules in the previous paper to allow a more favourable capital treatment for transactions meeting the requirements of simplicity, transparency and comparability as specified in Criteria for Identifying Simple, Transparent and Comparable Securitisations issued by the BCBS in July 2015. In December 2014, the BCBS also issued two consultative papers, Capital Floors: The Design of a Framework Based on Standardised Approaches and Revisions to the Standardised Approach for Credit Risk, the latter having been reviewed a second time in December 2015. The capital floor is meant to mitigate risk related to internal credit risk calculation models and enhance the comparability of risk across banks. The new floor will replace the current one, which is still based on Basel I. The new standardized approach for credit risk aims to reduce reliance on credit rating agencies and improve risk sensitivity. On January 28, 2015, the BCBS issued the final disclosure rules under Pillar 3: Revised Pillar 3 Disclosure Requirements. The new requirements are intended to improve transparency, consistency and comparability of results across banks and must be applied as of the end of 2016. However, on January 21, 2016, OSFI issued a draft guideline entitled Pillar 3 Disclosure Requirements, specifying therein that D-SIBs will have to meet the BCBS’s requirements as of the fiscal year ending October 31, 2017. The final version of the guideline will replace OSFI’s November 2007 advisory, Pillar 3 Disclosure Requirements. On March 11, 2016, the BCBS issued a consultative paper entitled Pillar 3 Disclosure Requirements – Phase 2. In July 2015, the BCBS issued a consultative paper, Review of the Credit Valuation Adjustment Risk Framework, with the aim of ensuring that all important drivers of CVA are considered in calculating capital, aligning the various accounting frameworks and ensuring consistency with the market risk framework. No date has been set for the implementation of these new rules, which will increase the level of capital the Bank is required to maintain. On November 9, 2015, the FSB issued a standard entitled Total Loss-Absorbing Capacity (TLAC) Standard for Global Systemically Important Banks (G-SIBs), which aims to implement a resolution strategy to determine whether global systemically important banks (G-SIBs) have sufficient loss-absorbing capacity to minimize impacts on financial stability and maintain the continuity of critical economic functions. There is currently no guidance on how the proposed standard will be incorporated into Canada’s bail-in regime, which has yet to be finalized. Also on November 9, 2015, the BCBS issued a consultative paper, TLAC Holdings, which sets out the proposed regulatory capital treatment for loss-absorbing instruments held by internationally active banks. This proposed prudential treatment is intended to reduce contagion in the financial system should a G-SIB go into resolution. On December 17, 2015, the BCBS issued a consultative paper, Identification and Measurement of Step-In Risk, that measures the risk of the Bank providing support to an unconsolidated entity, should that entity experience financial stress, and do so beyond or in the absence of any contractual obligation in order to mitigate the impact of the shadow banking system. On January 14, 2016, the BCBS issued the final rules for calculating market risk in Minimum Capital Requirements for Market Risk, a document that aims to remedy structural weaknesses in the trading portfolio that had not been addressed in previous market risk revisions. These rules will come into effect on January 1, 2019. On March 4, 2016, the BCBS issued Standardised Measurement Approach for Operational Risk, a consultative document that proposes a new standardized method for calculating operational risk. In the federal budget tabled on March 22, 2016, the Government of Canada confirmed its intention to move forward with the rules proposed in the Taxpayer Protection and Bank Recapitalization Regime Consultation Paper, which outlines a proposed bail-in regime applicable to D-SIBs that is in line with key international standards such as the FSB’s Key Attributes of Effective Resolution Regimes for Financial Institutions. On April 20, 2016, Canada’s Finance Minister introduced draft legislation that creates a bail-in regime for D-SIBs. The shares and eligible liabilities that will be subject to the conversion powers mentioned in the draft legislation, as well as the terms and conditions of such conversion, will be prescribed by regulations. The draft legislation also provides that OSFI will require D-SIBs to maintain a minimum capacity to absorb losses. Higher loss absorbency requirements will be established to ensure that affected banks maintain sufficient capital to absorb the proposed conversions. The implementation date of the proposed regime has not yet been determined. The Bank continues to monitor bail-in regime developments, as additional details on implementation, scope and timing are expected to follow through regulations.

MANAGEMENT’S DISCUSSION AND ANALYSIS CAPITAL MANAGEMENT
National Bank of Canada 21 Report to Shareholders, Second Quarter 2016
On March 24, 2016, the BCBS issued Reducing Variation in Credit Risk-Weighted Assets - Constraints on the Use of Internal Model Approaches, a consultative document that aims to limit the use of advanced credit risk calculation models. On April 6, 2016, the BCBS also issued Revisions to the Basel III Leverage Ratio Framework, a consultative document that proposes, in particular, revisions to the treatment of derivative exposures. On April 21, 2016, the BCBS issued Interest Rate Risk in the Banking Book, a document that addresses risk management, capital treatment and the supervision of interest rate risk in the banking book. These rules, which have to be implemented by 2018, are intended to ensure that banks have adequate capital to cover potential banking book losses arising from interest rate movements and to limit capital arbitrage between the trading book and the banking book. The following table presents the capital ratios and the leverage ratio calculated using the “all-in” methodology and the regulatory targets under Basel III. Regulatory ratios Minimum regulatory ratios to be maintained
As at April 30,
2016 As at October 31,
2015 BCBS
2016 (1)
OSFI 2016 (1)(2)
Capital ratios CET1 9.8 % 9.9 % 5.125 % 8.0 % Tier 1(3) 12.9 % 12.5 % 6.625 % 9.5 % Total(3)(4) 14.8 % 14.0 % 8.625 % 11.5 %
Leverage ratio 3.7 % 3.7 % n.a. 3.0 % n.a. Not applicable (1) For the capital ratios, includes the 0.625% conservation buffer set by the BCBS and the 2.5% conservation buffer set by OSFI. (2) For the capital ratios, includes a 1% surcharge applicable to D-SIBs since January 1, 2016. (3) Figures as at October 31, 2015 include the redemption of the Series 20 preferred shares on November 15, 2015. (4) Figures as at October 31, 2015 include the $500 million redemption of notes on November 2, 2015.
Management Activities On November 2, 2015, the Bank completed a $500 million redemption of medium-term notes maturing in November 2020 at a price equal to their nominal value plus accrued interest. These instruments had been excluded from the capital ratio calculations as at October 31, 2015. On November 15, 2015, the Bank redeemed all the issued and outstanding Non-Cumulative Fixed-Rate Series 20 First Preferred Shares. Pursuant to the share conditions, the redemption price was $25.50 per share plus the periodic dividend declared and unpaid. These instruments had been excluded from the capital ratio calculations as at October 31, 2015. On January 22, 2016, the Bank completed the issuance of 16,000,000 Non-Cumulative 5-Year Rate-Reset Series 34 First Preferred Shares at a price equal to $25.00 per share for gross proceeds of $400 million. Given that the Series 34 preferred shares satisfy the non-viability contingent capital requirements, they qualify for the purposes of calculating regulatory capital under Basel III.

MANAGEMENT’S DISCUSSION AND ANALYSIS CAPITAL MANAGEMENT
National Bank of Canada 22 Report to Shareholders, Second Quarter 2016
Movement in Regulatory Capital(1)
(millions of Canadian dollars) Six months ended
April 30, 2016
Common Equity Tier 1 (CET1) capital Balance at beginning 6,801 Issuance of common shares (including Stock Option Plan) 6 Repurchase of common shares − Contributed surplus 2 Dividends on preferred and common shares (388) Net income attributable to the Bank’s shareholders 432 Removal of own credit spread net of income taxes 6 Other (256) Movements in accumulated other comprehensive income Translation adjustments (20) Available-for-sale securities (18) Other 38 Change in goodwill and intangible assets (net of related tax liability) (55) Other, including regulatory adjustments and transitional arrangements Change in defined benefit pension plan asset (net of related tax liability) 124 Change in amount exceeding 15% threshold Deferred tax assets − Significant investment in common shares of financial institutions − Change in other regulatory adjustments(2) (3) Balance at end 6,669 Additional Tier 1 capital Balance at beginning 1,825 New Tier 1 eligible capital issuances 400 Redeemed capital(3) − Change in non-qualifying Additional Tier 1 subject to phase-out (13) Other, including regulatory adjustments and transitional arrangements (1) Balance at end 2,211 Total Tier 1 capital 8,880 Tier 2 capital Balance at beginning 1,052 New Tier 2 eligible capital issuances − Redeemed capital(4) − Change in non-qualifying Tier 2 subject to phase-out 1 Change in eligible collective allowances 231 Other, including regulatory adjustments and transitional arrangements − Balance at end 1,284 Total regulatory capital 10,164
(1) Figures are presented on an “all-in” basis. (2) Represents the change in investments in the Bank’s own CET1 and shortfall of total provisions to expected losses. (3) The redemption of the Series 20 preferred shares on November 15, 2015 was included in the October 31, 2015 Tier 1 capital. (4) The $500 million redemption of notes on November 2, 2015 was included in the October 31, 2015 Tier 2 capital.

MANAGEMENT’S DISCUSSION AND ANALYSIS CAPITAL MANAGEMENT
National Bank of Canada 23 Report to Shareholders, Second Quarter 2016
Risk-Weighted Assets by Key Risk Drivers CET1 risk-weighted assets (RWA) decreased by $0.4 billion to total $68.4 billion as at April 30, 2016 compared to $68.8 billion as at October 31, 2015. This decrease came mainly from the impact of a rising Canadian dollar on currency exposures. The Bank’s CET1 RWA are presented in the following table. Capital Adequacy Under Basel III(1) (millions of Canadian dollars) As at April 30, 2016 As at October 31, 2015
Exposure at default
Risk-weighted assets
Capital requirement(2)
Risk-weighted assets
Standardized
Approach AIRB
Approach Other Total Total
Credit risk Retail Residential mortgages 44,436 216 4,811 − 5,027 402 4,975 Qualifying revolving retail 5,442 − 1,152 − 1,152 92 1,036 Other retail 14,975 1,776 4,929 − 6,705 536 6,651 Non-retail Corporate 56,925 1,822 25,047 − 26,869 2,149 26,662 Sovereign 22,969 − 580 − 580 46 629 Financial institutions 4,770 153 1,162 − 1,315 105 974 Banking book equities(3) 595 − 595 − 595 48 593 Securitization 3,078 − 781 − 781 62 798 Other assets 27,726 − − 3,495 3,495 280 4,252 Counterparty credit risk Corporate 4,595 38 53 − 91 7 96 Sovereign 12,495 − 17 − 17 1 22 Financial institutions 51,621 − 1,204 − 1,204 96 1,402 Trading portfolio 10,607 105 2,554 − 2,659 213 2,774 Credit valuation adjustment charge(4) 2,090 − − 2,090 167 2,367 Regulatory scaling factor − 2,570 − 2,570 206 2,512 Total – Credit risk 260,234 6,200 45,455 3,495 55,150 4,410 55,743 Market risk VaR − 1,319 − 1,319 106 1,262 Stressed VaR − 1,972 − 1,972 158 1,875 Interest rate specific risk 680 − − 680 54 828 Total – Market risk 680 3,291 − 3,971 318 3,965 Operational risk 9,254 − − 9,254 740 9,127 Total 260,234 16,134 48,746 3,495 68,375 5,468 68,835
(1) Figures are presented on an “all-in” basis. (2) The capital requirement is equal to 8% of risk-weighted assets. (3) Calculated using the simple risk-weighted method. (4) Calculated based on CET1 RWA.

MANAGEMENT’S DISCUSSION AND ANALYSIS CAPITAL MANAGEMENT
National Bank of Canada 24 Report to Shareholders, Second Quarter 2016
Risk-Weighted Assets Movement by Key Drivers(1)
(millions of Canadian dollars) Quarter ended
April 30, 2016 January 31, 2016
Non-counterparty
credit risk Counterparty
credit risk(2) Total Total
Credit risk – Risk-weighted assets at beginning 49,841 6,843 56,684 55,743 Book size 197 (565) (368) 631 Book quality (78) 37 (41) (411) Model updates 12 (4) 8 − Methodology and policy − − − − Acquisitions and disposals − − − − Foreign exchange movements (883) (250) (1,133) 721 Credit risk – Risk-weighted assets at end 49,089 6,061 55,150 56,684 Market risk – Risk-weighted assets at beginning 3,779 3,965 Movement in risk levels(3) 192 (186) Model updates − − Methodology and policy − − Acquisitions and disposals − − Market risk – Risk-weighted assets at end 3,971 3,779 Operational risk – Risk-weighted assets at beginning 9,278 9,127 Movement in risk levels (24) 151 Acquisitions and disposals − − Operational risk – Risk-weighted assets at end 9,254 9,278 Risk-weighted assets at end 68,375 69,741
(1) Figures are presented on an “all-in” basis. (2) Calculated based on CET1 risk-weighted assets. (3) Also includes foreign exchange movements that are not considered material.
The table above provides the risk-weighted assets movements by key drivers underlying the different risk categories. The “Book size” item reflects organic changes in exposure size and composition (including new loans and maturing loans). RWA movements attributable to book size include increases or decreases in exposures, measured by exposure at default, assuming a stable risk profile. The “Book quality” item is the Bank’s best estimate of changes in book quality related to experience, such as underlying customer behaviour or demographics, including changes resulting from model recalibrations or realignments.

MANAGEMENT’S DISCUSSION AND ANALYSIS CAPITAL MANAGEMENT
National Bank of Canada 25 Report to Shareholders, Second Quarter 2016
Regulatory Capital Ratios The CET1 capital ratio was 9.8% as at April 30, 2016, relatively stable versus 9.9% as at October 31, 2015. The Tier 1 and the Total capital ratios were, respectively, 12.9% and 14.8% as at April 30, 2016 versus 12.5% and 14.0% as at October 31, 2015. The change in these two capital ratios stems essentially from the issuance of Series 34 preferred shares for $400 million. The leverage ratio was 3.7% as at April 30, 2016, unchanged from October 31, 2015. Regulatory Capital and Ratios Under Basel III(1)
(millions of Canadian dollars) As at April 30, 2016 As at October 31, 2015
Capital CET1 6,669 6,801 Tier 1(2) 8,880 8,626 Total(2)(3) 10,164 9,678 Risk-weighted assets CET1 capital 68,375 68,835 Tier 1 capital 68,604 69,094 Total capital 68,800 69,316 Total exposure 239,401 234,957 Capital ratios CET1 9.8 % 9.9 % Tier 1(2) 12.9 % 12.5 % Total(2)(3) 14.8 % 14.0 %
Leverage ratio 3.7 % 3.7 % (1) Figures are presented on an “all-in” basis. (2) Figures as at October 31, 2015 include the redemption of the Series 20 preferred shares on November 15, 2015. (3) Figures as at October 31, 2015 include the $500 million redemption of notes on November 2, 2015.
Dividends On May 31, 2016, the Board of Directors declared regular dividends on the various series of first preferred shares and a dividend of 55 cents per common share, up 1 cent or 2%, payable on August 1, 2016 to shareholders of record on June 20, 2016.

MANAGEMENT’S DISCUSSION AND ANALYSIS
National Bank of Canada 26 Report to Shareholders, Second Quarter 2016
RISK MANAGEMENT The Bank aims to maintain its financial performance by continuing to ensure prudent management and a sound balance between return and the risks assumed. The Bank views risk as an integral part of its development and the diversification of its activities and advocates a risk management approach consistent with its business expansion strategy. The Bank’s governance structure for risk management has remained largely unchanged from that described in the 2015 Annual Report. Managing risk requires a solid understanding of every type of risk found across the Bank. In addition to providing assurance that risk levels do not exceed acceptable thresholds, effective risk management can help control the volatility of the Bank's results. Despite the exercise of stringent risk management and the mitigation measures in place, risk cannot be suppressed entirely, and the residual risks may occasionally cause significant losses. Certain risks are discussed below. For additional information, see the Risk Management section on pages 55 to 89 of the 2015 Annual Report. Risk management information is also provided in Note 6 to the consolidated financial statements, which covers loans.
Credit Risk Credit risk is the risk of incurring a financial loss if an obligor does not fully honour its contractual commitments to the Bank. Obligors may be borrowers, issuers, counterparties or guarantors. Credit risk is the most significant risk facing the Bank in the normal course of business. The amounts shown in the following table represent the Bank’s maximum exposure to credit risk as at the financial reporting date without taking into account any collateral held or any other credit enhancements. These amounts do not take into account allowances for credit losses nor amounts pledged as collateral. The table also excludes equity securities. Maximum Credit Risk Exposure Under the Basel Asset Categories
(millions of Canadian dollars) As at April 30,
2016 As at October 31,
2015
Drawn
Undrawn commitments
Repo-style transactions(1)
OTC derivatives
Other off-balance-
sheet items(2) Total Total
Retail Residential mortgages 38,577 5,859 − − − 44,436 44,431 Qualifying revolving retail 2,688 2,754 − − − 5,442 5,198 Other retail 13,709 1,253 − − 13 14,975 15,052 54,974 9,866 − − 13 64,853 64,681 Non-retail Corporate 40,855 13,360 4,588 7 2,710 61,520 58,429 Sovereign 19,032 3,829 12,175 321 107 35,464 35,584 Financial institutions 3,793 344 50,981 640 633 56,391 63,033 63,680 17,533 67,744 968 3,450 153,375 157,046 Trading portfolio − − − 10,607 − 10,607 10,318 Securitization 634 − − − 2,444 3,078 2,982 Total – Gross Credit Risk 119,288 27,399 67,744 11,575 5,907 231,913 235,027 Standardized Approach 9,295 407 1,796 518 410 12,426 10,865 AIRB Approach 109,993 26,992 65,948 11,057 5,497 219,487 224,162 Total – Gross Credit Risk 119,288 27,399 67,744 11,575 5,907 231,913 235,027
(1) Securities purchased under reverse repurchase agreements and sold under repurchase agreements as well as securities loaned and borrowed. (2) Letters of guarantee, documentary letters of credit, and securitized assets that represent the Bank’s commitment to make payments in the event that a client fails to meet its financial
obligations to third parties.
In order to meet OSFI’s mortgage loan disclosure requirements, additional information has been provided in Supplementary Financial Information for the Second Quarter Ended April 30, 2016 and in Supplementary Regulatory Capital Disclosure for the Second Quarter Ended April 30, 2016, which are available on the Bank’s website at nbc.ca.

MANAGEMENT’S DISCUSSION AND ANALYSIS RISK MANAGEMENT
National Bank of Canada 27 Report to Shareholders, Second Quarter 2016
Market Risk Market risk is the risk of losses in on- and off-balance-sheet positions arising from movements in market parameters. Managing this risk is a core competency for the Bank in its market making, trading, investing and asset/liability management activities. The following tables provide a breakdown of the Bank’s Consolidated Balance Sheet into financial assets and liabilities by those that carry market risk and those that do not carry market risk, distinguishing between trading positions whose main risk measures are Value-at-Risk (VaR) and stressed VaR (SVaR) and non-trading positions that use other risk measures.
Reconciliation of Market Risk with Consolidated Balance Sheet Items (millions of Canadian dollars) As at April 30, 2016
Market risk measures
Balance
sheet Trading(1) Non-Trading(2) Not subject to
market risk Non-traded risk primary
risk sensitivity
Assets Cash and deposits with financial institutions 7,452 87 6,943 422 Interest rate(3) Securities At fair value through profit or loss 42,271 40,097 2,174 − Interest rate(3) and other(4) Available-for-sale 14,110 − 14,110 − Interest rate(3) and equity(5) Held-to-maturity 1,707 − 1,707 − Interest rate(3) Securities purchased under reverse repurchase agreements and securities borrowed 13,760 − 13,760 − Interest rate(3)(6) Loans, net of allowances 112,150 5,091 107,059 − Interest rate(3) Customers’ liability under acceptances 8,966 − 8,966 − Interest rate(3) Derivative financial instruments 12,181 10,712 1,469 − Interest rate Purchased receivables 1,334 − 1,334 − Interest rate Defined benefit asset 87 − 87 − Other Other 6,716 − − 6,716 220,734 55,987 157,609 7,138 Liabilities Deposits 130,271 3,463 126,808 − Interest rate(3) Acceptances 8,966 − 8,966 − Interest rate(3) Obligations related to securities sold short 14,839 14,839 − − Obligations related to securities sold under repurchase agreements and securities loaned 18,295 − 18,295 − Interest rate(3)(6) Derivative financial instruments 9,359 8,151 1,208 − Interest rate Liabilities related to transferred receivables 19,773 4,148 15,625 − Interest rate(3) Defined benefit liability 193 − 193 − Other Other 6,613 44 1,349 5,220 Interest rate(3) Subordinated debt 1,015 − 1,015 − Interest rate(3) 209,324 30,645 173,459 5,220
(1) Trading positions whose risk measures are VaR and SVaR. See the tables that show the VaR and SVaR distributions of the trading portfolios by risk category as well as their correlation effect,
which are presented on the following pages and in the Market Risk Management section of the 2015 Annual Report. (2) Non-trading positions that use other risk measures. (3) See the tables that show the VaR and SVaR distributions of the trading portfolios by risk category and their correlation effect as well as the interest rate sensitivity tables, which are presented
on the following pages and in the Market Risk Management section of the 2015 Annual Report. (4) See the Master Asset Vehicles section in Note 6 to the audited annual consolidated financial statements as at October 31, 2015. (5) The fair value of equity securities classified as available-for-sale is disclosed in Notes 3 and 5 to the consolidated financial statements. (6) These instruments are recorded at amortized cost and are subject to credit risk for capital management purposes. For trading-related transactions with maturities of more than one day, interest
rate risk is included in the VaR and SVaR measures.

MANAGEMENT’S DISCUSSION AND ANALYSIS RISK MANAGEMENT
National Bank of Canada 28 Report to Shareholders, Second Quarter 2016
(millions of Canadian dollars) As at October 31, 2015
Market risk measures
Balance
sheet Trading(1) Non-Trading(2) Not subject to
market risk Non-traded risk primary
risk sensitivity
Assets Cash and deposits with financial institutions 7,567 36 7,192 339 Interest rate(3) Securities At fair value through profit or loss 41,997 39,805 2,192 − Interest rate(3) and other(4) Available-for-sale 14,043 − 14,043 − Interest rate(3) and equity(5) Securities purchased under reverse repurchase agreements and securities borrowed 17,702 − 17,702 − Interest rate(3)(6) Loans, net of allowances 105,853 4,565 101,288 − Interest rate(3) Customers’ liability under acceptances, net of allowances 9,385 − 9,385 − Interest rate(3) Derivative financial instruments 10,842 9,412 1,430 − Interest rate(7) Purchased receivables 1,438 − 1,438 − Interest rate Defined benefit asset 268 − 268 − Other(8) Other 6,995 − − 6,995 216,090 53,818 154,938 7,334 Liabilities Deposits 128,830 3,204 125,626 − Interest rate(3) Acceptances 9,400 − 9,400 − Interest rate(3) Obligations related to securities sold short 17,333 17,333 − − Obligations related to securities sold under repurchase agreements and securities loaned 13,779 − 13,779 − Interest rate(3)(6) Derivative financial instruments 7,756 6,687 1,069 − Interest rate(7) Liabilities related to transferred receivables 19,770 4,139 15,631 − Interest rate(3) Defined benefit liability 183 − 183 − Other(8) Other 6,162 50 1,349 4,763 Interest rate(3) Subordinated debt 1,522 − 1,522 − Interest rate(3) 204,735 31,413 168,559 4,763
(1) Trading positions whose risk measures are VaR and SVaR. See the tables that show the VaR and SVaR distributions of the trading portfolios by risk category as well as their correlation effect,
which are presented on the following pages and in the Market Risk Management section of the 2015 Annual Report. (2) Non-trading positions that use other risk measures. (3) See the tables that show the VaR and SVaR distributions of the trading portfolios by risk category and their correlation effect as well as the interest rate sensitivity tables, which are presented
on the following pages and in the Market Risk Management section of the 2015 Annual Report. (4) See the Master Asset Vehicles section in Note 6 to the audited annual consolidated financial statements as at October 31, 2015. (5) The fair value of equity securities classified as available-for-sale is disclosed in Notes 3 and 5 to the consolidated financial statements. (6) These instruments are recorded at amortized cost and are subject to credit risk for capital management purposes. For trading-related transactions with maturities of more than one day, interest
rate risk is included in the VaR and SVaR measures. (7) See Notes 16 and 17 to the audited annual consolidated financial statements as at October 31, 2015. (8) See Note 23 to the audited annual consolidated financial statements as at October 31, 2015.
Trading Activities The first table below shows the VaR distribution of trading portfolios by risk category as well as their correlation effect. The second table on the next page shows the SVaR distribution, i.e., the VaR of the Bank's current portfolios obtained following the calibration of risk factors over a 12-month stress period. VaR of Trading Portfolios by Risk Category(1) (millions of Canadian dollars) Quarter ended Six months ended
April 30, 2016 January 31, 2016 April 30, 2015 April 30, 2016 April 30, 2015 Low High Average Period end Average Period end Average Period end Average Average
Interest rate (3.3) (6.0) (4.3) (3.6) (5.1) (5.3) (4.4) (4.4) (4.7) (4.9) Exchange rate (2.6) (5.3) (3.8) (2.8) (2.8) (3.0) (2.0) (2.1) (3.3) (1.8) Equity (3.6) (5.6) (4.5) (3.6) (4.1) (4.2) (3.5) (2.3) (4.3) (3.6) Commodity (0.6) (1.2) (0.8) (0.9) (1.7) (0.7) (1.0) (0.8) (1.2) (1.1) Correlation effect(2) n.m. n.m. 6.7 6.3 7.3 5.4 4.7 2.9 6.9 5.4 Total trading VaR (4.6) (8.1) (6.7) (4.6) (6.4) (7.8) (6.2) (6.7) (6.6) (6.0)
n.m. Computation of a correlation effect for the high and low is not meaningful, as highs and lows may occur on different days and be attributable to different types of risk. (1) Amounts are presented on a pre-tax basis and represent one-day VaR using a 99% confidence level. (2) The total trading VaR is less than the sum of the individual risk factor VaR results due to the correlation effect.

MANAGEMENT’S DISCUSSION AND ANALYSIS RISK MANAGEMENT
National Bank of Canada 29 Report to Shareholders, Second Quarter 2016
SVaR of Trading Portfolios by Risk Category(1)
(millions of Canadian dollars) Quarter ended Six months ended
April 30, 2016 January 31, 2016 April 30, 2015 April 30, 2016 April 30, 2015 Low High Average Period end Average Period end Average Period end Average Average
Interest rate (6.2) (9.0) (7.9) (6.2) (9.4) (9.0) (7.7) (7.6) (8.6) (8.9) Exchange rate (2.9) (9.6) (4.9) (3.1) (3.8) (8.0) (3.0) (2.7) (4.4) (3.1) Equity (4.3) (7.2) (5.8) (4.3) (5.3) (6.1) (5.0) (3.9) (5.6) (5.2) Commodity (0.6) (1.4) (1.1) (1.2) (2.4) (0.9) (1.9) (1.7) (1.7) (2.0) Correlation effect(2) n.m. n.m. 9.7 6.5 12.3 13.9 9.6 9.9 11.0 10.6 Total trading SVaR (8.0) (11.8) (10.0) (8.3) (8.6) (10.1) (8.0) (6.0) (9.3) (8.6)
n.m. Computation of a correlation effect for the high and low is not meaningful, as highs and lows may occur on different days and be attributable to different types of risk. (1) Amounts are presented on a pre-tax basis and represent one-day SVaR using a 99% confidence level. (2) The total trading SVaR is less than the sum of the individual risk factor SVaR results due to the correlation effect.
The average total trading VaR was $6.7 million for the quarter ended April 30, 2016 compared to $6.4 million for the quarter ended January 31, 2016. The average total trading SVaR was $10.0 million for the second quarter of 2016, up $1.4 million from the preceding quarter. The increases in average total trading VaR and SVaR were mainly caused by higher foreign exchange and equity risks, partly offset by lower interest rate risk. Total trading VaR and SVaR remained relatively stable during the first half of the quarter and decreased gradually during the second half of the quarter. Daily Trading Revenues The following table shows daily trading and underwriting revenues and VaR. Daily trading and underwriting revenues were positive almost 97% of the days for the quarter ended April 30, 2016. Net daily trading losses in excess of $1 million were recorded on two days. None of these losses exceeded the VaR limit.
Quarter ended April 30, 2016 (millions of Canadian dollars)
(11)
(9)
(7)
(5)
(3)
(1)
1
3
5
7
9
11
13
15
17
February2016
March2016
April2016
Trading revenues VaR (CAN)

MANAGEMENT’S DISCUSSION AND ANALYSIS RISK MANAGEMENT
National Bank of Canada 30 Report to Shareholders, Second Quarter 2016
Interest Rate Sensitivity – Non-Trading Activities (Before Tax) The following tables present the potential before-tax impact of an immediate and sustained 100-basis-point increase or decrease in interest rates on net interest income for the next 12 months and on the economic value of equity in the Bank’s non-trading portfolios, assuming no further hedging is undertaken. (millions of Canadian dollars) As at April 30, 2016
Impact on equity Impact on net interest income
Canadian
dollar U.S.
dollar Total Canadian
dollar U.S.
dollar Total
100-basis-point increase in the interest rate (198) 38 (160) (10) 17 7 100-basis-point decrease in the interest rate 154 (43) 111 13 (18) (5)
(millions of Canadian dollars) As at October 31, 2015
Impact on equity Impact on net interest income
Canadian
dollar U.S.
dollar Total Canadian
dollar U.S.
dollar Total
100-basis-point increase in the interest rate (145) 20 (125) 14 16 30 100-basis-point decrease in the interest rate 115 (25) 90 (12) (18) (30)
Liquidity Risk Liquidity risk is the risk that the Bank will be unable to honour daily cash and financial obligations without resorting to costly and untimely measures. Liquidity risk arises when sources of funds become insufficient to meet scheduled payments under the Bank’s commitments. Liquidity risk stems from mismatched cash flows related to assets and liabilities as well as the characteristics of certain products such as credit commitments and non-fixed-term deposits. Regulatory Environment The regulatory environment surrounding liquidity has evolved significantly in recent years. The Bank works closely with national and international regulators to implement regulatory liquidity standards. The guiding principles, standards and guidelines issued in recent years by the BCBS and OSFI are described on page 77 of the 2015 Annual Report. With regard to the BCBS’s intraday liquidity document entitled Monitoring Tools for Intraday Liquidity Management, which presents metrics and stress tests designed to improve monitoring and management of intraday liquidity risk, the proposed implementation schedule ranges from January 2015 to January 2017, at the latest. As for the Liquidity Adequacy Requirements (LAR) guideline issued by OSFI, the Bank has been in compliance with the Liquidity Coverage Ratio (LCR) and Net Cumulative Cash Flow (NCCF) metrics since their coming into force on January 1, 2015. The LAR guideline will be reviewed annually to reflect both national and international regulatory developments. Lastly, the Bank is currently assessing the impact of the probable adoption of the bail-in regime applicable to D-SIBs. In October 2014, the Bank for International Settlements (BIS) issued final rules for the Net Stable Funding Ratio (NSFR), which is a structural ratio over a one-year horizon. The Bank is currently monitoring this ratio and expects to be compliant in time for the implementation. In June 2015, the BCBS issued the final document on Net Stable Funding Ratio Disclosure Standards. This document sets out a common framework for the public disclosure of the NSFR, which would not be required before its formal implementation date of January 1, 2018. Liquid Assets To protect depositors and creditors from unexpected crisis situations, the Bank holds a portfolio of unencumbered liquid assets that can be readily liquidated to meet financial obligations. This portfolio consists of highly liquid securities, most of which are issued or guaranteed by governments, and of cash loans maturing in less than 30 days. The majority of unencumbered liquid assets are held in Canadian or U.S. dollars. Moreover, all assets that can be quickly monetized are considered liquid assets. The Bank’s liquidity reserves do not factor in the availability of the central bank’s emergency liquidity facilities. The following tables provide information on the Bank’s encumbered and unencumbered assets.

MANAGEMENT’S DISCUSSION AND ANALYSIS RISK MANAGEMENT
National Bank of Canada 31 Report to Shareholders, Second Quarter 2016
Liquid Asset Portfolio
(millions of Canadian dollars) As at April 30,
2016 As at October 31,
2015
Bank-owned
liquid assets(1) Liquid assets
received(2) Total
liquid assets Encumbered
liquid assets(3) Unencumbered
liquid assets Unencumbered
liquid assets Cash and deposits with financial institutions 7,452 − 7,452 1,008 6,444 6,251 Securities Issued or guaranteed by Canada, U.S. Treasury, other U.S. agencies and other foreign governments 19,589 15,621 35,210 23,553 11,657 12,061 Issued or guaranteed by provinces 14,631 10,871 25,502 19,045 6,457 6,154 Issued or guaranteed by municipalities and school boards 801 234 1,035 450 585 1,020 Other debt securities 3,379 1,140 4,519 1,743 2,776 3,154 Equity securities 19,051 34,118 53,169 41,970 11,199 14,507 Loans Securities backed by insured residential mortgages 6,398 − 6,398 2,959 3,439 2,761 As at April 30, 2016 71,301 61,984 133,285 90,728 42,557 As at October 31, 2015 66,908 68,915 135,823 89,915 45,908
(millions of Canadian dollars) As at April 30, 2016 As at October 31, 2015
Unencumbered liquid assets by entity National Bank (parent) 20,796 28,739 Domestic subsidiaries 13,025 7,147 Foreign subsidiaries and branches 8,736 10,022 42,557 45,908
(millions of Canadian dollars) As at April 30, 2016 As at October 31, 2015
Unencumbered liquid assets by currency Canadian dollar 26,050 24,238 U.S. dollar 11,475 20,752 Other currencies 5,032 918 42,557 45,908
Liquid Asset Portfolio – Average(4)
(millions of Canadian dollars) Quarter ended April 30, 2016
Bank-owned
liquid assets(1) Liquid assets
received(2) Total
liquid assets Encumbered
liquid assets(3) Unencumbered
liquid assets Cash and deposits with financial institutions 7,469 − 7,469 1,347 6,122 Securities Issued or guaranteed by Canada, U.S. Treasury, other U.S. agencies and other foreign governments 19,687 15,381 35,068 23,438 11,630 Issued or guaranteed by provinces 14,668 10,764 25,432 18,871 6,561 Issued or guaranteed by municipalities and school boards 964 173 1,137 410 727 Other debt securities 3,436 1,131 4,567 1,763 2,804 Equity securities 18,252 37,177 55,429 44,461 10,968 Loans Securities backed by insured residential mortgages 5,549 − 5,549 2,639 2,910 70,025 64,626 134,651 92,929 41,722
(1) Bank-owned liquid assets include assets for which there are no legal or geographic restrictions. (2) Securities received as collateral with respect to securities financing transactions and derivative transactions and securities purchased under reverse repurchase agreements and securities
borrowed. (3) In the normal course of its funding activities, the Bank pledges assets as collateral in accordance with standard terms. Encumbered liquid assets include assets used to cover short sales,
obligations related to securities sold under repurchase agreements and securities loaned, guarantees related to security-backed loans and borrowings, collateral related to derivative financial instrument transactions, asset-backed securities and liquid assets legally restricted from transfers.
(4) The average is based on the sum of the end-of-period balances of the three months of the quarter divided by three.

MANAGEMENT’S DISCUSSION AND ANALYSIS RISK MANAGEMENT
National Bank of Canada 32 Report to Shareholders, Second Quarter 2016
Summary of Encumbered and Unencumbered Assets (millions of Canadian dollars) As at April 30, 2016
Encumbered
assets(1) Unencumbered
assets Total
Encumbered assets as a % of total assets
Pledged as
collateral Other(2) Available as
collateral Other(3)
Cash and deposits with financial institutions 66 942 6,444 − 7,452 0.5 Securities 24,777 − 32,674 637 58,088 11.2 Securities purchased under reverse repurchase agreements and securities borrowed − 13,760 − − 13,760 6.2 Loans, net of allowances 31,418 − 3,439 77,293 112,150 14.2 Customers’ liability under acceptances − − − 8,966 8,966 − Derivative financial instruments − − − 12,181 12,181 − Due from clients, dealers and brokers − − − 482 482 − Purchased receivables − − − 1,334 1,334 − Investments in associates and joint ventures − − − 707 707 − Premises and equipment − − − 1,540 1,540 − Goodwill − − − 1,276 1,276 − Intangible assets − − − 1,113 1,113 − Other assets − − − 1,685 1,685 −
56,261 14,702 42,557 107,214 220,734 32.1
(millions of Canadian dollars) As at October 31, 2015
Encumbered
assets(1) Unencumbered
assets Total
Encumbered assets as a % of total assets
Pledged as
collateral Other(2) Available as
collateral Other(3)
Cash and deposits with financial institutions 42 1,274 6,251 − 7,567 0.6 Securities 18,858 − 36,527 655 56,040 8.7 Securities purchased under reverse repurchase agreements and securities borrowed − 17,333 369 − 17,702 8.0 Loans, net of allowances 31,594 − 2,761 71,498 105,853 14.6 Customers’ liability under acceptances, net of allowances − − − 9,385 9,385 − Derivative financial instruments − − − 10,842 10,842 − Due from clients, dealers and brokers − − − 415 415 − Purchased receivables − − − 1,438 1,438 − Investments in associates and joint ventures − − − 831 831 − Premises and equipment − − − 1,817 1,817 − Goodwill − − − 1,277 1,277 − Intangible assets − − − 1,059 1,059 − Other assets − − − 1,864 1,864 −
50,494 18,607 45,908 101,081 216,090 31.9 (1) In the normal course of its funding activities, the Bank pledges assets as collateral in accordance with standard terms. Encumbered assets include assets used to cover short sales, obligations
related to securities sold under repurchase agreements and securities loaned, guarantees related to security-backed loans and borrowings, collateral related to derivative financial instrument transactions, asset-backed securities, residential mortgage loans securitized and transferred under the Canada Mortgage Bond program, assets held in consolidated trusts supporting the Bank’s funding activities and mortgage loans transferred under covered bond programs.
(2) Other encumbered assets include assets for which there are restrictions and therefore cannot be used for collateral or funding purposes as well as assets used to cover short sales. (3) Other unencumbered assets are assets that cannot be used for collateral or funding purposes in their current form. This category includes assets that are potentially eligible as funding
program collateral (for example, mortgages insured by the CMHC that can be securitized into mortgage-backed securities under the National Housing Act (Canada)).

MANAGEMENT’S DISCUSSION AND ANALYSIS RISK MANAGEMENT
National Bank of Canada 33 Report to Shareholders, Second Quarter 2016
Liquidity Coverage Ratio (LCR) The LCR was introduced to ensure banks maintain sufficient liquidity to withstand periods of severe short-term stress. OSFI has been requiring Canadian banks to maintain a minimum LCR of 100% since January 1, 2015. An LCR above 100% ensures that banks are holding sufficient high-quality liquid assets (HQLA) to cover net cash outflows given a severe, 30-day liquidity crisis. The assumptions underlying the LCR scenario were established by the BCBS and OSFI. The following table provides average LCR data calculated using the three month-end figures in the quarter. For the quarter ended April 30, 2016, the Bank’s average LCR was 135%, well above the 100% regulatory requirement and demonstrating the Bank’s solid liquidity position. LCR Disclosure Requirements(1)
(millions of Canadian dollars) For the quarter ended
April 30, 2016 January 31, 2016
Total unweighted value(2) (average)
Total weighted value(3) (average)
Total weighted value(3) (average)
High-quality liquid assets (HQLA) 1 Total HQLA n.a. 31,546 32,718
Cash outflows 2 Retail deposits and deposits from small business customers, of which: 34,251 2,234 2,229 3 Stable deposits 17,013 510 503 4 Less stable deposits 17,238 1,724 1,726 5 Unsecured wholesale funding, of which: 39,669 21,548 21,712 6 Operational deposits (all counterparties) 10,134 2,430 2,312 7 Non-operational deposits (all counterparties) 22,220 11,803 10,815 8 Unsecured debt 7,315 7,315 8,585 9 Secured wholesale funding n.a. 4,796 3,589 10 Additional requirements, of which: 36,335 9,493 9,285 11 Outflows related to derivative exposures and other collateral requirements 9,559 5,297 5,256 12 Outflows related to loss of funding on secured debt securities 758 758 810 13 Backstop liquidity and credit enhancement facilities and commitments to extend credit 26,018 3,438 3,219 14 Other contractual commitments to extend credit 665 170 139 15 Other contingent commitments to extend credit 73,049 795 796 16 Total cash outflows n.a. 39,036 37,750
Cash inflows 17 Secured lending (e.g., reverse repos) 46,575 8,266 6,881 18 Inflows from fully performing exposures 7,454 4,236 3,908 19 Other cash inflows 3,197 3,197 2,718 20 Total cash inflows 57,226 15,699 13,507
Total adjusted
value(4) Total adjusted
value(4)
21 Total HQLA n.a. 31,546 32,718 22 Total net cash outflows n.a. 23,337 24,243 23 Liquidity coverage ratio (%)(5) n.a. 135 % 135 %
n.a. Not applicable (1) OSFI prescribed a table format in order to standardize disclosure throughout the banking industry. (2) Unweighted values are calculated as outstanding balances maturing or callable within 30 days (for inflows and outflows). (3) Weighted values are calculated after the application of respective haircuts (for HQLA) or inflow and outflow rates. (4) Total adjusted values are calculated after the application of both haircuts and inflow and outflow rates and any applicable caps. (5) The data in this table represents the average of the three month-end figures in the quarter. Consequently, the LCR ratio (line 23) is an average ratio for the three months of the quarter and
might not equal the LCR ratio calculated using lines 21 and 22.
Level 1 liquid assets represent 87% of the Bank’s HQLA, which includes cash, central bank deposits, and bonds issued or guaranteed by the Canadian and provincial governments. Cash outflows arise from the application of OSFI-prescribed assumptions on deposits, debt, secured funding, commitments and additional collateral requirements. The cash outflows are partly offset by cash inflows, which come mainly from secured loans and performing loans. The Bank expects some quarter-over-quarter variation between reported LCRs without such variations necessarily being indicative of a trend. The variation between the quarter ended April 30, 2016 and the previous quarter was a result of normal business activities. The Bank’s liquid asset buffer is well in excess of its total net cash outflows.

MANAGEMENT’S DISCUSSION AND ANALYSIS RISK MANAGEMENT
National Bank of Canada 34 Report to Shareholders, Second Quarter 2016
The LCR assumptions differ from the assumptions used for the liquidity disclosures provided in the previously presented tables or those used for internal liquidity management rules. While the liquidity disclosure framework was prescribed by the EDTF, the Bank’s internal liquidity metrics use assumptions that are calibrated according to its business model and experience. Funding Risk Funding risk is defined as the risk to the Bank’s ongoing ability to raise sufficient funds to finance actual or proposed business activities on an unsecured or secured basis at an acceptable price. The Bank maintains a good balance of its funding through appropriate diversification of its unsecured funding vehicles, securitization programs and secured funding. The Bank also diversifies its funding by currency, geography and maturity. The funding management priority is to achieve the optimal balance between the deposit liabilities of the Bank’s retail network, secured funding and unsecured funding. This brings optimal stability to the funding and reduces vulnerability to unpredictable events. Funding and liquidity levels remained sound and robust over the period, and the Bank does not foresee any event, commitment or demand that might have a significant impact on its liquidity risk position. The Bank’s balance sheet is well diversified and is aligned with the funding strategy. The core banking activities are funded entirely through personal and commercial deposits and through securitization programs. In addition to core deposits, the Bank also receives non-marketable deposits from governments and corporations. Wholesale funding is invested in cash and securities. The table below presents the residual contractual maturities of the Bank’s wholesale funding. The information has been presented in accordance with the categories recommended by the EDTF for comparison purposes with other banks. Residual Contractual Maturities of Wholesale Funding(1) (millions of Canadian dollars) As at April 30, 2016
1 month or less
Over 1 month to 3 months
Over 3 months to 6 months
Over 6 months to
12 months
Subtotal 1 year or less
Over 1 year to 2 years
Over 2 years Total
Deposits from banks(2) 1,898 20 74 4 1,996 − 59 2,055
Certificates of deposit and commercial paper(3) 668 3,546 1,480 476 6,170 376 94 6,640
Asset-backed commercial paper − − − − − − − −
Senior unsecured medium-term notes(4) − 1,651 422 3,192 5,265 4,419 5,747 15,431
Senior unsecured structured notes 29 34 56 104 223 − 1,799 2,022
Covered bonds and asset-backed securities
Mortgage securitization − 1,149 80 1,374 2,603 3,243 13,927 19,773
Covered bonds − − 2,519 − 2,519 942 4,298 7,759
Securitization of credit card receivables − − − 424 424 − 872 1,296
Subordinated liabilities(5) − − − 1,006 1,006 − 9 1,015
Other(6) 2,686 234 1 6 2,927 − − 2,927
5,281 6,634 4,632 6,586 23,133 8,980 26,805 58,918
Secured funding − 1,149 2,599 1,798 5,546 4,185 19,097 28,828
Unsecured funding 5,281 5,485 2,033 4,788 17,587 4,795 7,708 30,090
5,281 6,634 4,632 6,586 23,133 8,980 26,805 58,918
As at October 31, 2015 5,196 4,901 6,623 7,312 24,032 9,187 27,801 61,020
(1) Bankers’ acceptances are not included in this table. (2) Deposits from banks include all non-negotiable term deposits from banks. (3) Includes bearer deposit notes. (4) Certificates of deposit denominated in euros are included in senior unsecured medium-term notes. (5) Subordinated debt is presented in this table but the Bank does not consider it as part of its wholesale funding. (6) The Other item includes non-negotiable term deposits from non-bank financial institutions such as broker-dealers, pension funds and trust companies.
As part of a comprehensive liquidity management framework, the Bank regularly reviews its contracts that stipulate that additional collateral could be required in the event of a downgrade of the Bank’s credit rating. The Bank’s liquidity position management already incorporates additional collateral requirements in the event of a one-notch to three-notch downgrade. The table below presents the additional collateral requirements in the event of a one-, two- or three-notch credit rating downgrade. (millions of Canadian dollars) As at April 30, 2016
One-notch
downgrade Two-notch
downgrade Three-notch downgrade
Derivatives(1) 19 40 91 Other(2) − 199 199
(1) Contractual requirements related to agreements known as Credit Support Annexes. (2) Contractual requirements related to the margin funding facility of the MAV conduits.

MANAGEMENT’S DISCUSSION AND ANALYSIS RISK MANAGEMENT
National Bank of Canada 35 Report to Shareholders, Second Quarter 2016
Residual Contractual Maturities of Balance Sheet Items and Off-Balance-Sheet Commitments The following tables present balance sheet items and off-balance-sheet commitments by residual contractual maturity as at April 30, 2016 with comparative figures as at October 31, 2015. The information gathered from this maturity analysis is a component of liquidity and funding management. However, this maturity profile does not represent how the Bank manages its interest rate risk nor its liquidity risk and funding needs. The Bank considers factors other than contractual maturity in the assessment of liquid assets or in determining expected future cash flows. In the normal course of business, the Bank enters into various off-balance-sheet commitments. The credit instruments used to meet the financing needs of its clients represent the maximum amount of additional credit the Bank could be obligated to extend if the commitments were fully drawn. The Bank also has future minimum commitments under leases for premises as well as for other contracts, mainly contracts for outsourced information technology services. Most of the lease commitments are related to operating leases. (millions of Canadian dollars) As at April 30, 2016
1 month
or less
Over 1 month to 3 months
Over 3 months to 6 months
Over 6 months to 9 months
Over 9 months to
12 months
Over 1 year to 2 years
Over 2 years to 5 years
Over 5 years
No specified maturity Total
Assets Cash and deposits with financial institutions 5,207 − − − − − − − 2,245 7,452 Securities At fair value through profit or loss 1,291 1,479 1,414 1,020 380 3,433 8,483 6,349 18,422 42,271 Available-for-sale 19 192 37 103 125 513 6,587 5,997 537 14,110 Held-to-maturity − − − − − 25 1,607 75 − 1,707 1,310 1,671 1,451 1,123 505 3,971 16,677 12,421 18,959 58,088 Securities purchased under reverse repurchase agreements and securities borrowed 4,807 3,069 2,055 346 500 1,349 − − 1,634 13,760 Loans and acceptances(1) Residential mortgage 1,071 2,115 2,292 1,835 1,613 6,791 28,743 626 10 45,096 Personal and credit card 843 631 762 651 630 1,828 8,327 1,748 17,515 32,935 Business and government 6,641 2,798 2,713 2,804 2,659 4,365 8,623 2,330 2,023 34,956 Customers’ liability under acceptances 6,147 2,749 70 − − − − − − 8,966 Allowances for credit losses (837) (837) 14,702 8,293 5,837 5,290 4,902 12,984 45,693 4,704 18,711 121,116 Other Derivative financial instruments 1,076 1,062 539 571 368 967 2,676 4,922 − 12,181 Due from clients, dealers and brokers(1) 482 482 Purchased receivables 1,334 1,334 Investments in associates and joint ventures 707 707 Premises and equipment 1,540 1,540 Goodwill 1,276 1,276 Intangible assets 1,113 1,113 Other assets 242 143 130 74 133 128 102 83 650 1,685 1,318 1,205 669 645 501 1,095 2,778 5,005 7,102 20,318 27,344 14,238 10,012 7,404 6,408 19,399 65,148 22,130 48,651 220,734
(1) Amounts collectible on demand are considered to have no specified maturity.
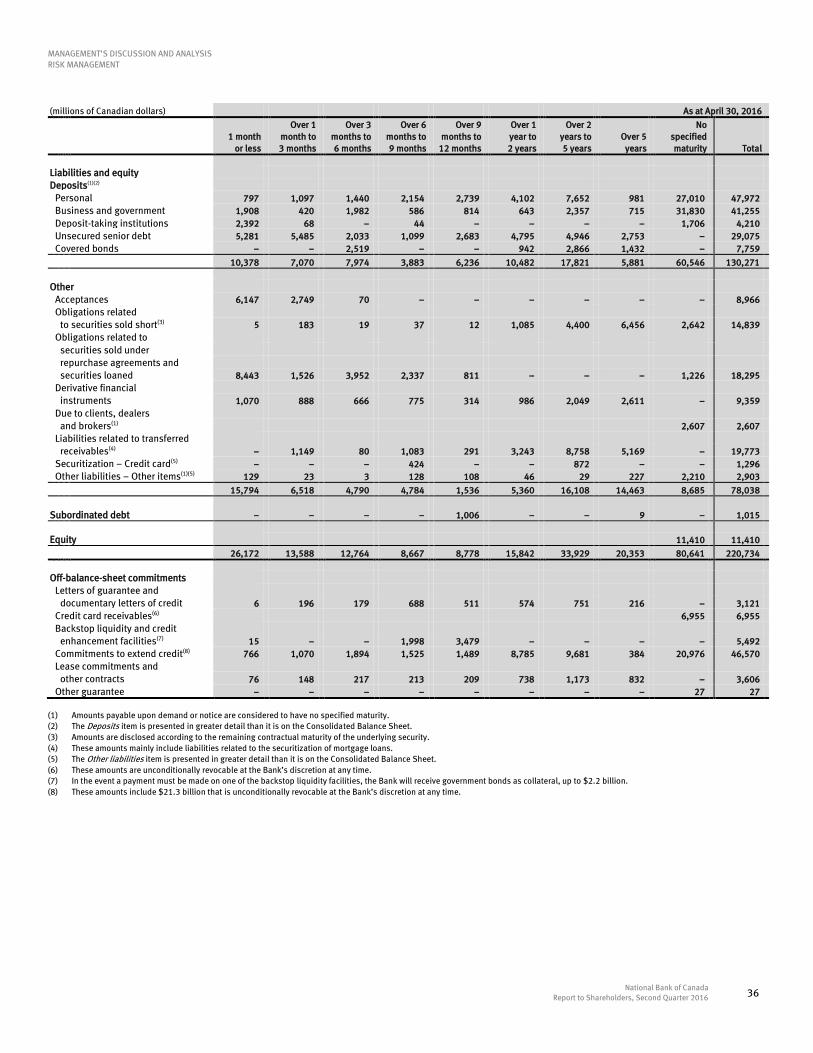
MANAGEMENT’S DISCUSSION AND ANALYSIS RISK MANAGEMENT
National Bank of Canada 36 Report to Shareholders, Second Quarter 2016
(millions of Canadian dollars) As at April 30, 2016
1 month
or less
Over 1 month to 3 months
Over 3 months to 6 months
Over 6 months to 9 months
Over 9 months to
12 months
Over 1 year to 2 years
Over 2 years to 5 years
Over 5 years
No specified maturity Total
Liabilities and equity Deposits(1)(2) Personal 797 1,097 1,440 2,154 2,739 4,102 7,652 981 27,010 47,972 Business and government 1,908 420 1,982 586 814 643 2,357 715 31,830 41,255 Deposit-taking institutions 2,392 68 − 44 − − − − 1,706 4,210 Unsecured senior debt 5,281 5,485 2,033 1,099 2,683 4,795 4,946 2,753 − 29,075 Covered bonds − − 2,519 − − 942 2,866 1,432 − 7,759 10,378 7,070 7,974 3,883 6,236 10,482 17,821 5,881 60,546 130,271 Other Acceptances 6,147 2,749 70 − − − − − − 8,966 Obligations related to securities sold short(3) 5 183 19 37 12 1,085 4,400 6,456 2,642 14,839 Obligations related to securities sold under repurchase agreements and securities loaned 8,443 1,526 3,952 2,337 811 − − − 1,226 18,295 Derivative financial instruments 1,070 888 666 775 314 986 2,049 2,611 − 9,359 Due to clients, dealers and brokers(1) 2,607 2,607 Liabilities related to transferred receivables(4) − 1,149 80 1,083 291 3,243 8,758 5,169 − 19,773 Securitization – Credit card(5) − − − 424 − − 872 − − 1,296 Other liabilities – Other items(1)(5) 129 23 3 128 108 46 29 227 2,210 2,903 15,794 6,518 4,790 4,784 1,536 5,360 16,108 14,463 8,685 78,038
Subordinated debt − − − − 1,006 − − 9 − 1,015 Equity 11,410 11,410 26,172 13,588 12,764 8,667 8,778 15,842 33,929 20,353 80,641 220,734 Off-balance-sheet commitments Letters of guarantee and documentary letters of credit 6 196 179 688 511 574 751 216 − 3,121 Credit card receivables(6) 6,955 6,955 Backstop liquidity and credit enhancement facilities(7) 15 − − 1,998 3,479 − − − − 5,492 Commitments to extend credit(8) 766 1,070 1,894 1,525 1,489 8,785 9,681 384 20,976 46,570 Lease commitments and other contracts 76 148 217 213 209 738 1,173 832 − 3,606 Other guarantee − − − − − − − − 27 27
(1) Amounts payable upon demand or notice are considered to have no specified maturity. (2) The Deposits item is presented in greater detail than it is on the Consolidated Balance Sheet. (3) Amounts are disclosed according to the remaining contractual maturity of the underlying security. (4) These amounts mainly include liabilities related to the securitization of mortgage loans. (5) The Other liabilities item is presented in greater detail than it is on the Consolidated Balance Sheet. (6) These amounts are unconditionally revocable at the Bank’s discretion at any time. (7) In the event a payment must be made on one of the backstop liquidity facilities, the Bank will receive government bonds as collateral, up to $2.2 billion. (8) These amounts include $21.3 billion that is unconditionally revocable at the Bank’s discretion at any time.

MANAGEMENT’S DISCUSSION AND ANALYSIS RISK MANAGEMENT
National Bank of Canada 37 Report to Shareholders, Second Quarter 2016
(millions of Canadian dollars) As at October 31, 2015
1 month
or less
Over 1 month to 3 months
Over 3 months to 6 months
Over 6 months to 9 months
Over 9 months to
12 months
Over 1 year to 2 years
Over 2 years to 5 years
Over 5 years
No specified maturity Total
Assets Cash and deposits with financial institutions 5,317 14 − − − − − − 2,236 7,567 Securities At fair value through profit or loss 587 673 701 1,351 757 5,473 7,992 6,706 17,757 41,997 Available-for-sale 1 356 92 147 37 527 6,846 5,519 518 14,043 588 1,029 793 1,498 794 6,000 14,838 12,225 18,275 56,040 Securities purchased under reverse repurchase agreements and securities borrowed 6,280 4,036 4,345 25 312 1,185 − − 1,519 17,702 Loans and acceptances(1) Residential mortgage 1,125 1,343 2,121 3,072 2,291 6,896 25,523 872 277 43,520 Personal and credit card 336 410 743 907 750 1,795 7,334 1,844 17,814 31,933 Business and government 3,767 1,609 1,719 2,143 1,479 2,558 7,269 2,127 8,283 30,954 Customers’ liability under acceptances 7,896 919 585 − − − − − − 9,400 Allowances for credit losses (569) (569) 13,124 4,281 5,168 6,122 4,520 11,249 40,126 4,843 25,805 115,238 Other Derivative financial instruments 520 682 550 606 208 831 2,627 4,818 − 10,842 Due from clients, dealers and brokers(1) 415 415 Purchased receivables 1,438 1,438 Investments in associates and joint ventures 831 831 Premises and equipment 1,817 1,817 Goodwill 1,277 1,277 Intangible assets 1,059 1,059 Other assets 235 226 216 118 92 110 71 − 796 1,864 755 908 766 724 300 941 2,698 4,818 7,633 19,543 26,064 10,268 11,072 8,369 5,926 19,375 57,662 21,886 55,468 216,090
(1) Amounts collectible on demand are considered to have no specified maturity.
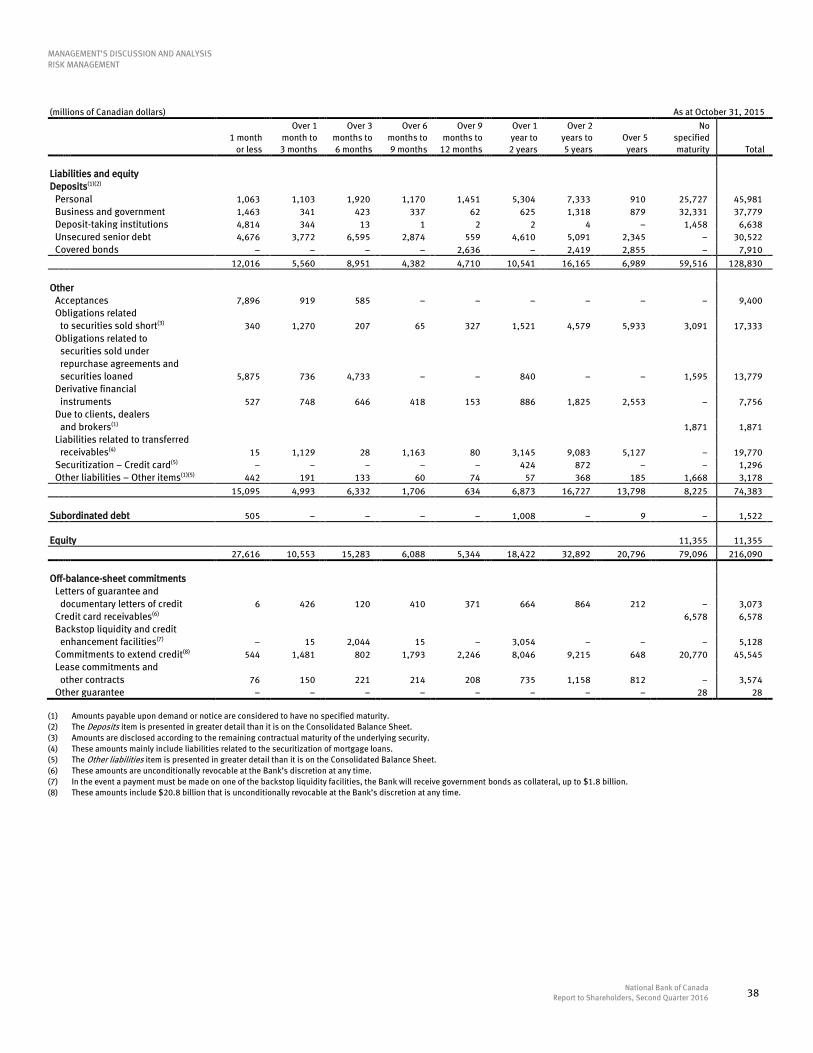
MANAGEMENT’S DISCUSSION AND ANALYSIS RISK MANAGEMENT
National Bank of Canada 38 Report to Shareholders, Second Quarter 2016
(millions of Canadian dollars) As at October 31, 2015
1 month
or less
Over 1 month to 3 months
Over 3 months to 6 months
Over 6 months to 9 months
Over 9 months to
12 months
Over 1 year to 2 years
Over 2 years to 5 years
Over 5 years
No specified maturity Total
Liabilities and equity Deposits(1)(2) Personal 1,063 1,103 1,920 1,170 1,451 5,304 7,333 910 25,727 45,981 Business and government 1,463 341 423 337 62 625 1,318 879 32,331 37,779 Deposit-taking institutions 4,814 344 13 1 2 2 4 − 1,458 6,638 Unsecured senior debt 4,676 3,772 6,595 2,874 559 4,610 5,091 2,345 − 30,522 Covered bonds − − − − 2,636 − 2,419 2,855 − 7,910 12,016 5,560 8,951 4,382 4,710 10,541 16,165 6,989 59,516 128,830 Other Acceptances 7,896 919 585 − − − − − − 9,400 Obligations related to securities sold short(3) 340 1,270 207 65 327 1,521 4,579 5,933 3,091 17,333 Obligations related to securities sold under repurchase agreements and securities loaned 5,875 736 4,733 − − 840 − − 1,595 13,779 Derivative financial instruments 527 748 646 418 153 886 1,825 2,553 − 7,756 Due to clients, dealers and brokers(1) 1,871 1,871 Liabilities related to transferred receivables(4) 15 1,129 28 1,163 80 3,145 9,083 5,127 − 19,770 Securitization – Credit card(5) − − − − − 424 872 − − 1,296 Other liabilities – Other items(1)(5) 442 191 133 60 74 57 368 185 1,668 3,178 15,095 4,993 6,332 1,706 634 6,873 16,727 13,798 8,225 74,383 Subordinated debt 505 − − − − 1,008 − 9 − 1,522 Equity 11,355 11,355 27,616 10,553 15,283 6,088 5,344 18,422 32,892 20,796 79,096 216,090
Off-balance-sheet commitments Letters of guarantee and documentary letters of credit 6 426 120 410 371 664 864 212 − 3,073 Credit card receivables(6) 6,578 6,578 Backstop liquidity and credit enhancement facilities(7) − 15 2,044 15 − 3,054 − − − 5,128 Commitments to extend credit(8) 544 1,481 802 1,793 2,246 8,046 9,215 648 20,770 45,545 Lease commitments and other contracts 76 150 221 214 208 735 1,158 812 − 3,574 Other guarantee − − − − − − − − 28 28
(1) Amounts payable upon demand or notice are considered to have no specified maturity. (2) The Deposits item is presented in greater detail than it is on the Consolidated Balance Sheet. (3) Amounts are disclosed according to the remaining contractual maturity of the underlying security. (4) These amounts mainly include liabilities related to the securitization of mortgage loans. (5) The Other liabilities item is presented in greater detail than it is on the Consolidated Balance Sheet. (6) These amounts are unconditionally revocable at the Bank’s discretion at any time. (7) In the event a payment must be made on one of the backstop liquidity facilities, the Bank will receive government bonds as collateral, up to $1.8 billion. (8) These amounts include $20.8 billion that is unconditionally revocable at the Bank’s discretion at any time.

MANAGEMENT’S DISCUSSION AND ANALYSIS
National Bank of Canada 39 Report to Shareholders, Second Quarter 2016
QUARTERLY FINANCIAL INFORMATION
(millions of Canadian dollars,
except per share amounts) 2016 2015 2014 2015 2014
Q2 Q1 Q4 Q3 Q2 Q1 Q4 Q3 Total Total
Total revenues 1,425 1,289 1,405 1,510 1,421 1,410 1,364 1,460 5,746 5,464
Net income 210 261 347 453 404 415 330 441 1,619 1,538
Earnings per share ($)
Basic 0.52 0.68 0.96 1.29 1.14 1.17 0.92 1.26 4.56 4.36
Diluted 0.52 0.67 0.95 1.28 1.13 1.16 0.91 1.24 4.51 4.32
Dividends per common share ($) 0.54 0.54 0.52 0.52 0.50 0.50 0.48 0.48 2.04 1.88
Return on common
shareholders’ equity (%) 7.7 9.5 13.6 18.8 17.6 17.8 14.3 20.1 16.9 17.9
Total assets 220,734 219,301 216,090 215,560 207,123 214,474 205,429 198,822
Impaired loans, net 300 234 254 254 249 194 248 184
Per common share ($)
Book value 27.75 27.77 28.26 27.60 27.01 26.33 25.76 25.18
Share price
High 45.56 44.11 46.33 50.01 49.15 55.06 53.88 49.15
Low 35.95 35.83 40.75 43.78 45.02 44.21 48.16 45.19

MANAGEMENT’S DISCUSSION AND ANALYSIS
National Bank of Canada 40 Report to Shareholders, Second Quarter 2016
INTERIM CONDENSED CONSOLIDATED
FINANCIAL STATEMENTS
(unaudited)
Consolidated Balance Sheets 41 Consolidated Statements of Income 42
Consolidated Statements of Comprehensive Income 43 Consolidated Statements of Changes in Equity 44
Consolidated Statements of Cash Flows 45 Notes to the Interim Condensed Consolidated Financial Statements 46

INTERIM CONDENSED CONSOLIDATED FINANCIAL STATEMENTS
National Bank of Canada 41 Report to Shareholders, Second Quarter 2016
CONSOLIDATED BALANCE SHEETS (unaudited) (millions of Canadian dollars) As at April 30, 2016 As at October 31, 2015
Assets Cash and deposits with financial institutions 7,452 7,567 Securities (Notes 4 and 5) At fair value through profit or loss 42,271 41,997 Available-for-sale 14,110 14,043 Held-to-maturity 1,707 − 58,088 56,040 Securities purchased under reverse repurchase agreements and securities borrowed 13,760 17,702 Loans (Note 6) Residential mortgage 45,096 43,520 Personal and credit card 32,935 31,933 Business and government 34,956 30,954 112,987 106,407 Customers’ liability under acceptances 8,966 9,400 Allowances for credit losses (837) (569) 121,116 115,238 Other Derivative financial instruments 12,181 10,842 Due from clients, dealers and brokers 482 415 Purchased receivables 1,334 1,438 Investments in associates and joint ventures (Note 8) 707 831 Premises and equipment 1,540 1,817 Goodwill 1,276 1,277 Intangible assets 1,113 1,059 Other assets (Note 9) 1,685 1,864 20,318 19,543 220,734 216,090
Liabilities and equity Deposits (Notes 4 and 10) Personal 47,972 45,981 Business and government 76,029 74,441 Deposit-taking institutions 6,270 8,408 130,271 128,830 Other Acceptances 8,966 9,400 Obligations related to securities sold short 14,839 17,333 Obligations related to securities sold under repurchase agreements and securities loaned 18,295 13,779 Derivative financial instruments 9,359 7,756 Due to clients, dealers and brokers 2,607 1,871 Liabilities related to transferred receivables (Notes 4 and 7) 19,773 19,770 Other liabilities (Note 11) 4,199 4,474 78,038 74,383 Subordinated debt (Note 13) 1,015 1,522 Equity Equity attributable to the Bank’s shareholders (Notes 15 and 19) Preferred shares 1,250 1,023 Common shares 2,620 2,614 Contributed surplus 69 67 Retained earnings 6,530 6,705 Accumulated other comprehensive income 145 145 10,614 10,554
Non-controlling interests (Note 16) 796 801 11,410 11,355 220,734 216,090 The accompanying notes are an integral part of these unaudited interim condensed consolidated financial statements.
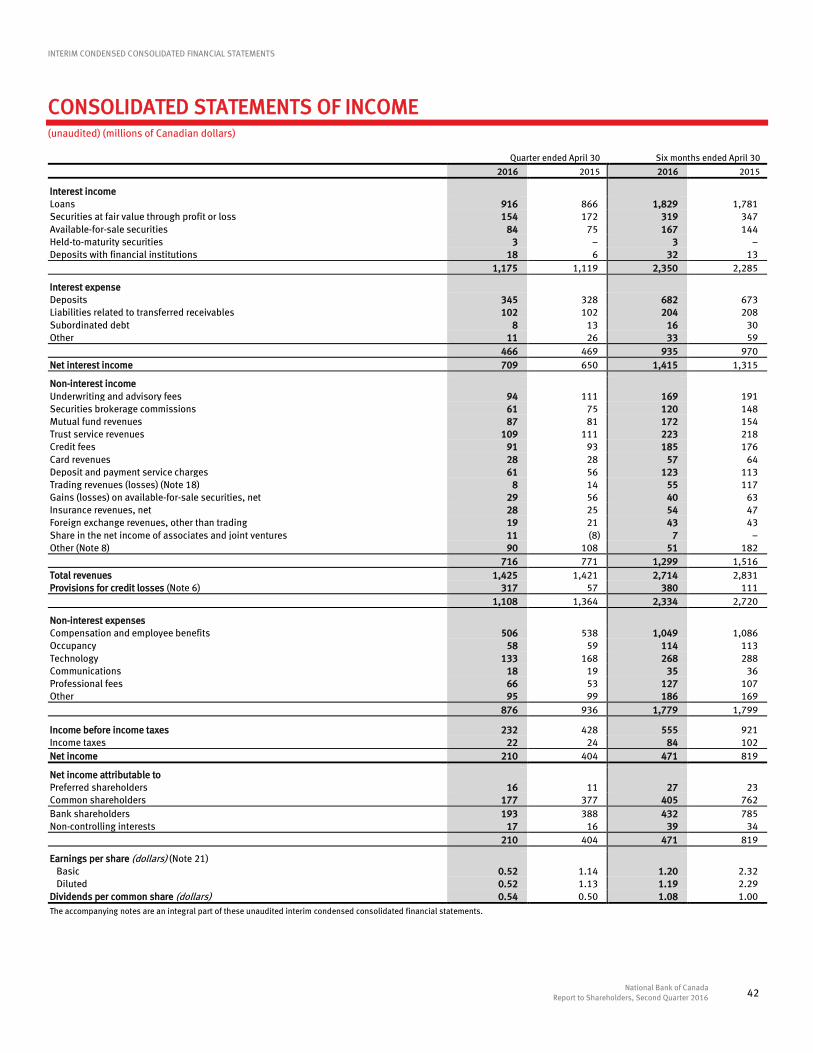
INTERIM CONDENSED CONSOLIDATED FINANCIAL STATEMENTS
National Bank of Canada 42 Report to Shareholders, Second Quarter 2016
CONSOLIDATED STATEMENTS OF INCOME (unaudited) (millions of Canadian dollars) Quarter ended April 30 Six months ended April 30
2016 2015 2016 2015
Interest income Loans 916 866 1,829 1,781 Securities at fair value through profit or loss 154 172 319 347 Available-for-sale securities 84 75 167 144 Held-to-maturity securities 3 − 3 − Deposits with financial institutions 18 6 32 13 1,175 1,119 2,350 2,285
Interest expense Deposits 345 328 682 673 Liabilities related to transferred receivables 102 102 204 208 Subordinated debt 8 13 16 30 Other 11 26 33 59 466 469 935 970 Net interest income 709 650 1,415 1,315 Non-interest income Underwriting and advisory fees 94 111 169 191 Securities brokerage commissions 61 75 120 148 Mutual fund revenues 87 81 172 154 Trust service revenues 109 111 223 218 Credit fees 91 93 185 176 Card revenues 28 28 57 64 Deposit and payment service charges 61 56 123 113 Trading revenues (losses) (Note 18) 8 14 55 117 Gains (losses) on available-for-sale securities, net 29 56 40 63 Insurance revenues, net 28 25 54 47 Foreign exchange revenues, other than trading 19 21 43 43 Share in the net income of associates and joint ventures 11 (8) 7 − Other (Note 8) 90 108 51 182 716 771 1,299 1,516 Total revenues 1,425 1,421 2,714 2,831 Provisions for credit losses (Note 6) 317 57 380 111 1,108 1,364 2,334 2,720
Non-interest expenses Compensation and employee benefits 506 538 1,049 1,086 Occupancy 58 59 114 113 Technology 133 168 268 288 Communications 18 19 35 36 Professional fees 66 53 127 107 Other 95 99 186 169 876 936 1,779 1,799
Income before income taxes 232 428 555 921 Income taxes 22 24 84 102 Net income 210 404 471 819
Net income attributable to Preferred shareholders 16 11 27 23 Common shareholders 177 377 405 762 Bank shareholders 193 388 432 785 Non-controlling interests 17 16 39 34 210 404 471 819 Earnings per share (dollars) (Note 21) Basic 0.52 1.14 1.20 2.32 Diluted 0.52 1.13 1.19 2.29 Dividends per common share (dollars) 0.54 0.50 1.08 1.00 The accompanying notes are an integral part of these unaudited interim condensed consolidated financial statements.
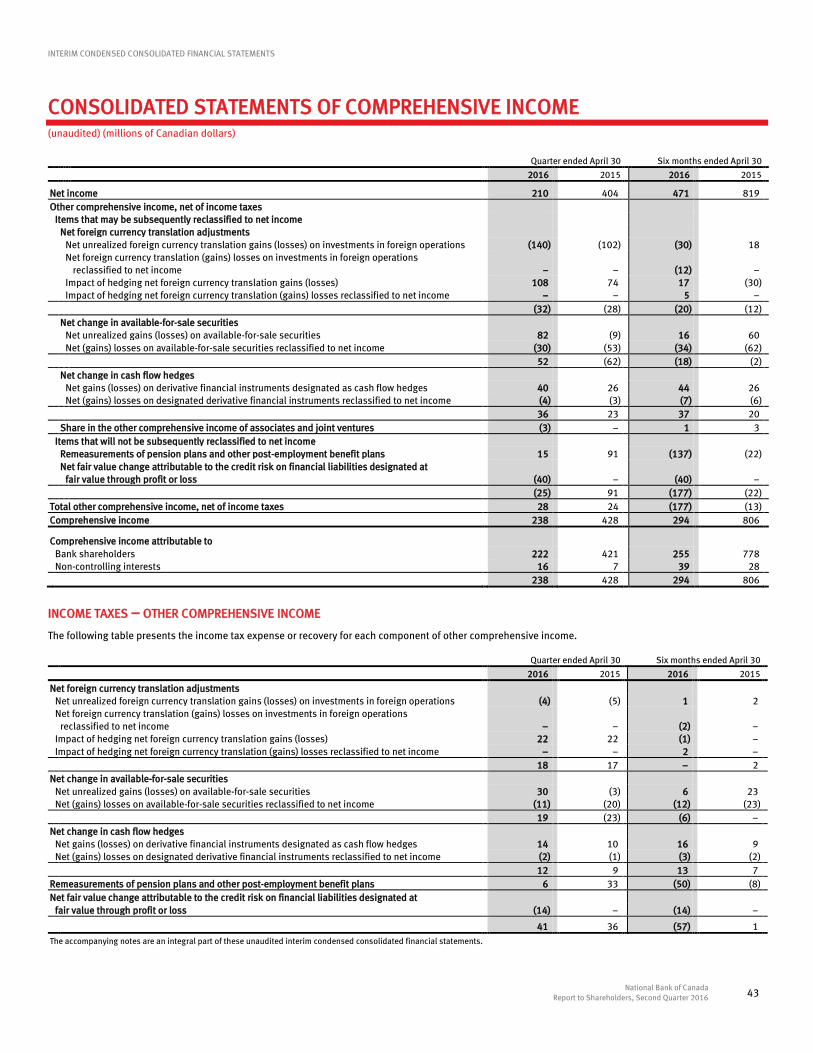
INTERIM CONDENSED CONSOLIDATED FINANCIAL STATEMENTS
National Bank of Canada 43 Report to Shareholders, Second Quarter 2016
CONSOLIDATED STATEMENTS OF COMPREHENSIVE INCOME (unaudited) (millions of Canadian dollars) Quarter ended April 30 Six months ended April 30
2016 2015 2016 2015
Net income 210 404 471 819 Other comprehensive income, net of income taxes Items that may be subsequently reclassified to net income Net foreign currency translation adjustments Net unrealized foreign currency translation gains (losses) on investments in foreign operations (140) (102) (30) 18 Net foreign currency translation (gains) losses on investments in foreign operations reclassified to net income − − (12) − Impact of hedging net foreign currency translation gains (losses) 108 74 17 (30) Impact of hedging net foreign currency translation (gains) losses reclassified to net income − − 5 − (32) (28) (20) (12) Net change in available-for-sale securities Net unrealized gains (losses) on available-for-sale securities 82 (9) 16 60 Net (gains) losses on available-for-sale securities reclassified to net income (30) (53) (34) (62) 52 (62) (18) (2) Net change in cash flow hedges Net gains (losses) on derivative financial instruments designated as cash flow hedges 40 26 44 26 Net (gains) losses on designated derivative financial instruments reclassified to net income (4) (3) (7) (6) 36 23 37 20 Share in the other comprehensive income of associates and joint ventures (3) − 1 3 Items that will not be subsequently reclassified to net income Remeasurements of pension plans and other post-employment benefit plans 15 91 (137) (22) Net fair value change attributable to the credit risk on financial liabilities designated at fair value through profit or loss (40) − (40) − (25) 91 (177) (22) Total other comprehensive income, net of income taxes 28 24 (177) (13) Comprehensive income 238 428 294 806
Comprehensive income attributable to Bank shareholders 222 421 255 778 Non-controlling interests 16 7 39 28 238 428 294 806
INCOME TAXES – OTHER COMPREHENSIVE INCOME
The following table presents the income tax expense or recovery for each component of other comprehensive income. Quarter ended April 30 Six months ended April 30
2016 2015 2016 2015
Net foreign currency translation adjustments Net unrealized foreign currency translation gains (losses) on investments in foreign operations (4) (5) 1 2 Net foreign currency translation (gains) losses on investments in foreign operations reclassified to net income − − (2) − Impact of hedging net foreign currency translation gains (losses) 22 22 (1) − Impact of hedging net foreign currency translation (gains) losses reclassified to net income − − 2 − 18 17 − 2 Net change in available-for-sale securities Net unrealized gains (losses) on available-for-sale securities 30 (3) 6 23 Net (gains) losses on available-for-sale securities reclassified to net income (11) (20) (12) (23) 19 (23) (6) − Net change in cash flow hedges Net gains (losses) on derivative financial instruments designated as cash flow hedges 14 10 16 9 Net (gains) losses on designated derivative financial instruments reclassified to net income (2) (1) (3) (2) 12 9 13 7 Remeasurements of pension plans and other post-employment benefit plans 6 33 (50) (8) Net fair value change attributable to the credit risk on financial liabilities designated at fair value through profit or loss (14) − (14) −
41 36 (57) 1 The accompanying notes are an integral part of these unaudited interim condensed consolidated financial statements.

INTERIM CONDENSED CONSOLIDATED FINANCIAL STATEMENTS
National Bank of Canada 44 Report to Shareholders, Second Quarter 2016
CONSOLIDATED STATEMENTS OF CHANGES IN EQUITY (unaudited) (millions of Canadian dollars) Six months ended April 30 2016 2015
Preferred shares at beginning (Note 15) 1,023 1,223 Issuance of Series 34 preferred shares 400 − Redemption of Series 16 and 20 preferred shares for cancellation (173) (200) Preferred shares at end 1,250 1,023 Common shares at beginning 2,614 2,293 Issuances of common shares Stock Option Plan 21 26 Impact of shares purchased or sold for trading (15) 4 Common shares at end 2,620 2,323 Contributed surplus at beginning 67 52 Stock option expense (Note 19) 6 10 Stock options exercised (3) (3) Other (1) − Contributed surplus at end 69 59 Retained earnings at beginning 6,705 5,850 Net income attributable to the Bank's shareholders 432 785 Dividends (Note 15) Preferred shares (24) (23) Common shares (364) (329) Premium paid on preferred shares redeemed for cancellation (3) − Share issuance expenses (6) − Remeasurements of pension plans and other post-employment benefit plans (137) (22) Net fair value change attributable to the credit risk on financial liabilities designated at fair value through profit or loss (40) − Impact of a financial liability resulting from a put option written to a non-controlling interest (33) (30) Retained earnings at end 6,530 6,231 Accumulated other comprehensive income at beginning 145 289 Net foreign currency translation adjustments (20) (12) Net change in unrealized gains (losses) on available-for-sale securities (18) (2) Net change in gains (losses) on cash flow hedges 37 26 Share in the other comprehensive income of associates and joint ventures 1 3 Accumulated other comprehensive income at end 145 304 Equity attributable to the Bank’s shareholders 10,614 9,940 Non-controlling interests at beginning 801 795 Net income attributable to non-controlling interests 39 34 Other comprehensive income attributable to non-controlling interests − (6) Distributions to non-controlling interests (44) (38) Non-controlling interests at end 796 785 Equity 11,410 10,725
ACCUMULATED OTHER COMPREHENSIVE INCOME
As at April 30,
2016 As at April 30,
2015
Accumulated other comprehensive income Net foreign currency translation adjustments (16) (15) Net unrealized gains (losses) on available-for-sale securities (6) 166 Net gains (losses) on instruments designated as cash flow hedges 161 149 Share in the other comprehensive income of associates and joint ventures 6 4 145 304
The accompanying notes are an integral part of these unaudited interim condensed consolidated financial statements.

INTERIM CONDENSED CONSOLIDATED FINANCIAL STATEMENTS
National Bank of Canada 45 Report to Shareholders, Second Quarter 2016
CONSOLIDATED STATEMENTS OF CASH FLOWS (unaudited) (millions of Canadian dollars) Six months ended April 30
2016 2015
Cash flows from operating activities Net income 471 819 Adjustments for Provisions for credit losses 380 111 Amortization of premises and equipment and intangible assets 212 105 Write-off of an equity interest in an associate (Note 8) 164 − Gain on the disposal of shares of Fiera Capital Corporation − (34) Impairment losses on intangible assets − 46 Deferred taxes (55) (8) Translation adjustment on foreign currency denominated subordinated debt − 1 Losses (gains) on sales of available-for-sale securities, net (44) (72) Impairment losses on available-for-sale securities 4 9 Share in the net income of associates and joint ventures (7) − Stock option expense 6 10 Change in operating assets and liabilities Securities at fair value through profit or loss (274) (618) Securities purchased under reverse repurchase agreements and securities borrowed 3,942 6,340 Loans, net of securitization (6,689) (776) Deposits 1,441 2,163 Obligations related to securities sold short (2,494) (536) Obligations related to securities sold under repurchase agreements and securities loaned 4,516 (3,837) Derivative financial instruments, net 264 (1,107) Due from and to clients, dealers and brokers, net 669 166 Purchased receivables 104 (444) Interest and dividends receivable and interest payable (47) (88) Current tax assets and liabilities 75 (83) Other items (283) 391 2,355 2,558 Cash flows from financing activities Issuance of preferred shares 400 − Redemption of preferred shares for cancellation (176) (200) Issuance of common shares 3 28 Redemption of subordinated debt (500) (350) Share issuance expenses (6) − Dividends paid (384) (188) Distributions to non-controlling interests (44) (38) (707) (748) Cash flows from investing activities Disposal of shares of Fiera Capital Corporation − 114 Purchases of available-for-sale securities (3,259) (4,209) Maturities of available-for-sale securities 412 263 Sales of available-for-sale securities 2,773 2,255 Purchases of held-to-maturity securities (1,709) − Net change in tangible assets leased under operating leases 163 (630) Net change in premises and equipment (70) (36) Net change in intangible assets (124) (122) (1,814) (2,365) Impact of currency rate movements on cash and cash equivalents 51 (1,061) Increase (decrease) in cash and cash equivalents (115) (1,616) Cash and cash equivalents at beginning 7,567 8,086 Cash and cash equivalents at end(1) 7,452 6,470 Supplementary information about cash flows from operating activities Interest paid 977 1,084 Interest and dividends received 2,357 2,291 Income taxes paid 135 180 The accompanying notes are an integral part of these unaudited interim condensed consolidated financial statements.
(1) This item is the equivalent of Consolidated Balance Sheet item Cash and deposits with financial institutions. It includes an amount of $0.9 billion as at April 30, 2016 ($1.3 billion as at
October 31, 2015) for which there are restrictions. In addition, $3 million was held in escrow as at April 30, 2016 ($3 million as at October 31, 2015).
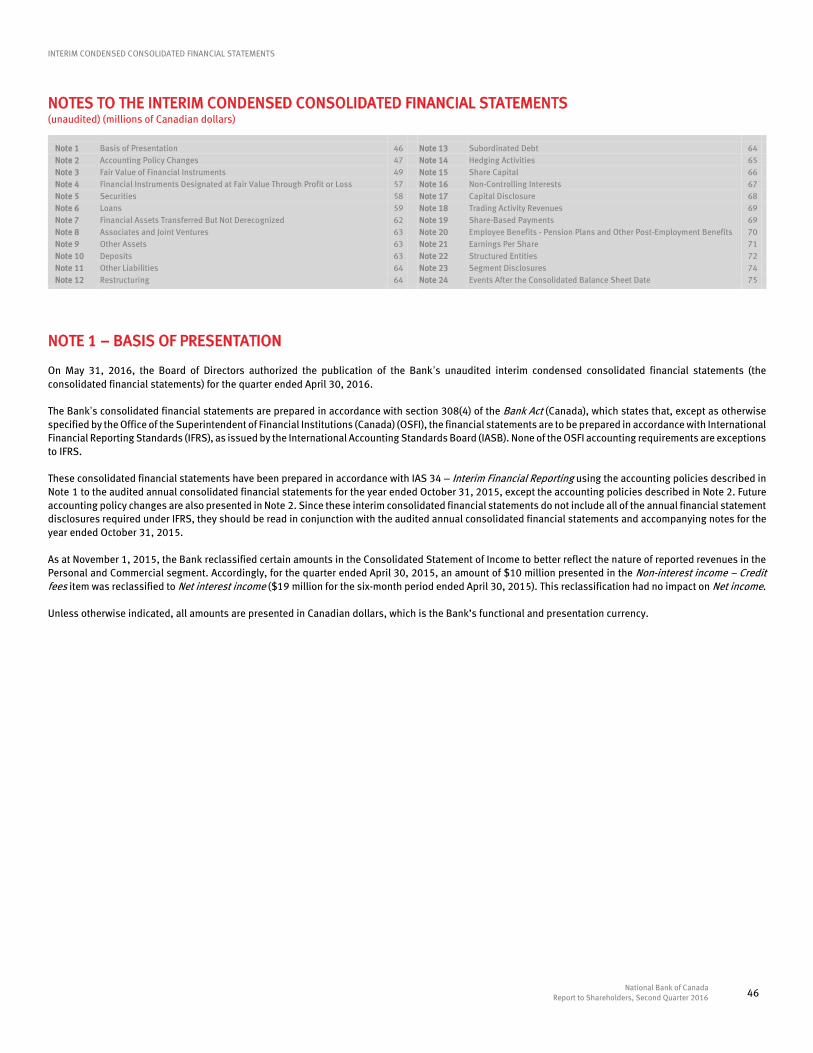
INTERIM CONDENSED CONSOLIDATED FINANCIAL STATEMENTS
National Bank of Canada 46 Report to Shareholders, Second Quarter 2016
NOTES TO THE INTERIM CONDENSED CONSOLIDATED FINANCIAL STATEMENTS (unaudited) (millions of Canadian dollars) Note 1 Basis of Presentation 46 Note 13 Subordinated Debt 64 Note 2 Accounting Policy Changes 47 Note 14 Hedging Activities 65 Note 3 Fair Value of Financial Instruments 49 Note 15 Share Capital 66 Note 4 Financial Instruments Designated at Fair Value Through Profit or Loss 57 Note 16 Non-Controlling Interests 67 Note 5 Securities 58 Note 17 Capital Disclosure 68 Note 6 Loans 59 Note 18 Trading Activity Revenues 69 Note 7 Financial Assets Transferred But Not Derecognized 62 Note 19 Share-Based Payments 69 Note 8 Associates and Joint Ventures 63 Note 20 Employee Benefits - Pension Plans and Other Post-Employment Benefits 70 Note 9 Other Assets 63 Note 21 Earnings Per Share 71 Note 10 Deposits 63 Note 22 Structured Entities 72 Note 11 Other Liabilities 64 Note 23 Segment Disclosures 74 Note 12 Restructuring 64 Note 24 Events After the Consolidated Balance Sheet Date 75
NOTE 1 – BASIS OF PRESENTATION On May 31, 2016, the Board of Directors authorized the publication of the Bank’s unaudited interim condensed consolidated financial statements (the consolidated financial statements) for the quarter ended April 30, 2016. The Bank’s consolidated financial statements are prepared in accordance with section 308(4) of the Bank Act (Canada), which states that, except as otherwise specified by the Office of the Superintendent of Financial Institutions (Canada) (OSFI), the financial statements are to be prepared in accordance with International Financial Reporting Standards (IFRS), as issued by the International Accounting Standards Board (IASB). None of the OSFI accounting requirements are exceptions to IFRS. These consolidated financial statements have been prepared in accordance with IAS 34 – Interim Financial Reporting using the accounting policies described in Note 1 to the audited annual consolidated financial statements for the year ended October 31, 2015, except the accounting policies described in Note 2. Future accounting policy changes are also presented in Note 2. Since these interim consolidated financial statements do not include all of the annual financial statement disclosures required under IFRS, they should be read in conjunction with the audited annual consolidated financial statements and accompanying notes for the year ended October 31, 2015. As at November 1, 2015, the Bank reclassified certain amounts in the Consolidated Statement of Income to better reflect the nature of reported revenues in the Personal and Commercial segment. Accordingly, for the quarter ended April 30, 2015, an amount of $10 million presented in the Non-interest income – Credit fees item was reclassified to Net interest income ($19 million for the six-month period ended April 30, 2015). This reclassification had no impact on Net income. Unless otherwise indicated, all amounts are presented in Canadian dollars, which is the Bank’s functional and presentation currency.

INTERIM CONDENSED CONSOLIDATED FINANCIAL STATEMENTS NOTES TO THE INTERIM CONDENSED CONSOLIDATED FINANCIAL STATEMENTS
(unaudited) (millions of Canadian dollars)
National Bank of Canada 47 Report to Shareholders, Second Quarter 2016
NOTE 2 – ACCOUNTING POLICY CHANGES
Accounting Policy Changes
During the quarter ended April 30, 2016, the Bank adopted the IFRS 9 provisions on own credit risk and updated one of its significant accounting policies, as described below. IFRS 9 – Financial Instruments (own credit risk) On February 1, 2016, the Bank early adopted, on a prospective basis, the own credit risk provisions set out in IFRS 9 – Financial Instruments. According to these provisions, changes in the fair value of financial liabilities designated at fair value through profit or loss that are attributable to changes in an entity’s own credit risk must be recognized in Other comprehensive income unless these changes offset the amounts recognized in Net income. Fair value changes not attributable to an entity’s own risk continue to be recognized in Non-interest income in the Consolidated Statement of Income. The amounts recognized in Other comprehensive income will not be subsequently reclassified to Net income. For the interim and annual periods prior to February 1, 2016, changes in the fair value of financial liabilities designated at fair value through profit or loss had been recognized in Non-interest income in the Consolidated Statement of Income. Held-to-Maturity Securities During the quarter ended April 30, 2016, the Bank classified securities in the held-to-maturity category. Held-to-maturity securities are financial assets with fixed or determinable payments and a fixed maturity that the Bank intends and is able to hold until maturity. The Bank accounts for held-to-maturity securities transactions on the trade date, and the related transaction costs are capitalized. These securities are initially recognized at fair value. In subsequent periods, they are recognized at amortized cost using the effective interest rate method, less any impairment loss measured using the same impairment model used for loans. Interest income and the amortization of premiums and discounts on these securities are recognized in Net interest income in the Consolidated Statement of Income.
Changes in Accounting Estimates
Impairment of Available-for-Sale Securities During the quarter ended January 31, 2016, following an assessment of market conditions, the Bank revisited the definition of the terms “significant” and “prolonged” in order to provide a better estimate of impairment losses, when applicable, on the equity securities classified in available-for-sale securities. As defined in Note 1 to the audited annual consolidated financial statements for the year ended October 31, 2015, the term “significant” represents a decline in fair value of more than 30% over a consecutive period of at least six months, and the term “prolonged” represents a decline in fair value of more than 5% over a consecutive period of at least 12 months. Considering the facts and circumstances, the definitions were changed to the following: a decline in fair value of more than 40% over a consecutive period of at least six months for the term “significant” and a decline in fair value of more than 5% over a consecutive period of at least 18 months for the term “prolonged.” This change in definitions, effective November 1, 2015, is considered a change in accounting estimate and is therefore applied prospectively. This change had the effect of decreasing the impairment losses on the equity securities classified in available-for-sale securities from $9 million to $3 million for the quarter ended January 31, 2016. Sectoral Provision on Non-Impaired Loans During the quarter ended April 30, 2016, following a significant increase in the credit risk of a group of loans of a specific industry, the Bank recorded a sectoral provision on non-impaired loans. When the credit risk of a loan portfolio with similar credit risk characteristics or of a group of loans of a specific industry increases significantly but the loans have yet to be individually identified as impaired, a sectoral provision is established collectively for the entire loan portfolio or loan group. This sectoral provision reflects the impairment losses that the Bank has incurred as a result of events that have occurred but where the individual loss has not been identified.

INTERIM CONDENSED CONSOLIDATED FINANCIAL STATEMENTS NOTES TO THE INTERIM CONDENSED CONSOLIDATED FINANCIAL STATEMENTS
(unaudited) (millions of Canadian dollars)
National Bank of Canada 48 Report to Shareholders, Second Quarter 2016
NOTE 2 – ACCOUNTING POLICY CHANGES (cont.)
Future Accounting Policy Changes
The Bank is currently assessing the impact that the adoption of the following standards will have on its consolidated financial statements. Effective Date – Early Adoption on November 1, 2017 IFRS 9 – Financial Instruments In July 2014, the IASB issued a complete and final version of IFRS 9, which replaces the current standard on financial instruments. IFRS 9 sets out requirements for the classification and measurement of financial assets and financial liabilities, for the impairment of financial assets, and for general hedge accounting. Macro hedge accounting has been decoupled from IFRS 9 and will be considered and issued as a separate standard. IFRS 9 provides a single model for financial asset classification and measurement that is based on contractual cash flow characteristics and on the business model for holding financial assets. IFRS 9 also introduces a new, single impairment model for financial assets not measured at fair value through profit or loss that requires recognition of expected credit losses rather than incurred losses as applied under the current standard. This model requires the recognition of 12-month expected credit losses as of the initial recognition date of a financial asset and recognition of lifetime expected losses if the financial instrument’s credit risk has increased significantly since initial recognition. In December 2015, the Basel Committee on Banking Supervision issued Guidance on Credit Risk and Accounting for Expected Credit Losses. As for the new hedge accounting model, it provides better alignment of hedge accounting with risk management activities. However, the current hedge accounting requirements may continue to be applied until the IASB finalizes its macro hedge accounting project. The IASB is requiring IFRS 9 to be applied as of November 1, 2018 and is permitting early adoption. On January 9, 2015, OSFI issued a final version of Early Adoption of IFRS 9 Financial Instruments for Domestic Systemically Important Banks, stating, however, that it expects Domestic Systemically Important Banks, a group that includes the Bank, to adopt IFRS 9 as of November 1, 2017. In general, IFRS 9 is to be applied retrospectively. The Bank will therefore adopt the IFRS 9 provisions as of November 1, 2017. Its first financial statements presented in accordance with these provisions will be its unaudited interim condensed consolidated financial statements for the quarter ending January 31, 2018 and will include an opening consolidated balance sheet as at November 1, 2017. In preparation for the adoption of IFRS 9, the Bank has established an enterprise-wide project, assembled a dedicated team, and established a formal governance structure. It has started implementing a detailed project plan comprising key activities and a corresponding schedule. The project is proceeding according to schedule. As interpretations of the new standard are still evolving, the Bank continues to monitor the interpretations and revisit its preliminary conclusions. Effective Date – November 1, 2018 IFRS 15 – Revenue from Contracts with Customers In May 2014, the IASB issued a new standard, IFRS 15, which replaces the current revenue recognition standards and interpretations. IFRS 15 provides a single comprehensive model to use when accounting for revenue arising from contracts with customers. The new model applies to all contracts with customers except those that are within the scope of other IFRS standards such as leases, insurance contracts and financial instruments. IFRS 15 is to be applied retrospectively.
At its meeting on July 22, 2015, the IASB unanimously confirmed its proposal to defer the effective date of IFRS 15 to fiscal years beginning on or after January 1, 2018. Early application of IFRS 15 is still permitted. Effective Date – November 1, 2019 IFRS 16 – Leases In January 2016, the IASB issued a new standard, IFRS 16 – Leases. The new standard requires lessees to recognize most leases on the balance sheet using a single model, thereby eliminating the distinction between operating and finance leases. Lessor accounting, however, remains similar to current accounting practice, and the distinction between operating and finance leases is retained. Early application is permitted if IFRS 15 – Revenue from Contracts with Customers has also been applied.

INTERIM CONDENSED CONSOLIDATED FINANCIAL STATEMENTS NOTES TO THE INTERIM CONDENSED CONSOLIDATED FINANCIAL STATEMENTS
(unaudited) (millions of Canadian dollars)
National Bank of Canada 49 Report to Shareholders, Second Quarter 2016
NOTE 3 – FAIR VALUE OF FINANCIAL INSTRUMENTS
Fair Value and Carrying Value of Financial Instruments by Category
Financial assets and financial liabilities are recognized on the Consolidated Balance Sheet at fair value or at amortized cost in accordance with the categories set out in the accounting framework for financial instruments. As at April 30, 2016
Carrying value and fair value Carrying value Fair value
Total carrying
value
Total fair
value
Financial instruments
classified as at fair
value through profit or loss
Financial instruments designated at fair value
through profit or loss
Available- for-sale
Financial instruments at amortized cost
Financial instruments at amortized cost
Financial assets Cash and deposits with financial institutions − − − 7,452 7,452 7,452 7,452 Securities 40,052 2,219 14,110 1,707 1,701 58,088 58,082 Securities purchased under reverse repurchase agreements and securities borrowed − 751 − 13,009 13,009 13,760 13,760 Loans and acceptances 4,987 104 − 116,025 116,769 121,116 121,860 Other Derivative financial instruments 12,181 − − − − 12,181 12,181 Due from clients, dealers and brokers − − − 482 482 482 482 Purchased receivables − − − 1,334 1,334 1,334 1,334 Other assets − − − 452 452 452 452
Financial liabilities Deposits − 3,317 126,954 (1) 127,516 130,271 130,833 Other Acceptances − − 8,966 8,966 8,966 8,966 Obligations related to securities sold short 14,839 − − − 14,839 14,839 Obligations related to securities sold under repurchase agreements and securities loaned − − 18,295 18,295 18,295 18,295 Derivative financial instruments 9,359 − − − 9,359 9,359 Due to clients, dealers and brokers − − 2,607 2,607 2,607 2,607 Liabilities related to transferred receivables − 5,989 13,784 13,807 19,773 19,796 Other liabilities 44 − 2,226 2,237 2,270 2,281 Subordinated debt − − 1,015 1,017 1,015 1,017
(1) Including embedded derivative financial instruments.

INTERIM CONDENSED CONSOLIDATED FINANCIAL STATEMENTS NOTES TO THE INTERIM CONDENSED CONSOLIDATED FINANCIAL STATEMENTS
(unaudited) (millions of Canadian dollars)
National Bank of Canada 50 Report to Shareholders, Second Quarter 2016
NOTE 3 – FAIR VALUE OF FINANCIAL INSTRUMENTS (cont.) As at October 31, 2015
Carrying value and fair value Carrying value Fair value
Total carrying
value
Total fair
value
Financial instruments
classified as at fair
value through profit or loss
Financial instruments designated at fair value
through profit or loss
Available- for-sale
Financial instruments at amortized cost
Financial instruments at amortized cost
Financial assets
Cash and deposits with financial
institutions − − − 7,567 7,567 7,567 7,567
Securities 39,753 2,244 14,043 − − 56,040 56,040
Securities purchased under reverse
repurchase agreements and
securities borrowed − 295 − 17,407 17,407 17,702 17,702
Loans and acceptances 4,413 152 − 110,673 111,407 115,238 115,972
Other
Derivative financial instruments 10,842 − − − − 10,842 10,842
Due from clients, dealers and brokers − − − 415 415 415 415
Purchased receivables − − − 1,438 1,438 1,438 1,438
Other assets − − − 459 459 459 459
Financial liabilities
Deposits − 3,053 125,777 (1) 126,247 128,830 129,300
Other
Acceptances − − 9,400 9,400 9,400 9,400
Obligations related to securities sold short 17,333 − − − 17,333 17,333
Obligations related to securities sold under
repurchase agreements and
securities loaned − − 13,779 13,779 13,779 13,779
Derivative financial instruments 7,756 − − − 7,756 7,756
Due to clients, dealers and brokers − − 1,871 1,871 1,871 1,871
Liabilities related to transferred receivables − 6,402 13,368 13,427 19,770 19,829
Other liabilities 50 − 2,227 2,227 2,277 2,277
Subordinated debt − − 1,522 1,526 1,522 1,526
(1) Including embedded derivative financial instruments.
Establishing Fair Value
The fair value of a financial instrument is the price that would be received to sell a financial asset or paid to transfer a financial liability in an orderly transaction in the principal market at the measurement date under current market conditions (i.e., an exit price). Unadjusted quoted prices in active markets provide the best evidence of fair value. When there is no quoted price in an active market, the Bank applies other valuation techniques that maximize the use of relevant observable inputs and that minimize the use of unobservable inputs. Such valuation techniques include the following: using information available from recent market transactions, referring to the current fair value of a comparable financial instrument, applying discounted cash flow analysis, applying option pricing models, or relying on any other valuation technique that is commonly used by market participants and has proven to yield reliable estimates. Judgment is required when applying many of the valuation techniques. Fair value is established in accordance with a rigorous control framework. The Bank has policies and procedures that govern the process for determining fair value. The Bank’s valuation governance structure has remained largely unchanged from that described in Note 3 to the audited annual consolidated financial statements for the year ended October 31, 2015. The valuation techniques used to determine the fair value of financial assets and liabilities are also described in this note, and no significant changes have been made to the valuation techniques.

INTERIM CONDENSED CONSOLIDATED FINANCIAL STATEMENTS NOTES TO THE INTERIM CONDENSED CONSOLIDATED FINANCIAL STATEMENTS
(unaudited) (millions of Canadian dollars)
National Bank of Canada 51 Report to Shareholders, Second Quarter 2016
Financial Instruments Recorded at Fair Value on the Consolidated Balance Sheet
Hierarchy of Fair Value Measurements
IFRS establishes a fair value hierarchy that classifies the inputs used in financial instrument fair value measurement techniques according to three levels. This fair value hierarchy requires observable market inputs to be used whenever such inputs exist. According to the hierarchy, the highest level of inputs are unadjusted quoted prices in active markets for identical instruments and the lowest level of inputs are unobservable inputs. If inputs from different levels of the hierarchy are used, the financial instrument is classified in the same level as the lowest level input that is significant to the fair value measurement. For additional information, see Note 3 to the audited annual consolidated financial statements for the year ended October 31, 2015. Transfers of financial instruments between Levels 1 and 2 and transfers to (or from) Level 3 are deemed to have taken place at the beginning of the quarter in which the transfer occurred. Significant transfers can occur between the fair value hierarchy levels due to new information on inputs used to determine fair value and the observable nature of those inputs. During the quarter ended April 30, 2016, $48 million in securities classified as at fair value through profit or loss and $66 million in obligations related to securities sold short were transferred from Level 2 to Level 1 resulting from changing market conditions (no significant transfer for the quarter ended April 30, 2015). During the six months ended April 30, 2016, $66 million in securities classified as at fair value through profit or loss and $70 million in obligations related to securities sold short were transferred from Level 2 to Level 1 resulting from changing market conditions ($70 million in securities classified as at fair value through profit or loss and no significant transfer of obligations related to securities sold short for the six months ended April 30, 2015). In addition, during the six-month periods ended April 30, 2016 and 2015, other financial instruments were transferred to (or from) Level 3 due to changes in the availability of observable market inputs resulting from changing market conditions. The following tables show financial instruments recorded at fair value on the Consolidated Balance Sheet according to the fair value hierarchy. As at April 30, 2016
Level 1 Level 2 Level 3
Total financial assets/liabilities
at fair value Financial assets Securities At fair value through profit or loss Securities issued or guaranteed by Canada 2,895 5,769 − 8,664 Provinces − 9,741 − 9,741 Municipalities and school boards − 420 − 420 U.S. Treasury, other U.S. agencies and other foreign governments 1,456 514 − 1,970 Other debt securities − 3,036 − 3,036 Equity securities 17,537 891 12 18,440 21,888 20,371 12 42,271
Available-for-sale Securities issued or guaranteed by Canada 239 6,581 − 6,820 Provinces − 4,623 − 4,623 Municipalities and school boards − 371 − 371 U.S. Treasury, other U.S. agencies and other foreign governments 821 28 − 849 Other debt securities − 803 33 836 Equity securities 216 122 273 611 1,276 12,528 306 14,110
Securities purchased under reverse repurchase agreements and securities borrowed − 751 − 751 Loans and acceptances − 5,091 − 5,091 Other Derivative financial instruments 114 11,956 111 12,181 23,278 50,697 429 74,404 Financial liabilities Deposits − 3,434 29 3,463 Other Obligations related to securities sold short 9,593 5,246 − 14,839 Derivative financial instruments 109 9,143 107 9,359 Liabilities related to transferred receivables − 5,989 − 5,989 Other liabilities − 44 − 44 9,702 23,856 136 33,694

INTERIM CONDENSED CONSOLIDATED FINANCIAL STATEMENTS NOTES TO THE INTERIM CONDENSED CONSOLIDATED FINANCIAL STATEMENTS
(unaudited) (millions of Canadian dollars)
National Bank of Canada 52 Report to Shareholders, Second Quarter 2016
NOTE 3 – FAIR VALUE OF FINANCIAL INSTRUMENTS (cont.) As at October 31, 2015
Level 1 Level 2 Level 3
Total financial assets/liabilities
at fair value Financial assets Securities At fair value through profit or loss Securities issued or guaranteed by Canada 1,969 6,647 − 8,616 Provinces − 10,359 − 10,359 Municipalities and school boards − 789 − 789 U.S. Treasury, other U.S. agencies and other foreign governments 326 866 − 1,192 Other debt securities − 3,264 − 3,264 Equity securities 17,145 611 21 17,777 19,440 22,536 21 41,997
Available-for-sale Securities issued or guaranteed by Canada 283 6,184 − 6,467 Provinces − 4,676 − 4,676 Municipalities and school boards − 428 − 428 U.S. Treasury, other U.S. agencies and other foreign governments 904 25 − 929 Other debt securities − 913 30 943 Equity securities 225 144 231 600 1,412 12,370 261 14,043
Securities purchased under reverse repurchase agreements and securities borrowed − 295 − 295 Loans and acceptances − 4,565 − 4,565 Other Derivative financial instruments 95 10,730 17 10,842 20,947 50,496 299 71,742 Financial liabilities Deposits − 3,184 20 3,204 Other Obligations related to securities sold short 11,456 5,877 − 17,333 Derivative financial instruments 42 7,659 55 7,756 Liabilities related to transferred receivables − 6,402 − 6,402 Other liabilities − 50 − 50 11,498 23,172 75 34,745
Financial Instruments Classified in Level 3
The Bank classifies financial instruments in Level 3 when the valuation technique is based on at least one significant input that is not observable in the markets. The Bank maximizes the use of observable inputs to determine the fair value of financial instruments. Valuation Techniques Applied to Financial Instruments Classified in Level 3 Other Restructured Notes of the Master Asset Vehicle (MAV) I and MAV II Conduits The fair value of these financial instruments is determined based on the net asset value, which represents the estimated value of a security based on valuations received from the administrator of the conduits. Equity Securities and Other Debt Securities The fair value of these financial instruments is determined primarily based on the net asset value, which represents the estimated value of a security based on valuations received from investment or fund managers or the general partners of the limited partnerships. Fair value can also be determined using internal valuation techniques adjusted for risk factors related to the financial instruments and for economic conditions.

INTERIM CONDENSED CONSOLIDATED FINANCIAL STATEMENTS NOTES TO THE INTERIM CONDENSED CONSOLIDATED FINANCIAL STATEMENTS
(unaudited) (millions of Canadian dollars)
National Bank of Canada 53 Report to Shareholders, Second Quarter 2016
Derivative Financial Instruments To determine the fair value of over-the-counter (OTC) derivative financial instruments, the Bank uses well-established valuation techniques that incorporate assumptions based primarily on observable market inputs such as current market prices and the contractual prices of the underlying instruments, the time value of money, interest rate yield curves, credit curves, currency rates as well as price and rate volatility factors. The Bank also includes the Credit Valuation Adjustment (CVA), the Debit Valuation Adjustment (DVA) and the Funding Valuation Adjustment (FVA). Structured Deposit Notes The fair value of structured deposit notes is established using valuation models that maximize the use of observable inputs when available, such as benchmark indices, and also incorporates the DVA. When fair value is determined using option pricing models, the valuation techniques are similar to those described for derivative financial instruments. The following tables show the significant unobservable inputs used for the fair value measurements of financial instruments classified in Level 3 of the hierarchy. As at April 30, 2016
Primary valuation techniques
Significant unobservable inputs
Range of input values
Fair value Low High
Financial assets Securities Other restructured notes of the MAV I and MAV II conduits 6 Net asset value Net asset value 100 % Equity securities and other debt securities 312 Net asset value Net asset value 100 % Market comparable EV/EBITDA(1) multiple 11 x 14 x Price-based model Price equivalent 71 % 146 % Other Derivative financial instruments Interest rate contracts 1 Discounted cash flows Discount rate 2.20 % Equity contracts 110 Option pricing model Long-term volatility 10 % 43 % Market correlation (58) % 80 % 429 Financial liabilities Deposits Structured deposit notes 29 Option pricing model Long-term volatility 12 % 62 % Market correlation (58) % 86 % Other Derivative financial instruments Equity contracts 107 Option pricing model Long-term volatility 9 % 61 % Market correlation (58) % 86 % 136
(1) EV/EBITDA means Enterprise Value/Earnings Before Interest, Taxes, Depreciation and Amortization.
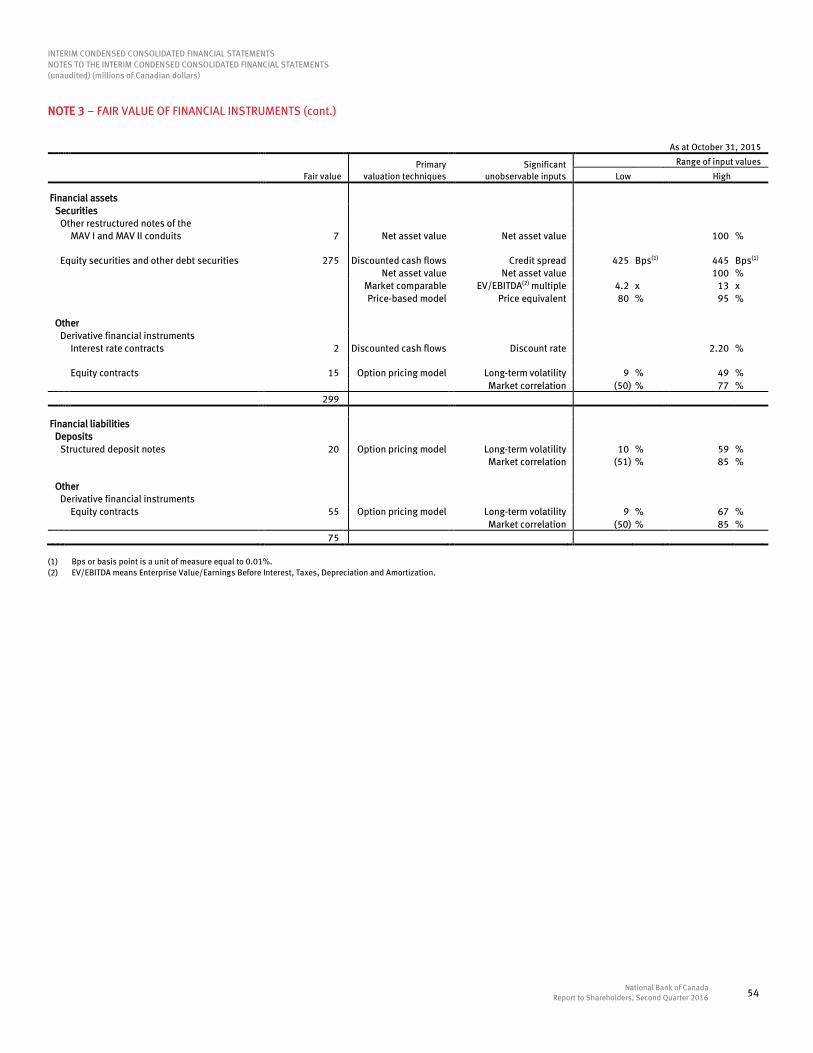
INTERIM CONDENSED CONSOLIDATED FINANCIAL STATEMENTS NOTES TO THE INTERIM CONDENSED CONSOLIDATED FINANCIAL STATEMENTS
(unaudited) (millions of Canadian dollars)
National Bank of Canada 54 Report to Shareholders, Second Quarter 2016
NOTE 3 – FAIR VALUE OF FINANCIAL INSTRUMENTS (cont.)
As at October 31, 2015
Fair value
Primary valuation techniques
Significant unobservable inputs
Range of input values
Low High
Financial assets Securities Other restructured notes of the MAV I and MAV II conduits 7 Net asset value Net asset value 100 % Equity securities and other debt securities 275 Discounted cash flows Credit spread 425 Bps(1) 445 Bps(1) Net asset value Net asset value 100 % Market comparable EV/EBITDA(2) multiple 4.2 x 13 x Price-based model Price equivalent 80 % 95 % Other Derivative financial instruments Interest rate contracts 2 Discounted cash flows Discount rate 2.20 % Equity contracts 15 Option pricing model Long-term volatility 9 % 49 % Market correlation (50) % 77 % 299 Financial liabilities Deposits Structured deposit notes 20 Option pricing model Long-term volatility 10 % 59 % Market correlation (51) % 85 % Other Derivative financial instruments Equity contracts 55 Option pricing model Long-term volatility 9 % 67 % Market correlation (50) % 85 % 75
(1) Bps or basis point is a unit of measure equal to 0.01%. (2) EV/EBITDA means Enterprise Value/Earnings Before Interest, Taxes, Depreciation and Amortization.

INTERIM CONDENSED CONSOLIDATED FINANCIAL STATEMENTS NOTES TO THE INTERIM CONDENSED CONSOLIDATED FINANCIAL STATEMENTS
(unaudited) (millions of Canadian dollars)
National Bank of Canada 55 Report to Shareholders, Second Quarter 2016
Significant Unobservable Inputs Used for Fair Value Measurements of Financial Instruments Classified in Level 3 Net Asset Value Net asset value is the estimated value of a security based on valuations received from the investment or fund managers, the administrators of the conduits or the general partners of the limited partnerships. The net asset value of a fund is the total fair value of assets less liabilities. Credit Spread Credit spread is the difference between a benchmark interest rate and the interest rate required by market participants to accept the lower credit quality of the measured financial asset. The interest rate on certain government bonds with a high credit rating and a maturity similar to the measured asset can often be considered a benchmark interest rate. An increase (decrease) in this unobservable input generally results in a decrease (increase) in fair value. EV/EBITDA (Enterprise Value/Earnings Before Interest, Taxes, Depreciation and Amortization) Multiple and Price Equivalent Private equity valuation inputs include earnings multiples, which are determined based on comparable companies, and a higher multiple will translate into a higher fair value. Price equivalent is a percentage of the market price based on the liquidity of the security. Discount Rate When discounted cash flow methods are used, the discount rate is the input used to bring future cash flows to their present value. A higher discount rate will translate into a lower fair value. Long-Term Volatility Volatility is a measure of the expected future variability of market prices. Volatility is generally observable in the market through options prices. However, the long-term volatility of options with a longer maturity might not be observable. An increase (decrease) in long-term volatility is generally associated with an increase (decrease) in long-term correlation. Higher long-term volatility may increase or decrease an instrument’s fair value depending on its terms. Market Correlation Correlation is a measure of the inter-relationship between two different variables. A positive correlation means that the variables tend to move in the same direction; a negative correlation means that the variables tend to move in opposite directions. Correlation is used to measure financial instruments whose future returns depend on several variables. Changes in correlation will either increase or decrease a financial instrument’s fair value depending on the terms of its contractual payout. Sensitivity Analysis of Financial Instruments Classified in Level 3 The Bank performs sensitivity analyses for the fair value measurements of financial instruments classified in Level 3, substituting unobservable inputs with one or more reasonably possible alternative assumptions. For the other restructured notes of the MAV I and MAV II conduits classified in Level 3, the most significant input used to determine fair value is net asset value. As at April 30, 2016 and as at October 31, 2015, the Bank varies the values used within a range that could result in a less-than $1 million increase or decrease in fair value. For equity securities and other debt securities, the Bank varies significant unobservable inputs such as net asset values, credit spreads, or EV/EBITDA multiples and price equivalents, and establishes a reasonable fair value range that could result in a $40 million increase or decrease in the fair value recorded as at April 30, 2016 (a $36 million increase or decrease as at October 31, 2015). For derivative financial instruments and embedded derivatives related to structured deposit notes, the Bank varies long-term volatility and market correlation inputs and establishes a reasonable fair value range. As at April 30, 2016, for derivative financial instruments, the net fair value could result in a $3 million increase or decrease ($11 million increase or decrease as at October 31, 2015), whereas for structured deposit notes, fair value could result in a $1 million increase or decrease ($4 million increase or decrease as at October 31, 2015).

INTERIM CONDENSED CONSOLIDATED FINANCIAL STATEMENTS NOTES TO THE INTERIM CONDENSED CONSOLIDATED FINANCIAL STATEMENTS
(unaudited) (millions of Canadian dollars)
National Bank of Canada 56 Report to Shareholders, Second Quarter 2016
NOTE 3 – FAIR VALUE OF FINANCIAL INSTRUMENTS (cont.) Change in the Fair Value of Financial Instruments Classified in Level 3
The Bank may hedge the fair value of financial instruments classified in the various levels through offsetting hedge positions. Gains and losses for financial instruments classified in Level 3 presented in the following tables do not reflect the inverse gains and losses on financial instruments used for economic hedging purposes that may have been classified in Level 1 or 2 by the Bank. In addition, the Bank may hedge the fair value of financial instruments classified in Level 3 using other financial instruments classified in Level 3. The effect of these hedges is not included in the net amount presented in the following tables. The gains and losses presented hereafter may comprise changes in fair value based on observable and unobservable inputs. Six months ended April 30, 2016
Securities at fair value
through profit or loss
Available- for-sale
securities
Derivative financial
instruments(1) Deposits
Fair value as at October 31, 2015 21 261 (38) (20) Total realized and unrealized gains (losses) included in Net income (2) (1) 8 (30) 8 Total realized and unrealized gains (losses) included in Other comprehensive income − 10 − − Purchases − 40 − − Sales (8) (6) − − Issuances − − − (7) Settlements and other − (8) 9 3 Financial instruments transferred into Level 3 − 1 68 (31) Financial instruments transferred out of Level 3 − − (5) 18 Fair value as at April 30, 2016 12 306 4 (29) Change in unrealized gains and losses included in Net income with respect to financial assets and financial liabilities held as at April 30, 2016(3) (1) − (30) 8
Six months ended April 30, 2015
Securities at fair value
through profit or loss
Available- for-sale
securities
Derivative financial
instruments(1) Deposits
Fair value as at October 31, 2014 1,223 237 (39) (81) Total realized and unrealized gains (losses) included in Net income (4) 31 53 3 (7) Total realized and unrealized gains (losses) included in Other comprehensive income − (39) − − Purchases 3 76 − − Sales (31) (78) − − Issuances − − − (11) Settlements and other (69) (4) − − Financial instruments transferred into Level 3 − − (1) 7 Financial instruments transferred out of Level 3 − − − 86 Fair value as at April 30, 2015 1,157 245 (37) (6) Change in unrealized gains and losses included in Net income with respect to financial assets and financial liabilities held as at April 30, 2015(5) 30 − 3 (7)
(1) The derivative financial instruments include assets and liabilities presented on a net basis. (2) Total net losses included in Non-interest income was $15 million. (3) Total unrealized losses included in Non-interest income was $23 million. (4) Total net gains included in Non-interest income was $80 million. (5) Total unrealized gains included in Non-interest income was $26 million.

INTERIM CONDENSED CONSOLIDATED FINANCIAL STATEMENTS NOTES TO THE INTERIM CONDENSED CONSOLIDATED FINANCIAL STATEMENTS
(unaudited) (millions of Canadian dollars)
National Bank of Canada 57 Report to Shareholders, Second Quarter 2016
NOTE 4 – FINANCIAL INSTRUMENTS DESIGNATED AT FAIR VALUE THROUGH PROFIT OR LOSS The Bank chose to designate certain financial instruments at fair value through profit or loss according to criteria presented in Note 1 to the audited annual consolidated financial statements for the year ended October 31, 2015. Consistent with its risk management strategy and as permitted by the fair value option, when the designation eliminates or significantly reduces the measurement or recognition mismatch resulting from measuring financial assets and liabilities on different bases, the Bank designated at fair value through profit or loss certain securities, certain securities purchased under reverse repurchase agreements, and certain liabilities related to transferred receivables. The fair value of liabilities related to transferred receivables does not include credit risk, as the holders of these liabilities are not exposed to the Bank’s credit risk. The Bank also designated certain hybrid financial instruments with one or more embedded derivatives, such as restructured notes of the MAV conduits, certain deposits, and certain loans at fair value through profit or loss. There is no exposure to credit risk on the loans to the extent that they are fully collateralized. To determine a change in fair value arising from a change in the credit risk of deposits designated at fair value through profit or loss, the Bank calculates, at the beginning of the period, the present value of the instrument’s contractual cash flows using the following rates: first, using an observed discount rate that reflects the Bank’s credit spread and, then, using a rate that excludes the Bank’s credit spread. The difference obtained between the two values is then compared to the difference obtained using the same rates at the end of the period. Information about the financial assets and financial liabilities designated at fair value through profit or loss is provided in the following tables.
Carrying value as at
April 30, 2016
Change in total fair value (including
the change in the fair value attributable to
credit risk) for the quarter ended
April 30, 2016
Change in total fair value (including
the change in the fair value attributable to
credit risk) for the six months ended
April 30, 2016
Change in fair value
since the initial recognition of
the instrument
Financial assets designated at fair value through profit or loss Securities 2,219 (7) 1 345 Securities purchased under reverse repurchase agreements 751 − − − Loans 104 (22) (23) (42) 3,074 (29) (22) 303
Financial liabilities designated at fair value through profit or loss Deposits(1)(2) 3,317 (182) (46) (15) Liabilities related to transferred receivables 5,989 53 31 (217) . 9,306 (129) (15) (232)
Carrying value as at
April 30, 2015
Change in total fair value (including the
change in the fair value attributable to
credit risk) for the quarter ended April 30, 2015
Change in total fair value (including the
change in the fair value attributable to
credit risk) for the six months ended
April 30, 2015
Change in fair value
since the initial recognition of
the instrument
Financial assets designated at fair value through profit or loss Securities 2,695 (30) 51 420 Securities purchased under reverse repurchase agreements 1,071 1 − − Loans 114 (10) (22) (28) 3,880 (39) 29 392
Financial liabilities designated at fair value through profit or loss Deposits(1)(2) 2,843 (81) (114) (218) Liabilities related to transferred receivables 5,949 72 (61) (240) 8,792 (9) (175) (458)
(1) For the quarter ended April 30, 2016, the change in the fair value of deposits designated at fair value through profit or loss attributable to credit risk, and recorded in Other comprehensive
income, resulted in a loss of $54 million (loss of $2 million recorded in Non-interest income in the Consolidated Statement of Income for the quarter ended April 30, 2015). For the six months ended April 30, 2016, this change was a loss of $39 million, which included a gain of $15 million recorded in Net income (negligible loss for the six months ended April 30, 2015). For additional information, see Note 2.
(2) The amount at maturity that the Bank will be contractually required to pay to the holders of these deposits varies and will differ from the reporting date fair value.

INTERIM CONDENSED CONSOLIDATED FINANCIAL STATEMENTS NOTES TO THE INTERIM CONDENSED CONSOLIDATED FINANCIAL STATEMENTS
(unaudited) (millions of Canadian dollars)
National Bank of Canada 58 Report to Shareholders, Second Quarter 2016
NOTE 5 – SECURITIES
Gross Gains (Losses) on Available-for-Sale Securities
As at April 30, 2016
Amortized
cost
Gross unrealized
gains
Gross unrealized
losses Carrying
value
Securities issued or guaranteed by Canada 6,766 65 (11) 6,820 Provinces 4,389 253 (19) 4,623 Municipalities and school boards 360 11 − 371 U.S. Treasury, other U.S. agencies and other foreign governments 838 11 − 849 Other debt securities 819 24 (7) 836 Equity securities 570 91 (50) 611 13,742 455 (87) 14,110 As at October 31, 2015
Amortized
cost
Gross unrealized
gains
Gross unrealized
losses Carrying
value
Securities issued or guaranteed by Canada 6,423 62 (18) 6,467 Provinces 4,475 231 (30) 4,676 Municipalities and school boards 414 15 (1) 428 U.S. Treasury, other U.S. agencies and other foreign governments 929 2 (2) 929 Other debt securities 937 15 (9) 943 Equity securities 569 78 (47) 600 13,747 403 (107) 14,043
Impairment Losses Recognized At the end of each financial reporting period, the Bank determines whether there is objective evidence of impairment for each available-for-sale security. During the quarter ended April 30, 2016, $1 million in impairment losses ($3 million for the quarter ended April 30, 2015) was recognized in Gains (losses) on available-for-sale securities, net in the Consolidated Statement of Income. For the six months ended April 30, 2016, impairment losses amounted to $4 million ($9 million for the six months ended April 30, 2015). In addition, during the six-month periods ended April 30, 2016 and 2015, no amount was reversed in the Consolidated Statement of Income to recognize subsequent increases in the fair value of previously impaired debt securities. Gross Unrealized Losses As at April 30, 2016 and as at October 31, 2015, the Bank concluded that the gross unrealized losses on available-for-sale securities were mainly due to market price fluctuations and to changes in foreign exchange rates and that there was no objective evidence of impairment requiring an impairment charge to be recognized in the Consolidated Statement of Income.
Held-to-Maturity Securities
At the end of each financial reporting period, the Bank determines whether there is objective evidence of impairment for each held-to-maturity security. As at April 30, 2016, there was no objective evidence of impairment on held-to-maturity securities.

INTERIM CONDENSED CONSOLIDATED FINANCIAL STATEMENTS NOTES TO THE INTERIM CONDENSED CONSOLIDATED FINANCIAL STATEMENTS
(unaudited) (millions of Canadian dollars)
National Bank of Canada 59 Report to Shareholders, Second Quarter 2016
NOTE 6 – LOANS
Credit Quality of Loans
As at April 30, 2016
Residential
mortgage Personal and
credit card Business and
government(1)(2) Total
Neither past due(3) nor impaired 44,803 32,582 43,467 120,852 Past due(3) but not impaired 212 273 95 580 Impaired 81 80 360 521 Gross loans 45,096 32,935 43,922 121,953 Less: Allowances on impaired loans Individual allowances 10 19 169 198 Collective allowances − 20 3 23 Allowances on impaired loans 10 39 172 221 45,086 32,896 43,750 121,732 Less: Sectoral allowance on non-impaired loans – Oil and gas(4) 250 Collective allowance on non-impaired loans(5) 366 616 Loans and acceptances, net of allowances 121,116 As at October 31, 2015
Residential
mortgage Personal and
credit card Business and
government(1)(2) Total
Neither past due(3) nor impaired 43,184 31,556 39,953 114,693 Past due(3) but not impaired 266 295 96 657 Impaired 70 82 305 457 Gross loans 43,520 31,933 40,354 115,807 Less: Allowances on impaired loans Individual allowances 10 18 151 179 Collective allowances − 22 2 24 Allowances on impaired loans 10 40 153 203 43,510 31,893 40,201 115,604 Less: Collective allowance on non-impaired loans(5) 366 Loans and acceptances, net of allowances 115,238
(1) Business credit portfolios are closely monitored and a monthly watchlist of problem commitments is produced. The watchlist is analyzed by the loan portfolio managers concerned, who
must then submit a report to Credit Risk Management. (2) Including customers’ liability under acceptances. (3) A loan is past due when the counterparty has not made a payment by the contractual due date. (4) The sectoral allowance on non-impaired loans was established collectively for the portfolio of loans to producers and service companies in the oil and gas sector. (5) The collective allowance on non-impaired loans for credit risk was established taking into account the Bank’s overall credit portfolio, except for loans covered by the sectoral allowance.

INTERIM CONDENSED CONSOLIDATED FINANCIAL STATEMENTS NOTES TO THE INTERIM CONDENSED CONSOLIDATED FINANCIAL STATEMENTS
(unaudited) (millions of Canadian dollars)
National Bank of Canada 60 Report to Shareholders, Second Quarter 2016
NOTE 6 – LOANS (cont.)
Loans Past Due But Not Impaired(1)
As at April 30, 2016 As at October 31, 2015
Residential
mortgage Personal and
credit card Business and government(2)
Residential mortgage
Personal and credit card
Business and government(2)
Past due but not impaired
31 to 60 days 81 101 20 120 109 36
61 to 90 days 53 33 38 54 38 26
Over 90 days 78 139 37 92 148 34
212 273 95 266 295 96
(1) Loans less than 31 days past due are not presented as they are not considered past due from an administrative standpoint. (2) As at April 30, 2016, the fair value of financial collateral held against loans past due but not impaired was $14 million ($16 million as at October 31, 2015).
Impaired Loans
As at April 30, 2016
Gross Individual
allowances Collective
allowances Net
Loans Residential mortgage 81 10 − 71 Personal and credit card 80 19 20 41 Business and government 360 169 3 188 521 198 23 300
As at October 31, 2015
Gross Individual
allowances Collective
allowances Net
Loans Residential mortgage 70 10 − 60 Personal and credit card 82 18 22 42 Business and government(1) 305 151 2 152 457 179 24 254
(1) Including customers’ liability under acceptances.

INTERIM CONDENSED CONSOLIDATED FINANCIAL STATEMENTS NOTES TO THE INTERIM CONDENSED CONSOLIDATED FINANCIAL STATEMENTS
(unaudited) (millions of Canadian dollars)
National Bank of Canada 61 Report to Shareholders, Second Quarter 2016
Allowances for Credit Losses
Six months ended April 30, 2016
Balance at beginning
Provisions for credit losses
Write-offs
Write-offs on credit cards
Recoveries and other(1)
Transfers(2)
Balance at end
Allowances on impaired loans Residential mortgage Individual allowances 10 6 (6) − − − 10 Collective allowances − − − − − − − Personal and credit card Individual allowances 18 62 (20) (42) 1 − 19 Collective allowances 22 15 (21) − 4 − 20 Business and government Individual allowances 151 45 (23) − (4) − 169 Collective allowances 2 2 (1) − − − 3 Individual allowances 179 113 (49) (42) (3) − 198 Collective allowances 24 17 (22) − 4 − 23 203 130 (71) (42) 1 − 221 Sectoral allowance on non-impaired loans – Oil and gas(3) − 250 − − − − 250 Collective allowance on non-impaired loans(4) 366 − − − − − 366 366 250 − − − − 616 Total allowances 569 380 (71) (42) 1 − 837
Six months ended April 30, 2015
Balance at beginning
Provisions for credit losses Write-offs
Write-offs on credit cards
Recoveries and other(1) Transfers(2)
Balance at end
Allowances on impaired loans Residential mortgage Individual allowances 9 5 (3) − − − 11 Collective allowances − − − − − − − Personal and credit card Individual allowances 15 60 (20) (39) − − 16 Collective allowances 21 18 (20) − 3 − 22 Business and government Individual allowances 191 26 (76) − 5 − 146 Collective allowances 2 2 (2) − − − 2 Individual allowances 215 91 (99) (39) 5 − 173 Collective allowances 23 20 (22) − 3 − 24 238 111 (121) (39) 8 − 197 Collective allowance on non-impaired loans(4) 366 − − − − − 366 Total allowances 604 111 (121) (39) 8 − 563
(1) Includes foreign exchange movements. (2) When a loan covered by the Sectoral allowance on non-impaired loans – Oil and gas becomes impaired, the sectoral allowance related to that loan is transferred to the individual allowances
on impaired loans. (3) The sectoral allowance on non-impaired loans was established collectively for the portfolio of loans to producers and service companies in the oil and gas sector. (4) The collective allowance on non-impaired loans for credit risk was established taking into account the Bank’s overall credit portfolio, except for loans covered by the sectoral allowance.

INTERIM CONDENSED CONSOLIDATED FINANCIAL STATEMENTS NOTES TO THE INTERIM CONDENSED CONSOLIDATED FINANCIAL STATEMENTS
(unaudited) (millions of Canadian dollars)
National Bank of Canada 62 Report to Shareholders, Second Quarter 2016
NOTE 7 – FINANCIAL ASSETS TRANSFERRED BUT NOT DERECOGNIZED In the normal course of its business, the Bank enters into transactions in which it transfers financial assets such as securities or loans directly to third parties, in particular structured entities. According to the terms of some of those transactions, the Bank retains substantially all of the risks and rewards related to those financial assets. The risks include credit risk, interest rate risk, foreign exchange risk, prepayment risk and other price risks, whereas the rewards include income streams associated with the financial assets. As such, those financial assets are not derecognized and the transactions are treated as collateralized or secured borrowings. The following table provides additional information about the nature of the transferred financial assets that do not qualify for derecognition and the associated liabilities. As at April 30, 2016 As at October 31, 2015
Carrying value of financial assets transferred but not derecognized Securities(1) 37,901 32,902 Residential mortgages 18,184 17,732 56,085 50,634 Carrying value of associated liabilities(2) 32,805 26,820
Fair value of financial assets transferred but not derecognized Securities(1) 37,901 32,902 Residential mortgages 18,463 18,032 56,364 50,934
Fair value of associated liabilities(2) 32,828 26,879
(1) The amount related to the securities loaned is the maximum amount of Bank securities that can be lent. For the obligations related to securities sold under repurchase agreements, the amount
includes the Bank’s own financial assets as well as those of third parties. (2) Associated liabilities include obligations related to securities sold under repurchase agreements before the offsetting impact of $4,291 million as at April 30, 2016 ($1,411 million as at
October 31, 2015) and liabilities related to transferred receivables. Liabilities related to securities loaned are not included, as the Bank can lend its own financial assets and those of third parties. The carrying value and fair value of liabilities related to securities loaned were $9,555 million as at April 30, 2016 ($8,140 million as at October 31, 2015).
The following table specifies the nature of the transactions related to financial assets transferred but not derecognized. As at April 30, 2016 As at October 31, 2015
Carrying value of financial assets transferred but not derecognized Securities backed by insured residential mortgage loans and other securities sold to Canada Housing Trust 19,350 18,958 Securities sold under repurchase agreements 13,006 7,148 Securities loaned 23,728 24,526 Residential mortgages transferred to a mutual fund 1 2 56,085 50,634

INTERIM CONDENSED CONSOLIDATED FINANCIAL STATEMENTS NOTES TO THE INTERIM CONDENSED CONSOLIDATED FINANCIAL STATEMENTS
(unaudited) (millions of Canadian dollars)
National Bank of Canada 63 Report to Shareholders, Second Quarter 2016
NOTE 8 – ASSOCIATES AND JOINT VENTURES Maple Financial Group Inc. The Bank has a 24.9% equity interest in Maple Financial Group Inc., a privately owned Canadian company that operates in Canada, Germany, the United Kingdom and the United States. Maple Bank GmbH, an indirectly wholly owned subsidiary of the company, is being investigated by German prosecutors regarding alleged tax irregularities. On February 6, 2016, the German Federal Financial Supervisory Authority, BaFin, placed a moratorium on the business activities of Maple Bank GmbH, preventing it from carrying out its normal business activities. This situation is the result of ongoing investigations launched by German authorities in September 2015 focusing on selected trading activities made by Maple Bank GmbH and some of its current and former employees during taxation years 2006 to 2010. The German authorities have alleged that these trading activities violated German tax laws. Neither the Bank nor its employees were involved in these trading activities and to our knowledge are not the subject of these investigations. In light of the situation, the Bank wrote off the carrying value of its equity interest in Maple Financial Group Inc. in an amount of $164 million ($145 million net of income taxes) during the first quarter of 2016. The $164 million write-off of the equity interest in this associate was recognized in the Non-interest income – Other item of the Consolidated Statement of Income for the six-month period ended April 30, 2016 and is presented in the Financial Markets segment. The Bank has advised the German authorities that if it is determined that portions of dividends received from Maple Financial Group Inc. could be reasonably attributable to tax fraud by Maple Bank GmbH, arrangements will be made to repay those amounts to the relevant authority. If any repayments are required, they are not expected to be material to the Bank’s financial position.
NOTE 9 – OTHER ASSETS As at April 30, 2016 As at October 31, 2015
Receivables, prepaid expenses and other items 686 690
Interest and dividends receivable 452 459
Defined benefit asset 87 268
Deferred tax assets 309 230
Current tax assets 118 192
Reinsurance assets 33 25
1,685 1,864
NOTE 10 – DEPOSITS As at April 30, 2016 As at October 31, 2015
On demand
or after notice(1) Fixed term(2) Total Total
Personal 27,010 20,962 47,972 45,981 Business and government 31,830 44,199 76,029 74,441 Deposit-taking institutions 1,706 4,564 6,270 8,408 60,546 69,725 130,271 128,830
(1) Deposits payable on demand are deposits for which the Bank does not have the right to require notice of withdrawal and consist essentially of deposits in chequing accounts. Deposits payable
after notice are deposits for which the Bank may legally require notice of withdrawal and consist mainly of deposits in savings accounts. (2) Fixed-term deposits are deposits that can be withdrawn by the holder on a specified date and include term deposits, guaranteed investment certificates, savings accounts and plans, covered
bonds and similar instruments.
During the six months ended April 30, 2016, the Bank did not issue any covered bonds (US$750 million and 1.0 billion euros issued during the six months ended April 30, 2015). See Note 22 for additional information on covered bonds. The Deposits – Business and government item includes the deposit from NBC Capital Trust and covered bonds, the balances of which were $225 million and $7,759 million, respectively, as at April 30, 2016 ($225 million and $7,910 million, respectively, as at October 31, 2015). On May 16, 2016, NBC Capital Trust (the Trust) announced its intention to redeem the 225,000 Trust Capital Securities – Series 1, or NBC Caps – Series 1, from which $225 million in gross issuance proceeds had been used by the Trust to finance a deposit note purchase from the Bank. For additional information, see Note 24.

INTERIM CONDENSED CONSOLIDATED FINANCIAL STATEMENTS NOTES TO THE INTERIM CONDENSED CONSOLIDATED FINANCIAL STATEMENTS
(unaudited) (millions of Canadian dollars)
National Bank of Canada 64 Report to Shareholders, Second Quarter 2016
NOTE 11 – OTHER LIABILITIES
As at April 30, 2016 As at October 31, 2015
Accounts payable and accrued expenses 1,079 1,334 Subsidiaries' debts to third parties 1,388 1,400 Interest and dividends payable 565 615 Defined benefit liability 193 183 Deferred tax liabilities 97 123 Current tax liabilities 82 82 Insurance liabilities 74 67 Other items(1)(2) 721 670 4,199 4,474
(1) As at April 30, 2016, other items included a $37 million restructuring provision ($67 million as at October 31, 2015). See Note 12 for additional information. (2) As at April 30, 2016, other items included an $11 million litigation provision ($15 million as at October 31, 2015).
NOTE 12 – RESTRUCTURING During fiscal 2015, the Board approved certain restructuring initiatives in order to continue its transformation plan, satisfy the changing needs of its clients and enhance operational efficiency. This transformation will allow the Bank to maintain the pace of its client-centric shift, pursue the transition to digital banking, maintain a compelling workplace and focus on operational excellence. During fiscal 2015, the Bank recorded an $86 million charge in Restructuring charge in the Consolidated Statement of Income, consisting of severance pay, professional fees, onerous contracts and write-offs of premises and equipment. This restructuring charge was allocated across all the Bank’s business segments.
The following table presents changes in the restructuring provision on the Consolidated Balance Sheet.
Severance pay Other Total
As at November 1, 2014 − − − Restructuring charge 53 33 86 Payments during the year (2) (17) (19) As at October 31, 2015 51 16 67 Payments during the period (22) (8) (30) As at April 30, 2016 29 8 37
NOTE 13 – SUBORDINATED DEBT On November 2, 2015, the Bank completed a $500 million redemption of notes maturing in November 2020 at a price equal to their nominal value plus accrued interest.

INTERIM CONDENSED CONSOLIDATED FINANCIAL STATEMENTS NOTES TO THE INTERIM CONDENSED CONSOLIDATED FINANCIAL STATEMENTS
(unaudited) (millions of Canadian dollars)
National Bank of Canada 65 Report to Shareholders, Second Quarter 2016
NOTE 14 – HEDGING ACTIVITIES
Derivative and Non-Derivative Financial Instruments Designated as Hedging Instruments As at April 30, 2016 As at October 31, 2015
Fair value
hedge Cash flow
hedge Net investment
hedge Fair value
hedge Cash flow
hedge Net investment
hedge
Assets Derivative financial instruments 743 372 − 731 405 4 Liabilities Derivative financial instruments 565 366 8 466 365 2 Carrying value of non-derivative financial instruments − − 1,213 − − 1,690
Notional amounts of designated derivative financial instruments 22,586 18,934 485 25,433 28,521 632
Results of the Fair Value Hedges Quarter ended April 30 Six months ended April 30 2016 2015 2016 2015 Gains (losses) on hedging instruments (90) (109) (62) 69 Gains (losses) on hedged items attributable to the hedged risk 89 111 62 (69) Ineffectiveness of fair value hedging relationships − − − −
Results of the Cash Flow Hedges Quarter ended April 30 Six months ended April 30 2016 2015 2016 2015
Unrealized gains (losses) included in Other comprehensive income as the effective portion of the hedging instrument 54 36 60 35 Losses (gains) reclassified to Net interest income in the Consolidated Statement of Income (6) (4) (10) (8) Ineffectiveness of cash flow hedging relationships (1) − (1) −
The following table shows the periods during which the Bank expects the hedged cash flows to occur and have an impact on net income. As at April 30, 2016
1 year or less
Over 1 year to
2 years
Over 2 years to
5 years Over
5 years Expected cash flows from hedged assets 20 20 49 32 Expected cash flows from hedged liabilities 52 50 108 30 Net exposure (32) (30) (59) 2
Results of the Hedges of Net Investments in Foreign Operations
For the six-month periods ended April 30, 2016 and 2015, a negligible amount representing the ineffective portion was recognized in Non-interest income in the Consolidated Statement of Income.

INTERIM CONDENSED CONSOLIDATED FINANCIAL STATEMENTS NOTES TO THE INTERIM CONDENSED CONSOLIDATED FINANCIAL STATEMENTS
(unaudited) (millions of Canadian dollars)
National Bank of Canada 66 Report to Shareholders, Second Quarter 2016
NOTE 15 – SHARE CAPITAL Issuance of Preferred Shares On January 22, 2016, the Bank issued 16,000,000 Non-Cumulative 5-Year Rate-Reset Series 34 First Preferred Shares at a per-share price of $25.00 for gross proceeds of $400 million. These shares are redeemable in cash at the Bank’s option, subject to the provisions of the Bank Act (Canada) and to OSFI approval, as of May 15, 2021 and on May 15 every five years thereafter, in whole or in part, at a price equal to $25.00 per share, plus all dividends declared and unpaid thereon on the date fixed for redemption; the shares are convertible at the option of the holder into an equal number of floating-rate (equal to the three-month Government of Canada Treasury Bills yield plus 4.90%) non-cumulative Series 35 First Preferred Shares, subject to certain conditions, on May 15, 2021 and on May 15 every five years thereafter. The Series 34 preferred shares carry a non-cumulative quarterly dividend of $0.3500 for the initial period ending May 15, 2021. Thereafter, these shares carry a non-cumulative quarterly fixed dividend in an amount per share determined by multiplying the interest rate, equal to the sum of the 5-year Government of Canada bond-yield on the calculation date of the applicable fixed rate plus 4.90%, by $25.00. Given that the Series 34 preferred shares satisfy the non-viability contingent capital requirements, they qualify for the purposes of calculating regulatory capital under Basel III. Redemption of Preferred Shares On November 16, 2015, which was the first business day after the November 15, 2015 redemption date, the Bank completed the redemption of all the issued and outstanding Non-Cumulative Fixed-Rate Series 20 First Preferred Shares. Pursuant to the share conditions, the redemption price was $25.50 per share plus the periodic dividend declared and unpaid. The Bank redeemed 6,900,000 Series 20 preferred shares for a total amount of $176 million, which reduced Preferred share capital by $173 million and Retained earnings by $3 million. Repurchase of Common Shares On May 11, 2015, the Bank began a normal course issuer bid to repurchase for cancellation up to 6,000,000 common shares over the 12-month period ending no later than May 10, 2016. The shares will be repurchased on the open market at market prices through the Toronto Stock Exchange. Amounts paid above the average book value of the common shares will be charged to Retained earnings. During the six months ended April 30, 2016 and the year ended October 31, 2015, the Bank did not repurchase any shares. Common Shares Held in Escrow
As part of the acquisition of Wellington West Holdings Inc. in 2011, the Bank had issued common shares held in escrow. As at April 30, 2016, the number of common shares held in escrow was 936,785 (936,785 as at October 31, 2015). The Bank expects that the conditions will be met and that the remaining shares held in escrow will be released by the end of fiscal 2016.
Shares Outstanding
As at April 30, 2016 As at October 31, 2015
Number of shares
Shares $
Number of shares
Shares $
First Preferred Shares Series 20 − − 6,900,000 173 Series 28 8,000,000 200 8,000,000 200 Series 30 14,000,000 350 14,000,000 350 Series 32 12,000,000 300 12,000,000 300 Series 34 16,000,000 400 − − 50,000,000 1,250 40,900,000 1,023 Common shares at beginning of the fiscal year 337,236,322 2,614 329,297,375 2,293 Issued under a public offering − − 7,160,000 300 Issued pursuant to the Stock Option Plan 540,222 21 1,059,650 39 Impact of shares purchased or sold for trading(1) (358,520) (15) (280,703) (18) Common shares at end of the period 337,418,024 2,620 337,236,322 2,614
(1) As at April 30, 2016, the Bank held 14,633 shares for trading, representing an amount of $1 million (343,887 shares sold short for trading representing an amount of $14 million as at
October 31, 2015).

INTERIM CONDENSED CONSOLIDATED FINANCIAL STATEMENTS NOTES TO THE INTERIM CONDENSED CONSOLIDATED FINANCIAL STATEMENTS
(unaudited) (millions of Canadian dollars)
National Bank of Canada 67 Report to Shareholders, Second Quarter 2016
Dividends Declared
Six months ended April 30
2016 2015 Dividends
$ Dividends
per share Dividends
$ Dividends
per share
First Preferred Shares Series 20 − − 5 0.7500 Series 28 4 0.4750 4 0.4750 Series 30 7 0.5125 7 0.5125 Series 32 6 0.4876 7 0.5884 Series 34 7 0.4373 − − 24 23 Common shares 364 1.0800 329 1.0000 388 352
NOTE 16 – NON-CONTROLLING INTERESTS As at April 30, 2016 As at October 31, 2015
Trust units issued by NBC Asset Trust (NBC CapS II)
Series 1(1) 410 410
Series 2(2) 359 359
Other 27 32
796 801
(1) Includes $10 million in accrued interest ($10 million as at October 31, 2015). (2) Includes $9 million in accrued interest ($9 million as at October 31, 2015).

INTERIM CONDENSED CONSOLIDATED FINANCIAL STATEMENTS NOTES TO THE INTERIM CONDENSED CONSOLIDATED FINANCIAL STATEMENTS
(unaudited) (millions of Canadian dollars)
National Bank of Canada 68 Report to Shareholders, Second Quarter 2016
NOTE 17 – CAPITAL DISCLOSURE OSFI is requiring Canadian banks to meet the 2019 minimum “all-in” requirements, regardless of the transition period set out by the Basel Committee on Banking Supervision (BCBS). OSFI designated Canada’s six largest banks, a group that includes National Bank, as Domestic Systemically Important Banks. Consequently, the Bank and all other major Canadian banks have to maintain a Common Equity Tier 1 (CET1) capital ratio of at least 8.0%, a Tier 1 capital ratio of at least 9.5%, and a Total capital ratio of at least 11.5%, all determined using the “all-in” methodology.
Since January 1, 2015, OSFI has been requiring Canadian banks to meet a Basel III leverage ratio of at least 3.0%. The leverage ratio is a measure independent of risk that is calculated by dividing the amount of Tier 1 capital by total exposure. Total exposure is defined as the sum of on-balance-sheet assets (including derivative exposures and securities financing transaction exposures) and off-balance-sheet items. The assets deducted from Tier 1 capital are also deducted from total exposure.
During the quarter and the six months ended April 30, 2016, the Bank was in compliance with all of OSFI’s regulatory capital requirements.
Regulatory Capital and Ratios Under Basel III(1)
As at April 30, 2016 As at October 31, 2015
Capital CET1 6,669 6,801 Tier 1(2) 8,880 8,626 Total(2)(3) 10,164 9,678 Risk-weighted assets CET1 capital 68,375 68,835 Tier 1 capital 68,604 69,094 Total capital 68,800 69,316 Total exposure 239,401 234,957 Capital ratios CET1 9.8 % 9.9 % Tier 1(2) 12.9 % 12.5 % Total(2)(3) 14.8 % 14.0 %
Leverage ratio 3.7 % 3.7 % (1) Figures are presented on an “all-in” basis. (2) Figures as at October 31, 2015 include the redemption of the Series 20 preferred shares on November 15, 2015. (3) Figures as at October 31, 2015 include the $500 million redemption of notes on November 2, 2015.

INTERIM CONDENSED CONSOLIDATED FINANCIAL STATEMENTS NOTES TO THE INTERIM CONDENSED CONSOLIDATED FINANCIAL STATEMENTS
(unaudited) (millions of Canadian dollars)
National Bank of Canada 69 Report to Shareholders, Second Quarter 2016
NOTE 18 – TRADING ACTIVITY REVENUES Trading activity revenues consist of the net interest income from trading activities and trading revenues recognized in Non-interest income in the Consolidated Statement of Income. Net interest income comprises dividends related to financial assets and liabilities associated with trading activities, net of interest expenses and interest income related to the financing of these financial assets and liabilities. Non-interest income consists of realized and unrealized gains and losses as well as interest income on securities measured at fair value through profit or loss, income from held-for-trading derivative financial instruments, and the change in fair value of financial instruments designated at fair value through profit or loss. Quarter ended April 30 Six months ended April 30
2016 2015 2016 2015
Net interest income 133 96 258 211 Non-interest income 8 14 55 117 141 110 313 328
NOTE 19 – SHARE-BASED PAYMENTS Stock Option Plan During the quarters ended April 30, 2016 and 2015, the Bank did not award any stock options. During the six months ended April 30, 2016, the Bank awarded 2,140,420 stock options (3,170,260 stock options during the six-month period ended April 30, 2015) with an average fair value of $3.70 per option ($7.44 in 2015). As at April 30, 2016, there were 18,009,365 stock options outstanding (16,652,313 stock options as at October 31, 2015). The average fair value of the options awarded was estimated on the award date using the Black-Scholes model. The following assumptions were used for accounting purposes. Six months ended April 30
2016 2015 Risk-free interest rate 1.43% 2.01% Expected life of options 7 years 7 years Expected volatility 21.12% 24.82% Expected dividend yield 5.33% 4.00%
Compensation expense is presented in the following table. Quarter ended April 30 Six months ended April 30
2016 2015 2016 2015
Compensation expense recorded for stock options 3 5 6 10
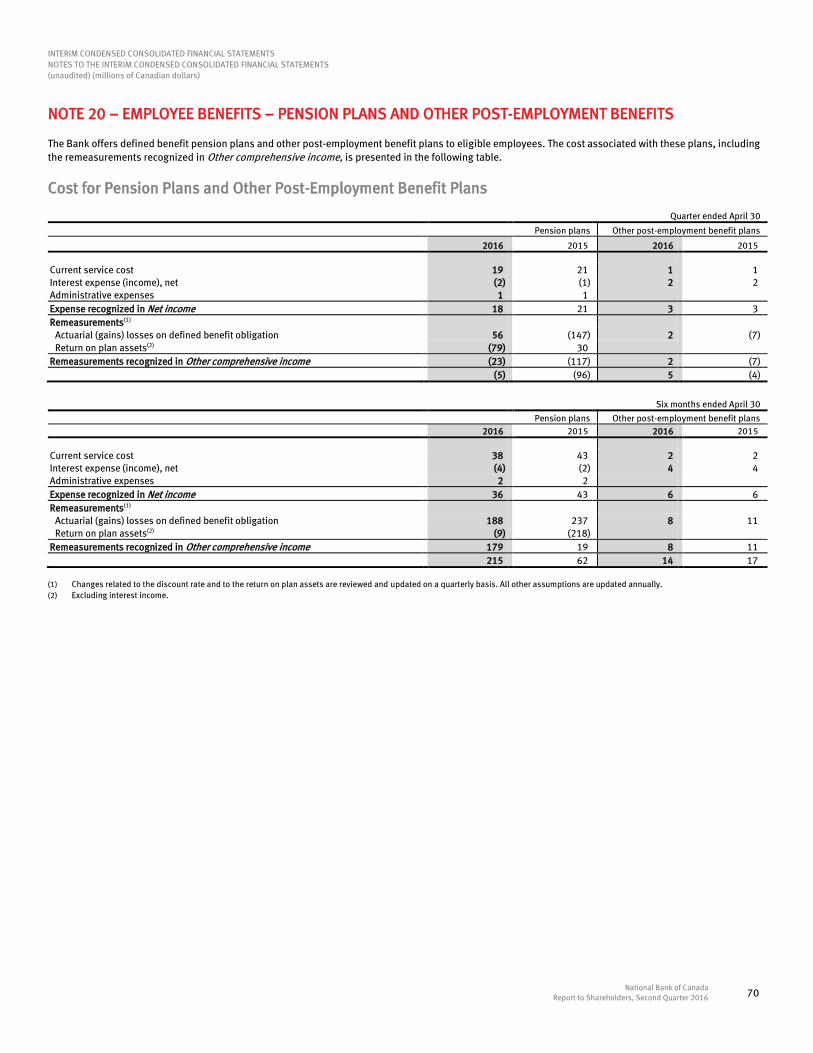
INTERIM CONDENSED CONSOLIDATED FINANCIAL STATEMENTS NOTES TO THE INTERIM CONDENSED CONSOLIDATED FINANCIAL STATEMENTS
(unaudited) (millions of Canadian dollars)
National Bank of Canada 70 Report to Shareholders, Second Quarter 2016
NOTE 20 – EMPLOYEE BENEFITS – PENSION PLANS AND OTHER POST-EMPLOYMENT BENEFITS The Bank offers defined benefit pension plans and other post-employment benefit plans to eligible employees. The cost associated with these plans, including the remeasurements recognized in Other comprehensive income, is presented in the following table.
Cost for Pension Plans and Other Post-Employment Benefit Plans Quarter ended April 30 Pension plans Other post-employment benefit plans
2016 2015 2016 2015
Current service cost 19 21 1 1 Interest expense (income), net (2) (1) 2 2 Administrative expenses 1 1 Expense recognized in Net income 18 21 3 3 Remeasurements(1) Actuarial (gains) losses on defined benefit obligation 56 (147) 2 (7) Return on plan assets(2) (79) 30 Remeasurements recognized in Other comprehensive income (23) (117) 2 (7) (5) (96) 5 (4)
Six months ended April 30
Pension plans Other post-employment benefit plans 2016 2015 2016 2015
Current service cost 38 43 2 2 Interest expense (income), net (4) (2) 4 4 Administrative expenses 2 2 Expense recognized in Net income 36 43 6 6 Remeasurements(1) Actuarial (gains) losses on defined benefit obligation 188 237 8 11 Return on plan assets(2) (9) (218) Remeasurements recognized in Other comprehensive income 179 19 8 11 215 62 14 17
(1) Changes related to the discount rate and to the return on plan assets are reviewed and updated on a quarterly basis. All other assumptions are updated annually. (2) Excluding interest income.

INTERIM CONDENSED CONSOLIDATED FINANCIAL STATEMENTS NOTES TO THE INTERIM CONDENSED CONSOLIDATED FINANCIAL STATEMENTS
(unaudited) (millions of Canadian dollars)
National Bank of Canada 71 Report to Shareholders, Second Quarter 2016
NOTE 21 – EARNINGS PER SHARE Diluted earnings per share is calculated by dividing net income attributable to common shareholders by the weighted average number of common shares outstanding after taking into account the dilution effect of stock options using the treasury stock method and any gain (loss) on redemption of preferred shares. Quarter ended April 30 Six months ended April 30
2016 2015 2016 2015
Basic earnings per share Net income attributable to the Bank’s shareholders 193 388 432 785 Dividends on preferred shares 16 11 24 23 Premium paid on preferred shares redeemed for cancellation − − 3 − Net income attributable to common shareholders 177 377 405 762 Weighted average basic number of common shares outstanding (thousands) 337,329 329,275 337,200 329,074 Basic earnings per share (dollars) 0.52 1.14 1.20 2.32 Diluted earnings per share Net income attributable to common shareholders 177 377 405 762 Weighted average basic number of common shares outstanding (thousands) 337,329 329,275 337,200 329,074 Adjustment to number of common shares (thousands) Stock options(1) 2,201 3,574 2,177 3,758 Weighted average diluted number of common shares outstanding (thousands) 339,530 332,849 339,377 332,832 Diluted earnings per share (dollars) 0.52 1.13 1.19 2.29
(1) For the quarter ended April 30, 2016, the diluted earnings per share calculation does not include an average number of 7,887,413 options outstanding with a weighted average exercise price
of $45.36 (3,170,260 options outstanding with a weighted average exercise price of $47.93 for the quarter ended April 30, 2015), as the exercise price of these options was higher than the average price of the Bank’s common shares. For the six months ended April 30, 2016, the diluted earnings per share calculation does not include an average number of 7,481,062 options outstanding with a weighted average exercise price of $45.36, as the exercise price of these options was higher than the average price of the Bank’s common shares. For the six months ended April 30, 2015, as the exercise price of the options was lower than the average price of the Bank’s common shares, no option was excluded from the diluted earnings per share calculation.

INTERIM CONDENSED CONSOLIDATED FINANCIAL STATEMENTS NOTES TO THE INTERIM CONDENSED CONSOLIDATED FINANCIAL STATEMENTS
(unaudited) (millions of Canadian dollars)
National Bank of Canada 72 Report to Shareholders, Second Quarter 2016
NOTE 22 – STRUCTURED ENTITIES A structured entity is an entity created to accomplish a narrow and well-defined objective and is designed so that voting or similar rights are not the dominant factor in deciding who controls the entity, such as when any voting rights relate solely to administrative tasks and the relevant activities are directed by means of contractual arrangements. Structured entities are assessed for consolidation in accordance with the accounting treatment described in Note 1 to the audited annual consolidated financial statements for the year ended October 31, 2015. For a detailed description of the Bank’s structured entities, see Note 28 to the audited annual consolidated financial statements for the year ended October 31, 2015. The Bank’s maximum exposure to loss resulting from its interests in these structured entities consists primarily of the investments in these entities, the fair value of the derivative contracts entered into with them, and the backstop liquidity and credit enhancement facilities granted to certain structured entities. In the normal course of business, the Bank may enter into financing transactions with third-party structured entities, including commercial loans, reverse repurchase agreements, prime brokerage margin lending, and similar collateralized lending transactions. While such transactions expose the Bank to the counterparty credit risk of the structured entities, this exposure is mitigated by the collateral related to these transactions. The Bank typically has neither power nor significant variable returns resulting from financing transactions with structured entities and does not consolidate such entities. Financing transactions with third-party-sponsored structured entities are included on the Bank's consolidated financial statements and are not included in the table accompanying this note. The following table presents the carrying amounts of the assets and liabilities relating to the Bank’s interests in non-consolidated structured entities, the Bank’s maximum exposure to loss from these interests as well as the total assets of these structured entities. As at April 30, 2016
Multi-seller
conduits(1) Master asset
vehicles(2) Investment
funds(3) Private
investments(4) Asset-backed
funds(5) NBC Capital
Trust(6)
Assets on the Consolidated Balance Sheet Securities at fair value through profit or loss 32 631 30 − − − Available-for-sale securities − 6 29 100 61 − Derivative financial instruments 7 − − − − − Other assets − − − − 8 − 39 637 59 100 69 − As at October 31, 2015 33 655 180 95 114 − Liabilities on the Consolidated Balance Sheet Deposits – Business and government − − − − − 225 Other liabilities − − − − − 4 − − − − − 229 As at October 31, 2015 − − − − − 229 Maximum exposure to loss Securities and derivative financial instruments 39 637 59 100 69 − Liquidity and credit enhancement facilities 2,397 − − − − − Margin funding facility − 821 − − − − 2,436 1,458 59 100 69 − As at October 31, 2015 2,266 1,476 180 95 114 − Total assets of the structured entities 2,453 − 176 3,206 70 230 As at October 31, 2015 2,283 − 1,243 3,648 144 234
(1) The main underlying assets, located in Canada, are residential mortgages, automobile loans, automobile inventory financings, and other receivables. As at April 30, 2016, the notional
committed amount of the global-style liquidity facilities totalled $2.4 billion ($2.3 billion as at October 31, 2015), representing the total amount of commercial paper outstanding. The Bank also provides series-wide credit enhancement facilities for a notional committed amount of $30 million ($30 million as at October 31, 2015). The maximum exposure to loss cannot exceed the amount of commercial paper outstanding. As at April 30, 2016, the Bank held $32 million in commercial paper ($22 million as at October 31, 2015) and, consequently, the maximum potential amount of future payments as at April 30, 2016 is limited to $2.4 billion ($2.2 billion as at October 31, 2015), which represents the undrawn liquidity and credit enhancement facilities.
(2) The total amount outstanding of restructured notes of the MAV conduits was $9.3 billion as at April 30, 2016 ($9.3 billion as at October 31, 2015). The undrawn margin funding facility amounted to $821 million as at April 30, 2016 ($821 million as at October 31, 2015).
(3) The underlying assets are various financial instruments and are presented on a net asset basis. Certain investment funds are in a trading portfolio. (4) The underlying assets are private investments. The amount of total assets of the structured entities corresponds to the amount for the most recent available period. (5) The underlying assets are automobile loans. (6) The underlying asset is a deposit note from the Bank. For additional information, see Notes 10 and 24.

INTERIM CONDENSED CONSOLIDATED FINANCIAL STATEMENTS NOTES TO THE INTERIM CONDENSED CONSOLIDATED FINANCIAL STATEMENTS
(unaudited) (millions of Canadian dollars)
National Bank of Canada 73 Report to Shareholders, Second Quarter 2016
The following table presents the Bank’s investments and other assets in the consolidated structured entities as well as the total assets of these entities. As at April 30, 2016 As at October 31, 2015
Investments
and other assets Total
assets(1) Investments
and other assets Total
assets(1)
Consolidated structured entities Securitization entity for the Bank’s credit card receivables(2)(3) 325 1,634 339 1,649 National Bank hedge fund managed accounts (Innocap platform)(3)(4) − − 23 23 Investment funds(5) 327 371 410 460 Covered bonds(6) 11,473 11,964 12,722 13,099 Building(7) 68 61 70 63 NBC Asset Trust(8) 1,125 1,897 1,125 1,900 Third-party structured entities(9) 1,099 1,099 1,395 1,395 14,417 17,026 16,084 18,589
(1) There are restrictions that stem mainly from regulatory requirements, corporate or securities laws and contractual arrangements that limit the ability of some of the Bank’s consolidated
structured entities to transfer funds to the Bank. (2) The underlying assets are credit card receivables. (3) The Bank's investment is presented net of third-party holdings. (4) The underlying assets are various financial instruments (trading portfolio). The total assets of the Innocap platform are presented on a net asset basis. (5) The underlying assets are various financial instruments and are presented on a net asset basis. Certain investment funds are in a trading portfolio. (6) For the covered bonds issued under the covered bond legislative program, the underlying assets are uninsured residential mortgage loans of the Bank. The average maturity of these underlying
assets is two years. For covered bonds issued under the structured covered bond program, the underlying assets are insured residential mortgage loans of the Bank. The average maturity of these underlying assets is two years. As at April 30, 2016, the total amount of transferred mortgage loans was $11.5 billion ($12.7 billion as at October 31, 2015), and the total amount of covered bonds of $7.8 billion was recognized in Deposits – Business and government on the Consolidated Balance Sheet ($7.9 billion as at October 31, 2015). For additional information, see Note 10.
(7) The underlying asset is a building located in Canada. (8) The underlying assets are insured and uninsured residential mortgage loans of the Bank. As at April 30, 2016, insured loans amounted to $160 million ($188 million as at October 31, 2015).
The average maturity of the underlying assets is two years. For additional information, see Note 16. (9) The underlying assets consist of equipment leased under operating leases.

INTERIM CONDENSED CONSOLIDATED FINANCIAL STATEMENTS NOTES TO THE INTERIM CONDENSED CONSOLIDATED FINANCIAL STATEMENTS
(unaudited) (millions of Canadian dollars)
National Bank of Canada 74 Report to Shareholders, Second Quarter 2016
NOTE 23 – SEGMENT DISCLOSURES Quarter ended April 30
Personal and
Commercial Wealth
Management Financial Markets Other Total
2016 2015 2016 2015 2016 2015 2016 2015 2016 2015
Net interest income(1) 465 440 91 81 262 285 (109) (156) 709 650 Non-interest income(1) 233 243 262 310 167 125 54 93 716 771 Total revenues 698 683 353 391 429 410 (55) (63) 1,425 1,421 Non-interest expenses 395 403 243 256 195 189 43 88 876 936 Contribution 303 280 110 135 234 221 (98) (151) 549 485 Provisions for credit losses(2) 315 56 2 1 − − − − 317 57 Income before income taxes (recovery) (12) 224 108 134 234 221 (98) (151) 232 428 Income taxes (recovery)(1) (3) 60 28 31 65 63 (68) (130) 22 24 Net income (9) 164 80 103 169 158 (30) (21) 210 404 Non-controlling interests − − − − 4 2 13 14 17 16 Net income attributable to the Bank's shareholders (9) 164 80 103 165 156 (43) (35) 193 388 Average assets 91,021 86,147 11,022 10,124 86,526 89,329 42,024 37,331 230,593 222,931
Six months ended April 30
Personal and
Commercial Wealth
Management Financial Markets Other Total
2016 2015 2016 2015 2016 2015 2016 2015 2016 2015
Net interest income(3) 940 890 180 164 498 523 (203) (262) 1,415 1,315 Non-interest income(3)(4) 482 485 529 570 218 305 70 156 1,299 1,516 Total revenues 1,422 1,375 709 734 716 828 (133) (106) 2,714 2,831 Non-interest expenses 805 807 493 498 385 365 96 129 1,779 1,799 Contribution 617 568 216 236 331 463 (229) (235) 935 1,032 Provisions for credit losses(2) 377 110 3 1 − − − − 380 111 Income before income taxes (recovery) 240 458 213 235 331 463 (229) (235) 555 921 Income taxes (recovery)(3) 65 123 56 58 121 128 (158) (207) 84 102 Net income 175 335 157 177 210 335 (71) (28) 471 819 Non-controlling interests − − − − 12 5 27 29 39 34 Net income attributable to the Bank's shareholders 175 335 157 177 198 330 (98) (57) 432 785 Average assets 90,765 85,521 10,983 10,156 88,122 89,491 41,542 35,526 231,412 220,694
(1) Net interest income and income taxes (recovery) of the business segments are presented on a taxable equivalent basis. Taxable equivalent basis is a calculation method that consists of
grossing up certain tax-exempt income by the amount of income tax that would have been otherwise payable. For the business segments as a whole, Net interest income was grossed up by $75 million ($123 million in 2015), Non-interest income was grossed up by $2 million (nil in 2015) and an equivalent amount was recognized in Income taxes (recovery). The effect of these adjustments is reversed under the Other heading.
(2) The provisions for credit losses for the quarter and six-month period ended April 30, 2016 include a $250 million sectoral provision on non-impaired loans recorded for the oil and gas producer and service company loan portfolio, presented in the Personal and Commercial segment.
(3) For the six months ended April 30, 2016, Net interest income was grossed up by $130 million ($186 million in 2015), Non-interest income was grossed up by $2 million (nil in 2015), and an equivalent amount was recognized in Income taxes (recovery). The effect of these adjustments is reversed under the Other heading.
(4) For the six months ended April 30, 2016, non-interest income includes the $164 million write-off of the equity interest in associate Maple Financial Group Inc., presented in the Financial Markets segment.
Personal and Commercial The Personal and Commercial segment encompasses the banking, financing, and investing services offered to individuals and businesses as well as insurance operations.
Wealth Management The Wealth Management segment comprises investment solutions, trust services, banking services, lending services and other wealth management solutions offered through internal and third-party distribution networks.
Financial Markets The Financial Markets segment encompasses banking services, investment banking services and financial solutions for institutional clients. The segment is also active in proprietary trading and investment activities for the Bank.
Other This heading encompasses Treasury activities, including the Bank’s asset and liability management, liquidity management and funding operations, certain non-recurring items and the unallocated portion of corporate services.

INTERIM CONDENSED CONSOLIDATED FINANCIAL STATEMENTS NOTES TO THE INTERIM CONDENSED CONSOLIDATED FINANCIAL STATEMENTS
(unaudited) (millions of Canadian dollars)
National Bank of Canada 75 Report to Shareholders, Second Quarter 2016
NOTE 24 – EVENTS AFTER THE CONSOLIDATED BALANCE SHEET DATE Acquisition of Advanced Bank of Asia Limited On May 16, 2016, the Bank completed the acquisition of Advanced Bank of Asia Limited (ABA), a major Cambodian financial institution that offers financial products and services to individuals and businesses. This acquisition is part of the Bank’s international growth strategy and, upon completion, brings the Bank’s common share equity interest in ABA to 90%. The sum of the $119 million cash purchase price, of the fair value of the previously held interest, and of the estimated value of the non-controlling interest established at the acquisition date exceeds the fair value of the net assets acquired by $125 million. This excess amount will be recorded on the Consolidated Balance Sheet as goodwill and mainly represents ABA’s expected business growth in Cambodia. The goodwill from this acquisition is not deductible for tax purposes. The acquired receivables, consisting mainly of personal and commercial loans, had an estimated acquisition-date fair value of $754 million. This amount also represents the gross contractual amounts receivable that the Bank expects to fully recover. The amount of the acquisition-related cost was negligible and included in Non-interest expenses in the Consolidated Statement of Income for the six-month period ended April 30, 2016. Had the Bank completed the acquisition on November 1, 2015, total revenues would have been approximately $2,744 million and net income approximately $480 million for the six-month period ended April 30, 2016. During the measurement period, the estimated fair values of all assets acquired and liabilities assumed may be retrospectively adjusted to reflect new information obtained about facts and circumstances that existed as at the acquisition date. The following table summarizes the estimated acquisition-date fair values of all assets acquired and liabilities assumed. Cash and deposits with financial institutions 356 Securities 54 Loans 754 Goodwill 125 Intangible assets 2 Other assets 30 1,321 Deposits 969 Other liabilities 86 1,055 Purchase price 119 Previously held interest 133 Non-controlling interest 14 266
Redemption of NBC Capital Trust Units On May 16, 2016, NBC Capital Trust, an open-end trust established by the Bank, announced its intention to redeem the 225,000 Trust Capital Securities – Series 1, or NBC CapS – Series 1, issued and outstanding on June 30, 2016 at a redemption price of $1,000 per trust capital security plus the unpaid distributions as at the redemption date of June 30, 2016. After the redemption, holders of NBC CapS – Series 1 will no longer be entitled to receive distributions or exercise any other rights. Given this redemption, the authorized but not issued Series 17 and 18 First Preferred Shares will be withdrawn from the Bank’s authorized capital, and the Bank will redeem the $225 million deposit note from NBC Capital Trust. For additional information, see Notes 13 and 28 to the audited annual consolidated financial statements for the year ended October 31, 2015.

INFORMATION FOR SHAREHOLDERS AND INVESTORS
Investor Relations Financial analysts and investors who want to obtain financial information on the Bank may contact the Investor Relations Department.
600 De La Gauchetière Street West, 7th Floor Montreal, Quebec H3B 4L2 Toll-free: 1-866-517-5455 Fax: 514-394-6196 Email: [email protected] Website: nbc.ca/investorrelations Public Affairs 600 De La Gauchetière Street West, 10th Floor Montreal, Quebec H3B 4L2 Telephone: 514-394-8644 Fax: 514-394-6258 Quarterly Report Publication Dates for Fiscal 2016 (subject to approval by the Board of Directors of the Bank)
First quarter February 23 Second quarter June 1 Third quarter August 31 Fourth quarter December 2
Disclosure of Second Quarter 2016 Results Conference Call — A conference call for analysts and institutional investors will be held
on Wednesday, June 1, 2016 at 1:00 p.m. EDT. — Access by telephone in listen-only mode: 1-866-862-3930 or
416-340-2217. The access code is 5882795#. — A recording of the conference call can be heard until June 30, 2016 by
dialing 1-800-408-3053 or 905-694-9451. The access code is 4441499#.
Webcast — The conference call will be webcast live at nbc.ca/investorrelations. — A recording of the webcast will also be available on National Bank’s
website after the call. Financial Documents — The Report to Shareholders (which includes the quarterly
consolidated financial statements) is available at all times on National Bank’s website at nbc.ca/investorrelations.
— The Report to Shareholders, the Supplementary Financial Information, the Supplementary Regulatory Capital Disclosure, and a slide presentation will be available on the Investor Relations page of National Bank’s website shortly before the start of the conference call.
Transfer Agent and Registrar For information about stock transfers, address changes, dividends, lost certificates, tax forms, and estate transfers, shareholders are asked to contact the transfer agent, Computershare Trust Company of Canada, at the address or telephone number below. Computershare Trust Company of Canada Share Ownership Management 1500 Robert-Bourassa Boulevard, 7th Floor Montreal, Quebec H3A 3S8 Telephone: 1-888-838-1407 Fax: 1-888-453-0330 Email: [email protected] Website: computershare.com Direct Deposit Service for Dividends Shareholders may elect to have their dividend payments deposited directly via electronic funds transfer to their bank account at any financial institution that is a member of the Canadian Payments Association. To do so, they must send a written request to the transfer agent, Computershare Trust Company of Canada. Dividend Reinvestment and Share Purchase Plan The Bank has a Dividend Reinvestment and Share Purchase Plan for Canadian holders of its common and preferred shares under which they can acquire common shares of the Bank without paying commissions or administration fees. Canadian participants acquire common shares through the reinvestment of cash dividends paid on the shares they hold or through optional cash payments of at least $500 per payment, up to a maximum of $5,000 per quarter.
For more information, shareholders may contact National Bank’s registrar and transfer agent, Computershare Trust Company of Canada, at 1-888-838-1407. To participate in the plan, National Bank’s beneficial or non-registered common shareholders must contact their financial institution or broker. Dividends The dividends declared by the Bank constitute eligible dividends pursuant to the Income Tax Act (Canada).