report submitted to the malawi vulnerability assessment
TRANSCRIPT

i
National Market Analysis Update to Inform the 2017/18
MVAC Food Security Response Options Main Report
Report Submitted
To
The Malawi Vulnerability Assessment Committee Ministry of Finance, Economic Planning and
Development, P.O. Box 30 136,
LILONGWE.

ii
Cover photos: Maize being kept at a ‘warehouse’ in Kasungu district and a
trader inspecting his maize at Liwonde market.
About the Consultants: The consultants are lecturers at the University of
Malawi’s Chancellor College comprising two economists (Dr. Patrick Kambewa
and Dr. Regson Chaweza) and a mathematician (Dr. Charles Fodya).
iii
Table of Contents
List of Tables ................................................................................................................................... v
List of Figures ................................................................................................................................ vi
List of Acronyms and Abbreviations .......................................................................................... vii
Acknowledgements ..................................................................................................................... viii
Executive Summary ...................................................................................................................... ix
1.0 Background...................................................................................................................... 1
1.2 Objectives of the Study ................................................................................................ 2
1.3 Organization of the Report .......................................................................................... 3
1.4 Study Limitations ........................................................................................................... 3
2.0 Methodology of the Study ............................................................................................. 5
2.1 Literature Review and Secondary data Collection .................................................... 5
2.2 Secondary data review ................................................................................................. 5
2.3 Primary Data Collection and Analysis ......................................................................... 5
2.4 Sampling of Respondents ............................................................................................ 6
2.5 Survey Process, Data Collection & Entry ................................................................... 8
2.6 Data Analysis and Report Writing ............................................................................... 9
3.0 Regional and National Food Security Context .......................................................... 10
3.1 Regional Food Security Situation .............................................................................. 10
3.2 National Economic and Food Security Context ....................................................... 11
3.2.1 National Economic Environment ....................................................................... 11
3.2.2 National Food Security Situation ....................................................................... 12
3.2.3 Available Food Stocks and Planned Stocks Purchases ................................... 14
3.3 Summary of Food Stocks ........................................................................................... 17
4.0 Trader Characteristics and Agri-Business Conditions .............................................. 18
4.1 Spread of Markets Visited for the Assessment ....................................................... 18
4.2 Respondent Traders Characteristics ......................................................................... 18
4.3 Business Environment and Commodities Traded ................................................... 19
4. 4 Summary of Findings for Trader Characteristics and Agri-business conditions . 23
5.0 Private Trader Food Trade Activities and Response Capacity ............................... 25

iv
5.1 Trends in Volumes of Maize Traded ......................................................................... 25
5.2 Respondents’ Experience and Expectations for the Maize Trade ........................ 28
5.3 Price Analysis of Maize ............................................................................................... 29
5.4 Integration of Main Markets ...................................................................................... 30
5.5 Maize Price Volatility Analysis .................................................................................... 32
5.6 Factors affecting Price Setting .................................................................................. 33
5.7 Commodity Handling and Access to Source and Destination Markets ................ 34
5.7.1 Mode of Transporting Commodities ................................................................. 34
5.7.2 Physical Access to Source and Destination Markets ...................................... 35
5.8 Status of Other Crops ................................................................................................. 36
5.9 The State of Vegetable Cooking Oil in the Markets ............................................... 38
5.10 Summary of Findings for Private Trader Food Trade Activities ............................ 40
6.0 Private Traders Response Capacity ........................................................................... 41
6.1 Traders’ Capacity Evaluation ..................................................................................... 41
6.2 Ownership of Storage Facilities and Quantity Stores ............................................. 42
6.3 Traders Experience with Selling on Loan ................................................................ 43
6.4 Summary of Findings on Trader Private Trader Food Trade Activities& Response
Capacity ........................................................................................................................ 43
7.0 The 2017/18 MVAC Response Options ............................................................................. 45
7.1 Recommended Response Options ............................................................................ 45
7. 2 Status of Markets Visited .......................................................................................... 45
7.2.1 Northern Region Markets ................................................................................... 45
7.2.2 Central Region Markets ...................................................................................... 46
7.2.2 Eastern and Southern Region Markets............................................................. 46
Bibliography ................................................................................................................................. 47
Appendix I: ................................................................................................................................... 48
Appendix II: Markets Visited and Their Type ................................................................................ 65

v
List of Tables
Table 1: A Comparison of 2016/17 Crop Production with the Previous Three Seasons . 13
Table 2: SGR Maize Receipts and Drawdown from July 2016 to July 2017 ................. 15
Table 3: Maize quantities being stored at various locations for ACE ............................ 16
Table 4: Number of Traders Interviewed per Commodity by Region ........................... 23
Table 5: Number of Traders and Maize Volumes Traded during the Previous Month and
Stocks expected to be sold in the Remaining Consumption Year.................. 26
Table 6: Maize Price per period by Region ............................................................... 30
Table 7: Correlation of Main Maize Markets in Malawi ............................................... 31
Table 8: Factors influencing the setting of Prices ..................................................... 34
Table 9: Main Customers to Traders ....................................................................... 35
Table 10: Estimated Number of traders of commodities by Region ............................. 36
Table 11: Current Stocks and Expected Stocks of Beans to be Sold ............................ 37
Table 12: Quantity of Maize Stored by Season.......................................................... 43

vi
List of Figures
Figure 1: Markets Visited during the Assessment ................................................................... 7
Figure 2: Malawi's Food, Non-food and National Inflations October 2016 to October
2017 ........................................................................................................................... 11
Figure 3: Source of Capital for Starting a Commodity Trading ............................................ 19
Figure 4: Average Distance covered by Traders by Region.................................................. 19
Figure 5: Source of Maize by Region ...................................................................................... 20
Figure 6: Type of Commodity Trading by Region ................................................................. 21
Figure 7: Number of Outlets per Trader per Region ............................................................. 22
Figure 8: Number of Commodities being sold per Trader by Region .................................. 22
Figure 9: Quantity of Maize Traders expected to sell for the remainder of the season ... 27
Figure 10: Trend of Maize Sales by Period.............................................................................. 28
Figure 11: Maize Price per Period ............................................................................................. 29
Figure 12: Nominal Average National Price (December 2015 – November 2017) ............ 32
Figure 13: Maize Price Volatility Analysis (December 2015 to November 2017) ............. 33
Figure 14: Mode of Commodity Transportation by Region ................................................... 34
Figure 15: Physical Access of Source and Destination Markets .......................................... 35
Figure 16: Current and Expected Price of Beans ................................................................... 37
Figure 17: Expected Stock levels to meet a 25% increase in Demand .............................. 41
Figure 18: Period within which Traders would re-stock to need a 25% increase in
demand ..................................................................................................................... 42

vii
List of Acronyms and Abbreviations
ACE Agricultural Commodity Exchange for Africa ADMARC Agricultural Development and Marketing Corporation AfDB African Development Bank AMIS Agricultural Marketing and Information System CBT Cash Based Transfers CISANET Civil Society for Agriculture Network DADO District Agricultural Development Office DfID Department for International Development DoDMA Department of Disaster Management Affairs FAM Fall Army Worm GTPAM Grain Traders & Processors Association of Malawi HEA Household Economy Approach IFPRI International Food Policy Research Institute IMF International Monetary Fund INGO International nongovernmental organization IPC Integrated Food Security Phase Classification MDRRP Malawi Drought Recovery and Resilience Project MDTF Multi Donor Trust Fund MFERP Malawi Flood Emergency Relief Program MT Metric Tons MVAC Malawi Vulnerability Assessment Committee mVAM Mobile Vulnerability Analysis and Mapping NFRA National Food Reserve Agency NGO Non-governmental organization RVAC Regional Vulnerability Assessment Committee SADC Southern African Development Community SGR Strategic Grain Reserve TA Traditional Authority UN United Nations USAID United States Agency for International Aid USD United States Dollar WFP World Food Program

viii
Acknowledgements
The consultants wish to acknowledge, with appreciation, the contribution several
individuals made in coming up with this report. The support and guidance from
the Malawi Vulnerability Assessment Committee under the leadership of its Chair,
Mrs. Victoria Geresomo, is very much highly appreciated. The past experiences
of other members, specifically, the Technical Advisor of MVAC, key members
from the World Food Programme (WFP), Ministry of Finance, Economic Planning
and Development, OXFAM, Civil Society for Agriculture Network (CISANET), Rab
Processors Malawi Limited, Agricultural Commodity Exchange (ACE), Agricultural
Marketing Development Corporation (ADMARC), the National Food Reserve
Agency (NFRA) and others made a significant input in the course of carrying out
this work. The Consultants would also like to thank the research assistants for
their dedication and sacrifice.
This study benefitted from funds provided by the Department for International
Development (DfID), through the SADC Regional Vulnerability Assessment and
Analysis Programme and the World Food Program, Johannesburg Regional
Bureau. This work could not have materialized without the input of 673 private
commodity traders from all districts of Malawi with the exception of Likoma
district due logistical challenges. While all efforts were undertaken to correctly
represent what we got in the field, all errors and misrepresentations of facts
contained herein are the responsibility of the consultants. Names and pictures of
persons are appearing in this report with owners’ consent.

ix
Executive Summary
Introduction
This assignment was an update to the market assessment that was carried out in June-
July 2017 as part of the Malawi Vulnerability Assessment Committee’s activities towards
the Integrated Food Security Phase Classification process. It was carried out in the
month of November 2017 and covered all districts of the country except Likoma in the
north. A total of 673 traders were interviewed.
During the assessment, it was noted that Malawi had a maize surplus of 100,000 MT
and that from July to October, ADMARC was buying maize. In November Government
lifted the maize export ban. The recommendation from the June-July assessment was
that all districts with population in Phase should be targeted for cash-based transfers.
This meant that the following districts were left out for assistance: Dowa, Chitipa,
Dedza, Dowa, Mchinji, Ntchisi, and Salima.
At the time of the update, the National Food Reserve Agency had about115,000MT of
maize while ADMARC reported to have over 100,000 MT. Two private trading entities
namely Rab Processors Limited and Agricultural Commodity Exchange had 32,978MT.
The rate of inflation continued to fall during the July-October period.
Main Findings
1. Trader Characteristics and Agri-business Conditions
The average distance that traders travelled to sell produe was the longest in the south
and shortest in the eastern region. This result is similar to the findings of the June-July
assessment and it was concluded then that traders from the south were going to
other regions, predominantly the centre, to get maize. Markets in Ntcheu
were the most common source markets mentioned by traders in the south.
Unlike the June-July assessment, the November update showed that traders from the
centre had the shortest average distance than the rest. It was observed that, in the
north and centre, most traders interviewed were in the source markets unlike traders in
the east and south who were at destination markets. During the June-July
assessment, it was observed that most traders preferred quantity measure for
buying and selling maize i.e. use of a cup or tins as confidence of scales is
normally low on the markets. This was still the case in the other regions except
the central region where use of scale was more common.

x
For the border districts, the price of maize in Malawi was higher than its surrounding
neighbors of Zambia and Mozambique. Consequently, maize in the border districts was
being informally imported. The direction of trade between Malawi and Tanzania,
specifically at the Songwe border, was not clear i.e. whether maize was going into
Tanzania or the reverse.
2. Private Trader Food Trade Activities and Response Capacity
Most respondents interviewed were involved in both retail and wholesale. This is unlike
in June-July where retail trading was the most common in all regions. A comparison of
maize being bought and sold by traders showed that traders in the east and south sold
more maize than they bought during the July-October period while the reserve was the
case for the centre and north. The volume sold in the south was almost double what
was bought during the same period. In Comparing the volumes sold it was found that
the centre had the highest quantity bought than the rest while the south had the largest
quantity sold. Traders from the north and centre indicated that they expected to sell
about an average of 9 tons of maize per trader for the remainder of the season.
With the exception of the south, respondents from the other regions indicated that
trading decreased during the July-October period and they expected trading to increase
during the remainder of the season.
The June-July assessment projected that the prices were to increase to an average of
K230/Kg in the north, K208Kg in the south, K194 in the east and K178 in the centre. In
this update, the average prices were lower than the projected as follows: north (90/kg,
centre K87 per kg, east K101 per kg and south K114 per kg). These prices were also
lower than the FEWSNet forecast price of K180/Kg. Price volatility was assessed to be
stable for the July-October period.
Use of vehicles was the major form of transportation reported in all regions. Access to
source and destination markets was generally rated as good to excellent in all regions.
Trade was done with local people (a majority) followed by fellow traders.
For the other commodities, beans was second to maize with the central region having
the largest stock and also expecting to sell the largest quantity for the remainder of the
season. Apart from the eastern region, the prices were expected to increase for the
remainder of the consumption season. In the east, prices were expected to decrease
during the January-March period. Vegetable cooking oil was either dominated by local
or imported brands depending on the region. In the southern and eastern regions,
imported brands from Mozambique dominated the local brands while in the centre and
north the local brands were dominant. The prices of the commodity had decreased
during the July-October period and this was due to the removal of the VAT by

xi
government and low prices of imported brands. There was also presence of non-
branded products on the market.
3. Private Traders’ Response Capacity
Respondents were asked to indicate whether they would be able to cope with a 25
percent increase in demand and a majority (north 86%, centre 83%, east 81% and
south 77%) said they would be able to cope. The increase in stock to enable them cope
ranged from 42 percent in the north, 54 percent in the centre, 52 percent in the south
and 62 percent in the east. The period they would be able to respond was less than 2
weeks for all regions. Ownership of storage facilities was generally low with 54 percent
of the traders in the east reporting to own the facilities and the other regions reporting
lower figures as follows: north 27 percent, centre 22 percent and south 27 percent.
During this assessment period, most traders sold on credit than during the June-July
assessment. The south was at 63 % while the east was at 58 %, centres 28 % and
north was at 41 %. The amount of credit ranged from K15,632 from the east to
K32,276,520 reported in the central region. Experience with selling commodity on loans
ranged from 50 % in the south to about 25 % in the other regions.
4. The 2017/18 MVAC Response Options
The June-July assessment recommended that humanitarian assistance should be
on cash-based transfers. This was based on the fact that for the affected TAs,
the caseloads were less than 50,000 and the markets were functioning with low
prices. Furthermore, physical access of the markets was assessed to be good
and excellent therefore in case of any emergency maize should be able to be
transported to the affected areas. This update has observed the following:
1. The market prices are still low in many areas with traders having some
maize in stock
2. ADMARC and the NFRA have been active, on the market, such that in case
of emergency they should be able to offload maize on the market.
3. Physical access to most markets is still being assessed to be good and
excellent.
Based on these observations, this update is recommending that the cash-based
response made in the June-July period should be maintained.

1
1.0 Background
This work is a follow up to a full market assessment that was carried out in June-
July 2017 in all districts of the country except Likoma district in the north. In the
June-July assessment, a recommendation was made that all areas with
populations in IPC Phase 3 be assisted using cash-based transfers. This included
all districts in country except Likoma. The basis of this recommendation is that
the country had harvested surplus maize and that markets were functioning as
the market assessment had shown. This update was therefore aimed at
appraising the extent to which the assumption of market functionality was still
holding.
Findings from the 2017 pre-harvest assessment conducted by Malawi
Vulnerability Assessment Committee (MVAC) in March pointed to a rebound
in maize production, especially in southern and central areas, compared to the
previous cropping season. Furthermore, the third-round crop estimates
forecasted maize production of 3.46 million metric tons, an increase of
46.2 percent compared to the same round last year. In July, this implied that
there is a projected national surplus of about 100,000 metric tons maize over the
requirement for human consumption, seed, and industrial use and feed.
However, it (the report) notes that a fall armyworm (FAW) infestation was
reported in almost all districts across the country. In January, Government
reported that 2,000 hectares of crop was affected in nine of the country’s 28
districts1. Another report indicated that the FAW affected the following ADDs;
Blantyre, Machinga, Kasungu, Mzuzu and Karonga2. Another report shows that
enormous infestations were noted in the districts of Salima, Balaka and
Chikwawa3.
1 http://www.reuters.com/article/us-malawi-grains-armyworm/malawis-armyworm-outbreak-destroys-
2000-hectares-minister-idUSKBN14Y0DK
2 http://www.mw.one.un.org/fao-partners-team-up-against-fall-armyworm-outbreak-in-malawi/
3 http://allafrica.com/stories/201708070641.html

2
1.2 Objectives of the Study
The overall objective of the assessment was to update the market
functionality so as to provide key recommendations to humanitarian actors with
essential information for decision-making in the context of deploying cash,
voucher and/or in-kind transfers or a combination of the above transfer
modalities during the remaining months of the consumption period.
More specifically the study:
1. Identified and sketched the supply chain of key staple commodities
that are critical to food security of vulnerable households.
2. Analyzed the historic and current availability of staple food
commodities on local markets, including potential recent changes and
patterns of seasonality.
3. Analyzed the overall market environment in which food commodity
trade takes place, including relevant government policies and regulations,
the (current) socio-political situation, security, road and transport
infrastructure;
4. Described the market structure in terms of actors and institutions of
relevant supply chains, barriers and constraints to enter trade or
maintain and increase levels of supply, as well as market catchment areas.
5. Analyzed the market conduct, i.e. price setting behaviors, weights and
standards including the transparency of transactions, competition and
potential corruptive behavior.
6. Identified key market outcomes such as seasonality and volatility patterns
of prices, market integration with supply sources, including physical flow
of commodities.
7. Analysed the market’s potential for responding to demand increases,
e.g. storage facilities, duration of stocks, stock replenishment lead-time,
and expected price developments due to increased levels of demand. And
to determine any potential inflationary risks associated with increased
local demand arising from the use of market based interventions.
8. Provided/collected price data and develop price scenarios for different
food commodities to be used in developing potential food baskets and
transfers values, and to support cost efficiency/effectiveness analysis, that
can facilitate decisions if and when to switch between different transfer
modalities or food baskets depending on seasons.
9. Analyzed affected populations’ demand conditions: their physical and
economic access to local markets (including inflation patterns of food

3
and non-food commodities, households’ purchasing power, livelihood and
market participation behaviors, self-sufficiency and resilience statuses, and
preferences).
10. Formulated and mapped food market related recommendations on
i)suitable areas, ii) periods of the year and iii) scale conceivable to
support either cash/voucher or in kind based interventions as well as iv)
how to address identified bottlenecks for traders to meet increased
demand and strengthen respective supply chains.
11. Mapped out potential irregular factors that may affect normal seasonal
trends of market behavior.
1.3 Organization of the Report
The rest of the report is organized as follows. Chapter 2 presents methodology,
survey process and data analysis approaches that were used in conducting this
assessment. Chapter 3 presents a regional and national food security context for
the 2017/18 consumption year. Chapter 4 discusses the trader characteristics
and the agri-business environment from the assessment. The activities that
traders undertake and their capacity to respond to a change in demand are
presented in Chapter 5. In the same Chapter, projected prices from the survey,
FEWSNet and Consultant’s own calculations are presented. Chapter 6 presents
the traders’ response capacity and their experience with the use of other trade
instruments such as loans, vouchers and coupons. Chapter 7 presents the
proposed 2017/18 MVAC response options given the IPC results and the market
assessment. The report concludes with Chapter 8.
1.4 Study Limitations
Compared to previous studies, the current assignment had a high number of
respondents. Lessons learnt from previous surveys might have contributed to
this high figure of respondents. However, the problem of having two markets
with same market day within a district and therefore having to choose which
market to visit on the said market day and leave out the other, still posed a
challenge. Secondly, a week before fieldwork commenced, the Agricultural
Development and Marketing Corporation (ADMARC) announced that it had
sourced funds amounting to K7.5 billion, from government, for the purchase of
maize at K170 per kg. It was going to purchase about 39,000 metric tons. At
the same time, the National Food Reserve Agency (NFRA) was buying maize at

4
its depot at K130 per kg. Unlike during the June-July assessment, some
members of the Grain Traders and Processor Association of Malawi (GTPAM),
notably Rab Processors Malawi Limited and Agricultural Commodity Exchange
(ACE) managed to avail themselves for interviews.

5
2.0 Methodology of the Study
The assessment used a mixed methods approach. These ranged from individual
interviews with commodity traders, key informant interviews, and analysis of
secondary data. The study team was instructed to check with local sources and
most importantly the district agricultural office to identify key markets in the TAs
in a given district. At least one key market per TA was sampled and in most
cases, one key market served several TAs and in some cases including those
from an adjacent district. However, if there were numerous key markets that
were operating in a given TA, two key markets utmost were sampled.
2.1 Literature Review and Secondary data Collection
Secondary literature review was conducted for various food and nutrition security
assessments, market assessment reports, external supply/value chain
assessments, economic and financial reports, policy documents and briefs, and
other regulatory documents. The assessment report includes MVAC reports, UN
and INGO reports. These comprised both national and regional documents.
2.2 Secondary data review
a. Analysis of maize price was done to identify seasonality, market
integration and undertake price forecasting. The data used was from
Agriculture Marketing and Information System (AMIS) for price
forecasting, mobile Vulnerability Analysis and Mapping (mVAM)
conducted by WFP for developing seasonality trends and FEWSNEt data
for assessing market integration. Interviews were also conducted with
FEWSNet who ,at the time of the study, were conducting cross-border
trade between Malawi and its neighbors.
b. Analysis of the regional supply chain, trade networks, price controls and
stock levels.
2.3 Primary Data Collection and Analysis
Data was collected in both primary and secondary (i.e. accessible and remote)
markets that serve food insecure populations in form of trader surveys using
market questionnaires (Appendix I), focus group discussions as well as with key
informants. The coverage for data collection was in key markets in the TAs as
advised at the district level.

6
The questionnaire included modules on supply, trade volumes, transportation,
storage, market response capacity and trader constraints. In addition, the need
to estimate the lead time of maize purchase, more especially the need to change
modality from cash/voucher to in-kind or vice versa. The module used in the
June-July assessment was adapted in order to identify what had changed from
the July period to the time of the interviews and what the expectations were for
the remainder of the season, specifically, January to March period.
Apart from the direct actors in the maize market (traders-plans and stocks,
transporters, NFRA, ADMARC, ACE, OXFAM), the key informants included
humanitarian actors that form the cash working group.
2.4 Sampling of Respondents
Interviews with key informants included traders of food commodities
(wholesalers, retailers and growers selling their own produce) and buyers of the
food commodities from the affected areas, namely, ADMARC, NFRA, District
Agriculture Development Officers and transport operators ferrying food
commodities, among others, at the markets in the affected areas. Interviews
were also conducted in key source markets. See figure 1.

7
Figure 1: Markets Visited during the Assessment

8
The survey included a sample of remote areas and interviewed traders. This
entailed interviewing traders in tiny markets where traders were selling a few
tins of maize. While a majority of the trading involved traders who were
aggregating the maize in some areas, vendors were buying to sell to other
traders outside the area as well as selling to consumers within the vicinity. This
was observed in areas that are near urban centers and food deficit areas such
as the Lower Shire. It involved talking to the people living in these areas and
asking them how food availability and prices change from the June-July period
to the time of the survey and what their expectations were for the remainder of
the season.
2.5 Survey Process, Data Collection & Entry
Four teams of 16 research assistants (four in each team) and four supervisors
were assembled to assist with data collection. The questionnaire for the June-
July Market Assessment Study 2017-2018 consumption year was adapted for use
in this survey. Training for this activity was done from 9th to 10th November, 2017
at Crossroads Hotel in Lilongwe City. Training involved going through the
questionnaire, question by question and in vernacular. Where appropriate,
changes were made to improve the efficiency of the tool. The research
assistants were also trained on how to use the Android tablets to collect data.
This was followed by pretesting at Nsundwe market which is 20 km on the
Lilongwe Mchinji road on the last day of training.
The four teams were assigned to four zones namely the northern zone team
which interviewed all districts in the north except Likoma but included Kasungu.
The central region team visited all districts in the region except Kasungu and
Ntcheu. The eastern team was responsible for districts of Ntcheu, Balaka,
Mangochi, Machinga, Zomba, Chiradzulu and Phalombe4. The southern team
visited the districts of Blantyre, Neno, Mwanza, Chikwawa, Nsanje, Thyolo and
Mulanje.
Using the tablets, data was uploaded on the WFP server and made available to
the consultants in Microsoft Excel Program. The coordinates collected during
4 In the analysis, the districts of Chiradzulu and Phalombe are appearing under the South.

9
interviews were entered into the GIS to produce maps showing all markets
visited and the attendant road networks.
2.6 Data Analysis and Report Writing
Initial analysis was conducted using Microsoft Excel program and the Statistical
Package for Social Scientists (SPSS Version 20). Further analysis was done by
plotting the coordinates of markets visited onto the Malawi map in order to show
the coverage of the study and access of the markets. The main analysis was
done using frequencies and means. Initial results were presented and discussed
at a workshop convened at Hippo View Lodge in Machinga district from 13th to
14th November 2017. Reports from the teams covered the number of markets
visited, the trends and dynamics of commodity trade observed and forecast for
the rest of the season. The workshop was attended by team leaders and
supervisors from the respective zones, the consultants and some MVAC
members. Preliminary findings from the field were discussed and
recommendations were made to be taken on board when writing the final report.

10
3.0 Regional and National Food Security Context
3.1 Regional Food Security Situation5
The June-July SADC Regional Vulnerability Assessment and Analysis (RVAA)
Synthesis Report showed that the central and southern parts of the SADC region
received above normal rainfall during the 2016/17 rainfall season (SADC, 2017).
The report further indicated that a new pest, the fall army worm6 (FAW) invaded
11 countries in the region but this was suppressed by the excessive rainfall
between the months of January and March 2017. Flooding occurred due to
cyclones namely Dineo for Botswana, Mozambique and Zimbabwe, and Cyclone
Enawo for Madagascar, Angola, Malawi, Namibia and South Africa. Some parts
of the region received rainfall below average. The areas that were affected are
central and western Angola, north-eastern Tanzania, much of Madagascar and
western South Africa.
Data from ten member states excluding DR Congo, Madagascar, Mauritius,
Namibia and Seychelles showed that the region had 43.22 million MT of cereal
production for the 2017/18 consumption year compared to 28.03 million MT the
previous season. This represents a 54% increase over the previous year.
Angola, South Africa, Zambia and Zimbabwe almost doubled their production
compared to the previous year. Cereal production for Lesotho and Swaziland did
not change much. The supply-demand analysis from ten countries (Angola,
Botswana, Lesotho, Malawi, Mozambique, South Africa, Swaziland, Zambia and
Zimbabwe) shows that the region has an overall surplus of 8.5 million MT for the
2017/18 consumption year. This is in comparison to the deficit of 9.3 million MT
the previous year. The only countries that reported a cereal deficit are Lesotho,
Swaziland and Botswana.
Because of the favorable situation, international cereal imports have ceased.
Maize prices have been decreasing in most countries. With the exception of
Zambia and Tanzania, the other countries had below average prices with Malawi,
Mozambique and South Africa being the cheapest in USD terms. For the
2017/18 consumption year, surpluses from within the region are expected to
5 Much of the facts reported here were extracted from the SADC report cited in the section.
6 Spodoptera frugiperda, is a migratory pest, a native of Americas and it prefers grass species such as
maize, wheat, rice and sugarcane.

11
flow towards food deficit countries within the region. South Africa and Zambia
are expected to export internationally to such countries as those in the east
African region. Malawi government lifted its maize export ban during the first
week of November 2017.
3.2 National Economic and Food Security Context
3.2.1 National Economic Environment
In 2016, economic activity was low at 2.7% from 3.3% in 2015. This followed
the floods caused by La Niña weather pattern in 2015 and prolonged dry spells
due to El Niño in 2016 (Malawi Government, 2017). The agricultural cumulative
output reduced by 35% in 2016. The other major sectors; manufacturing,
energy and water also declined during this period. According to the Budget
Statement of 2017, the Malawi Government noted that signs of recovery started
showing in the second half of 2016 when the inflation started declining during
the 2016-17 season (Malawi Government, 2017). The Graph below shows trends
in Malawi’s inflation and Malawi’s food inflation.
Figure 2: Malawi's Food, Non-food and National Inflations October 2016 to
October 2017
Inflation rates and specifically, food inflation has been declining from October
2016 to October 2017. The decline of inflation rates is mainly affected by the
decline in maize prices over the period and also the fact that the 2016/2017
0
5
10
15
20
25
30
Oct Nov Dec Jan Feb Mar Apr May Jun Jul Aug Sep Oct
OverallInflation FoodInflation NonFoodInflation

12
maize was being harvested during the months of April to July 2017. During the
second half of the 2016/17 consumption season, inflation reduced because the
Government imported maize. The exchange rate remained fairly stable in the
second half of 2016 up to May 2017 depreciating by only 2.0 percentage points
against the US dollar between June 2016 and mid May 2017 (Malawi
Government, 2017).
During the 2017 period, the World Bank resumed its budgetary support to
Malawi Government following confirmation by the IMF that the country is on
track in its pursuance of fiscal management reforms. The European Union’s
budgetary support was also resumed in the same period. The Reserve Bank of
Malawi reduced its policy rate from 27 percent at its peak to 22 percent in March
2017. In July, the Reserve Bank further reduced the base rate to 18 percent
resulting in some commercial banks reducing their interest rates. Commercial
banks which initially had taken a wait and see approach i.e. those that did not
reduce their interest rates as a result of the Reserve Bank’s reduction of the bank
rate have since reduced their rates.
3.2.2 National Food Security Situation
The MVAC report for the 2016/17 rain season notes that Malawi received normal
to above normal rainfall, for the country as a whole, although there was a delay
of onset of rainfall in the north. The late onset in the north had no impact on
overall agricultural production. There were minor floods in some parts of the
country such as Karonga and this increased the water levels to support rice
production.
Dry spells were experienced in the south especially in Nsanje, Machinga and
Zomba districts. In the centre, there was a dry spell in Dedza. This lasted 2
weeks but was not destructive.
There was above average production of most crops, except tobacco. Maize
production increased by 6% compared to 5-year average. As a result of the poor
tobacco prices for last year, farmers shifted to producing soybeans such that
hectarage planted to soybeans increased by 23% with that of tobacco falling by
42%7. Fall army worm attacked maize in all regions with varying intensities and
7 Calculations from APES data

13
the north was mostly affected due to late onset of rains. The affected districts in
terms of low tobacco production included Lilongwe, Kasungu, Ntchisi, Dowa, and
Mchinji in the centre and Rumphi and Mzimba in the north.
The 2017/18 consumption year is more promising than the previous two years as
shown in the table below. This table was also presented in the June-July
assessment.
Table 1: A Comparison of 2016/17 Crop Production with the Previous Three Seasons
Commodity
Rainfall Season
2013/14
Final
Estimates
2014/15
Final
Estimates
2015/16
Final
Estimates
2016/17
Final
Estimates
%
Change of
the
previous
year
Maize 3,978,123 2,776,277 2,369,493 3,464,139 1.46
Rice 132,002 108,690 83,711 121,079 1.45
Cassava 5,102,692 5,012,763 4,996,843 4,960,558 0.99
Sweet
Potato 4,209,699 4,324,873 4,463,710 5,472,013 1.23
Irish Potato 1,023,981 1,065,833 1,043,338 1,226,603 1.18
Sorghum 93,187 79,327 58,192 90,370 1.55
G/nuts 397,503 296,497 274,8760 386,319 1.41
Pulses 716,163 711,354 723,133 958,898 32.6
Beans n/a 188,745 157,769 198,486 25.8
Pigeon peas n/a 335,165 371,114 470,653 26.8
Soya beans n/a 120,952 136,910 208,556 52.3
Sources: Crop estimates from Agricultural Marketing Information System,
Ministry of Agriculture, Irrigation and Water Development
The production of the major food commodities of maize and rice increased by
almost 50% than the previous year. Production of maize generally increased in
all areas. While hectarage of maize increased by only 2% nationwide,
production increased by 46 % implying that much of the increase in production
was as a result of increased productivity i.e. output per unit area. Apart from

14
maize, the production of alternative or supplementary food commodities has
tremendously increased this year. While production of cassava almost remained
the same, the other important food crops had increased in production as follows:
sweet potatoes (23%), Irish potatoes (18%), sorghum (55%) and groundnuts
(41%).
Given that the national requirement of maize is estimated at 3.37 million MT, and
the production this year is 3.5 million MT, the country has a crude surplus of
about 130,000 MT. According to MVAC IPC analysis, the estimated population
that is in IPC Phase 3 and requiring humanitarian response is estimated at
1,043,000 people. This is in sharp contrast to last year where 6.7 million people
were food insecure due to effects of the El Nino. Given that there is food
surplus, any assistance to be given to food deficit households will not require
food imports.
3.2.3 Available Food Stocks and Planned Stocks Purchases
Table below shows the state of the strategic grain reserve (SGR) as at
11November 2017. The available balance at SGR was over 115,640.83 MT.
ADMARC reported to have over 100,000 MT.

15
Table 2: SGR Maize Receipts and Drawdown from July 2016 to July 2017
Depot Total SGR (MT) SGR Draw-downs (MT) Total Drawdowns
(MT)
SGR Losses
Dust/Chaff (MT)
Actual SGR
Balance (MT)
Committed Balance
(MT) Available Balance (MT)
Carryover stock 1/7/17
2017/18 SGR Receipts Total SGR DODMA WFP/DODMA ADMARC
1. Lilongwe 26,228.24 65,105.45 91,333.69 0.00 0.00 0.00 0.00 32.77 91,300.92 0.00 91,300.92
2. Kazomba 4.892 2,983.34 2,988.23 0.00 0.00 0.00 0.00 0.00 2,988.23 0.00 2,988.23
3. Mangochi 0 4,744.85 4,744.85 0.00 0.00 0.00 0.00 0.00 4,744.85 0.00 4,744.85
4. Mzuzu 0 0.00 0.00 0.00 0.00 0.00 0.00 0.00 0.00 0.00 0.00
5. Limbe 14.04 13,984.25 13,998.29 0.00 0.00 0.00 0.00 0.00 13,998.29 0.00 13,998.29
6. Luchenza 0 0.00 0.00 0.00 0.00 0.00 0.00 0.00 0.00 0.00 0.00
7. Bangula 0.866 2,607.67 2,608.54 0.00 0.00 0.00 0.00 0.00 2,608.54 0.00 2,608.54
Total 26,248.04 89,425.56 115,673.60 0.00 0.00 0.00 0.00 32.77 115,640.83 0.00 115,640.83
Source: National Food Reserve Agency. November 2017

16
The SGR has seven storage facilities in Lilongwe (Kanengo silos), Mzimba
(Kazomba silos), Mangochi, Mzuzu, Limbe, Luchenza and Bangula. As at July 1st
2017, the SGR had maize stocks amounting to about 26,248.04 MT at Kanengo,
Kazomba, Limbe and Bangula facilities. Since the beginning of the consumption
year, the NFRA has bought maize amounting to 89,425.56 MT being kept in all
its warehouses except Mzuzu and Luchenza. Bangula is in Nsanje district and
this district did not produce surplus maize. It is therefore a good conclusion to
make that much of the maize is due to cross border trading with Mozambique.
As at the beginning of November, no draw downs had been effected. Taking
losses into account, the maize stock being held at the SGR was 115,640.83.
During the assessment period maize purchases were still on-going.
Other traders namely, Rab Processors Malawi Limited and Agricultural
Commodity Exchange Africa reported to be keeping maize stocks. ACE was
selling and buying maize at K73 per Kg and had maize stored at locations and
quantities shown in table3 below
Table 3: Maize quantities being stored at various locations for ACE
Location Quantity (MT)
1. Balaka 5
2. Kasungu 340
3. Ezondweni (Mzimba) 110
4. Nsalu (Lilongwe) 250
5. Mulanje 14
6. Nathenje (Lilongwe) 62
7. Ntchisi 130
8. Salima 67
Total 978
It was reported that Rab Processors Malawi Limited had two storage points in
Lilongwe (15,000 MT) and Blantyre (17,000 MT) making a total of 32,000 MT.
The selling price of maize was K130 per kg. When the update was being

17
conducted, Rab had stopped buying maize. The update therefore has
established that as of the first week of November 2017, Malawi had official stock
levels of about 250,000 MT. It should be noted that ADMARC and NFRA were still
buying maize.
ADMARC was mainly buying maize from the central region and the eastern and
southern region are traditionally their selling points. Overall, ADMARC has 337
permanent markets which it can scale up to 700. In case of maize shortage, the
selling points can reach 1,000 points.
3.3 Summary of Food Stocks
The regional food situation has improved over the previous year such that save
for a few countries, most countries in the region will be food self-sufficient. The
region expects to export maize especially to the east African region. For Malawi,
production of major food crop increased over the previous year. From maize
imports of last year, there is potential to export. The government started
restocking its SGR such that at the assessment period, the stocks had increased
to over 115,000 MT implying a restocking of about 90,000 MT. ADMARC reports
to have 100,000 MT in its warehouses. Additionally, government had made
funds available for ADMARC to purchase maize from the market. From the
GTPAM, ACE reported to have 978 MT and Rab processors have 32,000 MT.
Government had lifted an export ban early November, 2017.

18
4.0 Trader Characteristics and Agri-Business Conditions
4.1 Spread of Markets Visited for the Assessment
While the assessment did not endeavor to cover all the markets and traders, an
attempt was made to cover the major markets in each TA. Information from the
District Agricultural Development Offices (DADO) guided this process. Figure
below shows the market points that were visited.
The map above shows that most markets visited were in the central, east and
southern regions with very few in the north. It was suspected that there were
few markets in the north trading in maize, on the account that they had just
started harvesting, therefore trading was yet to pick. Additionally, the lower
population in the region would suggest that maize is not traded as much as in
the other regions where food deficit households tend to traditionally rely on the
market.
4.2 Respondent Traders Characteristics
This section presents selected characteristics of traders that were interviewed
during the nationwide market survey. In all, 673 traders were interviewed. A
majority of the respondents were from the central region accounting for over 51
percent of the respondents.
Two major sources of capital for starting commodity trading were profit from
other businesses and farming dominated in the north and eastern regions while
traders in the central and southern regions invested profits from other business
into commodity trading (see figure below).

19
Figure 3: Source of Capital for Starting a Commodity Trading
4.3 Business Environment and Commodities Traded
The assessment wanted to establish the distance that traders cover from source
to current market. Figure below shows the results ,by region and also compared
to the average distances traders reported to have covered in the June-July
assessment.
Figure 4: Average Distance covered by Traders by Region
In the central region, the distance covered was shorter than the one reported in
June-July assessment. However, in the east and south the distance increased
substantially with the east reporting an almost eight-fold increase and the south
31%
47%
22%
34%
48%
35%
47%
29%
13% 11%15%
20%
0%
10%
20%
30%
40%
50%
60%
North Centre East South
Profit from other business Farming
Savings from salary Loans
Remittances Sales of assets and goods
Sale of livestock
76
105
11
47
90
36
83
148
0
20
40
60
80
100
120
140
160
North Centre East South
June-July November

20
over three times increase in distance. This indicated that traders especially in
the eastern and southern regions are now getting maize from more distant areas
than during the June-July assessment. Figure below shows where traders source
their produce.
Figure 5: Source of Maize by Region
As expected, a majority of the traders in the eastern and southern regions
indicated that they source their commodities from districts outside their own and
predominantly in the central region.
In terms of market operations, a majority of the respondents were operating at
wholesale and both retail and wholesale level as figure below shows.
17%
33%
17% 18%
34%38%
20%
28%
38%
29%
56%
48%
11%
0%
7% 7%
0%
10%
20%
30%
40%
50%
60%
North Centre East South
Within the market Within the district Outside the district Other

21
Figure 6: Type of Commodity Trading by Region
These results are different from the June-July findings where in all regions, the
retail were the majority as figure below shows. This could imply that in all
markets, there is little movement from producers to small traders and this has
shifted to trade involving wholesalers who are involved in controlling the
movement of maize. The eastern region, which reported only two wholesalers,
now reported a majority of 68 percent. It is possible that the traders who were
retailing have now graduated into wholesalers. A generalization could be made
that as a consumption season progresses, traders move from retail where they
buy from small traders and now start wholesaling.
During the June-July assessment, it was observed that most traders preferred
quantity measure for buying and selling maize i.e. use of a cup or tins as
confidence of scales is normally low on the markets. This was still the case in
the other regions except the central region where use of scale was more
common. Use of quantity measure is also not without problems as tins are also
disfigured or tampered with but in a more overt manner than scales.
It was common for traders to have multiple outlets as figure below shows.
Compared to the June-July assessment, the number of outlets per trader had
reduced especially in the centre and south.
2% 3% 2% 2%
48%52%
68%
60%
50%44%
30%
38%
0%
10%
20%
30%
40%
50%
60%
70%
80%
North Centre East South
Retail Wholesale Both

22
Figure 7: Number of Outlets per Trader per Region
The south and the centre had more traders with multiple outlets in the previous
assessment. The update showed that the north and the centre had more outlets
per trader. At the selling points, the traders were dealing in more than one
commodity. Other than displaying the products, competition among traders was
covert especially price competition. Figure below shows the average number of
commodities traders had, by region, for the June-July assessment and the
November update.
Figure 8: Number of Commodities being sold per Trader by Region
2.35
2.82
2.12
2.99
2.23 2.222.07
1.86
0
0.5
1
1.5
2
2.5
3
3.5
North Centre East South
June-July November
2.18
2.53
2.092.32
2.46 2.412.29 2.36
0
0.5
1
1.5
2
2.5
3
North Centre East South
June-July November

23
There was no significant change in the number of commodities traders had
although there was a slight increase for all regions except the centre.
A majority of the respondents interviewed were maize traders as table below
shows. This was a result of purposive sampling by the nature of the assessment
being aimed at assessing functionality of the food market.
Table 4: Number of Traders Interviewed per Commodity by Region
Region
Number of Traders per Commodity
Maize Beans Cowpeas Pigeon peas
North 84 16 3 -
Centre 224 155 48 13
East 47 11 2 3
South 115 51 17 20
Grand Total 470 233 70 36
NB: the total commodities are over the number of respondents interviewed because some respondents had multiple commodities
This result is not surprising since the respondents were purposively sampled i.e.
targeted traders dealing in maize, beans, cowpeas and pigeon peas. Beans was
the commodity with the second largest number of traders, with cowpeas and
pigeon peas having the least number of respondents. There were no respondent
traders in the north dealing in pigeon peas. Unlike the June-July assessment,
interviews for cooking oil were done separately for the November market update.
4. 4 Summary of Findings for Trader Characteristics and Agri-business
conditions
The number of traders interviewed was the largest in the centre (51%) followed
by the south and east. Compared to the June-July assessment, the distance that
traders indicated to have travelled increased especially in the eastern and
southern regions. This is as result of the traders’ mostly travelling to the central
region to get their commodities. Traders from the eastern and southern regions
mostly sourced their products from markets outside their districts and mostly the
central region.
Unlike the June-July assessment, most of the traders were engaged in wholesale
and both wholesale and retail. In the June-July period, the majority were in the
retail section. These were predominantly producers or small traders. The

24
number of outlets also reduced. This implies that maize trading is predominantly
a seasonal activity.

25
5.0 Private Trader Food Trade Activities and Response Capacity
5.1 Trends in Volumes of Maize Traded
As indicated earlier, Malawi lifted a maize export ban on 30th October 2017
following a bumper harvest during the 2016/17 agricultural season. Zambia had
lifted its maize export ban earlier ,in order, to serve the east African region. At
the time of the market survey, Zambia and Mozambique government agencies
were not yet buying maize in their respective countries. This made the Malawian
prices to be better (e.g. K40 per kg on the other side of the border against K60
on the Malawi side) 8 . In Karonga, maize was reportedly being sold at an
equivalent of K400 per kg on the Tanzania side versus K90 to K120 on the
Malawi side. Zambia is expected to export about 100,000 MT to the East African
countries, the bulk of which was meant for Kenya9. The reported cross border
trade ,during the survey, was mainly small scale with potential large-scale
trading using informal cross border crossings in order to avoid the borders where
the maize ban was in effect.
The respondents were asked to indicate the volume of maize they had bought
and sold during the previous month and what they expected to sell for the
remaining period of the consumption year. Table below shows the stocks that
were calculated for each district in terms of estimated number of traders,
volumes that were bought and sold between July to October 2017 and volumes
expected to be sold for the remainder of the current consumption year.
8 Bicycle transportation (K60 to K100)
9 https://www.the-star.co.ke/news/2017/07/24/zambia-to-export-100000-tons-of-maize-to-ea-bulk-
meant-for-kenya_c1603173

26
Table 5: Number of Traders and Maize Volumes Traded during the Previous Month and Stocks expected to be sold in the Remaining Consumption Year
District
Number of Estimated
Traders Covered
Volume of Maize Bought
July to October
(Kg)
Volume of Maize Sold
July to October
(Kg)
Volume of Maize
Expected to be Sold to
End of Year (Kg)
Northern Region
Mzimba 2,068 1,036,111 829,326 4,373,892
Rumphi 165 122,696 92,583 924,375
Karonga 872 720,330 550,966 1,939,053
Chitipa 212 125,928 59,784 1,055,363
Nkhata Bay 330 419,637 121,518 1,588,504
North Total 3,647 2,424,701 1,654,177 9,881,187
Central Region
Ntcheu 470 367,432 657,062 1,214,697
Dedza 697 707,981 801,782 1,197,339
Lilongwe 850 812,757 429,926 2,163,074
Dowa 158 1,471,066 1,457,056 23,700
Nkhotakota 421 131,142 107,313 2,370,709
Salima 368 209,211 239,070 298,351
Mchinji 182 489,054 518,376 365,070
Ntchisi 227 887,185 596,248 322,434
Kasungu 310 815,768 457,262 1,649,249
Centre Total 3,683 5,891,596 5,264,096 9,604,623
Eastern Region
Zomba 346 286,465 331,316 369,505
Machinga 224 114,544 326,053 428,139
Mangochi 37 128,367 132,709 154,167
Balaka 120 226,711 272,826 332,705
East Total 727 756,087 1,062,905 1,284,517
Southern Region
Nsanje 101 50,738 189,633 55,742
Chikwawa 163 291,036 525,834 352,482
Blantyre 164 174,250 893,800 118,900
Phalombe 66 158,400 847,440 1,307,177
Mulanje 268 174,393 706,261 224,505
Chiradzulu 91 2,292,472 2,074,072 22,750
Mwanza 53 36,806 147,222 143,836
Neno 67 59,128 188,270 44,603

27
Thyolo 199 25,428 123,442 472,874
South Total 1,172 3,262,650 5,695,974 2,742,869
National Total 9,229 12,335,034 13,677,153 23,513,196
At the June-July assessment, the volume expected to be traded for the
remainder of the consumption year was about 36,000 MT. The current update’s
estimate is above 23,500 MT. On a regional basis, the north and the centre
expected to sell more than the eastern and the southern regions as figure below
shows. In terms of buying and selling volumes, the data in the table above
shows that traders in the north and centre bought more volumes than they sold.
On the other hand, those in the east and south sold more volumes than they
bought. This could be the case because, usually, trading activities start in the
south and progress northwards. The additional reason for the centre could be
that ,with the bumper harvest that the region experienced, some farmers who
had earlier held onto their maize were finally selling.
Figure 9: Quantity of Maize Traders expected to sell for the remainder
of the season
9,881 9,605
1,285
2,743
0
2,000
4,000
6,000
8,000
10,000
12,000
North Centre East South

28
5.2 Respondents’ Experience and Expectations for the Maize Trade
Respondents were asked to indicate the trend of maize trade during the July
October period and their expectations for the remainder of the consumption
season. Figure below shows the results.
Figure 10: Trend of Maize Sales by Period
In all regions except the south, a majority of the respondents indicated that
maize volume traded during the July-October period decreased. Over 50 percent
of the traders in the south expect the trade volumes to increase from November
onwards. Over one third of the respondents in the centre and north expect the
volumes, to be traded from November onwards to decrease and fewer in the
east. These findings might indicate the type of trading occurring in a region.
The south is a net consumer/buyer therefore as the consumption year
progresses, more trade is expected. The centre and the north are net sellers
and they tend to sell earlier and less as the year progresses. About 40 percent
of the respondents in the eastern region did not expect any change in the trends
of volumes to be sold from November onwards.
0%
10%
20%
30%
40%
50%
60%
70%
80%
North Centre East South
Increase July-October Increase November onward
Decreased July-October Decreased November onward
No change July-October No change November onward

29
5.3 Price Analysis of Maize
The respondents were asked to indicate the current selling price of maize, the
expected price of maize for the periods November to December and January to
March. Data below shows that prices were generally higher in the southern
region just as were the expected prices for the two periods of interest.
Figure 11: Maize Price per Period
Compared with similar analysis of the June-July period, the prices for the
October period and the expected two sets of periods are lower than the
responses got in the previous assessment. The price projections that were
assessed for the June-July period were significantly above K175 per Kg minimum
for the October period. FEWSNet made a projection that maize prices would be
about K160 per Kg in October. Table below shows the projections from this
analysis in comparison with other earlier projections.
90 87
101
114
96 88
106
131
111 100
106
128
-
20
40
60
80
100
120
140
North Centre East South
Current Price November December January March

30
Table 6: Maize Price per period by Region
Region
Current
Price
October-December
Period
January-March Period
Current Projection
July Assessment Projection
Current Projection
July Assessment Projection
North 118 145 157 135 168
Centre 99 98 119 106 127
East 76 80 121 93 130
South 87 106 145 120 154
All projections made in the June-July assessment were higher than those
obtained. Although ADMARC was expected to participate actively on the market,
such has not been the case. This has further dampened the expectation of
traders on the market. With the lifting of the maize export ban, and ADMARC’s
resumption of buying maize, chances are that prices will pick up during the last
quarter of consumption year i.e. January-March period.
5.4 Integration of Main Markets
Data from the FEWSNet was used to assess the extent to which main maize
markets are integrated. Correlation coefficients were calculated for 15 markets
(4 in the north, 5 in the centre and 6 in the south) for a two-week data
frequency for a period between December 2016 to June 2017. The June-July
markets assessment showed that the markets were highly correlated as the table
below shows. Not much has happened to change this, by adding data for the
past four months.

31
Table 7: Correlation of Main Maize Markets in Malawi
KA RU
MZu MZ
Nkha Mpo
CMBY MC MIt MN
LNZu
LWND MJ CK NE
KA 1 RU 0.93 1
MZu 0.94 0.94 1 MZ 0.93 0.94 0.97 1
Nkha 0.93 0.95 0.97 0.99 1 MPo 0.94 0.93 0.97 0.97 0.97 1
CMBy 0.95 0.94 0.97 0.96 0.96 0.98 1 MC 0.84 0.87 0.94 0.94 0.94 0.93 0.91 1
MIt 0.89 0.90 0.96 0.97 0.96 0.95 0.93 0.96 1 MN 0.80 0.85 0.92 0.93 0.93 0.91 0.87 0.97 0.95 1
LNZu 0.94 0.97 0.97 0.98 0.98 0.98 0.97 0.92 0.95 0.91 1 LWND 0.79 0.83 0.92 0.93 0.93 0.89 0.87 0.96 0.94 0.95 0.90 1
MJ 0.84 0.87 0.94 0.96 0.96 0.92 0.89 0.96 0.95 0.96 0.93 0.97 1 CK 0.87 0.88 0.92 0.95 0.96 0.92 0.90 0.93 0.94 0.92 0.94 0.93 0.96 1
NE 0.76 0.80 0.85 0.90 0.90 0.82 0.80 0.87 0.91 0.90 0.86 0.91 0.94 0.92 1
Key:
KA=Karonga; RU=Rumphi; MZu=Mzuzu; MZ=Mzimba; Nkha= Nkhamenya; MPo=Mponela; CMBy=Chimbiya; MC=Mchinji; MIt=Mitundu; MN=Mwanza; LNZu=Lunzu; LWND=Liwonde; MJ=Mulanje; CK=Chikwawa; NE=Nsanje

32
The lowest correlation is 0.76 involving Karonga and Nsanje and the highest is
0.99 for Nkhamenya and Mzuzu. Most of the markets are otherwise highly
correlated with coefficients of over 0.90. This implies that any change in prices in
one market will result in traders responding i.e. move produce from markets with
low prices to markets with high prices.
5.5 Maize Price Volatility Analysis
The assessment considered the volatility of maize prices using the national
average prices. This analysis is justifiable given that the previous section has
shown that the main maize markets are integrated. The results of the volatility
analysis are shown in the graph below.
Figure 12: Nominal Average National Price (December 2015 – November 2017)
The national average price was declining up to June and then stabilized during
the last two quarters. Price volatility followed a similar trend with the price being
above long run average as the figure below shows.
0
50
100
150
200
250
300
Dec-15
Mar-16
Jun-16
Sep-16
Dec-16
Mar-17
Jun-17
Sep-17
Nov-17

33
Figure 13: Maize Price Volatility Analysis (December 2015 to November 2017)
The data set used is for a period of 99 weeks (December 2015 to November
2017) from 81 markets. The graph above shows that from December 2016, the
observed average prices have been volatile but below the mean. It is suspected
that when Government announced that it was going to import maize, the private
traders responded by off-loading maize on the market, therefore depressing the
price. In recent weeks, there has been a tendency for the price to increase.
While this is normal, the purchase of maize by the NFRA and ADMARC might
have also contributed to the price increase. This has tended to increase the
price of maize on the market in recent weeks.
5.6 Factors affecting Price Setting
The setting of prices takes into account several factors. Table below shows the
major factors that respondents took into account to set the prices.
-0.2
-0.15
-0.1
-0.05
0
0.05
0.1
0.15
1 5 9 13 17 21 25 29 33 37 41 45 49 53 57 61 65 69 73 77 81 85 89 93 97

34
Table 8: Factors influencing the setting of Prices
Factor
Region North Centre East South
Price in Source Market 89% 85% 97% 95%
Transportation Costs 32% 26% 35% 36%
Demand and Supply 39% 57% 35% 51%
Storage Costs 2% 5% 2% 2%
Labour Costs 4% 4% 3% 12%
Competitor price 14% 11% 8% 12%
ADMARC Prices 4% 5% 0% 2%
Government-set Price 1% 1% 0% 0%
Joint Set Pricing 8% 7% 0% 2%
Quantity of Commodity 21% 22% 30% 38% aMultiple responses
These results are consistent with the June-July results where price at source
markets was the major determinant of price setting. The other factors were
demand and supply, and transportation costs.
5.7 Commodity Handling and Access to Source and Destination Markets
5.7.1 Mode of Transporting Commodities
Motor Vehicle was the major transport type across all commodities. This was
mentioned by a minimum of 60 percent across all regions (see figure below).
This implies that most traders interviewed travelled over long distances.
Figure 14: Mode of Commodity Transportation by Region
71%
59%
78% 79%
6%3% 0% 1%3%
7%2%
8%
0%
10%
20%
30%
40%
50%
60%
70%
80%
90%
North Centre East South
Vehicles Oxcart Head load

35
5.7.2 Physical Access to Source and Destination Markets
In terms of access to both source and destination markets, generally the
respondents indicated that the markets were accessible with very few
respondents indicating that destination and source markets were inaccessible
during the rainy season. A comparison was made between the November-
December period and January to March period (see figure below).
Figure 15: Physical Access of Source and Destination Markets
During the November-December period most of the roads were categorized as
been good to excellent in terms of physical accessibility.
Table 9: Main Customers to Traders
Customer
Region
North Centre East South
No % No % No % No %
Local People 56 56 97 28 27 45 73 43
Fellow Traders 7 7 64 19 14 23 23 14
Schools 4 4 4 1 0 0 2 1
Restaurants 4 4 3 1 4 7 5 3
Hospitals/clinics 0 0 1 0 0 0 1 1
Other 4 4 17 5 0 0 12 7
19%
35%40%
26%
18%
36%
60%
22%
65%
46%
55%
67%67%
51%
38%
73%
10%14%
3%7%9% 7%
0%5%
0%
10%
20%
30%
40%
50%
60%
70%
80%
North Centre East South
Excellent Nov-Dec Excellent Jan-Mar Good Nov-Dec
Good Jan-Mar Bad Nov-Dec Bad Jan-Mar

36
The main customers for the traders across the regions were local people.
However, the proportion of traders indicating fellow traders as their major buyers
was exceptionally high in the central region. This implied that there were more
aggregators of commodities than the other regions.
5.8 Status of Other Crops
This section presents status of other crops that were covered by the assessment.
These are beans, cowpeas and pigeon peas. Traders of beans were the second
largest after maize as table below shows.
Table 10: Estimated Number of traders of commodities by Region
Region Commodity
Bean Cowpeas Pigeon peas
No.
Intervie
wed
Estimate
d No. of
Traders
No.
Intervie
wed
Estimate
d No. of
Traders
No.
Intervie
wed
Estimate
d No. of
Traders
North 16 466 3 143 0 0
Centre 155 3,036 48 477 13 115
East 11 193 2 16 3 23
South 51 550 17 151 20 145
Total 233 4,245 70 787 36 283
The central region had the highest number of bean traders interviewed across
the regions, with an estimated number of almost four times of traders from the
other regions combined. A similar trend was observed for cowpea. For pigeon
peas, the largest numbers of traders interviewed were in the south and centre
and there were no interviews for pigeon peas recorded in the north.
Further analysis was done for beans, given that relatively more traders were
interviewed and also involved larger quantities. Table below shows the stocks of

37
beans that traders had and what they anticipated to sell for the rest of the
season (November to March).
Table 11: Current Stocks and Expected Stocks of Beans to be Sold
Region Current Stocks (Kg)
Stocks Planned to the Sold for the rest of the
Season (Kg)
North 7,775 27,670
Centre 180,690 628,791
East 2,490 49,800
South 8,881 361,000
Total 199,836 1,067,261
The central region had the largest quantity of beans in stock as well as what
traders planned to sell for the rest of the season. The region is a source market
for the Lilongwe city and the populous eastern and southern regions. The price
of beans was expected to increase for the November-December and January-
March periods in all regions save the east as figure below shows.
Figure 16: Current and Expected Price of Beans
662 656 627
592
690 709 723
650 707
745
673 716
-
100
200
300
400
500
600
700
800
North Centre East South
Current Price November December January March

38
5.9 The State of Vegetable Cooking Oil in the Markets
The assessment did not attempt to estimate the number of traders and
quantities of vegetable cooking oils on the market. It established the types of
traders, the brands and source of the commodity.
Across the region, the markets had two categories of cooking oils; the branded
and non-branded cooking oils. The non-branded tended to be manufactured
from animal fat10, while most of the branded were vegetable cooking oil made
from traceable manufacturers. The vegetable cooking oils had local and
imported brands.
For most of the local brands, at the markets visited there were large traders
acting as wholesalers to the small traders who repack the oil into small quantities
to sell at the market. The establishment of large traders, in the markets, has
reduced chances of stock outs of cooking oil in the districts. Additionally, this
has meant that smaller traders do not have to travel very far to buy cooking oil.
This ,in turn, has increased the number of oil traders in the markets averaging
an impressive fifteen traders per market visited.
In the north, the most popular brands were Kukoma, Mulawe, Superstar and
Lawani. All these are local brands and the most dominant brand for the region is
Kukoma. The oil is repackaged in small sachets fetching a price of K50 and K100
and in 1 liter bottles going at K1000, half liter going at K500 and one quarter liter
going at K250 across all the districts.
In the central region, there were four main brands of cooking oil, namely;
Kukoma, Mulawe, Orie and Sunfoil. These have different sources and are made
from different commodities. For instance, Kukoma is made from groundnuts and
is sourced from Blantyre, Mulawe is made from soya and is also sourced from
Blantyre, Sunfoil is made from sun flower and is imported from South Africa and
10 These oils were solid in storage and required to be warmed during sales so that they can flow. They
were said to be popular with street food processors especially chips processors, popularly known as
‘chiwaya’.

39
Blantyre while Orie is from Tanzania. Kukoma was the most popular brand
among these. The Kukoma prices ranged from K800 to K900 per liter from
source and selling at K950 to K1, 100 per liter. For Mulawe the prices per liter
ranged from K750 to K850 from source and selling at K950 to K1000 at
destination market.
In the eastern region, the major source of cooking oil was Mozambique with a
small presence of the Kukoma brand on the market. The reason for choice was
mainly that the imported commodity was cheaper than locally manufactured
commodities. The imported oil was in various sizes ranging from 5 liters, 10
liters and 20 liter buckets. Traders were decanting these into sachets, 1 and 5
liter bottles. The prices ranged from, K850 to K1000 per liter for imports and
K1,000 to K1,200 per liter for Kukoma. At the time of the updates, the sales had
decreased.
In the southern region, the most popular brands were imported namely Donna,
Oreo and Sun oil. Oreo is imported from Tanzania while Donna and Sun Oil are
imported from Mozambique. Local brands found on the markets were Kukoma
and Mulawe while D’lite is imported from South Africa. In the markets visited, 20
liters of foreign brands were selling at an average price of K16, 000 and one liter
was selling at K800 or K900 and smaller sachets go for as low as K50 per sachet.
A bucket of Kukoma was selling at K17, 300 and traders were selling at either
K1200 or K1100 per liter. From the local brands, Kukoma was still the most
expensive. There were smaller local brands that were competing with the
branded products by undercutting the prices. Compared to the imported brands,
the local brands were more expensive before the removal of VAT in this year’s
budget.
Price of vegetable oil from Mozambique fluctuates with the strengthening and
weakening of the Mozambique Meticol11 popularly known as Metcash and also
depending on the weather. During the rainy season, transport costs increase
thereby increasing selling prices of the vegetable oil.
11 US$1=MZM60.74

40
5.10 Summary of Findings for Private Trader Food Trade Activities
Trading of maize was active along the border areas with maize getting into
Malawi. The traders expected to sell about 23.5 MT to the end of the
consumption year. The north and the centre expected to sell around 10 MT
each. During the July-October period, maize sales reduced and in all areas
maize sales were expected to increase.
The prevailing prices, during the assessment, were lower than the projected
from various sources e.g. the June-July assessment and FEWSNet. With prices
below K100 per Kg, in all regions but the north, the north had the highest
average price of K118 per Kg and in all regions the prices were expected to
increase in the coming months. Prices from June to November showed a stable
pattern as shown by the national average prices calculated from the AMIS data.
Maize was mainly transported using vehicles and physical access to markets for
the remaining period was assessed as good to excellent.
For the other crops, the predominant one was beans and was mainly grown in
the central region, as shown by the stocks that respondents reported to be
keeping during the time of the assessment. The east and the south were
observed to be net consumers of beans. Just as was the case with maize, prices
of beans were expected to increase over the consumption period.
Availability of cooking oil was generally good in all regions. Unlike during the
June-July assessment, it was reported that prices of vegetable cooking oil had
reduced. This was as a result of removal of VAT by government during this
year’s budget and also imports from mainly Mozambique which dominated the
east and the south.

41
6.0 Private Traders Response Capacity
The assessment appraised the capacity of the traders to respond to a 25 percent
increase in demand. This section focuses on whether the traders would absorb
the increase in demand, how much volume they would have to increase their
supply and within which timeframe would they be able to replenish their stock.
6.1 Traders’ Capacity Evaluation
Given that generally the maize harvest was good this year, respondents were
asked to indicate whether they would be able to cope with a 25 percent increase
in demand. A majority of the traders indicated that they would be able to do so
as follows: north 86%, centre 83%, east 81% and south 77%. Such an increase
would require the traders to increase their stock levels by about 50 percent
figure below shows.
Figure 17: Expected Stock levels to meet a 25% increase in Demand
The north had the least percent needed to meet an increase in demand
compared to the rest of the regions. This is the case because of differences in
the on-set of rains and harvest between the north and the other regions. The
distance to source markets was longest in the south, with an average distance of
148 km. The east had an average distance of 83 km, the north 90 km and the
centre 36 km. The source markets for the central region markets were within
the region unlike the south and east where major source markets were from the
central region. On the other hand, the northern region had a few major source
42
54
62
52
-
10
20
30
40
50
60
70
North Centre East South

42
markets i.e. Mzimba, Rumphi and Chitipa districts. Hence traders from Nkhata
Bay and Karonga had to travel relatively longer distances.
Distances that buyers covered were a reverse of the pattern observed on the
source markets. Central region buyers travelled an average distance of about
57.5 km while the other regions reported less averages as follows: north 15 km,
east 16.2 km and south 12.2 km.
Surprisingly, the timeframe within which traders could restock in case of an
increase in demand was longest in the north as figure below shows. This could
be the case because of distances between source and destination markets in the
north. Nevertheless, all traders indicated that they would be able to respond
within a two week period as figure below shows.
.
Figure 18: Period within which Traders would re-stock to need a 25%
increase in demand
6.2 Ownership of Storage Facilities and Quantity Stores
Very few traders indicated to own storage facilities. While the north, centre and
south indicated that about one quarter of them had storage facilities (27%, 22%
and 27% respectively), over one half of the respondents in the east (54%)
reported to own storage facilities.
1.33
1.18
1.15 1.17
1.05
1.10
1.15
1.20
1.25
1.30
1.35
North Centre East South

43
Respondents were asked to indicate the quantity of maize they stored during
July-October period and what they intended to store in the November-March
period. Table below shows the quantities that were reported.
Table 12: Quantity of Maize Stored by Season
Region Quantity Stored July-
October (Kg)
Quantity Stored
November-March (Kg)
North 20,440 19,933
Centre 380,533 307,965
East 44,875 19,248
South 15,991 12,565
Traders in the central region had more storage than all regions combined for
both periods. However, the results show that in the remaining consumption
period, the quantity of maize to be stored will decrease.
6.3 Traders Experience with Selling on Loan
The traders were asked to indicate if they ever sold their commodities on credit.
Unlike in the June-July findings, more traders in the south (63%) reported to
have sold on credit followed by the eastern region (58%). The central region
had the least proportion of traders indicating to have sold on credit mentioned by
28 % of the respondents with the north having 41 %. However, the average
amount of loans ranged from K15,632 in the east to K2,276,520 in the central
region. The other regions reported K28,470 for the south and K36,563 in the
north.
6.4 Summary of Findings on Trader Private Trader Food Trade Activities&
Response Capacity
A majority of the traders responded that they had capacity to respond to a 25 %
increase in demand of maize in all regions. This was assessed in terms of how
much they would have to increase their volumes which average 50 % except in

44
the east which had the highest of 62 %. Additionally, the timeframe within which
maize would be restocked was below a two week period.
Ownership of storage facilities was low across the regions, except in the eastern
region. Traders in the centre reported to have stored more maize during the
July-October period and expected to store more in the November-March period
than all regions combined.
Selling of commodities on credit was the highest in the south and east compared
to the other regions. The amounts involved in selling on credit ranged from as
low as above K15,000 in the east to over K2 million in the centre.

45
7.0 The 2017/18 MVAC Response Options
7.1 Recommended Response Options
This sub-section presents recommended options for the 2017/18 consumption
season based on the update. The June-July assessment recommended that
humanitarian assistance should be on cash-based transfers. This was based on
the fact that for the affected TAs, the caseloads were less than 50,000 and the
markets were functioning with low prices. Furthermore, physical access of the
markets were assessed to be good and excellent therefore, in case of any
emergency, maize should be able to be transported to the affected areas. This
update has observed the following:
4. The market prices are still low in many areas with traders having some
maize in stock
5. ADMARC and the NFRA have been active on the market, such that in case
of emergency they should be able to offload maize on the market.
6. Physical access to most markets is still being assessed to be good and
excellent.
Based on these observations, this update is recommending that the cash-based
response made in the June-July period should be maintained.
7. 2 Status of Markets Visited
An analysis of the maize markets visited was done in order to establish whether
the markets were source, transit or destination markets. Source markets are
those supplying maize to other areas i.e. traders come to these markets so that
they can sell in other distant markets. Transit markets are those connecting
source and destination markets while destination markets are those that serve
the consumer on the last node of the value chain. For details see Appendix II.
The following are the major observations:
7.2.1 Northern Region Markets
Most source markets were on the western side of the region, in the districts of
Mzimba, Rumphi and Chitipa. The Rumphi markets also serve as entry points of
maize from Zambia. Most transit markets were those along the M1 road
connecting Mzimba and Karonga. The destination markets were to the east e.g.
Nkhata Bay, Mzuzu and Karonga.

46
7.2.2 Central Region Markets
A majority of the markets visited were transit markets which were connecting
source markets with the districts/region to other destination markets with the
region predominantly, Lilongwe and the districts in southern Malawi. The districts
of Mchinji, Ntcheu and Lilongwe were entry points of maize imports from Zambia
and Mozambique.
7.2.2 Eastern and Southern Region Markets
Most markets visited were destination markets with a few transit markets
connecting maize from the central region to the two regions. Some transit
markets notably, Bangula and Mwanza were entry points for maize from
Mozambique.

47
Bibliography
FEWSNet. (2017). Malawi Food Security Outlook June 2017 to January 2018.
Lilongwe: Famine and Early Warning Systems.
Malawi Government. (2017). 2017/2018 Budget Statement. Lilongwe: Malawi
Government.
Malawi Government. (2016). Annual Economic Report 2016. Lilongwe: Ministry of
Finance, Economic Planning and Development.
SADC. (2017). State of Food Insecurity and Vulnerability in the Southern African
Development Community. Gaborone, Botswana: SADC Secretariat.

48
Appendix I:
Market Situation Analysis Update to Inform Food Security Response Options as part of the 2017/18 MVAC Response Programme
QUESTIONNAIRE FOR PRIVATE TRADERS
My name is ----------------------------.I am here on behalf of the Malawi Government through the Malawi Vulnerability Assessment Committee (MVAC) which is conducting a nationwide food market situation assessment to get an update on the functionality food commodity markets in the country. The purpose of this market assessment is to understand how staple food markets are currently functioning in different districts during the 2017/18 consumption season, and identify Traditional Authorities (TAs) that are suitable for implementation of in-kind food assistance and those suitable for implementation of cash based transfers. Your business enterprise is one of the many enterprises sampled to provide the needed information for the study at this market. For us to effectively collect the required information, we have a few questions which we shall ask you. All the information collected during the interview will be kept confidential, for the sole purpose of our client and your identity will not be disclosed to anyone. We hope you’ll feel free to speak openly and honestly. Are you willing to participate in this study? Yes |___|, No. |___|, If No, do not proceed with interviews. A. PROFILE AND IDENTIFICATION
A1 ADD A10 Date checked by Consultant
A2 District A11 Starting Time
A3 Traditional Authority A12 Ending Time
A4 EPA A13 Market Name
A5 Section A14 Do you have market days?
1= Yes; 0= No

49
A6 Research Assistant
A15 If yes, when are the market days
Monday |___|, Friday |___| Tuesday |___|, Saturday |___| Wednesday |___|, Sunday |___| Thursday |___|
A7 Date of interview A16
Y-coordinate (latitude) S: |___|___|, |___|___|___|___|___|
A8 Supervisor
X-coordinate (longitude) E: |___|___|, |___|___|___|___|___|
A9 Date checked by Supervisor
B. TRADER CHARACTERISTICS
Before, we start discussions on details of your business, I would want to find out the following information about you:
B1. Name of business owner_______________________________________________________
B2. Name of respondent __________________________________________________________
B3. When did you start the food commodity trade (year)? _________________________________
B4. Distance from the original place, to the current business place (km):______________________
C. GENERAL INFORMATION ON TRADER’S AGRI-BUSINESS& BUSINESS CONDITIONS
C1 C2 C3 C4
Type of business 1=Wholesaler 2= Retailer 3=Wholesaler
Number of simultaneous outlets
Main commodities traded in for the level (type) of business (main commodities are those that constitute at least 20% of the business incomes)
Major source of the staple food commodity business capitalization and amounts
Major source of Amount (MK)

50
and retailer Total No. of commodities being traded
Names of commodities (See codes below12) [multiple response]
business capital (See codes below)
Codes for C3:1=Maize, 2= pigeon peas, 3= general beans, 4=cow peas, 5= Groundnuts, 6= Soybean; 9 = rice; 10=
fish; 11= vegetables; 12= poultry (eg chicken); 13= small ruminants (eg goats, sheep); 14= Cattle /cattle meat
Codes for C4: 1=Profit from other business, 2=Farming (crop sales), 3=savings from salary/wage, 4=loan,
5=remittances, 6=Fishing, 7=sales of assets/goods, 8=sale of livestock, 9=Other (specify)
__________________________
C5. Do you have a license/business permit to conduct trade? Yes|___| No|___|
D. PATTERN OF VOLUMES OF TRADED COMMODITIES IN KEY SELECTED MARKETS
Commodity Numbers of traders in this market operating
Volumes traded in per month (kg)
In your opinion, based on the market trends, how have volumes sold
In your opinion, based on the market trends, how are the volumes sold
12 For the commodities that are not mentioned in D3, we do not expect to see them mentioned in responses to the subsequent questions below.

51
at the same activity level (amount and type of trading) as you do?
Bought Sold changed from July-September 1= increased; 2=Decreased 3=No change
expected to change during January-March 1=Will increase; 2=Decrease 3=No change
(a) 2017/18
(current season)
Da1 Da2.1 Da2.2 Da3 Da4
Maize
Beans
Cowpeas-(khobwe)
Pigeon peas-
(nandolo)
E. MARKET DYNAMICS IN FOOD COMMODITY MARKETING IN THE LOCAL MARKET PLACE IN THE
CURRENT YEAR AND PAST YEAR
(a) Plans for the remaining 2017/18 Agricultural Marketing Season
Ea1 Ea2 Ea3 Ea4 Ea5
Commodity Current Stocks available (kg)
Current selling Price (MK/kg)
Planned stocks to be sold in the remaining months of the 2017/18 marketing season (kg)
Expected average market selling price Nov – Dec, (MK/kg)
Expected average market selling price Jan - March, (MK/kg)
Maize
Beans

52
Cowpeas-(khobwe)
Pigeon peas-(nandolo)
Eb. What factors do you consider when setting a commodity price? [Multiple response options- please do not read responses to the respondent!!!]
Codes for Eb: 1=Price in source markets, 2=Transportation costs, 3=Demand and supply of the commodity, 4=Storage costs, 5=Labour costs, 6=Competitor price, 7=ADMARC prices, 8=Govt set price, 9=Joint price setting, 10=Quantity of the commodity, 11=Others (Specify) _______________
(c) Local Market and Institutional Environment for Food Commodities Trade during the 2016/17 Marketing Season
Ec1
Food Commodity Is there competition from other traders in the market?
1= Yes
2=No
No. of competitors
Wholesalers Retailers Both Total
Maize
Beans
Cowpeas-(khobwe)
Pigeon peas-(nandolo)
Codes for Ec2(major support from other traders): 1= joint setting of selling prices; 2= assisting each other in
transportation of produce; 3= storage security of the produce in the market place; 4=sharing customers, 5=borrowing
money from each other, 6=Selling on each other’s ‘behalf, 7=None, 8=other (specify)______________________

53

54
(Ed) Private Trader Response Capacity and Constraints
Ed2 Ed3 Ed4 Ed5
Commodity If demand
would increase,
will you be able
to absorb the
increased
demand?
See Codes Ed2
How much
could you
increase the
volume of
your current
trade (%)?
In case demand
increased by a
quarter, within
what time frame
would you deliver?
See Codes Ed4
What do you see as the 3 biggest constraints to increase supply should demand increase? See Codes Ed5
Maize
Beans
cowpeas-(khobwe)
Pigeon peas-(nandolo)
Codes Ed1: 1=Increase, 2=Decrease, 3=No change Codes Ed2: 1=Yes, 2=No Codes Ed4: 1=within one week, 2=within two weeks, 3-within one month, 4=Longer than one month, 5=I can’t promise, 6=don’t know, 999=Not applicable Codes Ed5: 1=Lack of own capital, 2=Lack of credit, 3= High collateral, 4=High interest rate on credit, 5= High
transport costs, 6=Lack of means of transport, 7=Poor road infrastructure, 8=High tax payment, 9=Too much food
assistance, 10=Low demand, 11=Low supply, 12 Few people control the market, 13=Shortage of storage, 14=Others
(specify)_____________________
(Ee) If there is an increase in demand from the affected population, how can you be supported to sustainably increase supply in the disaster affected areas? 1=more capital, 2=loan, 3=transportation means, 4=improved road infrastructure, 5=Remove/reduce tax, 6=storage

55
facilities, 7=None, 8=Others (specify)_____________________

56
Ef: Business Loan/ Capital Constraints
Ef1 Ef2 Ef3 Ef4 Ef5 Ef6 Ef7
What is the total required Capital to operate an effective commodity business in the current marketing season (MK)?
Ever attempted to get a loan from the bank/ microfinance institution/ VSL/ friend in the past & current year for the commodity trading? 1= Yes, 2=No (go
to Ef7)
From which source did you attempt to acquire the
business loan?
1= bank, 2= micro finance, 3= VSL= 4= friends/ relatives, 5= other (specify)
If, Yes, amount of loan obtained?
If Yes, what was/ is the interest rate?
If yes, how long was/ is the payment period?
(months)
If not able to get a loan for the business from the stated sources, what are the reasons? See codes for Ef7
below
Codes for Ef7: 1= not able to meet collateral requirements; 2= requirement to be a cooperative/group; 3= have previous
loans which are unpaid; 4= I fear loans; 5= high interests, 6=I do not need loans; 7 = other (specify)
(F) FLOW OF COMMODITIES
Fi1 Fi2 Fi3
Commodity How often do/did you have to restock commodities (when stocks run out)? (Codes Fi1)
How long does it take to refill/replenish the stock (days)
Volume of purchase in restocking trip (kg)
Maize
Beans

57
Cowpeas-(khobwe)
Pigeon peas-(nandolo)
Codes for Fi1:1=daily, 2=once a week, 3=twice a week, 4=twice a month, 5=once a month, 6=other (specify)____________________

58
(G) MARKET INTEGRATION
Commodity From how many markets do you usually source the commodity for sale in this market?
Of these, what is the major source market (name of place/market)?
Price in the source market at the time of the study? (MK/kg)
Price in current markets (MK/kg)
Has the source market been affected by any of the disasters? Codes for Hja4 0=None, 1=Fall army worms, 2=Drought, 3=Floods, 4=Early secession of rain, 5=Other (Specifiy))
How has the demand of the source market been impacted by the disaster
Impacts on the levels of supply in the disaster affected areas: 1=Increased 2=Decreased 3=No change 4=Don’t know 999=Not applicable
(a) current 2017/18
Gga1 Gga2 Gga3 Gga4 Gga5 Gga6
Maize
Beans
Cowpeas-khobwe
Pigeon peas-nandolo

59
(H) COMMODITY TRANSPORTATION
(a) For each of the commodities you are trading in, tell me more on transportation of the commodity for sale in the current season:
Commodity Location of the source market ( as in Hja1& Hjb1) 1= within the market 2= within the district 3=outside the district (name)
Distance from the source to this market (km)
Type of transport used 1=vehicles 2 oxcart 3=bicycle 4=head 5=None (Multiple response)
Quantity transported per trip
Total costs per trip (MK)
Who sets the transport prices? 1=Transporter 2= me as buyer
(a) 2017-18 current
Ha1 Ha2 Ha3 Ha6 Ha7 Ha9
Maize
Beans
Cowpeas-khobwe)
Pigeon peas-nandolo)
(J) PHYSICAL ACCESSIBILITY TO SUPPLY/SOURCE AND DEMAND/DESTINATION MARKETS

60
Commodity/ Year Physical Accessibility
(Condition of road) for the major source market 1= Excellent; 2= Good (Passable), 2=Bad (Impassable)
If the road is/will be/ was impassable, how does the trader deal with the problem so that the business doesn’t stop
Physical Accessibility (Condition of road) to the major demand market 1= Excellent; 2= Good (Passable), 2=Bad (Impassable)
If the road is/ will be/ was impassable, how does the trader deal with the problem so that the business doesn’t stop.
(a) 2017-18 current
Ja2 Ja3 Ja5 Ja6
Maize
Pulses (Beans)
Pulses (cowpeas-khobwe)
Puses(Pigeon peas-nandolo)
K MODEL OF SELLING WHETHER BY CREDIT OR VOUCHER
K1. Do you sale on credit to some of your customers? 1=Yes, 2=No
K2. If yes, how much of total sales for last month was on credit (MK) ______________________

61
K3. If yes, in which period of the year is your total sales on credit the highest (mention months)?
_________________________
1= January; 2= February, 3= March; 4= April; 5= May; 6= June; 7= July; 8= August; 9= September; 10= October, 11=
November; 12= December
K4. Have you ever sold your commodities using cash vouchers? 1=Yes, 2=No
K5. If yes, which Year,? ………………………; and K6. How much of total sales was on cash vouchers? (MK)
______________________
K7. If no, would you accept to sell your commodities using cash vouchers? 1=Yes, 2=No
K8. If no,
why?_____________________________________________________________________________________________
L DEMAND OF AGRICULTURAL COMMODITIES ON THE MARKET: CHARACTERISTICS OF BUYERS
Commodity Your major buyers/ customers (types of buyers) (Codes La1)
Where do they come from?
Location Distance from here(km)
(a) For 2017-18 (current situation)
La1
La2
Maize 1.

62
Commodity Your major buyers/ customers (types of buyers) (Codes La1)
Where do they come from?
Location Distance from here(km)
2.
3.
Legumes 1.
2.
3.
Codes for La1:1=Local people, 2=Fellow traders/vendors, 3=Schools, 4=Restaurants, 5=Hospitals/clinics,
6=Others_____________
M TRADER’S COMMODITY STORAGE FACILITIES
M1. Do you own a storage facility for the staple food commodities you trade in?
1=Yes; 2=No
M2. If no, where do you keep/store your commodity?
1=Rented storage facility, 2=dwelling house, 3=None, 4=others (specify)____________________________

63
M3. If Yes in M1, then, what commodities do you usually keep in the storage facility?
M3a1 M3a2 M3a3
Main commodities stored in the
facility owned by the trader
Total storage
capacity (kg)
Have you been leasing/renting out your storage facility? If Yes,
amount realized?
1=Yes
2=No
Amount realized
(MK) in a year
Major client (s)
1.
2.
3.
4.
M. Any other information you may wish to provide/ or comments to make on agricultural market issues?
____________________________________________________________________________________
____________________________________________________________________________________
___
Thank you very much for participating in the study by providing useful market information!!!

64

65
Appendix II: Markets Visited and Their Type Traditional Authority
Market Visited Buying Price
Selling Price
Type of Market
Source Market
Destination Market Transition Market
Mzimba District
Mtwalo Mzimba Boma K65 K75 X Kasungu X
Kampingo Sibande Mzuzu/Zigwagwa K75 K90
Mzuzu
Mwabulabo Jenda/ Why Not K50 K60 X Zigwagwa market and Lilongwe X
Nkhata Bay District
Limphasa Mpamba K70 K90
Mpamba Mkumbira Nkhatabay Boma K70 K90
Usisya X
Tukombo Chintheche K80 K90
Likoma X
Rumphi District
Chikulamayembe Rumphi Boma K60 K70 X Rumphi Boma
Zolokero Hewe K60 K70 X Karonga and Nyungwe market X
Chikulamayembe Msika wa Njala K60 K70
Rumphi Boma

66
Traditional Authority
Market Visited Buying Price
Selling Price
Type of Market
Source Market
Destination Market
Transition Market
Karonga District
Kaporo Songwe K70 K80
Songwe Kyungu Karonga Boma K70 K80 X
X
Wansambo Uliwa K80 K90
Uliwa Chitipa Disrict
Themba Nthalire Nthalire K70 K95
Nthalire Themba Nthalire Kapirinkhonde K70 K95 X Karonga X
Mwaulambya Chitipa Boma K70 K95 X Karonga X
Ntchisi District
Kalumo Ntchisi Boma 50/60 70/80 Malomo, Ntchisi
Boma
Lilongwe, X
9 Miles 50/60 70/80 X Lilongwe, Dwangwa. X
Chilooko Malomo 50/60 70/80
X Lilongwe, Dwangwa,
Nkhotakota,
X
Nkhotakota District
Kulula Khotakota Boma 70 80/90 Malomo/ 9 Miles/ X
60/70 90/120 Malomo,
Siyasiya, Nchisi
Boma,
X
Kafuzila Dwambazi 60/70 100/125 Jenda, Nchisi X

67
Mwadzama Mwansambo
Turnoff
60/70 X Dwangwa/ Lilongwe X
Mwansambo Mwansambo 6/70 80/90 X Dwangwa X
Mwadzama Benga
Kanyenda/
Malenga Chanzi
Dwangwa 70/80 100/120 Malomo/ Nchisi/
Siyasiya/
Lilongwe
X
Traditional
Authority
Market Visited Buying
Price
Selling
Price
Type of Market
Source
Market
Destination Market Transition
Market
Makanjira/
Mwanza
Thavite 60/70 70/80 Sisysiya/
Mwansambo
Turnoff
X
Khombedza Siyasiya 50/60 70/80 X Mwansambo/ Salima
Boma/ Dwangwa
X
Kaloinga Salima Boma 60/70 90/100 Siyasiya/
Dedza/ Nchisi
Golomoti
X
Kalonga Salima Kamuzu
Road
60/ 70 90/100 Siyasiya/
Dedza/
Golomoti/
Nchisi
X

68
Ndindi Ngodzi 70 80/90 Nchisi/
Sisyasiya
X
Bibi Kulunda Lifuwu Golomoti X
Ndindi Lifidzi
Ndindi Chipoka 60/70 70/80 Golomoti/
Dedza/ Nchisi
Maganga Senga Bay 70/80 100/120 G0lomoti/
Dedza/ Nchisi/
Siyasiya
X
Mvera 60/70 70/80 X/ Chezi/
Siyasiya
X/ WFP X

69
Traditional
Authority
Market Visited Buying
Price
Selling
Price
Type of Market
Source
Market
Destination Market Transition
Market
Dedza District
Kachindamoto
Ntakataka X
Golomoti 50/60 60/70 X Blantye/ Lilongwe/
Salima/
Mangochi/Liwonde
X
Bembeke 60/70 70/75 X Blantye/ Salima X
Kaphuka Chimbiya 60/70 60/80 X Lobi/ Thete Blantyre/ Mangochi/
Lilongwe
X
Kachele Lobi 50/60 60/70 X Chimbiya/ X
Kasumbwi/
Kamenyagwaza
Dedza Boma 60/70 70/80 X Lobi/
Chimbiya/
Mayani
Blantyre/ Mangochi/
Lilongwe/ Salima
X
Kachele/ Kaphuka Thete 60/70 70/80 X/ Lobi Blantyre/ Chimbiya/
Lilongwe/ Mangochi
X
Chilikumwendo Magomelo 50/60 60/70 X Mitundu/ Lilongwe/
Chimbiya
X
Kasungu District
Mwase Kasungu Boma K50 K60 X Lilongwe (NFRA) X

70
Santhe Santhe K50 K60 X Santhe Wimbe Mtunthama K50 K60 X Mtunthama Chisemphere Chatoloma K50 K60 X Chatoloma Kaluluma Nkhamenya K50 K60 X Nkhamenya Mphomwa Chamama K50 K60 X Chamama

71
Traditional
Authority
Market Visited Buying
Price
Selling
Price
Type of Market
Source
Market
Destination Market Transition
Market
Lilongwe District
Chadza/ Kalumbu Nathenje 60/70 70/80 X Blantyre/ Wfp/
Lilongwe
X
Mazengela/
Tsabango
Nkhoma 60/70 70/80 X Lilongwe/ Mangochi X
Chadza/Chiseka/
Masula
Mitundu 50/60 60/70 X X/ Lilongwe/ Blantyre X
Nchesi 60/70 70/80 Mitundu/
Chezi/Dowa/
Nchinji/
Msudwe
X X
Chitukula Mgona 60/70 70/80 Mitundu/
Nchinji/
Msudwe/
Nambuma
X X
Kasiya 60/70 70/80 X Lilongwe/ Msungwi X
Kabudula Ukwe 60/70 70/80 X Mchesi/ Kanengo/X

72
Mtema Ngwangwa 60/70 70/80 X X
Kabudula Kabudula 60/70 70/80 X Lilongwe X
Mchinji District
Mkanda Mkanda 50/60 60/70 X Mchinji Boma/ Lilongwe X
Mchinji Boma Zulu 50/70 60/70 X/ Mkanda/
Boarder
X/ Lilongwe X
Kamwendo Zulu/Mduwa 50/60 60/70 X / Mikundi/
Chiosya/ Kapili
Lilongwe X
Walilanji Mavwele 35-60 60/70 X/ Zambia/ Lilngwe X

73
Traditional
Authority
Market Visited Buying
Price
Selling
Price
Type of Market
Source
Market
Destination Market Transition
Market
Dowa District
Dzoole Mponela 50/60 60/80 X Lilongwe/ Dwangwa/
Nkhotakota
X
Chakhadza Madise 50/60 60/80 X Lilongwe X
Kayembe/
Chitukula
Nambuma X/ Kalonga/
Kasiya
Lilongwe/
Kanengo/Blantyre
X
Mkukula Lumbadzi Nambuma/
Dowa/ Chezi/
Mponela
X X
Dowa Boma X X/ Chezi X
Chiwere Chezi X Lilongwe/ Salima/
Dwangwa
X
Ntcheu District
Masasa
Sharpe Valley
75
80
Golomoti,
Kampepuza
&Tsangano
T/Off
X

74
Kwataine
Ntcheu Boma
70
80
Tsangano
T/Off, Lizulu
X
X
Mpando
Kambilonjo
70
75
Surrounding
villages and
Mozambique as
it lies in the
border lines
Most markets in the
Southern Region
X

75
Traditional
Authority
Market Visited Buying
Price
Selling Price Type of Market
Source
Market
Destination Market Transition
Market
Njolomole
Tsangano T/Off 70
75
Surrounding
villages and
also Tsangano
Most markets in
Southern Region
X
Mphambala
Ntonda
70
75
Surrounding
villages and
Doviko which
borders Malawi
and
Mozambique
Most markets in
Southern Region
X
Makwangwala Kampepuza 70 75/80 Surrounding
villages
Southern Region X
Chanthunya
Phalula
85
110
Ntonda,
Kampepuza,
Tsangano t/Off
and Lizulu
X
Nsamala Balaka Boma
85
100
Ntonda,
Kampepuza,
Tsangano
T/Off, Lizulu
Kambilonjo
X
X
Kachenga Mbera 85 110 Ntonda,
Kampepuza,
X

76
Tsangano
T/Off, Lizulu,
Kambilonjo and
Golomoti
Kalembo
Ulongwe
85
110
Ntonda,
Kampepuza,
Tsangano
T/Off,
Kambilonjo and
Katuli
X
Amidu
Mangochi T/Off 80
100/110
Katuli,
Kampepuza,
Tsangano
T/Off, Lizulu,
Kambilonjo
X
X
Traditional
Authority
Market Visited Buying
Price
Selling
Price
Type of Market
Source Market Destination
Market
Transition
Market
Mangochi District
Chimwala
Chimwala
80
110
Katuli,Tsangano T/Off and
Lizulu
X

77
Mponda
Mangochi Boma
70
100
Katuli, Kampepuza, Tsangano
T/Off, Lizulu, Kambilonjo,and
Chimbiya
X
X
Namkumba
Monkey Bay
80
110
Katuli, Golomoti, Kampepuza
and Chimbiya
X
Makanjira
Makanjira
70
100/110
Surrounding areas and most
for Mozambique during lean
periods
X
X
Chowe
M'baluku
80
100/110
Katuli, Mangochi Boma,
Tsangano T/Off and Lizulu
X
X
Katuli
Katuli /Mtembo
70
75
Mtembo in Mozambique as
this is the border post
between Malawi and
Mozambique
Most markets in the
Southern Region

78
Traditional
Authority
Market Visited Buying
Price
Selling
Price
Type of Market
Source Market Destination
Market
Transition
Market
Machinga District
Sitola
Liwonde
80
100/
110
Katuli, Tsangano T/Off,
Chimbiya and Lizulu
X
X
Nsanama
Msanama
85
K70
Katuli, Tsangano T/Off,
Chimbiya, Lizulu, and
Nayuchi
X
Liwonde/Kawing
a
Ntaja
80
110
Katuli, Tsangano T/Off,
Chimbiya Lizulu, and
Nayuchi
X
X
Chikwewo
Chikwewo
85
110
Katuli, Chimbiya Lizulu,
Mngokwe which borders
Mozambique and Nayuchi
X
Nayuchi
Nayuchi
70
75
Surrounding villages and
most quantities are from
Mozambique
X
X
Kapoloma
Nselema
70
110
Katuli, Tsangano T/Off
and Lizulu
X

79
Chamba
Mpita
70
110
Katuli, surrounding
villages and Tsangano
Turn Off
X
Zomba District
Malemiya
Songani
70
90/100
Surrounding villages, Katuli,
Tsangano T/Off, Chimbiya
and Lizulu
X
X
Mlumbe Masaula 7O 110
Lizulu, Lunzu, Tsangano
T/Off X
Mwambo
Jali
70
100
Katuli, Chimbiya, Tsangano
T/Off
X
X
Chikowi
Mayaka
80
110
Farmers from within, Katuli,
Tsangano T/Off, Lizulu
X
X
Chikowi
Thondwe
80
110
Farmers from within, Katuli,
Tsangano T/Off, Lizulu
X
Chikowi
Mpondabwino
80
110
Katuli, Tsangano T/Off, Lizulu
and Chimbiya
X
X
Traditional
Authority
Market Visited Buying
Price
Selling
Price
Type of Market
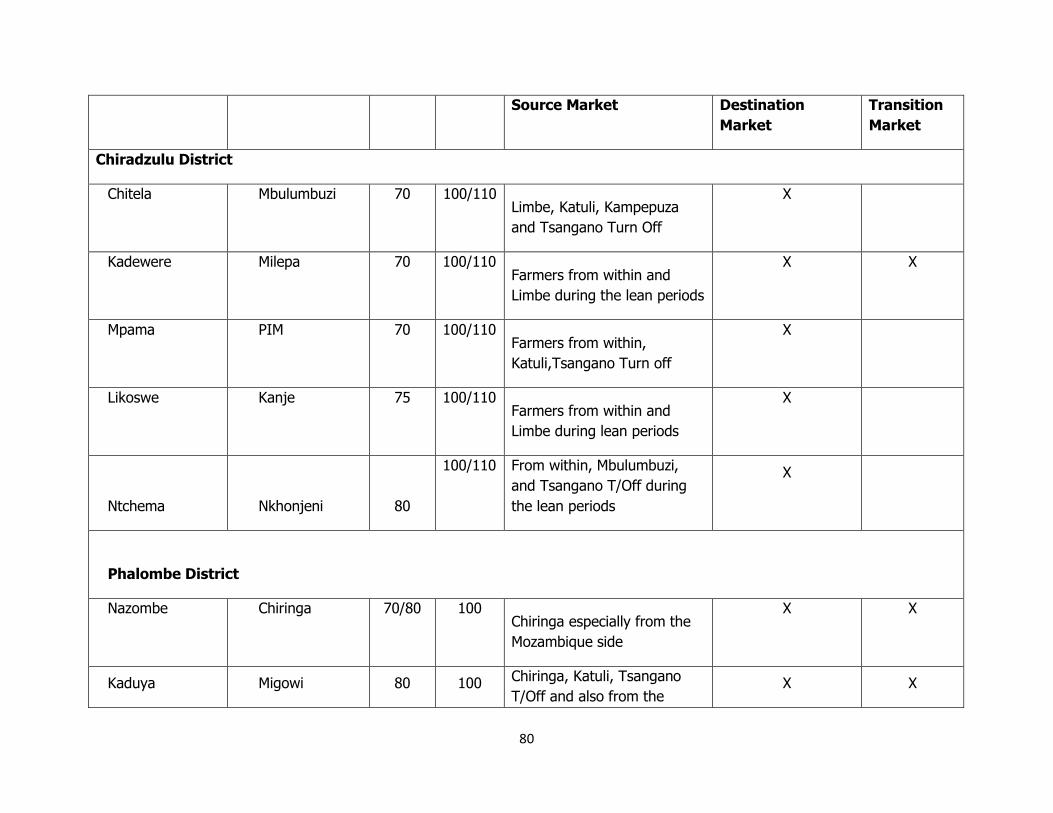
80
Source Market Destination
Market
Transition
Market
Chiradzulu District
Chitela
Mbulumbuzi
70
100/110
Limbe, Katuli, Kampepuza
and Tsangano Turn Off
X
Kadewere
Milepa
70
100/110 Farmers from within and
Limbe during the lean periods
X
X
Mpama
PIM
70
100/110 Farmers from within,
Katuli,Tsangano Turn off
X
Likoswe
Kanje
75
100/110 Farmers from within and
Limbe during lean periods
X
Ntchema Nkhonjeni 80
100/110 From within, Mbulumbuzi,
and Tsangano T/Off during
the lean periods
X
Phalombe District
Nazombe
Chiringa
70/80
100
Chiringa especially from the
Mozambique side
X
X
Kaduya Migowi 80 100 Chiringa, Katuli, Tsangano
T/Off and also from the X X

81
surrounding farmers
Jenala Maliro 80 110 Jali, Chiringa and Katuli X
Mkumba
Phalombe
Boma
80
100
Farmers from within but
Chiringa is the major source
X

82
Traditional Authority Market Visited Buying
Price
(MWK)
Selling
Price
(MWK)
Type of Market
Source
Market
Destinatio
n Market
Transitio
n Market
Nsanje District
Ndamela 1. Marka 80 100 Tsangano,
Chimbiya
x
Ndamela 2. Mtowe 80 90/100 Tsangano,
Chimbiya
X
Malemia 3. Nsanje Boma 80 90/100 Tsangano X
Malemia 4. Fatima 80 110 Ntcheu X
Mbenje 5. Bangula 80 100 Tsangano X
Mbenje 6. Sorgin 80 100 Tsangano x
Tengani 7. Tengani 60 90 Mozambique X (Limbe) X
Chikwawa District
Ngabu 8. Ngabu 70/80 90/100 Ntcheu X
Lundu 9. Nchalo 80 100/110 Tsangano X ( Limbe) x
Lundu 10. Tomali 80 100 Chimbiya, x
Katunga 11. Dyeratu 80 90/100 Tsangano X
12. Mkhate 80 100 Tsangano x

83
13.
Blantyre District
Kapeni 14. Chadzonda 70/80 90/100 Ntcheu X
Kapeni 15. Lunzu 80 90/110 Sera,
Tsangano
X
Lundu 16. Lilangwe 80 100 Chimbiya,
Lizulu
X
Kunthembwe 17. chikuli 80 100 Ntcheu X
Chigaru 18. Zelewa 80 90/100 Makanjira ,
Chimbiya
X( Mwanza) X

84
Traditional Authority Market Visited Buying
Price
(MWK)
Selling
Price
(MWK)
Type of Market
Source
Market
Destinati
on Market
Transition
Market
Thyolo District
STA Boidi 19. Bvumbwe 80 90/100 Ntcheu X
20. Thonga 80 100 Ntcheu X
Mchiramwera 21. Thyolo Boma 80 100 Ntcheu X
Nsabwe 22. Thekerani 60/ 80 90/100 Mozambique ,
Ntcheu
X
Kapichi 23. Luncheza 80 100 Ntcheu X
Nsabwe 24. Pa 50 Trading 80 90 Bvumbwe, X
Mulanje District
Mabuka 25. Chitakale 60/80 90 Mozambique,
Mchinji,
Ntcheu
X
Mabuka 26. Chinakanaka 70/80 90/110 Ntcheu, Dedza X(
Blantyre)
X
Chikumbu 27. Mulanje Boma 70 90/100 X

85
Mjema 28. Limbili 60 80/90 Mozambique X
(Blantyre)
X
Mjema 29. Muloza 60 80/90 Mozambique X(Blantyre) X
Neno District
Chekucheku 30. Neno Boma 80 110 Ntcheu X
Mulauri 31. Ligowe 60/80 90/100 X (Ntcheu) X
Mulauri 32. Chifunga 80 90/100 Ntcheu X
Mwanza District
Kanduku 33. Mwanza Boma 70/80 90/100 Ntcheu X
Kanduku 34. Mwanza chipatala 70/80 90/100 Ntcheu X