report prepared for: eel river recovery project€¦ · eel river recovery project: 2012 water...
TRANSCRIPT
Eel River Recovery Project: 2012 Water Temperature and Flow Monitoring Report i
Eel River Recovery Project
2012 Citizen Assisted Monitoring Water Temperature, Flow and Toxic Algae - Final Report
Report Prepared for: Eel River Recovery Project
With funding from: Rose Foundation and Patagonia
By: Patrick Higgins ERRP Volunteer Coordinator
January 31, 2013

Eel River Recovery Project: 2012 Water Temperature and Flow Monitoring Report ii
Acknowledgements
The Eel River Recovery Project (ERRP) was formed in late 2011 because of concerns regarding salmon runs, diminishing Eel River flows, and toxic algae outbreaks. This study is the first to test hypotheses and provide data on which to base community action. The ERRP is extremely grateful to the Rose Foundation and Patagonia for the core grant funds that supported citizen-assisted monitoring throughout the Eel River watershed. Private firms Kier Associated and Pacific Watershed Associates also made contributions to support final analysis and reporting. ERRP is also very thankful for our umbrella organization, the Trees Foundation, for supporting our efforts to help the Eel River. The North Coast Regional Water Quality Control Board and the Mendocino County Water Agency loaned ERRP more than 70 automated water temperature sensing gauges in 2012, which made this study possible. ERRP also appreciates the cooperative working relationship we have established with the Humboldt County Department of Public Health so that we can assist them in helping protect the community. The greatest thanks, however, must be reserved for the many residents throughout the watershed who engaged as ERRP volunteers, allowed access to their properties, and joined us in the field to collect scientific data and take photopoints. As each of them learned more about their local creeks or river reaches, they also provided pieces of the puzzle that can be assembled to understand the overall ecological condition of the Eel River. Through their dedication and support, ERRP volunteers were able to begin trend monitoring that can help us measure changes over time and adjust the course of restoration accordingly. Diane Higgins deserves special thanks for editing this report, assisting in the field, maintaining ERRP’s website and supporting the organization in many other ways.
Rose Foundation

Eel River Recovery Project: 2012 Water Temperature and Flow Monitoring Report iii
Thank You!
ERRP Volunteers 2012 Water Temperature, Flow
and Toxic Algae Watch
Sal Steinberg Paul Trichilo Paul & Barbara
Domanchuk Maureen McIver Diane Higgins Martin Mitchell Karen & Scott Walsh Larry Desmond Jerry Albright Kelly Harris Wally Stahle Bruce & Heron Hillbach-
Barger Dane Downing Bill Reynolds David Sopjes Vincent DiMarzo Graham & Dotti Russell Cathy Warren
Eel River Recovery Project: 2012 Water Temperature and Flow Monitoring Report iv
Table of Contents Cover………………………………………………………………………………….. i Acknowledgements……………………………………………………………………. ii Table of Contents……………………………………………………………………... iii Background/Focus of Inquiry…………………………………………………………. 1-2 Methods………………………………………………………………………….......... 2-3 Results ……………………………………………………………………………….. 3-12 Discussion ………………………………………………………………………….. 12-18 Recommendations…………………………………………………………………... 18-19 Conclusion…………………………………………………………………………….... 19References…………………………………………………………………………. 20-21 Attachment 1. Table of Water Temperature Probes 2012 ERRP Project ………. 22-23
Eel River Recovery Project: 2012 Water Temperature and Flow Monitoring Report 1
Background/Focus of Inquiry The Eel River Recovery Project (ERRP) was formed in late 2011 because of concern in the Eel River watershed about diminishing flows, deteriorating water quality, and the future of salmon runs. Community scoping meetings held in Fortuna, Redway and Willits, in September 2011, provided the foundation for ERRP’s agenda. An ERRP Advisory Group met in retreat to create 2012 and 2013 Action Plans (Smalley and Higgins 2011, Higgins 2012). Toxic blue-green algae or Cyanobacteria, which is now commonly present in the margins of the lower Eel River, South Fork Eel and Van Duzen River, is known to cause dog fatalities and pose a risk to human health (Hill 2010, Puschner et al. 2008). ERRP sought out grant funds to support citizen monitoring throughout the watershed and to set up a toxic algae response mechanism so the community can avoid unnecessary risk, but also be aware when it is safe to recreate. Long time Eel River residents are concerned about flow depletion in the watershed. Creeks that once supplied their precious drinking water, provided a refreshing place to cool off in the summer, and nurtured salmon and steelhead juveniles were drying up. Most watershed residents are not trained scientists, so they value the opportunity to assist in scientific inquiry to see if they can verify their observations, which are otherwise treated as “anecdotal”. ERRP is not advocacy oriented. Its objective is to provide scientific data that documents conditions and trends. This will provide a foundation of trust and help the community get focused on solutions instead of arguing over whether there is a problem. In the near term, two hypotheses drove the 2012 ERRP monitoring project:
1) Toxic algae blooms are driven by reduced flow and increased nutrient pollution and would not flourish, if the Eel River were closer to its historic range of ecological variability. 2) Stream flow has diminished as a result of increased agricultural diversions and domestic water use since the passage of Prop 215 in 1996.
Citizen monitoring is being used to supplement data from public agencies and will also be used for trend monitoring and to help assess effectiveness of restoration. Fisheries and watershed scientist Patrick Higgins was the lead contractor on this project. He has previous experience assisting with citizen monitoring in northern California watersheds and participated in a previous Eel River watershed-wide water quality study by the Humboldt County Resource Conservation District (HCRCD) (Friedrichsen 1998). Friedrichsen (1998) collected or acquired water temperature data in the Eel River watershed in1996 (216 locations) and in1997 (227 locations) and compared those temperature regimes with baseline data collected after the 1964 flood by Kubicek (1977). The Humboldt County RCD continued to collect water temperature data through 2003 and all these data are available to ERRP to serve as a baseline. Because of the relationship of flow volumes and transit time and water temperature (Pool and Berman 2000), ERRP intends to use water temperature data as an indicator of flow depletion. However, many locations where water temperatures were measured in 1995-1996 are now dry

Eel River Recovery Project: 2012 Water Temperature and Flow Monitoring Report 2
and photopoints with known GPS locations serve as evidence of flow depletion without temperature analysis. Photopoints can also be used to monitor changes over time in riparian areas and to assess stream damage after floods. The study of toxic algae problems was largely experimental. ERRP volunteers regularly walked sections of river where a toxic alga has been observed in the past. and where dog fatalities have occurred. Water temperature data were collected at these locations and communication was established with the Humboldt County Department of Public Health. Volunteers were set to engage with county staff, if risk of toxic algae development appeared high. In some cases, the location of probe placement was selected to answer citizen volunteer questions. Did an earthflow on Dobbyn Creek degrade salmon habitat? How do beaver dams in Outlet Creek affect flows and water temperatures? Do pools that have become isolated because of flow depletion maintain groundwater connections and their ability to sustain juvenile steelhead? Methods The main method of inquiry for the 2012 ERRP citizen monitoring effort was measuring water temperature, although photographs with time date stamps and known geographic location (GPS coordinates) are also an important source of evidence. Water temperature data were collected following the methods of Lewis (1999) and Friedrichsen (1998). Lewis et al. (2000) point out the possible problems with temperature data quality when deploying automated probes:
1) Exposure of the sensor to the air, 2) Improper calibration procedures, 3) Improper placement of the sensor in the stream, 4) Low battery, 5) Inherent malfunctions in the automated probe, and 6) Vandalism.
Calibration of Probes: Lewis (1999) points out that “all continuous stream temperature monitoring sensors should be calibrated against a National Institute of Standards and Technology (NIST) traceable thermometer. Sensors not meeting precision and accuracy data quality objectives should not be used.” Fifty four Optic Pro Onset Instrument water temperature sensors (Figure 1) were loaned to ERRP by the North Coast Regional Water Quality Control Board (NCRWQCB). The batteries were replaced and probes calibrated by NCRWQCB Water Quality Engineer Richard Fadness. Twenty four additional Hobotemp style Onset Instrument gauges were also loaned to ERRP by the Mendocino County Water Agency. ERRP replaced batteries in these units and Patrick and Diane Higgins performed calibration using an ice bath and an NIST thermometer purchased by the project following methods of Lewis (1999). Placement of Probes in the Stream: Lewis (1999) provides the following guidance on automated temperature probe placement:

Eel River Recovery Project: 2012 Water Temperature and Flow Monitoring Report 3
A) Optic Pro B) Hobotemp
Figure 1. Onset Instrument automated probe types used in the 2012 ERRP water temperature monitoring project.
“Sensors should be placed in a well-mixed zone, e.g., at the end of a riffle or cascade. Monitoring location should represent average conditions — not pockets of cold water refugia or isolated hot spots.”
Probe placement was supervised by ERRP Volunteer Coordinator Patrick Higgins, although volunteers were allowed to place some additional probes after being trained. Sensors were always placed in flowing water in the main flow or thalweg. The area was checked to make sure here were no apparent temperature anomalies and probes were placed at a depth of at least 3 feet or as deep as possible. Gauges were placed out of direct sunlight and out of contact with bedrock or bridge abutments that could act as heat sinks. Although Lewis (1999) cautions against placing probes in or around beaver ponds, ERRP purposefully selected a location below an Outlet Creek beaver pond to check for flow and temperature. Where possible, probes were placed at locations previously surveyed (Friedrichsen 1998) to allow for trend monitoring. Interval for Data Recording: Probes were set to record water temperatures every 30 minutes, which is substantially more frequent than the minimum sampling interval recommended by Lewis (1999) of 1.6 hours (96 minutes). Salmonids Water Temperature Tolerance References: Water temperature profoundly impacts Pacific salmon species and ERRP is very concerned with maintaining suitable salmonid habitat. Despite the fact that this report is more focused on water temperature and flow than salmon, charts below often refer to maxima or optimum temperature ranges for salmon. These temperature ranges are from McCullough (1999), although Welsh et al. (2001) provides the best information for coho salmon temperature tolerance for the northern California region. Assessment of suitability for salmonids often involves a powerful summary statistic, the floating weekly average water temperature, which is calculated by averaging the previous 3 daily average water temperatures with 4 days following. The maximum floating weekly average water temperature (MWAT) for the entire year is commonly used to compare between different streams or at the same location inter-annually (McCullough 1999). Results A total of 57 automated temperature probes were deployed by ERRP at locations throughout the Eel River watershed in the summer of 2012 (Figure 2, Attachment 1). Continuous water temperature data were collected at 45 sites; 8 probes were placed at locations where stream reaches went dry, and 4 probes were lost due to equipment failure that will be more fully explained below. Probe placement dates varied from early June in the Van Duzen to as late as August in the lower Eel River to check for adult Chinook salmon suitability.
Eel River Recovery Project: 2012 Water Temperature and Flow Monitoring Report 4
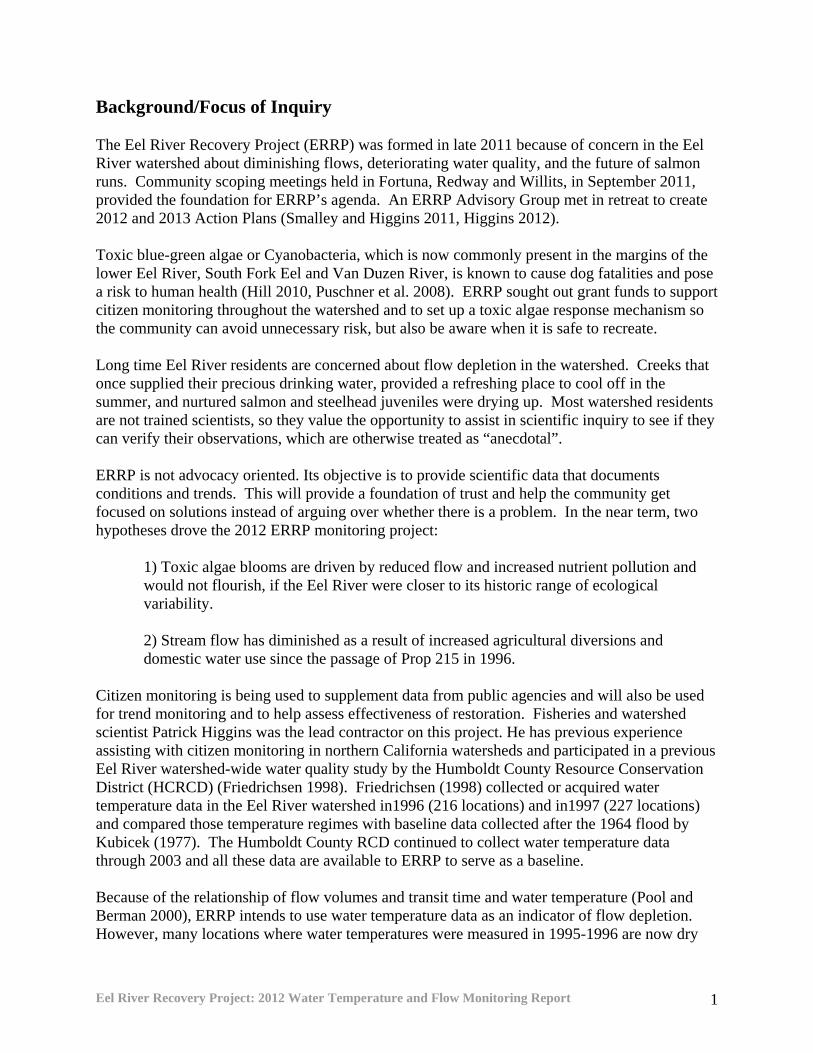
Figure 2. Water temperature automated probe sites where ERRP monitored in summer and fall of 2012. Each location where a temperature gauge was placed was also photo-documented in an upstream and downstream direction. Photos were also taken where stream reaches went dry in locations formerly known to be perennial. Four of the water temperature probes were placed in locations thought to at risk of toxic algae development in some years. Temperature probes were also placed in isolated pools in streams that lost surface flow in order to check for surface-groundwater interchanges that might sustain juvenile salmonids. Probes were also placed below a beaver dam on Outlet Creek and at other locations to help answer questions posed by volunteers. Overall Temperature Patterns: Lewis et al. (2000) described the basic patterns of northern California stream temperature relative to climatic zones, geography, topography, riparian characteristics and flow. Small streams nearer their headwaters are cooler than larger order streams further from their source. Areas nearer the ocean have greater influence from the coastal fog and tend to be cooler. Basinwide Main Eel River Reach Comparison: Figure 3 shows water temperatures in mainstem reaches of several forks of the Eel River with a wide range of values relative to salmonid suitability. The upper mainstem South Fork above Branscomb is cool enough for coho salmon. Mainstem reaches further from their headwaters at the Middle Fork below Williams Creek, upper main Eel at Emandal and the South Fork at Miranda all fell in ranges that were highly stressful or

Eel River Recovery Project: 2012 Water Temperature and Flow Monitoring Report 5
lethal. Water temperatures in the lower Eel River (12th, Fernbridge) are cooled by proximity to the ocean, but become elevated within a short distance upstream near Howe Creek and warmer still at Shively.
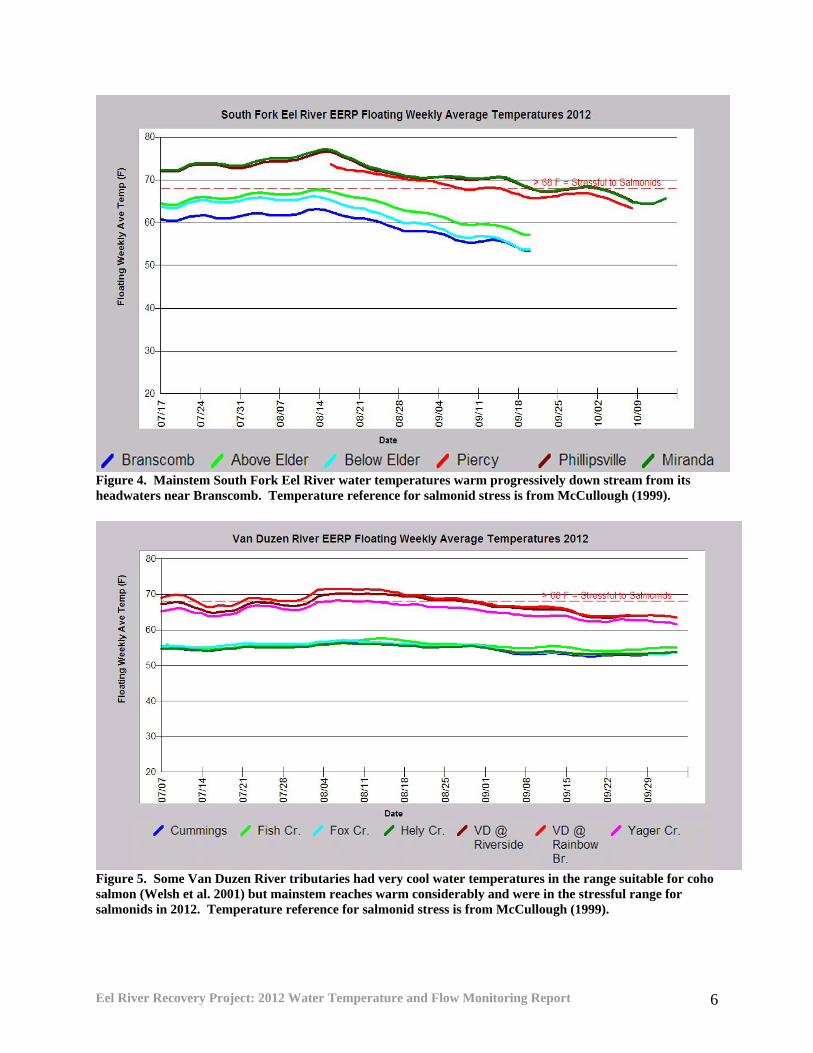
Figure 3. Floating weekly average water temperatures at a range of mainstem Eel River sites with a reference for salmonid stress (68 F) taken from McCullough (1999). Mainstem South Fork Eel River: The upper South Fork Eel above Branscomb Road and downstream within the UC Angelo Preserve (Figure 4) are some of the coolest mainstem locations in the entire Eel River basin. As the river increases in size further from its headwaters it warms considerably. The temperature near Piercy near Cook's Valley is intermediate but above optimal for salmonids, while the South Fork at Phillipsville and Miranda are both in the highly stressful range for salmon and steelhead juveniles. Temperature monitoring in the lower reach, downstream from Piercy, was also part of the toxic algae analysis project. Van Duzen Tributaries and Mainstem Reaches: The floating average weekly temperature of the mainstem Van Duzen River was in the stressful range for salmonids (McCullough 1999), while tributaries Cummings, Fish, Fox and Hely creeks were cool enough for coho salmon (Figure 5). Yager Creek is the largest Van Duzen tributary and its temperature is cooler than the mainstem but warmer than smaller streams. Temperature monitoring in the lower reach of the Van Duzen is also part of the toxic algae analysis project. Tributaries Serving As Refugia: The ERRP is concerned that flow depletion can elevate water temperatures above suitable levels for salmon and steelhead rearing so the 2012 monitoring project was in part to discover where cold water segments or refugia are located (Figure 6). May and Peterson (2003) define refugia as “an area where special environmental circumstances have
Eel River Recovery Project: 2012 Water Temperature and Flow Monitoring Report 6
Figure 4. Mainstem South Fork Eel River water temperatures warm progressively down stream from its headwaters near Branscomb. Temperature reference for salmonid stress is from McCullough (1999).
Figure 5. Some Van Duzen River tributaries had very cool water temperatures in the range suitable for coho salmon (Welsh et al. 2001) but mainstem reaches warm considerably and were in the stressful range for salmonids in 2012. Temperature reference for salmonid stress is from McCullough (1999).

Eel River Recovery Project: 2012 Water Temperature and Flow Monitoring Report 7
Figure 6. Seven tributaries surveyed for temperature by ERRP in 2012 were cool enough to support coho salmon (Welsh et al. 2001), including Bear (lower Eel), Howe, Price, Sherwood, and Elder creeks and Wolverton Gulch. Reference for salmonid stress is from McCullough (1999). enabled a species or community of species to survive after decline or extinction in surrounding areas” or “habitats or environmental factors that provide spatial and temporal resistance and/or resilience to aquatic communities impacted by natural and anthropogenic disturbances.” Cold water streams that can serve as refugia may flow from undisturbed watersheds, such as Wilderness areas, but may also be found in recovering timberland watersheds or well managed working landscapes. Jack of Hearts Creek on the upper South Fork and Wolverton Gulch in the Van Duzen River are among the coolest streams surveyed in 2012. Elder Creek, in the upper South Fork, is a control stream with no watershed disturbance. Bear Creek, Price Creek and Howe Creek in the lower Eel River basin have all substantially recovered from logging. Sherwood Creek and Willits Creek are some of the coolest of the Outlet Creek tributaries. Lower Eel River: The ERRP 2012 monitoring project also focused on the lower Eel River to check for suitability for holding adult Chinook salmon (Figure 7). Water temperatures in the lower Eel River are coolest at Fernbridge and warm progressively upstream, with a substantial jump between 12th Street and Howe Creek. The main Eel near Shively, below Dyerville, is sometimes cooler than the river downstream at Howe Creek. The floating weekly water temperatures of the lower Eel River reaches accessible to Chinook salmon remained above stressful until early September. The vanguard of the salmon run entered the lower Eel on August 16 (Vincent DiMarzo, personal communication).
Eel River Recovery Project: 2012 Water Temperature and Flow Monitoring Report 8
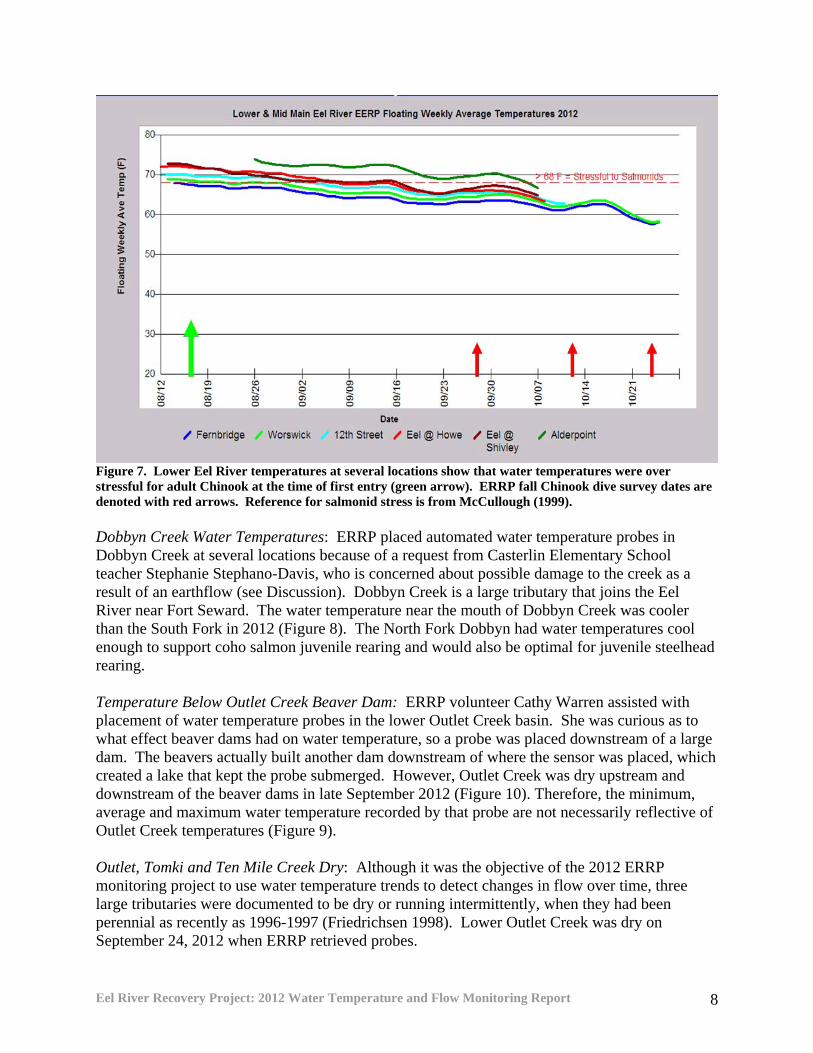
Figure 7. Lower Eel River temperatures at several locations show that water temperatures were over stressful for adult Chinook at the time of first entry (green arrow). ERRP fall Chinook dive survey dates are denoted with red arrows. Reference for salmonid stress is from McCullough (1999). Dobbyn Creek Water Temperatures: ERRP placed automated water temperature probes in Dobbyn Creek at several locations because of a request from Casterlin Elementary School teacher Stephanie Stephano-Davis, who is concerned about possible damage to the creek as a result of an earthflow (see Discussion). Dobbyn Creek is a large tributary that joins the Eel River near Fort Seward. The water temperature near the mouth of Dobbyn Creek was cooler than the South Fork in 2012 (Figure 8). The North Fork Dobbyn had water temperatures cool enough to support coho salmon juvenile rearing and would also be optimal for juvenile steelhead rearing. Temperature Below Outlet Creek Beaver Dam: ERRP volunteer Cathy Warren assisted with placement of water temperature probes in the lower Outlet Creek basin. She was curious as to what effect beaver dams had on water temperature, so a probe was placed downstream of a large dam. The beavers actually built another dam downstream of where the sensor was placed, which created a lake that kept the probe submerged. However, Outlet Creek was dry upstream and downstream of the beaver dams in late September 2012 (Figure 10). Therefore, the minimum, average and maximum water temperature recorded by that probe are not necessarily reflective of Outlet Creek temperatures (Figure 9). Outlet, Tomki and Ten Mile Creek Dry: Although it was the objective of the 2012 ERRP monitoring project to use water temperature trends to detect changes in flow over time, three large tributaries were documented to be dry or running intermittently, when they had been perennial as recently as 1996-1997 (Friedrichsen 1998). Lower Outlet Creek was dry on September 24, 2012 when ERRP retrieved probes.

Eel River Recovery Project: 2012 Water Temperature and Flow Monitoring Report 9
Figure 8. Floating weekly average water temperature of lower mainstem, South Fork and North Fork Dobbyn Creek with Elder Creek included for comparison as a control stream. References from McCullough (1999) and Welsh et al. (2001).
Figure 9. Minimum, average and maximum daily water temperature of area immediately below beaver dam on Outlet Creek. During the period of record beavers constructed another dam downstream that kept the probe submerged. The pond had elevated water temperatures unsuitable for salmonids.

Eel River Recovery Project: 2012 Water Temperature and Flow Monitoring Report 10
Figure 10. The bed of Outlet Creek upstream of Bloody Run Creek on September 26, 2012 showing the stream with no surface flow. ERRP planned to place a water temperature gauges in Tomki Creek, but surface flow at the mouth of Rocktree Creek (Hearst-Willits Road Xing) was interrupted on June 14, 2012 and no probe was placed (Figure 10). Ten Mile Creek went dry in August 2012 at Black Oak Ranch (Figure 11) and also at Branscomb Road west of Laytonville, where Friedrichsen (1998) found stream flows to be perennial in 1996 and 1997. A map of all reaches of streams that went dry during 2012 is displayed in Figure 12. Baechtel, Bloody Run, and lower Mill (MF) creeks all lost surface flow, but that is not atypical. However, upper Mill Creek above the town of Covelo went dry at a location where it was perennial in 1996 (Friedrichsen 1998). The question of whether the season of loss of flow has changed, such as in Baechtel Creek, will require further study. Loss of Groundwater Cooling in Isolated Pool: The pool at the Black Oak Ranch, shown in Figure 11, still harbored a steelhead yearling as of mid-August, despite many warm-water adapted invasive species also being present. The automated probe hourly data in Figure 13 show that water temperatures were cool enough to sustain the steelhead for the first few weeks after probe placement, but by late September water temperature warmed dramatically. Isolated pools in northern California streams often remain cool because of surface and groundwater connections (Nielsen et al. 1994); therefore, it is likely that the change in pool temperature on Black Oak Ranch resulted from loss of this groundwater cooling influence.

Eel River Recovery Project: 2012 Water Temperature and Flow Monitoring Report 11
Figure 10. Tomki Creek at Rocktree Creek (center), showing that flow was already disconnected when visited by ERRP on June 14, 2012.
Figure 11. Isolated pool on the Black Oak Ranch below Laytonville with the streambed of Ten Mile Creek leading into the pool, which is drying up.

Eel River Recovery Project: 2012 Water Temperature and Flow Monitoring Report 12
Figure 12. Map of locations or stream reaches where streams went dry during the 2012 survey.
Figure 13. The isolated pool in Ten Mile Creek had temperatures that support steelhead juvenile rearing in August, but greatly elevated temperatures in late September and early October.
Eel River Recovery Project: 2012 Water Temperature and Flow Monitoring Report 13
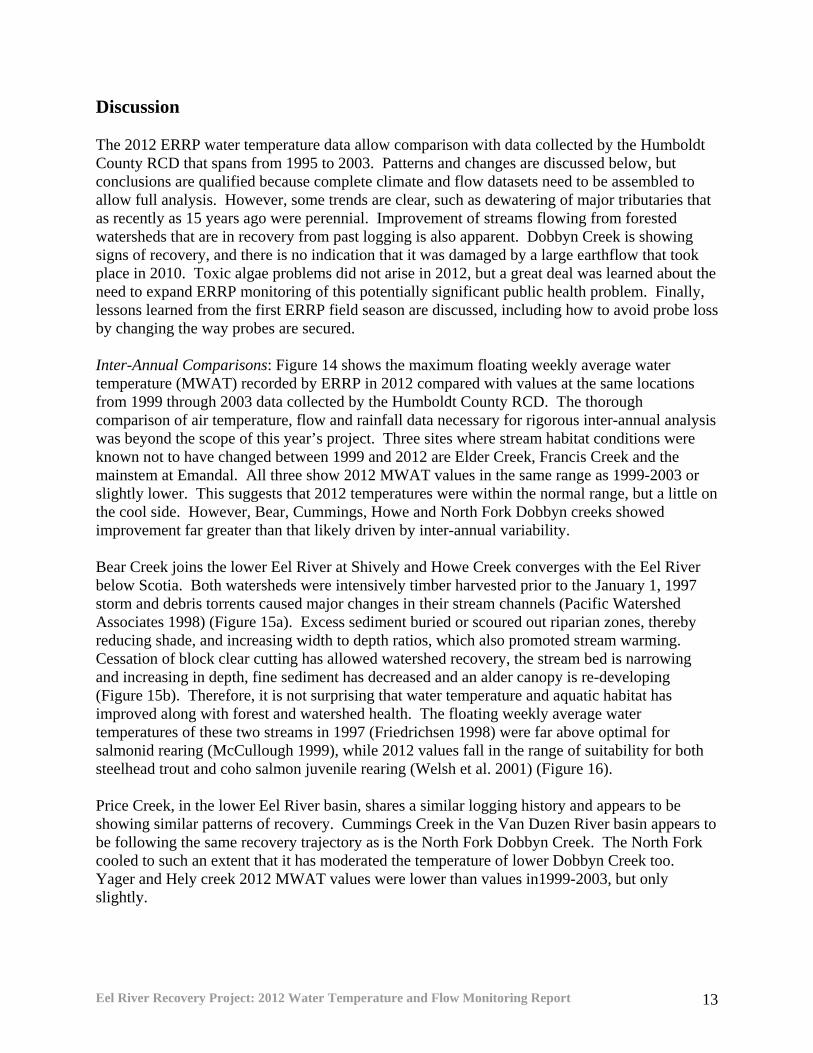
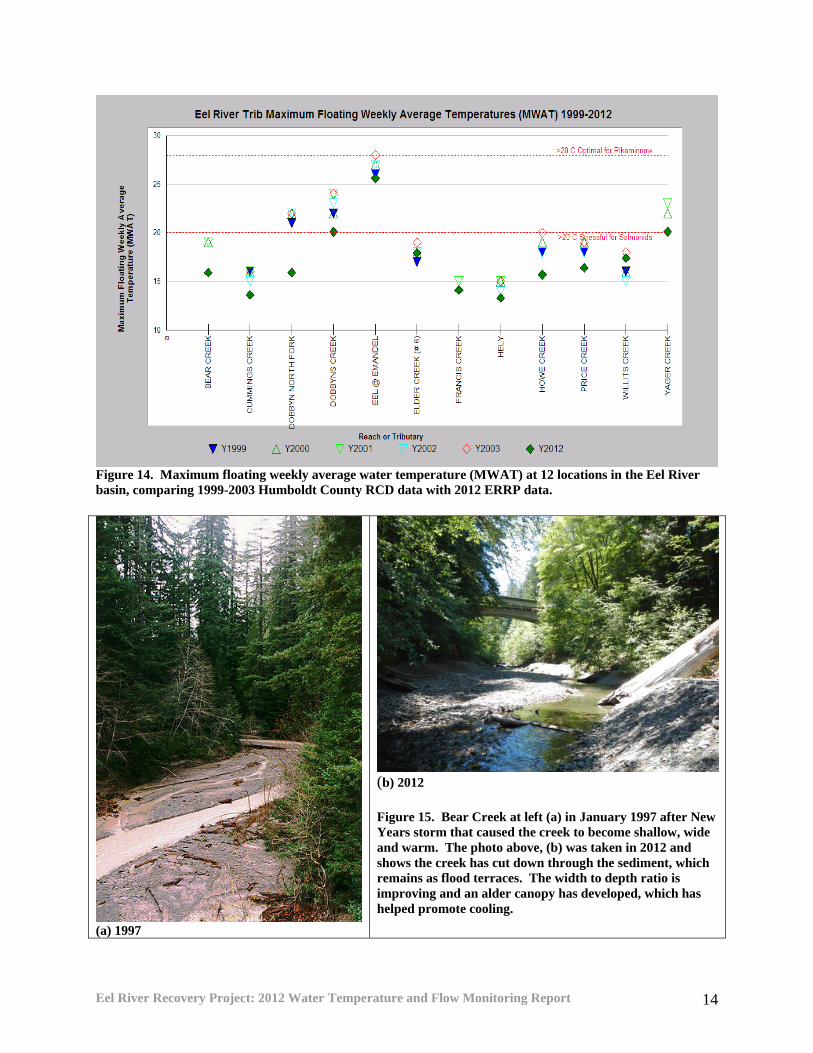
Discussion The 2012 ERRP water temperature data allow comparison with data collected by the Humboldt County RCD that spans from 1995 to 2003. Patterns and changes are discussed below, but conclusions are qualified because complete climate and flow datasets need to be assembled to allow full analysis. However, some trends are clear, such as dewatering of major tributaries that as recently as 15 years ago were perennial. Improvement of streams flowing from forested watersheds that are in recovery from past logging is also apparent. Dobbyn Creek is showing signs of recovery, and there is no indication that it was damaged by a large earthflow that took place in 2010. Toxic algae problems did not arise in 2012, but a great deal was learned about the need to expand ERRP monitoring of this potentially significant public health problem. Finally, lessons learned from the first ERRP field season are discussed, including how to avoid probe loss by changing the way probes are secured. Inter-Annual Comparisons: Figure 14 shows the maximum floating weekly average water temperature (MWAT) recorded by ERRP in 2012 compared with values at the same locations from 1999 through 2003 data collected by the Humboldt County RCD. The thorough comparison of air temperature, flow and rainfall data necessary for rigorous inter-annual analysis was beyond the scope of this year’s project. Three sites where stream habitat conditions were known not to have changed between 1999 and 2012 are Elder Creek, Francis Creek and the mainstem at Emandal. All three show 2012 MWAT values in the same range as 1999-2003 or slightly lower. This suggests that 2012 temperatures were within the normal range, but a little on the cool side. However, Bear, Cummings, Howe and North Fork Dobbyn creeks showed improvement far greater than that likely driven by inter-annual variability. Bear Creek joins the lower Eel River at Shively and Howe Creek converges with the Eel River below Scotia. Both watersheds were intensively timber harvested prior to the January 1, 1997 storm and debris torrents caused major changes in their stream channels (Pacific Watershed Associates 1998) (Figure 15a). Excess sediment buried or scoured out riparian zones, thereby reducing shade, and increasing width to depth ratios, which also promoted stream warming. Cessation of block clear cutting has allowed watershed recovery, the stream bed is narrowing and increasing in depth, fine sediment has decreased and an alder canopy is re-developing (Figure 15b). Therefore, it is not surprising that water temperature and aquatic habitat has improved along with forest and watershed health. The floating weekly average water temperatures of these two streams in 1997 (Friedrichsen 1998) were far above optimal for salmonid rearing (McCullough 1999), while 2012 values fall in the range of suitability for both steelhead trout and coho salmon juvenile rearing (Welsh et al. 2001) (Figure 16). Price Creek, in the lower Eel River basin, shares a similar logging history and appears to be showing similar patterns of recovery. Cummings Creek in the Van Duzen River basin appears to be following the same recovery trajectory as is the North Fork Dobbyn Creek. The North Fork cooled to such an extent that it has moderated the temperature of lower Dobbyn Creek too. Yager and Hely creek 2012 MWAT values were lower than values in1999-2003, but only slightly.
Eel River Recovery Project: 2012 Water Temperature and Flow Monitoring Report 14
Figure 14. Maximum floating weekly average water temperature (MWAT) at 12 locations in the Eel River basin, comparing 1999-2003 Humboldt County RCD data with 2012 ERRP data.
(a) 1997
(b) 2012 Figure 15. Bear Creek at left (a) in January 1997 after New Years storm that caused the creek to become shallow, wide and warm. The photo above, (b) was taken in 2012 and shows the creek has cut down through the sediment, which remains as flood terraces. The width to depth ratio is improving and an alder canopy has developed, which has helped promote cooling.
Eel River Recovery Project: 2012 Water Temperature and Flow Monitoring Report 15
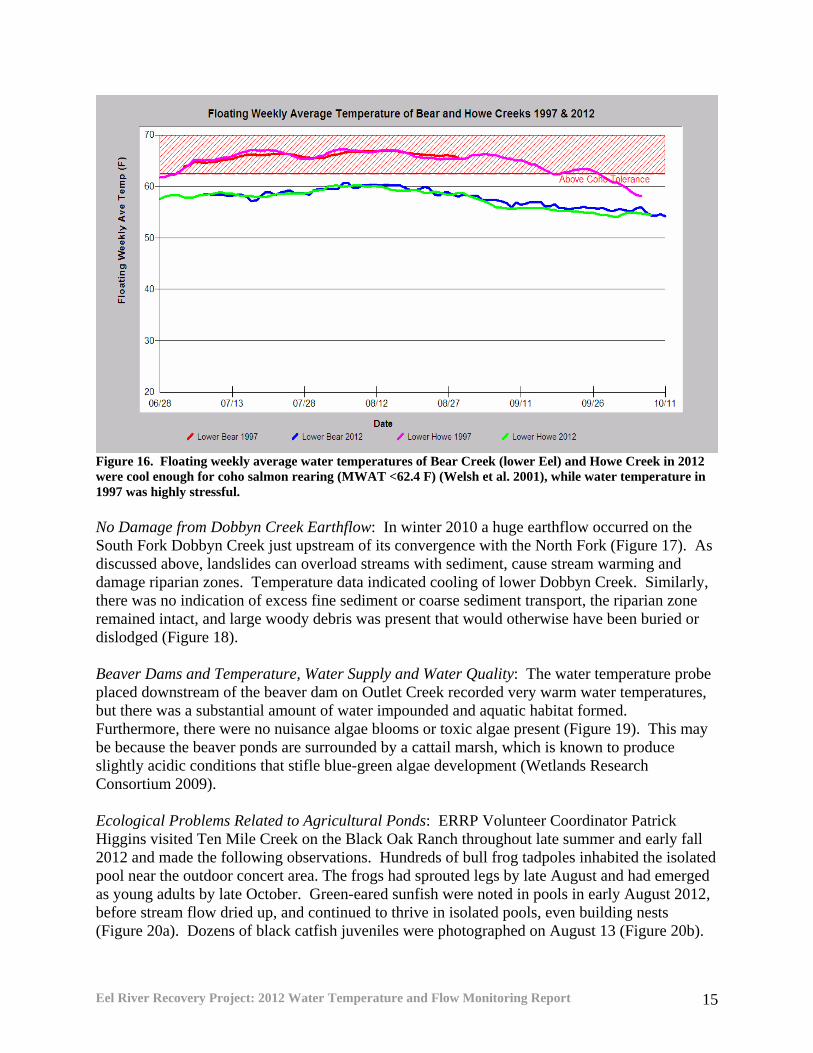
Figure 16. Floating weekly average water temperatures of Bear Creek (lower Eel) and Howe Creek in 2012 were cool enough for coho salmon rearing (MWAT <62.4 F) (Welsh et al. 2001), while water temperature in 1997 was highly stressful. No Damage from Dobbyn Creek Earthflow: In winter 2010 a huge earthflow occurred on the South Fork Dobbyn Creek just upstream of its convergence with the North Fork (Figure 17). As discussed above, landslides can overload streams with sediment, cause stream warming and damage riparian zones. Temperature data indicated cooling of lower Dobbyn Creek. Similarly, there was no indication of excess fine sediment or coarse sediment transport, the riparian zone remained intact, and large woody debris was present that would otherwise have been buried or dislodged (Figure 18). Beaver Dams and Temperature, Water Supply and Water Quality: The water temperature probe placed downstream of the beaver dam on Outlet Creek recorded very warm water temperatures, but there was a substantial amount of water impounded and aquatic habitat formed. Furthermore, there were no nuisance algae blooms or toxic algae present (Figure 19). This may be because the beaver ponds are surrounded by a cattail marsh, which is known to produce slightly acidic conditions that stifle blue-green algae development (Wetlands Research Consortium 2009). Ecological Problems Related to Agricultural Ponds: ERRP Volunteer Coordinator Patrick Higgins visited Ten Mile Creek on the Black Oak Ranch throughout late summer and early fall 2012 and made the following observations. Hundreds of bull frog tadpoles inhabited the isolated pool near the outdoor concert area. The frogs had sprouted legs by late August and had emerged as young adults by late October. Green-eared sunfish were noted in pools in early August 2012, before stream flow dried up, and continued to thrive in isolated pools, even building nests (Figure 20a). Dozens of black catfish juveniles were photographed on August 13 (Figure 20b).

Eel River Recovery Project: 2012 Water Temperature and Flow Monitoring Report 16
Figure 17. Earthflow just upstream of the convergence of South Fork and North Fork Dobbyn Creek. Photo taken August 26, 2012.
Figure 18. Lower Dobbyn Creek looking upstream from site where automated temperature probe was placed. Lack of fine sediment, intact riparian and large wood give indicate no damage resulting from the 2010 earthflow.

Eel River Recovery Project: 2012 Water Temperature and Flow Monitoring Report 17
Figure 19. Cathy Warren on Outlet Creek beaver pond in July 2012. There was no sign of nuisance algae blooms or toxic algae development. Green-eared sunfish and black catfish are exotic fish species originally native to lakes or Mississippi River tributaries in the Mid-West and South. They cannot survive flashy, high winter flows in Eel River tributaries such as Ten Mile Creek. The annual supply of warm water exotic species that dominate stagnating tributaries is coming from agricultural impoundments that provide ideal conditions. All three species are often introduced by land owners for recreation and their amusement, despite legal prohibitions of transplanting these organisms without a permit. Ecological effects of non-native warm-water fish are modest, but impacts from bull frogs on native frogs and amphibians are high due to their competitive size advantage.
Black catfish juveniles Figure 20. (Left) Green-eared sunfish over a circular nest. (Above) a swarm of black catfish larvae in an isolated Ten Mile Creek pool at Black Oak Ranch in August 2012.

Eel River Recovery Project: 2012 Water Temperature and Flow Monitoring Report 18
Summary of Toxic Algae Findings: The 2012 water year lacked early winter rainfall but precipitation continued through late spring, which promoted cool early-summer water temperatures. The summer air temperatures also rarely rose above 100 F in the interior of the Eel River basin, which moderated water temperatures as well. Consequently, toxic algae blooms were limited or non-existent. The Phillipsville toxic algae monitoring location on the Russell property serves as an example. No problem developed in 2012 (Figure 21a), while toxic algae did form there in the drier and warmer year 2009 (Figure 21b). ERRP volunteers also noted that the shape of pools can vary from year to year and can be more prone to toxic algae development, if extensive slow edge-waters form. Some nuisance algae were noted in the Holmes Pool in 2012 because of its extensive shallow areas, although whether toxic algae formed there is unknown. This variability called attention to the fact that ERRP needs to expand its monitoring capacity to cope with the magnitude and extent of this problem.
(a) 2012 (b) 2009 Figure 21. These photos show the South Fork Eel River at Phillipsville in 2012 (left), when no toxic algae formed, and in 2009 (right) when dog mortality was caused by the bloom depicted. Humboldt County Public Health Department provided the 2009 photo and staffer Harriet Hill is shown taking a sample. Lost Automated Temperature Probes: Wire used to secure stream gauges dissolved during the course of the summer, which was highly unexpected. Four NCRWQCB water temperature gauges were lost as a result in lower Williams Creek (MF), Rainbow Bridge on the Van Duzen River and at two upper mainstem Eel locations just below Hearst. Steelhead Water Temperature Tolerance: Juvenile steelhead were observed on the Middle Fork Eel River below Williams Creek (Figure 22 a & b) when the maximum daily water temperature was over 80 F, which exceeds what laboratory studies have show to be lethal (McCullough 1999). The riffle is a good location for food delivery and it creates a bubble curtain that provides cover. Mixing with air likely elevates dissolved oxygen available to the steelhead juveniles, which may partially mitigate temperature stress. However, surface and groundwater interactions are also known to provide localized refugia (Pool and Berman 2000, Nielsen et al. 1994) and future studies might test for hyporheic connections at such locations.
Eel River Recovery Project: 2012 Water Temperature and Flow Monitoring Report 19
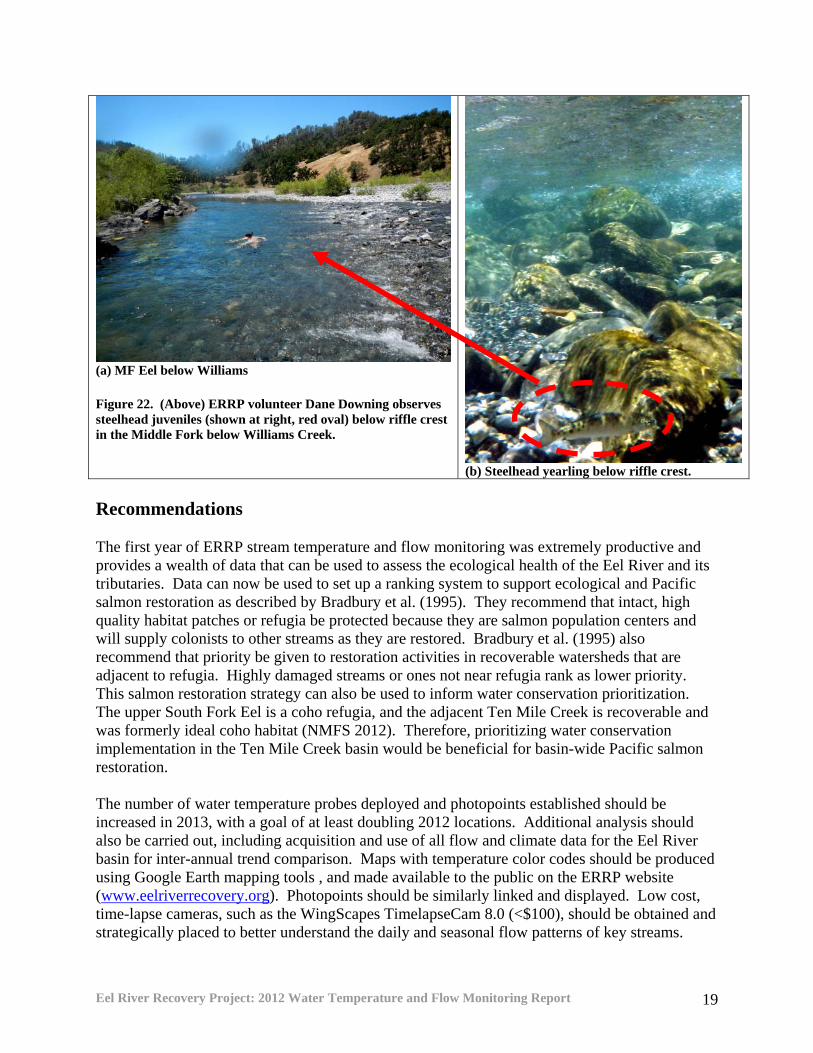
(a) MF Eel below Williams Figure 22. (Above) ERRP volunteer Dane Downing observes steelhead juveniles (shown at right, red oval) below riffle crest in the Middle Fork below Williams Creek.
(b) Steelhead yearling below riffle crest. Recommendations The first year of ERRP stream temperature and flow monitoring was extremely productive and provides a wealth of data that can be used to assess the ecological health of the Eel River and its tributaries. Data can now be used to set up a ranking system to support ecological and Pacific salmon restoration as described by Bradbury et al. (1995). They recommend that intact, high quality habitat patches or refugia be protected because they are salmon population centers and will supply colonists to other streams as they are restored. Bradbury et al. (1995) also recommend that priority be given to restoration activities in recoverable watersheds that are adjacent to refugia. Highly damaged streams or ones not near refugia rank as lower priority. This salmon restoration strategy can also be used to inform water conservation prioritization. The upper South Fork Eel is a coho refugia, and the adjacent Ten Mile Creek is recoverable and was formerly ideal coho habitat (NMFS 2012). Therefore, prioritizing water conservation implementation in the Ten Mile Creek basin would be beneficial for basin-wide Pacific salmon restoration. The number of water temperature probes deployed and photopoints established should be increased in 2013, with a goal of at least doubling 2012 locations. Additional analysis should also be carried out, including acquisition and use of all flow and climate data for the Eel River basin for inter-annual trend comparison. Maps with temperature color codes should be produced using Google Earth mapping tools , and made available to the public on the ERRP website (www.eelriverrecovery.org). Photopoints should be similarly linked and displayed. Low cost, time-lapse cameras, such as the WingScapes TimelapseCam 8.0 (<$100), should be obtained and strategically placed to better understand the daily and seasonal flow patterns of key streams.

Eel River Recovery Project: 2012 Water Temperature and Flow Monitoring Report 20
Inexpensive water flow gauges that attach to culverts are now also available (McMahon 2008) and ERRP might consider trying to establish some key flow monitoring stations in the future as well. Toxic algae monitoring should be expanded to cover as many popular swimming holes on the lower main Eel, South Fork and Van Duzen rivers as possible. ERRP should expand its website to show recent pictures of these locations as well as a color coding to indicate water quality and the level of risk of exposure to toxic algae. Communications with Humboldt County Public Health Department should be improved and a line of communication should also be established with Mendocino County, since canine mortalities have been known in upper reaches of the South Fork Eel River (Jeff Hedin, Personal communication). University of California doctoral candidate Keith Bouma-Gregson will design algae data collection protocols for ERRP in 2013, including algae transects in reaches with known problems. Ultimately, ERRP hopes to gain understanding of why the Eel River passed its “tipping point” and became susceptible to toxic algae development and how we can fix it. Conclusion The 2012 ERRP water temperature and flow project demonstrates that citizen-assisted monitoring can provide trustable scientific data to enable understanding of the ecological condition of the Eel River and its tributaries. The Eel River is showing signs of recovery from sediment damage in miles of its mainstem reaches, which is leading to a major Chinook salmon resurgence. However, at the same time, three of the largest tributaries, Outlet, Tomki and Ten Mile creeks, are going dry. These sub-basins were huge production engines for Chinook, coho and steelhead, and major clean water producers for the Eel River ecosystem. This study provides strong evidence in support of the ERRP hypothesis that flows have diminished since 1996. The data provided by ERRP can be used to prioritize salmon restoration activities and where to target water conservation and nutrient pollution reduction projects. Water bodies all over the world that are out of ecological balance are experiencing proliferation of toxic blue-green algae species. ERRP hopes to help speed implementation of measures that will heal the Eel River ecosystem and make it more resistant to the effects of climate change. The citizens of the region will be rich indeed, if we can maintain the beneficial uses of the Eel River (fishable, swimmable and drinkable) into the 21st Century.

Eel River Recovery Project: 2012 Water Temperature and Flow Monitoring Report 21
References Bouma-Gregson, Keith. Personal communication. Doctoral candidate in the Mary Power Lab, Department of Integrative Biology, University of California, Berkeley, CA. Bradbury, W., W. Nehlsen, T.E. Nickelson, K. Moore, R.M. Hughes, D. Heller, J. Nicholas, D. L. Bottom, W.E. Weaver and R. L. Beschta. 1995. Handbook for Prioritizing Watershed Protection and Restoration to Aid Recovery of Pacific Salmon. Published by Pacific Rivers Council, Eugene, OR. 56 p. DiMarzo, Vincent. Personal communication. Wiyot Tribe Council Member and Environmental Department technician, Loleta, CA. Friedrichsen, G. 1998. Eel River water quality monitoring project. Final report. Submitted to State Water Quality Control Board, for 205(J) Contract #5-029-250-2. Humboldt County Resources Conservation District. Eureka, CA. 76 pp. http://www.krisweb.com/biblio/ncc_hcrcd_friedrichsen_1998.pdf Hedin, Jeff. Personal communication. Resident of Piercy, CA and member of ERRP. Higgins, P.T. 2012. Eel River Recovery Project Second Annual Retreat Report and 2013 Action Plan - October 20, 2012 – Emandal. Published on October 25, 2012. Prepared for ERRP. 10 P. Hill, H. 2010. Blue Green Algae (BGA) - Detailed Fact Sheet. For Distribution to Animal Health Workers. Revised July 2010. Prepared by Harriet Hill, Humboldt County Division of Environmental Health, Eureka, CA. 2 p. Kubicek, Paul F. 1977. Summer water temperature conditions in the Eel River system with reference to trout and salmon. Masters thesis, Humboldt State University, Arcata, Ca. Lewis, T.E. 1999. Stream Temperature Survey Protocol. Forest Science Project. Humboldt State University Foundation, Arcata, CA. 14 p. http://www.krisweb.com/biblio/ncc_hsu_lewis_1999_temp.pdf Lewis, T.E., D.W. Lamphear, D.R. McCanne, A.S. Webb, J.P. Krieter, and W.D. Conroy. 2000. Executive Summary: Regional Assessment of Stream Temperatures Across Northern California and Their Relationship to Various Landscape-Level and Site-Specific Attributes. Forest Science Project. Humboldt State University Foundation, Arcata, CA. 14 p. http://www.krisweb.com/biblio/ncc_hsu_lewisetal_2000_fspregass.pdf May, C.W. and G. Peterson. 2003. Landscape Assessment and Conservation Prioritization of Freshwater and Nearshore Salmonid Habitat in Kitsap County, Performed under contract to Kitsap County, WA. 247 p. http://www.kitsapshoreline.org/kitsap_refugia_report_2003.pdf
Eel River Recovery Project: 2012 Water Temperature and Flow Monitoring Report 22
McCullough, D. 1999 . A Review and Synthesis of Effects of Alterations to the Water Temperature Regime on Freshwater Life Stages of Salmonids, with Special Reference to Chinook Salmon. Columbia Intertribal Fisheries Commission, Portland, OR. Prepared for the U.S. Environmental Protection Agency Region 10. Published as EPA 910-R-99-010. http://www.krisweb.com/biblio/gen_usepa_mccullough_1999.pdf McMahon, T. 2008. Review of “Draft Policy for Maintaining Instream Flows in Northern California Coastal Streams.” Prepared for the CA SWRCB WRD. Professor of Fisheries, Montana State University, Bozeman, MT. 11 p. Metcalfe, Kevin. Personal communication. Consumer Protection Program Supervisor, Humboldt County Department of Public Health, Eureka, CA. National Marine Fisheries Service (NMFS). 2012. Draft Southern Oregon/Northern California Coho (SONCC) Recovery Plan. Publication date January 2012. NMFS, Arcata, CA. 1500 p. Nielsen, J.L., T.E. Lisle, and V. Ozaki. 1994. Thermally stratified pools and their use by steelhead in northern California streams. Transactions of the American Fisheries Society 123:613-626. Poole, G. C. and C. H. Berman. 2000. Pathways of human influence on water temperature dynamics in stream channels. Environmental Management – February 2000. 20 pp. http://www.krisweb.com/biblio/gen_usepa_pooleetal_2000_pathways.pdf Puschner, B., B. Hoff, and E.R. Tor. 2008. Diagnosis of anatoxin-a poisoning of dogs from North America. Journal of Veterinary Diagnostics Investigations, Volume 20, pp 89-92. Smalley, D. and , P.T. Higgins. 2011. Eel River Recovery Project Action Plan: Emandal Advisory Group Retreat Recap. October 29, 2011. Performed for Eel River Recovery Project. 14 p. Welsh, H.H., G.R. Hodgson, M.F. Roche, B.C. Harvey. 2001. Distribution of Juvenile Coho Salmon (Oncorhynchus kisutch) in Relation to Water Temperature in Tributaries of a Northern California Watershed Determining Management Thresholds for an Impaired Cold-water Adapted Fauna. North American Journal of Fisheries Management. 21:464-470, 2001. http://www.rsl.psw.fs.fed.us/projects/wild/welsh/welsh5.pdf

Eel River Recovery Project: 2012 Water Temperature and Flow Monitoring Report 23
Probe LOCATION Sub_Basin Vol_Tech Deploy Retrieve
2024404 Wolverton Gulch Van Duzen Sal/Paul 6/19/2012 10/8/2012 2024408 Yager Creek Van Duzen Sal/Paul 6/20/2012 10/8/2012 2024409 Cummings Creek Van Duzen Sal/Paul 6/21/2012 10/8/2012 2024412 Fox Creek Van Duzen Sal/Paul 6/22/2012 10/8/2012 2024414 VD Riverside Pk Rd Van Duzen Sal/Paul 6/24/2012 10/8/2012 2024416 Hely Creek Van Duzen Sal/Paul 6/25/2012 10/8/2012 2024418 Grizzly Creek Van Duzen Sal/Paul 6/26/2012 10/8/2012 2024419 VD Rainbow Bridge Van Duzen Sal/Paul 6/27/2012 10/8/2012 2024420 Fish Creek Van Duzen Sal/Paul 7/4/2012 10/8/2012 2024421 Baech_LD Outlet Creek Larry Desmond 6/17/2012 10/11/2012
2024423 Baech_LDM Outlet Creek Larry Desmond 6/17/2012 10/11/2012
2024426 Baech_UD Outlet Creek Larry Desmond 6/17/2012 10/11/2012
2024428 Baech_Top Outlet Creek Larry Desmond 6/17/2012 10/11/2012
2024431 Baech_LN Outlet Creek Larry Desmond 6/17/2012 10/11/2012
2024436 Baech_UN Outlet Creek Larry Desmond 6/17/2012 10/11/2012
2024432 Eel_Emandal Upper Eel Jerry Albright 6/16/2012 10/20/2012
2024435 Bloody Run Outlet Creek Cathy Warren 6/17/2012 9/24/2012 2024437 Sherwood_DS Outlet Creek Kelly Harris 7/1/2012 10/19/2012 2024438 Sherwood_US Outlet Creek Kelly Harris 7/1/2012 10/19/2012 2024439 Willits Creek Outlet Creek Wally Stahle 7/28/2012 10/11/2012
2024441 Outlet (BL Beaver) Outlet Creek Cathy Warren 6/17/2012 9/24/2012 2024442 Bear Cr. (Shively) Lower Eel Pat Higgins 7/7/2012 10/11/2012
2024444 Eel at Shively Lower Eel Bill Reynolds 7/7/2012 10/20/2012
2024445 Eel at Worswick Lower Eel David Sopjes 8/10/2012 11/15/2012
2024446 Eel at Fernbridge Lower Eel Vince DiMarzo 8/10/2012 11/10/2012
2024447 SF Eel Miranda South Fork Graham Russell 8/10/2012 10/11/2012
2024460 SF Eel Angelo Upper South Fork Pat Higgins 7/1/2012 9/23/2012
2024461 SF Angelo below Elder South Fork Pat Higgins 7/1/2012 9/23/2012
2024462 Elder Creek South Fork Pat Higgins 7/1/2012 9/23/2012
2024464 Redwood (Branscomb) South Fork Pat Higgins 7/1/2012 9/23/2012
2024468 SF ab. Branscomb Rd South Fork Pat Higgins 7/1/2012 9/23/2012
2024469 SF Phillipsville South Fork Pat Higgins 7/7/2012 10/11/2012
2024473 Jack of Hearts South Fork Karen Walsh 7/1/2012 10/20/2012
2024474 Mill Creek (MF) Middle Fork Bruce/Dane 7/9/2012 10/7/2012
2024481 MF bl Williams Middle Fork Bruce/Dane 7/7/2012 10/7/2012
2024483 Williams (MF) US Thistle Middle Fork Bruce/Dane 7/13/2012 10/7/2012
2024484 Lower Eel (12 th St) Lower Eel Vince DiMarzo 7/13/2012 10/15/2012
2024489 Williams (MF) US Murphy Middle Fork Bruce/Dane 7/26/2012 10/7/2012
2024495 Eel off Howe Lower Eel Pat Higgins 6/21/2012 10/11/2012
2024497 Francis Creek Lower Eel David Sopjes 7/15/2012 11/10/12?
2024498 Upper Price Creek Lower Eel David Sopjes 7/15/2012 11/10/12?
2024499 Howe Creek Lower Eel David Sopjes 6/21/2012 10/11/2012
2024500 Price Creek Lower Eel David Sopjes 6/21/2012 10/11/2012
4612 NF Dobbyn Creek Middle Eel Pat Higgins 8/22/2012 10/9/2012
17955 Dobbyn Middle Eel Pat Higgins 8/22/2012 10/9/2012
18629 SF Dobbyn Middle Eel Pat Higgins 8/22/2012 10/9/2012
18630 Ten Mile South Fork Pat Higgins 8/11/2012 10/11/2012 18631 Van Duzen at Greens Van Duzen Paul Domanchuk 8/12/2012 10/7/2012

Eel River Recovery Project: 2012 Water Temperature and Flow Monitoring Report 24
Probe LOCATION Sub_Basin Vol_Tech Deploy Retrieve 18635 Streeter Low South Fork Martin Mitchell 8/19/2012 10/11/2012
18637 Main Eel Alderpoint Middle Eel Pat Higgins 8/22/2012 10/9/2012
18640 SF Eel at Piercy South Fork Maureen McIver 8/11/2012 10/11/2012
18642 Streeter Pool South Fork Martin Mitchell 8/19/2012 10/11/2012
823453 Ten Mile Pool South Fork Pat Higgins 8/15/2012 10/11/2012