report on the mpex evaluation of the dissemination of
TRANSCRIPT
Final Evaluation Report for FIPSE Grant #P116P50026:
Evaluation of the Workshop Physics Dissemination Project*
J.M. Saul and E.F. Redish Physics Education Research Group
University of Maryland College Park, MD 20742-4111
In cooperation with P. Laws and the Workshop Physics Project at Dickinson College
Workshop Dissemination Project P.I.: Priscilla Laws P.I. Institution: Dickinson College Period Covered by this report: 9/95-6/97
* The research described in this report was funded in part by NSF grant #RED-9355849

2
Summary
The FIPSE project (FIPSE grant #P116P50026) under study was designed to help implement Workshop Physics (WP) at a variety of undergraduate institutions with the full support of the developers at Dickinson College. This paper is an evaluation of the Workshop Physics courses implemented under this grant in term of students’ conceptual understanding and their expectations (cognitive beliefs about physics, mathematics, and learning).
Pre- and post-course testing of the first term course with two standard mechanics concepts tests was used to evaluate conceptual understanding. The two tests used were the Force Concept Inventory (FCI) or the Force Motion Conceptual Evaluation (FMCE). Student Expectations were evaluated with the Maryland Physics Expectations (MPEX) survey, an instrument developed by the authors and others expressly for this purpose. In addition, interviews were conducted with twenty-seven student volunteers at three of the project schools. Results from introductory courses taught with traditional lecture and other research-based curricula (RBC) (where active learning activities are used to supplement lecture) are included for comparison.
The results of our two-year evaluation study show the following four points:
1. The secondary WP implementations are averaging twice the overall fractional gains on the FCI than those obtained by traditional lecture courses at four-year colleges and the University of Maryland (41% ± 2% std. err. vs. 20% ± 3%). The secondary implementation results are comparable to those from Workshop Physics classes at Dickinson College (40% ± 3%) in the early years. They are also significantly better than the gains from curricula where RBC activities supplement lecture-based instruction (34% ± 1%).
2. An analysis of the four Newton’s third law questions on the FCI shows the fractional gains of the secondary WP implementations (64% ± 4%) are averaging more than twice the gain of traditional lecture classes (28% ± 4%). The WP implementation results are comparable to the results from the other RBC classes (53% ± 3%) and the 1992 WP classes at Dickinson College (59% ± 16%).
3. The traditional lecture classes and most of the RBC classes showed significant deterioration in their expectations over the course. This was true both overall and in two of the six subscales including the Reality and Math Link clusters. However, the secondary WP implementations showed little or no deterioration overall and in five of the six subscales. Several of the WP adopting schools had small increases in some subscales, although only one school had any significant improvement in expectations. (The University of Northern Iowa improved significantly in the Reality Link cluster.)
4. The WP adopting schools had post expectations that were 10-15% more favorable than traditional lecture classes and some RBC. The Reality Link dimension had the most favorable average with 77% ± 2% (std. err.) of the students responding that classroom physics was strongly linked to real world situations. This was confirmed by interviews that showed that many students believed that the physics they were learning would be useful to them in their careers in chemistry, medicine, and architecture.

3
I. Introduction The FIPSE project for dissemination of the Workshop Physics1 curriculum to several undergraduate institutions was designed to help address the implementation difficulties of adopting Workshop Physics in a variety of academic settings. As outside evaluators on this project, we had two goals. Our main goal was to measure the progress of the students in the dissemination implementations relative to other forms of instruction. A secondary goal was to try to understand WP implementation problems that came up in our investigation.
In the workshop approach, the idea of learning physics passively through traditional lecture and recitations is abandoned in favor of learning physics by doing physics through guided discovery laboratory activities. In this approach, the laboratory becomes the course rather than a supplement to the lecture. The goals for student learning in Workshop Physics are to enable students to:2
• construct conceptual models of phenomena and relate these to mathematical models;
• learn enough scientific literacy to be able to learn more science without formal instruction;
• develop proficiency with computers and other research tools;
• appreciate science and want to learn more; and
• engage in the further study of science.
To evaluate the success of Workshop Physics classes in helping students achieve these goals, the authors of this evaluation study decided to look at two aspects of student learning, conceptual understanding and “expectations.”
Two standard qualitative multiple-choice Newtonian mechanics diagnostics, the Force Concept Inventory (FCI)3 and the Force Motion Concept Evaluation (FMCE),4 have been developed to study the effectiveness of introductory physics instruction in improving students’ conceptual understanding of physics. Both mechanics concept tests have been shown by their developers to be reliable and valid measures of student knowledge of the basic Newtonian force concept.5
“Expectations” are cognitive attitudes and beliefs that students have about learning, physics, and mathematics, i.e. attitudes and beliefs that affect how students learn physics. Previous studies have shown that student expectations play a large role in shaping how students build their understanding of physics and the type of understanding they build.6, 7 As part of an NSF sponsored research project on student expectations, we developed the Maryland Physics Expectation (MPEX) survey to study the distribution and evolution of student expectations in the introductory physics classes.8 Eighteen universities, colleges, and high schools have participated in this project to date, including eight of the schools involved with the Workshop Physics dissemination project.
This evaluation study was designed to help answer the following questions:
1. Do the new Workshop Physics implementations supported by this project improve students understanding of basic physics concepts? How do the gains compare with the results from classes taught with traditional and other research-based curricula at other schools?

4
2. How do student expectations change over one year of Workshop Physics? How do these changes compare with results from classes taught with traditional and other research-based curricula at other schools?
3. What can expectations tell us about implementation problems and how to deal with them? In what ways are the implementations at adopting institutions similar and in what ways are they different from the Dickinson implementation?
We will begin by briefly reviewing the evaluation methods used in this study in Section II. The results of the FCI and FMCE mechanics concept tests are discussed in Section III. Section IV contains a summary of the results of the MPEX survey. Section V discusses the findings of the interviews with student volunteers. Section VI contains the conclusion with a summary of the results and a discussion of the implications for other schools considering adopting Workshop Physics.
II. Evaluation Methods In our original plan to evaluate students’ conceptual understanding and expectations during the 1995-96 and 1997-98 school years, the students were to be evaluated with the FMCE and the MPEX survey at the beginning and end of the first quarter or semester of the introductory physics sequence. The MPEX survey was to be given again at the end of the first year of instruction (the end of the sequence). In order to make sure the pre/post gains represented improvement in student learning, the data were matched so that only students who took both the pre-test and the corresponding post-test were included in the analysis of the pre/post results. The schools adopting the Workshop Physics curriculum were asked to take data from both modified and unmodified classes to see if the Workshop Physics classes were doing a better job of helping the students reach the course goals. In addition, The authors of this evaluation agreed to make site visits to some of the schools to help evaluate their implementations and to conduct interviews with student volunteers. The following undergraduate institutions agreed to implement the WP curriculum in introductory classes and participate in the evaluation study as part of the dissemination project:
Carroll College (CAR) Skidmore College (SKD)
Drury College (DRY) University of Northern Iowa (UNI)
Forsythe Technical Community College (FTCC) Whittier College (WHT)
Nebraska Wesleyan University (NWU)
These schools agreed to allow us to take data from WP and traditional lecture introductory physics course taught during this study. Results from Dickinson College (DC) are used to measure the progress of the new WP courses relative to the original implementation. In addition, we also used concept test and MPEX survey data from the following schools so we could compare the WP results to other traditional lecture courses (TRD) as well as modified lecture courses (RBC) where research-based activities are used to supplement the lecture part of the course:9
University of Maryland (UMD), both TRD and RBC courses

5
University of Minnesota (MIN), both TRD and RBC courses
Ohio State University (OSU), RBC classes
Tables briefly describing the schools and the courses are shown in Appendix A. This plan was carried out with four changes during the dissemination project. First,
DRY, NWU, and SKD elected to use the FCI instead of the FMCE to evaluate student understanding of Newtonian mechanics concepts.10 The FCI data was processed and evaluated at Maryland. Second, we were only able to compile FMCE data for CAR, DC, and UNI. Third, several schools neglected to take both types of diagnostic data from classes taught in traditional lecture style. Fourth, logistical difficulties prevented some of the schools from taking MPEX survey data three times during the sequence. As a result, matched MPEX data from the beginning and end of the one year of instruction in the introductory physics sequence was only available from DRY, NWU, UNI, and CAR.11
In addition, at the end of the 1997 spring and fall semesters, we distributed several conceptual exam problems through the Workshop Physics Listserve and webpages. The schools involved in the dissemination project were encouraged to use these problems and send the results to Maryland for analysis. Several schools have sent us exam data, but it will not be analyzed until summer 1998. Next, we will briefly discuss the use and analysis of the concept tests, the MPEX survey, and the interviews to evaluate student learning in TRD, WP, and RBC courses.
A. Conceptual Understanding Two concept tests were used to measure the improvement in students knowledge of basic physics concepts: the FCI and the FMCE. The FCI, developed by Halloun, Hestenes, Wells, and Swackhammer,12 is the most commonly used physics conceptual evaluation test in the United States today.13,14 It is designed to measure students’ belief in Newtonian laws of motion vs. the student’s common sense beliefs. A copy of the FCI is included in Appendix B. The FMCE, developed by Thornton and Sokoloff as an evaluation of Workshop Activities,15 covers similar topics but is limited to linear motion and has a stronger emphasis on graphical representations. Both tests have questions that were specifically developed to trigger and identify specific common sense beliefs identified by the research literature. A copy of the FMCE is included in Appendix C. In his recently published study of FCI results from over 6500 students, Hake found that the figure of merit for gains in students’ conceptual understanding in a class was the average fraction of the possible (fractional) gain h, where h is defined as follows,16
h = (class post-test average – class pre-test average) / (100 – class pre-test average)
Hake collected FCI data to see if research-based curricula were more effective for teaching Newtonian mechanics than traditional lecture methods. He found the following result:
Traditional Classes (14 classes, N = 2084 students) h = 0.23 ± 0.04 (std. dev.)
PER-based Classes (48 classes, N = 4458 students) h = 0.48 ± 0.14 (std. dev.)

6
where h is averaged over classes, not students. The average fractional gain of the PER-based classes is twice as great as the average gain for traditional lecture classes. Note the narrow widths and large separation of the two distributions.
Although the Hake study gives a general result, the data may have been compromised by students dropping the class. There may have also have been a selection bias in that participating instructors sent in their results for inclusion by Hake only after they knew what the results were. In this evaluation, our data is matched so that only students who took both the pre-course and post-course concept tests are included. The concept tests were used in all classes taught while the schools were participating in this study to reduce selection bias.17 We also identified and analyzed four questions on the FCI that specifically address Newton’s third law, one of the hardest concepts. The overall FCI/FMCE results and the Newton’s third law results are presented in Section III.
B. Expectations We developed the MPEX survey to better understand the distribution and evolution of
student expectations in introductory physics classes.18 The MPEX survey has 34 statements that students can either agree or disagree with using a five-point Likert scale. In evaluating the results, we consider the survey responses of instructors at the adopting schools involved in the dissemination project as “expert” responses. The future Workshop Physics instructors answered the survey items the way they would want their students (ideally) to answer after a year of instruction. A student response in agreement with the expert response is defined as “favorable” for learning physics and a response in disagreement with the expert response is defined as “unfavorable” for learning physics.
In addition to the overall result, the MPEX survey has clusters of items that probe six subscales or dimensions of expectations. The first three dimensions were proposed by Hammer19 in his study to classify student beliefs about the nature of learning physics.
1. Independence beliefs about learning physics — whether it means receiving information or involves an active process of reconstructing one’s own understanding;
2. Coherence beliefs about the structure of physics knowledge — as a collection of isolated pieces or as a single coherent system;
3. Concepts beliefs about the content of physics knowledge — as formulas or as concepts that underlie the formulas.
In the MPEX survey, we also probe three additional dimensions:
4. Reality Link beliefs about the connection between physics and reality — whether physics is unrelated to experiences outside the classroom or whether it is useful to think about them together;
5. Math Link beliefs about the role of mathematics in learning physics — whether the mathematical formalism is just used to calculate numbers or is used as a way of representing information about physical phenomena;

7
6. Effort beliefs about the kind of activities and work necessary to make sense out of physics — whether they expect to think carefully and evaluate what they are doing based on available materials and feedback or not.
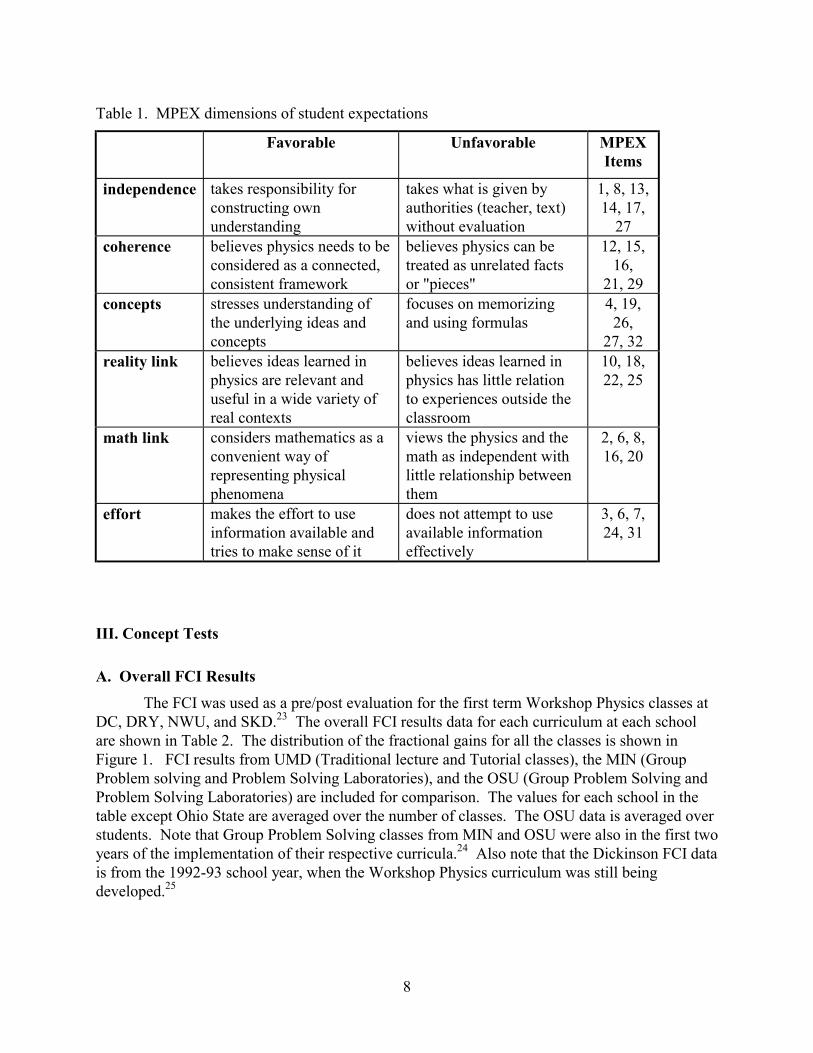
A list of the dimensions with the extreme favorable and unfavorable view for each dimension is shown below in Table 1. The 34 survey items are presented in Appendix D.
To understand the effect of instruction in introductory physics classes on student expectations, it is important to compare pre-sequence measurements with measurements made later in the sequence. For this evaluation, we report on expectation results from the beginning and end of the introductory physics sequence.20 Shifts in student expectations are measured as the change in the percentage of favorable responses. Ideally, we would like student expectations to either become more favorable or to at least remain generally favorable over one year of instruction as the students learn more about the nature of physics and how to use physics to reason out an understanding of physical situations.
The MPEX survey results for this study are presented in Section IV. Note that all the MPEX data presented in this report are matched.21 The results are presented in tables as (% of favorable responses) / (% of unfavorable responses). Since the fraction of favorable and unfavorable student responses may add up to less than 100%, the remainder are neutral or blank student responses. Our results show some differences among different classes at the same institution, but the variation is statistically consistent with the sample size. To simplify the presentation of the MPEX results, the individual class results have been combined for similar classes at a given institution.
C. Interviews Site visits were made by one of the authors (Saul) to NWU and DRY at the end of the 1997 spring semester. In each case, the visitor attended classes and interviewed student volunteers solicited by the instructor. The interviews themselves were conducted in three parts. In the first part, the students were asked questions about their background and their expectations regarding Workshop Physics. In the second part of the interview, the students were asked to go over and explain their survey responses to 20-30 of the MPEX survey items. In the last part of the interview, the student volunteers were which activities they found helpful for learning and what changes they would make to improve the class. The interviews were videotaped and transcribed for detailed analysis. 22
The first site visit was to DRY. The visitor observed both the algebra/trig-based and calculus-based Workshop Physics classes. Both classes were at the end of the two-semester sequence. Eight student volunteers were interviewed from the algebra/trig-based course, four from the calculus-based course either individually or in groups of two.
The second site visit was made to NWU immediately following the visit to DRY. NWU is unusual in that they teach only one type of introductory sequence that is a hybrid algebra/trig- and calculus-based course. The visitor attended both sections of their hybrid Workshop Physics course. The ten student volunteers from both sections were interviewed individually. To get a broader perspective on the class, at least three students each were interviewed from the top third, middle third, and bottom third of the class (as rated by the instructor).
8
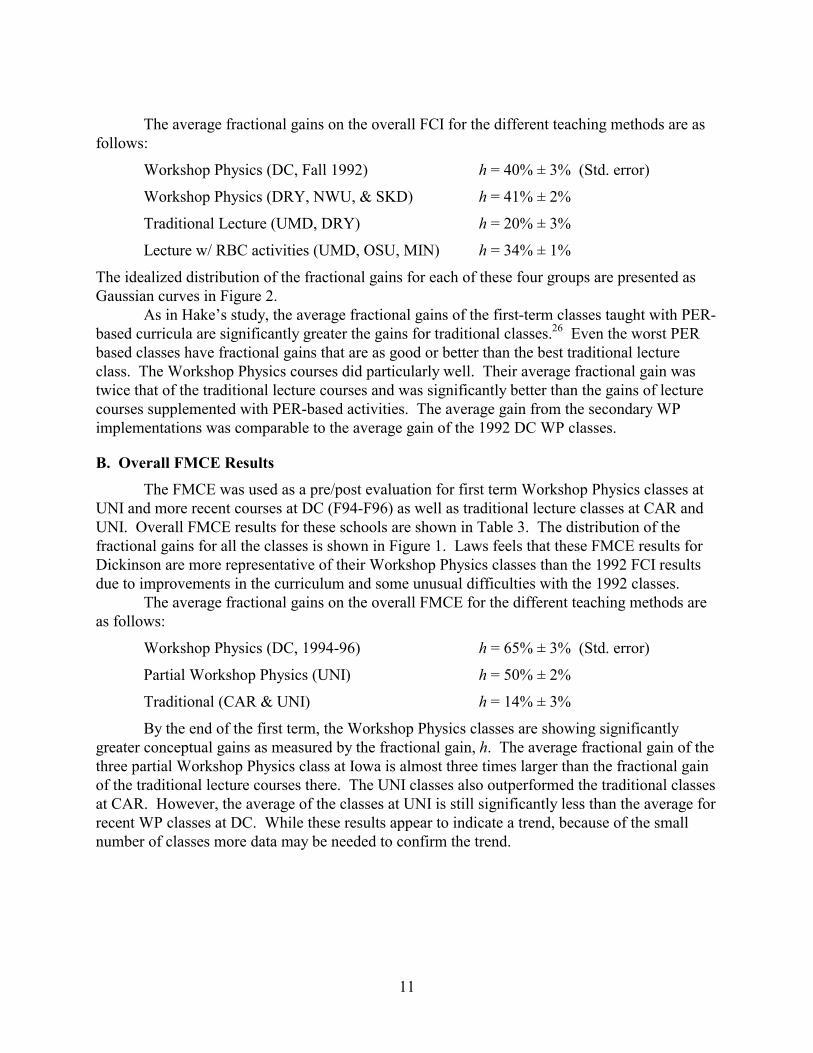
III. Concept Tests
A. Overall FCI Results The FCI was used as a pre/post evaluation for the first term Workshop Physics classes at
DC, DRY, NWU, and SKD.23 The overall FCI results data for each curriculum at each school are shown in Table 2. The distribution of the fractional gains for all the classes is shown in Figure 1. FCI results from UMD (Traditional lecture and Tutorial classes), the MIN (Group Problem solving and Problem Solving Laboratories), and the OSU (Group Problem Solving and Problem Solving Laboratories) are included for comparison. The values for each school in the table except Ohio State are averaged over the number of classes. The OSU data is averaged over students. Note that Group Problem Solving classes from MIN and OSU were also in the first two years of the implementation of their respective curricula.24 Also note that the Dickinson FCI data is from the 1992-93 school year, when the Workshop Physics curriculum was still being developed.25
Table 1. MPEX dimensions of student expectations
Favorable Unfavorable MPEX Items
independence takes responsibility for constructing own understanding
takes what is given by authorities (teacher, text) without evaluation
1, 8, 13, 14, 17,
27 coherence believes physics needs to be
considered as a connected, consistent framework
believes physics can be treated as unrelated facts or "pieces"
12, 15, 16,
21, 29 concepts stresses understanding of
the underlying ideas and concepts
focuses on memorizing and using formulas
4, 19, 26,
27, 32 reality link believes ideas learned in
physics are relevant and useful in a wide variety of real contexts
believes ideas learned in physics has little relation to experiences outside the classroom
10, 18, 22, 25
math link considers mathematics as a convenient way of representing physical phenomena
views the physics and the math as independent with little relationship between them
2, 6, 8, 16, 20
effort makes the effort to use information available and tries to make sense of it
does not attempt to use available information effectively
3, 6, 7, 24, 31

9
Table 2: Overall FCI results (fractional gains are averaged over classes). Note that C is used to denote calculus-based classes, A to denote algebra/trig-based courses, and AC to denote the hybrid course at NWU.
School Curricula N (# of classes) FCI Pre FCI Post h
DC-C (F92) WP 62 (3) 41.8 64.8 0.40 DRY-C (F96) WP 8 (1) 47.8 77.6 0.57 SKD-C (F96) WP 33 (2) 41.2 63.9 0.39
NWU-AC (F95&F96) WP 68 (6) 38.4 62.9 0.40
DRY-A (F96) WP 23 (1) 32.5 58.6 0.39
UMD-C (F93-S96) TRD 258 (7) 51.1 60.4 0.19 DRY-A (F96) TRD 39 (2) 38.3 52.3 0.24
MIN-C (F94) RBC 524 (5) 49.0 65.2 0.32 OSU-C (F95) RBC 258 (2) 50.4 69.4 0.38
UMC-C (F93-S97) RBC 546 (9) 50.4 67.9 0.35
MIN-A (F95) RBC 84 (1) 34.4 56.8 0.34
Table 3. Overall FMCE results (fractional gains are averaged over classes). Note that C is used to denote calculus-based classes, A to denote algebra/trig-based courses, and AC to denote the hybrid course at NWU.
School Curricula N (# of classes) FMCE Pre FMCE Post h
DC-C (F94-F96) WP 154 (7) 24.1 73.4 0.65 UNI-A (F96) WP 82 (3) 20.9 60.6 0.50
CAR-C (F95) TRD 24 (1) 25.9 39.4 0.18 CAR-A (F95) TRD 38 (1) 19.6 25.9 0.08
UNI-A (F96) TRD 34 (1) 25.4 38.1 0.17

10
Figure 1. FCI (above and middle) and FMCE (below) figure of merit histograms for classes from nine of the schools participating in the study. The figure of merit h is the fraction of the possible gain. Shown below are results for traditional lecture classes (TRD), lecture classes supplemented with research-based activities (RBC), and Workshop Physics classes (WP).
Overall FMCE Results
0
1
2
3
4
5
6
7
8
9
0.00 0.05 0.10 0.15 0.20 0.25 0.30 0.35 0.40 0.45 0.50 0.55 0.60 0.65 0.70 0.75 0.80
# of
cla
sses
TRD (DRY & UMD)RBC (UMD, OSU, & MIN)
0
1
2
3
0.00 0.05 0.10 0.15 0.20 0.25 0.30 0.35 0.40 0.45 0.50 0.55 0.60 0.65 0.70 0.75 0.80
h (fraction of the possible gain)
# of
cla
sses
TRD (CAR & UNI)WP (DC)WP (UNI)
0
1
2
3
4
5
6
0.00 0.05 0.10 0.15 0.20 0.25 0.30 0.35 0.40 0.45 0.50 0.55 0.60 0.65 0.70 0.75 0.80
# of
cla
sses
WP (DC - F92)WP (DRY, NWU, & SKD)
Overall FMCE Results
Overall FCI Results
Overall FCI Results
11
The average fractional gains on the overall FCI for the different teaching methods are as
follows:
Workshop Physics (DC, Fall 1992) h = 40% ± 3% (Std. error)
Workshop Physics (DRY, NWU, & SKD) h = 41% ± 2%
Traditional Lecture (UMD, DRY) h = 20% ± 3%
Lecture w/ RBC activities (UMD, OSU, MIN) h = 34% ± 1%
The idealized distribution of the fractional gains for each of these four groups are presented as Gaussian curves in Figure 2.
As in Hake’s study, the average fractional gains of the first-term classes taught with PER-based curricula are significantly greater the gains for traditional classes.26 Even the worst PER based classes have fractional gains that are as good or better than the best traditional lecture class. The Workshop Physics courses did particularly well. Their average fractional gain was twice that of the traditional lecture courses and was significantly better than the gains of lecture courses supplemented with PER-based activities. The average gain from the secondary WP implementations was comparable to the average gain of the 1992 DC WP classes.
B. Overall FMCE Results The FMCE was used as a pre/post evaluation for first term Workshop Physics classes at
UNI and more recent courses at DC (F94-F96) as well as traditional lecture classes at CAR and UNI. Overall FMCE results for these schools are shown in Table 3. The distribution of the fractional gains for all the classes is shown in Figure 1. Laws feels that these FMCE results for Dickinson are more representative of their Workshop Physics classes than the 1992 FCI results due to improvements in the curriculum and some unusual difficulties with the 1992 classes.
The average fractional gains on the overall FMCE for the different teaching methods are as follows:
Workshop Physics (DC, 1994-96) h = 65% ± 3% (Std. error)
Partial Workshop Physics (UNI) h = 50% ± 2%
Traditional (CAR & UNI) h = 14% ± 3%
By the end of the first term, the Workshop Physics classes are showing significantly greater conceptual gains as measured by the fractional gain, h. The average fractional gain of the three partial Workshop Physics class at Iowa is almost three times larger than the fractional gain of the traditional lecture courses there. The UNI classes also outperformed the traditional classes at CAR. However, the average of the classes at UNI is still significantly less than the average for recent WP classes at DC. While these results appear to indicate a trend, because of the small number of classes more data may be needed to confirm the trend.

12
Figure 2. Idealized Gaussian distributions of the fractional gain h on the overall FCI.
Table 4. Results on the FCI Newton 3 questions (fractional gains are averaged over classes). Note that C is used to denote calculus-based classes, A to denote algebra/trig-based courses, and AC to denote the hybrid course at NWU.
School Curricula N (# of classes) N3 FCI Pre N3 FCI Post hN3
DC-C (F92) WP 62 (3) 34.0 75.3 0.59 DRY-C (F96) WP 8 (1) 21.9 96.9 0.92 SKD-C (F96) WP 33 (2) 25.8 73.4 0.66
NWU-AC (F95&F96) WP 68 (6) 28.8 69.9 0.59
UMD-C (F93-S96) TRD 258 (7) 38.7 56.6 0.28
MIN-C (F94) RBC 524 (5) 33.8 57.7 0.40 OSU-C (F95) RBC 258 (2) 31.5 62.3 0.47
UMD-C (F93-S97) RBC 546 (9) 42.6 75.5 0.60

13
Figure 3. Histograms of average figures of merit (hN3) for the Newton 3 FCI cluster for all three curricula. Shown below are results for traditional lecture classes (TRD), lecture classes supplemented with research-based activities (RBC), and Workshop Physics classes (WP).
0
1
2
3
4
0.20 0.25 0.30 0.35 0.40 0.45 0.50 0.55 0.60 0.65 0.70 0.75 0.80 0.85 0.90
# of
cla
sses
s
TRD (UMD)RBC (UMD, OSU, & MIN)
Newton 3 FCI Results
Newton 3 FCI Results
0
1
2
3
4
0.20 0.25 0.30 0.35 0.40 0.45 0.50 0.55 0.60 0.65 0.70 0.75 0.80 0.85 0.90
# of
cla
sses
s
WP (DC - F92)WP (DRY, NWU, & SKD)
h (fraction of the possible gain)
Newton 3 FCI Results

14
C. FCI Newton’ Third Law Results Results were obtained from WP classes at DC and at three of the FIPSE WP schools (DRY, NWU, & SKD). Results from TRD classes at UMD and RBC classes from MIN, OSU, and UMD are included for comparison. The Newton 3 FCI results for these schools are shown in Table 4. The distribution of the fractional gains for all the classes is shown in Figure 3.
The average fractional Newton 3 FCI gains for the different teaching methods are as follows:
Workshop Physics (DC, Fall 1992) h = 59% ± 16%
Workshop Physics (DRY, NWU, & SKD) h = 64% ± 4%
Traditional Lecture (UMD) h = 28% ± 4%
Lecture w/RBC activities (UMD, OSU, MIN) h = 53% ± 3%
Note that like overall FCI gains, the Workshop Physics classes achieved twice the gain of the traditional lecture classes. The average gain for the secondary WP classes are comparable to that of the 1992 DC WP classes and significantly better than the average gain for the RBC classes. The distribution of the average fractional gains for classes shows that all but one of the WP classes (one of the DC 1992 WP classes) had larger h’s than all the traditional lecture classes.
One of the UMD Tutorial classes and four of the Workshop Physics classes achieved fraction gains > 70% (two of the 1992 classes at DC, one of the classes at SKD, and one of the classes at NWU). The result for the SKD class is especially notable since the pre-course score for the Newton 3 cluster was the smallest of any class participating in this study.
IV. MPEX Survey MPEX survey results from the beginning and end of the introductory physics sequences
are presented in Table 5 both for the overall survey and for the six expectation dimensions. MPEX results from Workshop Physics sequences are presented from DC, DRY, NWU, and UNI. MPEX results from traditional lecture courses at CAR and MIN as well as RBC classes at UMD (Tutorial classes), MIN (Group Problem solving and Problem Solving Laboratories27), and OSU (Group Problem Solving and Problem Solving Laboratories) are included for comparison.
The values for each school in the table are averaged over the number of students. The uncertainty σ is based on the binomial probability distribution.28 A shift of 2σ in the percentage of favorable responses is considered significant. Note that C is used to denote calculus-based classes, A to denote algebra/trig-based courses, and AC to denote the hybrid course at NWU. In analyzing the MPEX survey results it is important to consider the pre/post change and the post value.
The overall MPEX results for all the sequences studied deteriorated (became less favorable) during the sequence except for some of the Workshop Physics classes (DC-C, DRY-A, and UNI-A). The DRY-A and UNI-A sequences became slightly more favorable. Two of the three traditional sequences and two of the RBC sequences showed significant deterioration overall. A part of this deterioration was the significant decrease in favorable responses to the effort cluster at every school (except UNI-A) in the study. At the end of the sequence, students generally felt they did not put in as much effort at they expected to at the beginning of the

Table 5. Percentages of students giving favorable/unfavorable responses overall and on the clusters of the MPEX survey giving at the beginning (pre) and end of one year (post) of the calculus-based introductory physics sequence. University of Maryland (UMD) is the only school participating in this study whose introductory sequence is longer than one year. Note that C is used to denote calculus-based classes, A to denote algebra/trig-based courses, and AC to denote the hybrid course at NWU.
Schools
Overall (%)
Independence (%)
Coherence (%)
Concepts (%)
Reality Link (%)
Math Link (%)
Effort (%)
Fav/Unfav σ Fav/Unfav σ Fav/Unfav σ Fav/Unfav σ Fav/Unfav σ Fav/Unfav σ Fav/Unfav σ UMD-C Pre 58 / 20 4 48 / 32 4 60 / 17 4 52 / 23 4 66 / 11 3 61 / 17 4 68 / 12 3(RBC) Post 54 / 22 48 / 28 54 / 25 60 / 17 63 / 17 56 / 19 51 / 24 MIN-C Pre 59 / 19 3 52 / 27 3 56 / 21 3 54 / 21 3 72 / 9 2 64 / 15 2 72 / 11 2 (RBC) Post 46 / 26 40 / 33 48 / 23 49 / 24 53 / 17 46 / 27 44 / 30 MIN-C Pre 58 / 20 2 50 / 30 3 54 / 24 3 54 / 22 3 71 / 8 2 61 / 16 2 73 / 11 2 (TRD) Post 50 / 25 42 / 34 53 / 23 54 / 20 59 / 17 56 / 21 50 / 27 OSU-C Pre 50 / 24 4 41 / 35 4 49 / 25 4 45 / 27 4 59 / 12 3 53 / 22 4 63 / 18 4 (RBC) Post 42 / 29 36 / 38 39 / 27 41 / 31 51 / 22 40 / 31 43 / 32 CAR-C Pre 62 / 17 11 50 / 28 12 48 / 23 12 53 / 23 12 82 / 3 5 71 / 9 8 83 / 3 4 (TRD) Post 49 / 30 44 / 33 48 / 25 49 / 31 50 / 28 55 / 24 49 / 28 CAR-A Pre 55 / 19 6 46 / 33 7 46 / 29 7 36 / 34 7 72 / 5 3 61 / 12 5 81 / 9 4 (TRD) Post 47 / 33 37 / 47 47 / 36 37 / 40 50 / 21 56 / 26 56 / 27 DC-C Pre 60 / 16 4 57 / 21 4 57 / 17 4 54 / 20 4 72 / 6 3 65 / 12 4 72 / 9 3 (WP) Post 59 / 18 57 / 23 63 / 15 62 / 15 68 / 10 63 / 18 53 / 27 DRY-C Pre 76 / 10 12 88 / 2 6 66 / 14 14 69 / 9 12 82 / 7 10 86 / 3 7 83 / 11 12 (WP) Post 70 / 10 67 / 17 60 / 17 74 / 6 86 / 4 83 / 6 54 / 11 NWU-AC Pre 61 / 19 6 52 / 27 7 58 / 25 6 52 / 21 6 81 / 7 4 64 / 13 5 81 / 5 3 (WP) Post 58 / 22 50 / 30 57 / 23 58 / 20 77 / 7 53 / 29 58 / 25 DRY-A Pre 63 / 15 10 63 / 10 11 53 / 24 12 48 / 25 12 77 / 8 7 67 / 8 8 81 / 9 6 (WP) Post 67 / 18 65 / 23 74 / 18 63 / 18 80 / 9 83 / 6 61 / 23 UNI-A Pre 50 / 26 8 45 / 35 8 51 / 28 8 40 / 36 9 57 / 12 6 54 / 22 8 66 / 14 7 (WP) Post 56 / 23 46 / 31 48 / 28 46 / 27 76 / 11 58 / 23 59 / 19

16
sequence. This result is well known and is neither surprising nor particularly disturbing. We will refer to the other five clusters as the cognitive clusters from now on.
More disturbing is that in looking at five cognitive clusters, the TRD and RBC classes (except UMD-C) all showed significant deterioration in at least one cluster and four of the six sequences showed deterioration in at least three of these clusters. Only one of the WP sequences showed any significant deterioration in any of these five clusters. The DRY-C sequence showed a significant decrease in the percentage of favorable responses, but still ended up with 60% favorable responses, second only to the DRY-A sequence (65% favorable). Note that only three sequences (WP-DRY, WP-UNI, and RBC-UMD) had any significant gains in the percentage of favorable responses either overall or in any of the clusters.
It is interesting to note that the post results for the WP sequences for the overall survey and for the independence, concepts, and reality link clusters were more favorable than all the other sequences except UMD. The WP sequences at DC and DRY were considerably more favorable overall and in four of the five cognitive dimensions than all the other sequences. In general, the secondary implementations at NWU and UNI had less favorable post expectations than the WP sequences at DC and DRY.
Surprisingly, the secondary WP sequences actually had more favorable post responses on the reality link cluster than the DC sequence. This cluster is of particular interest because if the students perceive that the physics they learn in the classroom is strongly connected to the real world, they see physics as being relevant to them personally. When that happens, the students are better motivated to build a good functional understanding of physics that is usable after the course is over. The four secondary sequences had unusually large fractions of favorable post responses to the reality link cluster ranging from 76% to 86%. For comparison, The DC post response was only 68% favorable. The average response of the secondary WP sequences 25%more favorable than average response for the TRD and RBC sequences. Also note that almost all the TRD and RBC sequences and none of the WP sequences showed significant deterioration on the reality link cluster. The two DRY sequences and the UNI sequence actually showed some improvement. The UNI result is particularly important because this is the only significant improvement we have observed in the reality cluster for any of the schools we have studied. It is one of the few significant improvements we have seen. We also saw significant improvement on the concept cluster for the WP sequence at DC and the RBC sequence at UMD.
V. Interviews
A. Overview During the course of this project, interviews with student volunteers were conducted
during site visits made to three of the adopting schools, Nebraska Wesleyan University (NWU), Drury College (DRY) and Forsythe Technical Community College (FTCC). In this section, we will mainly discuss results from the interviews with NWU and DRY students. These schools were selected for two reasons. First, these secondary implementations were very close to the original implementation at Dickinson and second, the two implementations provide an interesting contrast with each other. The DRY WP implementation is very successful (as seen from the concept test and expectation results) and the workshop method is being adapted for courses in other departments. The NWU implementation is getting better results than traditional

17
lecture courses but still has several implementation difficulties that are currently being addressed.29 Some of these implementation difficulties will be of interest to other schools considering adopting the WP curriculum.
B. Expectation Issues There are four points of interest to note from the interviews on student expectations.
First, as we saw earlier in the MPEX survey results, most classes (including the WP classes at DC) show a decrease in the number of favorable responses in the reality link cluster over the year of introductory physics. At DRY, the student responses to the reality link cluster became more favorable, though not significantly so. At NWU, the students began and ended the sequence with more favorable responses in the reality cluster than most of the schools in this study, including Dickinson College (see Table 5).
This favorable response from the DRY and NWU students is reflected in the interviews. Almost all the students interviewed at NWU believed that the physics they learned in the classroom was strongly connected to the real world. In fact, all the students interviewed in the upper two-thirds of the class gave explicit examples of how they were connecting physics to their own out-of-class experiences. There may be several possible reasons for this. One reason might be the way many of the students look at learning, another is probably Workshop Physics’ heavy emphasis on laboratory activities. However, part of the reason is also due to the instructor connecting what the students are learning to everyday experience. In one student’s words,
I think every problem we have in class, every example he’s [the instructor’s] used he’s related to a real world concept. It’s not anything that we’ve never heard of before. … We use real life examples every day.
In addition, when asked about the advantages of taking workshop physics, many of the students responded that this way of learning physics was helping them learn useful knowledge and skills that they could apply beyond the class. While several of the NWU students were able to see connections between the physics they were learning and their careers, the Drury students saw the connection more clearly and were able to cite specific examples from medicine and architecture.
The second point deals with student perception of learning in the classroom. One particular interview questions probes whether students believe they can learn and understand physics in this course. This is an important issue since many students who are required to take physics just try to get through the course without really understanding the content. Most of the students interviewed at both schools felt that anyone is capable of learning physics, though some of them did add conditions such as “if you apply yourself” (2 students), or “if you really want to (2 students).” This result indicates that even though some of these students are struggling, they believe that most people can learn physics with understanding in a Workshop Physics class. This is often not the case in a traditional lecture class.
Another question probes whether students believe that understanding physics is not required to succeed in the class and implies that understanding physics is not emphasized or reinforced in the class. At NWU, three students believed that understanding physics was required to get a good grade in the class. But another three students believed that despite the heavy course emphasis on conceptual understanding in Workshop Physics, it was still possible to pass this class by memorizing, plugging equations into problems, and chugging away for an answer. In other words, the students are using the same means to get through the WP class that

18
they commonly use to pass a traditional lecture course.30 This may be an indication that the homework and the exam problems may not be designed to encourage students to explicitly use their understanding of physics to do well.
The third point is that only two of the four students at NWU in the top third of the class and three of the ten NWU students overall preferred Workshop physics over traditional lecture instruction. Six of the other students believed that learning by lecture was or would be more effective for them than figuring things out for themselves. For the two students in the top third of the class, this was due to their view that learning physics meant learning and using equations. Although one of them did believe that Workshop Physics was a better way to learn concepts. The other four students preferred lectures, either because they wanted things explained to them or because they wanted more recipe-like activities.
Most of these students had at least some constructivist expectations, but these are what we call “apparent” constructivist expectations. Most of these students believe they should be constructing their own understanding, yet deep down they feel that being told is more effective. One reason for this is that working on something when you don’t know what is right or what you are supposed to be learning is uncomfortable for many students. Three of the students commented that sometimes they felt they were not learning the right things or they did not know the right answers to their classroom lab activities.
Another reason why students might feel uncomfortable is that Workshop Physics requires a different type of learning from what they are used to in traditional instruction. Two students from the middle third of the class both commented on this. When one of these students was asked if the class was what he had expected it to be, he replied,
There's a lot more emphasis on using your hands in lab. I was ready to take notes and study for exams like every other class. So, this has required me to study in a different way. But I don't really have anything to compare it to. But I don't — I like learning like this. It's not too bad. It's just a different way to study, different way of learning.
When asked how studying for this class was different, he continued,
In several of the courses I've taken here, you sat in your lectures for 50 minutes, take notes, review your notes, and basically memorize things for a test. And it might just be — This is the only physics class I've taken, too. It might be that, but that's a different, too ... just having to work all the problems. But the lab manual that we work out of — you just keep up by doing exercises every day in lab. You don't really take notes. And sometimes I don't really learn the right thing, because we don't review. A lot of time, we don't go over the material — like in other classes, you have reviews or recitations, I guess, where you can ask ques-tions and those are kind of skipped over here.
The fourth point has to do with the students being part of a community. One key aspect of science-education reform and research-based physics curricula is the establishment in the classroom of a community of learners where the students discuss the central ideas of the course with one another both in and out of class. Although some of the students at NWU discuss their solutions with one another and help one another prepare for exams, they do not discuss or reflect on what they do in class when they are out of class. This is in contrast to Dickinson College and Drury College where the workshop physics students do regularly discuss class activities outside

19
of classtime. Almost all the students I interviewed at Drury and Dickinson worked with other students outside of class at least once a week. They discussed all aspects of the class, not just the homework assignments and the exams.
In general, the implementation at Drury seemed more successful than the implementation at NWU. The groups functioned better and the instructors seemed to have learned how to manage the class more effectively. However, part of the success at Drury may be due to the nature of the institutions. It should be noted that many of the students in the WP classes at Drury knew each other from other classes and they were encouraged to form study groups for many of their other classes.
C. Implementation Issues Two factors essential to the success to any curriculum that uses cooperative groups are
how well the group members work together and whether the group’s main goal is completing the activity or trying to really understand what is going on in the activity. Six of the ten NWU students interviewed mentioned problems with their groups. Note that in the second semester at NWU the groups were assigned and kept unchanged throughout the semester.
In one student’s case (top third), the problem was the way the group worked together. The two other members of her group knew each other outside of class and excluded her when both were present. However, in the weeks before the interview, one of the other women had been absent and the student was able to collaborate with her remaining lab partner. She said that lab was a much better experience with just the two of them.
For three of the other students (top, middle, and bottom third), the problem was one of conflicting goals. Their goal of trying to make sense of the lab activities was thwarted by some of their group members who stressed getting through the assignment as quickly as possible. These students were like the poor students (as judged by their performance in class) studies of students’ study procedures by Chi et al.31 and Ferguson-Hessler and de Jong.32 These studies found that students who were not performing well in the class (unlike the students who were performing well in the class) went through examples and readings and accepted them “as is” without thinking about what they were reading and/or checking to see that they understood it.
In cooperative group activities, the instructor can counter this tendency by asking semi-Socratic questions of the groups and/or the class as a whole. However, problems with the group dynamics should not be taken lightly. It is an indication that the students’ goals for learning do not match those of the instructor or the curriculum. In addition, there were also indications in the interviews that some students were not connecting the classroom activities to the homework and the exams. One student stated explicitly in her interview that she used her textbook to do the homework and the class activities to understand the concepts.
Several of the NWU students interviewed also commented about wasted time due to the confusion at the beginning of the period. From one of the students in the top third,
… so there was a lot of confusion time, just setting things up. It wasn't explained well. And that's the big thing, I think. He [The instructor] goes through each group individually and explains how to set something up. But a — rather than doing it as a whole. … I just thought with [the second semester instructor], we seem to waste a lot more time, because you couldn't really progress with the lab until you had it set up right. There just was a lag time.

20
The students need to have a good idea of what they are doing when they begin the lab activity. Leaving student groups floundering for long periods of time can result in the students being frustrated. This is where having more than one facilitator for 25 students (like at DC) can make a big difference.
From the interviews, we found that the group dynamics seemed to affect how the students viewed the curriculum. When students feel that their group works well, they tend to feel Workshop Physics is effective. If the group has difficulties, students tend to believe they would learn more in traditional instruction.
VI. Conclusion This evaluation study looked at how well students improved their understanding of basic
physics concepts and their expectations about what they were learning at institutions adopting the Workshop Physics curriculum. Two mechanics concept tests, the FCI and the FMCE, were used to measure gains in student understanding of the Newtonian force concept and a survey of author’s design, the MPEX survey, was used to evaluate student expectations. An analysis of the pre/post results of both measures shows that the classes adopting the Workshop Physics curriculum did significantly better than classes using traditional lecture methods and as well or better than classes where lectures were supplemented with active learning activities. In a few instances, the results were as good or better than Workshop Physics classes at Dickinson. However, the interviews indicated that these results can be negated by difficulties such as poor group dynamics or group confusion about what to do for a specific activity.
References
1 P.W. Laws, “Calculus-Based Physics Without Lectures,” Physics Today 44, 24-31 (1991). 2 See Ref. 1. 3 D. Hestenes, M. Wells, and G. Swackhammer, “Force Concept Inventory,” Phys. Teach. 30
(3), 141-153 (1992). 4 R.K. Thornton and D.R. Sokoloff, “Assessing student learning of Newton’s laws: The Force
and Motion Concept Evaluation,” Am. J. Phys. 66 (4), 338-351 (1998). 5 See Ref. 3 for details on the FCI and Ref. 4 for details on the FMCE. 6 D.M. Hammer, Defying Common Sense: Epistemological Beliefs in an Introductory Physics
Course, Ph.D. Dissertation, University of California at Berkeley, 1991 (Unpublished). 7 A.H. Schoenfeld, "Learning to think mathematically: problem solving, metacognition, and
sense-making in mathematics", in Handbook of Research in Mathematics Teaching and Learning, edited by D. A. Grouws (MacMillan Publishing, New York, 1992), pp. 334-370; E. Silver, “Foundations of cognitive theory and research for mathematics problem solving instruction,” in Cognitive Science in Mathematics, edited by A. Schoenfeld (Erlbaum, Hillsdale NJ, 1987) 33-60; M.F. Belenky, B.M. Clinchy, N.R. Goldberger, and J.M. Tarule, Women's Ways of Knowing (Basic Books, 1986); W.F. Perry, Forms of Intellectual and Ethical Development in the College Years (Holt, Rinehart, & Wilson, NY, 1970).

21
8 E.F. Redish, J.M. Saul, and R.N. Steinberg, “Student expectations in introductory physics
courses,” Am. J. Phys. 66 (3), 212-224 (1998). 9 University of Maryland has adopted University of Washington Tutorials for Introductory
Physics. For more information, please see E.F. Redish, J.M. Saul, and R.N. Steinberg, “On the effectiveness of active-engagement Microcomputer-Based Laboratories, Am. J. Phys. 65 (1), 45-54 (1997). The Ohio State University and University of Minnesota use the Group Problem Solving and Problem-Solving Laboratory curriculum developed by the PER group at University of Minnesota. For more information on this curriculum, please see P. Heller, T. Foster, and K. Heller, “Cooperative Group Problem Solving,” in AIP Conference Proceedings No. 399 The Changing Role of Physics Departments in Modern Universities: Proceedings of the International Conference on Undergraduate Physics Education, edited by E.F. Redish and J.S. Rigden (AIP Press, Sunnyvale NY, 1997); P. Heller, R. Keith, and S. Anderson, “Teaching problem solving through cooperative grouping. Part 1: Group versus individual problem solving,” Am. J. Phys. 60 (7), 627-636 (1992); P. Heller and M. Hollabaugh, “Teaching problem solving through cooperative grouping. Part 2: Designing Problems and cooperative groups,” Am. J. Phys 60 (7), pp. 637-644. In addition, the University of Minnesota Web pages offer a detailed description and course materials from the Group Problem Solving and Problem Solving Labs curriculum. (URL: www.physics.umn.edu/groups/physed/ )
10 FTCC also used the FCI. However, because of small classes and small samples, the data was considered unreliable and dropped from this study.
11 FTCC was a special case. Because of the nature of the student population at this community college, only a few students could be tracked at the beginning and end of the first term, let alone the sequence. Therefore, only data from interviews taken during a site visit are included in this report.
12 See Ref. 3. 13 Over six thousand students participated in a study of FCI results by Richard Hake. See R.R.
Hake, “Active-engagement vs. traditional methods: A six thousand student study of mechanics test data for introductory physics courses,” Am. J. Phys. 66 (1), 64-74 (1998).
14 As part of the MPEX study, we collected FCI data from over two thousand undergraduate students at ten schools under more controlled conditions than were used in Hake’s study. See J.M. Saul, Beyond Problem Solving, Evaluating Introductory Physics Courses Through the Hidden Curriculum, Ph.D. Dissertation, University of -Maryland at College Park, 1998 (Unpublished).
15 See Ref. 4. 16 Hake found that unlike average post score, the average fractional gain h did not correlate with
the average pre-test average. This makes h a more useful measure for comparing classes with significantly different pre-course scores.

22
17 However, as mentioned previously, some schools did not collect concept test and/or MPEX
survey data from certain classes. Because such data was not taken from all classes of a type, this does not constitute a selection bias. Also, note that not all data collected was usable.
18 The background, development, and validation of the MPEX survey is discussed in detail in Ref. 8.
19 See Ref. 6. 20 University of Maryland has a three-semester introductory physics sequence. To make the
comparison fare, Maryland results are reported from the beginning and end of the first year of instruction.
21 Matched data includes only the results from students who completed the survey both at the beginning and at the end of the period in question.
22 The students were required to sign a release form prior to being videotaped. To keep their identities confidential, each student was assigned a code name for the duration of the interview.
23 Note that the Dickinson FCI data is from the 1992 fall semester, the only year for which matched FCI was available. Dickinson feel their most recent courses have benefited from substantial improvements in the WP curriculum since then.
24 The fall 1995 class at University of Minnesota was the third year in the implementation of the Group Problem Solving curriculum in the calculus-based introductory physics sequence.
25 This was the only year that matched FCI data was available from Dickinson. In more recent classes (which benefit from substantial improvements), student understanding of the Newtonian force concept was evaluated with the FMCE.
26 Here significance refers to statistical significance. 27 Note that the University of Minnesota MPEX data was collected the year after the concept test
was collected.
28 The uncertainty nqp 00=σ where qp
pp +=0 and qpqq +=0 . For more information
on the derivation of σ, please see Ref. 7. 29 Please see the final FIPSE report for the Workshop Physics Dissemination Project by P. Laws
et al. 30 See Refs. 1, 3, 6, 8, and the two Heller et al. in Ref. 9. 31 M.T.H. Chi, M. Bassok, M.W. Lewis, P. Reimann, and R. Glaser, “Self explanations: How
students study and use examples in learning to solve problems,” Cog. Sci. 13, 145-182 (1989). 32 M.G.M. Fergusson-Hessler and T. de Jong, “Studying physics texts: Differences in study
processes between good and poor performers,” Cognition and Instruction 7, 41-54 (1990).