report on texas growth occupations 2017 · this report summarizes findings relating to existing and...
TRANSCRIPT

Texas Workforce Commission
Report on Texas Growth Occupations - 2017
LMCI 1-5-2018

1
I. Executive Summary
Texas Labor Code Section 302.019 requires the Texas Workforce Commission (TWC) to gather and study information relating to existing and projected shortages in high-wage, high-demand occupations in Texas annually, including for selected industries.
This report summarizes findings relating to existing and projected shortages in high-wage, high-demand occupations by industry in Texas. Data included in this report was the most current data available as of the end of fiscal year 2017. Thus, the Quarterly Census of Employment and Wages (QCEW) data covers the period through first quarter 2017. The Current Employment Statistics (CES) and Help Wanted Online (HWOL) data cover the period through the September 2017 estimates.
As of September 2017, Texas has experienced 89 consecutive months of annualized employment growth.
Texas remains driven by a continued economic shift towards high-skilled jobs in the Business and Professional Services sector, while the state’s rapid population growth and aging baby-boomer population increases demand for service sector jobs, primarily Leisure and Hospitality and Education and Health Services. These three industries, in addition to Trade, Transportation, and Utilities, account for over 55 percent of the jobs in Texas.
The occupations showing the highest current demand according to the HWOL data are typical of the Professional, Scientific, and Technical Services, Health Care, and Transportation and Warehousing sectors. These industries also currently show the highest employment growth rates.
For this report, TWC staff measured industry employment levels over the most recent available five-year period (first quarter of 2012 to first quarter of 2017) using employment levels reported by Texas employers under TWC’s QCEW program. This report included industry-level employment data along with HWOL data to provide comparison and context.
This report contains TWC’s most current long- and short-term projections for employment growth in Texas. Long-term projections were released in September 2016 with a base year of 2014 covering the period of 2014 to 2024. Short-term projections were released in February 2017 with a base year of 2016 covering the period of 2016 to 2018. As a result, this report uses current employment statistics programs such as QCEW, CES and HWOL to better understand the current economic situation. The next short-term employment projections, covering the period of 2017 to 2019, will be released in the Spring of 2018. The next long-term employment projections, covering the period of 2016 to 2026, will be released in Fall 2018.
Due to shifts in the economy, required education and job training for the occupations in this report ranges from professional occupations requiring a college degree, to skilled trades in construction or manufacturing that require specific technical skills training. Some jobs in this report require no post-secondary education. However, higher-paying occupations tend to require:

2
a) a bachelor’s degree and specific technical skill training, or b) some form of post-secondary education, specific technical skill training, and additional on-the-
job training.
Since no official definition of a high wage occupation exists, TWC focused in this report on growing occupations that pay more than the Texas median wage of $35,484 per year.
In preparing the projections, TWC examined more than 800 occupations, segmenting them for specific industries. Those growth occupations are listed by industry sector in Section II. For more information on TWC’s methodologies, please refer to the Methodology section at the end of this report.
II. Growth Occupations in Growth Industries
Increasing populations and higher demand for goods and services continue to drive demand for workers in the United States, particularly in Texas and its surrounding states. In some key occupations, local supply has at times struggled to keep up with demand.
This report focuses on the most in-demand occupations in Texas from 2014 through 2024 (long-term) and 2016 through 2018 (short-term). It is important to remember that even similar job titles will require unique combinations of technical skills, education, work experience, and soft skills based on each employer’s unique needs.
This section identifies occupations within major industries as defined in Chapter 302. The charts display staffing and wage information for a specific occupation in that specific industry. Occupations are then ranked by the projected employment change in Texas from 2014 to 2024. Listed industry employment data corresponds with that industry’s North American Industry Classification System (NAICS) code.

3
A. Construction
The construction industry is projected to grow by 27.8 percent from 2014 to 2024, creating the need for 177,390 workers over 10 years. Occupational projections also indicate that the highest demand will be for supervisors and for specialty trade workers to fill positions such as Electricians, Plumbers, and Carpenters.
In first quarter 2017, employment with Construction companies reached 698,844 workers. The industry has grown 23.8 percent over the last five years according to QCEW data and demand for construction workers continues to rise. Texas second quarter 2017 home sales rose significantly, while housing inventory remains at 4.1 months, driving average home prices up 6.8 percent from last year. These trends indicate strong demand for residential, commercial and industrial building projects.
Construction occupations projected to add the most jobs in the long- and short-term and pay above the Texas median wage of $35,484 are listed below.
Long-Term
Occupational Title
Annual Average
Employment 2014
Annual Average
Employment 2024
Number Change 2014-2024
Percent Growth 2014-2024
Average Annual Wage 2016
Electricians 39,740 53,490 13,750 34.6% $45,064 Supervisors of Construction Trades and Extraction Workers 43,440 55,330 11,890 27.4% $64,518
Plumbers, Pipefitters, and Steamfitters 27,290 35,160 7,870 28.8% $45,765 Carpenters 27,930 34,970 7,040 25.2% $38,164 Operating Engineers and Other Construction Equipment Operators 23,650 29,650 6,000 25.4% $40,437
Heating, Air Conditioning, and Refrigeration Mechanics and Installers 14,680 19,910 5,230 35.6% $43,211
Office Clerks, General 24,000 29,200 5,200 21.7% $38,046 General and Operations Managers 17,280 22,160 4,880 28.2% $126,436 Construction Managers 21,080 25,160 4,080 19.4% $94,737 Welders, Cutters, Solderers, and Brazers 13,450 16,460 3,010 22.4% $54,478

4
Short-Term
Occupational Title
Annual Average
Employment 2016
Annual Average
Employment 2018
Number Change 2016-2018
Percent Growth 2016-2018
Average Annual Wage 2016
Supervisors of Construction Trades & Extraction Workers 47,920 51,490 3,570 7.4% $64,518
Electricians 43,260 46,210 2,950 6.8% $45,064 Carpenters 30,820 32,910 2,090 6.8% $38,164 Plumbers, Pipefitters, & Steamfitters 29,850 31,800 1,950 6.5% $45,765 Operating Engineers & Other Construction Equipment Operators 25,970 27,770 1,800 6.9% $40,437
Construction Managers 23,310 24,800 1,490 6.4% $94,737 Office Clerks, General 26,290 27,770 1,480 5.6% $38,046 General & Operations Managers 18,940 20,230 1,290 6.8% $126,436 Heating, AC, & Refrigeration Mechanics & Installers 15,960 17,020 1,060 6.6% $43,211
Welders, Cutters, Solderers, & Brazers 14,780 15,760 980 6.6% $54,478

5
B. Manufacturing
Texas produces more than 11 percent of the total manufactured goods in the United States. It also exports more goods by dollar value to Mexico and Canada than to any other country. Despite a strong dollar, which typically reduces demand for exports, the Dallas Federal Reserve Bank (DFRB) manufacturing production index posted 15 consecutive positive readings in September, suggesting manufacturing output continues to expand in Texas.
The Manufacturing industry has changed in recent years with increased automation, driving up manufacturing wages for 94 consecutive months according to the DFRB monthly Manufacturing Outlook survey. This is likely due to an increase in demand for higher-skilled employees. These ongoing changes may have fed the contraction of 11,000 manufacturing jobs from first quarter 2012 to first quarter 2017. The industry began showing positive growth starting in November 2016.
Manufacturing industry employment is expected to increase by 7.2 percent by 2024. This increase spans a broad range of skill sets including Industrial Machinery Mechanics; Computer Controlled Machine Tool Operators; and Welders, Cutters, Solderers, and Brazers, among others as shown below.
Long-Term
Occupational Title
Annual Average
Employment 2014
Annual Average
Employment 2024
Number Change 2014-2024
Percent Growth 2014-2024
Average Annual Wage 2016
Industrial Machinery Mechanics 10,990 14,090 3,100 28.2% $54,224 Supervisors of Production and Operating Workers 32,130 34,910 2,780 8.7% $68,371
Computer-Controlled Machine Tool Operators, Metal and Plastic 12,180 14,580 2,400 19.7% $40,446
Welders, Cutters, Solderers, and Brazers 25,550 27,730 2,180 8.5% $40,281 Heavy and Tractor-Trailer Truck Drivers 12,890 15,000 2,110 16.4% $38,872 Sales Representatives, Wholesale and Manufacturing, Except Technical and Scientific Products
20,250 22,070 1,820 9.0% $69,338
Chemical Equipment Operators and Tenders 11,420 13,220 1,800 15.8% $62,746 Maintenance Workers, Machinery 7,110 8,660 1,550 21.8% $44,713 General and Operations Managers 16,750 17,990 1,240 7.4% $143,065 Inspectors, Testers, Sorters, Samplers, and Weighers 25,340 26,560 1,220 4.8% $41,330

6
Short-Term
Occupational Title
Annual Average
Employment 2016
Annual Average
Employment 2018
Number Change 2016-2018
Percent Growth 2016-2018
Average Annual Wage 2016
Industrial Machinery Mechanics 10,510 10,980 470 4.5% $54,224 Heavy & Tractor-Trailer Truck Drivers 13,420 13,780 360 2.7% $38,872 Electrical & Electronics Engineering Technicians 7,390 7,630 240 3.2% $58,563
Industrial Engineers 8,320 8,500 180 2.2% $95,355 Chemical Equipment Operators & Tenders 11,720 11,900 180 1.5% $62,746 Computer-Controlled Machine Tool Operators, Metal & Plastic 10,600 10,770 170 1.6% $40,446
Semiconductor Processors 3,990 4,160 170 4.3% $36,594 Software Developers, Systems Software 6,480 6,630 150 2.3% $105,988 Maintenance Workers, Machinery 6,970 7,120 150 2.2% $44,713 Electronics Engineers, Exc. Computer 4,540 4,680 140 3.1% $114,522

7
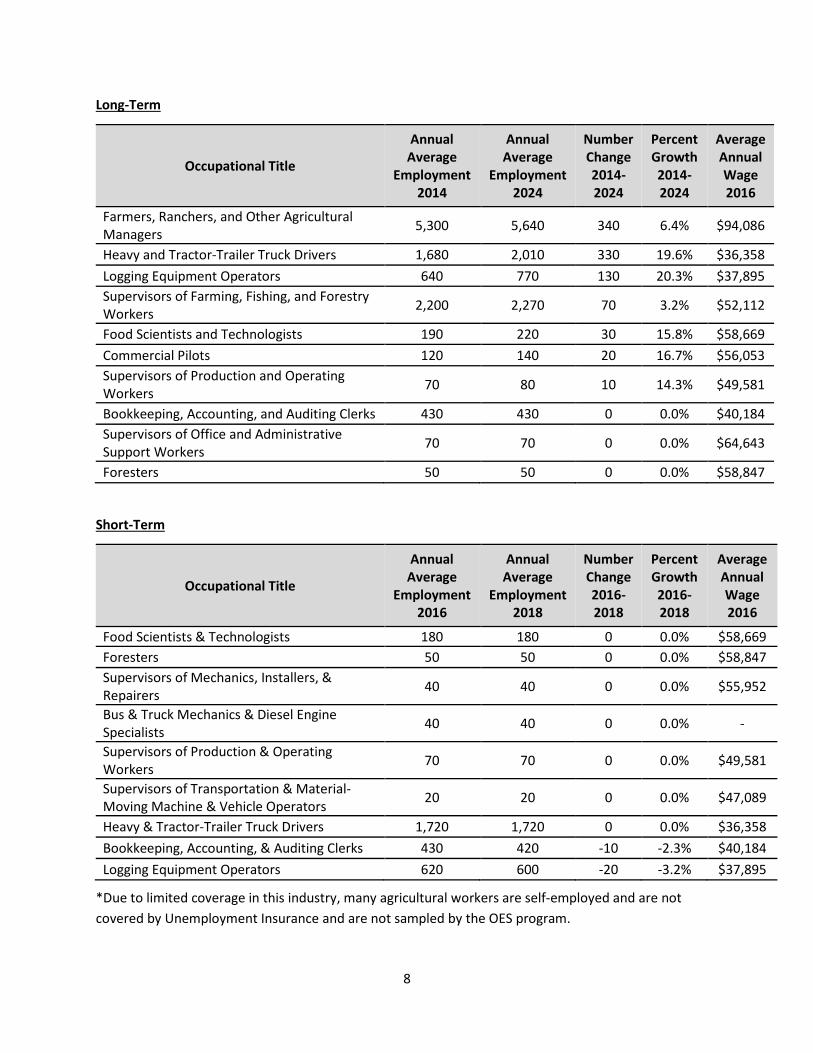
C. Agriculture and Forestry
Though the Agriculture and Forestry industry is one of Texas’ smallest in terms of employment, it leads the nation in many ways. The industry produces the most cattle, cotton, hay, sheep, goats and mohair of any state in the nation.1 Texas also has the most farms and ranches in the country: 248,800 covering 130.2 million acres.2
In Texas and across the nation, this industry has been using fewer and fewer workers in recent decades as farming methods have become more efficient. Farms now tend to be fewer in number, larger and more expensive to operate, but also much more productive.
From first quarter of 2012 to first quarter of 2017 the Agriculture and Forestry industry in Texas grew by 6.5 percent, adding 3,617 jobs. This trend is also supported by the Conference Board’s HWOL data which has shown a 64 percent increase in job postings over the year. The industry is projected to add nearly 6,700 jobs by 2024, growing to 64,850 jobs total.
Agriculture and Forestry industry jobs projected to add the most positions over the long- and short-term are listed below.
1 Texas Department of Agriculture (https://texasagriculture.gov/About/TexasAgStats) 2 Texas Department of Agriculture (https://texasagriculture.gov/About/TexasAgStats)
8
Long-Term
Occupational Title
Annual Average
Employment 2014
Annual Average
Employment 2024
Number Change 2014-2024
Percent Growth 2014-2024
Average Annual Wage 2016
Farmers, Ranchers, and Other Agricultural Managers 5,300 5,640 340 6.4% $94,086
Heavy and Tractor-Trailer Truck Drivers 1,680 2,010 330 19.6% $36,358 Logging Equipment Operators 640 770 130 20.3% $37,895 Supervisors of Farming, Fishing, and Forestry Workers 2,200 2,270 70 3.2% $52,112
Food Scientists and Technologists 190 220 30 15.8% $58,669 Commercial Pilots 120 140 20 16.7% $56,053 Supervisors of Production and Operating Workers 70 80 10 14.3% $49,581
Bookkeeping, Accounting, and Auditing Clerks 430 430 0 0.0% $40,184 Supervisors of Office and Administrative Support Workers 70 70 0 0.0% $64,643
Foresters 50 50 0 0.0% $58,847
Short-Term
Occupational Title
Annual Average
Employment 2016
Annual Average
Employment 2018
Number Change 2016-2018
Percent Growth 2016-2018
Average Annual Wage 2016
Food Scientists & Technologists 180 180 0 0.0% $58,669 Foresters 50 50 0 0.0% $58,847 Supervisors of Mechanics, Installers, & Repairers 40 40 0 0.0% $55,952
Bus & Truck Mechanics & Diesel Engine Specialists 40 40 0 0.0% -
Supervisors of Production & Operating Workers 70 70 0 0.0% $49,581
Supervisors of Transportation & Material-Moving Machine & Vehicle Operators 20 20 0 0.0% $47,089
Heavy & Tractor-Trailer Truck Drivers 1,720 1,720 0 0.0% $36,358 Bookkeeping, Accounting, & Auditing Clerks 430 420 -10 -2.3% $40,184 Logging Equipment Operators 620 600 -20 -3.2% $37,895
*Due to limited coverage in this industry, many agricultural workers are self-employed and are not covered by Unemployment Insurance and are not sampled by the OES program.

9
D. Health Care and Social Assistance
The Health Care and Social Assistance industry grew to 1,530,608 positions in first quarter 2017. The industry has averaged 3.1 percent annual growth over the past 5 years, resulting in 219,818 jobs added. According to long-term industry projections, Health Care and Social Assistance employment is expected to grow to approximately 1,892,000 jobs by 2024, posting the strongest growth of the 11 industries in this report at 32.2 percent.
Ambulatory Health Care Services, which consists of doctors’ and dentists’ offices, outpatient care centers and medical and diagnostic laboratories, comprises about 47 percent of the Health Care and Social Assistance industry. Ambulatory Health Care Services has averaged 3.2 percent annual growth over the past five years, slightly faster than Health Care and Social Assistance overall.
A consistent need for nurses drives occupational demand within the Health Care and Social Assistance industry. HWOL shows the industry job postings are down 14.5 percent over-the-year perhaps largely due to Registered Nurses (RNs) postings declining 20 percent over the year. RNs account for one in four job postings in the industry. Licensed Practical and Licensed Vocational Nurses (LVNs), Nursing Assistants and Medical Assistants are also among the top 5 most listed positions. This historically strong demand is reflected in long-term occupational projections with RNs and LVNs projected to add the most positions over the coming years.
Health Care and Social Assistance occupations projected to add the most jobs in the long- and short-term are listed below.

10
Long-Term
Occupational Title
Annual Average
Employment 2014
Annual Average
Employment 2024
Number Change 2014-2024
Percent Growth 2014-2024
Average Annual Wage 2016
Registered Nurses 168,960 225,170 56,210 33.3% $70,361 Licensed Practical and Licensed Vocational Nurses 58,430 75,000 16,570 28.4% $46,357
Office Clerks, General 37,670 47,550 9,880 26.2% $38,816 Dental Assistants 23,620 30,090 6,470 27.4% $35,534 Medical and Health Services Managers 15,990 21,030 5,040 31.5% $102,340 Physical Therapists 11,380 15,580 4,200 36.9% $96,858 Medical Records and Health Information Technicians 12,700 16,750 4,050 31.9% $38,867
General and Operations Managers 11,770 15,700 3,930 33.4% $102,874 Radiologic Technologists 14,340 18,020 3,680 25.7% $55,675 Nurse Practitioners 6,850 10,460 3,610 52.7% $110,504
Short-Term
Occupational Title
Annual Average
Employment 2016
Annual Average
Employment 2018
Number Change 2016-2018
Percent Growth 2016-2018
Average Annual Wage 2016
Registered Nurses 178,780 186,130 7,350 4.1% $70,361 Licensed Practical & Licensed Vocational Nurses 61,240 63,260 2,020 3.3% $46,357
Office Clerks, General 40,400 41,980 1,580 3.9% $38,816 General & Operations Managers 12,670 13,400 730 5.8% $102,874 Medical & Health Services Managers 16,990 17,690 700 4.1% $102,340 Physical Therapists 12,150 12,840 690 5.7% $96,858 Physicians and Surgeons, All Other 17,850 18,430 580 3.2% $207,656 Dental Assistants 25,250 25,830 580 2.3% $35,534 Speech-Language Pathologists 7,600 8,110 510 6.7% $91,130 Medical Records & Health Information Technicians 13,380 13,870 490 3.7% $38,867

11
E. Educational Services
Demand for Educational Services will continue to grow in Texas due to an expanding population. From 2010 to 2016, Texas added 2,716,496 people--more than any other state in the nation. During this span, school enrollment for persons three years of age and older jumped by 405,370 students, a 5.6 percent increase. Enrollment grew even more drastically over 10 years with 1,036,409 students added since 2006, a 15.8 percent increase.
QCEW data shows Educational Services employment added 95,530 jobs over five years beginning first quarter 2012, an 8.6 percent gain that puts industry employment at 1,210,629 jobs for first quarter 2017. The industry is expected to expand by another 21.7 percent from 2014 to 2024 according to the Texas Workforce Commission’s long-term industry projections. HWOL has shown strong industry demand by adding 10.4 percent more postings over the year.
TWC’s Occupational projections data estimate that Elementary, Secondary, and Middle School Teachers as well as Educational Administrators for both public and private Texas schools will all increase by 24.6 percent by 2024. Educational Services occupations projected to add the most jobs in the long- and short-term are listed below.
Long-Term
Occupational Title
Annual Average
Employment 2014
Annual Average
Employment 2024
Number Change 2014-2024
Percent Growth 2014-2024
Average Annual Wage 2016
Elementary School Teachers 137,720 171,550 33,830 24.6% $54,801 Secondary School Teachers 100,550 125,250 24,700 24.6% $55,488 Middle School Teachers 69,040 86,050 17,010 24.6% $55,000 Education Administrators, Elementary and Secondary School 23,140 28,840 5,700 24.6% $82,432
Educational, Guidance, School, and Vocational Counselors 20,940 25,840 4,900 23.4% $59,690
Kindergarten Teachers 14,090 17,580 3,490 24.8% $55,075 Health Specialties Teachers, Postsecondary 11,840 15,250 3,410 28.8% $108,816 Self-Enrichment Education Teachers 9,350 12,300 2,950 31.6% $40,237 Special Education Teachers, Kindergarten and Elementary School 11,720 14,590 2,870 24.5% $55,853
Instructional Coordinators 11,260 13,810 2,550 22.6% $68,589

12
Short-Term
Occupational Title
Annual Average
Employment 2016
Annual Average
Employment 2018
Number Change 2016-2018
Percent Growth 2016-2018
Average Annual Wage 2016
Elementary School Teachers, Exc. Special Education 155,540 161,300 5,760 3.7% $54,801
Secondary School Teachers, Exc. Special & Career/Technical Education 113,530 117,750 4,220 3.7% $55,488
Middle School Teachers, Exc. Special & Career/Technical Education 77,980 80,870 2,890 3.7% $55,000
Education Administrators, Elementary & Secondary School 26,160 27,140 980 3.7% $82,432
Educational, Guidance, School, & Vocational Counselors 22,640 23,610 970 4.3% $59,690
Health Specialties Teachers, Postsecondary 11,490 12,220 730 6.4% $108,816 Self-Enrichment Education Teachers 10,390 11,120 730 7.0% $40,237 Kindergarten Teachers, Exc. Special Education 15,980 16,580 600 3.8% $55,075 Special Education Teachers, Kindergarten & Elementary School 13,240 13,730 490 3.7% $55,853
Instructional Coordinators 12,480 12,970 490 3.9% $68,589

13
F. Transportation and Warehousing
The Transportation and Warehousing industry grew to an estimated 501,546 positions in first quarter 2017. The industry has averaged 3.8 percent annual growth over the past five years, adding 84,361 jobs. According to long-term industry projections, Transportation and Warehousing employment is expected to grow to approximately 561,000 positions by 2024.
Truck Transportation makes up about 27 percent of the overall Transportation and Warehousing industry, and has averaged 2.3 percent annual growth over the past five years. According to HWOL, Transportation and Warehousing postings are down 17 percent over the year largely due to local general freight trucking being down 45 percent over the year. However, job postings for long-distance general freight trucking, specialized freight, and general warehousing and storage are up over the year. Long-term occupational projections reflect this demand, as Heavy & Tractor-Trailer Drivers and Light Truck or Delivery Services Drivers are expected to add the most positions in the overall Transportation and Warehousing industry over 10 years.
Warehousing and Storage employment grew at an 11.8 percent annualized rate over the past five years, representing the addition of 34,891 jobs. This accounts for about 41 percent of the overall employment gains in Transportation and Warehousing over the past five years. This trend is expected to continue as Amazon and other online retailers expand their distribution infrastructure in Texas.
Transportation and Warehousing occupations projected to add the most jobs in the long- and short-term are listed below.
Long-Term
Occupational Title
Annual Average
Employment 2014
Annual Average
Employment 2024
Number Change 2014-2024
Percent Growth 2014-2024
Average Annual Wage 2016
Heavy and Tractor-Trailer Truck Drivers 90,830 114,730 23,900 26.3% $45,136 Light Truck or Delivery Services Drivers 17,810 23,010 5,200 29.2% $41,037 Flight Attendants 12,550 16,090 3,540 28.2% $55,952 Postal Service Mail Carriers 21,440 23,770 2,330 10.9% $50,379 Airline Pilots, Copilots, and Flight Engineers 8,070 10,340 2,270 28.1% $203,524 Cargo and Freight Agents 8,740 10,980 2,240 25.6% $47,718 Dispatchers, Except Police, Fire, and Ambulance 8,800 10,900 2,100 23.9% $39,945
Customer Service Representatives 8,210 10,150 1,940 23.6% $37,051 Aircraft Mechanics and Service Technicians 8,930 10,820 1,890 21.2% $64,831 Supervisors of Transportation and Material-Moving Machine and Vehicle Operators 7,900 9,660 1,760 22.3% $64,357

14
Short-Term
Occupational Title
Annual Average
Employment 2016
Annual Average
Employment 2018
Number Change 2016-2018
Percent Growth 2016-2018
Average Annual Wage 2016
Heavy & Tractor-Trailer Truck Drivers 94,150 97,410 3,260 3.5% $45,136 Light Truck or Delivery Services Drivers 19,380 20,560 1,180 6.1% $41,037 Flight Attendants 14,400 15,060 660 4.6% $55,952 Customer Service Representatives 9,060 9,520 460 5.1% $37,051 Cargo & Freight Agents 9,560 10,010 450 4.7% $47,718 Airline Pilots, Copilots, & Flight Engineers 9,280 9,690 410 4.4% $203,524 General & Operations Managers 7,300 7,670 370 5.1% $121,374 Supervisors of Transportation & Material-Moving Machine & Vehicle Operators 8,460 8,820 360 4.3% $64,357
Reservation & Transportation Ticket Agents & Travel Clerks 8,960 9,300 340 3.8% $43,614
Supervisors of Helpers, Laborers, & Material Movers, Hand 4,340 4,680 340 7.8% $52,143

15
G. Mining, Quarrying, and Oil and Gas Extraction
The Mining, Quarrying, and Oil and Gas Extraction industry projections, prepared in 2016 with a 2014 base year, do not adequately capture the industry’s upswing over the past year. HWOL data shows industry job postings growing 135.8 percent annually in Texas, representing a net increase of 1,183 job postings over the year.
Automation has impacted the numbers of oil workers needed on rigs, while numbers of support and headquarters office personnel continue to rise. As oil prices continue to rise, recovery in the Mining, Quarrying, and Oil and Gas Extraction industry is expected to continue.
Mining, Quarrying, and Oil and Gas Extractions occupations projected to add the most jobs in the long- and short-term are listed below.
Long-Term
Occupational Title
Annual Average
Employment 2014
Annual Average
Employment 2024
Number Change 2014-2024
Percent Growth 2014-2024
Average Annual Wage 2016
Crushing, Grinding, and Polishing Machine Setters, Operators, and Tenders 440 480 40 9.1% $36,161
Lawyers 1780 1800 20 1.1% $189,338 Paralegals and Legal Assistants 340 350 10 2.9% $65,059 Cartographers and Photogrammetrists 130 140 10 7.7% $77,468 Excavating and Loading Machine and Dragline Operators 1,390 1,390 0 0.0% $40,797
Loading Machine Operators, Underground Mining 80 80 0 0.0% -
Operations Research Analysts 50 50 0 0.0% $91,522 Economists 50 50 0 0.0% $129,697 Legal Secretaries 30 30 0 0.0% $57,152 Civil Engineering Technicians 30 30 0 0.0% $68,623

16
Short-Term
Occupational Title
Annual Average
Employment 2016
Annual Average
Employment 2018
Number Change 2016-2018
Percent Growth 2016-2018
Average Annual Wage 2016
Heavy & Tractor-Trailer Truck Drivers 10,310 10,650 340 3.3% $42,351 Helpers, Extraction Workers 4,500 4,570 70 1.6% $36,864 Derrick Operators, Oil & Gas 5,930 5,990 60 1.0% $51,051 Rotary Drill Operators, Oil & Gas 6,290 6,350 60 1.0% $55,071 Computer Systems Analysts 2,870 2,910 40 1.4% $110,740 Geological & Petroleum Technicians 3,470 3,510 40 1.2% $73,109 Maintenance Workers, Machinery 1,210 1,250 40 3.3% $44,329 Inspectors, Testers, Sorters, Samplers, & Weighers 2,340 2,380 40 1.7% $49,361
Supervisors of Mechanics, Installers, & Repairers 1,170 1,190 20 1.7% $83,120
Bus & Truck Mechanics & Diesel Engine Specialists 950 970 20 2.1% $46,351

17
H. Utilities
With 49,852 private sector jobs in first quarter 2017, Utilities is one of the smallest industries covered by this report. Historic trend according to the QCEW has shown this industry growing by 1.2 percent over the last five years.
The Texas Utilities industry is projected to grow at 17.8 percent from 2014-2024, adding 8,550 private sector jobs during that time. The driving force behind this growth will likely be the increased infrastructure needs for Texas’ rapidly expanding population. According to the Census, between 2015 and 2016, the Texas population grew at a faster rate than the nation. The state ranked first in absolute population change over the year, growing by 432,957 people, more than any other state.
Some of the larger expected growth occupations in the Utilities industry from 2014-2024 include: Electric Power-Line Installers and Repairers, Industrial Machinery Mechanics, Power Plant Operators, Customer Service Representatives, and Wind Turbine Service Technicians.
Utilities occupations projected to add the most jobs in the long- and short-term are listed below.
Long-Term
Occupational Title
Annual Average
Employment 2014
Annual Average
Employment 2024
Number Change 2014-2024
Percent Growth 2014-2024
Average Annual Wage 2016
Electrical Power-Line Installers and Repairers 4,580 5,400 820 17.9% $60,167 Industrial Machinery Mechanics 1,150 1,630 480 41.7% $61,233 Power Plant Operators 2,590 3,060 470 18.1% $70,052 Customer Service Representatives 2,170 2,550 380 17.5% $40,801 Water and Wastewater Treatment Plant and System Operators 1630 1930 300 18.4% $37,402
Wind Turbine Service Technicians 210 510 300 142.9% $62,767 Control and Valve Installers and Repairers, Except Mechanical Door 1,460 1,720 260 17.8% $49,619
Supervisors of Mechanics, Installers, and Repairers 1,350 1,590 240 17.8% $77,176
General and Operations Managers 1,350 1,590 240 17.8% $136,482 Office Clerks, General 1,800 2,020 220 12.2% $37,048

18
Short-Term
Occupational Title
Annual Average
Employment 2016
Annual Average
Employment 2018
Number Change 2016-2018
Percent Growth 2016-2018
Average Annual Wage 2016
Water & Wastewater Treatment Plant & System Operators 1,720 1,820 100 5.8% $37,402
General & Operations Managers 1,420 1,450 30 2.1% $136,482 Customer Service Representatives 2,290 2,320 30 1.3% $40,801 Computer Systems Analysts 560 580 20 3.6% $95,297 Office Clerks, General 1,900 1,920 20 1.1% $37,048 Supervisors of Mechanics, Installers, & Repairers 1,430 1,450 20 1.4% $77,176
Control & Valve Installers & Repairers, Exc. Mechanical Door 1,530 1,550 20 1.3% $49,619
Maintenance & Repair Workers, General 650 670 20 3.1% $43,915 Power Plant Operators 2,770 2,790 20 0.7% $70,052 Financial Managers 270 280 10 3.7% $145,095

19
I. Wholesale Trade
The Wholesale Trade industry in Texas is predicted to grow 22.1 percent from 2014-2024, adding an additional 118,430 jobs during that period. This exceeds the overall statewide industry forecasted growth rate of 20.7 percent over 10 years. Wholesale Trade has grown by 48,585 jobs over the last five years, a five-year job growth percentage increase of 9.2 percent according to QCEW.
The five largest growth occupations in the Wholesale Trade industry include: Sales Representatives, Wholesale and Manufacturing, Except Technical and Scientific Products; Heavy and Tractor-Trailer Truck Driver; Office Clerks-General; Drivers/Sales Workers; and Sales Representatives, Wholesale and Manufacturing, Technical and Scientific Products.
Wholesale Trade occupations projected to add the most jobs in the long- and short-term are listed below.
Long-Term
Occupational Title
Annual Average
Employment 2014
Annual Average
Employment 2024
Number Change 2014-2024
Percent Growth 2014-2024
Average Annual Wage 2016
Sales Representatives, Wholesale and Manufacturing, Except Technical and Scientific Products
74,750 92,750 18,000 24.1% $74,126
Heavy and Tractor-Trailer Truck Drivers 23,190 28,610 5,420 23.4% $40,649 Office Clerks, General 26,660 31,280 4,620 17.3% $37,437 Customer Service Representatives 16,440 20,330 3,890 23.7% $36,443 General and Operations Managers 16,040 19,760 3,720 23.2% $140,048 Driver/Sales Workers 16,060 19,710 3,650 22.7% $38,125 Sales Representatives, Wholesale and Manufacturing, Technical and Scientific Products
14,520 17,910 3,390 23.3% $98,064
Supervisors of Non-Retail Sales Workers 8,480 10,520 2,040 24.1% $81,665 Supervisors of Office and Administrative Support Workers 7,000 8,630 1,630 23.3% $56,740
Parts Salespersons 6,450 7,860 1,410 21.9% $38,772

20
Short-Term
Occupational Title
Annual Average
Employment 2016
Annual Average
Employment 2018
Number Change 2016-2018
Percent Growth 2016-2018
Average Annual Wage 2016
Heavy & Tractor-Trailer Truck Drivers 22,850 23,350 500 2.2% $40,649
Sales Representatives, Wholesale & Manufacturing, Exc. Technical & Scientific Products
74,180 74,670 490 0.7% $74,126
General & Operations Managers 15,860 16,190 330 2.1% $140,048 Driver/Sales Workers 16,040 16,300 260 1.6% $38,125 Bus & Truck Mechanics & Diesel Engine Specialists 3,310 3,490 180 5.4% $47,572
Industrial Machinery Mechanics 2,630 2,800 170 6.5% $49,086 Market Research Analysts & Marketing Specialists 4,180 4,310 130 3.1% $77,002
Sales Representatives, Wholesale & Manufacturing, Technical & Scientific Products
15,430 15,560 130 0.8% $98,064
Computer Systems Analysts 3,310 3,430 120 3.6% $88,658 Customer Service Representatives 16,630 16,740 110 0.7% $36,443

21
J. Retail Trade
Retail Trade is a large, important and growing industry in Texas. An expanding economy and growing population have increased demand for retail goods. In first quarter of 2017 alone, gross sales in Texas’ Retail Trade industry reached $99 billion.3 Eight of the top 100 U.S. retail companies headquarter in Texas.4
The industry is projected to add nearly 250,000 jobs by 2024, growing to 1,494,870 jobs total. From first quarter 2012 to first quarter 2017, Texas’ Retail Trade industry grew more than 13 percent, representing 2.5 percent annualized growth and 153,752 jobs added over five years. In the recent year, Retail Trade growth has slowed to 1.2 percent annually, likely due to the competition between brick and mortar retail and electronic commerce. Technology is immersing itself into the industry to a growing degree, with increasing analytics on customers, inventory and conversions.
Retail Trade industry jobs projected to add the most positions over the long-term are listed below. Typical Retail Trade industry jobs such as retail sales people, cashiers and stock clerks and order fillers are projected to grow by the largest number. However, these occupations pay below the state median wage and therefore do not appear in this analysis. In the coming years, given the increase in the use of technology in the industry, we may see changes in the in-demand occupations typically associated with Retail.
3 Texas Comptroller of Public Accounts, http://comptroller.texas.gov/taxinfo/staxqtr/stxqtr02.html 4 National Retail Federation, https://nrf.com/advocacy/retails-impact/tx

22
Long-Term
Occupational Title
Annual Average
Employment 2014
Annual Average
Employment 2024
Number Change 2014-2024
Percent Growth 2014-2024
Average Annual Wage 2016
Supervisors of Retail Sales Workers 90,110 107,420 17,310 19.2% $46,783 Automotive Service Technicians and Mechanics 23,550 28,110 4,560 19.4% $41,874
General and Operations Managers 16,670 20,220 3,550 21.3% $107,552 Supervisors of Office and Administrative Support Workers 13,580 16,430 2,850 21.0% $50,889
Pharmacists 12,040 13,690 1,650 13.7% $126,302 Supervisors of Mechanics, Installers, and Repairers 4,480 5,570 1,090 24.3% $67,458
Automotive Body and Related Repairers 3,530 4,480 950 26.9% $47,442 Sales Representatives, Wholesale and Manufacturing, Except Technical and Scientific Products
4,250 5,150 900 21.2% $104,390
Heavy and Tractor-Trailer Truck Drivers 3,820 4,590 770 20.2% $37,917 Sales Managers 3,470 4,190 720 20.7% $130,654
Short-Term
Occupational Title
Annual Average
Employment 2016
Annual Average
Employment 2018
Number Change 2016-2018
Percent Growth 2016-2018
Average Annual Wage 2016
Supervisors of Retail Sales Workers 94,080 97,370 3,290 3.5% $46,783 Automotive Service Technicians & Mechanics 25,450 26,300 850 3.3% $41,874 General & Operations Managers 17,600 18,270 670 3.8% $107,552 Supervisors of Office & Administrative Support Workers 14,340 14,980 640 4.5% $50,889
Sales Representatives, Services, All Other 8,900 9,200 300 3.4% $41,487 Pharmacists 12,690 12,970 280 2.2% $126,302 Sales and Related Workers, All Other 4,090 4,300 210 5.1% $35,566 Sales Representatives, Wholesale & Manufacturing, Exc. Technical & Scientific Products
4,560 4,750 190 4.2% $104,390
Supervisors of Mechanics, Installers, & Repairers 4,830 5,020 190 3.9% $67,458
Automotive Body & Related Repairers 3,820 3,990 170 4.5% $47,442

23
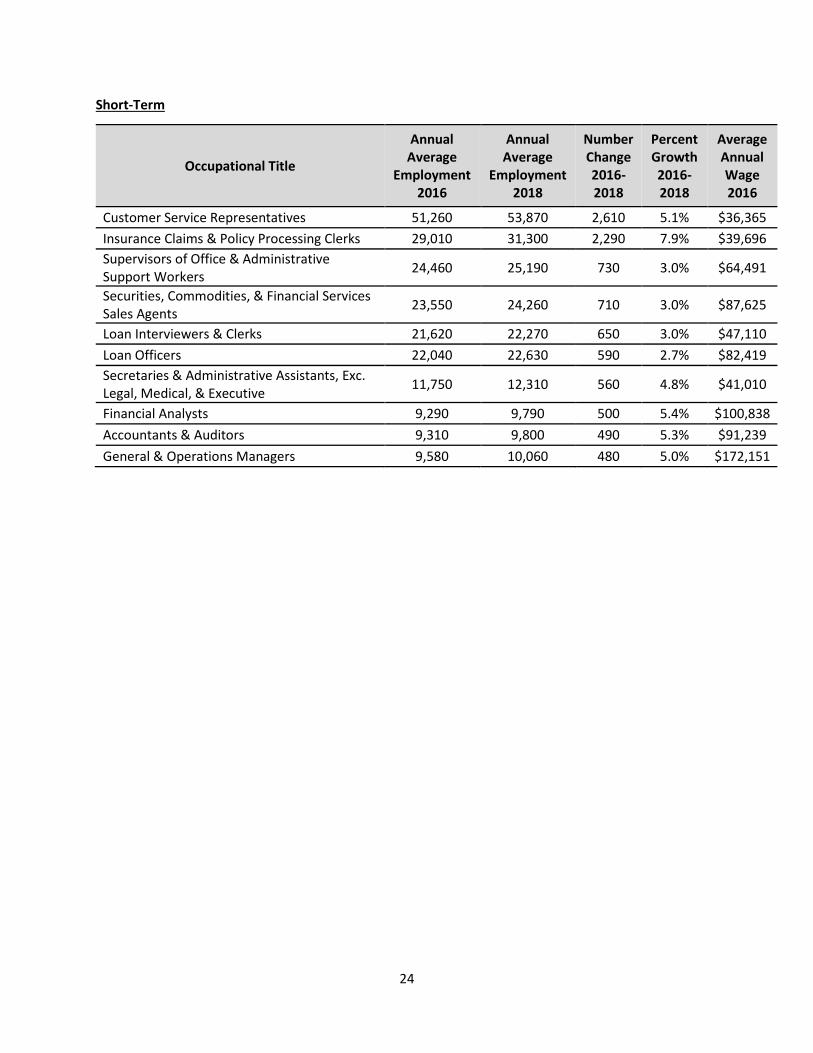
K. Finance and Insurance
From 2014 to 2024, the Finance and Insurance industry is projected to grow by 17.6 percent, adding 85,760 jobs. Projections indicate most jobs will be available in positions such as Insurance Claims & Policy Clerks, Customer Service Representatives, and Financial Services Sales Agents.
First Quarter 2017 QCEW data indicates the industry totaled 520,087 jobs and has grown 12.9 percent over the last five years.
Large firms are headquartered in cities across Texas, with the Dallas metroplex a large and continually growing international financial center. Texas’ high population growth rate will also continue to drive this sector as more residents create demand for loans and insurance policies.
Finance and Insurance occupations projected to add the most jobs in the long- and short-term are listed below.
Long-Term
Occupational Title
Annual Average
Employment 2014
Annual Average
Employment 2024
Number Change 2014-2024
Percent Growth 2014-2024
Average Annual Wage 2016
Customer Service Representatives 48,030 57,440 9,410 19.6% $36,365 Insurance Sales Agents 35,890 44,220 8,330 23.2% $58,370 Insurance Claims and Policy Processing Clerks 26,130 31,730 5,600 21.4% $39,696
Personal Financial Advisors 12,470 16,840 4,370 35.0% $115,865 Loan Officers 21,240 25,570 4,330 20.4% $82,419 Loan Interviewers and Clerks 20,590 24,790 4,200 20.4% $47,110 Supervisors of Office and Administrative Support Workers 23,590 27,600 4,010 17.0% $64,491
Securities, Commodities, and Financial Services Sales Agents 22,860 26,860 4,000 17.5% $87,625
Claims Adjusters, Examiners, and Investigators 11,790 14,130 2,340 19.8% $71,335
General and Operations Managers 8,960 10,820 1,860 20.8% $172,151
24
Short-Term
Occupational Title
Annual Average
Employment 2016
Annual Average
Employment 2018
Number Change 2016-2018
Percent Growth 2016-2018
Average Annual Wage 2016
Customer Service Representatives 51,260 53,870 2,610 5.1% $36,365 Insurance Claims & Policy Processing Clerks 29,010 31,300 2,290 7.9% $39,696 Supervisors of Office & Administrative Support Workers 24,460 25,190 730 3.0% $64,491
Securities, Commodities, & Financial Services Sales Agents 23,550 24,260 710 3.0% $87,625
Loan Interviewers & Clerks 21,620 22,270 650 3.0% $47,110 Loan Officers 22,040 22,630 590 2.7% $82,419 Secretaries & Administrative Assistants, Exc. Legal, Medical, & Executive 11,750 12,310 560 4.8% $41,010
Financial Analysts 9,290 9,790 500 5.4% $100,838 Accountants & Auditors 9,310 9,800 490 5.3% $91,239 General & Operations Managers 9,580 10,060 480 5.0% $172,151

25
L. Professional, Scientific, and Technical Services
From 2014 to 2024, the Professional and Technical Services industry is projected to grow by 26.2 percent, adding 168,040 jobs. Establishments in this industry employ workers in many different occupations. Projections indicate most jobs will be available in highly skilled positions such as Software Developers, Accountants, and Lawyers.
QCEW data indicates jobs in this industry totaled 737,459 as of first quarter 2017. Also, for the first time in the QCEW series history, Professional, Scientific, and Technical Services is the industry with the largest employment in a Workforce Development Area (WDA) in Texas: The Capital Area WDA, which consists of Austin’s Travis county. This aligns with the trend we have observed since 2014 with at least two dozen Silicon Valley tech companies relocating to or opening offices in Texas. A number of these firms recently built or expanded major campuses in Austin.
This large industry is expected to continue growing rapidly through 2024. Demand for highly skilled technology workers will likely drive growth in this industry group. This bodes well for Texas since many of these occupations also command higher than average salaries.
Professional, Scientific, and Technical Services occupations projected to add the most jobs in the long- and short-term are listed below.
Long-Term
Occupational Title
Annual Average
Employment 2014
Annual Average
Employment 2024
Number Change 2014-2024
Percent Growth 2014-2024
Average Annual Wage 2016
Accountants and Auditors 37,380 51,580 14,200 38.0% $82,599 Computer Systems Analysts 24,240 34,350 10,110 41.7% $96,510 Software Developers, Applications 19,170 26,470 7,300 38.1% $106,522 Lawyers 25,570 32,360 6,790 26.6% $155,716 Computer User Support Specialists 14,100 19,490 5,390 38.2% $55,872 Office Clerks, General 28,940 34,250 5,310 18.3% $39,264 Paralegals and Legal Assistants 17,290 22,220 4,930 28.5% $52,482 Software Developers, Systems Software 12,990 17,750 4,760 36.6% $110,807 General and Operations Managers 16,330 20,790 4,460 27.3% $162,158 Management Analysts 13,020 17,130 4,110 31.6% $106,006

26
Short-Term
Occupational Title
Annual Average
Employment 2016
Annual Average
Employment 2018
Number Change 2016-2018
Percent Growth 2016-2018
Average Annual Wage 2016
Computer Systems Analysts 27,800 29,890 2,090 7.5% $96,510 Accountants & Auditors 37,560 39,560 2,000 5.3% $82,599 Software Developers, Applications 22,200 23,720 1,520 6.8% $106,522 Computer User Support Specialists 16,060 17,160 1,100 6.8% $55,872 Software Developers, Systems Software 14,770 15,740 970 6.6% $110,807 Management Analysts 14,160 15,010 850 6.0% $106,006 Office Clerks, General 30,130 30,920 790 2.6% $39,264 General & Operations Managers 17,490 18,270 780 4.5% $162,158 Lawyers 25,350 26,080 730 2.9% $155,716 Customer Service Representatives 13,840 14,500 660 4.8% $38,264

27
M. Accommodation and Food Services
The Accommodation and Food Services industry remains among the strongest performing industries in Texas and is projected to grow by 29.7 percent, adding 315,180 jobs over 10 years. This industry also grows with population and tourism which have been booming. Industry growth spans many occupations with a wide range of salaries and education levels such as Event Planners, Chefs, Accountants and Heavy Truck Drivers.
From first quarter 2012 to first quarter 2017, Accommodation and Food Services in Texas grew by more than 22 percent, adding 212,887 jobs. Over 80 percent of the industry consists of the Restaurants subsector, which has grown 24 percent over the last five years. Special Food Services comprises only 4.5 percent of the Accommodation and Food Services industry, but has grown 30.5 percent over the last five years, likely due to the recent proliferation of food trucks.
Accommodation and Food Services jobs projected to add the most positions over the long- and short-term are listed below.
Long-Term
Occupational Title
Annual Average
Employment 2014
Annual Average
Employment 2024
Number Change 2014-2024
Percent Growth 2014-2024
Average Annual Wage 2016
Supervisors of Food Preparation and Serving Workers 64,540 88,150 23,610 36.6% $38,553
Food Service Managers 9,780 12,780 3,000 30.7% $59,658 Chefs and Head Cooks 6,360 8,380 2,020 31.8% $44,790 General and Operations Managers 6,500 8,480 1,980 30.5% $87,244 Lodging Managers 2,740 3,420 680 24.8% $52,271 Supervisors of Office and Administrative Support Workers 2,090 2,590 500 23.9% $45,330
Meeting, Convention, and Event Planners 1,280 1,650 370 28.9% $49,763 Accountants and Auditors 870 1,090 220 25.3% $56,374 Supervisors of Retail Sales Workers 510 680 170 33.3% $45,795 Public Relations Specialists 560 720 160 28.6% $54,696

28
Short-Term
Occupational Title
Annual Average
Employment 2016
Annual Average
Employment 2018
Number Change 2016-2018
Percent Growth 2016-2018
Average Annual Wage 2016
Supervisors of Food Preparation & Serving Workers 71,210 76,040 4,830 6.8% $38,553
Food Service Managers 10,810 11,440 630 5.8% $59,658 Chefs & Head Cooks 7,040 7,460 420 6.0% $44,790 General & Operations Managers 7,130 7,530 400 5.6% $87,244 Supervisors of Housekeeping & Janitorial Workers 2,250 2,310 60 2.7% $36,537
Supervisors of Office & Administrative Support Workers 2,210 2,270 60 2.7% $45,330
Meeting, Convention, & Event Planners 1,380 1,430 50 3.6% $49,763 Accountants & Auditors 940 980 40 4.3% $56,374 Public Address System & Other Announcers 780 820 40 5.1% $49,875 Public Relations Specialists 610 640 30 4.9% $54,696

29
III. Conclusions
TWC reviewed the top growth occupations across the key industries for this report as required by statute. TWC tracks approximately 800 different occupations and employment is projected to increase in almost all those occupations across industries.
Economic changes can impact employment in all industries in Texas. Still, demand across occupations varies depending on the needs of employers in different industries and locations.
A key demographic shift is increasing demand for many occupations. Texas employers continue to experience the retirements of the Baby Boom generation. Baby Boomers have long dominated the workforce in many Texas industries. However, many are now in their sixties and are retiring at an increasing rate.
These workforce demographic and economic changes are occurring as Texas employers also have enhanced their employment requirements. Hiring managers are looking for more workers while also demanding more technical skills, work experience and education than in the past.
In high-demand, high-wage fields, such trends lead to rising demand for workers with:
a) a bachelor’s degree and specific technical skill training b) some form of post-secondary education, specific technical skill training, and additional on-the-
job training
IV. Methodology
TWC collects data and makes projections on employment by industry as part of its contracts with the U.S. Bureau of Labor Statistics and the Employment and Training Administration division of the U.S. Department of Labor (DOL). These contracts also guided TWC’s statistical data standards. In accordance with the statistical methodology established by DOL and the federal Office of Management and Budget, TWC calculated employment data for approximately 800 occupations to analyze pay ranges and growth trends for these different occupations.
TWC measures many aspects of the Texas labor market. The number of workers employed and wages paid by industry are tracked by QCEW. This program utilizes data from TWC’s Unemployment Insurance program and is updated every three months. Wage information for specific occupations is gathered from surveys sent to sampled employers in the Occupational Employment Statistics (OES) program, which updates each year.
Employers supply the data for these programs, and TWC analyzed the employment and wage data from both the QCEW and OES programs. This data is further supplemented by monthly employment data

30
from the CES program surveys of employers in Texas. These programs serve to validate each other in identifying staffing trends with employers.
TWC then examines the number of workers by industry as the basis for producing industry employment projections. TWC produces these industry employment projections and corresponding occupational employment projections to help job seekers, students, parents, policy makers, and company hiring managers better understand their regional labor market. Occupational employment growth is based on industry growth and other variables, which will include population growth and changing skill requirements by employers.
The current long-term projections for employment by industry and occupation were completed by TWC in September 2016 for the period of 2014 to 2024 and the short-term projections were completed in February 2017 for the period of 2016 to 2018. This report also includes industry employment level comparisons from QCEW data over the most recent five years and from HWOL data over the year to give context, as Section II of this report shows.
This report focuses on occupations with high demand or significant job openings and high pay rates as required by statute. Not all occupations are specific to a single industry.
The median pay across all occupations in Texas is $35,484 a year, according to the most recent OES survey of Texas employers. For the purposes of this report, TWC only looked at occupations where the annual pay was estimated to be more than the statewide median, $35,484 a year.