report on spills in the great lakes basin - ijc · report on spills in the great lakes basin with a...
TRANSCRIPT


Report on Spills in the Great Lakes Basinwith a Special Focus on the St. Clair–Detroit River Corridor
July, 2006
ISBN 1-894280-58-X
Cette publication est également disponible en français.

INTERNATIONAL COMMISSION JOINT MIXTE COMMISSION INTERNATIONALE Canada and United States Canada et États Unis
Rt. Hon. Herb GrayChair, Canadian Section
Hon. Dennis SchornackChair, U.S. Section
Robert GourdCommissioner
Irene BrooksCommissioner
Jack BlaneyCommissioner
Allen OlsonCommissioner
International Joint Commission Offices
Canadian Section United States Section
International Joint Commission International Joint Commission234 Laurier Avenue West – 22nd Floor 1250 23rd Street N.W. – Suite 100Ottawa, Ontario K1P 6K6 Washington, D.C. 20440Phone: (613) 995-2984 Phone: [email protected] [email protected] Great Lakes Regional Office
International Joint Commission or International Joint Commission100 Ouellette Avenue – 8th Floor P.O. Box 32869Windsor, Ontario N9A 6T3 Detroit, Michigan 48232-0869Phone: 519-257-6700 Phone: 313-226-2170Fax: 519-257-6732Email: [email protected]
Visit the International Joint Commission website at www.ijc.org
Cover photo courtesy of the National Aeronautics Space Administration (NASA). Photo of St. Clair River by Jeff Dunn.
iii
Contents
Report on Spills in the Great Lakes Region 1
Findings 3
Final Comments 12
Technical Annex 13
Table of Contents of the Technical Annex 15


1
Report on Spills in the Great Lakes Basinwith a Special Focus on the St. Clair–Detroit River Corridor
Since the mid-1990s, the number of polluting spills of chemicals, oils and hydrocarbons and wastes to the Great Lakes and the St. Lawrence River has appeared to be on the decline. There were no serious spills to command public or regulatory attention and public perception was that spills appeared to be under control on both sides of the border.
During a massive power outage that crippled the northeastern part of North America for several days in August 2003, Royal Polymer — a chemicals manufacturer in Sarnia, Ontario — had two consecutive spills to the St. Clair River of vinyl chloride monomer totaling 132 kg (290 lbs). The company failed to report these spills for several days due to the power outage and subsequent failure of its monitoring system to detect the spill. During the same time, sewage treatment facilities in some U.S. communities on the St. Clair River reported overflows of untreated or partially treated sewage. Some people immediately downstream reported feeling ill, but no link to either the sewage or chemical spills was ever confirmed.
Less than six months later in February 2004, a leak in a heat exchanger at Imperial Oil — also in Sarnia, Ontario — contaminated cooling water discharged to the St. Clair River with two chemicals, methyl ethyl ketone and methyl isobutyl ketone. A number of other reported spills to the St. Clair River around this time resulted in increasingly greater public alarm with each occurrence. Even small spills that might have previously gone unnoticed came under greater scrutiny by the public. Further details on spills to the Great Lakes basin and the St. Clair–Detroit River corridor (the corridor connecting the St. Clair River, Lake St. Clair and the Detroit River) are provided in the Commission’s Technical Annex to this report.
In its 12th Biennial Report on the Great Lakes Water Quality, the International Joint Commission (Commission) expressed concern about the apparent increase in major spills to the connecting channel from Lake Huron to Lake Erie, particularly the St. Clair River section. The Commission also committed to explore the issue further and to publish a separate report after it had collected more information.
This special report follows through on that commitment and is consistent with the Commission’s responsibilities under the 1972 Great Lakes Water Quality Agreement (Agreement) signed by the governments of the United States and Canada. Under Article VII of the Agreement, the Commission’s role is to monitor the progress of governments to restore and protect the water quality of the Great Lakes, assist them in disseminating information and provide advice and recommendations. More information on the Commission, which was established under the Canada-United States Boundary Water Treaty of 1909, may be found at www.ijc.org.
2
The Commission’s objective in developing this special report is to examine the spill incidents in the St. Clair–Detroit River corridor and to determine whether there is an increasing trend in spills that might affect the public. To determine whether recent spills in the corridor are unique to that area or are symptomatic of a more widespread problem, the Commission also reviewed spill data for the Great Lakes and other connecting corridors. The primary focus of this report, however, is the St. Clair–Detroit River corridor.
For the puproses of this report, the Commission refers to spills as accidental or illicit discharges of substances (i.e. oils and hydrocarbons, chemicals and wastes) that cause or may cause harm to the environment or to humans. The impact of spills was not assessed, nor does this report address legally permitted discharges of chemicals from industrial outfalls or discharges from municipal waste water treatment facilities—although those sources also contribute large amounts of polluting substances to the Great Lakes and their connecting channels.
The Commission’s review was conducted with the assistance of several agencies in both countries, which provided considerable amounts of data. Environment Canada, the U.S. Coast Guard, the U.S. Environmental Protection Agency (U.S. EPA) and the Ontario Ministry of the Environment were particularly helpful.
The Commission’s analyses were limited by the scope of its investigation (trends in spill incidents, not their impacts), the availability, accessibility and adequacy of data and information to address the Commission’s questions and the Commission’s available resources.
As a result of its review, however, the Commission has determined some clear and simple findings. Without better monitoring data and shared data reporting, it will continue to be difficult to determine accurately the real trends in spill incidents occurring to the Great Lakes and the St. Clair–Detroit River corridor. In the absence of more comprehensive information and trend analyses, it is virtually impossible to direct accountability for spill prevention and enforcement. Significant improvements are required in binational spill information management and sharing, and coordination of spill preven-tion approaches. In addition, the Commission found that enhanced monitoring programs, accurate spill detection and simplified notification procedures are needed to reduce the harmful human and ecosystem impacts of spills. Further, both countries need to improve cross boarder communications between their agencies and with water users about protective actions they should take. Lastly, the Commission observed that the responsibility for cleanup costs of major spill incidents is not clear and should be addressed.
The Commission’s findings are underscored by the recent release of a report by the U.S. Govern-ment Accountability Office (GAO), entitled Better Information and Targeted Prevention Efforts Could Enhance Spill Management in the St. Clair–Detroit River Corridor (July 2006). Like the Commission, the GAO cited issues with data quality and management as well as with spill notification. Both the GAO and Commission reports focus on spills to the corridor, however, the Commission also considers spills to all of the Great Lakes and major connecting channels. For its part, the GAO report examines spills in the context of the U.S. Clean Water Act and the Comprehensive Environmental Response, Compensation and Liability Act (Superfund), and directs its recommendations to U.S. agencies; the Commission report uses the Canada-U.S. Great Lakes Water Quality Agreement as its perspective and directs its recommendations to both countries.

3
Findings
1. Spill information management at all levels of government in Canada and the United States needs to be improved and better coordinated through a shared regional database using common reporting criteria and spill definitions.
To complete this review, the Commission examined available data on spills occurring in the Great Lakes basin between 1990 and June 2005. There were several difficulties in accessing, reviewing and interpreting this information.
First, data collected in the two countries are not directly compatible. The data are collected by agencies with differing mandates, approaches and purposes, and data are categorized using different formats and applications. Some data sets for spills reported in more recent years (2001 to 2004) were incomplete, pending completion of agency investigative processes and analyses. Data also were not reported in a consistent manner, often changing formats from one year to the next. As a result of these differences, the databases compiled and used by the various jurisdictions are not easily compared, thus making it more difficult to assess the situation or determine courses of action.
In addition, a common definition of spills does not exist in the Great Lakes basin and terminology often differs from one jurisdiction to another. Legislation, regulations or guidelines refer to spills as — or include them in definitions of — “discharges”, “polluting incidents”, “environmental emergen-cies”, or “releases”. Generally, these definitions tend to be broad and encompass a range of events, whether accidental or not.
In Canada, federal and provincial data are maintained by Environment Canada in a centralized system that is not easily accessible by the public although the data are easy to use for analysis. While this database contains all spills reported to the Ontario Spills Action Centre (SAC), the Canadian Coast Guard also receives notification for some marine spills, and not all data on these incidents are passed to the SAC.
Databases in the United States are maintained by the National Response Center (NRC) and the U.S. Coast Guard (USCG). The USCG database relies largely on marine related spill information and provides only summary information on its website. The main function of the NRC is to receive reports of spills and to notify the appropriate response agency; its database includes all calls on all types of spills — land-based as well as marine. The data are available in their entirety on the NRC website, but are not easily manipulated and may duplicate USCG data.
Recommendation #1
The responsible agencies at all levels of government in Canada and the United States should develop a shared regional database for the Great Lakes basin that can be used to produce a comprehensive binational spill trend analysis that identifies patterns, and to focus regulatory efforts. This database should be based on common, well-defined terms, reporting criteria and comparable information.

4
2. Information sharing between Canada and the United States needs to be improved.
Better coordination between response agencies in the United States and Canada is needed to enhance sharing and assessment of information related to spills and to more effectively communicate potential risks to the public.
Current information sharing is carried out by the two Coast Guards as required by Annex 6 of the Great Lakes Water Quality Agreement. This Annex directs the two Coast Guards to consult with each other and with other interested parties on an annual basis, and to report on activities under Annexes 4, 5, 6, 8 and 9 (the “Coast Guard annexes”) of the Agreement.
These annexes address polluting spills from specific sources, including oil and hazardous substances and wastes from vessels as well as discharges from transportation-related onshore and offshore facilities. The Agreement also directs that the Coast Guards identify problems or areas of concern and work cooperatively to determine necessary actions, and to review and modify, as required, the Canada–U.S. Coast Guard response system (CANUSLAK).
Accordingly, the two Coast Guards meet biennially to develop a joint report to the Commission. Their report is an important means of tracking trends in pollution from marine sources and should be continued. However, the scope of this effort is focused on transportation related spills and does not deal with the wider range of spills to the Great Lakes. Because transportation-related spills only amount to a small fraction of the total discharge of polluting substances from land-based, wastewa-ter or permitted sources, the scope and purpose of the current reporting requirement should be examined by the Parties during their forthcoming Agreement review.
The two Coast Guards are not required to report on data collected by other agencies, although the additional information would contribute to a more comprehensive picture of spills and to informed decision-making. The absence of this information also limits the Commission’s ability to alert govern-ments to trends in spill incidents to the lakes. A revised Great Lakes Water Quality Agreement reporting requirement, for example, should task federal agencies to work collaboratively with state, provincial and local governments. This would result in more complete reporting on spills, a better understanding of their extent in the Great Lakes and more timely preventive or responsive actions.
Recommendation #2
The U.S. and Canadian Coast Guards should consult and work cooperatively with other relevant federal, state, provincial and local agencies to
• exchange information and data and report biennially on discharges from vessels (including oil and hazardous substances and wastes), discharges from onshore and offshore facilities, and discharges in the Great Lakes watershed that impact Great Lakes water quality and pollution from shipping sources;
• identify problems or areas of concern;• determine necessary actions; and• review and modify the Joint Maritime Contingency Plan as required.
5
3. Trends in spills indicate a need for binational coordination of spill prevention approaches.
While the Commission’s analysis of the data was limited by their shortcomings, its review noted apparent trends in reported spill incidents in the St. Clair–Detroit River corridor and throughout the Great Lakes basin — into the open waters of the lakes, along the shoreline, and in tributary waters. The number of spills varies from year to year for all Great Lakes locations, but since the 1990s the number of spill incidents appears to be declining.
The chemical spills in the St. Clair River that attracted public and Commission attention are not a sign of an overall increasing trend in spills to the Great Lakes. Spills can impact water quality, harm sensitive ecosystems and/or require local water intakes to close. Most of the economic, environmen-tal and human health impacts are felt in the immediate area of the spill. The public perception that spills alone have resulted in an increasing threat to water quality is not supported by the Commis-sion’s review of the available data. Nevertheless, spills continue to occur, and their number and locations are largely related to, or associated closely with, areas of higher population densities and commercial or industrial activity.
Looking at the basin as a whole, more spills in Canada are reported to occur in Lake Ontario; in the United States, information provided indicates that Lakes Michigan and Erie have the highest number of reported spills. Within the St. Clair–Detroit River corridor, available data indicates that Canadian spills are more numerous in the St. Clair River and that U.S. spills are more numerous in the Detroit River. However, the St. Lawrence River also appears to be an area where a large number of spills have occurred in recent years in both countries.
Substances reported spilled include oil and hydrocarbons, and chemicals and waste (industrial wastes and effluents). On the U.S. side, oil and hydrocarbons account for more than 95 percent of the spills recorded in the St. Clair–Detroit River corridor — similar to what is reported in the United States elsewhere in the Great Lakes. Oil and hydrocarbons constitute about half of all reported Canadian spills in the St. Clair–Detroit River corridor, and there appear to be more spills reported as chemical spills in all the Canadian corridors and lakes combined.
In the St. Clair–Detroit River corridor, reported spills from Canada are mostly from industrial sources. New legislation in Ontario that compels polluters to pay for cleanup costs is expected to reduce the overall number of these spills. The United States has had this type of legislation in effect for a number of years. The IJC analysis relied on U.S. Coast Guard data, which included U.S. spills from general shore-based activities, commercial vessels, recreational vessels, and from outfalls and drains. This data shows that regularly inspected large commercial ships account for only about one percent of the total spill incidents reported.
In addition to their ecological impacts, the cleanup and remediation of spills are costly. For example, the estimated cost of cleaning up the 2002 Rouge River oil spill was more than $10 million (US funds), and the cost of the U.S. Environmental Protection Agency investigation alone was $2 million. Spill prevention is far less costly. Research, engineering, monitoring and modeling have led to the development of feasible, cost-effective technologies to prevent and contain spills. Effective, technol-ogy-based, comprehensive spill prevention approaches should be implemented in both countries. Regulatory programs should be harmonized and coordinated to provide a consistent approach to prevent and contain spills, enforce permits and prevent illicit discharges from industrial facilities.

6
Such programs also should be used to expand awareness and educate the public about approaches to prevent unnecessary household discharges and smaller spills (e.g., dumping waste automobile or finishing oils to public drains or waterways).
Recommendation #3
To prevent chemical spills to the Great Lakes and their connecting channels, particu-larly the St. Clair–Detroit River corridor, the Canadian and U. S. federal governments should work cooperatively with state, provincial and local governments to develop and implement effective, coordinated spills prevention approaches that:
• harmonize U.S. and Canadian prevention and enforcement programs;• provide consistent approaches to prevent and contain spilled substances, including
provisions for secondary and tertiary containment;• establish effective real-time monitoring to ensure compliance; • ensure enforcement of discharge permits and regulations at all industrial facilities;
and• facilitate public outreach and education programs to reduce illicit spills by
businesses and households.

7
4. Better monitoring, accurate detection and speedy notification are required to reduce harmful hum-an and ecosystem impacts.
Once a spill has occurred, predicting its human and ecosystem impact involves a combination of monitoring and modeling. The goal is to learn as soon as possible when a spill occurs in order to alert the relevant response agencies and assist them in determining when a spill will arrive, and to know the potential threat it poses to public health and what action needs to be taken.
Monitoring to immediately detect a spill at the point of release is the most critical step to prevent harmful human and ecosystem impacts. Once a spill has occurred, modeling and continuous monitor-ing at water intakes will determine the speed and trajectory of the contaminant plume. In-stream, real-time monitoring can complement this process by detecting spills or verifying reported spills, and can help to fine-tune the travel projections to accurately model movement of the contaminant. The challenge for monitoring is to anticipate and calibrate sensors for the substances that pose the highest risk. Because an in-stream fixed monitoring station can only record the substances passing that location, integrated sensor technology may be needed to overcome current monitoring limitations. However, pending further advances in this technology, in-stream monitoring can serve as a useful tool to focus the activities of response organizations.
In the St. Clair River, the only real-time monitoring capacity to detect spills is a voluntary, in-stream monitoring program operated by the Sarnia-Lambton Environmental Association at the Courtright monitoring station. This station continuously monitors a limited number of chemical and biological water conditions. The Commission is not aware of any other such system operating in the Great Lakes basin. However, local water intake facilities do monitor for some forms of bacteria and for certain chemical substances as required by local water quality regulations.
Government agencies have various monitoring programs in place, including upstream-downstream monitoring in all connecting channels. For the most part, these programs do not entail continuous water quality monitoring; rather, they use regular sampling to identify contaminants of concern and characterize ambient water concentrations. These activities assess the effectiveness of programs and actions to improve water quality over longer periods of time and cannot immediately detect a spill or provide notification.
Since the recent spill occurrences and the resulting public concern, some steps have been taken or soon will be in place to address this problem. On the U.S. side, Macomb County and St. Clair County, Michigan, are proceeding with the first phase of an inter-county water monitoring program that will expand the counties’ capacities to monitor and alert responders to the presence of harmful chemical substances in the St. Clair–Detroit River corridor. Funding is in place to establish fixed monitoring stations in the St. Clair River and Lake St. Clair. In the second phase, additional equipment will be placed further downriver. Discussions also are underway to identify means and opportunities for the Ontario government to participate in this expanding monitoring program.
Separately, Ontario has a contaminant transport flow model that predicts when a substance might arrive at points downstream. The U.S. Geological Survey also recently completed a hydrodynamic flow model for the St. Clair–Detroit River corridor. Support is being sought for the development of a state-of-the-art hydraulic model of this corridor to predict more precisely what will happen when a substance is spilled. A state-of-the-art hydrodynamic model for the St. Clair River also is proposed as part of the Commission’s Upper Great Lakes Study, with implementation planned for spring 2006. When completed, this model is expected to replace existing, less precise models.

8
The events of September 11, 2001 have increased awareness of the potential for malicious, deliber-ate spills. This has stimulated intense activity to develop real-time, chemical sensor technology and biomonitoring capability on both sides of the border. This technology has multiple uses and may enhance the response capacity for accidental spills as well as those from a terrorist attack. In addition, anecdotal information from the U.S. Coast Guard indicates that the increased frequency and visibility of law enforcement patrols along the border has resulted in the unexpected benefit of a decline in spills by recreational boaters.
Recommendation #4
The two federal governments should work cooperatively with state, provincial and local governments to establish and conduct joint testing of government-supported, real-time monitoring and biomonitoring systems that would
• monitor for a broad suite of potential chemical and biological contaminants;• be supported by a back-up source of power, maintained to the highest standards,
and designed to protect all U. S. and Canadian water intakes in the St. Clair–Detroit River corridor and other strategic sites in the basin; and
• be integrated with state-of-the-art hydraulic models of the rivers (such as that proposed for the St. Clair River under the Commission’s Upper Lakes Study) to provide improved assessment of relative risks and forecasting capability in the event of a spill.

9
5. Both countries need to improve cross-border communication between their agencies and to develop common protocols to notify water users about spills and the protective actions they should take.
When a spill occurs in a connecting corridor of the Great Lakes that has a potential to adversely impact the other country, the jurisdiction in which the spill occurred should notify the other jurisdic-tion so that it can take the necessary steps to protect people and sensitive ecosystems.
A formal notification agreement between Ontario and Michigan requires that each inform the other about any anticipated or accidental discharge of pollutants that is likely to have adverse effects. This arrangement applies to the St. Clair–Detroit River corridor as well as the St. Mary’s River connecting corridor. There is no formal notification system between Ontario and New York for the Niagara and St. Lawrence Rivers, but they do contact each other as part of their regular procedures.
In its review, the Commission found no indication that a lack of notification, or delayed notifica-tion, between officials in Ontario and Michigan was either a regular or repeated occurrence. On the whole, the system designed to implement the notification agreement works well, but some cases entail numerous steps that could complicate communication.
However, when a spill first occurs, it is not uncommon for only partial information to be shared, particularly regarding the spill’s details. Incomplete information contributes to uncertainty and compromises the ability of local authorities to make informed decisions about closing their water intakes or taking other community health protection measures. The normal tendency is to err on the side of caution and, for example, temporarily close a water intake until the risk proves to be negligible.
Once the responsible agencies become aware of a threat from a spill, communicating that threat in a clear and timely fashion to water plant operators and the public is absolutely critical. The Commission notes the need for responsible agencies to refine existing risk communication procedures for plant operators and the public in downstream communities.
An integrated systems approach to cross-border interagency communication should be applied to risk communication with plant operators and the public. The Commission understands that some local and downstream communities do not believe that they are adequately informed by govern-ments and industry in a timely and thorough manner. This situation reflects on the procedures in place within each country to contact their communities.
Governments also should understand that citizens in transboundary regions often hear media broadcasts from the other side of the border, and these messages may sometimes be different from what they hear in their own country. In some cases, one country may not be transmitting messages while the other country is doing so. In these situations, there is the potential for the public to be confused and fail to take appropriate action. Joint risk communication properly targeted to inform citizens in border regions about the appropriate levels of action they should take is required to provide clear direction and to avoid confusion.

10
Recommendation #5
Ontario and Michigan should improve their spill risk communication to communities on both sides of the St. Clair River and the Detroit River by establishing
• common risk assessment criteria to discern relative risk;• stream-lined, standardized procedures to trigger responsible agency and public
notification; and• joint communication procedures that differentiate levels of risk and specify action
levels for downstream and transboundary communities, including water plant operators, business and industry, and the public.

11
6. Responsibility for clean-up costs of major spills is not clear.
One additional issue noted by the Commission while developing this report is the apparent conflict regarding compensation for cleanup costs between the terms of the Great Lakes Water Quality Agreement and the Great Lakes Joint Marine Contingency Plan (CANUSLAK). This conflict became apparent in April 2002 during the CANUSLAK response to the massive Rouge River oil spill that spread into the Detroit River. That spill, an estimated 100,000 to 255,000 gallons (378,541 to 965,280 liters) of lube oil and diesel fuel, required full and effective implementation of the Canada/U.S. Coast Guard response system. It was the largest oil spill in 20 years to the Great Lakes basin and the largest ever in the Detroit area.
The Agreement states that the costs of operations of both countries shall be borne by the country in whose waters the pollution incident occurred, unless otherwise agreed. The Joint Marine Contin-gency Plan requires each country pay its own expenses regardless of the pollution source. Since the Rouge River incident occurred, this discrepancy has not been resolved. This issue should be addressed during the Parties’ forthcoming review of the Agreement.
Recommendation #6
The U.S. and Canadian governments should resolve the conflict between the terms of the Great Lakes Water Quality Agreement and the Joint Marine Contingency Plan regarding compensation for cleanup costs of major spills that impact both countries.

12
Final CommentsThe Commission’s review of spills in the Great Lakes basin and the St. Clair - Detroit River corridor found progress in some areas. In many others, such as accessibility to spill data, and shared approaches for spill data management and spill prevention, further improvement is required. The Commission will continue its monitoring and alerting functions assigned under the terms of the Great Lakes Water Quality Agreement and will report from time to time on further progress in the area of pollution response communication. We look forward to the governments’ response to this special report.
Signed this 20th day of July, 2006
Rt. Hon. Herb Gray Dennis L. Schornack Chair, Canadian Section Chair, U.S. Section
Robert Gourd Irene B. Brooks Commissioner Commissioner
Jack P. Blaney Allen I. Olson Commissioner Commissioner

13
Technical Annex
This Annex provides some of the relevant data and background information in support of the findings and recommendations in the Commission’s report on Spills in the Great Lakes Basin with a Special Focus on the St. Clair–Detroit River Corridor. The review was conducted with the assistance of a number of agencies in both countries, which provided considerable amounts of data. Environment Canada, the U.S. Coast Guard, the U.S. Environmental Protection Agency (EPA), and the Ontario Ministry of the Environment were particularly helpful.
14
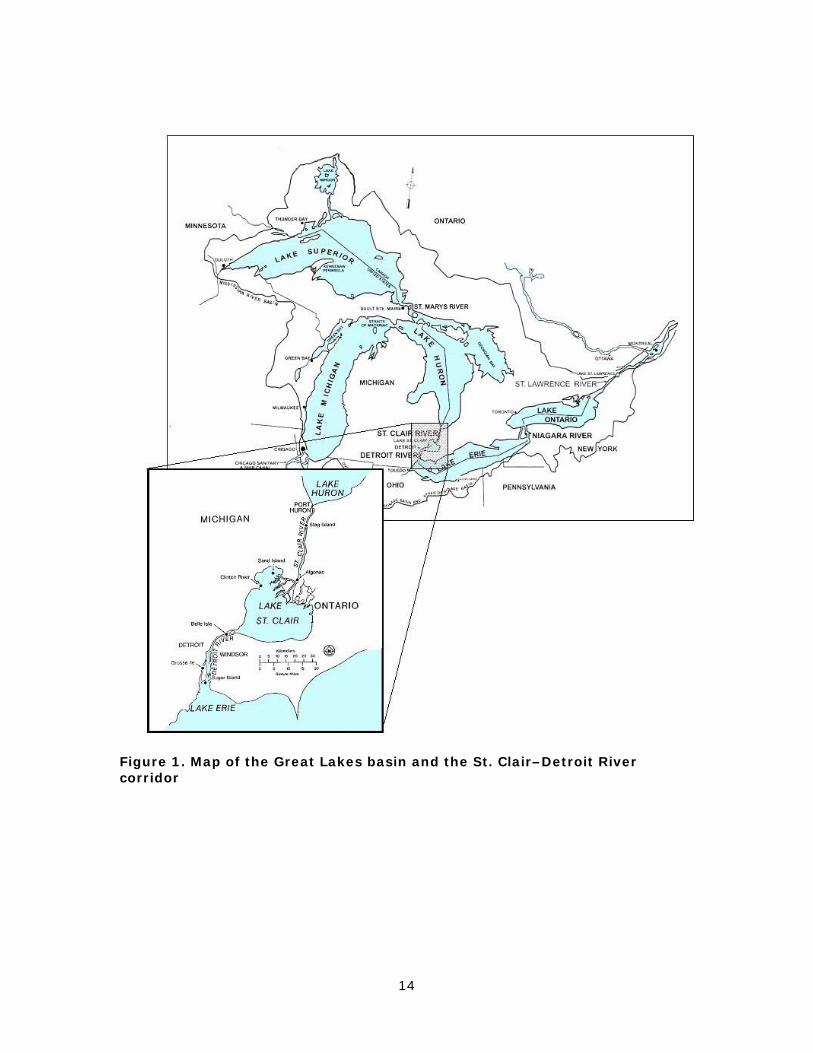
Figure 1. Map of the Great Lakes basin and the St. Clair–Detroit River corridor

15
Table of Contents
Introduction................................................................................................17
The St. Clair–Detroit River Corridor ............................................................21
What Is a Spill? ...........................................................................................24
Compiling Spills Data ..................................................................................27 $ U.S. Great Lakes spill data ........................................................................28 $ Canadian Great Lakes spill data..................................................................29
What the Data Show ...................................................................................30 $ Categories of substances spilled .................................................................34 $ Substances spilled from U.S. sources ..........................................................34 $ Substances spilled from Canadian sources ...................................................36 $ Assessing the impact of spills.....................................................................38
Notification, Response and Communicating with the Public ........................41 $ Notification .............................................................................................41 $ Response................................................................................................45 $ Monitoring and modeling for spill detection and response...............................47 $ Communicating with the public ..................................................................52
Tables $ Table 1. Spills in the St. Clair–Detroit River corridor, 2002-2005.....................18 $ Table 2. Actions taken by Canadian and U.S. legislators and legislative bodies
following spills in the St. Clair–Detroit River corridor, 2003–2005....................19 $ Table 3. Definitions of “spill” ......................................................................25 $ Table 4. Spills information reported by U.S. and Canadian agencies.................27 $ Table 5. Categories of substances spilled in Canadian Great Lakes and corridors,
2000–2004 and 1990–1994.......................................................................37 $ Table 6. Planning framework for minimizing spills and their impacts ................42 $ Table 7. Contaminants analyzed by the Sarnia-Lambton Environmental
Association..............................................................................................48 Text boxes $ Box 1. Spill notification procedures of Ontario and Michigan ...........................43 $ Box 2. Findings of the Industrial Pollution Action Team (IPAT) ........................52 $ Box 3. Report of the Environmental SWAT Team: Sarnia inspection sweep 2004-
2005 ......................................................................................................53
Figures $ Figure 1. Map of the Great Lakes basin and the St. Clair–Detroit River corridor .14 $ Figure 2. Map of St. Clair River, Lake St. Clair and Detroit River showing
municipal water intakes ............................................................................22 $ Figure 3. Number of spills in the St. Clair–Detroit River corridor, 1990–2004 ....30 $ Figure 4. Spills in the St. Clair–Detroit River corridor, 1990–2003 ...................31 $ Figure 5. U.S. Great Lakes spill incidents, by corridor, 1990–2004...................32 $ Figure 6. Canadian Great Lakes spill incidents, by corridor, 1990–2004............32 $ Figure 7. U.S. Great Lakes spill incidents, by lake, 1990–2004........................33

16
$ Figure 8. Canadian Great Lakes spill incidents, by lake, 1990–2004.................33 $ Figure 9. Types of hydrocarbons spilled into the St. Clair–Detroit River corridor
from U.S. sources, 1990–2001...................................................................35 $ Figure 10. Canadian spills to the St. Clair River and Detroit River, by category of
substance, 1990–2004..............................................................................36 $ Figure 11. Canadian spills to the Great Lakes and connecting channels, by
category of substance, 1990–2004 .............................................................37 $ Figure 12. Source of Canadian spills to the St. Clair–Detroit River corridor,
1990–2004 .............................................................................................38 $ Figure 13. Source of Canadian spills to the Great Lakes, 1990-2004 ................39 $ Figure 14. Source of U.S. spills to the St. Clair–Detroit River corridor, 1990–2001 ..............................................................................................39 $ $ Figure 15. Source of U.S. spills to the Great Lakes, 1990–2001 ......................40 $ Figure 16. Michigan spill notification procedures ...........................................44 $ Figure 17. Example of benzene monitoring and alerting system ......................49

17
Introduction
Since the mid-1990s, the number of polluting spills of oils and hydrocarbons, chemicals and wastes to the Great Lakes and the St. Lawrence River has appeared to be on the decline. There were no serious spills to command public or regulatory attention, and public perception was that spills appeared to be under control on both sides of the border. During a massive power outage that crippled the Northeastern part of North America for several days in August 2003, Royal Polymers Limited—a chemicals manufacturer in Sarnia, Ontario—had two consecutive spills of vinyl chloride monomer totaling 132 kg (290 lbs) to the St. Clair River. The company failed to report these spills for several days, the delay a result of the power outage and the subsequent failure of its monitoring system to detect the spill. During the same time, sewage treatment facilities in some U.S. communities on the St. Clair River reported overflows of untreated or partially treated sewage. Some people immediately downstream reported feeling ill, but no link to either the sewage or chemical spills was ever confirmed. Less than six months later, in February 2004, a leak in a heat exchanger at Imperial Oil—also in Sarnia, Ontario—contaminated cooling water with two chemicals, methyl ethyl ketone and methyl isobutyl ketone, which was discharged to the St. Clair River. A number of other reported spills to the St. Clair River around this same time resulted in increasingly greater public alarm with each occurrence. Even small spills that might have previously gone unnoticed came under greater scrutiny by the public. In its 12th Biennial Report on Great Lakes Water Quality, the International Joint Commission (Commission) expressed concern about the apparent increase in major spills to the connecting channel from Lake Huron to Lake Erie, particularly the St. Clair River section. The Commission also committed to explore the issue further and to publish a separate report after it had collected more information. In exploring the matter, the Commission compiled information on reported spill incidents that attracted the attention of local communities (Table 1). While not an exhaustive list, it covers chemical spills and oil spills over 50 gallons and is based on information made available by Environment Canada, the U.S. Coast Guard and EPA. The Commission refers to spills as accidental or illicit discharges of substances (i.e., oils and hydrocarbons, chemicals, and wastes) that cause or may cause harm to the environment or to humans. Permitted discharges of chemicals from industrial outfalls or discharges from municipal wastewater treatment facilities were not considered in the Commission’s analysis though these sources may contribute large amounts of polluting substances. The impact of spills on humans and wildlife also was not assessed.

18
Table 1. Spills in the St. Clair–Detroit River corridor, 2002-2005 Date of spill
Substance spilled
Quantity spilled
Location of spill (state/province, facility, river)
Jan. 4, 2002 Chlorine 2,000 gallons MI: Detroit Edison, Detroit River April 9, 2002 Lubricating oil and
diesel fuel 100,000–255,000 gallons
MI: Mystery spill, Rouge/Detroit River
July 30, 2002 Asphalt 60,000 gallons MI: Midwest Supply, Detroit River
Sept. 1, 2002 Lubricating oil 270 gallons MI: Detroit Edison, Detroit River Nov. 28, 2002 Clarified oil 396 gallons MI: National Steel Corp., Detroit
River Dec. 13, 2002 Diesel oil 550 gallons MI: Cargill Salt, St. Clair River April 15, 2003 Benzene ON: Imperial Oil , St. Clair River June 11, 2003 Ethylene dichloride ON: Dow dredging, St. Clair
River July 3, 2003 Oil 75 gallons MI: Praxair, Detroit River Aug. 9, 2003 No. 2-D fuel oil 75 gallons MI: Vessel, Detroit River Aug. 14–15, 2003 (power blackout)
Vinyl chloride 132 kg (290 lbs)
ON: Royal Polymer, St. Clair River
Jan. 10, 2004 Toluene ON: Sunoco Refinery, St. Clair River
Jan. 17, 2004 Lubricating oil 157 gallons MI: Praxair, Detroit River Feb. 2, 2004 Cooling water with
methyl ethyl ketone and methyl isobutyl ketone
45,000 gallons ON: Imperial Oil, St. Clair River
March 5, 2004 Caustic (high pH) wastewater
3,330 gallons ON: Lambton Generating Station, St. Clair River
April 7, 2004 Oil-like substance 90 gallons MI: Vessel, Detroit River April 29, 2004 Hydrocarbon with
toluene ON: Sunoco, St. Clair River
May 9, 2004 Crude oil 50 gallons MI: Detroit Edison, St. Clair River May 22, 2004 Primarily non-
petroleum contaminated substances
MI: Mystery spill, Rouge/Detroit River
May 23, 2004 Oil 300 gallons ON: Imperial Oil, St. Clair River May 25, 2004 Coal tar 100 gallons MI: U.S. Steel, Detroit River June 18, 2004 Oil-like substance 60 gallons MI: U.S. Steel, Detroit River Aug. 3, 2004 Oil-like substance 2000 gallons MI: Mystery spill, Rouge/Detroit
River Aug. 28, 2004 Oil-like substance 12,000 gallons MI: Mystery spill, Rouge/Detroit
River Oct. 31, 2005 Oily bilge water 62.5 gallons ON: Shell Oil, St. Clair River, The
American Spirit owned by the American Steamship Company

19
The Commission also compiled information on actions taken by agencies, legislators, and legislative bodies in both countries to address the growing public concern about spills to the St. Clair–Detroit River corridor. Table 2 provides an overview of some of these key activities. Table 2. Actions taken by Canadian and U.S. legislators and legislative bodies following spills in the St. Clair–Detroit River corridor, 2003–2005 Date Legislator or
legislative body Action taken
Sept. 30, 2003
Michigan House Resolution: No. 129
Calls for environmental officials of Canada, the United States, Michigan and Ontario to develop stronger safeguards for notifications when spill of toxic materials occur.
Feb. 6, 2004
Minister Leona Dombrowsky, Ontario Minister of the Environment
Instructs the Environmental SWAT team (established September 2000 to monitor compliance with environmental laws) to begin an inspection sweep of Canadian industries in Sarnia, ON.
March 1 2004
Michigan Representative Candice Miller
Writes to the IJC expressing concern about the spills and requesting an investigation. Similar letters are sent to the Michigan Department of Environmental Quality, U.S. EPA, U.S. Coast Guard and Department of State.
March 11, 2004
The Binational Public Advisory Committee for the St. Clair River AOC
Questions government officials on how communities can be better protected from spills.
March 22, 2004
Canadian federal budget
Amends the Income Tax Act prohibiting deduction of fines and penalties as a cost of doing business.
April 5, 2004
Director, Michigan Department of Environmental Quality
Requests meeting with the Ontario Minister of the Environment to discuss cooperation in protecting international waters and actions to improve the notification process for spills and illegal discharges into water across the border. Meeting takes place August 10, 2004.
April 19, 2004
Minister Leona Dombrowsky, Ontario Minister of the Environment
Forms an Industrial Pollution Action Team to examine causes of industrial spills and dangerous air emissions and to recommend prevention measures for industry and others.
June 15, 2004
Michigan Legislature
Adopts regulations (part 5 rules–Section 3111b of Part 31) requiring measures for facilities where releases occur: call 911, provide a follow-up report to local health department, and notify the state.
June 15, 2004
Michigan Legislature
Revises regulations to include penalties for failing to report a release as required or having prescribed discharges.
July 13, 2004
Environment Canada
Holds initial multi-agency meeting with provincial, U.S. federal and state officials, following concerns expressed about trans-border spill notification procedures. Follow-up teleconference held

20
November 5, 2004. Further meetings are planned. Aug. 9, 2004
Industrial Pollution Action Team
Reports to Leona Dombrowsky, Ontario Minister of the Environment, with 35 recommendations for action (see Box 2, Findings of the Industrial Pollution Action Team).
Oct. 4, 2004
Michigan Senators Levin and Stabenow and Michigan Representative Levin
Requests the U.S. Government Accountability Office (GAO) investigate the problem of spills in the St. Clair River. The GAO report is expected to be issued in spring 2006.
Oct. 8, 2004
Government of Ontario
Proposes legislation (Bill133) to impose immediate environmental penalties on companies for spills and announces a program rewarding environmental leaders for good practices.
Nov. 22, 2004
Michigan Representative Candice Miller
Secures $650,000 from the federal government to assist Macomb and St. Clair counties to establish a water quality monitoring system in the St. Clair River and Lake St. Clair. An additional $350,000 was secured May 6, 2005.
March 18, 2005
Imperial Oil Limited and an employee
Charged under the Canadian federal Fisheries Act with depositing a deleterious substance in water frequented by fish for the February 2004 spill of methyl ethyl ketones.
April 12, 2005
Ontario Environmental SWAT Team
Completes Sarnia Inspection Sweep having found 260 instances of non-compliance in the 35 facilities inspected.
May 19, 2005
Royal Polymers Limited
Pleads guilty to three counts under the Ontario Water Resources Act and is fined $255,000 plus a 25% victim fine surcharge.
May 20, 2005
Michigan Department of Environmental Quality
Receives grant of $760,000 from Department of Homeland Security for three mobile water monitoring facilities.
June 13, 2005
Government of Ontario
Passes Bill 133 which gives government inspectors power to fine companies ($100,000 a day) and individual employees ($20,000 a day) for toxic spills.
Sept. 7, 2005
Imperial Oil Limited
Pleads guilty to one count under the Canadian federal Fisheries Act and fined $300,000.

21
The St. Clair–Detroit River Corridor
The Great Lakes connecting corridor that extends from Lake Huron to Lake Erie is the St. Clair–Detroit River corridor. Moving downstream along the corridor, the communities, land use and habitats vary considerably, and population growth and industry have impacted the corridor’s water quality. Two binational Areas of Concern (St. Clair River and Detroit River) and two Michigan Areas of Concern (Clinton River and Rouge River) are located along the corridor. Areas of Concern (AOC) are designated under the Great Lakes Water Quality Agreement as areas needing special attention to restore the beneficial uses of the water. Spills in the corridor are an additional stress to the connecting water bodies. The St. Clair River flows southward about 40 miles (64 km), connecting the southern tip of Lake Huron to Lake St. Clair. Agriculture is the predominant land use within the river's watershed, but intensive development has occurred in and near the cities of Port Huron and Sarnia. This area is designated as the St. Clair Binational Area of Concern. Residential areas dominate the Michigan side of the river. The heaviest concentration of industry lies along the Ontario shore near Sarnia and includes petroleum refineries, chemical manufacturers, paper mills, salt producers and electric power plants. The St. Clair River serves as a “blue highway” for ships carrying cargo between the upper and lower Great Lakes. Figure 2 provides an overall view of the St. Clair River, Lake St. Clair and the Detroit River, and also identifies municipal water intakes potentially vulnerable to spills. Most of the communities on the Michigan side draw their water from the St. Clair River. In contrast, most Ontario communities along the river obtain their water from a pipeline from Lake Huron. The first water intake on the Canadian side is the community of Walpole Island, just before the delta where the St. Clair River enters Lake St. Clair. The nearby town of Wallaceburg, Ontario, also gets its water from the delta region. The St. Clair River branches into several channels near its mouth at Lake St. Clair, creating a broad delta region. The Walpole Island First Nation is located in this delta region and their water intake is across from that of Algonac, Michigan, at the southern end of the river.

22
Source: Environment Canada (adapted) Figure 2. Map of St. Clair River, Lake St. Clair and Detroit River showing municipal water intakes

23
The Clinton River Area of Concern watershed drains 1,968 km2 (760 square miles) of southeastern Michigan, including portions of Oakland and Macomb counties and small areas of St. Clair and Lapeer counties. About half of the river's flow is treated wastewater from six municipal wastewater treatment plants. Land use on the north branch of the river is agricultural and the main industries are automotive-related. On the east side of Lake St. Clair, the Sydenham and Thames rivers flow in from the agricultural areas of southwest Ontario. On the west side, the Clinton River flows 80 miles (128 km) to Lake St. Clair near Mt. Clemens, MI. The southwest side of Lake St. Clair is an urban residential area forming the northern part of the City of Detroit. The binational Detroit River Area of Concern is a large primarily urban area encompassing the metropolitan areas of Detroit, Michigan, and Windsor, Ontario.
There are more than three million people living in the metropolitan area of Detroit and more than 280,000 in the area surrounding Windsor. Windsor, Ontario, and its neighboring community of LaSalle draw water from Lake St. Clair, upstream of the Detroit River. Detroit, Michigan, has three municipal water intakes: one connected to Lake Huron, the second at Belle Isle and the third on the Canadian side of the Detroit River at Fighting Island. The two Detroit municipal water intakes supply water to four water treatment plants located around the metropolitan area with the capacity to pump over 1.3 billion gallons of water per day to the citizens of southeast Michigan.
Considerable quantities of wastewater also are discharged along the St. Clair–Detroit River corridor. Approximately 13,000 commercial and industrial dischargers are connected to the Detroit Wastewater Treatment Plant, with 446 considered major dischargers. Almost 1,300 commercial and industrial dischargers are served by Windsor wastewater control plants, including 70 major dischargers.
As Figure 2 shows, the Rouge River empties into the Detroit River at Windsor. This area is the oldest and most heavily populated and industrialized area in southeast Michigan. The lower four miles of the river are maintained as a shipping channel from the turning basin to the river's mouth at the south end of Zug Island. South of Detroit and Windsor, land use on the Ontario side is primarily agricultural with some small communities, while the Michigan side of the river is more urban. There are two water intakes downstream of the Detroit Wastewater Treatment Plant and the Rouge River, not counting the Fighting Island pipeline that crosses the river for water. The Michigan town of Wyandotte takes water from near the north end of Grosse Ile while the Ontario town of Amherstburg takes water from the other side of the river near the south end of Grosse Ile. Everything flowing down the St. Clair–Detroit River corridor eventually flows into the shallow west end of Lake Erie.

24
What Is a Spill?
The Commission found that a common definition of spills does not exist in the Great Lakes basin, and terminology often differs from one jurisdiction to another (Table 3). Legislation, regulations or guidelines refer to spills as—or include them in definitions of—“discharges”, “polluting incidents”, “environmental emergencies”, or “releases”. Generally, these definitions tend to be broad and encompass a range of events, whether accidental or not. In all jurisdictions there is a system to allow facilities to discharge substances at allowable concentrations based on water quality standards and criteria. In Ontario, discharge permits are called Certificates of Approval. When the amount of the discharge exceeds its permitted level (“exceedance”), then it is considered a spill and is reported. Permitted discharges are not included in the spill data, while exceedances are supposed to be included. However, it is not clear whether all exceedances are fully reflected in the Canadian databases. In the United States, discharge permits are issued under the National Pollution Discharge Elimination System (NPDES). The NPDES discharges in excess of permitted levels (i.e., exceedances) are considered “permit or compliance violations” and are not reported as spills in the U.S. databases used in this review. Discharges in excess of permitted levels are “self-reported” to the NPDES Permit Compliance System. The extent to which the cumulative effect of these continuous permitted discharges may impact water quality is beyond the scope of this report. Overflows and discharges from sewage treatment plants and combined sewers are not included in this paper. During storm events, overflows of combined sewer systems are not usually considered spills, but they contain untreated sewage and contaminants. Sewage treatment plants are permitted to discharge sewage under specific conditions related to plant operations. Municipal sewage overflows are known to contain a complex mix of substances including chemical contaminants. Sewage overflows and bypasses are a significant problem, well documented in the Great Lakes, that goes beyond the scope of this report. The Commission has not included in its present analysis any spills described in the data as strictly sewage spills. The analysis does include discharges described in the data as “illicit discharges”. Such spills are usually described in the database as “Oil, waste/lubricants—possible contaminant”. The Commission refers to spills as accidental or illicit discharges of substances (i.e., oils and hydrocarbons, chemicals and wastes) that cause or may cause harm to the environment or to humans.

25
Table 3. Definitions of “spill” Legislation Definition United States Clean Water Act (CWA)
Section 311(a) (2) refers to “discharges” which “includes, but is not limited to, any spilling, leaking, pumping, pouring, emitting, emptying or dumping…” not in compliance with a permit. See also the National Contingency Plan.
United States Oil Pollution Act
Incorporates the CWA definition but also notes that a discharge is “any emission (other than natural seepage)” and may be “intentional or unintentional.”
Canada Canadian Environmental Protection Act (CEPA)
Under section 3 (1), release “includes discharge, spray, inject, inoculate, abandon, deposit, spill, leak, seep, pour, emit, empty, throw, dump, place and exhaust.” Section 193 defines an environmental emergency as “(a) an uncontrolled, unplanned or accidental release, or release in contravention of regulations made under this Part, of a substance into the environment.”
Canada Fisheries Act
Uses the term “deposit” defined as “any discharging, spraying, releasing, spilling, leaking, seeping, pouring, emitting, emptying, throwing, dumping or placing.”
Canada–United States Joint Inland Pollution Contingency Plan
Refers to “polluting incident” in section 105.13, as “an accidental or unauthorized release of any pollutant, other than radiological materials and permit exceedances, on either or both sides of the inland international boundary of a magnitude that causes, or threatens to cause, adverse effects to the public health or welfare, the environment, or property.”
State of Michigan Natural Resources and Environmental Protection Act
Section 324.20301 of the Natural Resources and Environmental Protection Act defines spills as “any leaking, pumping, pouring, emptying, discharging, escaping, leaching, or disposing of a hazardous material in a quantity which is or may become injurious to the public health, safety, welfare, or to the environment.”
State of New York Navigation Law
Under authority of the Navigation Law, Part 611 of 6 New York Codes, Rules and Regulations, Section 2 (g) defines (petroleum) spills as “any escape of petroleum from the ordinary containers employed in the normal course of storage, transfer, processing or use.” Releases of other hazardous substances are dealt with in Part 595 of 6 NYCRR under authority of the

26
Environmental Conservation Law. Section 1(c) 16 defines spills as “any escape of a substance from the containers employed in the normal course of storage, transfer, processing or use.”
Province of Ontario Environmental Protection Act
Part X, Section 91(1) and 92, defines a spill as “a discharge into the environment from, or out of, a structure, vehicle or other container, and that is abnormal in quality or quantity in light of all the circumstances of the discharge.”

27
Compiling Spills Data
Compiling and analyzing a set of spill data for the Great Lakes is not a straightforward exercise. Data collected in the two countries are not directly compatible. The data are collected by agencies with differing mandates, approaches and purposes, and data are categorized using different formats and applications (Table 4). Some data sets for spills reported in more recent years (2001 to 2004) were incomplete, pending completion of agency investigative processes and analyses. Data also were not reported in a consistent manner, often changing formats from one year to the next. As a result of these differences, the databases compiled and used by the various jurisdictions are not easily comparable, making it more difficult to assess the situation or determine courses of action. Table 4. Spills information reported by U.S. and Canadian agencies U.S. information
Canadian information
Industrial Industrial Facilities Industrial Facility Refinery Factory Electrical Equipment Transformer Shorebased Activities Production Field Shoreline Chemical Plant Land Facility (non-marine) Other Industrial Plant Designated Waterfront Facility Municipal Facility Shipyard/Repair Facility Other Offshore Marine Facility Marpol Reception Storage/Transfer Storage/Transfer Outfall/Sewer/Drain Outfall/Sewer/Drain Onshore Pipeline Onshore Pipeline Marine – Commercial Marine Mystery Vessel Marine Terminal Freight Ship/Barge Marine Tanker Tow/Tugboat Barge Public/Research Vessel Bulk Carrier Tank Ship/Barge Pleasure Craft Commercial Vessel Other Watercraft Fishing Boat Marine Recreational Recreational Marina Non-marine Transportation Transportation Land Vehicle NEC Airport

28
Aircraft Transport Truck R-R Equipment NEC Train Non-vessel Commercial Carrier
Tank Truck
Mobile Facility Other Motor Vehicle Tank Truck Unknown Other Unknown/Other Other Natural Chronic Phenomena Unknown U.S. Great Lakes spill data U.S. Coast Guard (USCG) The primary source of information for this review was information provided by the U.S. Coast Guard (USCG) and includes all spill incidents investigated by them. All reported spills within the USCG’s jurisdiction are investigated and responded to regardless of source. Because the USCG jurisdiction for spill response is limited to navigable waters of the United States, the data may not include spills in non-navigable parts of the Great Lakes watershed that were reported and responded to by other jurisdictions such as U.S. EPA. The categories of Great Lakes data displayed in the chart of overall spills differentiate between vessel types and clearly reflect the vessel/marine orientation of the USCG. The USCG involvement with marine-related activities, such as boating accident investigations, foreign vessel boardings and harbor patrols, could cause data to be skewed towards transportation-related activities. However, even with this potential bias, the Detroit River data show a greater percentage of shore-based incidents than elsewhere. The USCG database entries were listed on an incident-by-incident basis in a spreadsheet, which can be sorted in a number of ways but which is cumbersome, with many water bodies identified only by latitude and longitude. The USCG database is not accessible to the public, but summary information up until 2001 is posted on their website. Beginning in 2002, the record-keeping system used by the USCG was changed. Current data were provided for the St. Clair–Detroit River corridor. For the rest of the lakes and corridors, only raw data were given to the IJC, requiring programming of these data. The USCG database includes only cases where the investigation has been completed. In some cases, the intial reporting information remains incomplete in the data set: some cases remain under investigation, some are waiting agency approval, and some may not have been within USCG jusrisdiction. As a result, data for the more recent years (2003 and 2004) are only about half complete. Further, the new system after 2002 does not use all of the same categories of information as in previous years, making it difficult to compare recent with previous data. National Response Center (NRC) This database is accessible on the Web. It includes information on all calls received about spills. The NRC does not investigate the spills, but rather serves as a call center to notify the appropriate response agency for their action. More than one call
29
may be received about the same spill and therefore information may be duplicated. Data are grouped by county and and do not differentiate spills that might impact the Great Lakes from inland spills. Changes to the website have provided more information, but data searches are difficult. EPA Region V Special requests can be made to EPA regions for summaries of spill incident data, which is provided in the form of hard-copy incident reports. It is time-consuming to summarize or analyze the information. Canadian Great Lakes spill data Canadian spills data were obtained from an Environment Canada and Ontario Ministry of the Environment (MOE) consolidated database. Starting in 2003, the two agencies began using their Integrated Division System to track spill incidents which gave both agencies the complete data set. Previously, MOE had sent their data to Environment Canada. As a result, there may be some discrepancies between the earlier data and the 2002–2004 data. This single information source made it possible to obtain spills data in spreadsheet format quickly. The data were broken down by lake and connecting channel. Spill volumes were collected but not provided because they were available only for some of the spills and tended to be more misleading than reliable. The data were aggregated by categories such as substance spilled, source, etc., rather than on an incident-by-incident basis. The only known gap in these data is for minor vessel-related spills. Whereas all land-based spills must be reported to the province, all vessel-related spills must be reported to the federal Pollution Prevention Officer. However, combining information from the Environment Canada–Ontario Ministry of the Environment database with the Canadian Coast Guard database would result in considerable double-counting. Any information on vessel spills is passed to the province if the spill is significant or likely to have implications for water quality, communities or downstream interests. Canadian data are not published or posted on a website. Environment Canada formerly published summary reports, but the latest was for 1984–1995. Provincially the most recent report is the Ontario Spills Action Centre’s Summary Report of 1995 Spills.

30
What the Data Show
Given the limitations of the available spill data, the data must be interpreted cautiously. Not only are the databases from the two countries quite different, but there may be other factors involved. For example, changes in reporting practices or requirements can affect data quality, and the greater scrutiny as a result of more visible USCG presence post September 11, 2001, is thought by some to have reduced the number of spills in the U.S. Figure 3, which combines the Canadian and U.S. data for the St. Clair–Detroit River corridor, shows the contribution of reported spills to the connecting channels from each country as the water moves from Lake Huron to Lake Erie, and illustrates how the water is impacted as it moves downstream (from the top of the chart to the bottom). The number of reported spills in the St. Clair River appears greater from the Canadian side, while the Detroit River appears to have more spills from the U.S. side. Lake St. Clair is not differentiated in Canadian data but, as previously described, the Canadian side of the lake is primarily agricultural and residential, whereas much of the western side of the lake is the urban area of Detroit.
Detroit R. - U.S.
Detroit R. - Can Lake St. Clair - U.S.
St. Clair R. - U.S.
St. Clair R./Lake - Can
0
20
40
60
80
100
120
140
160
1990 1991 1992 1993 1994 1995 1996 1997 1998 1999 2000 2001 2002 2003 2004
St. Clair R./Lake - CanSt. Clair R. - U.S.Lake St. Clair - U.S.Detroit R. - CanDetroit R. - U.S.
Data source: Environment Canada and U.S. Coast Guard Figure 3. Number of spills in the St. Clair–Detroit River corridor, 1990–2004

31
In contrast, if data from the National Response Center (selecting for oil and chemical spills to water) are used instead of the USCG data, the picture for the same corridor is quite different (Figure 4). The NRC data overstate the number of spills because they include all the spills for each affected county (St. Clair County, Macomb County and Wayne County), making it look as if the Coast Guard data understate the number of reported spills. Figure 4 reflects only data up to 2003 because the 2004 data could not be extracted from the revised NRC database. Note the difference in scales between the two charts. The total number of reported spill incidents is more than 250, rather than just over 140 for the Coast Guard–Environment Canada database.
0
50
100
150
200
250
300
1990
1991
1992
1993
1994
1995
1996
1997
1998
1999
2000
2001
2002
2003
St. Clair R. / Lake - CanSt. Clair Co. (St. Clair R.)Macomb Co. (Lake St. Clair)Detroit R. - CanWayne Co. (Detroit R)
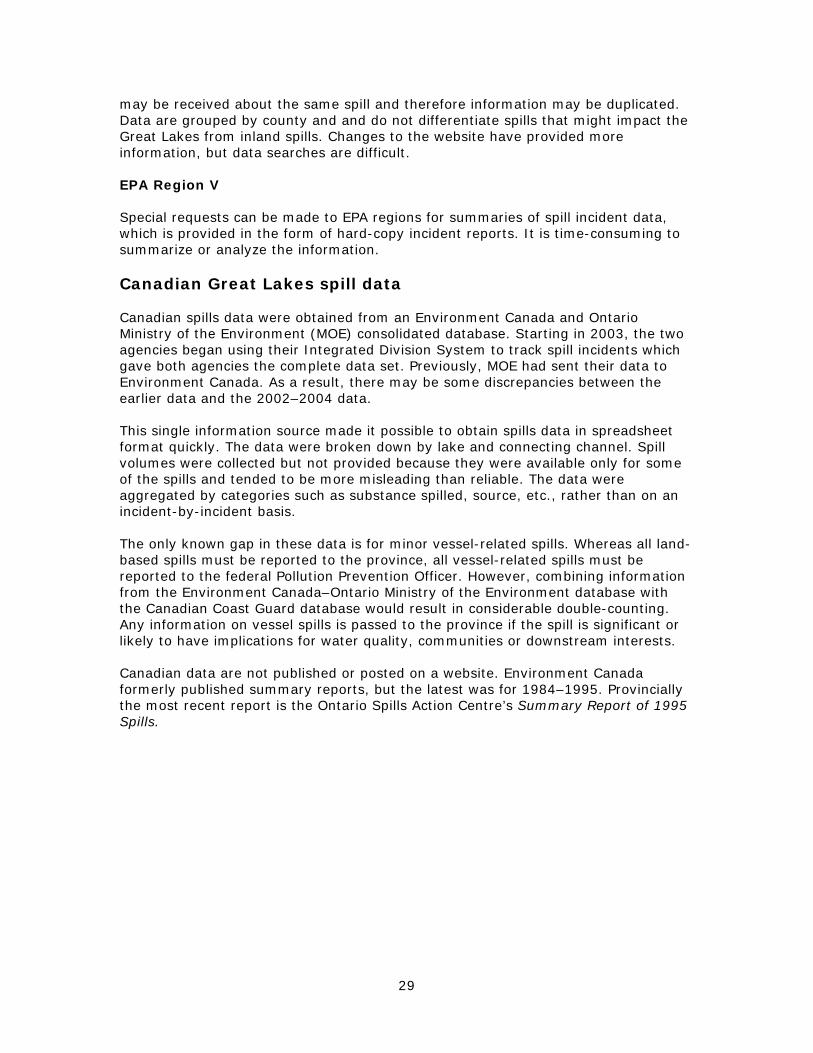
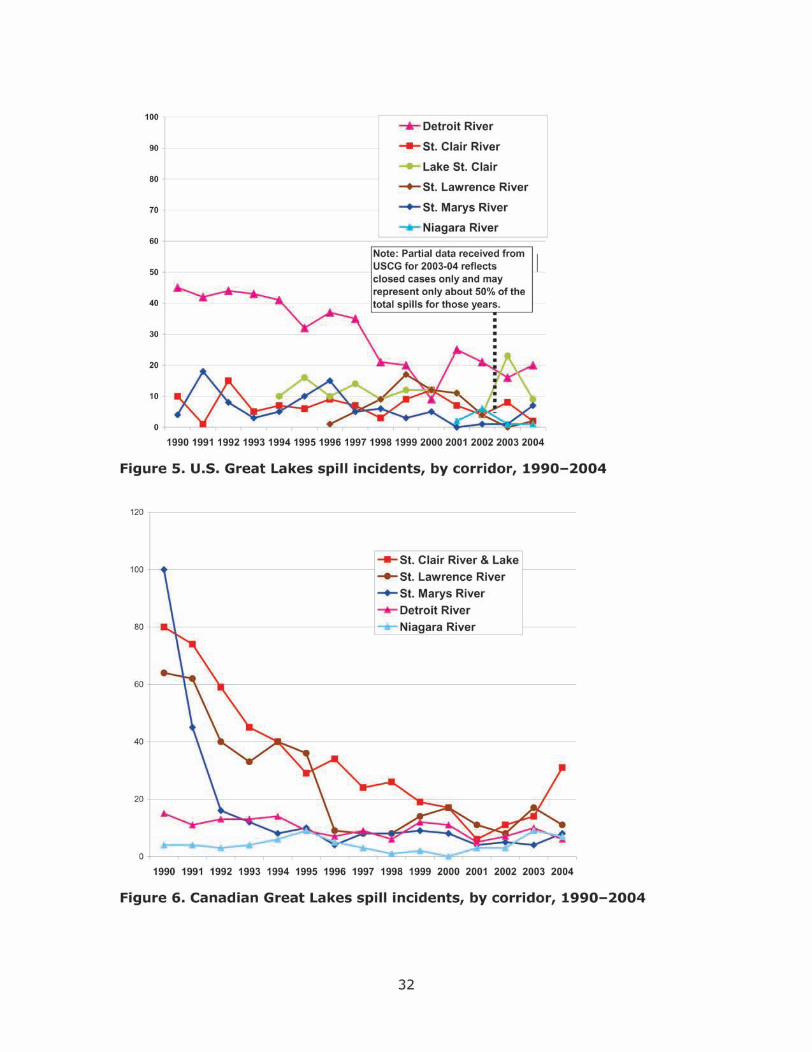
Data source: Environment Canada and U.S. National Response Centre Figure 4. Spills in the St. Clair–Detroit River corridor, 1990–2003 The number of spills in the St. Clair and Detroit Rivers can be put in context by comparing them with reported spills in other corridors (Figure 5 and 6). For U.S. spills, the Detroit River has a greater number of spills than the other corridors. For Canadian spills, the St. Clair River has a greater number of spills. The number of spills in recent years is lower than it was in the early 1990s. The number of spills in the St. Lawrence River has been high in some years, occasionally experiencing as many spills as reported for the St. Clair and Detroit rivers. The data for U.S. spills shows that the number of reported spill incidents was fairly consistent for most of the Great Lakes and connecting channels over the period reviewed. While spills continue, there have been notable declines in the number of reported spill incidents in Lake Michigan and Lake Erie.

33
0
50
100
150
200
250
300
1990 1991 1992 1993 1994 1995 1996 1997 1998 1999 2000 2001 2002 2003 2004
Num
ber o
f Spi
ll In
cide
nts
Lake Michigan
Lake Erie
Lake Huron
Lake Superior
Lake Ontario
Note: Partial USCG spill data for 2003 & 2004 shows only closed cases and may reflect only 50% of the total spills for those years.
Figure 7. U.S. Great Lakes spill incidents, by lake, 1990–2004 The number of reported spills in the St. Clair and Detroit Rivers is low compared to the number of spills to the Great Lakes overall. Spill patterns reflect population distribution and densities and industry patterns around the lakes.
0
50
100
150
200
250
300
1990 1991 1992 1993 1994 1995 1996 1997 1998 1999 2000 2001 2002 2003 2004
Lake OntarioLake ErieLake HuronLake Superior
Figure 8. Canadian Great Lakes spill incidents, by lake, 1990–2004

34
Categories of substances spilled To facilitate analysis of the data available to the Commission, the substances spilled were categorized as follows: • Oils and hydrocarbons: This category includes all types of oil and gasoline as
well as creosote, asphalt and hydraulic fluid. • Chemicals: This category includes the full range of chemicals including organic
and inorganic acids, ammonia, chlorine, pesticides and ethylene glycol. • Waste: This category includes industrial wastes and effluents. • Other: This category includes spills that do not fall into the other categories. Oil and hydrocarbons Oil is not a single chemical substance but a mixture of compounds with different physical, chemical and toxicological properties. Refined oil products are more toxic than crude oils. Most toxic compounds in oil products tend to be lost rapidly through evaporation. Oil spills may have devastating short-term consequences to the local environment and economy, impacting wildlife, fisheries, tourism and disrupting marine transportation. Oil usually floats on the surface of water although very heavy oil can sink. It spreads quickly and coats coastal areas. Degradation of sensitive habitat is of immediate concern in the event of an oil spill. Oil destroys the insulating ability of the fur of marine mammals and the feathers of birds. As they try to clean themselves they ingest the oil that can poison them. If there are substantial quantities in an area the oil may be drawn into intake pipes. Depending on the size of the spill and its location, an oil spill can have serious economic implications. Local beaches or port facilities may be forced to close for extended periods for clean-up efforts. For example, the Rouge River spill in April 2002, resulted in to the Rouge River being closed to boat traffic for nine days. Fortunately, the Detroit River boat traffic at the time was not affected. Chemicals Each chemical has its own toxicity, expected persistence in the environment and potential for bioaccumulation in biota. Some chemicals volatilize to the atmosphere quickly while others degrade quickly in water. These chemical reactions, as well as the volume spilled, determine the environmental impact of the spilled substance. Most of the chemical spills are a mixture of a chemical with cooling or wastewater, so they are diluted to some extent. It is rarely practical or possible to mount a recovery effort once a chemical has entered a water body because the chemical is either soluble, disperses rapidly or settles broadly on particles to the sediment. Substances spilled from U.S. sources Almost all spills recorded in the USCG database (over 80%) appeared to be oil and hydrocarbon spills. One explanation is that the USCG investigates vessel related spills including all visible oil sheens. It should be noted, however, that in a spill event, oil is usually mixed with many other substances and chemicals. For the St. Clair–Detroit River corridor, oil and hydrocarbons are over 90% of reported U.S. spills (Figure 9). As such, it is useful to examine the distribution of the

35
types of oil-based substances spilled and compare them with the U.S. Great Lakes spills overall.
Fuel Oil 7% (15%)
Oil: Lub 15% (16%)
Oil Misc 5% (9%)Waste Oil 46% (14%)
Oil: Diesel 13% (17%)
Gasoline 11% (18%)
Other 3% (11%)
Note: Figures in parentheses are the share of each type of hydrocarbon in total U.S. spills to the Great Lakes Figure 9. Types of hydrocarbons spilled into the St. Clair–Detroit River corridor from U.S. sources, 1990–2001 For the U.S. Great Lakes and corridors spills combined, the data available to the Commission show an almost equal distribution of about 15% each between gasoline, fuel oil, lubricating oil, diesel oil and waste oil over the 1990 to 2002 period. The breakdown is different for the St. Clair–Detroit River corridor where, in addition to lubricating oil, as 15% of substances reported, there is a further 46% of substances spilled are categorized as “Oil, waste/lubricants – possible contaminant”, for a total of 60% of the spills in the corridor relating to lubricating oil. This greater percentage of spills of lubricating oil in the St. Clair and Detroit Rivers may indicate where more stringent enforcement is required, or could simply reflect how the data are entered in the system. For example, the data made available to the Commission show that Detroit River spills were primarily gasoline and fuel oil in 1990, a mixture of fuel oil and lubricating oil for 1991, and a mixture of lubricating oil and oil waste lubricants for 1992. From 1993 to 1997, all the spills are described as “oil waste lubricants”, but this data category is not used after 1998. This type of disparity in the data makes it difficult to accurately determine apparent trends in the types of substances spilled. After 2002, lubricating oil is indicated as the substance spilled less than 10% of the time.

36
Substances spilled from Canadian sources Based on data made available to the Commission, Figure 10 shows Canadian spills to the St. Clair River and Detroit River. Oil and hydrocarbons are about a half of the substances spilled, which would appear to be considerably less than the trend for similar types of spills reported in the U.S. With the exception of the recent increase in spill incidents in 2004, the total number of chemical spills appears to be declining in recent years.
0
10
20
30
40
50
60
70
80
90
100
1990 1991 1992 1993 1994 1995 1996 1997 1998 1999 2000 2001 2002 2003 2004
OtherWasteChemicalsOil and Hydrocarbons
Figure 10. Canadian spills to the St. Clair River and Detroit River, by category of substance, 1990–2004 As Figure 11 shows, the distribution of substances spilled in the St. Clair–Detroit River corridor is similar to that of substances from Canadian sources elsewhere in the Great Lakes.

37
0
100
200
300
400
500
600
1990 1991 1992 1993 1994 1995 1996 1997 1998 1999 2000 2001 2002 2003 2004
OtherWastesChemicalsOil / Hydrocarbons
Figure 11. Canadian spills to the Great Lakes and connecting channels, by category of substance, 1990–2004 As noted above, the number of reported spills has been declining and with few exceptions, the percentage of those spills that are chemical spills also has been declining. Table 5 compares the breakdown of substances for the most recent five years (2000 to 2004) with the first five years (1990 to 1994). This comparison indicates that not only has the percentage of chemical spills been declining, but so has the absolute number of spill incidents. However, it also indicates that chemical spills remain a problem not just for the St. Clair–Detroit River corridor, but also around the Great Lakes. Table 5. Categories of substances spilled in Canadian Great Lakes and corridors, 2000–2004 and 1990–1994 St. Clair–Detroit All corridors Lakes only 2000-
2004 1990–1994
2000-2004
1990–1994
2000-2004
1990–1994
Hydrocarbons 53% 40% 48% 29% 50% 39% Chemicals 17% 39% 16% 39% 11% 14% Waste 15 % 15% 22% 28% 22% 41% Other 15% 6% 14% 4% 17% 6%

38
Assessing the impact of spills The impact of a spill on human or ecosystem health primarily depends on the volume and toxicity of the substance, the season in which the spill occurs, the location of the spill, the routes of exposure of humans and wildlife to the substance, and the extent to which the substance can be quickly cleaned up. Agencies in both countries collect some data on the volumes of substances spilled; however, in many incidents spill volumes are not indicated. Spill volumes are usually given as a rough estimate—the concentration of contaminant, critical to determining the potential impact, is not usually known or available. The Commission did not assess the impact of spills on humans and wildlife. Source of spills Examining the nature of spill sources can help to identify appropriate corrective actions. The causes of spills, their consequences and likely solutions may be quite different for spills emanating from a ship than for spills coming from a shore-based facility or some other mobile source, such as a truck. Figures 12 to 15 show the aggregate data by source over the last 12 years for the U.S. and the last 15 years for Canada. General trends from the available information on reported spills in the St. Clair–Detroit River corridor are similar to those for the Great Lakes as a whole. Some categories of data, such as the spill sources for marine commercial and marine recreational are comparable between the corridor and the Great Lakes, are also comparable between the two countries and these show similar general trends. However, differences in the data source and definitions preclude an accurate, detailed comparison. For example, the U.S. information reflects a marine transportation bias and the Canadian information reflects a shore-side, industrial orientation.
Industrial Facilities63%
Storage / Transfer1%
Marine Recreational3%
Marine Commercial 14%
Transportation2%
Other17%
Figure 12. Source of Canadian spills to the St. Clair–Detroit River corridor, 1990–2004

39
Industrial70%
Marine - Comm11%
Marine - Rec5%
Transportation 3%
Other9%
Storage / Transfer2%
Figure 13. Source of Canadian spills to the Great Lakes, 1990-2004
Industrial2%
Shorebased activities
35%
Outfall / drains20%
Marine - Commercial
13%
Marine - Recreational
16%
Non-marine Transportation
2%
Unknown12%
Figure 14. Source of U.S. spills to the St. Clair–Detroit River corridor, 1990–2001

40
Outfall / drains4%
Large Bulk Carriers
1%
Freight Ship / Barge
6%
Tow / Tugboat3%
Other Vessels5%
Other15%
Industrial4%
Unknown18%
Mystery Vessels13%
Shorebased Activities
24%
Non-marine Transportation
3%
Marine - recreational
19%
Fig
Figure 15. Source of U.S. spills to the Great Lakes, 1990–2001

41
Notification, Response and Communicating with the Public
Table 6 outlines key phases in a planning framework for pollution prevention, spill prevention and spill contingency planning, notification, spill response and public communication developed by the Commission during its review. Each phase is important to preventing spill incidents and minimizing their harmful impacts to humans and wildlife. Notification In the event of a polluting spill, the first step must be the immediate notification of the relevant response agency by the facility where the spill occurred, followed by notification of the local community with recommendations for appropriate level of response. In August 2003, during the massive power outage affecting the northeast region of the continent, Royal Polymer had a major spill of vinyl chloride monomer. The company failed to report these spills to the Ontario Ministry of the Environment for several days as a result of the power outage and the subsequent failure of its monitoring system to detect the spill. Consequently, Michigan was not notified immediately of the spill incident. This event helps to identify several key areas in the planning framework that failed and could be strengthened.
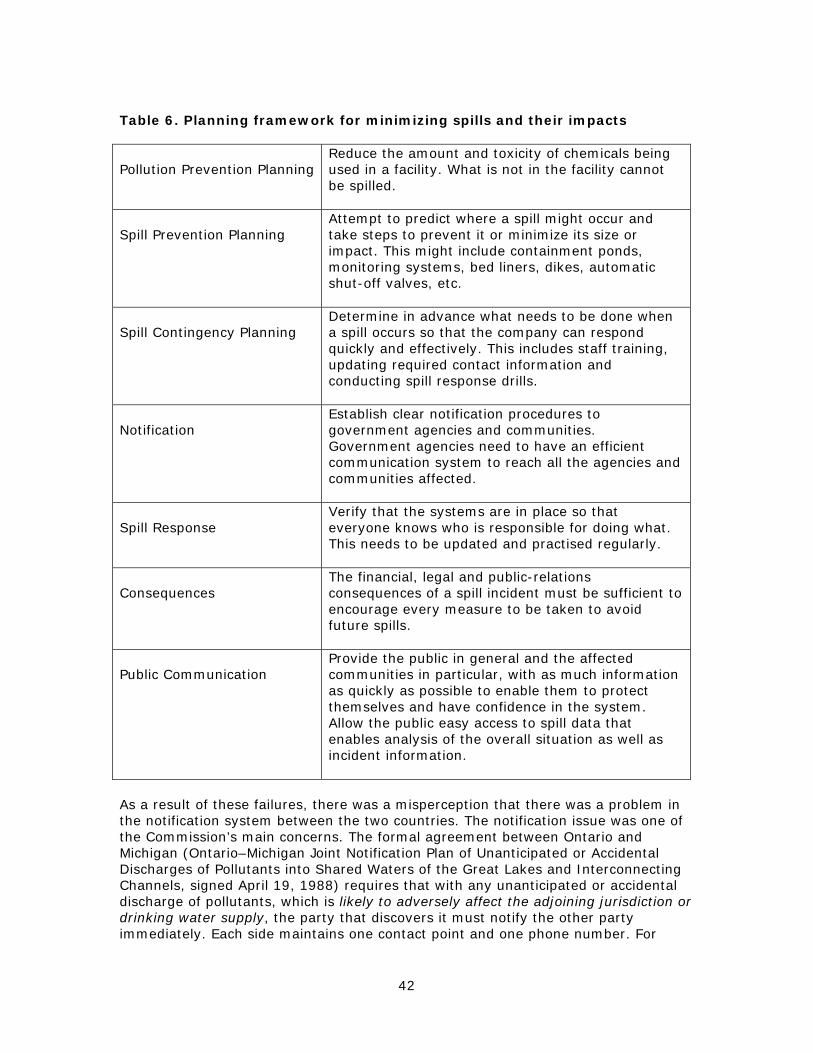
42
Table 6. Planning framework for minimizing spills and their impacts Pollution Prevention Planning
Reduce the amount and toxicity of chemicals being used in a facility. What is not in the facility cannot be spilled.
Spill Prevention Planning
Attempt to predict where a spill might occur and take steps to prevent it or minimize its size or impact. This might include containment ponds, monitoring systems, bed liners, dikes, automatic shut-off valves, etc.
Spill Contingency Planning
Determine in advance what needs to be done when a spill occurs so that the company can respond quickly and effectively. This includes staff training, updating required contact information and conducting spill response drills.
Notification
Establish clear notification procedures to government agencies and communities. Government agencies need to have an efficient communication system to reach all the agencies and communities affected.
Spill Response
Verify that the systems are in place so that everyone knows who is responsible for doing what. This needs to be updated and practised regularly.
Consequences
The financial, legal and public-relations consequences of a spill incident must be sufficient to encourage every measure to be taken to avoid future spills.
Public Communication
Provide the public in general and the affected communities in particular, with as much information as quickly as possible to enable them to protect themselves and have confidence in the system. Allow the public easy access to spill data that enables analysis of the overall situation as well as incident information.
As a result of these failures, there was a misperception that there was a problem in the notification system between the two countries. The notification issue was one of the Commission’s main concerns. The formal agreement between Ontario and Michigan (Ontario–Michigan Joint Notification Plan of Unanticipated or Accidental Discharges of Pollutants into Shared Waters of the Great Lakes and Interconnecting Channels, signed April 19, 1988) requires that with any unanticipated or accidental discharge of pollutants, which is likely to adversely affect the adjoining jurisdiction or drinking water supply, the party that discovers it must notify the other party immediately. Each side maintains one contact point and one phone number. For
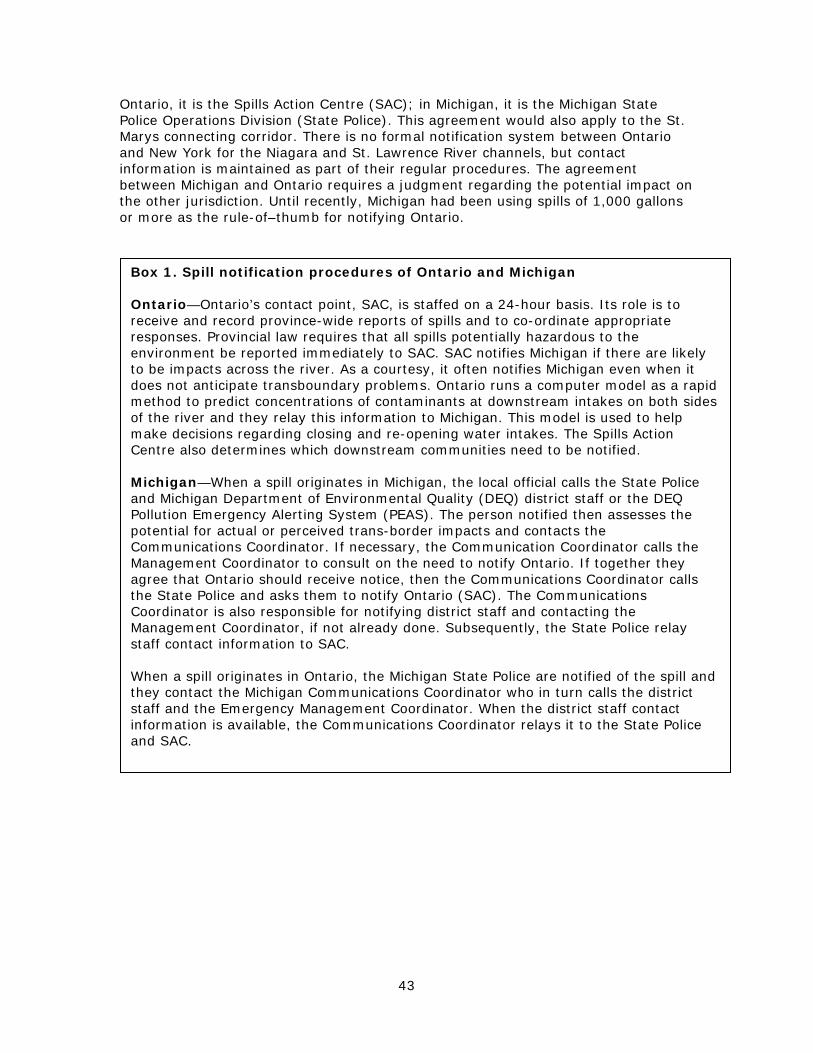
43
Ontario, it is the Spills Action Centre (SAC); in Michigan, it is the Michigan State Police Operations Division (State Police). This agreement would also apply to the St. Marys connecting corridor. There is no formal notification system between Ontario and New York for the Niagara and St. Lawrence River channels, but contact information is maintained as part of their regular procedures. The agreement between Michigan and Ontario requires a judgment regarding the potential impact on the other jurisdiction. Until recently, Michigan had been using spills of 1,000 gallons or more as the rule-of–thumb for notifying Ontario.
Box 1. Spill notification procedures of Ontario and Michigan Ontario—Ontario’s contact point, SAC, is staffed on a 24-hour basis. Its role is to receive and record province-wide reports of spills and to co-ordinate appropriate responses. Provincial law requires that all spills potentially hazardous to the environment be reported immediately to SAC. SAC notifies Michigan if there are likely to be impacts across the river. As a courtesy, it often notifies Michigan even when it does not anticipate transboundary problems. Ontario runs a computer model as a rapid method to predict concentrations of contaminants at downstream intakes on both sides of the river and they relay this information to Michigan. This model is used to help make decisions regarding closing and re-opening water intakes. The Spills Action Centre also determines which downstream communities need to be notified. Michigan—When a spill originates in Michigan, the local official calls the State Police and Michigan Department of Environmental Quality (DEQ) district staff or the DEQ Pollution Emergency Alerting System (PEAS). The person notified then assesses the potential for actual or perceived trans-border impacts and contacts the Communications Coordinator. If necessary, the Communication Coordinator calls the Management Coordinator to consult on the need to notify Ontario. If together they agree that Ontario should receive notice, then the Communications Coordinator calls the State Police and asks them to notify Ontario (SAC). The Communications Coordinator is also responsible for notifying district staff and contacting the Management Coordinator, if not already done. Subsequently, the State Police relay staff contact information to SAC. When a spill originates in Ontario, the Michigan State Police are notified of the spill and they contact the Michigan Communications Coordinator who in turn calls the district staff and the Emergency Management Coordinator. When the district staff contact information is available, the Communications Coordinator relays it to the State Police and SAC.

44
Figure 16. Michigan spill notification procedures When a spill first occurs, it is not uncommon to have only partial information regarding the spill details. To be most useful in determining the required response, the alert from the plant should state the identity and quantity of the chemical spilled, and the time of the spill. When the information is relayed to communities downstream, they also need to know the potential effects the contaminant spilled could have on human and aquatic ecosystem health and when it is likely to reach their community. Communication continues to be important during initial stages of the notification process, and updates need to be provided to communities and to the press as more information becomes available. Incomplete information raises concerns, but without the full picture, it is often difficult for local authorities to make informed decisions regarding their water intake or other community health protection measures. Naturally, the tendency is to err on the side of caution and close a water intake, if only temporarily. Michigan has a multi-step procedure (Figure 16) compared with Ontario (Box 1). Michigan changed their notification system on June 15, 2004, to require a facility to call 911 locally, as well as to notify the state in the event of a spill. At the same time they included penalties for failing to report a release.

45
Response The Commission did not learn of any spill incident where the response effort was inadequate to protect human or aquatic health. For most chemical spills, unless there is immediate containment to prevent the chemical reaching the water body, there is little that can be done in the way of removal. Physical and chemical properties of the substance, such as its solubility, ability to accumulate in living organisms, and half-life will determine how it reacts in water and what effects it may have on human and ecosystem health. If there is a public health concern, then drinking water intakes can be closed downstream. Once a spill has occurred and facilities have been notified, a response plan (Table 6) must be implemented quickly to minimize impacts to human and ecosystem health. The U.S. and Canada share a binational response plan (CANUSLAK). An example of implementing this plan was the U.S.–Canada Coast Guard’s response to the 2002 oil spill in the Rouge River that spread into the Detroit River. This spill, an estimated 100,000 to 255,000 gallons (378,541 to 965280 litres) of lubricating oil and diesel fuel, required full and effective implementation of the U.S.–Canada Coast Guard response system. It was the largest oil spill in 20 years to the Great Lakes basin and the largest ever in the Detroit area. From all reports this worked extremely well. The USCG estimated that 27 miles of soiled shoreline were cleaned at an estimated cost of $7.5 million. Importantly, this clean-up exercise highlighted a discrepancy between the Great Lakes Water Quality Agreement and the Canada–U.S. Joint Marine Contingency Plan (CANUSLAK) regarding who pays clean-up expenses when there are impacts in both countries. The Agreement states that the costs of operations of both countries shall be borne by the country in whose waters the pollution incident occurred, unless otherwise agreed. However, the Joint Marine Contingency Plan requires each country to pay its own expenses regardless of the source of the pollution. Since this incident occurred, no steps have been taken to remedy this discrepancy. For most spills, the immediate concern is the protection of human health. For example, when notice of a spill is received, the Ontario Ontario Ministry of the Environment (MOE) refers to its information resources to determine whether there is a water quality guideline for the substance spilled and whether there are any potential health implications. If there is no guideline available for that substance in Canada, MOE checks other international guidelines. To be protective of human health, water quality guidelines build in a considerable margin of error. For some substances, the U.S. EPA applies more stringent criteria that consider the sensitive impacts to children. For example, both the EPA and the MOE long-term drinking water criterion for benzene is 5.0 parts per billion (ppb), while the EPA short term criterion is 235.0 ppb. Therefore, if as a result of a spill the guideline for long-term water quality is exceeded for a short period, the risk of serious health implications would not be high. However, to ensure greater safety, water treatment plants usually close their intakes when concentrations at the level of the long-term guideline are detected. An example of this approach was seen with the response (February 2004) to the Imperial Oil spill of methyl ethyl ketone and methyl isobutyl ketone. Monitoring was conducted at drinking water intakes and surface water locations in the St. Clair River, Lake St. Clair and the Detroit River. Based on the results of this monitoring and consultation with local and federal health agencies, MOE staff was satisfied that

46
drinking water criteria had not been exceeded and the drinking water supplies were safe. Typically, when water treatment plants downstream receive notification of a spill, they are told the substance and estimated quantity of the spill, the estimated time for the chemical plume to reach their intake (according to a model developed by MOE), and the relevant water quality guideline and any possible health reactions from ingestion of the contaminant. This information is the basis for the local Medical Officer of Health to decide if the water intake needs to be closed and for how long. Usually staff at the water plant conduct tests to confirm that the water is safe just before the intake is closed and again before it is re-opened. Sometimes the quantity of the spill is not known initially or the first notification call is made prior to the model being run. In such circumstances, MOE makes a follow-up call. When the spill originates in Ontario, the information is provided to Michigan for notification of their water treatment operators, while at the same time Ontario advises its own downstream communities. The decision to close a water intake may be based on a perceived health risk which can exceed any real risk. For example, many communities along the St. Clair River closed their intakes after being notified of a vinyl chloride spill in August 2003 during a massive regional power outage. By the time anyone was aware of the spill, several days had passed and the substance was believed to have left the St. Clair River. Although there may have been a health risk immediately after the spill occurred, by the time the notification was given, testing of water samples and subsequent modeling did not indicate any reason for concern. It should be noted that when the vinyl chloride spill occurred, there were also sewage overflows from nearby municipalities which impacted water quality as well. However, no linkage to reports of illness could be determined. Occasionally the water intakes are closed for plant operational reasons. For example, a spill of caustic wastewater (March 5, 2004) from the Lambton TGS raised the pH level in the St. Clair River and some water treatment operators decided to close their intakes as a precaution to prevent possible damage to their equipment and treatment processes. The economic impact of a spill on a downstream community depends on the amount of advance notification the plant receives, the time of year, and the duration of a shutdown. For example, during summer months the demand for water is much greater. If there is sufficient lead time, water plant operators can bring up water levels in needed reservoirs in advance to avoid or limit the need for back-up water supplies. Closing a water intake has many implications. A notice to boil water or to drink bottled water means inconvenience and possible extra costs to residents. Communities may need to turn to alternate sources of water to service their citizens, incurring additional costs to pay for bulk carriers to truck in water. If water pressure is lost, fire fighting systems could be compromised. Many industrial processes also rely on high water pressure. Loss of water pressure may result in the water system having to be flushed and disinfected before resuming normal plant operations and water distribution.

47
Monitoring and modeling for spill detection and response Once a spill has occurred, reducing harmful human and ecosystem impact involves a combination of monitoring and modeling. The goal is to know as soon as possible when a spill occurs and then to determine when it will arrive, in what concentration, and at which locations downstream. Adequate response requires monitoring to detect a spill immediately at its point of release, modeling to determine the speed and trajectory of the contaminant plume, and then monitoring again at water intakes. In-stream, real-time monitoring can complement this process by detecting or confirming any unreported spills and helping to fine-tune the travel projections of the model. The challenge for monitoring is to adequately monitor for the potentially large number of possible substances that could be spilled. A further challenge is that in-stream fixed monitoring stations can record only the substances passing their location. Industrial facilities Most industrial facilities are required to have monitors at their wastewater outfalls and at other strategic locations within the plant. These internal monitoring systems are often a requirement of a discharge permit or other regulations. Monitors in industrial facilities are usually set to monitor small quantities of contaminants to notify personnel in time to assess the nature and source of the problem and to take corrective measures before the situation becomes dangerous. The extent of the monitoring varies from one facility to another depending on the type of operations and the materials being handled. Drinking water treatment plant intakes Drinking water treatment plants conduct basic testing of the raw water coming into the plant for some forms of human waste–related bacterial contamination prior to treatment. In the United States, the Safe Drinking Water Act requires community water systems to test their water frequently for a specified list of contaminants, but this testing is not designed for the immediate detection of spills (www.epa.gov/safewater/sdwa). In Canada, water treatment plants are required to conduct similar chemical testing. Industry association monitoring station at Courtright On the St. Clair River, the Sarnia-Lambton Environmental Association, representatives of the local oil and chemical industry there, established the Courtright water monitoring station to help determine if the water quality in the river was improving. The station continuously conducts tests of chemical and biological water conditions. The 18 chemicals monitored hourly are representative of those associated with the oil refining and petrochemical production located in Sarnia (Table 7). This system also serves as an alert to companies to check their systems closely if any of the substances listed are detected and have not already been reported to the Ontario Ministry of the Environment. The Sarnia-Lambton Environmental Association has a Spill Communication Guideline for their members’ use in the event of a spill incident. In addition to the legally required notifications, these guidelines include calls to downstream communities as well as to the media on both sides of the river.

48
Table 7. Contaminants analyzed by the Sarnia-Lambton Environmental Association
Current Contaminants Analyzedminimum detection limits in parts per billion
• MTBE 0.10• hexane 0.10• chloroform 0.13• cyclohexane
0.04• carbon tet 0.13• benzene 0.05• 1,2-dichloroethane 2.90• trichloroethylene 0.05• 1,2-dichloropropane
0.09
• toluene 0.08• perchloroethylene 0.08• ethylbenzene
0.08• m+p-xylene 0.16• o-xylene / styrene 0.16• 1,3-dichlorobenzene
0.09• 1,3-diethylbenzene0.12• 1,2-diethylbenzene0.09• tetraethyl lead 0.27
The Courtright monitoring station is privately owned and operated by the industry association, but it assists the Ontario Ontario Ministry of the Environment by notifying them when levels of monitored substances rise to one-half of the long-term drinking water guidelines or 10 ppb, whichever is smaller. For example, with detection of benzene, and similarly for any other substance, at levels of 1.0 ppb, the system operator is automatically alerted to ensure that the analyzer is functioning properly. Industry association members potentially discharging benzene are called automatically at 2.0 ppb (Figure 17). At levels of 2.5 ppb, MOE is automatically notified. The drinking water guideline for benzene is 5.0 ppb. The monitoring station also takes grab samples for subsequent analysis of other substances as required. Results of this analysis can confirm or modify the results of an MOE model that is used to predict expected peak concentrations and when a contaminant plume will reach different points along the river. Monitoring results can be used to estimate spill quantities to further confirm modeled results.

49
> 1.0 ppbORTECH
checksinstrumentresponse
> 2.5 ppbMOE
informed
> 2.0 ppbmembers
checkoperations
Early Automatic Response System
Benzene
Safe long term drinking water standard 5.0 ppbSt. Clair River RAP “yardstick” 6.6 ppb
Figure 17. Example of benzene monitoring and alerting system Neither vinyl chloride, spilled in August 2003, nor methyl ethyl ketone spilled in February 2004, is monitored at Courtright although both Royal Polymers Limited and Imperial Oil are members of the industry association. This illustrates some of the challenges faced with designing a monitoring system; identifying appropriate technology for sampling and testing, and determining which substances and at what frequency and cost should be analyzed. A new instrument, to be installed at Courtright station, will extend the list of analytes—including vinyl chloride. Communities downstream can request the monitoring results from the Courtright system at any time. They are not posted on a website because the raw data are not immediately verified. The independent consultant operating the Courtright monitoring station also produces an annual report for the association members. The annual report is available to the public in hard copy at the association’s office in Sarnia.

50
Government ambient monitoring Government agencies also conduct contaminant monitoring programs that differ from the real time, or “near” real time, industry monitoring programs. Various agencies cooperate to conduct upstream–downstream monitoring for the St. Clair–Detroit River corridor, the Niagara River and the St. Lawrence River. They assess a wide range of organic and inorganic contaminants focusing on the differences between the upstream and downstream concentration levels. This monitoring helps them determine the effectiveness of longer-term programs, such as the Remedial Action Plans for the Areas of Concern. Water quality monitoring programs are listed on the Great Lakes Monitoring Inventory (www.binational.net). Ontario mobile water quality monitoring In some instances the Ministry may deploy one of their two boats equipped with sets of instruments that measure water quality and feed data directly to an on-board computer system for immediate analysis. The primary role of these boats is to obtain real-time, geographically precise data on water quality as they relate to near-shore activities, but this program is not designed to be an alerting system. However, in the event of a major spill, these boats can be used to track contaminant plumes, assess their movement to downstream communities, and estimate their possible impact on sediment biota. The boats are equipped to measure conductivity, transparency, temperature and the presence of organic material. Existing modeling capability When the Ontario Spills Action Centre is notified of a major spill, it requests the Environmental Monitoring Branch to run their tracking model. This is a contaminant transport flow model (time/distance) that assumes that the substance will move as a single mass. It is used to determine when the substance spilled will be passing various water intakes downstream. This model encountered difficulty in predicting flows in the methyl ethyl ketone spill in February 2004, when the river had an ice cover. The U.S. Geological Service has recently developed a hydrodynamic flow model of the St. Clair–Detroit River corridor. It focuses more on the water dynamics than the Ontario model and can account for such factors as ice cover and wind direction. It should yield similar results to the Ontario model for the rivers. However, for Lake St. Clair, wind direction is particularly important and the USGS model can be more precise. Possible new modeling initiatives Macomb Country, Michigan, has expressed a desire to develop a model along the St. Clair–Detroit River corridor that could take into consideration the hydraulic aspects of the river. Unlike an open-water lake situation, where wind and waves are important, the connecting channels of the St. Clair River and Detroit River are dominated by hydraulic action (flow characteristics). The St. Clair River has two deep navigational channels with a shallower section between them. The fate of chemicals or other substances in the system is dependent on these water body characteristics as substances are moved, re-suspended, scoured and deposited by the hydraulic action.

51
It is important that any model of a binational river be based on agreed-upon data. For a model to accurately predict the extent to which a chemical would be volatized to the air or react chemically with the receiving water, the movement of a chemical and any potential impacts, it should include the characteristics of specific chemicals and the river. Developing and operating this kind of model could be costly. In July 2004, the Industrial Pollution Action Team (IPAT) recommended that the Ontario Minister of Environment, in collaboration with industry and the communities, evaluate the potential for financing and using state-of-the-science, in situ sensors to provide high quality data to operators and regulators. Highlights of the findings of that report are shown in Box 2. (The IPAT report relied upon information gathered during comprehensive inspection sweeps by the Ontario Environmental SWAT team at a number of petrochemical and related industries in the Sarnia area (Box 3).) Similarly, the Macomb County Water Quality Board in Michigan has proposed an extensive in-stream, real-time chemical and biological monitoring of the St. Clair River and Lake St. Clair. The concept was originally based on a monitoring system for the Ohio River that is similar to the monitoring station run by the Sarnia-Lambton Environmental Association at Courtright. The Ohio River is a highly industrialized area with millions of gallons of chemicals stored, transported or manufactured along its corridor. The Ohio River Valley Water Sanitation Commission (ORSANCO), an interstate commission, coordinates a water monitoring program by fifteen facilities, mostly water utilities. Each station uses a flame ionization detector to detect and quantify 22 organic compounds. Daily samples are taken unless a threatening level of a contaminant is detected. It uses a time-of-travel model to assess potential impact on downstream water intakes (www.orsanco.org). The U.S. EPA appropriated $1.0 million ($650,000 originally and then a further $350,000) to the Inter-County water monitoring program, matched 45% by the counties, for a total project value of about $1.8 million. County legislators are considering an additional $500,000 from the 2006 budget. There are currently three committees looking at various aspects of this initiative and the province of Ontario is involved in the discussions. The main cluster of equipment is expected to be located in the mid- to upper- St. Clair River area with a second smaller instrument cluster to be located in Lake St. Clair. In addition, the Michigan Department of Environmental Quality has received a grant for $760,000 from the Department of Homeland Security for three mobile water monitoring facilities. These units would be deployed by a van to various locations along the St. Clair–Detroit River corridor. These mobile facilities could provide location flexibility to the fixed in-stream monitoring. Complementing developments for chemical monitoring, the U.S. Army Center for Environmental Health Research has developed an aquatic biomonitor that detects potentially toxic events by measuring changes in fish behavior. Initial laboratory and field tests have shown that the aquatic biomonitor responds to most chemicals within an hour and the system can produce a report every 15 minutes.

52
Communicating with the public The Commission found that in the event of a spill, communicating with the public and informing them of appropriate actions they should take to protect themselves, is a problem that needs to be carefully addressed in transboundary regions. Citizens in transboundary regions often hear media broadcasts from the other side of the border, and these messages may sometimes be different from what they hear in their own country. Also, in some cases, one country may not be transmitting messages while the other country is issuing public advisories. In these situations, there is potential for the public at large becoming confused and failing to take appropriate action. Once the responsible agencies become aware of a threat from a spill in a transboundary area, joint communications, properly targeted to inform plant operators and citizens about the appropriate levels of action they should take, are required to avoid confusion. A binationally coordinated approach to cross-border communication with plant operators and the public—using appropriate and consistent messages—would help to ensure that all local and downstream communities are promptly and adequately informed by governments and industry.
Box 2. Findings of the Industrial Pollution Action Team (IPAT) Extract from the report prepared for the Ontario Minister of Environment, July 30, 2004
1. Ontario’s environmental management framework is largely reactive, not preventive.
2. Current approaches to managing spills are not sufficiently risk-based. 3. Ontario’s approvals framework is cumbersome and outdated. 4. The Ministry’s current environmental management system does not
employ the full range of available tools. 5. The number and training of staff may be important factors in spill
prevention and response. 6. Current Ministry monitoring systems appear inadequate to assess ambient
conditions. 7. Laboratory analysis is slow and hampers spills response. 8. There is no regulatory requirement for laboratory accreditation in industrial
self- monitoring. 9. Spill contingency plans are not transparent to the public. 10. Spill response systems should employ state-of-the art predictive
simulation. 11. Downstream communities are not recouping the full costs of spills. 12. Current notification systems do not serve all water users equally well. 13. Jurisdictional confusion may be slowing spills response and notification. 14. Local communities have been gravely impacted by spills. 15. Existing communication and community participation mechanisms are
ineffective. These IPAT findings should be considered in the context of its full report to the Ontario Minister of the Environment that can be found at www.ene.gov.on.ca.

53
Box 3. Report of the Environmental SWAT Team: Sarnia inspection sweep 2004–2005 Between February 2004 and January 2005, Ontario’s Environmental SWAT Team conducted a comprehensive inspection sweep of 35 petrochemical and related industrial facilities in the Sarnia area after a number of spills during the previous year of potentially harmful chemicals into the St. Clair River. Residents of downstream communities were concerned that the quality of their drinking water supply was being compromised and two of the spills resulted in the temporary closures of water-intake facilities. The purpose of the sweep was to ensure compliance with environmental legislation in order to help reduce the threat to human health and/or the environment of future spills as well as unlawful discharges and emissions. According to the report issued by the Environmental SWAT Team, the sweep did not identify any immediate impacts of non-compliance leading to concerns about human health or the environment. However, almost 100% of the facilities inspected (34 out of 35) were found to be in non-compliance with one or more legislative and regulatory requirements. Common deficiencies identified in the report included: $ No spill contingency and/or prevention plans $ Not having a Certificate of Approval for wastewater collection and treatment
works or air emission control equipment $ Altering equipment, systems, processes or structure contrary to the existing
Certificate of Approval for Air or Waste $ Improper chemical handling, storage and identification. Altogether, 32 Orders of Compliance were issued, including six to facilities to develop both a spill prevention plan and a spill contingency plan, and two to facilities to develop a spill prevention plan (each had a spill contingency plan). However, the sweep also found a wide variety of sound practices in many of the facilities (22 out of 35). These included: $ Containment – monitoring sensors on surface water intake and discharge
points, with ability to use automatic trip gates, absorbent booms, etc. and alarms to prevent discharges to the St. Clair River
$ Monitoring – monitoring once-through cooling systems to detect leaks, which can result in spills being prevented
$ Operations – closed-loop systems or electric fans as alternatives to once-through cooling water systems to prevent the discharge of contaminants to air or water
$ Wastewater/Storm Water Treatment – secondary containment for storm water on site until tested, all ditches gated on final discharge
$ Contingency/Spill Planning – Process Hazard Analysis (HAZOP study) of all key processes, with staff involved in identifying critical process areas and addressing solutions to reduce the use of hazardous chemicals, prevent contaminant discharge and minimize upsets.
The full report is available at www.ene.gov.on.ca/programs/5069e_index.htm.