report on customer service performance measures in...
TRANSCRIPT
Report on Customer Service Performance Measures in UK Network Industries
SQUEEZING HARD TO IMPROVE QUALITY
by
Vinh Sum Chau
CCR Working Paper CCR 02-3
Abstract
Literature on performance measurement systems reached great heights in the late-1980s, and challenges of the traditional financial performance indicators being inadequate for measuring what is most representative of organisation-wide operations in the 1990s. This paper provides a descriptive consideration on the customer service aspect of performance measures, as imposed by the economic regulators of water and sewerage services, electricity (supply, distribution and transmission), gas (supply and transmission) and telecommunications. This paper is also offers a detailed description of the evolution and performance of the companies within these network industries, indicating any emerging trends behind the patterns that explain the operational effectiveness and implications to which the data draw our attention. The observations on the published performance measurement data indicate a general trend of improvement over time in the performance of all companies in all the industries. The greatest rate of improvement is most obvious in the earlier years of the Standards being established, nearer to the time of privatisation. However, there are patterns of performances by particular companies, or of particular Standards, where evidence of improvement is much “fuzzier”, and these raise questions of effective control over improvement of the Standards which are predominantly influenced by inevitable forces, such as the weather. Furthermore, such behaviour raises questions on whether there can be further “true” improvement where performance levels are already high in the latter years, or whether it is time for the redesign of the performance measurement systems as a whole, to suit the changing needs of customers with the passing of time.
May, 2002 Keywords: customer service standards, service regulation, utility quality regulation, performance measurement systems, customer satisfaction, UK network industry
ISSN 1473-8473

2
Contact Details: CCR, School of Management, University of East Anglia, Norwich, NR4 7TJ, United Kingdom Direct Dial: +44 (0) 1603 59 2744 Email: [email protected] This paper forms part of the project “Regulatory Design: External and Internal Performance Measures in Regulated Industries”, funded by the Economic and Social Research Council (Project Number: R022250147). The author is immensely grateful for the helpful and extensive advice and comments of Prof. Catherine Waddams, on the earlier draft of this paper.

3
CONTENTS
1.0 INTRODUCTION ………………………………………………. Page 4
2.0 ELECTRICITY: SUPPLY, DISTRIBUTION & TRANSMISSION ……………………………………………….. Page 7
2.1 ELECTRICITY SUPPLY ……………………………………….. Page 8
2.2 ELECTRICITY DISTRIBUTION ………………………………. Page 23
2.3 ELECTRICITY TRANSMISSION – The National Grid (NGC) .. Page 26
3.0 WATER & SEWERAGE SERVICES …………………………... Page 29
4.0 TELECOMMUNICATIONS – Comparable Performance Indicators ………………………………………………………… Page 40
5.0 GAS SUPPLY & TRANSMISSION ……………………………. Page 47
6.0 DISCUSSION …………………………………………………… Page 56
7.0 CONCLUSION ………………………………………………….. Page 61
REFERENCES ………………………………………………….. Page 64
APPENDIX A …………………………………………………… Page 68
APPENDIX B …………………………………………………… Page 69
TABLES ………………………………………………………… Page 71
FIGURES ………………………………………………………... Page 84

4
1.0 INTRODUCTION
A focal consideration of economic regulation and industrial policy has been understanding
how to regulate firms with market power (Armstrong et al, 1994), and “in the process of
regulatory reform, markets have been liberalised, industries have been restructured, and
new regulatory methods and institutions have been created” (p.1). One original argument
for the privatisation of the UK network utility industries was to make way for the
expectation of lowered costs of production and a higher service to consumers (Parker,
1999), this being associated with an unbundling of services that would no longer be
leading to a narrower definition of areas of natural monopoly. There is a trade-off
between lower costs from the incentives which privatisation provides and the potential
exploitation of excessive power over consumers. This begs policy innovations by
government to prevent monopolistic abuse of power to achieve profits in excess of those
achievable under conditions of perfect competition, and this warrants a need for economic
regulation.
According to Waddams Price (2002), “one tool for controlling privatised companies with
market power is to compare the performance of different companies, either for regulators
to use some form of comparative regulation between monopolies, or to provide additional
information for consumers as they are offered choice in previously monopolised
industries”. Moreover, a method of monitoring the processes and mechanisms within the
organisation is through performance measurement systems, arguably historically
developed to maintain organisational control and “the process of ensuring that the
organisation pursues strategies that lead to the achievement of goals and objectives”
(Brignall and Ballantine, 1996: p.6). Inasmuch as the importance of measuring
performance has been increasingly recognised across a multiplicity of industries and
sectors, particularly in the 1980s, the effectiveness in using traditional financial
performance indicators, such as the financial ratios of cost accounting, to achieve their
objective of measuring the overall performance of the organisation has been challenged,
particularly in the 1990s. Even the fad-phase of EVA® (Economic Value Added), a means
to calculate “the profit that remains after deducting the cost of the capital invested to
generate that profit” (Stern et al, 2001: p.15), was considered insufficient and ineffective
to fully comprehend the management of organisational performance (Otley, 1999).
Literature on performance measurement systems indicates that a number of alternatives

5
have been proposed, providing the initiative to include other elements for measurement
(Kaplan and Norton, 1992; 1996), due to financial measures no longer being adequate for
the changing nature of the present times (Johnson and Kaplan, 1987), that alternative
frameworks ought to be applied (Fitzgerald et al, 1991; Eccles and Pyburn, 1992), and that
customer satisfaction is a better indicator of organisational performance (Ittner and
Larcker, 1998).
It imperative to focus on customer service levels for utility regulation because these ensure
that companies provide to customers minimum levels of safety, reliability and efficiency
of service as if under market conditions; on the part of the company, these also give them
incentives to acquire a competitive edge. According to Baldwin and Cave (1999),
“competition involves rivalry among firms for the customer’s business across all the
dimensions of the service – price, quality and innovation” (p.210), and as one purpose of
regulation is “ensuring that consumers and licensees reap the benefits that flow from
privatisation” (OFFER, 1990: p.5), this is a vital element for exploration. Furthermore,
Neely et al (1997: p.1142) argue:
“Customer service, like quality and flexibility, is a multidimensional concept and can be affected by both tangible and intangible factors. Customers may, for example, base their assessment of the level of service they receive on factors such as the value of the product or service, their satisfaction with the environment in which they receive the service and the speed with which the service is delivered.”
Therefore, the purpose of this paper is to provide a detailed account of the evolution and
performance of customer service measures since they were first established, in each of the
sectors, taking into careful consideration any connections between the changes in the
required levels of performance as imposed by the economic regulator, the penalty
payments attached for the companies which do not attain these targets, and the actual
performance attainment levels of the individual companies.
The methodology of data collection applied for the preparation of this paper comes
directly from published annual reports, predominantly those directly on customer services,
of the economic regulators. The data from these reports were then inputted into a freshly
created database, from which specific datasets were generated. In various instances, these
data were recalculated to ensure consistency and comparability, particularly where the
economic regulators had altered the formats in which the data were presented, or where

6
the data were omitted for particular years, either because they themselves were
incomparable or unavailable, at the time of preparation or publication.
It is not only useful to collect together these datasets, but it is also interesting, as what lies
behind the patterns in the performances of each individual company and Standard, is a
moving story. However, the scope of this paper does not include the revelation of these
hidden stories, although Crowther et al (2001: p.236) suggest that:
“It is already noted that one of the regulators’ duties is to protect consumers. However, there is also a requirement to ensure that the industry is able to continue into the future … the regulator must protect the privatised companies to the extent that their survival is of importance. Also, the regulator’s job is dependent upon the continued requirement for a regulator and the success of the regulatory process. It is then possibly not too surprising that the results achieved by the privatised industries and the regulatory process itself have been defended by the regulators.”
Therefore, it is interesting to explore the extent to which, and whether it can be so that, the
design of the performance measurement systems allows sufficient scope for year-on-year
improvement in the network industries. In this way, following Crowther’s assertion, the
work of the economic regulators will remain of utmost importance, to ensure that there
will be improvement in these industries, whilst providing sufficient scope to enable such
improvements.
To pursue these observations, this paper considers, in this order, the customer service
performance measures of the electricity (supply, distribution and transmission), water and
sewerage services, telecommunication and gas (supply and transmission) industries, within
each a detailed description of their establishment, evolution, and performances. In this
way, this paper endeavours to provide an insightful consideration of the effectiveness of
the performance measurement systems that currently exist in these industries. The paper
then offers discussion on the possible implications and explanations for the emerging
patterns of the observed data, and closes with a conclusion that summarises the main
issues that have arisen from these observations.
This paper intends neither to build nor test existing theory on performance measurement
systems; this is left to future research. Instead, it intends to provide only the current state
of development of these measures in the UK network industries under consideration, and
some thoughts on the implications of such observations. It is anticipated that, because

7
existing literature on similar subject areas applies datasets that are either incomplete
(Baldwin and Cave, 1999; Iozzi, 1999; Waddams Price, 2002) or outdated (Ogden and
Anderson, 1995; Dean et al, 1999), the observations on the data in this paper endeavours
to enhance and assist future research on similar topics, by adding supportive empirical
evidence to forthcoming new theories, as well as consolidating these new assertions and
informative “stories”.
The customer service “standards” that apply in the network industries vary tremendously
and are industry-specific. There can be no simple cross-industry description applicable to
all the Standards. This paper only places emphasis on the evolution and performance data
of UK network industries as of April 2002. Typically, the economic regulators set
Standards which are either compulsory whereby a penalty will be imposed for not
achieving these, or minimum levels which customers ought have the right to “expect”. A
stricter form of these is where the penalties have been made automatic, which offers a
more accurate measure where these are indicated by the number of payments made
(electricity Guaranteed Standards), vis-à-vis a percentage level of achievement, such as in
water Standards and electricity Overall Standards. The details of these are therefore
explored by consideration of each industry in turn, as immediately follows.
2.0 ELECTRICITY: SUPPLY, DISTRIBUTION & TRANSMISSION
The electricity provided to households is divided into the companies that supply it, those
that distribute it and the very few companies that hold the licence to transmit it. In the
UK, this is regulated by one economic regulator, and a system of performance standards is
set to govern the functioning of the companies that provide these services.
The Director General of Electricity Supply, in his first Annual Report of OFFER,
announces that “ I see my prime task as ensuring that consumers and licensees reap the
benefits that will flow from privatisation of the electricity industry” (OFFER, 1992: p.5),
and in his opinion, “a competitive market, with efficient and financially sound companies
operating within a stable regulatory framework, is in the best interests of consumers and
the industry itself” (p.11). Essentially, a test of the effectiveness of performance measures

8
in the electricity industry is one which is capable of determining whether such
performance achievement levels lead to the achievement of the regulator’s prime task.
A report by the National Audit Office in 2001 (NAO, 2001) outlined that although
“competition has reduced electricity bills for many customers … some have experienced
problems” (p.2), and that in spite of ongoing development in standards of customer
services, “information on quality of service is, however, still hard to obtain” (p.5).
Therefore, this section provides an outline and overview of the evolution and progress of
the performance measures used by the regulator for electricity supply, distribution and
transmission, Office of Gas and Electricity Markets (OFGEM), formerly OFFER (Office
of Electricity Regulation), and the companies in the electricity supply and distribution
industries. This reports background information on the rationale behind performance
measures in this industry, and then considers the electricity supply, distribution and
transmission measures individually, and any emerging trends. The information results
predominantly from published data and related documentation of OFGEM, although some
of these data are reinterpreted and applied to exhibit a more meaningful linkage for the
establishment of a year-on-year comparison.
A descriptive approach is taken in outlining patterns in the company performances, and
the author cannot testify against the degree of accuracy and reliability of the data, as these
are provided to and reported by OFGEM. Although reported performances are considered
subject to some formal audit or independent assessment, even OFGEM announces that
“companies are themselves responsible for their own standards of reporting, and the
results are presented in this report on that basis” (OFFER, 1993a: p.3).
2.1 ELECTRICITY SUPPLY
The first set of published data on the quality of public electricity suppliers (PESs) was the
1991/92 publication of “Report on Customer Service” (OFFER, 1992), by the fourteen
Electricity Supply Companies in England, Scotland and Wales, with the purpose of
helping customers “assess the quality of the service they currently receive and to enable
them to compare it with the service provided by other Electricity Supply Companies”
(OFFER, 1992: p.i). This annual report was renamed “Report on Services for Electricity

9
Customers” (OFGEM, 1999) in 1998, when the electricity and gas regulators, OFFER and
OFGAS respectively, merged to become OFGEM. This report also records the “number
of complaints that have been referred to OFFER and the Electricity Consumers’
Committees by individual customers and the number of customers disconnected for non-
payment of electricity bills … [which are] important indicators of the way in which the
Electricity Supply Companies deal with their customers …” (OFFER, 1992: p.i). A
summary of customer services is also included in one section of the OFFER/OFGEM
general Annual Reports.
The evidence from this paper suggests that the development of customer performance
measures in electricity supply has been the most coherent and best-defined, vis-à-vis those
of other utilities. Various external reviews were conducted for the development and
enhancement of customer services for electricity supply (OFFER, 1993b), electricity
distribution (OFGEM, 2001f), and for other utility services. The excelled development of
measures for electricity supply could have been due to early review of customer
preferences and expectations (OFFER, 1993b), as opposed to those conducted later for
electricity distribution (OFGEM, 2001f), gas transportation (OFGEM, 2001g) and water
and sewerage services (OFWAT, 2001b).
These Standards were established by a regulatory framework, by which sections 39 and 40
of the Electricity Act 1989 set out standards to be achieved by the PESs and reported to the
Director General. These standards cover the provision of services to customers in supply,
distribution and metering services. It was reported that “one of the main purposes of the
Standards is to set a common framework for customer service by the companies … [and
this] framework is intended to ensure a minimum level of service for all customers and to
encourage companies to aim for higher levels of performance” (OFFER, 1998b: p.63).
There are two types of standards: Guaranteed Standards and Overall Standards. The
former sets service levels which must be met in each individual case, and in the event of
PES’s failing to provide the required level of service, the customers affected are entitled,
upon request, to a package of compensation. This predetermined amount of compensation
required as minimum payment is set by the regulator. The latter covers areas of service
where it is not appropriate to give individual guarantees, but where the customers should
have a right to expect a minimum level of service. For this, payments need not be made

10
for failure to maintain a particular standard. Although the exact performance level for
each PES’s Overall Standard may be different, they have been set by the Director General
after review of recent performance, consultation with the companies, the Electricity
Consumers’ Committees and other customer representatives. These were given particular
review in 1993, 1995, 1998 and 2000.
Table 1 outlines the current Guaranteed Standards and the levels of penalty payment
required, which are compulsory, although not necessarily automatic. The GS scheme of
performance measurement accounts for the number of claims made under each of the
categories, and thus clearly does not directly account for the company’s ability to provide
the levels of standards, as not all customers who have suffered would made a claim. This
is in spite of GS10 being a Standard to make customers aware of the GS scheme per se.
For the evolution and development of the Guaranteed Standards, refer later.
Under the Guaranteed Standards, PESs are at least once a year required to send to each of
their customers details of the Guaranteed Standards. Initially, the Director General neither
had powers nor asked PESs to detail their customers of Overall Standards. However, the
provisions of the Competition and Service (Utilities) Act 1992 clarified the need, and now
customers must be informed of the company’s individual predetermined targets and their
actual percentage performance of this target.
The Standards are subject to changes by the Director General, and “will need to take into
account changes in customer needs and expectations” (OFFER, 1992: p.3). Furthermore,
the Standards are used by the Director General to review the operation of the formulae
which govern the maximum price the companies can charge for electricity.
Table 2 exhibits the original set of Overall Standards, and this framework to date has
hardly changed, although the substantive level of achievement set for the PES have altered
through time, before stabilising (see later).
The first report on customer services (OFFER, 1992) indicated particular and greatest
concern on the standard of meter reading, which limits the extent to which the PESs can
rely on estimated meter readings to produce bills. “Estimated bills are unpopular and
cause problems for many customers, particularly when there is an unexpected high bill

11
following a series of under-estimates … [so] there is a strong case for raising this
Standard” (OFFER, 1992: p.i). Company performances of these two Standards improved
well (see later), but other concerns were raised as the Standards developed over time.
The presentation of the first two publications of the report of the Overall Standards
remained very clear and detailed. These included, for each of the PESs, the predetermined
performance, achieved performance, and the raw data of each component success and
failure. However, the third report (OFFER, 1994) to exhibit the data for 1993/94
presented the data on Overall Standards in graph-form with no data in figures. Only
required and achieved percentages (of the past three years) were graphically presented.
Furthermore, without explanation, data for standard OS3b were excluded from the report.
The 1994/95 report (OFFER, 1995) was the first in which a table of required and achieved
performances for each company was presented, in addition to the graphic illustration.
Data for standard OS3b remained missing.
The presentation of the Overall Standards data remained unchanged in the 1995/96 and
1996/97 (OFFER, 1996; 1997) publications, but for the reappearance of data on standard
OS3b. No changes were made to the presentation of Overall Standards in subsequent
publications.
A few key improvement issues were outlined in the 1997/98 report (OFFER, 1998b). A
significant requirement would be for all the Overall Standards (apart from OS1a) to be set
at 100 per cent. Further, common customer service obligations under the Guaranteed
Standards for all PESs were made. These changes were made because the Director
General expressed concern over the increasing role these Standards played as the
competitive market developed; further, as second-tier suppliers would operate in more
than one PES area, it would be more appropriate for Standards on distribution to be
uniform across all PES areas.
Consultations were also indicated in the 1998/99 report (OFGEM, 1999), particularly in
the areas of: a standard covering supply restoration in less than the current 24 hours;
reducing the scope of the severe weather exemption; the introduction of a new Standard to
12
deal with frequent supply interruptions; and requiring all payments for not achieving a
Guaranteed Standard be made automatically.
In the 1998/99 report (OFGEM, 1999), a Code of Practice was outlined, recognising that
companies have important obligations to customers set out in the Codes of Practice, which
form a key part of customer protection to specify clearly the standards customers should
expect from suppliers. These codes were agreed with the Electricity Consumers’
Committees and approved by the Director General, in preparation for the introduction of
full competition in 1998. These Codes cover issues relating to: payment of bills by
domestic customers, including guidance for payment difficulties; advice on energy
efficiency; procedures for site access; and company complaint-handling arrangements.
There is also the arrangement for promoting the awareness of the Codes and for
monitoring the service delivered to customers. Further, suppliers must by licence report
on their performance under the Codes.
There were originally (in 1991/92) ten Guaranteed Standards. The Director General’s
reviews led to a new one being introduced in July 1998, GS11 on prepayment meter faults.
The standard requires companies to respond to prepayment meter faults within three hours
(on weekdays and four at weekends). Table 3 outlines these changes over time.
The report of 1999/00 (OFGEM, 2000b) outlined further tightening of the standards. The
Guaranteed Standard and associated Overall Standard covering supply restoration was
changed from 24 hours to 18 hours. Moreover, the report of 2000/01 (OFGEM, 2002a)
indicated that all overall standards, except OS1a and OS1b, remain at the attainment target
of 100 per cent. This signals a relaxation of standard OS1b for all companies, as it fell to
99.5 per cent, previously fixed at 100 per cent since 1997/98.
Another dimension was the enactment of the Utilities Act 2000, in amendment of the
Electricity Act 1989, which made it an appropriate time to review the arrangements in the
Standards. The Act confirmed that OFGEM can “make regulations prescribing such
standards of performance in connection with the activities of electricity distributors, so far
as affecting customers or potential customers of electricity suppliers” (s.39A(1)), and that
“if an electricity distributor fails to meet a prescribed standard, he shall make to any
person who is affected by the failure and is of a prescribed description such compensation

13
as may be determined by or under the regulations” (s.39A(2)). With regard to overall
standards, OFGEM may “determine such standards … in connection with the activities of
electricity distributors as … ought to be achieved by them” (s.40A(1)(a)), and “arrange for
the publication in such form and in such manner as it considers appropriate, of the
standards so determined” (s.40A(1)(b)).
Whilst the electricity supply market successfully opened up in May 1999, and customers
were offered a choice of PESs, customers were still dependent on the PES of the area for
distribution services. Thus, for the PESs which remained monopoly suppliers, new
arrangements for the Standards were issued. Guaranteed Standards continued to apply to
PES tariff customers. Second-tier customers were to receive the same level of service on
distribution matters from local PESs as received by the PES’s own supply customer. PESs
must publish their own performance data in serving all their tariff and contract supply
customers. Similarly, second-tier suppliers must publish their own Standards on supply
issues and monitor these performances.
The report of 2000/01 (OFGEM, 2002a) signals many changes, particularly in terms of
presentation of data. Due to the many recent changes in ownership of the companies, with
associated changes in names, the 2000/01 report provides the current and previous
company names, but for the purposes of this present report, to prevent confusion and
complexity, the data herein are presented using the former names. The business brand
names for distribution and supply are as exhibited in Table 4 (OFGEM, 2002a: p.9).
Furthermore, the report was also subject to many other substantive modifications. Due to
the separation of businesses of the electricity companies, the report presents most of the
data by separation into distribution and supply, and PES and non-PES, where appropriate.
Again, for the purposes of consistency and ease of comparability, in this present report,
only the original company name will be used, and data that are measured against the
original united form will be applied. Additionally, for the total number of payments made
by each company, due to the recognition of the varying sizes of the companies, not only
are the total number of payments for each company presented, the number of payments
made per 100,000 customers is also available.

14
For comparability purposes, for GS2, only restoration of supply within 12 hours can now
be observed, as the second measure (restoration within 24 hours) has been reduced and
measured as restoration within 18 hours. Moreover, the number of domestic
disconnections is no longer reported in the OFGEM annual report, but the responsibility
has instead been passed to the Social Action Plan, and the presentation of these data are no
longer comparable with those in the previous OFGEM reports.
In fact, the last of this annual report on customer service standards that presents all data in
the same particular format is that of 2000/01, as “responsibility for future reports covering
performance from 1 October 2001 will pass to energywatch” (OFGEM, 2002a: p.2), the
independent statutory consumer organisation, although OFGEM will still continue to
collect the same data for its personal use and interest within its other regulatory functions.
This is to make way for the introduction of fresh data from the newly established
Information and Incentives Project, better known as the IIP.
Supply Standards: PES and Guaranteed Standard Performances
The effectiveness and operation of the Standards may be assessed by evaluating the PES
performances under these standards. A series of data collected as published from the
reports (OFFER, 1992; 1993a; 1994; 1995; 1996; 1997; 1998b; OFGEM, 2000b; 2002a)
illustrates either very effective functioning of a particular standard (smooth and obvious
improvement in performances), moderate effectiveness (general improvement, with a few
exceptions), and ineffective operation (where the data show no pattern in the performance
data at all).
The overall performance among PESs and the industry indicate very effective
improvement in the Standards to make and keep an appointment (GS9), notice of supply
interruption (GS5) and a reduction in domestic disconnections. The year 1993/94 saw the
greatest reduction in domestic disconnections, and this is most obvious in the industry
figures. There is some slight fluctuation in the performance of GS5, such as the high
number of payments made by South Western in 1992/93, and the sharp fall in payments by
East Midlands in the same year. However, the overall pattern indicates an overall industry
tendency of improved performance of the Standard.
15
Similarly, although many of the Standards have not indicated a clear improvement in the
performances, for them, there are still patterns which emerge to indicate some kind of
improvement or control. For instance, in the first few years of the operation of GS4,
estimating charges, there has been a significant improvement in performance across the
industry. Thus, estimating charges seem to be controllable. A very obvious fall back in
performance was in 1993/94 where Midlands made a large number of payments, and the
same for Norweb and ScottishPower in 1998/99.
But for the sudden large volume of guaranteed payments made by Yorkshire in 1994/95,
there is a general pattern of improvement in GS7, for responding to meter disputes. In the
first year of running this Standard, a large number of payments was made by
ScottishPower, but it seems that it has kept this Standard under control since 1994/95.
Again, but for the high volume of payments made by East Midlands in the second year
running of GS3 (providing a supply and meter), there seems to be a general trend to
improved performance in the industry. Despite the unusually high volume of payments
made by Yorkshire in 1995/96, the industry trend still indicates an improvement in the
performance of GS3.
Two Standards, responding to failure of a suppliers’ fuse (GS1) and investigation of
voltage complaints (GS6), show a general fall in the number of payments made for the
Standards (ie, an improvement in PES performance) but a slight increase in the payments
in the latter years again. In the case of GS1, of particular significance is the sudden
increase in payments made by SEEBOARD in 1992/93 and Eastern between 1994/95 and
1995/96. It seems that the industry worsening of the Standard in the latter years is not due
to the poor performance of any one particular company. In the case of GS6, the lowest
number of payments made was seen in 1996/97, and increased again in 1997/98,
predominantly due to SWALEC.
Finally, the performance of two Standards indicate no pattern or trend at all, notifying
customers of payments due for the failure of any Guaranteed Standard (GS10) and
responding to queries regarding charges and payment queries (GS8). As these two
Standards are very similar, both involving contact with customers, it is not surprising that
the performances of these are very similar. Unfortunately, there is insufficient evidence to
warrant any valid commentary on the performances of these two Standards.
16
As the issue of control is imperative, for the PESs and the regulator, and more so as it
ultimately affects the customers, it is crucial to evaluate the performances of the GS
standards scrupulously under each PES. In this light, similar three distinctive patterns to
that of the GS performance levels have emerged: very obvious improvement in
performances (smooth pattern in the fall of the volume of payments made, signifying
strong control), general improvement in the performances in the Standards (general trend
emerging among the Standards), and again, where no pattern is obvious.
The data on East Midlands show a clear and general pattern of improved performances,
with the exception of poor performance in 1994/95. The performance of Hydro-Electric
shows a very rapid rate of improvement, even with the unusual poor performance of
restoring supply within 24 hours in 1992/93 and 1996/97. However, Southern and South
Western have shown excellent control of the Standards and both PESs improved
performance in all the Standards since they were first operated. The performances of
Manweb indicate good improvement in the Standards over time. In 1999/00, however,
there has been a minor increase in customer complaints and payment for poor responses to
customers (GS1 and GS2).
The performance of several PESs indicate overall improvement in customer services. The
performance of Eastern has generally improved. It seems that the performance in
responding to customers and restoring supply within 24 hours is particularly high in
1994/95, which reflects the slight increase in customer complaints in the same year. The
performance of Midlands is very similar; there is a slight indication of improved
performances, except for the extremely high volume of payments made for restoring
supply within 12 hours in the year 1995/96, and the high initial number of domestic
disconnections and payments for responding to customers. Again, for ScottishPower,
there seems to be an emergent pattern of improvement in customer service but for the
exceptionally high number of payments made for restoration of supply in 24 hours in
1993/94. Also, there seems to be a slight increase in the number of payments made for
responding to customers in 1996/97.
Finally, various PESs indicate little pattern in the performance of the Standards. These
include London, with exceptionally poor performance of payment in period (GS10) in

17
1997/98 and initial high domestic disconnection rate. The year 1998/99 saw very poor
performance of restoration of supply for both Northern and Norweb, and no obvious trend,
particularly for Norweb’s notice of planned interruptions. There are too many fluctuations
in the performance of the Standards of Yorkshire. It is unclear whether there is any
correlation between the performance of any one of its Standards with another.
Although there are fluctuations in the performance of various Standards for SWALEC and
SEEBOARD, particularly a poor general performance of many Standards in 1995/96,
there is a clear improvement in the volume of customer complaints over time for
SWALEC. For response to customers and payment in period for SEEBOARD, it seems
that 1995/96 saw the best performance in all Standards, but since then has taken a “U-
turn” and the number of payments made under the Standards has increased again.
In 2000/01, for GS6 and GS7, the numbers of payments have more than doubled. In the
former, the industry values increased from 9 to 13 (mainly attributable to Yorkshire), and
for the latter, the number of industry payments rose from 23 to 59. However, in the cases
of GS8 and GS10, the year of 2000/01 has seen immense reductions in the number of
payments. The industry number of payments fell from 1,228 to 518 and from 994 to 328,
for the two standards, respectively.
In general, the latest set of data (OFGEM, 2002a) raises doubts over whether the
Standards can truly improve. For most of the companies, the volume of complaints has
vastly increased. In the case of Eastern, from 858 to 1,867, for East Midlands, from 762 to
2,320, for Hydro-Electric, from 144 to 1,467, for Manweb, from 362 to 566, for Northern,
from 1,754 to 4,884, for South Western, from 68 to 899, for Southern, from 497 to 1,816,
and for SWALEC, from 141 to 1,213. OFGEM (2002a) also indicates large one-year
increases in payments for restoration of supply within 12 hours for Manweb and
ScottishPower which have seen increases from 0 to 26 and from 0 to 25, respectively. For
ScottishPower, the number of payments made for responding to customers has also
increased from 16 to 38. Other increases include from 1 to 24 for Northern’s meter
disputes, 12 to 95 for NORWEB’s payment in period, and from 21 to 41 for Yorkshire’s
notice of planned interruptions.

18
Overall Standards – The Pattern of PES Performance
Due to the variations in the minimum performance levels required and set by each PES, it
would be inappropriate to evaluate the performance of each PES under the category of
Overall Standards. Instead, it is more interesting to consider the pattern of performance of
Overall Standards of each PES over time.
Generally, with the exception of Manweb and SWALEC, which had reduced the required
level of various Overall Standards (and the relaxation of OS1b for all companies, in
2000/01), all the required levels of Overall Standards in the PESs have increased over
time. Thus, the importance of considering the changes in the required levels of
performance in juxtaposition with the actual performance level has become somewhat
reduced. Their variations and fluctuations are outlined in Table 5, but still indicate a
convergence to a tightening and levelling of standards over time.
Correspondingly, overall, the PESs performed increasingly well, indicating improvement
in the achievement of these Overall Standards.
However, of particular significance, some PESs fell back on various Overall Standards.
East Midlands suddenly achieved only 94.5 per cent for OS4 in 1993/94, falling from 100
per cent in the previous year. London saw sudden falls in OS8 and OS5 to 87.5 per cent
and 77.8 per cent respectively. Yorkshire saw a sudden fall in the achievement rate of
OS2 in 1993/94 to 89.5 per cent, and of a greater magnitude, the achievement of OS1a of
Hydro-Electric gradually fell from 96.1 per cent in 1991/92 to only 76.6 per cent in
1995/96, and increasing again the following year.
Data for 1999/00 indicate greatest fall-back for Northern, in which the achievement of
OS7 was 94.4 per cent, OS5 was 93.8 per cent and OS8 only 89.4 per cent. This is
particularly significant, as many of the Overall Standards were increased by OFGEM to
100 per cent in the latter years.
Some surprising indications are manifested in the latest dataset of 2000/01. In the case of
East Midlands, Eastern and Southern, these are attributable to the large decrease in the
achievement percentage levels of OS1a, from 89.9 to 84.8, 93.8 to 91.1 and 92.2 to 89.1

19
percentage points, respectively. Other sharp falls in the achievement percentages can also
be attributed to Eastern, London and NORWEB for decreases from 100 to 95.3, 99.4 to
79.6, and 99.3 to 92, respectively for OS2. The worsening of the percentage levels of OS2
is depicted in the industry average to fall in the year from 99.6 to 97.6 (see later). The
only substantive company improvement of OS1a (of the magnitude as large as about 1%)
can be attributed to Manweb (from 87.5 to 88.1) and SWALEC (from 89.3 to 91.4).
A different method of evaluating the effectiveness of the Overall Standards is to consider
the number of OS’s that have not been achieved by each PES in each year. It is also of
interest to consider, in such instance, which OS is unachieved and the percentage by
which there is underachievement. Further, by considering in juxtaposition the pattern of
failure rate with the pattern of actual level of achievement, the overall “true” performance
of each PES is explored. Refer to Table 6 for these details.
Thus, in considering the overall volume of PES unachieved Overall Standards, a pattern
seems to be apparent. A general “pattern” is indicative across the PES, that initially there
were a high volume of failures to achieve the Standards when they were first introduced,
but gradually the achievement rate improved, with fewer failures, to an optimal level in
1997/98. In 1998/99, the regulator put all, except one, of the Overall Standards to 100 per
cent, and the number of failures increased again in that year, albeit not as many as the
earlier years, and gradually, the PESs have become acquainted with the higher required
levels and the failure rate appears to begin to fall thereafter, despite a sudden rise in
2000/01.
In the case of the 2000/01 data, not even the relaxation of OS1b can curtail the increases in
unachieved Overall Standards. From this, there is a slight indication of the re-emergence
of a growth in the volume of unachieved Overall Standards, as indicated in Figure 10.
The increased volume of failures in 1998/99 does not imply a fall in the actual level of
performance of Overall Standards, but rather a higher standard to achieve. This is
evidenced by the examination of a graph of average PES OS achievements. It is clear that,
with the exception of the performance of OS4 falling to 92.8 per cent in 1996/97, the
average performances of all the Overall Standards have increased over time, and did not

20
worsen in the years of 1998/99 and 1999/00, despite increases in the rate of failure to
achieve the increased standards.
Generally, the highest number of failures to achieve the Standards across the PESs is
Midlands, especially in the years 1992/93 and 1993/94, but an improvement is seen
thereafter. Throughout the time period, the greatest number of failures seems to be for
OS1 and OS8. The PESs which have experienced the least number of failures are
SEEBOARD, South Western, Southern, SWALEC and Yorkshire.
However, in considering the average OS actual performances of Midlands, SEEBOARD,
South Western, SWALEC and Yorkshire (Figure 11), it is clear that the average
performance of Midlands is actually not worse than that of the others. In fact, it
performed better than South Western in the earlier years, and subsequently outperformed
SEEBOARD and SWALEC. This incongruity with data on unachieved Overall Standards
is due to different predetermined levels of required Standards. By reference to Figure 12,
as the average level of Overall Standards required for PESs have increased at an active
rate for all the standards, it is not surprising the companies find it difficult to achieve the
standard required.
A summary of OS failures, depicted in Table 6, indicates that since the introduction of 100
percentage required levels in all but one of Overall Standards in 1998/99 (see Figure 13),
all the PESs have at least one failed Standard since then. However, the pattern indicates a
fall in this number of failures.
In considering the percentage by which the Overall Standards are unachieved by each
PES, three classes of the same discussed “pattern” (as the volume of unachieved OSs)
seem to become apparent: very obvious, moderately obvious, and where there is no
pattern.
The three PESs in which the “pattern” is most obvious are Eastern, Midlands and
Manweb. In the case of Eastern, the number of and percentage by which the OSs are
unachieved are very high, and low in the latter years. This is the same for Midlands, but
for OS1a for which the Standard was not raised to 100 per cent in 1998/99, which per se
seems to gradually follow the same pattern. In the case of Manweb, the percentage by

21
which the OS is not achieved is greater in the latter years. These are indicated in Figures
14, 15 and 16.
Note that there are PESs which experience this same pattern, but only in a limited way, ie,
where only one or two of the Standards follow this pattern. These are SEEBOARD,
Southern, SWALEC, and Yorkshire. South Western’s only failed to achieve two
Standards in the latter years.
The PESs which show a strong resemblance to the general pattern are as follows. East
Midlands has a high percentage by which it has missed the achievement target on, inter
alia, OS4 for the years 1993/94 and 1998/99. London failed by 22.2 per cent in 1998/99 to
achieve the Standard for OS5. However, this was not due to a sudden excessive rise in the
required Standard, as the compulsory 100 per cent is only 2 percentage points greater than
the previous year’s 98 per cent required target. Northern’s performance indicates a fall in
the early achievement of OS8, since 1995/96, and further exacerbated by the 1998/99
increases in the Standards levels, inter alia. Norweb and ScottishPower follow similar
performance patterns; they both only fail to achieve a few Standards in the earlier years
and none as they have become acquainted with the Standards, but then fail again to
achieve a few Standards when they have arisen in the latter years.
One PES, Hydro-Electric, seems not to follow the pattern at all (see Figure 17). It had
failed to achieve the performance level in OS8 in the first year by 10 percentage points,
but recovered by 1993/94. There was a one-off failure to achieve OS2 by 5.1 per cent in
1992/93. There were also failures to achieve OS7 and OS1b in 1995/96. These
disappeared by 1996/97, but reappeared with OS7 and OS4 in 1998/99 at the introduction
of the 100 percentage levels.
Again, the 2000/01 data indicate a number of particularities which diverge from the
“patterns” of performance. The first is the recognition that East Midlands has
underachieved OS1a by 5.2 per cent (only 0.1 per cent in the previous year). Second, the
percentage of miss-rate for NORWEB and London has increased from 0.7 to 8.0 and 0.6
to 20.4, respectively. Thirdly, the 2000/01 data raise fears for the increasing size of
underachievement percentage rates of OS7 for Southern, South Western, SEEBOARD and
Yorkshire, with increases from 0.9 to 2.2, from 0.5 to 0.8, from 1.5 to 2.6 and from 1.2 to

22
2.4, respectively, and for these companies, the growth of OS7 underachievement
commenced in 1997/98 with the introduction of cross-the-board 100 per cent attainment
targets.
Required Levels of Standards, Penalties and PES Performance
Of particular significance is the connection between the performance of aggregate PES
Guaranteed Standards (for which Industry values are considered) and the predetermined
required level of each Guaranteed Standard, and secondly the connection of that with the
penalty payment levels. For these purposes, the graphs for the electricity supply industry,
changes in the level of required standards per OS and the changes in the penalty payments
per OS are considered. As the changes in the required performance level per OS and
penalty payment per OS are predetermined, and predominantly at the same time, there is
no need to consider any connection between them. Note that, for simplicity purposes, the
penalties considered in direct comparison are for domestic consumers only.
The overall pattern of the industry performance of the Guaranteed Standards indicates a
general improvement in quality over time. These patterns are more particular in the case
of keeping appointments (GS9), estimating charges (GS4), domestic disconnections and
the general level of complaints. However, some Standards have not performed well,
particularly in the latter years. These include the restoration of supply (GS2), responding
to customers (GS8) and the notification of payment required for the failure of the Standard
(GS10).
Generally, the required levels of performance have tightened across the board, particularly
in the latter years. However, responding to customer queries (GS8) was tightened from 10
to 5 working days in 1993/94, while others such as GS4 and GS7 were tightened in
1998/99 and GS2 in 1999/00. Nonetheless, notice of supply interruptions (GS5) was
relaxed permanently from at least 2 days’ notice to 5 in 1998/99. These industry
comparisons can be shown by Figures 18, 19 and 20.
Comparing the industry performance with the tightening of the Standards, it is interesting
to note that the poorly performed Standards of the latter years do not reflect the
performance level of those which have been tightened in the latter years. Thus, it is
23
unclear why GS8 and GS10 have performed so poorly in 1999/00. Similarly, in spite of
the tightening of GS4 and GS7 in 1998/99, these have still performed well throughout the
time phase.
The corresponding predetermined penalty payments generally have increased over time.
The bulk (GS1, GS5, GS6, GS7, GS8, GS9 and GS10) were increased from £10 to £20 in
1993/94. GS2 was increased twice, from £20 to £40 in 1993/94 and again to £50 in
1997/98. Of extreme interest is the rise and fall in the penalty payment for GS3; this rose
from £20 to £40 in 1993/94, and was reduced back to £20 again in 1994/95, where it has
remained since.
Although the size of penalty payments is increasing over time, with improved various
industry Standards, it still cannot be concluded that these are directly linked. This is
because there are some poor performers in the latter years, and there has not been any
reduction in the penalty payments in the latter years. Similarly, it cannot be implied that
the poor performances of Guaranteed Standards of the Industry are related to the changes
in the amount of compulsory penalty payments. The size of penalty payments changes too
infrequently to suggest any direct effect on the performance in the industry.
2.2 ELECTRICITY DISTRIBUTION
Presently, also covered by the same provisions of supply in the Utilities Act 2000,
electricity companies must make available data regarding the performance of the standards
on the distribution of electricity to the customers. The main publication by OFGEM
which produces data on the performance of the companies on distribution is entitled
“Report on Distribution and Transmission System Performance”. Much of the data
contained in this paper come from the reports of 1999/00 and 2000/01 (OFGEM, 2001d;
2002b), as these data were made available online for these two years too.
The opening paragraph of the 1997/98 Report (OFFER, 1998c: p.1) states that:
“All licensees who operate transmission or distribution systems are required to report annually on their performance in maintaining system security, availability and quality of service. This information provides a picture of the continuity and quality of supply experienced by final customers. Information is now available for each of the years since Vesting … [The] report

24
continues to incorporate year-by-year comparisons to help identify trends in companies’ performance.”
The format of this report varies little from year to year, but due to the introduction of the
Information and Incentives Project (IIP), operational since April 2002, the 2000/01 is the
last of the traditional format, in order to ensure that “there is no gap in the published
information prior to the conclusion of the current review and publication of data for the
first year of operation of IIP” (OFGEM, 2002b: p.2)
This annual report opens with information on the overall security and availability of
supply, measured in terms of the number of interruptions and supply minutes lost,
experienced by customers connected to the distribution systems of the 14 distribution
companies, in addition to measures on restoration times achieved.
There is the statutory requirement on the transmission and distribution companies to
maintain voltage and frequency within prescribed limits, and the system operators must
report on incidents which cause excursions outside the prescribed limits for both
frequency and voltage. For the purposes of this paper, security will be considered by the
measurement of supply interruptions per 100 connected customers; availability will be
considered in terms of minutes lost per connected customer; and the quality of distribution
service in terms of the percentage of interruptions due to distribution faults that are
restored within 3 hours and within 24 hours.
General Patterns of Performance for Distribution Businesses
In view of the company performance for supply interruptions, generally, the evidence
indicates a gradual improvement over time. This is most obvious in the case of SWALEC,
with a gradual fall of customer interruptions (CIs) per 100 from 284.6 in 1990/91 to 152.7
in 1999/00. Some companies seem not to have improved in this Standard. London, for
example, although it has the best supply performance, has remained the same throughout
the years. In 1990/91, this was 40.68 and by 1999/00, this has only changed to 36.9, per
100 connected customer.
25
However, if the average of the industry is considered in greater detail, it is clearer that
there has been a huge improvement in this Standard over time. The average industrial
performance has fallen from 123.6 interruptions to 87.3 interruptions per 100 connected
customers, which indicates a high rate of overall improvement (as shown in Figures 21
and 22).
The same can be observed for supply availability. The range of customer minutes lost
(CMLs) per connected customer is extremely wide, and is difficult to observe an obvious
improvement in the service. Of particular significance is the extremely poor standard of
East Midlands and Midlands in 1991/92, with 1003.9 and 397.8 minutes lost per customer,
respectively. Nonetheless, in view of the average performance, it is clearer that there has
been a gradual improvement over time, and that the unusual poor performance in the
opening year is predominantly due to that of East Midlands and Midlands.
The quality of service aspect is measured by the percentage of faults due to distribution
faults not being restored within 3 hours and 24 hours. Thus, a fall in the pattern would
indicate an improvement in performance over time. In both instances, there were wide
ranges of performances across the companies. Of particular interest was the extremely
poor performance in 1992/93 of East Midland in both cases, being 35.2 and 16.5 for non-
restoration within 3 hours and 24 hours, respectively. Correspondingly, this raised the
average performances of the two time bands for 1992/93 from 14.3 per cent and 0.8 per
cent to 16.5 per cent and 1.82 per cent, respectively. By 1999/00, the performances
improved to only 9.45 per cent and 0.00 per cent, respectively. However, although the
2000/01 data show improvement from the very first sets of data, compared to those of
1999/00, there were slight increases in the percentage of resolutions not met within 3
hours. Still, this presently raises fears about possible future patterns of worsening
performances. These trends are shown in Figures 23 and 24.
Under the existing system of guaranteed and overall standards, the evidence indicates
acceptable improvement over time. However, quality of customer services is really only
one facet of their purpose. The introduction of the Information and Incentives Project
(IIP) initiated to address some of the weaknesses associated with the existing price
regulation framework. In this, inter alia, it attempted to “strengthen the incentives on the
electricity distribution companies to deliver the agreed quality of output and to value better

26
changes in the quality of output” (OFGEM, 2001c: p.1). Although this paper does not
provide sufficient scope to incorporate all details of the IIP, it must be noted that analyses
of electricity distribution performance measures have thus become difficult.
2.3 ELECTRICITY TRANSMISSION – The National Grid (NGC)
Under the original Electricity Act 1989, the Director General of Electricity Supply has
various powers and duties to carry out a number of functions, particularly in a manner he
considers best calculated to secure that all reasonable demands for electricity are met, that
licence holders are able to finance their activities, and to promote competition in the
generation and supply of electricity. Furthermore, this includes additional duties to protect
the interests of consumers, to promote efficiency on the part of transmission and supply
licence holders and the efficient use of electricity. Section 9(2) of the above Act provides
for holders of Transmission Licences to develop and maintain an efficient, co-ordinated
and economical system of electricity transmission, and to facilitate in the supply and
generation of electricity.
Note that in the context of NGC, under Condition 12(2) of the Transmission Licence, it
shall “… draw up and submit to the Director for his approval a statement setting out
criteria by which the performance of the licensee in maintaining transmission system
security availability, and quality of service may be measured”.
There are three transmission licensees in Great Britain: The National Grid Company
(NGC), and two Scottish companies, ScottishPower and Hydro-Electric. Specific
measures for NGC are included later in this report.
NGC is not only the sole possessor of a licence to operate the national grid that transmits
electricity at high voltage from generators to the Regional Electricity Companies’ local
distribution networks, but it is also responsible for scheduling and co-ordinating power
flows across the interconnectors between England and Scotland and the UK and France.
Thus, it is required to maintain an efficient, co-ordinated and economical system of
electricity transmission, and to facilitate competition in the generation and supply sectors.

27
The Grid Code and Condition 12 of the NGC’s Transmission Licence sets out limits or
security standards with the purpose of maintaining system security and quality of supply
on the NGC system, and ensuring that generation capacity is matched with demand,
voltage and frequency, and the flows are contained within the thermal limitations of the
NGC system.
Data on performance measures, specific to NGC, are reported and published in a yearly
report (NGC, 2000), in which system performance is monitored by reporting monthly
variations in system availability, together with planned and unplanned system
unavailability. For the purposes of this report, only the annual amounts will be
considered.
Here (see Figure 25), system availability is defined as the total hours each circuit is
available, as a proportion of the product of the number of circuits and the number of hours
in the period. Overall, the graph of average annual system availability and winter peak
system availability indicates a general rise in the achievement of this standard over time.
The rates at which these two performances are improving are very similar.
The NGC Transmission System has interconnections with France and Scotland.
Interconnector availability is the measure which indicates the level of availability of the
transmission system interconnectors at the geographic boundaries of the transmission
systems.
The pattern of the French Interconnector annual availability indicates a gradual
improvement in the standard (see Figure 26). However, interestingly, the Scottish
Interconnector’s performance fell at first instance from 95.7 per cent in 1990/91 to 86.2
per cent in 1993/94, but had improved in the following year to 98.6 per cent and remained
at a level above 95 per cent.
NGC monitors and reports on the security and reliability of the Transmission System in
terms of the loss of supply incidents and estimates of the total energy unsupplied for the
year. Performance is monitored by total estimated energy unsupplied from the NGC
system for each incident and the average incident duration. An incident is defined as “any
system event which results in a single or multiple loss of supply” (NGC, 2000: p.11). The

28
average incident duration is measured by the estimated total energy unsupplied (in MW
mins), over the total of MW lost.
There has been enormous improvement in NGC’s performance of average unsupplied
energy per incident against the estimated unsupplied energy, between 1990/91 and
1991/92. The average incident duration has also generally fallen, indicating improvement
in the standard, as indicated in Figure 27.
To ensure the quality of supply, the Electricity Supply Regulations permit variations of the
voltage up to 10 per cent above and below the nominal at 400kV, 275kV and 132kV, and
not exceeding 6 per cent at lower voltages. The Standard by which this is to be measured
is when voltage excursions have exceeded 15 minutes. Similarly, the Electricity Supply
Regulations permit variations in frequency up to 1 per cent above and below 50Hz. This
is measured when the frequency excursions are for more than 60 seconds.
NGC’s performance on these measures is particularly good, as there were only two years
in which voltage excursions occurred. There was one in 1992/93 and two in 1997/98.
Similarly, there were only in 1991/92, 1992/93 and 1993/94, one, one and four cases
respectively of frequency excursions, and another three in 1995/96.
Summary & Implications
It seems that the service standards in the electricity industry are very well segmented,
considering carefully many related areas believed important and valued by customers.
The Guaranteed and Overall Standards system applied in the electricity industry is the first
of its kind, although these may subsequently have been brought into other utility
industries.
Generally, the performance of the PESs against the GS and OS scheme has indicated
strength and confidence in this performance measurement system. In most cases,
particularly where guaranteed supply standards have been tightened and penalty payment
sums have increased over time, the improvement has been incredible and repetition of this
in other industries is much desired. Of particular interest was the introduction of
compulsory 100 percentage levels of achievement in Overall Standards, which led to a
29
marked increase in the number of PESs not achieving these, as well as the increase in the
number OSs which the PESs are not achieving. This happened in parallel with actual
trends that indicated improvement in the percentage achievement of the Standards. This is
a clear suggestion that the performance measurement system here is a problematic one. If,
for instance, all PESs should meet all the required OS levels, there could not be any future
indication of “improvement”. A good performance measurement system should strive to
achieve this.
3.0 WATER & SEWERAGE SERVICES
As with the privatisation of the electricity industry, the water and sewerage companies
must be accountable for the manner in which services are provided to customers. Much of
the literature suggests that, at the time of privatisation, the water industry still had its
monopoly position intact, urging for a greater impetus to beckon forth effective
development of a system of performance measure that can ensure a competent level of
service to customers.
Ogden and Anderson (1995) outline the state of customer representation in the water
industry prior to privatisation. Although they outline the original White Paper on water
privatisation and the government argument that it would be more efficient at providing
water services under market conditions, there is still a need to regulate in order to ensure
the quality of customer services when privatised.
Prior to 1973, customer representation in the water industry was conducted via local
authorities which also provided the water services; in 1973 this representation was passed
over to the regional water authorities, and according to Ogden and Anderson (1995:
p.539), in 1983, “customer representation gain[ed] a distinct identity”, whereby consumer
consultative committees (CCCs) were formed. Subsequently, a unique system of
performance measurement that governs the quality of customer services that still exists
today were established. The focus of attention in this paper is on the current performance
measures in the regulated water industry.

30
This section of the paper essentially explores the wide scope of performance measures in
the water industry, and the approach will predominantly rely on data provided in the water
regulator, OFWAT (Office of Water Services) published report, presently entitled “Levels
of Service for the Water Industry in England and Wales” (OFWAT, 2001a). A brief
outline of the evolution of these Standards, penalty payments required for water company
defaults and the significance of what can be inferred from these findings are all considered
in this paper.
Evolution of “DG” Standards
The first Report on the non-financial performance measures in the water industry was
entitled “The Water Industry of England and Wales: Levels of Service Information,
1989/90” (OFWAT, 1990). In this, it was clearly outlined that “the Companies” are
required under “the Licence” (the terms of the Instrument of Appointment) to report on a
series of specified Levels of Service Indicators. The collection of this information was
intended by OFWAT to (a) provide customers with information on their service
companies’ problems and performance; (b) enable the companies to demonstrate now and
over time the effectiveness of their operational and investment programmes and their
management of these vital services; and (c) enable all involved in the industry to compare
the relative level of service provision across all the companies (OFWAT, 1990: p.1).
The Director General of Water Services monitors and regulates the companies under the
Water Act 1989, and considers the data provided in this review. “By considering levels of
service improvements over time and in combination with other physical and financial
information … the companies, their customers and shareholders, and the financial markets
will be able to make performance and efficiency comparisons” (OFWAT, 1990: p.1), even
if the indicators are not truly performance or efficiency measures themselves.
The original set of service indicators in the 1989/90 Report (OFWAT, 1990: p.3) involved
eight primitively defined standards, simply known as DG Standards (Director General),
the numeration, nomenclature and scope of which were modified over time. Table 7
outlines the original set of DG Standards.

31
It must be noted that the data collected to form the first report were not always collected
on common definitions or based on proper systems of records with clear reporting links
back to real events (audits). Essentially, the guidelines on the reporting of levels of
service information were not finalised until June 1990, so individual companies had
different methods of reporting. Caution must be applied when using the 1989 data for
purposes of direct comparisons.
The 1990/91 report on customer services (OFWAT, 1991) indicated that DG4 became
“Water Usage Restrictions”, instead of “Hosepipe Restrictions”. Of quintessential
importance, in July 1991, the Director General had deleted the 1989/90 definition of DG8
because it was believed this indicator was not a relevant level of service parameter as
Local Planning Authorities had adopted different consultation practices which seriously
impaired the data.
The 1991/92 report on customer services (OFWAT, 1992) introduced a system of
confidence grades for presenting the data of the 1991 reporting year, based on data
reliability and data accuracy. The 1990/91 Report, presently entitled “Levels of Service
Report for the Water Industry of England and Wales”, noted that: “… because of concern
about the quality of information provided … OFWAT required the companies … to give
confidence grades to the information provided [and] the information is audited by
independent certifiers who have given an objective and expert opinion on these confidence
grades” (OFWAT, 1991: p.4).
The 1992/93 report on customer services (OFWAT, 1993a) provides changes to the DG
standards, adding specificity of requirements to them, as follows:
DG1 Population at risk of water shortage DG2 Properties at risk of low pressure DG3 Properties subject to unplanned supply interruptions of 12 hours or more DG4 Population subject to hosepipe restrictions DG5 Properties at risk of sewer flooding DG6 Billing queries responded to within 20 days DG7 Written complaints responded to within 20 days
This was the first year in which a comprehensive set of data was included for the previous
years’ performances. Four specific categories of performance were recognised:

32
• Response to customers – DG6 and DG7; • Reliability of water supply services – DG2 and DG3; • Adequacy of water resources – DG1 and DG4; and • Sewerage services – DG5
Although these standards were confirmed in the report, data for DG1 and DG4 were
excluded due to influences by climatic and weather patterns, for that year’s publication.
DG5 was also excluded because the data were only applicable to 10 of the 32 companies.
Similarly, the data for these three DG standards were excluded again in the 1993/94
(OFWAT, 1994) report, with additional doubt regarding the consistency of the information
reported. The definition of DG1 had been changed to “Population at risk of water
shortage” in the 1994/95 customer services report (OFWAT, 1995), although data for
DG1, DG4 and DG5 were not included in the Report, due to inconsistencies in the data
collection process. The 1995/96 customer services report (OFWAT, 1996) marked a
significant change in the DG standards. DG1 was removed, and DG4 was renamed as
“Water Usage Restriction”. Furthermore, two new standards had been established:
DG8 Bills of Metered Customers DG9 Ease of Telephone Contact
DG8 shows the percentage of customers who receive at least one bill during the reporting
year based on an actual meter reading. These can either be company or customer
readings! DG9 concerns the ease with which the customer can contact the water company.
Telephone traffic is monitored, and the response timing in bands of 15, 30 and exceeding
30 seconds. The data taken into consideration by OFWAT include: total calls received on
customer contact lines; total calls answered; calls answered within three time bands
(within 15, 30 and exceeding 30 seconds); average time to answer calls; abandoned calls;
and when all lines are busy. For consistency, for the purposes of this paper, the data
utilised refer only to that of telephone calls answered within 30 seconds.
The 1996/97 customer services report (OFWAT, 1997) shows changes in the standards of
the DGs. DG6 had been reduced to billing contacts not responded to within 5 working
days (previously 20) and DG7 had been reduced to written contacts not responded to
within 10 working days (previously 20). Unfortunately, the data only exhibit these in

33
percentage form. Thus, for consistency, the latest publication (OFWAT, 2001a) was
consulted for the purposes of this paper, which includes performance data for DG6 and
DG7 from as far back as 1990/91.
In 1997, the National Audit Office also reviewed the quality of services provided to
customers by the water industry (NAO, 1997), and found that these have generally
improved since the privatisation of the industry. However, it suggests that the customers’
satisfaction with the quality of services provided was insufficiently monitored, and
recommends greater use of targets for the regulation of quality services, that OFWAT
should set up best practices toward which companies should aspire, and conduct further
research for up-to-date information on customer satisfaction.
Since 1997, the DG standards have not changed much. DG5 was, in the 1998/99 customer
services report (OFWAT, 1999a), known as “properties at risk of flooding from sewers”,
but, in the 1999/00 report (OFWAT, 2000), as “properties at risk of flooding from sewers
(once in ten years)”. All other standards remained the same.
Nonetheless, it seems that OFWAT has taken up the advice of the NAO (1997) and
furthered research into customer satisfaction, and published jointly with the Ofwat
National Customer Council (ONCC) findings from a survey on the satisfaction with
service provided by local water and sewerage companies (OFWAT, 2001b). Among other
things, this survey report indicated 90 per cent general satisfaction with customer services
received, and two-thirds of customers reckoned with “value for money” for the water and
sewerage services received. The results also indicated a high level of satisfaction with
telephone handling, which explains the increasing improvement in this standard in the
latter years (see later). However, the customers saw dissatisfaction with the penalty
payment levels of the compensation scheme, Guaranteed Standards Scheme (GSS), and
this was one of the impetuses for the recent amendments (see later). The report also
played a persuasive role in the design and implementation of the new Overall Performance
Assessment (OPA) mechanism (see later for details).
Furthermore, the OFWAT Annual Report 2001-2002 (OFWAT, 2002a) announces that the
ten Customer Services Committees (CSCs) and the Ofwat National Customer Council
(ONCC) now work together under a new name, WaterVoice, which represents the

34
viewpoints of water customers. Further to OFWAT’s maintenance of the existing
standards of customer services scheme, WaterVoice conducts “regular audits of company
practices … supplementing the quantitative monitoring of service quality” (OFWAT,
2002a: p.16).
Data Collection Methodology for the Performance Trends
The 2000/01 Report on the level of services (OFWAT, 2001a) indicates only the
requirement for standards DG2, DG3, DG4, DG5 (three categories), DG6, DG7, DG8 and
DG9. The industry percentages are available for all these standards from 1990/91 to
2000/01. All the data used in the analyses, with minor exceptions, and contained in this
paper, were derived primarily and predominantly from those as published exactly in the
OFWAT service standard annual reports.
For consistency, the collection of individual company performance measures for the early
years of DG6 and DG7 were calculated. For DG6 (Response to Billing Contacts), the
percentages of two bands were summed for the value referring to responding within 5 days
for the years 1989/90, 1990/91 and 1991/92. Similarly, for DG7 (Response to Written
Contacts), three bands were summed for the percentage referring to responding within 10
days, for the years 1989/90, 1990/91 and 1991/92.
Note that the performance data of DG3 do not show any obvious pattern. This could be
partly due to inconsistencies in the reporting of the data. It must be noted that the data
refer to unplanned, unwarned interruptions to supply for greater than 12 hours. The sets
of performance data in the publications are not consistent. Instead, the numbers of
affected properties were calculated by using the 1993/94 figures, where the number of
properties affected in that year were divided by the percentage of properties below
reference level. The product of these two figures (a common factor) was multiplied by all
the other years’ data of percentages below reference level, in order to estimate the number
of properties. No performance was estimated for Bournemouth and West Hants because
the denominator was 0 in this method of calculation.

35
Achievement Performances of Companies on the DG Standards
By inspecting the performance levels of all the Standards in the industry overall, there is
sufficient evidence to suggest a general increasing improvement for all the companies.
This is further evidenced by the general decrease in the number of guaranteed payments
being made over time and particularly in the latter years.
The graph of overall industry performance (since 1990) indicates general improvement
pattern in all the Standards (Figure 28). Of particular significance is the poor performance
of DG4 (Hosepipe ban) in 1995/96, at a rate of 39 per cent, from a previous rate of only 3
per cent in the previous year. Similarly, there is a gradual improvement in DG7, but for
the unusual poor performance at 24.1 per cent in 1993/94.
Considering the performance of the individual Standards, it seems that three have
demonstrated a smooth and obvious improvement in the performance of all the companies
throughout the years.
Firstly, the company performances for responding to written contacts (DG7) is particularly
good, as there is a clear convergence to a percentage level of above 90 per cent by
1997/98, where it remained. Of particular interest is the performance of Anglian, as the
rate fell from a growing high, from 90.7 per cent to 50.7 per cent in 1993/94, and a jump
back to 97.7 per cent in the following year. Bristol was originally the poorest performer,
with a performance level of only 25.1 per cent in 1989. Interestingly, this level improved
very quickly to 30.9, 61.3 and 97.5, in the respective years 1991/92, 1992/93 and 1993/94.
Figure 29 exhibits clearly these patterns.
Second, the Standard for response to billing contacts (DG6) performed increasingly well,
with a gradual overall improvement to levels above 90 per cent by 1998/99. In this
Standard, the original worst performer was Severn Trent, with 40.9 per cent in 1989, but it
improved dramatically in 1992/93 jumping from a level of 45.5 per cent to 83.3 per cent.
Other companies saw sudden unusual slumps. Bristol, for example, suddenly fell from 76
per cent to 53 per cent in 1991/92, and increased again to 72 per cent the following year.
In the case of Mid-Kent, in 1994/95, the Standard had fallen from 77.4 per cent to 61.1 per
cent, and back up to 97.3 per cent the following year. Similarly, for Essex and Suffolk,

36
the peak of its performance was the 71.3 per cent in 1996/97. For these, it is reasonably
justifiable to suspect measurement error. Figure 30 indicates these patterns, although very
clearly a convergence of overall improvement is also clear.
Thirdly, the Standard for bills for metered customers (DG8) saw good improvements (see
Figure 31). Initially, the poorest performer was United Utilities, with only 90.8 per cent in
1989, but this made a sudden improvement in 1997/98, jumping from 92.9 per cent to 98.1
per cent. Northumbrian also slumped in 1997/98 to 96.7 per cent, and Essex and Suffolk
again in 1996/97 to 96.9 per cent from a previous 100 per cent achievement in this
Standard. Of great significance is the performance of Severn Trent in 2000/01, which fell
from 99.5 per cent in 1999/00 to 96.7 per cent.
However, it is particularly interesting to note that despite the fluctuations in the
performances of this Standard, the general performance level is high (above 90 per cent) in
all cases. Furthermore, although this Standard is a new one, the starting levels are as high
as the Standard’s counterparts of the same year, vis-à-vis the levels of those Standards of
equal effectiveness in 1989/90. This suggests across-the-board ability to perform well.
It is interesting to see (from figure 32) a fall in the general number of properties at risk of
flooding from sewers (DG5). This Standard measures the effectiveness of the companies’
control over inevitable effects, such as the weather. This pattern is less obvious, but still,
there is a convergence to a low rate of flooding. In this measure, of particular interest are
Thames and Dwr Cymru. The former experienced a rise in the number of properties at
risk of flooding from 30 in 1989/90 to 180 in 1990/91, and generally falling thereafter.
The latter experienced in 1993/94 a sudden increase from 36 to 180, and a fall again the
following year to just 28.
In contrast, there are Standards which do not indicate obvious improvement in the level of
company performance over the years. In the case of ease of telephone contact (DG9)
being a relatively new Standard, performances are difficult to compare (see Figure 33,
which shows that only 5 years’ data are available). Nonetheless, there was a fall in the
Standard achieved by South East Water in 1999/00, from a level of 96.5 per cent the
previous year to 68.6 per cent, and an improvement back to 74.5 per cent the following

37
year. Mid-Kent performed well since the establishment of the Standard in 1996/97, but
fell dramatically in 2000/01 from 87.4 per cent to 50.6 per cent.
Finally, two Standards have demonstrated difficulty in tracking their pattern of general
performance. The first is the pressure of mains water (DG2) and the second, unplanned
interruptions to supply (DG3). In the former (Figure 34), Tendring Hundred had
performed extremely poorly, which distorted the overall “picture” of industry performance
of this Standard. These were as high as 45.7 and 45.1 connected properties below
reference level in the years 1990/91 and 1991/92 respectively. In the latter (Figure 35),
the incomparability of the data was predominantly due to the OFWAT reports changing
format over the years of publication. Thus, instead of simply lifting published data from a
range of options, only unplanned, unwarned interruptions to supply for greater than 12
hours could have been and were considered, for which the number of properties
experiencing this problem was calculated/estimated for the entire year range, using the
explained methodology. In this, Thames had a particularly high value of 217,001
properties in the first year, which distorted the “picture” of overall industry performance.
However, in order to establish a clearer picture for both these Standards, averages were
monitored, and these show a slight pattern of improvement over the years. This is of
particular importance in the case of interruptions, as it indicates a gradual improvement in
the ability to control unexpected interruptions across the industry.
In observing the average graphs, it is very indicative that the unusually poor performances
of the two Standards (by the specific two companies) have strongly influenced the average
performances in the same years.
Penalty Payments – the Guaranteed Standards Scheme (GSS)
Separate to the taxonomy of DG Standards, customers are entitled to guaranteed standards
of service, as laid down by the Government, and the penalty payments which the
customers are owed in the event of these levels not being met is known as the Guaranteed
Standards Scheme (GSS). For this reason, the issue of penalty payments is considered at
the end of this section of the paper, and not directly with the evolution and performance of
the DG standards. The scheme is applicable to all customers, including potential

38
customers and those in debt. The numbering of these refer specifically to the table of
GSSs (Table 8), and not that of the DG Standards.
According to a review on the compensation for customers by OFWAT (1999b): “when the
scheme was first introduced in 1989, compensation payments were £5 [and] in 1993, they
were increased to £10 and the scheme was extended to include business customers as well
as household customers”. Payment levels were altered again for September 2001, and
these current levels are outlined in Table 8.
Due to the few changes in these levels, it is difficult to compare them in juxtaposition with
the changes to the actual performance levels by the companies of the DG standards.
When the first set of DG Standards were established by OFWAT, there were also
intentions to establish “no-nonsense compensation schemes” to protect customers who
received particularly poor standards of services, although these would not replace their
statutory rights. These did not intend to cover all possible eventualities, nor would they
preclude water companies from running compensation schemes that extended further than
the minimum payments set out in this system.
Originally, the GSS elements did not warrant automatic payments. The 1992-93 Report
on the levels of services (OFWAT, 1993a) stated that “from 1 April 1993, billing queries
and written complaints not actioned within the required timescales attract an automatic
payment from the company of £10 [which] should provide companies with an incentive to
reduce further the number of delayed letters and in doing so improve overall service to
customers” (p.12).
The 1998/99 annual report (OFWAT, 1999a) outlined that “all ten water and sewerage
companies now have systems in place to automatically reimburse annual sewerage charges
to all customers whose properties suffer from internal flooding from sewers [which] goes
beyond the statutory requirement that requires customers to claim rebates of sewerage
charges … Ofwat will shortly place before the Secretaries of State … proposals to extend
the GSS … [for] wider use of automatic payments, and tightening existing standards to
reflect current performance levels” (p.8).

39
In 1999, a more enhanced GSS system was introduced, in which the following categories
were added:
- telephone appointments now attract the automatic payment - automatic payment if companies fail to provide adequate warning of a planned
interruption or if interruptions run over the allocated time - sewerage companies are required to reimburse annual sewerage charges to all
customers whose properties suffer internal flooding from sewers, and the limit on payment of this standard has been removed [although put back in 2001 to a maximum of £1,000].
Summary & Implications
The development of customer service performance measures in the water and sewerage
industry has been somewhat erratic, with the establishment of some DG standards, the
removal of some and the addition of more. These were then followed by some degree of
tightening, some redefining and some modification in the way they were presented. In any
case, when a uniform “currency” of performance data is made existing, be it calculated or
readily available, this has indicated improvement for most companies for most standards.
This is without doubt for the Standards of responding to billing contacts and responding to
written contacts. These can only bring forth, firstly, the why question, and secondly, the
how.
The performance measurement system will remain be the focus of consideration, and in
the event of the why and how question not being justifiably answered, doubts would be
raised over whether this system is an effective one. The performance of standards
improving at the speed of response to customers unnecessarily infers any true
improvement in the quality of each response. For instance, in the case of telephone
response, a customer who is transferred across five call-centres to resolve a problem
would have had his call responded to within 30 seconds, but unnecessarily the response he
had desired nor of the quality he had anticipated.
Unlike that of the electricity GS and OS schemes, the compensation scheme available to
the customers operates separately to the DG Standards. Because of this, it is difficult to
explore whether there is any direct connection between the changes in the GSS

40
compensation scheme and performance of the water companies based on the GSS System,
or whether it is just due to the readjustment of the DG standards required.
4.0 TELECOMMUNICATIONS – Comparable Performance Indicators
The intention of this section is to outline the evolution and state of performance measures
in the telecommunications industry, since privatisation of British Telecommunications
(BT) and the creation of the telecommunications industry regulator, the Office of
Telecommunications (OFTEL). Due to the numerous mergers in this industry and the
associated tracking down of changes in the companies, the feasibility and effectiveness of
performance measures data for comparison purposes across companies are very difficult to
obtain, as outlined in CPI (2001). For this reason, only two are briefly considered for the
purposes of this paper: BT and Kingston, due to the long-established history of the
companies.
The section presents material by outlining the background behind telecommunications
service standards, defining what these mean. It then explores briefly how these have
evolved and performed since they were first established.
Background Information
Under the Telecommunications Act 1984, companies are obliged to produce a Code of
Practice for the establishment of standards of customer services. However, rather than the
Director General establishing set standards, OFTEL has encouraged the industry to
develop for itself a set of comparable performance indicators. Accordingly, in 1993,
performance indicators common across the industry were established to monitor the
quality of service to residential and business customers. Physical preparation for the data
collection process was originally left to the individual operator companies, and
commenced in late 1994. The first dataset was collected for the last quarter of 1995.
Furthermore, the European Directive on the application of open provision to voice
telephony (Directive 95/62/EC) identifies information and various standards on
telecommunications required across Europe. These include: supply time to install, fault

41
repair time, fault reports, operator services, payphones, billing, and network performance.
These measures are intended to allow customers to compare performance on a like-to-like
basis between European members. Although the individual companies collect such
information, each European member is likely to offer different interpretations of these
quality measures, rendering them inconsistent across Member states.
Since then, the responsibility of assembling the data in the UK was left to a third party
incumbent, PE International and several consumer bodies, with support from OFTEL, and
twice-yearly statistics on these performances are now published.
For the publication of the data, the companies providing the telecoms services are
separated into three categories: directly connected switched services, where there is a
direct link between the exchange and customers’ premises; directly connected dedicated
services, for business customers only; and indirectly connected services for the companies
which do not provide a direct link to the customers’ premises.
The original Comparable Performance Indicators (CPIs), when first established in 1995,
fell into five main categories, for which particular measures were specified. Table 9
provides details of these performance measures.
It seems that the performance indicators used in the telecoms industry are less rigid than
those of the water and electricity industries. These measures are not numbered as they are
for water (DG) and electricity (GS) standards.
Furthermore, OFTEL publishes lists of complaints and enquiries, and a breakdown of the
complaint categories. These include: disputed bills and other billing problems, bill
payment problems, charges, installations, numbering, payphones, phonebooks, privacy,
quality of customer service, quality of telecommunications service, rental, repair service,
network and discount services, general information request, and miscellaneous issues.
The report, “Telecommunications Companies: Comparable Performance Indicators” (CPI,
2000), provides information on the quality of service in a number of telecommunications
companies, but does not take into account their differences when considering the
performances. These may include: the specific area in which the company operates; size
42
of company; and age of company. It seems that the Industry Forum (made up of the main
fixed network telecommunications companies) has been applauded “for its work in
empowering consumers to make informed buying decisions”, and that “the CPI initiative
shows that the UK’s telecommunications industry is prepared to work together for the
benefit of consumers” (CPI, 2000: p.3).
The accuracy of the data is ensured by a two-staged process. First, these data are verified
by independent auditors on the basis of an audit procedure agreed by all the participating
companies. Second, a single independent body, the British Approval Board for
Telecommunications, agrees to a sufficient level of comparability in the application of that
audit process and results across telecommunications companies.
The auditors provide an opinion on the accuracy of the data provided, and the publication
of such data is agreed to be sound, within 3 per cent of each of the indicators submitted.
Where data are omitted by a company, or found to be insufficiently sound within the 3 per
cent accuracy boundary, or found not to fall within the agreed procedures, this value is
omitted in the report, and is specified.
Two main forms of quality are considered – the quantitative comparative performance
indicators and qualitative customer satisfaction surveys (conducted by independent
external agencies). CPI quantitative measures are the “hard” measures, as described, and
the qualitative measures are the “soft” measures of the customers’ perceived levels of
satisfaction with the overall or particular aspects of the service. At this point, it is
necessary to define what is understood by the definitions of quantitative measures, as these
are considered in this paper.
Definition of Comparable Performance Indicators
The development of the CPIs has matured at a lesser rate than that of its counterparts in
water and electricity. For this reason, it is necessary to clearly define what is meant by the
measures and how they are defined and calculated. The following are the performance
measures applied in the telecommunications sector, and the calculation of which brings
with it a great degree of specificity. Since their establishment in the last quarter of 1995,
the measures’ definitions have not changed, and they are as follows.

43
Service Provision represents the operator’s performance in fulfilling orders for the
provision of new services, or for changes to existing services, by the date committed by
the operator to the customer. It is a measure of how well the operator meets its
commitments. This is calculated as a percentage of the number of orders (commitment
made to a customer to provide a product or service or to effect a change in the service)
completed (when all items are available for use by the customer) on or before the date
committed to the customer during the period, over the number of orders completed during
the period.
Customer Reported Faults (the inability of an item to perform a required function
resulting in an impaired service) is the measure that indicates the level of the customer-
perceived reliability of the network service, measured by the number of customer-reported
faults per 100 direct customer lines, per quarter. This is calculated as a percentage of the
total number of customer-reported fault reports closed in the period, over the average
population of direct lines during the period.
Service Restoration is defined as that which represents the operator’s performance in
restoring service within the operator’s stated objective times (different for each operator).
Note that different reporting methods are permitted, depending on whether the operator
uses a system of appointments for agreeing visits to customer’s premises. Operators who
do not use appointments (meeting agreed with the customer where access is required to the
premises) may only (i) report the percentage of fault reports restored in objective time;
operators using appointments may choose to report in the same manner or choose to (ii)
report the percentage of non-appointed fault reports restored in objective time and (iii) that
for which appointments are made. The calculation for measure (i) is taken as the
percentage of the total number of fault reports restored in objective time during the report,
over the total number of fault reports restored during the period. Measurement (ii) is taken
as the percentage of total number of faults reported without specific appointment restored
in objective time during the period, over the total number of fault reports without specific
appointment restored during the period, is taken. Finally, measure (iii) is taken as the
percentage of total number of fault reports with specific appointment restored during the
period, over the total number of fault reports restored during the period, is taken.

44
Fault Repairs is the measure that represents the extent to which an operator is unable to
meet the objective restoration. This is calculated by taking the percentage of the number
of customer fault reports restored by objective time plus “x” hours in the period, over the
total number of fault reports restored in that period.
Complaint Handling is the measure that indicates the rapidity in the complaint process of
the operator, within a 20-day period. This is calculated by the percentage of the number of
complaints processed within 20 days, in the given quarter period, over the total number of
complaints processed during that same quarter. Note that all communications are
considered as complaints whether or not justified and by whatever means. Furthermore,
billing inaccuracy complaints are included in this measure, even when already considered
as a separate measure per se.
Billing Inaccuracy Complaints endeavour to measure the extent of perceived inaccuracy
of the information presented in the bills produced by the operator. This is taken as the
number of bill inaccuracy complaints received per 1000 bills issued. Of course, this
cannot truly measure the volume of inaccurate bills, as it deals with complaints only, and
also where there is a complaint, that complaint cannot indicate a true error on the bill.
This measure is calculated by taking 1000 multiplied by the number of billing inaccuracy
complaints received during the period, over the number of bills issued during that period
(not including repeat bills and final demand notices). Note that a billing inaccuracy
complaint is about the accuracy of the information on the bill, and not just the sum owing
by the customer; however, it cannot include other billing matters, such as the format and
frequency of the bill.
Evolution of the Comparative Performance Measures
The first set of data published in the last quarter of 1995 was purely quantitative and did
not report on the customer satisfaction aspect. Instead, these were included in the first
report of 1996 for the categories of service provision, fault repairs and complaint handling.
The customer service satisfaction was included for the billing accuracy measure in
subsequent publications. Note that data for the July publication of CPIs are unavailable
(out of print), and thus are omitted in the analyses of this paper.

45
In 1997, an average interval between faults measure was taken and put in the customer
reported faults aspect, measured in years. Also, the third quarter saw the introduction of a
new measure – service disconnection, which is calculated by the number of non-payment
per 1000 lines, measured as gross, or net (less reconnections made). Unfortunately, the
effectiveness of this measure is poor and data are not available for all companies. For this
reason, the data for this measure are excluded in this report.
Another measure was introduced in 1999, called the Repeated Reported Faults. These fall
within the category where the customer fault reports recur within 30 calendar days of the
resolution of an earlier same fault on the same line. The purpose of the introduction of
this measure was to indicate what proportion of fault reports are repeated after a previous
fault report has been cleared. This measure is calculated as a percentage of the number of
repeat customer fault reports that are cleared in the period, over the total number of fault
reports cleared in the period. A repeated fault, in this sense, is defined as that a qualifying
customer report receives against a customer’s line (preferably to a specified line) within 30
calendar days of the date of clearance of the immediately preceding qualifying report of a
fault against the same customer line.
Comparable Performances in Action
Comparing firstly BT and Kingston, as given, there seems to be few significant changes in
the performance of both companies for billing accuracy. Generally, on this measure, BT’s
performance gradually became poor through to 1998, and improved gradually from the
first quarter of 1999. Kingston’s performance also grew poorer to the first quarter of
1998, but in a fluctuating manner, and improved significantly by the third quarter, at a
level where it approximately remained.
As shown in Figure 36, billing complaints had increased from 1.2 per 1000 in 1995 to 2.4
in 1998, but had improved from there, gradually reducing to a rate of 1.3 in the second
quarter of 2001. Similarly, the performance was imitated by Kingston, as billing accuracy
exacerbated from 0.9 per 1000 bills to 2.2 in 1998 and improved thereon to 0.6 in 2001.
Again, the patterns in the performance of BT and Kingston on customer reported faults
appear to be the same, but in reverse order (Figure 37). The reported faults of Kingston

46
fell from 4.5 per 100 lines to 2.7 in 1998, and slowly increased again in the last quarter of
1998, finishing at 3.7 in 2001. In this instance, the performance of BT remained roughly
constant, fluctuating about the rate of 3.6 throughout.
Very interestingly, while there have been fluctuations in the performance of customer
reported faults for Kingston, the percentage of their faults cleared in target time has
remained very constant, at nearly 100 per cent (see Figure 38). However, the percentage
of faults being cleared in target time has fallen for BT. Commencing in 1995, at 81.6 per
cent, the rate at which BT clears faults in target time gradually fell as low as 60.8 per cent
in the last quarter of 2000, picking up again a little thereafter to 76.7 per cent in 2001.
The repeated reported faults show a different pattern in the performance of the companies
(Figure 39). Whilst Kingston was able to ensure a constant performance in fault reports
over the period commencing in 1999, the performance in the repeated faults has worsened,
from about 6 per cent repeated within a 30-day period, to 9 per cent by 2001. However,
while BT has seen falling performance in clearing faults in target time, it seems that the
quality of repairs has improved, as the repeated faults have fallen from about 11 per cent
in 1995 to 9.3 per cent by 2001.
There does not seem to be any pattern in the performance of the two companies for
completing orders by the date promised, as shown in the stability of the data-lines of
Figure 40). For BT, there has been a fluctuation in the performance, at about an average
of 96 per cent. In the case of Kingston, in spite of a fall to a performance of 95.8 per cent
in the third quarter of 1997, its performance has remained constant at above 99.5 per cent
from 1998 onwards.
The other measure which does not seem to show any pattern in the company performance
is in complaint handling, as suggested by the erratic changes in the performances, as
shown in Figure 41. For BT, there has been a peak in processing complaints within 20
days in the second quarter of 1998 to 99.4 per cent. Thereafter, there was a gradual fall to
95.8 per cent in 2001. Kingston performed well when the CPI data were first publised, but
achievement fell below the 99 percentage mark in 1997, fluctuating and falling to 97 per
cent in 1999 before picking up again to the 99 percentage mark in 2000.

47
Overall, considering the patterns in all the measures for BT and for BT, it seems, in the
long term, there is some consistency in billing, fault restoration services, completion of
orders and complaint handling. However, there is a sharp fall in the completion of work in
target times. The performance of Kingston is somewhat “fuzzier”. There is greatest
consistency in performance in restoring faults and the quality of this restoration, and since
1998 a strong performance in completing orders, indicating good control.
Summary & Implications
The Comparable Performance Indicators of the telecommunications industry is newer than
any of the performance standards of the other industries, and the development of which is
also at its early stages of infancy. Although clearly defined indicators, other factors still
impair the measurability of the individual company performances under which, such as the
many mergers of companies in this industry. Again, this is a challenge for the
performance measurement system in this area, although it is not the direct fault of the
system per se.
Unlike the performance trends of the electricity and water industries, which have
predominantly indicated general improvement over time, the patterns of performances in
the telecommunications industry do not indicate this same kind of improvement.
However, the performance data do show some stability in the patterns of the trends, and
this may be more favoured by customers who value the quality of the services they
receive.
5.0 GAS SUPPLY & TRANSMISSION
The establishment of various standards of performance in the gas industry has been an
ongoing and continuous process, subject to many amendments and changes. Not only did
they commence the latest (vis-à-vis their utility counterparts), their rate of development
has been the slowest too. This section intends to outline the evolution and company
achievement of these performance standards, predominantly through the exploration of
Annual Reports of the economic regulator for gas supply and transmission, OFGEM
(Office of Gas and Electricity Market), formerly OFGAS (Office of Gas Supply). This
48
provides understanding of the availability of these performance measures and an attitude
towards these from a variety of interesting perspectives.
Although now regulated by the same regulator, OFGEM, the development of customer
service quality regulation has been much slower for gas than for electricity. For
electricity, this was outlined as a main priority, since the very first Annual Report of
OFFER, “for protecting the interests of customers with respect to prices, quality and
continuity of supply” (OFFER, 1990: p.10). For gas, however, although the 1991 Annual
Report addresses “a lengthy list of agreed improvements in British Gas’ central
commitment to deal with its tariff customers’ problems and legitimate expectations in a
fair, reasonable and just manner” (OFGAS, 1992: p.44), the regulator nevertheless admits
that “it is very well to enter into a commitment to provide service but it is another matter
to deliver that commitment adequately and consistently throughout the whole
organisation” (p.45).
The present state of development regarding service standards in the gas industry results
from the licence conditions, Network Code obligations and various voluntary standards
adopted by the gas transporters and gas suppliers. Although the gas regulator has powers
to set guaranteed and overall standards of service, these have not been prescribed until the
recent periodic price review of Transco (see later). The following applies a
chronologically evolutionary approach to outline the development of the current standards
of service, since 1991, and the now separated functions of British Gas and Transco.
A list of the ten “Key Standards” outlined in the 1991 Annual Report (OFGAS, 1992:
p.89) can be found at Appendix A. These were intended to focus “directly on the principal
points of interaction between British Gas and its customers” (p.46). Unlike for electricity
standards, where penalty payments would be incurred for not achieving various levels of
performance, OFGAS would only refer to British Gas if they were not achieved. The
development of these Key Standards was left to subsequent years, and the targets of which
became clearer.
The Annual Report of 1992 (OFGAS, 1993) outlined the standards and levels of service
commenced in August 1992, learning from the operation of the package of service
standards which linked complaint and compensation schemes, as published by British Gas

49
in March 1992. A seminar was conducted in 1992 to provide useful additional
information and clarity to improve on the original standards of service package.
Furthermore, “it is OFGAS’s aim to ensure that British Gas develops and puts into
operation a standard of service package which is comprehensive in scope across all
functions of the company, reflects best practice throughout the whole service industry
sector in Great Britain, is relevant to all tariff customers and is properly costed, managed,
controlled and delivered. In that way all customers can be assured that they will receive
value for money from the company” (OFGAS, 1993: p.37).
In the spring of 1992, British Gas itself had published arrangements for complaint
handling, approved by OFGAS; they agreed these arrangements would be reviewed, and
that the compensation scheme which is linked to a complaint handling approach would
also be reviewed (OFGAS, 1993: p.38).
The OFGAS Annual Report of 1993 stated that: “the results from monitoring the delivery
of service standards during 1992 were very encouraging, indicating that British Gas
matched or bettered the planned performance levels in most areas of activity … [but notes]
the need for further development of quality of service monitoring … in improving service
to the customer” (OFGAS, 1994: p.21).
During 1993, OFGAS, the Gas Consumer Council and British Gas worked together and
published the Standards of Service Package, and agreed an action plan to implement
recommendations of the report. Thus, as a result, new standards provide for (OFGAS,
1994: p.22):
• Submission of bills based on actual meter reads at least once a year in a minimum of 90% of cases;
• Clear commitments as to the help British Gas will offer customers in payment difficulties. These are in line with the provisions of Condition 12A of the Authorisation;
• Prior warning and steps to minimise disruption to customers and the travelling public when essential planning maintenance work is undertaken on public highways. This is consistent with the requirements of the New Roads and Streetworks Act 1991;
• The efficient delivery of GasCare register services; and • The provision of energy efficiency advice.

50
The revision of Condition 13A of the Authorisation gave OFGAS greater powers to
determine disputes between customers and British Gas including appropriate
compensation. For the details of Condition 13A (announced on December 02, 1993, for
introduction from January 01, 1994), see Appendix B.
In 1994, OFGAS monitored the general levels of service provided to its customers,
particularly in the areas of:
• Reporting on its levels of performance; • Separation of responsibilities; • Establishment of social obligations; • Debt and disconnection issues; and • Transco’s engineering works.
British Gas operated, throughout 1994, in accordance with the obligations of Condition
13A, and “in all but three of the 39 standards … met or exceeded its planned performance
levels” (OFGAS, 1995: p.24). On the issue of separating responsibilities between trading
and transportation, responsibility for operating various standards must be separated
between Transco and Public Gas Supply.
The 1995 Annual Report of OFGAS recorded a 50 per cent increase in the achievement of
the standards of performance, but “there were two areas where performance fell short of
the levels expected – the time taken to deal with correspondence from customers and the
accuracy of the company’s estimating of gas accounts” (OFGAS, 1996: p.22). It was thus
suggested that additional devotion was required to providing effective complaints handling
services and to its communications with customers.
It was decided that reporting on the individual performances of Transco and British Gas
should be separate, and the discussions proceeded to the end of 1995 regarding the number
and form of the standards to be applied for the two businesses. The separation took place
in 1996.
The Annual Report of 1996 (OFGAS, 1997) was the first that reported the separation of
standards of performance between what became British Gas Trading (BGT) and Transco.

51
Two standards remained common to both organisations, however: telephone answering
and the handling of correspondence. The Annual Report indicated failures of both BGT
and Transco.
In the case of BGT, it would consider itself to have failed on as standard if it does not
reach targets on:
• Dealing with correspondence within 5 days; • Attempting a meter read every 6 months; • Billing on an actual meter read every 2 years; • Visiting a customer within 5 days of a request being received for a gas supply; • The accuracy of its estimates of gas usage by domestic customers; and • The number of safety checks made within 28 days of a customer joining the GasCare
Register.
Additionally, BGT introduced a Tariff Gas Billing System (TGBS) – the central bill-
handling means to replace 64 separate billing systems – which resulted in over-long billing
periods and inaccurate bills, predominantly due to incompatibility of TGB with all its
databases. In 1998, “BGT has now overcome the operational difficulties following the
introduction of a new nationwide billing system, which had affected performance in
previous years” (OFGAS, 1999: p.40).
Similarly, Transco failed to achieve two of its targets: the required performance for
attending to uncontrolled gas escapes within an hour was 97%, but Transco only achieved
95.5%; and with the requirement to record all complaints (100%), only 99% was achieved.
The 1997 OFGAS Annual Report (OFGAS, 1998) is the first to exhibit a tabulated
summary of the performances of the standards, for BGT and Transco. The same was
reported in the 1998 Annual Report (OFGAS, 1999), and a summary of which is made in
Table 10.
The OFGEM Annual Report of 1999 “is the first annual report of OFGEM, as the
integrated regulatory organisation responsible for both gas and electricity … [and]
OFGEM’s overall aim remains to protect and advance the interests of consumers by
promoting the choice and value available to gas and electricity customers” (OFGEM,
2000a: p.5). In the opening lines of the section on protecting customers in the 1999
52
Annual Report, “a Utilities Bill was included in the Queen’s speech to Parliament … [and]
includes a new duty on the regulator to protect consumer interests … set new standards of
performance for gas and electricity companies” (OFGEM, 2000a: p.8). For this reason,
the Annual Reports no longer publish the performance of BGT and Transco under their
current standards, although the complaints data are available throughout.
Interestingly, at this time, a review by the National Audit Office on the introduction of
competition into the domestic gas market (NAO, 1999) reported that not only do
customers now have a choice of gas suppliers, but also, in general, “the quality of the
service to customers is improving” (p.5). Essentially, the report evaluates the
effectiveness of opening up the market to competitive conditions by observing any
improvements in the standard of quality to customers.
The focus on exhibiting performance measures data for the gas industry was excluded in
the 2000/01 Annual Report of OFGEM (OFGEM, 2001a). The Utilities Act 2000
furthermore established the need for guaranteed and overall standards of performance to
be set for electricity distributors, gas transporters and all electricity and gas suppliers,
where in the past these had only applied to public electricity suppliers (PESs).
Accordingly, proposals on what standards of performance targets should be set for the
monopoly electricity distribution and gas transportation businesses were announced during
the year of 2000. Further, a new independent consumer body was created, the Gas and
Electricity Council, which replaced the existing Gas Consumer Council, and now inspects
a new set of standards of performance.
“Guaranteed and overall standards ensure that customers receive certain minimum levels
of service when dealing with companies … [and] such minimum standards are particularly
important in relation to monopoly businesses where there is no market pressure on
companies to improve service standards” (OFGEM, 2001b: p.26). The separation of the
gas supply and transportation businesses made it more necessary to establish clear
standards of services to customers.
British Gas Trading and Transco therefore now operate different standards. Currently, for
gas suppliers, the special licence condition 13A is still applicable in addition to a set of
BGT’s own standards (of which there are 27), known as Public Standards of Service (see
53
Tables 12 and 13), contained in a leaflet entitled “Standards of Service for Our Gas
Consumers” (see later). For Transco, three main sets of frameworks govern its
performance of service standards. The first is Condition 19 of the gas transporter licence
that alternative heating and cooking facilities must be provided in the prevention of gas
escapes (which is common to all gas transporters) and that Transco reports on the
performance against these standards. The second are the obligations under the Network
Code (see below) and the third are a set of its own voluntary standards as established in
1992. These are explained as follows.
In the case of Transco, if it breaches its obligations under the Network Code to make gas
available for offtake from the system, it must pay:
• Consumers using less than 73,200 kWh (2,500 Therms) £25 for each consecutive period of 24 hours, or part of such a period, commencing with the expiry of the first 24 hours of the failure; and
• Larger users a payment calculated in accordance with a formula set out in the Network Code
Furthermore, Transco’s National Transmission System is governed by a number of
regulatory and legal frameworks. The primary legal framework is the Gas Act 1986, as
amended by the Utilities Act 2000, and primarily establishes a separation of licensing of
gas transporters, gas shippers and gas suppliers, where Transco is currently the largest gas
transporter in Great Britain. The principle objective of the Act is to protect the interests of
consumers in relation to gas conveyed through pipes, wherever appropriate, by promoting
effective competition between those concerned. In doing so, two further principle
objectives are necessary: to secure, as economically as possible, that all reasonable
demands for gas in Great Britain are met; and to secure that licence holders are able to
finance the operation of activities, as authorised by their licences.
The Utilities Act 2000 establishes new duties, in addition to those on standards of service,
for the Regulator (known as “The Authority”) to impose financial penalties on companies
found to have been in breach of licences issued to them under the Gas Act 1986 or the
Electricity Act 1989.

54
On the issue of gas transporter licences, under section 9 of the Gas Act 1986, a gas
transporter must develop and maintain an efficient and economic pipeline system for the
conveyance of gas and to comply with any reasonable demands to connect to a system to
convey gas to any premises. The Gas Transporter licence places an additional obligation
on the gas transporter by the introduction of a Network Code, which sets out the
arrangements between the transporter and shippers for the use of, and connection to, that
transporter’s pipeline system. Four key points are required, as set out in Standard
Condition 7 of the Gas Transporter Licence, and each Network Code must meet these
relevant objectives: (a) the efficient and economic operation by the licensee of its pipeline
system; (b) the efficient discharge of its obligations under its licence; (c) the securing of
effective competition between relevant shippers and between relevant suppliers; and (d)
the provision of reasonable economic incentives for relevant suppliers to secure that the
domestic supply security standards are satisfied as respects the availability of gas to their
domestic customers.
For Transco, the Network Code was put in place in March 1996. Only shippers and
Transco may propose modifications to the Network Code, and OFGEM (bound by the
duties under section 4A of the Gas Act 1986) can only direct modifications to the Code if,
in its opinion, the proposed modification would better facilitate the achievement of the
relevant objectives as set out in Standard Condition 7 of the Gas Transporter Licence.
Further, modifications to the Code require approval by OFGEM.
The shippers of gas, as signatories to Transco’s Network Code, must balance the gas they
put into the pipeline network with the gas they take out each day. Furthermore, these must
be at a uniform flow rate – this is occasionally referred to as the 1/24 Flow Rate Rule.
Transco’s voluntary standards are outlined in OFGEM’s Guaranteed and Overall
Standards of Performance: Final Proposals (OFGEM, 2001a) report, and the details of
which can be found in Table 11. It must be noted that these “Public Standards of Service”
are voluntary standards, hence the discretion of the compensation, in respect of other
standards. They roughly parallel the guaranteed standards in electricity.
These standards were proposed for changes, where fixed payments were suggested
instead. For instance, restoring domestic customers’ suppliers after an unplanned was
55
proposed to warrant a payment of between £30; reinstatement of consumers’ premises of
£50 (domestic) and £100 (non-domestic); making and keeping appointments of £20;
adequate heating and cooking facilities of £24; and notifying consumers of payments
owed under the standards of £20. Nonetheless, these did not reflect the final decisions set
for the 2002 periodic price review of Transco, as laid out in OFGEM (2001e).
For BGT, the standards that attract fixed compensation can be found in Table 12
(OFGEM, 2001b: p.25). Similarly, the standards that do not attract fixed compensation
can be found in Table 13. The numbering of the categories in these standards does not
correspond directly with the GS and OS scheme of levels of service standards.
Furthermore, these numbers do not have direct resemblance with the standards against
which BGT and Transco once operated.
Summary & Implications
The evolution of a uniform set of standards applicable to the gas sector has been an
ongoing and extremely difficult one, the establishment of which effectively commenced
earlier than that of the electricity and water industries. Yet, the state of advance in the
development of these standards has lagged behind ever since. Commencing from a
position of general standards for customer services (comprised mainly of three
obligations), as opposed to performance measures as in the other industries, these are now
consolidated in the final determinations set out in the periodic price reviews, such as the
set of Guaranteed and Overall Standards for Transco in April 2002 (OFGEM, 2002e).
This is because “consumers are interested in quality as well as prices … [so] the price
control review has involved consideration of the appropriate guaranteed and overall
standards of performance and other quality of service indicators” (OFGEM, 2001e: p.3).
Although the scope of this paper does not allow for inclusion of extreme details of future
schemes of replacement, nonetheless, the implications and changes in the standards signal
the high degree of ineffectiveness of those in the past.
To briefly outline, therefore, a number of Guaranteed and Overall Standards were included
in the price review (see Tables 14 and 15 for details) for Transco and these differed very
much from, and reflected the primitive nature of the original standards that were only a
56
framework by which the combined business of British Gas Trading operated in 1990.
OFGEM outlines the penalty and attainment of these targets in its report of Transco’s
price review (OFGEM, 2001e: pp.36-40); and these differed somewhat too from those
operational between 1996 and 1998, and those operated by the separated businesses of
BGT and Transco’s voluntary standards.
Finally, due to the discontinuity of the development of standards of the gas industry, any
analyses of these performances over time have not been possible. Thus, the quality of
standards in the provision of gas and the effectiveness of performance measurement
systems that the gas industry can bring about also cannot be evaluated.
6.0 DISCUSSION
Literature on the importance of the quality of customer services as an essential
performance measurement category seems somewhat overrated, much of it putting its
central focus of consideration on it being a tool for competitive positioning. Customer
service indicators were originally established as a mechanism for price regulation,
believing that the introduction of greater conditions of market competition, the levels of
customer services must naturally improve, if not already heightened by individual
company incentives. Outlined in a report by the National Audit Office, “although price is
likely to remain a major incentive … quality of service is also important for customers”
(NAO, 1999: p.49). However, the provision of quality must come a price to pay, and it is
the Director General’s aim, for whichever utility, to “set a stable framework within which
companies can plan efficiently and exploit new technologies to deliver the right quality of
service to customers at the right price” (OFWAT, 1993b: p.2). Essentially, as quality
increases, it becomes more expensive to provide it, increasing marginal costs, although the
marginal benefit of customers receiving it decreases, and an optimal level of quality is
reached at their intersection (Baldwin and Cave, 1999). The provision of this optimal
level of quality brings with it a competitive element too. Even the Director General of
Electricity Supply announces in the first Annual Report of OFFER (1990: p.5) that:
“… if the benefits of private ownership are to be fully secured, competition is a vital ingredient. It will be important for new sources of generation and supply to emerge. When companies know
57
that consumers have freedom of choice, they try even harder to deliver a service that meets consumers’ wishes.”
Thus, the degree of essentiality for the provision of quality in customer services rests with
the companies that provide it, whilst the burden that ensures its provision rests with the
regulators; the remaining stakeholder is the customer who receives it. All three parties
place equal pressure in ensuring that the quality of customer services exists, is provided,
and provided at an increasing level, at an acceptable price paid by the customers.
Collectively, therefore, this paper aims to provide a descriptive commentary on the
performance levels and achievement of the Standards in the four household utilities:
electricity, water, telecommunications and gas. The consideration of these performances
appeared in this order, and of decreasing detail because of the degree of their development
in each sector. Although the DG Standards in Water and Sewerage Services commenced
before the GS and OS Standards in electricity supply and distribution, their actual state of
development is less advanced. Whilst the first report on customer services of OFFER
proudly announces that “This is OFFER’s first report on the customer service provided …
to help assess the quality of the service they currently receive and to enable them to
compare it with the service provided by other Electricity Supply Companies” (OFFER,
1992: p.i), the first report of OFWAT embarrassingly admits that “the Levels of Service
Indicators are not performance or efficiency measures in themselves … [and that]
confidence in the information for comparative purposes will improve rapidly over the next
few years” (OFWAT, 1990: pp.1, 5). With the telecommunications sector, these were left
to a third-party incumbent, and commenced even later – in 1995. This may be acceptable
if considered in the light of the degree of importance of each utility, with water and
electricity being of vital importance. This, however, does not explain the poor state of
development of customer service standards in the gas sector. Gas is widely consumed and
quality levels not being achieved can lead to serious safety implications. Even the three
years’ quality standards as noted in the Annual Reports of OFGAS prove inadequate.
The inadequacy of the development of performance standards in the gas industry was
already noted; the separation of businesses of British Gas Trading and Transco led to
different developments of standards, and essentially, those of Transco were consolidated
in the recent periodic price review, operational since April 2002. The Standards imposed

58
for Transco follow the same format as those already applied in electricity, by the operation
of Guaranteed and Overall Standards. A comparison of these applied in electricity and in
Transco can be found in Tables 14 and 15. As the standards that govern electricity
distribution are now enhanced (although the intention of OFGEM is to continue collecting
these data) by the Information and Incentives Project (IIP), to incorporate a wider
spectrum of standards, it is more interesting to compare those of IIP with those for gas, as
these both are new. Much of the initiatives for and modifications to the IIP were brought
about by market research conducted by MORI (OFGEM, 2001f), such as findings that
continuity of supply was the most important aspect of performance, and that “customers
also rate … answering the telephone quickly and efficiently as important” (p.41).
Moreover, the IIP was praised by the National Audit Office as representing “a promising
development … [which] concentrates on firstly improving the information collected and
secondly developing an incentive scheme linking financial payments to quality of service”
(NAO, 2002: p.33). Time can only tell how effective the IIP turns out to become.
Although it is not the intention to provide scope in this paper for the inclusion of
discussion on the IIP, it is nonetheless essential to note that its establishment was due to
recognition of the inadequacies and defects in considering solely the various Standards on
electricity distribution. By proposing an “incentive scheme [that] links directly the quality
to consumers with the amount of revenue they can collect, this will provide them with
clear and predictable incentives to deliver the appropriate quality of service to consumers”
(OFGEM, 2001c: p.2). In the water industry, a more thorough performance measurement
scheme has also been introduced, one which is to link service levels to prices. In this, an
Overall Performance Assessment (OPA) is established, that includes the existing DG
Standards, adding to it water supply and environmental considerations. This scheme can
be understood to run in parallel with the IIP, as OFWAT announces that the original
proposals for the OPA “took account of discussions with a number of companies, the
Drinking Water Inspectorate (DWI) and Environment Agency (EA) and developments in
other utilities, particularly the Office of the Gas and Electricity Markets’ Information and
Incentives Project” (OFWAT, 2002b: p.2).
The 1997-98 Report on the Level of Customer Services for Water and Sewerage Services
(OFWAT, 1998) attempts to report on the OPA results if applied for the water and
sewerage companies. The purpose of this scheme was to “enable comparisons to be made

59
about the quality of the overall service companies provide to customers, which will be
taken into account when setting price limits [which] will help to maintain incentives for
companies to improve the services they offer to customers … [and] inform customers
about the performance of their local water supplier” (OFWAT, 1998: p.4). The results
from this set of data were applied by the Director General to make adjustments to
company price limits in the subsequent price review. This is a good method of comparing
the variation in the possible results of the new scheme with that of the existing DG
Standards.
Whilst the focus of this paper is not on the newer schemes that are to consolidate those
that have been functioning, and detailed herein, the establishment and understanding of
these (for electricity, water and gas) do, nevertheless, raise doubts on their operational
effectiveness. The achievement of performance levels of DG7 (figure 29) and DG6
(Figure 30), for instance, brings one to question how it is possible for performances to
improve so dramatically over the years. With such high achievement levels, is it possible
to track any true increases in performance over time? A good performance measurement
system should be one that can stand the test of time, but if, as in the case of responses to
billing and written contacts, a performance measure can no longer be truly evaluated
(because of unrealistic improvement levels), by definition, it is not a good performance
measurement system.
For the water industry, where the empirical evidence suggests such excellent improvement
in performances over time, particularly with those that are easily “measurable”, it is
justifiable to question whether the companies are really becoming better in their provision
of customer services, or if they are becoming better at “playing” the performance
measures per se. Arguably, therefore, in the case of evaluating the performance measures
that are less measurable, due to many contingent factors surrounding their viability, such
as the weather in terms of flooding, where such a measure indicates improvement over
time, this indication is more “believable”. Over time, although the performance
improvement in sewer flooding is less impressive than those of response to billing and
written contacts, this is a more reliable indication, as these performance figures are more
difficult to “play”. It also indicates the degree to which the companies are able to control
what is inevitable.

60
The data themselves can be somewhat flawed, such as those, already mentioned, of the
early years of OFWAT, and where data are missing from the OFGEM reports too, either
due to flawed data collection processes or inadequacy in company reporting systems that
render the data unreliable. The effects of missing data encompass inconsistency,
incomparability and inaccuracy of the data, and these themselves defeat the very purpose
of the data reporting process. The original purpose of OFWAT publishing the DG
performance data was to provide customers with individual company achievements of
various Standards, demonstration of operational effectiveness of investment programmes,
and to enable cross-company comparisons (OFWAT, 1990). This provokes one to wonder
whether the achievement of these objectives is possible. Furthermore, the variation of the
formats in which the data are presented have posed a problem: the early years of the
OFWAT reports and the recent reports of OFGEM, as well as the cessation of the OFGEM
Customer Service reports to make way for the reporting of IIP data, which potentially
cause problems for the establishment of within-industry comparisons.
Comparisons across industry performances on customer services are also rendered
difficult, as they do not all consider the same elements of performance measures. For
instance, penalty payments are not compulsory or automatic in all industries, and in some,
they do not exist. For electricity and water, penalty payments are automatic in many
cases, but the effectiveness of the performance measurement systems cannot be compared
against penalty payments because penalty payments are directly related to the performance
data in the former while penalties are operated on a different scheme in the latter.
A multiplicity of complex and contingent factors surrounds the operational effectiveness
of how the performance measurement systems for customer services in utilities are
managed. The problems attached to these systems stimulate many great challenges on the
functionality aspect as a system to adequately measure the performance valued and desired
by customers. The details of customer service performance levels offered in this paper
endeavour to provide support for future research and discussion in this area; the scope of
this paper however does not allow for sufficient determination on this aspect, although the
data do permit doubts to be raised, particularly where trends in the datasets have shown
particularly surprising comparative indications.

61
7.0 CONCLUSION
Thorough discussion on the implications of what can be observed from the data can lead
one to believe that customer service performance measures applied in the utilities industry
are extremely flawed and problematic. However, the intention of this paper is not to
provide discussion of such implications to a degree which permits this belief. The primary
objective is to provide from observations of the dataset any evidence of emerging patterns
that may be revealed as evidence for future research. Further, the results derived from the
observations do not intend to provide solid findings to evaluate the effectiveness of
customer service performance measures as a regulatory tool, although their use as a
complementary supplement to pure price regulation has proved valid.
For the customer service performance indicators, in general, performance levels have
improved for all the Standards in most of the industries. It is not so clear for those of
telecommunications, but their development is still at an early stage. Arguably, the
implications of telecommunication services being out of bounds are less severe than those
of gas and electricity. For this reason, even the minimal availability of data on these
performance measures has still indicated improvement over the time; and furthermore,
their importance has led to a newer development of customer service standards through the
price control review. Such increases in performance levels support the original arguments
for privatisation, even if this may be surprising to those who are sceptical.
A lot of the literature reports on the growing importance of recognising customer service
levels as an important performance indicator, not only as a regulatory tool that permits the
customers to know what standard of services they are receiving, but also as an indication
of how the companies themselves live up to their own expectations, in achieving goals of
their own. In UK economic regulation, evidence of this is less direct. Until 1998/99,
when all but one of the Overall Standards of electricity were put to 100 per cent, arguably
the individual targets could be used as a tool to indicate company achievement of
individual goals. This was because the individual levels of Overall Standards were
determined by the regulator but, to some extent, through some consultation with the public
electricity suppliers. Therefore, the achievements of these targets were effectively
achievements of their own company objectives, as well as meeting the requirements of the
regulator. Substantively, in the case of electricity Overall Standards, the actual
62
performance levels have increased over time. However, because the required levels of
achievements have also increased, the number of OS targets not achieved has increased,
particularly in 2000/01, which the author believes is a better measure of corporate (as
opposed to company) performance and a better use of the existing performance
measurement systems.
In the industries with the longest established consistent set of customer service
performance measures (electricity and water), with a few exceptions, there are clearly
overall increases in penalty payments over time against tighter Standard levels, that have
led to a general corresponding increase in customer service performances. This is true,
even for Standards for which a high degree of control is required, such as those influenced
directly by the weather (for example, in sewer flooding levels, for which there are still
signs of vast improvement). Furthermore, this is also true for electricity distribution
Standard performances where the range of company performance has been extremely
wide, and from which the average industry performances have indicated improvement.
Referring back to the opening paragraph of this paper, Parker’s (1999) suggestion that
privatisation leads to a lower cost of production and a higher service to consumers seems
to hold.
However, this is only true to the extent which the performance measurement systems in
place permit. The real question under consideration is not whether performances have
increased; it is not whether performance measurements are accurate; but rather whether
the performance measurement systems are adequate to truly reflect the Standards of
services customers value. Only by answering this in the affirmative can one begin to
correctly answer whether there has been an improvement in customer service levels.
Indeed, as the performances have increased to the extent that further improvement is
difficult to identify and that newer Standards have been put in place (such as the IIP and
OPA), one cannot help but wonder whether these inherit a sufficient level of adequacy and
appropriateness, or whether instead they will lead to performances of permanent
unidentifiable improvement.
One objective of this paper is to provide a descriptive consideration of the data and make
observations from the emerging trends. In effect, this has worked in reverse. It is in
observing the emerging trends from the published data that it has been possible to outline

63
what has been of greatest significance. By simply suggesting that the performances have
improved over time is a good suggestion, but this alone is not good enough. This is
because the observation would be incomplete. Performance, performance measurement
and performance measurement systems are three quite different entities. Indeed, the
performance of many of the Standards has shown inevitable evidence of improvement
over time, and similarly performance measurement of the data has also improved, as the
published reports have admitted increased reliability and accuracy of measurement
techniques over time. However, the performance measurement systems through which the
customer service performance measures operate have not indicated firm signs of
improvement. These are what are changing over time, and the test of these systems is
perhaps the problematic aspect. This test, nonetheless, is the true test of service levels to
customers, as it is the system of performance measurement that can generate measures that
customers want and value, rather than improvement in a set of figures which cannot.
Whilst the comprehension and awareness of the data presented in this paper are of utmost
importance as a comfort blanket, this blanket is not large enough to cover all aspects of
customer service performance measurement issues in the utility industries; there are
contingency factors that affect the data, as well as flaws in the reported data themselves,
and only time can tell whether changes in these performance measurement systems can
bring with them an accompanying pillow.

64
REFERENCES
1. Armstrong, M, Cowan, S and Vickers, J (1994) Regulatory Reform: Economic Analysis and British Experience, London: The MIT Press.
2. Baldwin, R and Cave, M (1999) Understanding Regulation: Theory, Strategy and
Practice, Oxford: Oxford University Press, Ch.19, pp.248-256. 3. Brignall, S and Ballantine, J (1996) “Performance Measurement in Service Businesses
Revisited”, International Journal of Service Industry Management, 7, 1, pp.6-31. 4. CPI (Various Years, 1995 … 2001) “Telecommunications Companies: Comparable
Performance Indicators – Residential Customers”, CPI and OFTEL. 5. Crowther, D, Cooper, S and Carter, C (2001) “Regulation – the Movie: A Semiotic
Study of the Public Review of UK Regulated Industry, Journal of Organizational Change Management, 14, 3, pp.225-238.
6. Dean, A, Carlisle, Y and Baden-Fuller, C (1999) “Punctuated and Continuous Change:
The UK Water Industry”, British Journal of Management, 10, pp.s3-s18. 7. Eccles, R.G and Pyburn, P.J (1992) “Creating a Comprehensive System to Measure
Performance”, Management Accounting (US), October, pp.41-44. 8. Fitzgerald, L, Johnson, R, Brignall, S, Silvestro, R and Voss, C (1991) Performance
Measurement in Service Businesses, London: CIMA. 9. Iozzi, A (1999) “Essays on Regulations: Theory and Practice”, An Unpublished PhD
Thesis, University of York, September, Ch.8, pp.196-237. 10. Ittner, C.D and Larcker, D.F (1998) “Are Nonfinancial Measures Leading Indicators of
Financial Performance? An Analysis of Customer Satisfaction”, Journal of Accounting Research, 36, Supplement, pp.1-35.
11. Johnson, H.T and Kaplan, R.S (1987) The Rise and Fall of Management Accounting,
Boston, MA: Harvard Business School Press. 12. Kaplan, R.S and Norton, D.P (1992) “The Balanced Scorecard – Measures that Drive
Performance”, Harvard Business Review, 70, 1, pp.71-79. 13. Kaplan, R.S and Norton, D.P (1996) “Using the Balanced Scorecard as a Strategic
Management System”, Harvard Business Review, 74, 1, pp.75-78. 14. NAO (1997) “Regulating and Monitoring the Quality of Service provided to Customers
by the Water Industry in England and Wales: Report by the Comptroller and Auditor General”, National Audit Office, HC 388 – Session 1997-1998, December.

65
15. NAO (1999) “Office of Gas Supply – Giving Customers a Choice – The Introduction of Competition into the Domestic Gas Market: Report by the Comptroller and Auditor General”, National Audit Office, HC 403 – Session 1998-1999, May.
16. NAO (2001) “Office of Gas and Electricity Markets – Giving Domestic Customers a
Choice of Electricity Supplier: Report by the Comptroller and Auditor General”, National Audit Office, HC 85 – Session 2000-2001, January.
17. NAO (2002) “Pipes and Wires: Report by the Comptroller and Auditor General”,
National Audit Office, HC 723 – Session 2001-2002, April. 18. Neely, A, Richards, H, Mills, J, Platts, K and Bourne, M (1997) “Designing
Performance Measures: A Structured Approach”, International Journal of Operations and Production Management, 17, 11, pp.1131-1152.
19. NGC (2000) “Report to the Director General of Gas and Electricity Markets:
Transmission System Performance, 1999/00”, The National Grid Company Plc, 17.pps.
20. OFFER (1990) “Annual Report 1989”, Office of Electricity Regulation, May, 23.pps. 21. OFFER (1992) “Report on Customer Service 1991/92”, Office of Electricity Regulation,
July, 24.pps. 22. OFFER (1993a) “Report on Customer Service 1992/93”, Office of Electricity Regulation,
July, 26.pps. 23. OFFER (1993b) “Electricity Services: The Customer Perspective”, A Report by MORI
for the Office of Electricity Regulation, March, 218.pps. 24. OFFER (1994) “Report on Customer Service 1993/94”, Office of Electricity Regulation,
July, 29.pps. 25. OFFER (1995) “Report on Customer Service 1994/95”, Office of Electricity Regulation,
July, 32.pps. 26. OFFER (1996) “Report on Customer Service 1995/96”, Office of Electricity Regulation,
July, 32.pps. 27. OFFER (1997) “Report on Customer Service 1996/97”, Office of Electricity Regulation,
July, 34.pps. 28. OFFER (1998a) “Annual Report 1997”, Office of Electricity Regulation, June, 143.pps. 29. OFFER (1998b) “Report on Customer Service 1997/98”, Office of Electricity
Regulation, July, 41.pps. 30. OFFER (1998c) “Report on Distribution and Transmission System Performance
1997/98”, Office of Electricity Regulation, January, 26.pps. 31. OFGAS (1992) “Annual Report 1991”, Office of Gas Supply, February, 99.pps. 32. OFGAS (1993) “1992 Annual Report”, Office of Gas Supply, February, 63.pps. 33. OFGAS (1994) “1993 Annual Report”, Office of Gas Supply, February, 48.pps. 34. OFGAS (1995) “Annual Report 1994”, Office of Gas Supply, February, 40.pps. 35. OFGAS (1996) “Annual Report 1995”, Office of Gas Supply, February, 40.pps.

66
36. OFGAS (1997) “Annual Report 1996”, Office of Gas Supply, February, 48.pps. 37. OFGAS (1998) “Annual Report 1997”, Office of Gas Supply, May, 66.pps. 38. OFGAS (1999) “Annual Report 1998”, Office of Gas Supply, July, 64.pps. 39. OFGEM (1999) “Report on Services for Electricity Customers 1998/99, Office of Gas
and Electricity Markets, October, 38.pps. 40. OFGEM (2000a) “OFGEM Annual Report 1999”, Office of Gas and Electricity Markets,
May, 56.pps. 41. OFGEM (2000b) “Report on Services for Electricity Customers 1999/00”, Office of Gas
and Electricity Markets, September, 35.pps. 42. OFGEM (2001a) “Annual Report 2000-2001”, Office of Gas and Electricity Markets,
July, 76.pps. 43. OFGEM (2001b) “Guaranteed and Overall Standards of Performance: Final Proposals”,
Office of Gas and Electricity Markets, January, pp.19-29. 44. OFGEM (2001c) “Information and Incentives Project – Incentive Scheme: Final
Proposals”, Office of Gas and Electricity Markets, December, 83.pps. 45. OFGEM (2001d) “Report on Distribution and Transmission System Performance
1999/2000”, Office of Gas and Electricity Markets, January, 28.pps. 46. OFGEM (2001e) “Review of Transco’s Price Control from 2002: Final Proposals”,
Office of Gas and Electricity Markets, September, 120.pps. 47. OFGEM (2001f) “Experience of the Competitive Market: The Domestic Electricity and
Gas Markets”, Research by MORI for the Office of Gas and Electricity Markets, January, 89.pps.
48. OFGEM (2001g) “Gas Transporters’ Standards of Performance Study – Quantitative
Stage”, Research Report prepared for Ofgem by IFF Research Ltd, July, 147.pps. 49. OFGEM (2002a) “Report on Services for Electricity Customers 2000/01”, Office of Gas
and Electricity Markets, March, 38.pps. 50. OFGEM (2002b) “Report on Distribution and Transmission System Performance
2000/2001”, Office of Gas and Electricity Markets, January, 20.pps. 51. OFWAT (1990) “The Water Industry of England and Wales: Levels of Service
Information 1989/90”, Office of Water Services – Engineering Intelligence Division, October, 42.pps.
52. OFWAT (1991) “Levels of Service Report for the Water Industry of England and Wales
1990/91”, Office of Water Services, November, 50.pps. 53. OFWAT (1992) “1991-92 Report on Levels of Service for the Water Industry in England
and Wales”, Office of Water Services, December, 45.pps. 54. OFWAT (1993a) “1992-93 Report on Levels of Service for the Water Industry in
England and Wales”, Office of Water Services, October, 35.pps. 55. OFWAT (1993b) “Setting Price Limits for Water and Sewerage Services: The
Framework and Approach to the 1994 Periodic Review, Office of Water Services, November, 43.pps.

67
56. OFWAT (1994) “1993-94 Report on Levels of Service for the Water Industry in England and Wales”, Office of Water Services, December, 36.pps.
57. OFWAT (1995) “1994-95 Report on Levels of Service for the Water Industry in England
and Wales”, Office of Water Services, December, 43.pps. 58. OFWAT (1996) “1995-96 Report on Levels of Service for the Water Industry in England
and Wales”, Office of Water Services, December, 48.pps. 59. OFWAT (1997) “1996-97 Report on Levels of Service for the Water Industry in England
and Wales”, Office of Water Services, November, 47.pps. 60. OFWAT (1998) “1997-98 Report on Levels of Service for the Water Industry in England
and Wales”, Office of Water Services, November, 43.pps. 61. OFWAT (1999a) “1998-1999 Report on Levels of Service for the Water Industry in
England and Wales”, Office of Water Services, September, 40.pps. 62. OFWAT (1999b) “Review to all Managing Directors of all Water and Sewerage
Companies and Water only Companies”, Office of Water Services, MD 153. 63. OFWAT (2000) “Levels of Service for the Water Industry in England and Wales 1999-
2000 Report”, Office of Water Services, July, 39.pps. 64. OFWAT (2001a) “Levels of Service for the Water Industry in England and Wales 2000-
2001 Report”, Office of Water Services, September, 39.pps. 65. OFWAT (2001b) “Understanding Customers’ Views”, An OFWAT/ONCC Report,
October. 66. OFWAT (2002a) “Annual Report 2001-02 of the Director General of Water Services”,
Office of Water Services, May, 51.pps. 67. OFWAT (2002b) “Linking Service Levels to Prices”, Office of Water Services, February,
55.pps. 68. Ogden, S and Anderson, F (1995) “Representing Customers’ Interests: The Case of the
Privatized Water Industry in England and Wales”, Public Administration, 73, 4, pp.535-559.
69. Otley, D (1999) “Performance Management: A Framework for Management Control
Systems Research”, Management Accounting Research, 10, pp.363-382. 70. Parker, D (1999) “Regulation of Privatised Public Utilities in the UK: Performance and
Governance”, International Journal of Public Sector Management, 12, 3, pp.213-235.
71. Stern, J.M, Shiely, J.S and Ross, I (2001) The EVA Challenge: Implementing Value-
Added Change in an Organisation, New York: John Wiley & Sons, Inc., p.15. 72. Waddams Price, C (2002) “Yardstick Competition and Comparative Performance
Measures in Practice”, in Hunt, L (Ed), Festschrift for Colin Robinson, Routledge Publishing, Forthcoming.

68
APPENDICES
APPENDIX A: British Gas Key Service Standards, 1991 1 Obtaining a Gas Supply
When a customer makes contact to request a gas supply – (a) where a survey visit is required contact will be made within two working days to arrange an
appointment which will be within three working days, or later if requested by the customer (b) following such a visit a quotation for providing a supply will be despatched within five working
days of the visit (c) if no visit is required a quotation will be despatched within five working days of receipt of the
enquiry 2 Emergency Service 1 Uncontrolled escapes will be attended to within one hour of the report being received. 2 Controlled escapes will be attended within two hours of the report being received. (Reported gas
escapes are classified as “uncontrolled” or “controlled” based on details given by the person making the report. A reported gas escape is classified as “controlled” where the report clearly indicates that the customer’s control tap has been turned off, and the escape of gas has stopped.)
3 Continuity of Supply 1 Where a customer’s gas supply is interrupted, except through the exercise of British Gas’ power to
disconnect for reasons other than safety, the supply will be restored within one working day unless restoration is impossible due to exceptional circumstances.
2 Except in a district supply emergency, if it is necessary to interrupt gas supply to premises occupied by old, disabled or otherwise vulnerable persons the premises will not be left without adequate heating and/or cooking arrangements.
4 Meter Reading 1 For all customers an attempt will be made to read their meters six months after previous read or
attempted read. 2 The meters of customers who do not submit their own readings will be compulsorily read no later
than 18 months after the last successive reading. 3 The meters of all customers will be compulsorily read no later than two years after the last
successful reading. 5 Billing 1 Differences between actual and estimated gas usage by tariff customers will be monitored. 2 Estimating procedures will ensure that the estimates used favour neither British Gas nor its
customers. 6 Collection 1 No later than three months after an unpaid bill has been despatched, clear action will be taken in
accordance with Condition 12A to prevent debt build up. 7 Telephone Enquiry Responses 1 Customer telephone calls will be answered within 30 seconds of the call being connected. 8 Customer Contact 1 A record will be kept of all customer contracts, requests and complaints where action is required.

69
9 Customer Appointments 1 Appointments will be made for all visits where work has been requested. Where required
appointments will be offered on a morning or afternoon basis and will be kept on that basis. 2 If the customer is not available at the premises to be visited a suitable note will be put through the
door advising the customer that the appointment has been kept. 10 Customer Correspondence 1 For all customer correspondence a reply will be provided within five working days of receipt of the
correspondence. If an interim reply has to be made the reply will indicate when a substantive reply is expected to be sent.
2 For all customer correspondence which can be responded to by a visit contact will be made within two working days of receipt of correspondence. The visit will then be arranged on an agreed date within five working days of that contact, or later if requested by the customer.
APPENDIX B: Condition 13A of the Authorisation 1 The supplier shall establish, and shall diligently take all reasonable steps to achieve, standards of
performance in relation to the provision by the Supplier of gas supply services to tariff customers and potential tariff customers including services relating to: - (a) the giving of, and the continuation of the giving of, supplies of gas; (b) the ascertainment of quantities of gas supplied; (c) the recovery of gas charges; and (d) the prevention of escapes of gas.
2 The standards of performance so established (in this Condition referred to as “the established
standards”) shall, in particular – (a) govern the making of visits to customer’s premises and the response to complaints and
enquiries make in person, by telephone, in writing or otherwise in respect of gas supply services; and
(b) take into account the interests of those who are disabled or of pensionable age. 3 The Supplier shall keep records of the levels of performance achieved by the Supplier (which in
circumstances where the Director so directs shall extend to individual cases) in relation to the established standards and the cost incurred by the Supplier in such performance.
4 The Supplier shall not make any change in the established standards without the consent of the
Director. 5 (1) The Supplier shall establish and shall operate a scheme for compensating persons
affected by failures to meet the established standards. (2) The scheme so established shall provide for the Supplier making to any such person by
way of compensation a specific sum and any such further compensation as may be appropriate.
(3) Where a dispute arises between a person claiming compensation under the scheme so established and the Supplier as to whether compensation is payable under the scheme or whether the amount of such compensation is appropriate and that person has notified the Director of the dispute, the Supplier shall refer the question in dispute to the Director for determination and shall give effect to that determination.

70
(4) The scheme so established shall provide, in any case where such a dispute arises, for the Supplier to inform the person claiming compensation of the provisions of sub-paragraph (3) above.
6 The Supplier shall –
(a) furnish to the Director; and (b) publish, in such form and in such manner as the Director may direct – the established
standards and particulars of the scheme established under paragraph 5 above (in this Condition referred to as “the compensation scheme”) including an explanation of the principles on which compensation will be made.
7 The Supplier shall, as soon as practicable after the end of the financial year ending on 31st
December 1993 and of each subsequent financial year, furnish to the Director and publish, in such form and in such manner as the Director may direct – (a) a report on –
(i) the levels of performance achieved by the Supplier in that year in relation to the established standards; and (ii) the operation of the compensation scheme during that year; (iii) such research as the Supplier has carried out with a view to discovering the views of representative samples of persons on the levels of performance so achieved and the operation of the compensation scheme in that year; and
(b) a statement of the levels of performance proposed to be achieved by the Supplier in the ensuring financial year in relation to the established standards.
8 (1) Any statement to be furnished and published under paragraph 7(1)(b) above shall
include any proposals for modifying the established standards.
(2) In formulating any such proposals the Supplier shall take account of any representations with regard to standards of performance in relation to the provision by the Supplier of gas supply services made by the Director to the Supplier in the preceding financial year.
9 The Supplier shall furnish the Director with such information as to –
(a) the achievement by the Supplier of levels of performance in relation to the established standards;
(b) the records kept under paragraph 3 above; and (c) the operation of the compensation scheme, as she may from time to time direct.

71
TABLES
TABLE 1: Current Level of Guaranteed Standards and Penalty Payment (2001-02)
GS Standard Performance Required Penalty Payment
GS1 Respond to failure of a supplier'sfuse
Within 3 hours on weekdays between (at least )7am to 7pm, and within 4 hours at weekendsbetween (at least) 9am to 5pm
£20
GS2 Restoring electricity suppliesafter faults
Must be restored within 18 hours £50 (domestic),£100 (non-domestic), £25 foreach 12 hour period
GS3 Providing supply and meter Arrange an appointment within 2 working daysfor domestic consumers and 4 working days fornon-domestic consumers
£20-£100
GS4 Estimating charges Within 5 days for simple jobs, and 15 days forothers
£40
GS5 Notice of supply interruption Consumers must be given 5 days' notice £20 (domestic), £40(non-domestic)
GS6 Investigation of voltagecomplaints
Visit within 7 working days or substantive replywithin 5 days
£20
GS7 Responding to meter problems Visit within 7 working days or substantive replywithin 5 working days
£20
GS8 Responding to customers queriesabout charges and paymentqueries
A substantive reply and agreed refunds paidwithin 5 working days
£20
GS9 Making and keepingappointments
A morning or afternoon appointment, or a timedappointment if requested by the customer
£20
GS10 Notifying customers ofpayments owed under standards
Write to the customer and make payment within10 working days
£20
GS11 Responding to prepayment meterfaults
Within 3 hours on weekdays and 4 hours atweekends
£20

72
TABLE 2: First Original Set of Overall Standards (1991-92)
OS Service Required Performance1a Minimum percentage of supplies to be
reconnected following faultswithin 3 hours
1b All supplies to be reconnected following faults within 24 hours
2 All voltage faults to be corrected within 6 months
3a Connecting new tariff customers' premises toelectricity distribution systems
domestic customers within 30 working days
3b Connecting new tariff customers' premises toelectricity distribution systems
non-domestic customers within 40 workingdays
4 All customers who have been cut off for non-payment to be reconnected
before the end of the working day after theyhave paid the bill or made arrangements topay
5 Visiting to move meter when asked to do so bycustomer
within 15 working days
6 Changing meters where necessary on change oftariff
within 10 working days of domesticcustomers' request in all cases
7 Ensuring that the company obtains a firm meterreading for all domestic and small businesscustomers
at least once a year
8 All customer letters to be responded to within 10 working days

73
TABLE 3: Changes in Electricity Guaranteed Standards and Penalty Payments
Year GS-1 GS-2 GS-3 GS-4 GS-5 GS-6 GS-7 GS-8 GS-9 GS-10 GS-11
1991/92
Within 4 hours of any notification during working hours
24 hours
Within 3 working days for domestic, 5 working days for non-domestic
Within 10 working days (simple jobs), 20 working days (others)
At least 2 days' notice
Visit or reply within 10 working days
Visit or reply within 10 working days
A substantive reply within 10 working days
All appointments to visit on a day must be kept
Write to customer within 10 working days of failure
N/A
1991/92 £10
£20 domestic, £50 non-domestic, plus £10 per further 12 hrs
£20 domestic, £50 non-domestic
£20£10 domestic, £20 non-domestic
£10 £10 £10 £10 £10 N/A
1993/94 . . . . . . .A substantive reply within 5 working days
. . N/A
1993/94 £20
£40 domestic, £100 non-domestic within 24 hrs, plus £20 per further 12 hours
£40-£100 £40£20 domestic, £40 non-domestic
£20 £20 £20 £20 £20 N/A
1994/95 . . . . . . . .
Offer and keep a morning or afternoon appointment, or a more precise time if requested
. N/A
1994/95 . .£20 or £40 domestic, £100 non-domestic
. . . . . . . N/A
1995/96 . . . . . .
Visit within 10 working days or substantive reply within 5 working days
. . . N/A
1995/96 . . £20 - £100 . . . . . . . N/A1996/97 . . . . . . . . . . N/A
1996/97 .
£40 (domestic) £100 (non-domestic) + £25 per 24hrs
. . . . . . . . N/A
1997/98
Respond within 3hrs weekdays 7am-7pm, and within 4 hrs at weekends 9am-5pm
. . . .
Visit within 10 working days or substantive reply within five
. . . . N/A
1997/98 .
£50 (domestic customers) for restoring supplies within 24 hours, plus £25 per further 12 hours
. . . . . . . . N/A
1998/99 . .
Arrange an appointment within 2 working days (domestic), 4 working days (non-domestic)
Within 5 days for simple jobs, and 15 days for others
Customers must be given 5 days' notice
Visit within 7 working days or substantive reply within 5 days
Visit within 7 working days or substantive reply within 5 working days
A substantive reply and agreed refunds paid within 5 working days
A morning or afternoon appointment, or a timed appointment if requested by the customer
Write to the customer and make payment within 10 working days
Within 3 hours on weekdays and 4 hours at weekends
1998/99 .
£50 (domestic), £100 (non-domestic), £25 for each 12 hour period
. . . . . . . . £20
2000/01 .Must be restored within 18 hours
. . . . . . . . .
2000/01 . . . . . . . . . . .
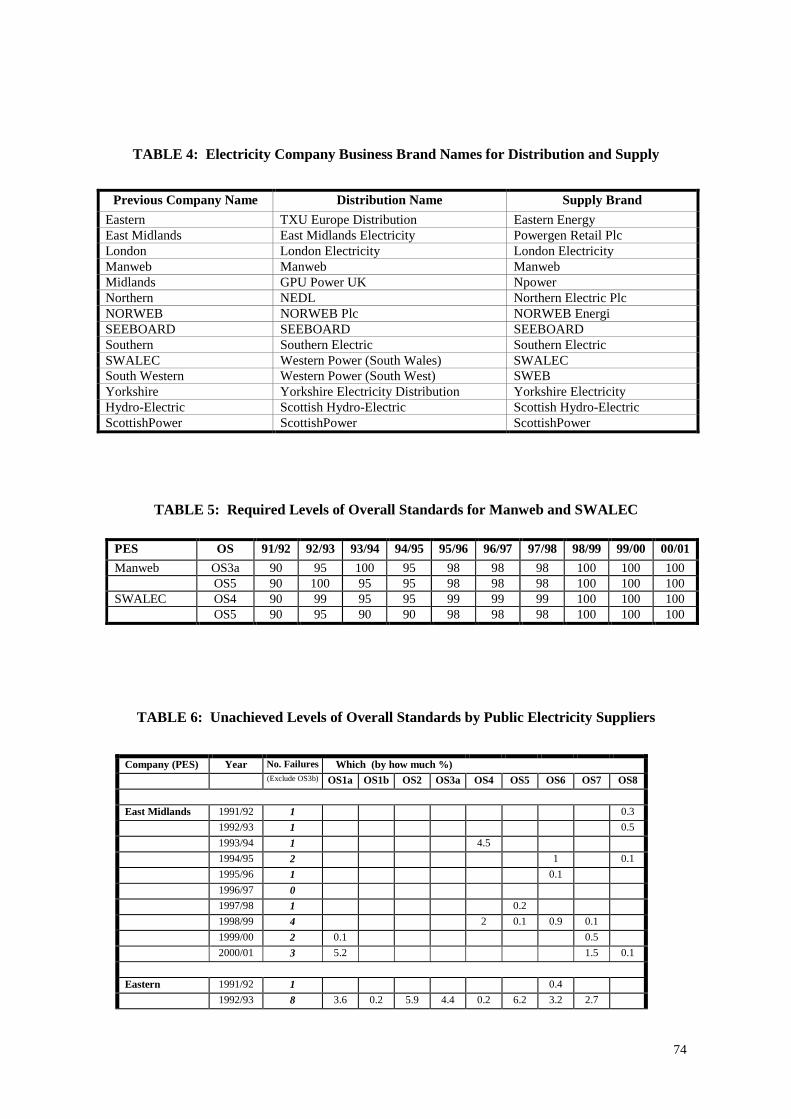
74
TABLE 4: Electricity Company Business Brand Names for Distribution and Supply
Previous Company Name Distribution Name Supply Brand Eastern TXU Europe Distribution Eastern Energy East Midlands East Midlands Electricity Powergen Retail Plc London London Electricity London Electricity Manweb Manweb Manweb Midlands GPU Power UK Npower Northern NEDL Northern Electric Plc NORWEB NORWEB Plc NORWEB Energi SEEBOARD SEEBOARD SEEBOARD Southern Southern Electric Southern Electric SWALEC Western Power (South Wales) SWALEC South Western Western Power (South West) SWEB Yorkshire Yorkshire Electricity Distribution Yorkshire Electricity Hydro-Electric Scottish Hydro-Electric Scottish Hydro-Electric ScottishPower ScottishPower ScottishPower
TABLE 5: Required Levels of Overall Standards for Manweb and SWALEC
PES OS 91/92 92/93 93/94 94/95 95/96 96/97 97/98 98/99 99/00 00/01Manweb OS3a 90 95 100 95 98 98 98 100 100 100
OS5 90 100 95 95 98 98 98 100 100 100SWALEC OS4 90 99 95 95 99 99 99 100 100 100
OS5 90 95 90 90 98 98 98 100 100 100
TABLE 6: Unachieved Levels of Overall Standards by Public Electricity Suppliers
Company (PES) Year No. Failures Which (by how much %) (Exclude OS3b) OS1a OS1b OS2 OS3a OS4 OS5 OS6 OS7 OS8
East Midlands 1991/92 1 0.3 1992/93 1 0.5 1993/94 1 4.5 1994/95 2 1 0.1 1995/96 1 0.1 1996/97 0 1997/98 1 0.2 1998/99 4 2 0.1 0.9 0.1 1999/00 2 0.1 0.5 2000/01 3 5.2 1.5 0.1
Eastern 1991/92 1 0.4 1992/93 8 3.6 0.2 5.9 4.4 0.2 6.2 3.2 2.7
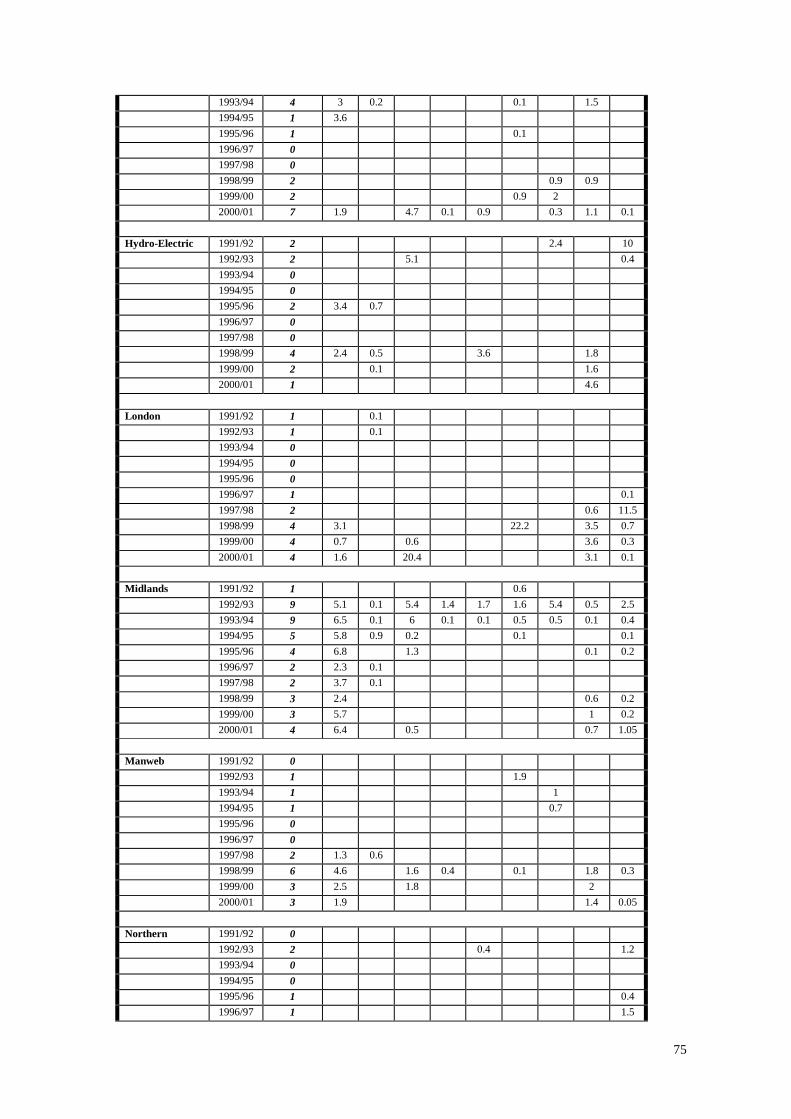
75
1993/94 4 3 0.2 0.1 1.5 1994/95 1 3.6 1995/96 1 0.1 1996/97 0 1997/98 0 1998/99 2 0.9 0.9 1999/00 2 0.9 2 2000/01 7 1.9 4.7 0.1 0.9 0.3 1.1 0.1
Hydro-Electric 1991/92 2 2.4 10 1992/93 2 5.1 0.4 1993/94 0 1994/95 0 1995/96 2 3.4 0.7 1996/97 0 1997/98 0 1998/99 4 2.4 0.5 3.6 1.8 1999/00 2 0.1 1.6 2000/01 1 4.6
London 1991/92 1 0.1 1992/93 1 0.1 1993/94 0 1994/95 0 1995/96 0 1996/97 1 0.1 1997/98 2 0.6 11.5 1998/99 4 3.1 22.2 3.5 0.7 1999/00 4 0.7 0.6 3.6 0.3 2000/01 4 1.6 20.4 3.1 0.1
Midlands 1991/92 1 0.6 1992/93 9 5.1 0.1 5.4 1.4 1.7 1.6 5.4 0.5 2.5 1993/94 9 6.5 0.1 6 0.1 0.1 0.5 0.5 0.1 0.4 1994/95 5 5.8 0.9 0.2 0.1 0.1 1995/96 4 6.8 1.3 0.1 0.2 1996/97 2 2.3 0.1 1997/98 2 3.7 0.1 1998/99 3 2.4 0.6 0.2 1999/00 3 5.7 1 0.2 2000/01 4 6.4 0.5 0.7 1.05
Manweb 1991/92 0 1992/93 1 1.9 1993/94 1 1 1994/95 1 0.7 1995/96 0 1996/97 0 1997/98 2 1.3 0.6 1998/99 6 4.6 1.6 0.4 0.1 1.8 0.3 1999/00 3 2.5 1.8 2 2000/01 3 1.9 1.4 0.05
Northern 1991/92 0 1992/93 2 0.4 1.2 1993/94 0 1994/95 0 1995/96 1 0.4 1996/97 1 1.5
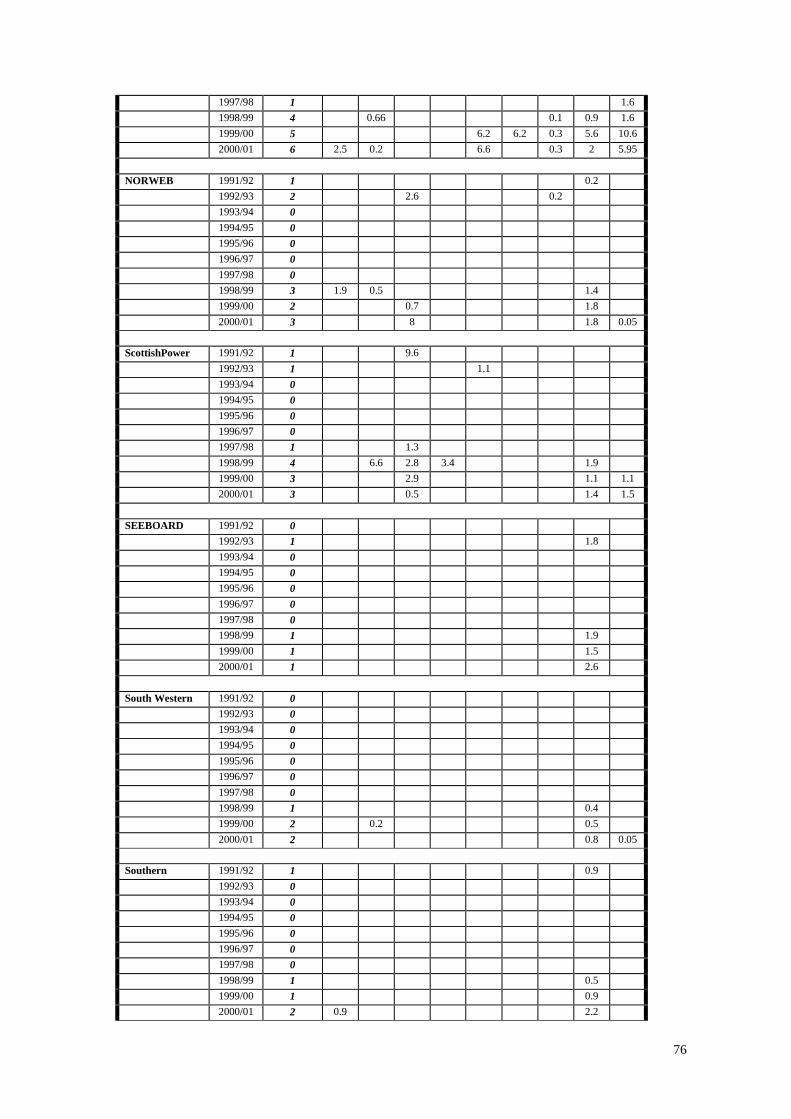
76
1997/98 1 1.6 1998/99 4 0.66 0.1 0.9 1.6 1999/00 5 6.2 6.2 0.3 5.6 10.6 2000/01 6 2.5 0.2 6.6 0.3 2 5.95
NORWEB 1991/92 1 0.2 1992/93 2 2.6 0.2 1993/94 0 1994/95 0 1995/96 0 1996/97 0 1997/98 0 1998/99 3 1.9 0.5 1.4 1999/00 2 0.7 1.8 2000/01 3 8 1.8 0.05
ScottishPower 1991/92 1 9.6 1992/93 1 1.1 1993/94 0 1994/95 0 1995/96 0 1996/97 0 1997/98 1 1.3 1998/99 4 6.6 2.8 3.4 1.9 1999/00 3 2.9 1.1 1.1 2000/01 3 0.5 1.4 1.5
SEEBOARD 1991/92 0 1992/93 1 1.8 1993/94 0 1994/95 0 1995/96 0 1996/97 0 1997/98 0 1998/99 1 1.9 1999/00 1 1.5 2000/01 1 2.6
South Western 1991/92 0 1992/93 0 1993/94 0 1994/95 0 1995/96 0 1996/97 0 1997/98 0 1998/99 1 0.4 1999/00 2 0.2 0.5 2000/01 2 0.8 0.05
Southern 1991/92 1 0.9 1992/93 0 1993/94 0 1994/95 0 1995/96 0 1996/97 0 1997/98 0 1998/99 1 0.5 1999/00 1 0.9 2000/01 2 0.9 2.2

77
SWALEC 1991/92 1 1.1
1992/93 0 1993/94 0 1994/95 0 1995/96 0 1996/97 0 1997/98 0 1998/99 1 1.4 1999/00 2 1.8 0.8 2000/01 1 1.7
Yorkshire 1991/92 0 1992/93 0 1993/94 0 1994/95 0 1995/96 0 1996/97 0 1997/98 0 1998/99 3 0.1 0.8 0.1 1999/00 1 1.2 2000/01 3 0.1 2.4 0.05
TABLE 7: Original DG Standards for Water and Sewerage Services (1989-99)
DG1 Raw Water AvailabilityIdentifies the population whose water resource availability is below the reference level
DG2 Pressure of Mains WaterIdentifies the number of customers’ properties that are subject to mains water pressuresbelow the reference level(s)
DG3 Interruptions to Water SuppliesIdentifies the number of customers’ properties that have experience a loss of supply forlonger than the reference level, without reasonable notice from the Company
DG4 Hosepipe RestrictionsIdentifies the population who have been subject to hosepipe restrictions
DG5 Flooding Incidents from SewersIdentifies the number of customers’ properties where flooding from public sewers hasoccurred at a frequency that is greater than the reference level
DG6 Response to Billing QueriesIdentifies the banded response time for meaningful responses to customer’s billing queries
DG7 Response to Written ComplaintsIdentifies the banded response time for meaningful responses to customers’ writtencomplaints
DG8 Response to Development Control ConsultationsIdentifies the banded response time for responses to development control (planningconsultations)

78
TABLE 8: Guaranteed Standards Scheme – Compensation in Water Industry (2001-)
Service Required Performance Penalty Payment
1 Responding to billingqueries
Respond within 10 working days ifrequest to change payment methodcannot be met; within 20 working daysto other account queries
£20
2 Responding to writtencomplaints
Respond fully within 10 working daysunless a visit, or enquiries of a 3rd partyare necessary; otherwise holdingresponse within 10 working daysrespond fully within 20 working days
£20 (domestic), £50(business)
3 Appointments made inwriting
Specify am/pm (before or after 1pm) onthe day; keep the appointment or give24 hours notice of cancellation
£20
4 Warning notice of aplanned supplyinterruption exceeding 4hours
Give 24 hours written notice to thecustomer
£20 (domestic), £50(business)
5 Restoring supply after aplanned interruption
Restore supply by the time specified £20 + £10 per 24hr(domestic), £50 + £25 per24hr (business)
6a Restoring supply after anunplanned interruption(except strategic mainsburst or leak)
Restore supply within 24 hours £20 + £10 per 24hr(domestic), £50 + £25 per24hr (business)
6b Restoring supply after aburst or leak on a strategicmain
Restore supply within 48 hours £20 + £10 per 24hr(domestic), £50 + £25 per24hr (business)
7 Sewer flooding in property Refund annual sewage charges if acustomer's building is flooded, but not ifcaused by severe weather
Maximum £1,000 perincident
8 Low pressure Pay £25 where a customer experienceslow pressure of one hour or more on twooccasions
£25
9 Meter installation Install a meter within 15 working daysof receiving a payment
£10
10 Drinking water quality No current standard, but currently beingproposed
--
TABLE 9: Original Comparable Performance Indicators (CPI), 1995
Indicator Name What it Measures PerformanceService Provision Meeting their commitments to
customers to install telecomsservices
Complete orders by datepromised
Customer reported faults Network reliability Minimal faults per 100 linesFault Repairs Repairing faults in target time Cleared in target timeComplaint Handling Dealing with complaints
promptlyProcessed within 20 days
Bill Accuracy Providing accurate billinformation
Minimal complaints per 1000bills

79
TABLE 10: Summary of BGT and Transco Standards of Services, 1996-1998
1996-
Required1996-
Achieved1997-
Required1997-
Achieved1998-
Required1998-
Achieved
British GasTrading
Telephone call response in 30 seconds 90 62 90 96 90 96
Replies to customer correspondence within 5days
90 76 90 99 90 100
Billing on actual BGT meter reads at least onceevery 2 years
99 96 99 98 99 99
Customer visits within 10 weeks to discussarrangements to pay
90 99 N/A N/A N/A N/A
Gas safety checks made within 28 days ofjoining GasCare
95 90 95 99 95 99
Transco Telephone answering 90 97 90 93 90 90
Replies to correspondence 90 95 90 99 90 97
Complaints recorded 100 99 100 100 100 100
Visits in response to correspondence 93 99 93 98 93 96
Notification of planned work 95 100 95 99 95 99
Making/Keeping appointments 95 99 95 99 95 99
Responding to gas emergencies (uncontrolled -1 hour)
97 95.5 97 98 97 97
Responding to gas emergencies (controlled - 2hours)
97 98 97 99 97 99
Offer alternative heating/cooking 100 100 100 100 100 100
TABLE 11: TRANSCO’s Voluntary Standards of Customer Service, 2001
Service Required Performance PenaltyPayment
Making and keeping appointments(95%)
Where required, appointments will be made on a morning or afternoon basis. Failure to give 24hours' notice of inability to attend may attract a compensation payment
£10
Alternative heating and cookingfacilities (100%)
Where Transco has to disconnect the gas supply for safety reason, it will provide alternative heatingand cooking facilities for consumers who are disabled, chronically sick, or of a pensionable age, orwhere there are children in the property
£20
Telephone calls (90%) All calls to Transco call centres to be answered within 30 seconds Discretionary
Replies to correspondence 1(90%)
Customer to receive a reply within 5 working days, except where immediate action is required.Interim replies will indicate when a full reply may be expected
Discretionary
Replies to correspondence 2(90%)
Correspondence requesting connection of premises likely to use less than 2500 therms per year willreceive a reply in 5 working days (unless request comes via a shipper or supplier)
Discretionary
Complaints (100%) A record will be kept of all complaints, from whatever source Discretionary
Visits (93%) Where a visit is appropriate, following receipt of correspondence or a complaint, contact will bemade within 2 working days. The visit will be made within 5 working days, or later with thecustomer's agreement
Discretionary
Notification of planned work (95%) Work for planned maintenance that requires interruption of the gas supply, and entry to thecustomer's premises will be the subject of notice of at least 10 working days in respect of the servicepipe and at least 5 days in respect of the meter
Discretionary
Gas emergencies (97%) In respect of gas escapes, spillage of carbon monoxide or other hazardous situations, as quickly aspossible but within at least one hour for uncontrolled escapes and two hours for controlled escapes
Discretionary
TABLE 12: BGT’s Guaranteed Standards and Penalty Payment, 2001
Serial Service Required Performance PenaltyPayment
6 Making and keepingappointments (95%)
Where required, appointments will be made on a morning orafternoon basis. Failure to give 24 hours' notice of inability toattend may attract a compensation payment
£11
9 Appointments for final meterreading or clearance (99%)
Morning or afternoon appointments (at two days’ notice) forfinal meter reading or clearance
£11
10 Special meter reading orclearance, at the customer’srequest (99%)
Visit within three working days of request. Morning ofafternoon appointments to be agreed, as required
£11

80
TABLE 13: BGT’s Levels of Overall Standards, 2001 Serial Standard Performance Level % Target
1 Telephone answering Within 30 seconds 90%2 Replies to customers Within 5 working days. Interim replies to indicate the
expected data of substantive replies 90%
3 Customer complaints A record to be kept of all written customer complaints 99%
4 Visits Following receipt of correspondence or a complaint, contact will be made within 2 working days. The visit will be made within 5 working days, or later with the customer's agreement.
93%
5 Obtaining a gas supply Request to be passed to the relevant gas transporter within 48 hours
99%
7a Credit meter accounts (meter reading)
The company will submit gas bills based on an actual meter read (can be customer reading), at least once a year
90%
7b Credit meter accounts (meter reading)
The company will submit gas bills based on an actual meter read (must be company reading), at least once every 2 years
99%
8 Meter reading frequency Attempt to read meters six months after the previous reading or attempted reading
98%
9 Final meter reading or clearance
A morning or afternoon appointment must be given, if required, with at least 2 days' notice
99%
10 Special meter reading or clearance
Visit within 3 working days of receiving a request. A morning or afternoon appointment to be agreed, if required
99%
11 Estimating procedures Procedures should favour neither BGT nor its consumers. Differences between actual and estimated gas usage will be monitored
90%, weeklysamples within
+/- 4%
12 Account payment Not later than 3 months after an unpaid bill was dispatched, clear action will be taken to prevent build-up of debt
99% of unpaidbills
13 "Help Pack" for defaulting customers
Where a customer's account is unpaid and there has been no contact with the company, BGT will send a "Help Pack", encouraging contact
99% with whomno contact has
been made
14 Visits concerning unpaid bill Where a bill remains unpaid after 13 weeks, the company's representatives will visit the customer, to discuss an arrangement to pay
95% ofconsumers
visited
15 Payment arrangements Unless standard 16 applies, the customer will be offered an affordable payment arrangement, to cover current consumption, plus a contribution towards arrears
100% ofconsumers
16 Alternatives to payment arrangements
Where a payment arrangement is unsuitable, the company will offer a prepayment meter, or a Fuel Direct arrangement
100% ofconsumers
17a Regular payment schemes Monitoring of consumption against monthly payment to be undertaken every six months, and payments adjusted accordingly
NONE. BGTmonitors its
performance tothe number of
complaintsreceived
17b Regular payment schemes Refunds will be made where there is a credit balance, and payments are in excess of the level required
100% ofrequests
18 Refunds Where the customer is entitled to a refund, it will be sent within 5 working days of the request, or of the decision that a refund is appropriate
95% ofrequested
refunds

81
19 Defective/full meters Where a defective or full meter means that the customer is off supply, a visit will be made within four hours of the request
95% of requests
20 Older, disabled or chronically sick consumers
BGT will maintain a "Gas Care Register" as described in the relevant code of practice
NONE. BGTmonitors the
numbersregistered and
carries out"internal
analysis"21 Gas safety checks for those
on the "Gas Care Register" A check will be made within 28 days of the customer's joining the register, or later by agreement
95% of new GasCare consumers
22 Energy Efficiency (Services) Consumers to be advised annually of energy efficiency services available, and of a point of contact for further information
100% ofconsumers
23 Energy Efficiency (Advice) Free energy efficiency advice to be available from trained specialists, at local call rates
NONE, but BGTmonitor thenumber ofenquiries
24 Energy Efficiency (and debt) Information on reduction of energy costs to be given when visiting consumers to discuss debt problems
100% ofconsumers
visited
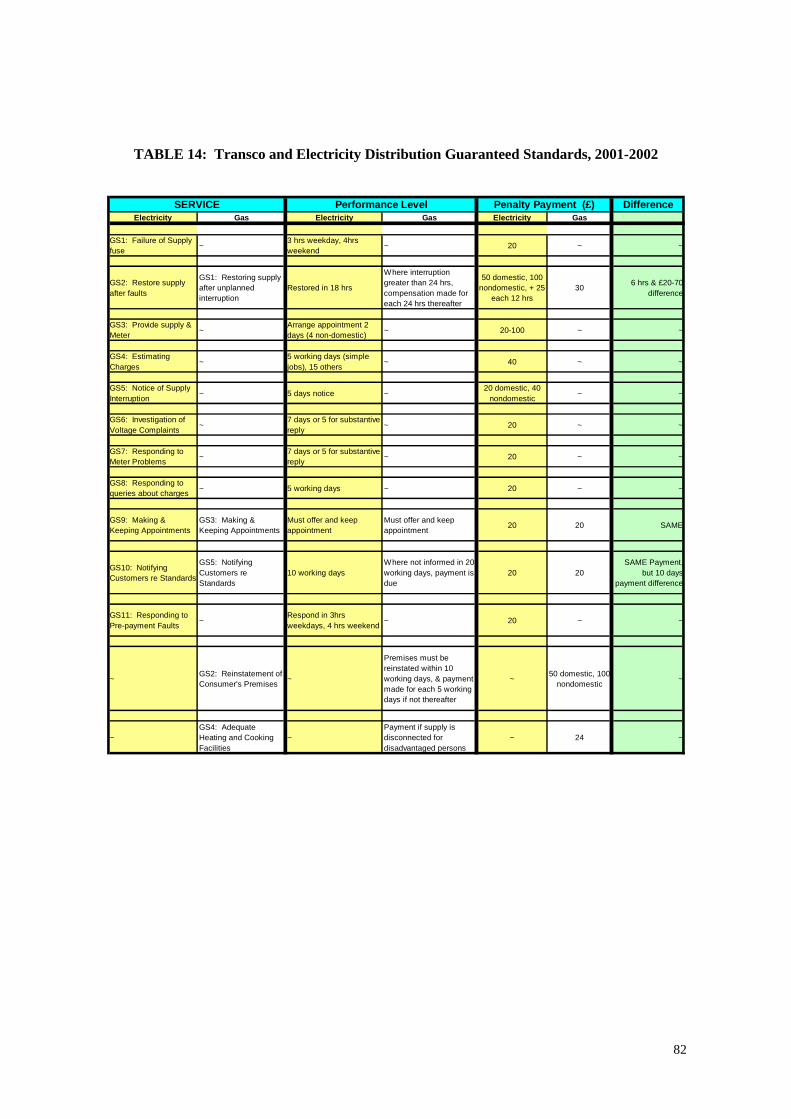
82
TABLE 14: Transco and Electricity Distribution Guaranteed Standards, 2001-2002
Difference
Electricity Gas Electricity Gas Electricity Gas
GS1: Failure of Supply fuse ~ 3 hrs weekday, 4hrs
weekend ~ 20 ~ ~
GS2: Restore supply after faults
GS1: Restoring supply after unplanned interruption
Restored in 18 hrs
Where interruption greater than 24 hrs, compensation made for each 24 hrs thereafter
50 domestic, 100 nondomestic, + 25
each 12 hrs30 6 hrs & £20-70
difference
GS3: Provide supply & Meter ~
Arrange appointment 2 days (4 non-domestic) ~ 20-100 ~ ~
GS4: Estimating Charges ~
5 working days (simple jobs), 15 others ~ 40 ~ ~
GS5: Notice of Supply Interruption ~ 5 days notice ~
20 domestic, 40 nondomestic ~ ~
GS6: Investigation of Voltage Complaints ~
7 days or 5 for substantive reply ~ 20 ~ ~
GS7: Responding to Meter Problems ~ 7 days or 5 for substantive
reply ~ 20 ~ ~
GS8: Responding to queries about charges ~ 5 working days ~ 20 ~ ~
GS9: Making & Keeping Appointments
GS3: Making & Keeping Appointments
Must offer and keep appointment
Must offer and keep appointment 20 20 SAME
GS10: Notifying Customers re Standards
GS5: Notifying Customers re Standards
10 working daysWhere not informed in 20 working days, payment is due
20 20SAME Payment,
but 10 days payment difference
GS11: Responding to Pre-payment Faults ~
Respond in 3hrs weekdays, 4 hrs weekend ~ 20 ~ ~
~ GS2: Reinstatement of Consumer's Premises ~
Premises must be reinstated within 10 working days, & payment made for each 5 working days if not thereafter
~ 50 domestic, 100 nondomestic ~
~GS4: Adequate Heating and Cooking Facilities
~Payment if supply is disconnected for disadvantaged persons
~ 24 ~
SERVICE Performance Level Penalty Payment (£)

83
TABLE 15: Transco and Electricity Distribution Overall Standards, 2001-2002
DifferenceElectricity Gas Electricity Gas Electricity Gas
OS1a: Faults reconnected in 3 hrs ~ 3 hrs ~ Various ~ ~
OS1b: Faults reconnected in 18 hrs ~ 18 hrs ~ Various ~ ~
OS2: Voltage faults corrected ~ 6 months ~ 100 ~ ~
OS3a: Connect domestic customers within 30 days
~ 30 working days ~ 100 ~ ~
OS3b: Connect non-domestic customers within 40 days
~ 40 working days ~ 100 ~ ~
OS4: Those cut off to be reconnected after payment of bill
~ Within the day ~ 100 ~ ~
OS5: Visiting to move meter if asked by customer
~ Within 15 days ~ 100 ~ ~
OS6: Changing meters when necessary on change of tariff
~ 10 working days ~ 100 ~ ~
OS7: Ensure firm reading of meters ~ at least once a year ~ 100 ~ ~
OS8: Respond to LETTERS
OS4: Acknowledge correspondence 10 working days
Must acknowledge within 5 working days
100 90 5 days, 10% difference
~ OS1: Respond to telephone calls ~ 30 seconds ~ 90 ~
~ OS2: Notify planned supply interruptions ~
A letter to be provided 5 working days in advance
~ 95 ~
~OS3: Informing customers when due to be reconnected
~ 12 hours of knowledge ~ 97 ~
~ OS5: Visits after receipt of complaint ~
2 working days after receipt of correspondence, visit 5 working days after contact
~ 93 ~
~ OS6: Response to COMPLAINTS ~
Substantive response within 10 working days
~ 90 ~
~ OS7: Respond to EMERGENCY calls ~
1 hr uncontrolled escapes, 2 hrs controlled escapes
~ 97 ~
SERVICE Performance Level Achievement Level (%)

84
FIGURES
Figure 1:
GS9 - Making an Appointment
0
500
1000
1500
2000
2500
1991
-1992
1992
-1993
1993
-1994
1994
-1995
1995
-1996
1996
-1997
1997
-1998
1998
-1999
1999
-2000
2000
-2001
Time (Year)
IND
UST
RY
PAYM
ENT
0
1000
2000
3000
4000
5000
6000
7000
8000
9000
No.
Pay
men
ts M
ade
East Midlands
Eastern
London
Northern
SEEBOARD
Hydro-Electric
Manweb
Midlands
NORWEB
ScottishPower
South Western
Southern
SWALEC
Yorkshire
INDUSTRY
Figure 2:
GS5 - Notice of Supply Interruption
0
100
200
300
400
500
600
700
800
1991
-1992
1992
-1993
1993
-1994
1994
-1995
1995
-1996
1996
-1997
1997
-1998
1998
-1999
1999
-2000
2000
-2001
Time (Year)
No.
of P
aym
ents
Mad
e
0
500
1000
1500
2000
2500
IND
UST
RY
PER
FOR
MA
NC
E
East Midlands
Eastern
Hydro-Electric
London
Manweb
Midlands
Northern
NORWEB
ScottishPower
SEEBOARD
South Western
Southern
SWALEC
Yorkshire
INDUSTRY

85
Figure 3:
Domestic Disconnections
0
1000
2000
3000
4000
5000
6000
7000
1990
-1991
1991
-1992
1992
-1993
1993
-1994
1994
-1995
1995
-1996
1996
-1997
1997
-1998
1998
-1999
1999
-2000
Time (Year)
IND
UST
RY
PER
FOR
MA
NC
E
0
10000
20000
30000
40000
50000
60000
70000
East Midlands
Eastern
Hydro-Electric
Manweb
Midlands
Northern
NORWEB
SEEBOARD
South Western
Southern
SWALEC
Yorkshire
INDUSTRY
London
ScottishPower
Figure 4:
GS4 - Estimating Charges
0
100
200
300
400
500
600
1991
-1992
1992
-1993
1993
-1994
1994
-1995
1995
-1996
1996
-1997
1997
-1998
1998
-1999
1999
-2000
2000
-2001
Time (Year)
IND
UST
RY
PER
FOR
MA
NC
E
0
5
10
15
20
25
30
35
40
45
50
No.
Pay
men
ts M
ade
Hydro-Electric
INDUSTRY
South Western
East Midlands
Eastern
London
Manweb
Midlands
Northern
NORWEB
ScottishPower
SEEBOARD
Southern
SWALEC
Yorkshire

86
Figure 5:
GS10 - Notifying Customers of Payment under the Standards
0
50
100
150
200
250
1991
-1992
1992
-1993
1993
-1994
1994
-1995
1995
-1996
1996
-1997
1997
-1998
1998
-1999
1999
-2000
2000
-2001
Time (Year)
No.
Pay
men
ts M
ade
0
100
200
300
400
500
600
700
800
900
1000
IND
UST
RY
PER
FOR
MA
NC
E
East Midlands
Eastern
Hydro-Electric
London
Manweb
Midlands
NORWEB
ScottishPower
SEEBOARD
South Western
Southern
SWALEC
Yorkshire
INDUSTRY
Northern
Figure 6:
GS8 - Responding to Queries about Charges and Payments
0
200
400
600
800
1000
1200
1400
1991
-1992
1992
-1993
1993
-1994
1994
-1995
1995
-1996
1996
-1997
1997
-1998
1998
-1999
1999
-2000
2000
-2001
Time (Year)
IND
UST
RY/
CO
MA
PNY
PER
FOR
MA
NC
E
0
20
40
60
80
100
120
No.
Pay
men
ts M
ade
East Midlands
Eastern
INDUSTRY
London
Manweb
Midlands
Northern
SEEBOARD
South Western
Hydro-Electric
NORWEB
ScottishPower
Southern
SWALEC
Yorkshire

87
Figure 7:
East Midlands - Guaranteed Standards
0
500
1000
1500
2000
2500
1991
-1992
1992
-1993
1993
-1994
1994
-1995
1995
-1996
1996
-1997
1997
-1998
1998
-1999
1999
-2000
2000
-2001
Time (Year)
0
10
20
30
40
50
60
70
80
90
100
Appointments
DomesticDisconnectionsEstimate ofChargesMeter Disputes
Notice PlannedInterruptionsPayment inPeriodProviding aSupplyCustomerComplaintsResponding toCustomersSuppliers' Fuse
VoltageComplaintsRestoration ofSupply >12hrsRestoration ofSupply >24hrs
Figure 8:
London - Guaranteed Standards
0
10
20
30
40
50
60
1991
-1992
1992
-1993
1993
-1994
1994
-1995
1995
-1996
1996
-1997
1997
-1998
1998
-1999
1999
-2000
2000
-2001
Time (Year)
0
1000
2000
3000
4000
5000
6000
7000
8000
9000
Estimate ofCharges
Meter Disputes
Notice PlannedInterruptions
Payment in Period
Providing aSupply
Appointments
DomesticDisconnections
Responding toCustomers
Suppliers' Fuse
VoltageComplaints
Restoration ofSupply >12hrs
Restoration ofSupply >24hrs
CustomerComplaints

88
Figure 9:
Hydro-Electric OS Actual Performance
75
80
85
90
95
100
1991
-1992
1992
-1993
1993
-1994
1994
-1995
1995
-1996
1996
-1997
1997
-1998
1998
-1999
1999
-2000
2000
-2001
Time (Year)
Perf
orm
ance
(%)
OS1aOS1bOS2OS3aOS3bOS4OS5OS6OS7OS8
Figure 10:
Volume of PES Unachieved Overall Standards
0
1
2
3
4
5
6
7
8
9
10
1991
/92
1992
/93
1993
/94
1994
/95
1995
/96
1996
/97
1997
/98
1998
/99
1999
/00
2000
/01
Time (Year)
Num
ber o
f OS
NO
T ac
hiev
ed
East MidlandsEasternHydro-ElectricLondonMidlandsManwebNorthernNORWEBScottishPowerSEEBOARDSouth WesternSouthernSWALECYorkshire

89
Figure 11:
Average Performance - Overall StandardsMidlands, SEEBOARD, South Western, SWALEC, Yorkshire
94
95
96
97
98
99
100
1991
-1992
1992
-1993
1993
-1994
1994
-1995
1995
-1996
1996
-1997
1997
-1998
1998
-1999
1999
-2000
2000
-2001
Time (Year)
Perfo
rman
ce (%
)
Midlands
SEEBOARD
SouthWestern
SWALEC
Yorkshire
Figure 12:
AVERAGE PES Actual Achieved Level of Overall Standards
85
87
89
91
93
95
97
99
101
1991
-1992
1992
-1993
1993
-1994
1994
-1995
1995
-1996
1996
-1997
1997
-1998
1998
-1999
1999
-2000
2000
-2001
Time (Year)
Perfo
rman
ce (%
)
OS1aOS1bOS2OS3aOS4OS5OS6OS7OS8
OS3b excluded due to unavailability of data

90
Figure 13:
AVERAGE REQUIRED PES Overall Standards
78
83
88
93
98
1991
-1992
1992
-1993
1993
-1994
1994
-1995
1995
-1996
1996
-1997
1997
-1998
1998
-1999
1999
-2000
2000
-2001
Time (Year)
Perfo
rman
ce (%
)
OS1aOS1bOS2OS3aOS4OS5OS6OS7OS8
OS3b excluded due to unavailability of data
Figure 14:
Eastern - Unachieved OS
0
1
2
3
4
5
6
1991
/92
1992
/93
1993
/94
1994
/95
1995
/96
1996
/97
1997
/98
1998
/99
1999
/00
2000
/01
Time (Year)
% U
nach
ieve
d O
S
OS1aOS1bOS2OS3aOS4OS5OS6OS7OS8
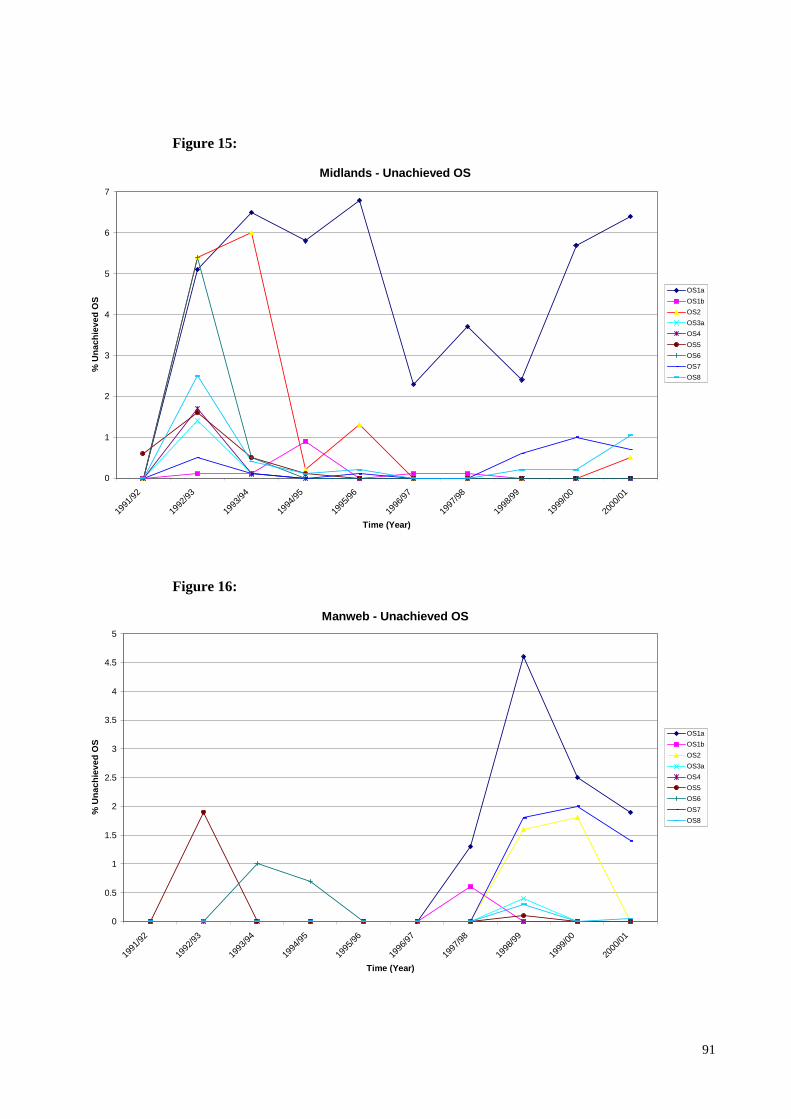
91
Figure 15:
Midlands - Unachieved OS
0
1
2
3
4
5
6
7
1991
/92
1992
/93
1993
/94
1994
/95
1995
/96
1996
/97
1997
/98
1998
/99
1999
/00
2000
/01
Time (Year)
% U
nach
ieve
d O
S
OS1aOS1bOS2OS3aOS4OS5OS6OS7OS8
Figure 16:
Manweb - Unachieved OS
0
0.5
1
1.5
2
2.5
3
3.5
4
4.5
5
1991
/92
1992
/93
1993
/94
1994
/95
1995
/96
1996
/97
1997
/98
1998
/99
1999
/00
2000
/01
Time (Year)
% U
nach
ieve
d O
S
OS1aOS1bOS2OS3aOS4OS5OS6OS7OS8

92
Figure 17:
Hydro-Electric - Unachieved Overall Standards
0
2
4
6
8
10
1991
/92
1992
/93
1993
/94
1994
/95
1995
/96
1996
/97
1997
/98
1998
/99
1999
/00
2000
/01
Time (Year)
% U
nach
ieve
d O
S
OS1aOS1bOS2OS3aOS4OS5OS6OS7OS8
Figure 18:
Electricity Supply Industry - Guaranteed Standards
0
200
400
600
800
1000
1200
1400
1991
-1992
1992
-1993
1993
-1994
1994
-1995
1995
-1996
1996
-1997
1997
-1998
1998
-1999
1999
-2000
2000
-2001
Time (Year)
0
5000
10000
15000
20000
25000
30000
35000
40000
45000
Estimate of Charges Meter Disputes Payment in Period Providing a Supply Responding to Customers
Appointments Domestic Disconnections Notice Planned Interruptions Suppliers' Fuse Voltage Complaints
Restoration of Supply >12hrs Restoration of Supply >24hrs Customer Complaints
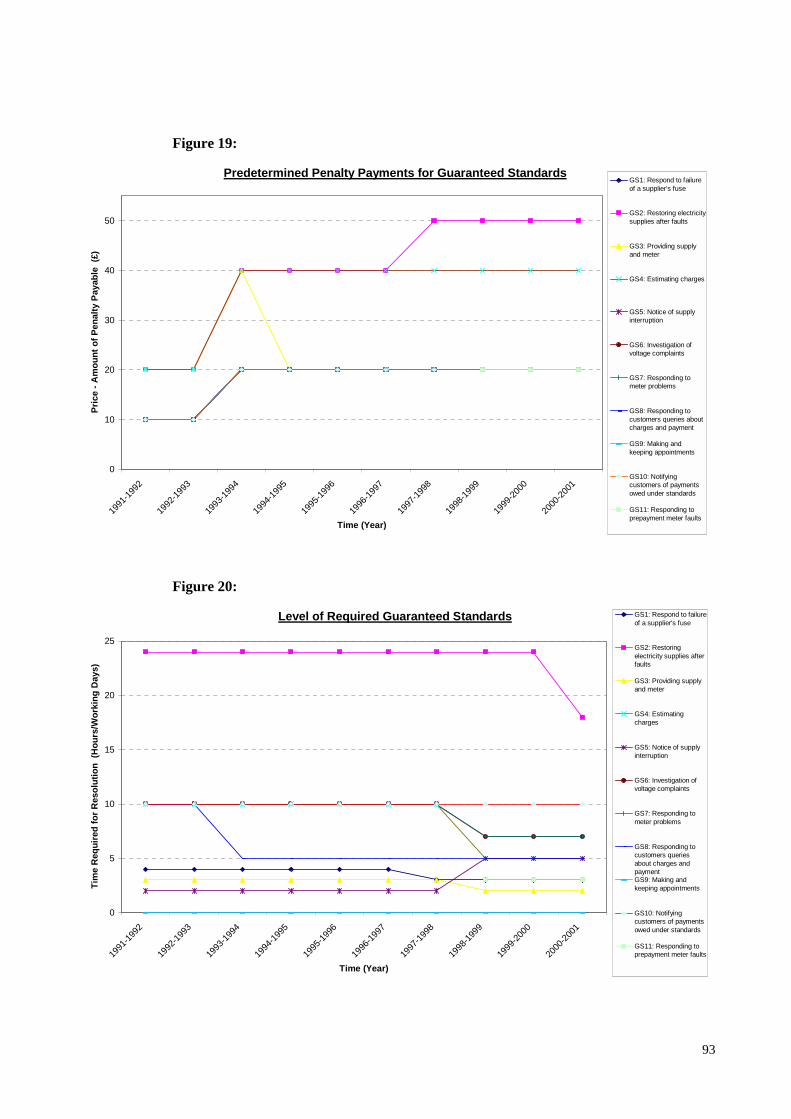
93
Figure 19:
Predetermined Penalty Payments for Guaranteed Standards
0
10
20
30
40
50
1991
-1992
1992
-1993
1993
-1994
1994
-1995
1995
-1996
1996
-1997
1997
-1998
1998
-1999
1999
-2000
2000
-2001
Time (Year)
Pric
e - A
mou
nt o
f Pen
alty
Pay
able
(£)
GS1: Respond to failureof a supplier's fuse
GS2: Restoring electricitysupplies after faults
GS3: Providing supplyand meter
GS4: Estimating charges
GS5: Notice of supplyinterruption
GS6: Investigation ofvoltage complaints
GS7: Responding tometer problems
GS8: Responding tocustomers queries aboutcharges and payment
GS9: Making andkeeping appointments
GS10: Notifyingcustomers of paymentsowed under standards
GS11: Responding toprepayment meter faults
Figure 20:
Level of Required Guaranteed Standards
0
5
10
15
20
25
1991
-1992
1992
-1993
1993
-1994
1994
-1995
1995
-1996
1996
-1997
1997
-1998
1998
-1999
1999
-2000
2000
-2001
Time (Year)
Tim
e R
equi
red
for R
esol
utio
n (H
ours
/Wor
king
Day
s)
GS1: Respond to failureof a supplier's fuse
GS2: Restoringelectricity supplies afterfaults
GS3: Providing supplyand meter
GS4: Estimatingcharges
GS5: Notice of supplyinterruption
GS6: Investigation ofvoltage complaints
GS7: Responding tometer problems
GS8: Responding tocustomers queriesabout charges andpaymentGS9: Making andkeeping appointments
GS10: Notifyingcustomers of paymentsowed under standards
GS11: Responding toprepayment meter faults

94
Figure 21:
SUPPLY Interruptions(to see AVERAGE clearly)
80
85
90
95
100
105
110
115
120
125
90/91
91/92
92/93
93/94
94/95
95/96
96/97
97/98
98/99
99/00
00/01
Time (Year)
Perf
orm
ance
(per
100
cus
tom
ers)
Eastern
East Midlands
London
Manweb
Midlands
Northern
NORWEB
SEEBOARD
Southern
SWALEC
South Western
Yorkshire
Hydro-Electric
ScottishPower
AVERAGE
Figure 22:
AVAILABILITY: Minutes Lost(Zoomed View of Average Line)
70
90
110
130
150
170
190
210
230
90/91
91/92
92/93
93/94
94/95
95/96
96/97
97/98
98/99
99/00
00/01
Time (Year)
Min
utes
Los
t (pe
r con
nect
ed c
usto
mer
)
Eastern
East Midlands
London
Manweb
Midlands
Northern
NORWEB
SEEBOARD
Southern
SWALEC
South Western
Yorkshire
Hydro-Electric
ScottishPower
AVERAGE

95
Figure 23:
QUALITY OF SERVICE: Interruptions due to Distribution Faults(Total of those not restored within 3 hours)
5
10
15
20
25
30
35
90/91
91/92
92/93
93/94
94/95
95/96
96/97
97/98
98/99
99/00
00/01
Time (Years)
Perfo
rman
ce (%
)
Eastern
East Midlands
London
Manweb
Midlands
Northern
NORWEB
SEEBOARD
Southerm
SWALEC
South Western
Yorkshire
Hydro-Electric
ScottishPower
Figure 24:
QUALITY OF SERVICE: Interruptions due to Distribution Faults(Not Restored within 24 Hours - zoomed view)
0
0.2
0.4
0.6
0.8
1
1.2
1.4
1.6
1.8
2
90/91
91/92
92/93
93/94
94/95
95/96
96/97
97/98
98/99
99/00
00/01
Time (Year)
Perfo
rman
ce (%
)
Eastern
East Midlands
London
Manweb
Midlands
Northern
NORWEB
SEEBOARD
Southern
SWALEC
South Western
Yorkshire
Hydro-Electric
ScottishPower
AVERAGE

96
Figure 25:
NGC Average Annual System Availability
90
91
92
93
94
95
96
97
98
99
100
1990
-1991
1991
-1992
1992
-1993
1993
-1994
1994
-1995
1995
-1996
1996
-1997
1997
-1998
1998
-1999
1999
-2000
Time (Years)
% A
vera
ge S
yste
m A
vaila
bilit
y
Average AnnualSystemAvailability
Winter PeakSystemAvailability
Figure 26:
NGC Interconnector Availability
85
87
89
91
93
95
97
99
1990
-1991
1991
-1992
1992
-1993
1993
-1994
1994
-1995
1995
-1996
1996
-1997
1997
-1998
1998
-1999
1999
-2000
Time (Years)
% In
terc
onne
ctor
Ann
ual A
vaila
bilit
y
FrenchInterconnectorAvailability
ScottishInterconnectorAvailability

97
Figure 27:
NGC Unsupplied Energy
0
50
100
150
200
250
300
350
1990
-1991
1991
-1992
1992
-1993
1993
-1994
1994
-1995
1995
-1996
1996
-1997
1997
-1998
1998
-1999
1999
-2000
Time (Year)
MW
h (A
vera
ge a
nd E
stim
ated
)
0
500
1000
1500
2000
2500
3000
3500
AverageIncidentDuration
AverageUnsuppliedEnergy perincident
EstimatedUnsuppliedEnergy
Figure 28:
Industry Performance of DGs
0
5
10
15
20
25
30
35
40
1990
-1991
1991
-1992
1992
-1993
1993
-1994
1994
-1995
1995
-1996
1996
-1997
1997
-1998
1998
-1999
1999
-2000
2000
-2001
Time (Years)
Perf
orm
ance
(%)
DG2: Property at risk oflow pressure
DG3: Properties subjectto unplanned supplyinterruptions of 12+
DG4: Population subjectto hosepipe bans
DG5: Properties subjectto sewer floodingincidents (overloading
DG6: Billing contactsnot responded to (within5 working days)
DG7: Written contactsnot responded to (within10 working days)
DG8: Bills not based onmeter readings
DG9: Receivedtelephone calls notanswered within 30seconds

98
Figure 29:
Response to Written Contacts
20
30
40
50
60
70
80
90
100
1989
-1990
1990
-1991
1991
-1992
1992
-1993
1993
-1994
1994
-1995
1995
-1996
1996
-1997
1997
-1998
1998
-1999
1999
-2000
2000
-2001
Time (Years)
Perf
orm
ance
(%)
Anglian
Bournemouth andWest HantsBristol
Cambridge
Dee Valley
Dwr Cymru
Essex and Suffolk
Folkstone andDoverMid Kent
Northumbrian
Portsmouth
Severn Trent
South East Water
South Staffs
South West
Southern
Sutton and EastSurreyTendring Hundred
Thames
Three Valleys
United Utilities
Wessex
Yorkshire
Figure 30:
Response to Billing Contacts
40
50
60
70
80
90
100
1989
-1990
1990
-1991
1991
-1992
1992
-1993
1993
-1994
1994
-1995
1995
-1996
1996
-1997
1997
-1998
1998
-1999
1999
-2000
2000
-2001
Time (Years)
Perf
orm
ance
(%)
Anglian
Bournemouth and WestHantsBristol
Cambridge
Dee Valley
Dwr Cymru
Essex and Suffolk
Folkstone and Dover
Mid Kent
Northumbrian
Portsmouth
Severn Trent
South East Water
South Staffs
South West
Southern
Sutton and East Surrey
Tendring Hundred
Thames
Three Valleys
United Utilities
Wessex
Yorkshire

99
Figure 31:
DG8 - Bills for Metered Customers
90
91
92
93
94
95
96
97
98
99
100
1995
-1996
1996
-1997
1997
-1998
1998
-1999
1999
-2000
2000
-2001
Time (Years)
Ach
ieve
men
t (%
)
Anglian
Bournemouth andWest HantsBristol
Cambridge
Dee Valley
Dwr Cymru
Essex and Suffolk
Folkstone and Dover
Mid Kent
Northumbrian
Portsmouth
Severn Trent
South East Water
South Staffs
South West
Southern
Sutton and EastSurreyTendring Hundred
Thames
Three Valleys
United Utilities
Wessex
Yorkshire
Figure 32:
Flooding from Sewers
0
20
40
60
80
100
120
140
160
180
1989
-1990
1990
-1991
1991
-1992
1992
-1993
1993
-1994
1994
-1995
1995
-1996
1996
-1997
1997
-1998
1998
-1999
1999
-2000
2000
-2001
Time (Year)
Perf
orm
ance
(No.
Con
nect
ed P
rope
rtie
s)
Anglian
Dwr Cymru
Northumbrian
Severn Trent
South West
Southern
Thames
United Utilities
Wessex
Yorkshire

100
Figure 33:
DG9 - Ease of Telephone Contact
40
50
60
70
80
90
100
1996
-1997
1997
-1998
1998
-1999
1999
-2000
2000
-2001
Time (Year)
Perf
orm
ance
(%)
Anglian
Bournemouth andWest HantsBristol
Cambridge
Dee Valley
Dwr Cymru
Essex and Suffolk
Folkstone and Dover
Mid Kent
Northumbrian
Portsmouth
Severn Trent
South East Water
South Staffs
South West
Southern
Sutton and EastSurreyTendring Hundred
Thames
Three Valleys
United Utilities
Wessex
Yorkshire
Figure 34:
Pressure of Mains Water
0
5
10
15
20
25
30
35
40
45
1989
-1990
1990
-1991
1991
-1992
1992
-1993
1993
-1994
1994
-1995
1995
-1996
1996
-1997
1997
-1998
1998
-1999
1999
-2000
2000
-2001
Time (Year)
Con
nect
ed P
rope
rtie
s be
low
refe
renc
e le
vel
Anglian
Bournemouth and WestHantsBristol
Cambridge
Dee Valley
Dwr Cymru
Essex and Suffolk
Folkstone and Dover
Mid Kent
Northumbrian
Portsmouth
Severn Trent
South East Water
South Staffs
South West
Southern
Sutton and East Surrey
Tendring Hundred
Thames
Three Valleys
United Utilities
Wessex
Yorkshire
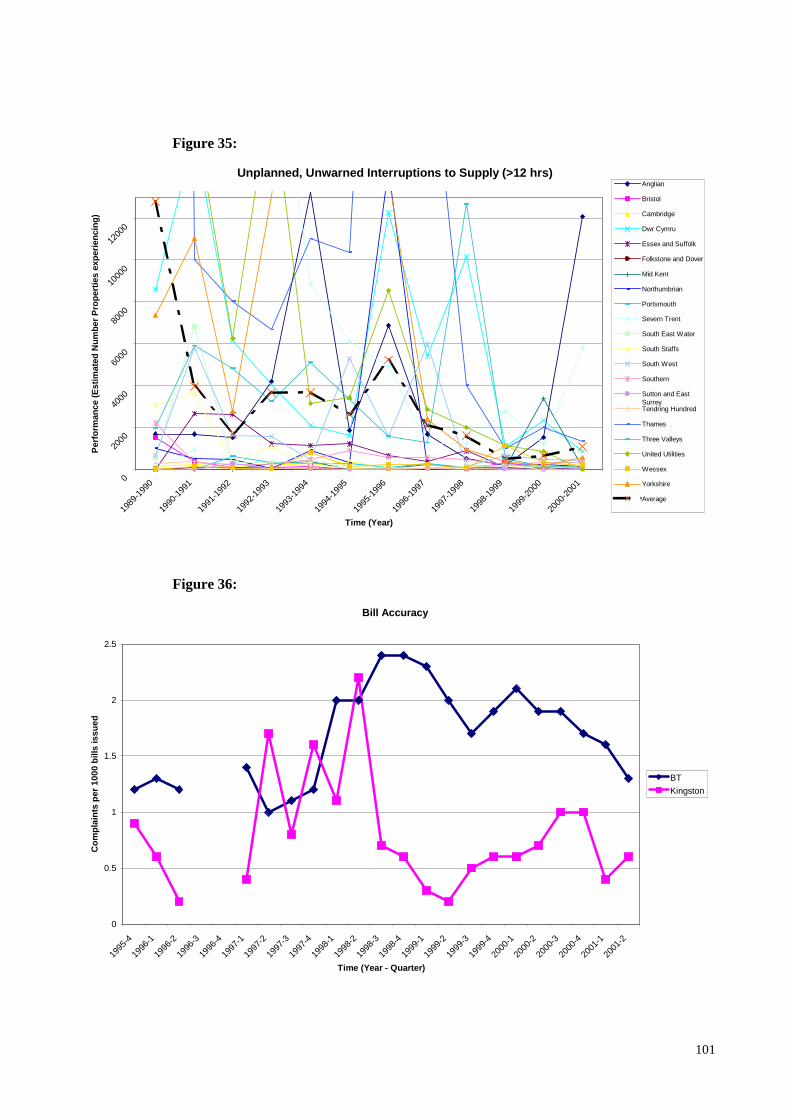
101
Figure 35:
Unplanned, Unwarned Interruptions to Supply (>12 hrs)
0
2000
4000
6000
8000
1000
0
1200
0
1989
-1990
1990
-1991
1991
-1992
1992
-1993
1993
-1994
1994
-1995
1995
-1996
1996
-1997
1997
-1998
1998
-1999
1999
-2000
2000
-2001
Time (Year)
Perfo
rman
ce (E
stim
ated
Num
ber P
rope
rties
exp
erie
ncin
g)
Anglian
Bristol
Cambridge
Dwr Cymru
Essex and Suffolk
Folkstone and Dover
Mid Kent
Northumbrian
Portsmouth
Severn Trent
South East Water
South Staffs
South West
Southern
Sutton and EastSurreyTendring Hundred
Thames
Three Valleys
United Utilities
Wessex
Yorkshire
Average
Figure 36:
Bill Accuracy
0
0.5
1
1.5
2
2.5
1995
-4
1996
-1
1996
-2
1996
-3
1996
-4
1997
-1
1997
-2
1997
-3
1997
-4
1998
-1
1998
-2
1998
-3
1998
-4
1999
-1
1999
-2
1999
-3
1999
-4
2000
-1
2000
-2
2000
-3
2000
-4
2001
-1
2001
-2
Time (Year - Quarter)
Com
plai
nts
per 1
000
bills
issu
ed
BTKingston

102
Figure 37:
Customer Reported Faults
2.5
3
3.5
4
4.5
5
5.5
1995
-4
1996
-1
1996
-2
1996
-3
1996
-4
1997
-1
1997
-2
1997
-3
1997
-4
1998
-1
1998
-2
1998
-3
1998
-4
1999
-1
1999
-2
1999
-3
1999
-4
2000
-1
2000
-2
2000
-3
2000
-4
2001
-1
2001
-2
Time (Year - Quarter)
Rep
orte
d Fa
ults
per
100
line
s (%
)
BTKingston
Figure 38:
Fault Reports Cleared in Target Time
60
65
70
75
80
85
90
95
100
1995
-4
1996
-1
1996
-2
1996
-3
1996
-4
1997
-1
1997
-2
1997
-3
1997
-4
1998
-1
1998
-2
1998
-3
1998
-4
1999
-1
1999
-2
1999
-3
1999
-4
2000
-1
2000
-2
2000
-3
2000
-4
2001
-1
2001
-2
Time (Year - Quarter)
% o
f Fau
lts c
lear
ed
BTKingston

103
Figure 39
Repeated Reported Faults
5
6
7
8
9
10
11
12
1999
-1
1999
-2
1999
-3
1999
-4
2000
-1
2000
-2
2000
-3
2000
-4
2001
-1
2001
-2
Time (Year - Quarter)
% F
aults
Rep
eate
d w
ithin
30
days
of 1
st re
solu
tion
BTKingston
Figure 40:
Order Completed by Date Promised
95
95.5
96
96.5
97
97.5
98
98.5
99
99.5
100
1995
-4
1996
-1
1996
-2
1996
-3
1996
-4
1997
-1
1997
-2
1997
-3
1997
-4
1998
-1
1998
-2
1998
-3
1998
-4
1999
-1
1999
-2
1999
-3
1999
-4
2000
-1
2000
-2
2000
-3
2000
-4
2001
-1
2001
-2
Time (Year - Quarter)
% O
rder
Com
plet
ed in
Tim
e
BTKingston

104
Figure 41:
Complaint Handling
94
95
96
97
98
99
100
1995
-4
1996
-1
1996
-2
1996
-3
1996
-4
1997
-1
1997
-2
1997
-3
1997
-4
1998
-1
1998
-2
1998
-3
1998
-4
1999
-1
1999
-2
1999
-3
1999
-4
2000
-1
2000
-2
2000
-3
2000
-4
2001
-1
2001
-2
Time (Year - Quarter)
% P
roce
ssed
with
in 2
0 da
ys
BTKingston