sequential versus simultaneous market...
TRANSCRIPT
1
Sequential Versus Simultaneous Market Delineation: TheRelevant Antitrust Market for Salmon
by
Niels HaldrupDept. of Economics, University of Aarhus,
& Copenhagen Economics ApS&
Peter Møllgaard*Dept. of Economics, Copenhagen Business School
Centre for Industrial Economics & Copenhagen Economics ApS& Visiting Professor at CCP, March to April 2005
&Claus Kastberg Nielsen
Copenhagen Economics ApS
CCP Working Paper 05-2
Abstract: Delineation of the relevant market forms a pivotal part of mostantitrust cases. The standard approach is sequential. First the product market isdelineated, then the geographical market is defined. Demand and supply substitutionin both the product dimension and the geographical dimension will normally bestronger than substitution in either dimension. By ignoring this one might decide firstto define products narrowly and then to define the geographical extent narrowlyignoring the possibility of a diagonal substitution. These reflections are important inthe empirical delineation of product and geographical markets. Using a unique dataset for prices of Norwegian and Scottish salmon, we propose a methodology forsimultaneous market delineation and we demonstrate that compared to a sequentialapproach conclusions will be reversed.March 2005
JEL Classification: C3; K21; L41; Q22Keywords: Relevant Market; Econometric Delineation; Salmon.
Acknowledgments:We would like to thank Tobias Købke of Copenhagen Economics ApS for excellentresearch assistance and the Centre of Industrial Economics for financial support.
Contact details:* Copenhagen Business School, Soljberg Plads 3, C5; DK-2000 Frederiksberg,Denmark. Email: [email protected]
ISSN 1745-9648

1 IntroductionDelineation of the relevant market constitutes a pivotal part of most antitrustcases. The standard approach is sequential. First the product market is delin-eated, then the geographical market is defined. However, demand and supplysubstitution in both the product dimension and the geographical dimension willnormally be stronger than substitution in either dimension at a time. By ignor-ing this, one might decide first to define products narrowly and then to definegeographical extent narrowly ignoring the possibility of diagonal substitution.Price tests are frequently used in market delineation because detailed produc-
tion and sales data are inaccessible. Using a unique price data set, we demon-strate that the sequential approach can reverse conclusions compared with amore proper simultaneous approach to market definition. We use monthly ex-port price data for farmed salmon produced in Norway and Scotland. Datahas been acquired from Norwegian Kontali and Eurostat’s Comext. All pricesare converted to the same currency and unit of account (Euros per kilo). Thesample runs from January 1995 through August 2003.The excellent data for this market allow for the use of a number of differ-
ent applications of modern time series econometrics that each corroborate theconclusions. As a powerful tool in the analysis of joint market delineation wesuggest to employ the Johansen ML procedure for cointegrated systems whichtakes advantage of an extended information set compared to a sequential pro-cedure using univariate unit root tests, e.g. Dickey-Fuller tests, that do not useco-variate information regarding other price series.Our most important result is that contrary to what we find when using
a sequential approach, the simultaneous anaysis suggests that Norwegian andScottish salmon should be considered belonging to the same product market aswell as the same geographical market when looking at the sample period January1995 through August 2002. The conclusion is that the sequential approachshould not be carried out when a simultaneous approach is feasible.We also find that when EU regulation of Norwegian salmon prices (anti-
dumping duties or minimum prices) are binding as was the case in the twelvemonths after our primary sample period then the market delineation changesso that Norwegian and Scottish salmon belong to different product and differ-ent geographical markets. The economic interpretation is that the regulatoryintervention removes the normal competive pressure of Norwegian salmon onScottish salmon so that divergent price paths are sustainable.In the next section a review of the literature on market and product delin-
eation is given. This is followed, in section 3, by a thorough description of theEU salmon industry with particular focus on farmed Norwegian and Scottishsalmon and the competition environment for these products. Section 4 suggestsan empirical methodology for simultaneous market delineation and the approachis applied to the salmon price data set.
2

2 Literature ReviewDefining the relevant market is crucial in the application of competition poli-cies concerning restrictive agreements, abuse of domination and merger control.The purpose of defining the relevant market is to identify all substitutes that ex-ert a significant competitive constraint on the product or service under scrutiny.These may be subsitutes in demand or in supply. Demand substitution is carriedout by customers that seek alternatives; supply substitution is carried out bysuppliers that seek profit opportunities by shifting their supply towards higherpriced alternatives. Both types of substitution may have both a product di-mension and a geographical dimension: Customers may look for a product withdifferent characteristics or they may look for the same product but at a differ-ent location. Likewise, suppliers may start producing a product with alternativecharacteristics or they may start supplying their existing product at a differentlocation. The competitive constraint is exerted by both demand and supplysubstitution in both the product dimension and the geographical dimension.The most common method for delineating the relevant market is that of the
‘hypothetical monopolist’ also known as the SSNIP test.1 The question posedby this test is if a hypothetical monopolist in control of the products or servicesthat constitute a candidate market could profitably increase the price by somesmall amount, typically five or ten per cent. The relevant market is the smallestset of products or services that satisfy this condition. In principle, what thetest is looking for is an estimate of the elasticity of the residual demand ofthe hypothetical monopolist. Landes and Posner (1981) demonstrate that inthe case of a dominant firm with a competitive fringe producing a homogeneousgood, the absolute value of this residual demand elasticity, εdi , may be expressedas:
εdi =εdmSi+
εs(1− Si)
Si(1)
where εdm is the (absolute value of the) price elasticity of market demand, Siis the market share of the (hypothetically) dominant firm i and εs is the priceelasticity of supply. The hypothetically dominant firm would then find it optimalto exercise market power as expressed by the familiar Lerner index:
Li =Pi −MCi
Pi=1
εdi(2)
These two equations summarize that the market power or the pricing of thehypothetically dominant firmmay be constrained by both customers’ availabilityof alternatives and alternative suppliers’ readiness to supply more if the priceincreases. There are many variations of these basic equations. Neven et al.(1993) for example contains similar expressions for a hypothetical monopolistoperating in an oligopoly with differentiated products.In the EU, the European Commission seems to adopt a particular version of
this methodology. In its Notice on market definition, the central definition of
1SSNIP = Small but Significant Non-transitory Increase of Price.
3

the test is:
“The question to be answered is whether the parties’ customerswould switch to readily available substitutes or to suppliers locatedelsewhere in response to an hypothetical small (in the range 5%-10%), permanent relative price increase in the products and areasbeing considered. If substitution would be enough to make the priceincrease unprofitable because of the resulting loss of sales, addi-tional substitutes and areas are included in the relevant market.This would be done until the set of products and geographic areasis such that small, permanent increases in relative prices would beprofitable.” (European Commission, 1997, paragraph 17)
The SSNIP test is also endorsed in other jurisdictions, e.g. in the UnitedStates (Merger Guidelines) and in the United Kingdom (Office of Fair Trading,1999). However, this methodology is only very rarely used directly in practice.In a recent survey of EU merger cases between 1990 and 2001, Copenhagen Eco-nomics (2003) demonstrates that the SSNIP methodology is used as a frame-work in only eleven per cent of the product definitions and in only four per centof the geographic delineations. The methodology is never applied directly in aquantitative analysis. Instead the European Commission typically relies on verysimple indicators such as trade flows and differences in price levels as empiricaldocumentation for their choice of market definition.The reason why the SSNIP methodology is applied only rarely and unsys-
tematically is probably that in order to estimate the components of (1) a lot ofdata is needed (time series of quantities, prices and background variables).2 Analternative that has been used, particularly in merger analysis, is price correla-tion analysis, see Bishop and Walker (2002, ch. 11). The application of thesetests may be attributed to a more limited data requirements as only price dataseries are needed. This methodology is based on Stigler and Sherwin (1985)who argued that the (relevant) market should consist of those suppliers andcustomers whose trading determine the price. They thus defined the market as“the area within which the price of a good tends to uniformity, allowance beingmade for transportation costs.”Evidently, price correlations must be purged of common factors such as sea-
sonality in demand or price movements of a common input that have nothingto do with competitive pressures.3 Thus at the very least market definitionbased on price correlation analysis should be based on partial correlation coef-ficients. In addition, if the price series are not stationary, modern methods ofco-integration and error-correction models are needed to deal with the analy-sis of co-variation of prices and the tendency for prices to revert to a stablerelationship.4
2See la Cour and Møllgaard (2002) for an application of a SSNIP-like approach to marketdelineation for cement.
3 See Copenhagen Economics (2003) for a survey of these methods.4 See Wills (2002) for an example of a market delineation of salmon using stationarity tests
4
Typically, when such analysis is undertaken at all, it is based on pairwisecomparisons of products or geographical locations. In the Nestlé/Perrier mergercase5 the European Commission needed to establish whether still bottled water,sparkling bottled water and other soft drinks would belong to the same rele-vant market. The delineation was resolved by examining a set of correlationcoefficients that established high correlation between still and sparkling min-eral water and low correlation between either of these and other soft drinks.The market was thus defined as mineral (source) water; see Bishop and Walker(2002, 11.12-14).It is even more rare that more advanced methods, such as Granger causality
tests and co-integration analysis, are employed in European competition cases.6
However, Granger causality tests were used in the Mannesmann/Vallourec/Ilvamerger case7 to establish whether the US, the EU and Eastern Europe be-longed to the same geographical market for seamless stainless steel tubes, in-dicating that they were. Co-integration analysis has been used in e.g. theLonrho/Gencor 8 and in the CVC/Lenzing9 merger cases. In the former theabsence of co-integrating relationships was taken as an indication that the fiveproducts (platinum, rhodium, palladium, gold and silver) belonged to separateproduct markets. In the latter, the European Commission used an AugmentedDickey-Fuller test to determine that since “relative prices do not revert to somelong-run equilibrium [... the] two products do not belong to the same relevantmarkets.”There is a sense in which the SSNIP methodology advocates sequentiality.
The SSNIP thought experiment often runs as follows: The starting point is somegood. You ask the question if that good is worth monopolizing. If the answeris negative,10 you look at a neighbouring good (in the product dimension or inthe geographical dimension) and extend the monopolizing requirement to thatgood. You continue in this way until the monopolizing requirement is satisfied.Typically, however, there are several neighbouring goods along both dimen-
sions. It is not obvious that a sequential or step-wise approach will give thesame answer as one that uses the information that is given by the system ofcompetitive pressures. Neven et al. (1993) argue that the European Commis-
on the price of Scottish salmon relative to that of Norwegian salmon. See Haldrup (2003) fora survey of traditional and moderne econometric methods applicable to market delineation.
5Case IV/M190 [1993] 4 Common Market Law Review M17; [1992] Official Journal of theEuropean Communities L356/1.
6 See Bishop and Walker (2002) 15.10-11 for a survey on which the following is based.7Case IV/M315 [1994] Official Journal of the European Communities L102/15.8Case IV/M619 [1997] Official Journal of the European Communities L11/30.9Case COMP/M2187 [2000].10The answer may be negative simply because the good is already monopolized. This
is known as the ‘cellophane fallacy’, see Stocking and Mueller (1955). The ‘hypotheticalmonopolist’ might in fact be a real monopolist and thus have set the monopolist price. Itwould then obviously not be profitable to raise the price by whatever small but significantnon-transitory amount. Some argue (e.g. Posner, 2001, 150-152) that the test should not bebased on actual prices but on the (counter-factual) competitive prices.This is evidently not an operational approach. We find that the relevant question for market
delineation is whether other products exert a competitive pressure at the actual price level.
5
sion uses a sequential approach by first defining product markets and then onlylater defining geographical markets. On theoretical grounds, they argue thatdemand substitution may be underestimated by this approach, since the SSNIPtest may fail to be satisfied first in the product dimension and then in the geo-graphical dimension. We will argue that this critique extends and generalizes.First, it extends to supply substitution. Suppliers may often react more to
e.g. geographical price differences than consumers, e.g. when the good rep-resents low value to the consumer that hence would not find it profitable toovercome transportation costs while suppliers would find it profitable to shipthe goods in large quantities.Second, the critique generalizes to any dimension of the market delineation.
Even if the market delination exercise is done only in one dimension, e.g. theproduct dimension, we may end up with erroneous results if part of the infor-mation set is ignored. This is because competitive pressures that operate in theother dimensions, e.g. the geographic dimension or (if the good may be stored)in the time dimension, are ignored so that the partial model is misspecified.
3 The market for salmon in the EUThis section describes the product and the market for (farmed) salmon in theEU. In addition, a recent merger case in the UK highlights the fairly advancedmethods already applied for delineating the relevant market for salmon.
3.1 The product and the industry
Salmon may be farmed or caught in the wild. Farmed salmon is a relativelyrecent phenomenon, dating back about a quarter of a century. Before 1975,fresh salmon was only caught from wild stocks and considered a luxury product.Today, wild salmon accounts for a negligible fraction of EU consumption andwill be ignored in the following exposition that focuses entirely on the marketfor farmed salmon in the EU.The major producers of Atlantic salmon are Norway (54% of production
volume), Scotland (17%), Chile (13%), Canada (8%), Faroe Islands (5%) andIreland (3%). During the decade from 1990 to 2000, Atlantic salmon productionmore than tripled. All producing countries increased production, however theproduction of Scotland, Chile and Canada grew more than that of Norway.In recent years the farmed salmon industry has shown signs of concentra-
tion: major producers have taken advantage of economies of scale and increasedcapacity utilisation. The salmon industry includes several vertical elements ofa supply chain:1. breeding of the salmon,2. primary processing (slaughtering and gutting),3. secondary processing (e.g. filleting and smoking), and4. retailing or exporting.
6

The main battle fields of Norwegian and Scottish producers of farmed salmonare England, France, The Netherlands, Germany and Spain. Norway exports alot to Denmark as well: Denmark serves as a hub for further distribution andprocessing of Norwegian salmon, in the same way as England serves as a hubfor Irish and Scottish farmed salmon.
3.2 Barriers to competition
In the markets for farmed salmon, barriers to competition might include ad-vertising, possibly contracts with retailers, transportation costs and regulatorybarriers in the form of antidumpng duties. All in all, however, these barriersseem low relative to the fast growth of the markets.Processors, wholesellers and retailers are relatively big and purportedly will-
ing to buy salmon from both countries. Advertising is used by producers: Nor-wegian salmon is advertised as a healthy product. Scottish salmon is generallymarketed as a superior quality product and has e.g. been awarded the LabelRouge in France. Thus Scottish producers attempt to differentiate their productvertically above Norwegian salmon. Retailers sell some salmon products as ownbrands.Contracts are not widely used: Most trade is handled informally. However,
retailers seem to drive a movement towards increased use of longer-term con-tracts but at present the market seems very flexible for all players.Transportation is complicated but not overly expensive. Salmon requires
specialized treatment throughout the distribution chain, involving iced contain-ers and refrigerated storage facilities. Transportation costs amount to aboutfour per cent of total costs to farmers and six per cent to processors.In terms of regulatory barriers, the EU Commission found Norwegian pro-
ducers guilty of dumping in 1996. Price floors and export volume caps wereestablished for Norwegian producers. A punitive anti-dumping tax of three percent was applied to all Norwegian exports. However, this tax may be used tofinance marketing projects. Although Norwegian salmon is restricted by theseregulations, their impact have been minimal due to the overall market develop-ment with increased volumes and prices. Prices have generally remained overthe floor. Very recently the market price of farmed salmon has dropped signifi-cantly making the price floor binding.
3.3 A merger case in the salmon industry
The UK Competition Commission has recently (2000) investigated and reportedon the proposed acquisition by Nutreco Holding NV of Hydro Seafood GSPLtd from Norsk Hydro. Nutreco has substantial interest in fish feed and insalmon production in Scotland, Chile and Canada but not in Norway or Ireland.Norsk Hydro is Norway’s largest industrial group originating in oil and energyproduction. Norsk Hydro did not regard its salmon farming businesses, HydroSeafood, as belonging to its core competencies.
7
Nutreco’s Marine Harvest (Scotland; MH) and Hydro Seafood GSP (Norway;GSP) are the two largest farmers and suppliers of farmed salmon in the UK.They have seawater farms and gutting/packing facilities on the west coast ofScotland and in the western isles and Shetland. GSP and MH also both havefreshwater facilities in Scotland for rearing smolts (juvenile salmon). Nutreco’sTrouw is UK’s largest manufacturer of feeds for salmon and trout.The UK Competition Commission found that the relevant market for salmon
is that for gutted farmed Atlantic salmon extending across all of the EEA:Farmed salmon is imported from other European countries, mainly Norway,competes with Scottish farmed salmon and is considered a substitute for Scot-tish salmon by many secondary processors, wholesalers and retailers. Nutreco’spost-merger share would be above 15 per cent of this broadly defined market.The Competition Commission argued, however, that Scottish salmon due tovertical product differentiation can command a modest premium in the UK andsome export markets and thus ended up defining the market as “a small marketsegment for which Scottish salmon is a differentiated premium product withinthe single, wider EEA market for farmed gutted salmon.” In this narrowly de-fined market Nutreco’s share of the UK market for Scottish salmon would bearound 46 per cent.The Competition Commission recommended prohibition of the merger be-
cause of the expected direct effects on the feed market and its indirect effect onthe salmon market: Nutreco’s share of the UK market for salmon feed wouldincrease substantially. The supply of salmon feed is concentrated with a three-firm concentration ration above 90 per cent. Nutreco’s Trouw is one of thethree large suppliers of feed. Since the merged company was stipulated to buymainly from Trouw, the Competition Commission expected the other two bigfeed suppliers to face increased unit costs following reduced capacity utiliza-tions. This would lead to an even further increase of Trouw’s position and makeit the only competitive feed producer. Other salmon farmers would thus faceincreased costs and “[a]s the costs of independent salmon farmers and smolt pro-ducers increase, some will either become more dependent on Nutreco or go outof business, thereby further consolidating Nutreco’s position.” (UK CompetitionCommission, 2000, p. 4).Lexecon analysed the market definition for gutted salmon in this merger
case. Based on weekly data from July 1997 through June 2000 relative priceswere analyzed using stationarity tests. Lexecon relied on a sequential procedureaccording to which they first decided that Scottish salmon was part of the sameproduct market as Norwegian salmon (in the UK) and then decided that Scottishsalmon sold in the UK was part of a market including France and the rest ofEurope. Apparently this analysis was accepted by the Competition Commission(Wills, 2000). Below we will argue that this sequential procedure may lead towrong conclusions.
8

1995 1996 1997 1998 1999 2000 2001 2002 2003
1.0
1.5
2.0 Scottish SalmonFrance Germany
Netherlands Spain
1995 1996 1997 1998 1999 2000 2001 2002 2003
0.75
1.00
1.25
1.50 Norwegian SalmonFrance Germany
Netherlands Spain
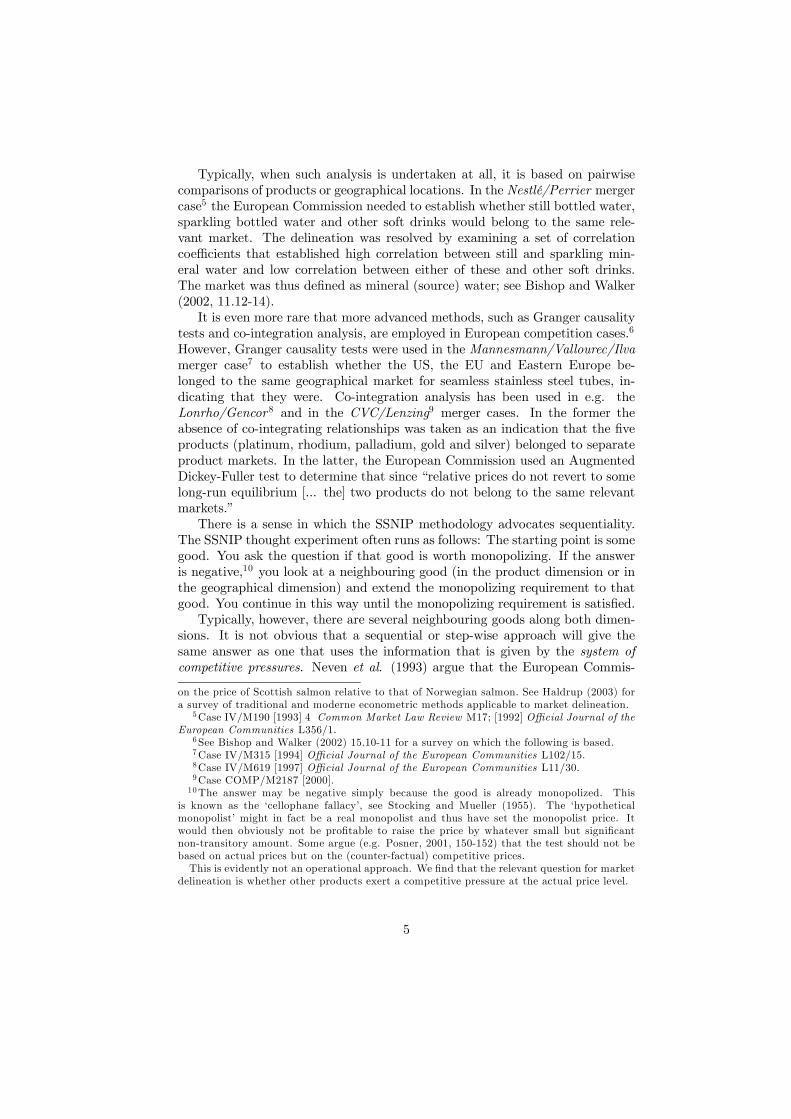
Figure 1: Log export prices of Norwegian and Scottish Salmon 1995:1-2003:8.
4 Econometric market delineation
4.1 Description of the data and some motivation for thesimultaneous analysis
The price data used for the analysis of the Salmon case are export prices (FOB)for Norwegian and Scottish Salmon (Source: Norwegian Kontali, and Eurostat’sComext). For Norway data is available for most of the EU countries whilstthe Scottish prices only are available for a subgroup of countries. Due to theselimitations the present analysis includes the export prices for Germany, TheNetherlands, France and Spain for the period 1995:1 - 2003:8. However, becausethere are indications in the data set that the market conditions have changedrecently, see the discussion in section 3.2, much of the analysis will be for thereduced sample period 1995:1-2002:8. All prices have been converted to thesame currency and unit of account (Euros per kilo). In the statistical analysesthe log-transformed price series are examined.Before any formal statistical analysis it is worthwhile considering some de-
scriptive and graphical measures of the available data. In figure 1 the (log)export prices (henceforth: export prices) are displayed separately for Scottishand Norwegian salmon to emphasize the product dimension. Visual inspectionof the figure seems to indicate different time series properties. The Scottishprices do seem to co-move to some extend, as is strongly the case for the Norwe-gian prices. However, as compared to the Norwegian prices the Scottish prices
9

tend to be somewhat more volatile. From a visual analysis one might arguethat the Scottish prices are stationary, I(0), whereas the Norwegian prices arenon-stationary I(1). If this conjecture is correct, i.e. the integration orders forprices across the two products differ, the market for Norwegian and Scottishsalmon are separate. Also, because the Norwegian prices seem to exhibit thesame stochastic price trend for all of the four countries, i.e. the prices seem tocointegrate, see Engle and Granger (1987) and Johansen (1991), the geograph-ical market for Norwegian salmon includes all four countries. Even though theScottish Salmon prices seem to co-vary in the four countries it is harder fromeye-balling to say how the relevant geographical market for Scottish salmonshould be delineated.The above arguing relies on a sequential market delineation strategy. Sta-
tistical analyses of the integration orders of the individual price series do in factshow that the above conjecture about the price behaviour is correct11. However,we will demonstrate that the sequential approach can contain pitfalls which mayinvalidate the conclusions. At least the statistical tools that are available to doa powerful simultaneous analysis of the price series for both Norwegian andScottish salmon will provide a rather different conclusion. Lets try to put forthsome explanations why this can occur.First of all, the basic reasoning why the Scottish Salmon and Norwegian
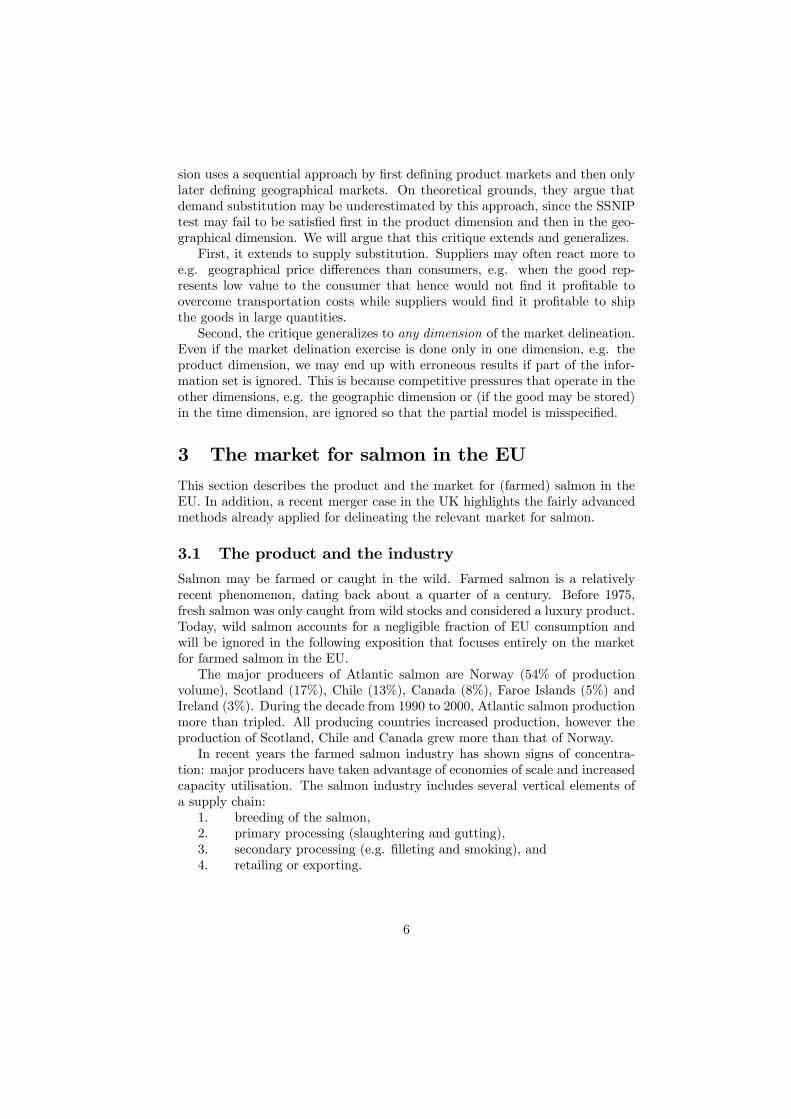
Salmon, based on price tests, are to be regarded as different products is thatthe integration order of the price series are different. If this finding is correct theproducts cannot belong to the same market. It is a general time series propertythat an I(1) series plus an I(0) series will always be I(1). However, for a finitesample size it can be hard to discriminate between these cases because thevariance of the I(0) component can be arbitrarily big, see Franses and Haldrup(1994). When this is the case any test will have difficulties detecting the true(asymptotic) order of integration of the series and relates to the poor powerof unit root tests in many cases. In relation to the above data example ourargument is that even though the Scottish prices are more volatile than theNorwegian prices the general level of the prices seem to co-vary, perhaps exceptfor the last year of observations. This could indicate that the Scottish andNorwegian prices could share a common price trend. Some graphs will emphasizethis argument. In figure 2 the pairs of Norwegian and Scottish export pricesto the single countries are displayed after the series have been filtered usingthe Hodrick-Prescott filter, see e.g. Hodrick and Prescott (1997). The idea isto decompose the price series pt into the sum of a trend component τ t and anirregular component ct = pt−τ t where the trend is found by solving the problem
minτt
TXt=1
((pt − τ t)2 + λ((τ t+1 − τ t)− (τ t − τ t−1))2)
where λ is a smoothing parameter.11Both augmented Dickey-Fuller tests, see e.g. Fuller (1976) and Dickey and Fuller (1979),
and KPSS tests, see Kwiatkowski et al. (1992) were conducted. For space limitations thesetests are not reported but can be obtained from the authors upon request.
10

1995 2000
1.0
1.2
1.4France
Scottish prices Norwegian prices
1995 2000
0.75
1.00
1.25
1.50 The Netherlands
1995 2000
1.00
1.25
1.50 Germany
1995 2000
0.75
1.00
1.25
1.50 Spain
Figure 2: Hodrick-Prescott filtered (log) price trend for Scottish and Norwegiansalmon exported to France, The Netherlands, Germany, and Spain.
Figure 2 displays the trend component after filtration with λ = 5. Eventhough the price trends of the Norwegian salmon are almost identical, it isof interest to observe that for each of the countries the variation of the pricetrends for Scottish and Norwegian salmon to each of the regions tend to co-vary,especially for the 1995:1-2002:8 period. This co-variation is hard to observe usingthe raw data due to the strong short-run fluctuations. So when attempting toextract the price trends across the different price series there does in fact seem toexist a common price trend element although we realize that the above analysisshould be considered illustratory.This result is interesting because it allows for the possibility that the entire
system of 8 prices (2 salmon products to 4 countries) is governed by a single pricetrend, and when this is the case the product and geographical market is com-mon for Norwegian and Scottish salmon. However, such an analysis necessarilyrequires that the 8 price series are considered jointly. The testable implicationsare thus to see whether the 8 price series are restricted by 7 cointegrating re-strictions which implies that a single common stochastic price trend drives theentire system of prices. A particularly interesting testable implication of a jointproduct and geographical market is that the cointegrating relations appear inpairs whereby the relative prices (up to a scale) are stationary across productsand across regions. According to Granger´s representation theorem, see Engleand Granger (1987), cointegration amongst the series will imply that an errorcorrection mechanism exists implying Granger causality in at least one direc-
11

tion which underscores the interaction of price behaviour. This is the propertythat links together the common price pattern of the price series in the presentexample. In the following section we will analyze these hypotheses by formaltesting.
4.2 Simultaneous delineation of the relevant product andgeographical markets
The starting point for the system analysis is a vector autoregressive model oforder k, VAR(k), for the levels of the price series:
Pt =m+A1Pt−1+A2Pt−2+.....AkPt−k+εt
where Pt = (p1t, p2t, ..., pqt)0 is the vector of price series and Ai are q × q
matrices with the parameters associated with each lag of the price series, andm is a vector with the intercept terms of each equation. It is assumed that theerror term in the VAR model is normally distributed with a covariance matrixΣ :
εt ∼ N(0,Σ)
The model can also be written on error correction model form, see Johansen(1991), as
∆Pt =m+ΠPt−1 +k−1Xj=1
Γj∆Pt−j + εt (3)
The cointegration properties of the data are given by conditions concerningthe matrix Π. Technically we have to address (and estimate) the rank of thatmatrix. The following possibilities arise:
Rank Π = q (full rank) ⇒ Pt is stationary, I(0).Rank Π = 0 (zero rank)⇒ ∆Pt is stationary, I(0), (or equivalently, Pt is I(1)).Rank Π = r < q (reduced rank) ⇒ ΠPt−1 is stationary I(0).
In the third case there are r cointegrating relations and thus q − r separateprice trends. This case is obviously most interesting because this is the situationwhere "attractor relations" exist between the price levels and hence affect marketdelineation. The empirical problem is thus initially to determine r. Assumenow, that the rank of Π equals r (0 < r < q). In this case
Π = αβ0
where α,β are both q × r.This yields the error correction model formulation of the model in the case
of cointegration
∆Pt =m+αβ0Pt−1+k−1Xj=1
Γj∆Pt−j+εt. (4)
12

It is important to observe that the number of cointegration relations mea-sures the number of stationary relationships. In principle, this implies that theorder of integration of the single series can be tested within the cointegratedVAR model, i.e. if the matrix β contains a column of zeros and a single cellwith a non-zero entry, then the associated variable is stationary I(0). This hastestable implications as we shall see.With respect to the present application it is of interest to look at the fur-
ther requirements for market delineation along the product and geographicaldimensions, respectively. Let us look at the most interesting cases.
4.2.1 Case 1. Norwegian and Scottish salmon are considered sepa-rate products and for each product there exist a geographicalmarket delineated by the number of countries under scrutiny.
Write the 8 dimensional price vector
Pt = (p1St, p2St, p3St, p4St, p1Nt, p2Nt, p3Nt, p4Nt)0 (5)
with i = 1, 2, 3, 4 indicating the country to which export takes place, and j =N,S signifies Norwegian and Scottish salmon, respectively. If we assume thatthe single price series are all I(1), then the cointegration rank is r = 6 in thepresent case whereby the 8 price series are driven by 2 separate price trends:one for each product. To further identify these trends the β matrix should takethe form
β =
1 0 0 0 0 0∗ 1 0 0 0 00 ∗ 1 0 0 00 0 ∗ 0 0 00 0 0 1 0 00 0 0 ∗ 1 00 0 0 0 ∗ 10 0 0 0 0 ∗
(6)
where "*" indicates an arbitray number. If it occurs that the freely varying pa-rameters equal minus one, then the relative prices across the different countrieswill be stationary which can be tested. In this case we have
β0Pt =
p1St − p2Stp2St − p3Stp3St − p4Stp1Nt − p2Nt
p2Nt − p3Nt
p3Nt − p4Nt
(7)
i.e. the vector of stationary relative prices12.
12Observe that stationarity of the relative prices is not necessary for the associated prod-ucts to belong to the same market. It is sufficient that the pair of price series cointegrate
13

Note how the block structure in (6) indicates that Norwegian and Scottishsalmon are considered separate products, i.e. only the pairs of prices for eachof the goods are stationary.
The two goods can also be considered separate (in terms of product delin-eation) when the integration orders of prices differ. Assume the Scottish pricesare all I(0) and that Norwegian prices are all I(1). Also assume that the ge-ographical market for Norwegian salmon is the "the group of four"-countriesconsidered in the study. In this situation the cointegration rank is r = 7 andthe single price trend drives the market for Norwegian salmon. Hence, the βmatrix takes the form
β =
1 0 0 0 0 0 00 1 0 0 0 0 00 0 1 0 0 0 00 0 0 1 0 0 00 0 0 0 1 0 00 0 0 0 ∗ 1 00 0 0 0 0 ∗ 10 0 0 0 0 0 ∗
(8)
Whether this is a valid restriction of the cointegration matrix is again testableof course. Note that in the present case the geographical market for Norwegiansalmon consists of the 4 countries. To analyze the geographical dimension forScottish salmon requires further testing relevant for stationary variables.
4.2.2 Case 2. Norwegian and Scottish salmon belong to the sameproduct and geographical market.
In this second case the cointegration rank is r = 7 and a single price trend drivesall 8 prices series, i.e. this price trend is common to all prices. The β−matrixcan for instance take the form
β =
1 0 0 0 0 0 1∗ 1 0 0 0 0 00 ∗ 1 0 0 0 00 0 ∗ 0 0 0 00 0 0 1 0 0 ∗0 0 0 ∗ 1 0 00 0 0 0 ∗ 1 00 0 0 0 0 ∗ 0
(9)
Compared to (6) the extra column implies that the block structure vanishes andmakes all prices across products pairwisely cointegrated. For instance, using
whereby the error correction mechanism following from the cointegration property will ensureco-movement of the prices. If relative prices are stationary it is just a further restriction ofthe model, but this will not have different implications concerning marketdelineation.
14

the normalization chosen in (9) the price pair (p1St, p1Nt ) cointegrates. Infact, proper rearrangement will show that all pairs (piSt, piNt) for the countriesi = 1, 2, 3, 4 cointegrate in this case and because there are no over-identifyingrestrictions in this structure it is not possible to do any testing. An alternativeway of specifying an exactly identified structure is
β =
1 0 0 0 0 0 00 1 0 0 0 0 00 0 1 0 0 0 00 0 0 1 0 0 0∗ 0 0 0 1 0 00 ∗ 0 0 ∗ 1 00 0 ∗ 0 0 ∗ 10 0 0 ∗ 0 0 ∗
(10)
In this case the cointegrating relations are arranged such that the price pairsfor Norwegian and Scottish salmon to a particular region will cointegrate. Alsothe price pairs of e.g. Norwegian salmon to the various regions cointegrate. Infact, due to the exact identification several ways of arranging the pairwise pricesexist.As it can be seen, product and geographical market delineation has testable
implications when the full system of price series is analyzed jointly. In the fol-lowing section we will adopt the Johansen ML-procedure to test the possibilitiesusing the present data set.
4.3 Testing market delineation
For the price vector Pt given in (5) a VAR(2) model on the error correctionmodel form (3) was estimated for the period 1995:1-2002:8. A constant whichcould be restricted to lie in the cointegration space was included which meansthat no linear trends were allowed to exist in the data. This is what we wouldalso expect from visual inspection of the graphs in figure 1. The estimated VARmodel was generally found to be statistically well-specified although there weresome problems with the normality assumption associated with the export pricesto France of Norwegian Salmon, see Table 1. However, it is well known frome.g. Gonzalo (1994) that cointegration analysis is robust to discrepancies fromthe normality assumption.In Table 2 the results of Johansen’s cointegrated VAR analysis are reported.
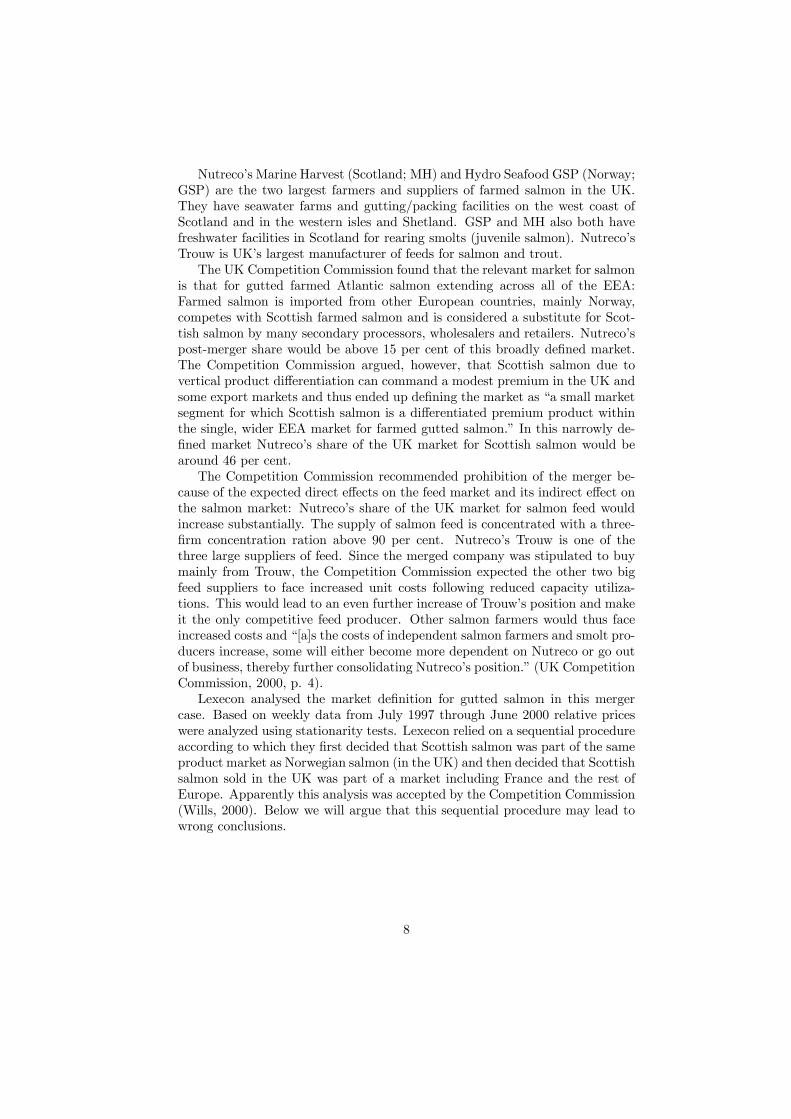
Using a conservative 10% level (which is reasonable given that the asymptoticdistributions may be poor in finite samples) there is clear sign of the presenceof r = 7 cointegration vectors which further implies that only a single commonprice trend drives the data. According to the discussion in section 4.2 this is anecessary requirement for Norwegian and Scottish salmon to belong to the sameproduct and geographical market. In figure 3 the "cointegrating relations" aredisplayed and visual inspection of these reveal evidence that 7 relations are verystationary whilst the 8th relation seems much more non-stationary.
15

However, we need to impose further restrictions to conclude on market de-lineation because different possibilities exist.
Table 1. Specification testing of the VAR(2) model. The tests reported are LM tests for ARCH,heteroscedasticity, and autocorrelation. The JB test is the Jarque-Bera test for Normality.
AR(1-6) LM-test JB-χ2test ARCH-LM test White-LM testScottish SalmonFrance .73 9.20∗∗ .52 .18The Netherlands .74 3.50 .30 1.17Germany .98 8.19∗∗ .56 1.25Spain .95 4.93 .62 .70Norwegian SalmonFrance 1.00 27.08∗∗∗ .46 .23The Netherlands .58 1.14 .83 .73Germany 1.37 4.69 .66 .64Spain .77 2.26 .25 .57Note: "*", "**", and "***" indicate significance at 10, 5 and 1% level, respectively.
Table 2. Johansen trace test for cointegration rank. The sampleperiod is 1995:1-2002:8.rank r eigenvalue log-likelihood Trace-test: H0 : rank ≤0 1144.99 244.76 [0.000]∗∗∗
1 .5165 1177.69 179.36 [0.000]∗∗∗
2 .4210 1202.28 130.18 [0.000]∗∗∗
3 .3862 1224.24 86.26 [0.007]∗∗∗
4 .2861 1239.41 55.92 [0.032]∗∗
5 .2190 1250.53 33.67 [0.071]∗
6 .1542 1258.07 18.60 [0.083]∗
7 .1305 1264.37 6.01 [0.197]8 .0646 1267.37
First we consider the possibility of all Scottish prices being stationary. Thiswas the outcome when conducting univariate ADF and KPSS test of the singleprice series. We imposed the restriction
β =
1 0 0 0 ∗ ∗ ∗0 1 0 0 ∗ ∗ ∗0 0 1 0 ∗ ∗ ∗0 0 0 1 ∗ ∗ ∗0 0 0 0 ∗ ∗ ∗0 0 0 0 ∗ ∗ ∗0 0 0 0 ∗ ∗ ∗0 0 0 0 ∗ ∗ ∗
16

1995 2000
0.0
0.5
1.0 vector1
1995 2000
-0.5
0.0
0.51.0 vector2
1995 2000
-0.5
0.0
0.51.0 vector3
1995 2000-0.250.000.250.50 vector4
1995 2000
-2.5
0.0
2.5 vector5
1995 2000
-0.1
0.0
0.1 vector6
1995 2000
-0.1
0.0
0.1vector7
1995 2000
0
1vector8
Figure 3: The cointegrating vectors. According to the Johansen ML trace testthe first 7 vectors are stationary whereas the 8th is non-stationary. Note thedifferent scales.
17

which is a joint test of all Scottish price series being stationary whilst leavingthe remaining stationary relations unaffected. This test gives 4 over-identifyingrestrictions and the LR test is thus distributed as χ2(4) yielding a p-value of0.002. Hence the hypothesis is rejected, thus reversing the conclusion drawnfrom univariate (sequential) testing. One explanation behind this result is thefact that an increased information set is used compared to the univariate testswhich increases test power.Next, in order to see how much structure we can impose on the co-integrating
relations, we have considered whether the price series cointegrate in pairs. Thiswould correspond to the β matrix (9) where no overidentifying restrictions areimposed. Any testing requires further restrictions. A test of whether all therelative prices are pairwise stationary implies one over-identifying restriction oneach of the β-vectors; the LR test is thus distributed as χ2(7) with a p-valueof 0.008 which leads to rejection. However, loosening the restrictions yields thefollowing structure which could not be rejected:
β =
1 1 1 0 0 0 1∗ 0 0 0 0 0 00 −1 0 0 0 0 00 0 −1 0 0 0 00 0 0 1 1 1 −10 0 0 −1 0 0 00 0 0 0 −1 0 00 0 0 0 0 −1 0
The χ2(6) test yields a p-value of 0.112. This means that all but one relativeprice tends to be stationary; the remaining relation is also stationary but it isnot given as a (1, -1) relation. However, it is important to stress that while theserestrictions give rise to easier intuition, they are not important for the marketdelineation as such. It is sufficient that we have found that the price series doin fact cointegrate in pairs whereby the error correction model representationwill ensure the price dynamics to be such that the prices tend to co-move whichis sufficient for the goods to belong to the same market.The major strength of the simultaneous analysis is that the interaction of
prices across Norwegian and Scottish prices can be examined. To further em-phasize the interaction of prices for these products we have have rearranged theabove system to focus on the relative price pairs for the products. To do so theβ matrix has been formulated such that the elements of β0Pt reads
β0Pt =
p1St − p1Nt
p2St − p2Nt
p3St − p3Nt
p4Nt − p4Nt
∗∗∗
(11)
18

where we only want to focus on the first four cells for illustration. Note that theseprice pairs in (11) measure respectively the relative prices of Norwegian andScottish salmon to each of the countries (i = 1, 2, 3, 4) France, The Netherlands,Germany, and Spain. The loading matrix of these relative prices can be writtenas follows according to the error correction model (4) (where the remainingdynamics has been abstracted from):
∆p1St∆p2St∆p3St∆p4Nt
∆p1Nt
∆p2Nt
∆p3Nt
∆p4Nt
=
−.74∗∗∗ 0 0 00 −.46∗∗∗ 0 00 0 −.56∗∗∗ 00 0 0 −.52∗∗∗
.06∗∗ 0 0 00 .04∗∗∗ 0 00 0 .02 00 0 0 .01
p1St−1 − p1Nt−1p2St−1 − p2Nt−1p3St−1 − p3Nt−1p4Nt−1 − p4Nt−1
∗∗∗
.
It is apparent from the price dynamics that very strong adjustment of pricestakes place across the different salmon products. For instance, when a unitprice difference exists between Norwegian and Scottish Salmon export to France,then 74% of this discrepancy is eliminated in the following period with respectto the Scottish salmon prices. The adjustment in Norwegian salmon prices issomewhat weaker, i.e. only 6% of the discrepancy is subsequently corrected for.In general, the Norwegian salmon prices seem to adjust somewhat less to theScottish salmon prices than opposite. But the conclusion is that as a result ofcommon price trends causal effects exist across products and hence advocatingfor a common product in market delineation.
4.4 On the robustness of the empirical results to the fullsample period
In the above empirical analysis we have limited the analysis to the data period1995:1-2002:8. If we extend the sample to include the following twelve monthsfor which we know that the antidumping regulation of Norwegian salmon priceshas been binding, we find that our empirical market delineation results are notrobust to such an extension. From figure 1 it is apparent that the price behaviourchanges by the end of the sample period as discussed in section 3.2. Asche andSteen (2003) show how these antidumping measures affected Norwegian salmonpricing behaviour that was detached from EU salmon producers’ behaviour.A formal test of cointegration using the above techniques to the full sample
period yields the results reported in table 3
19
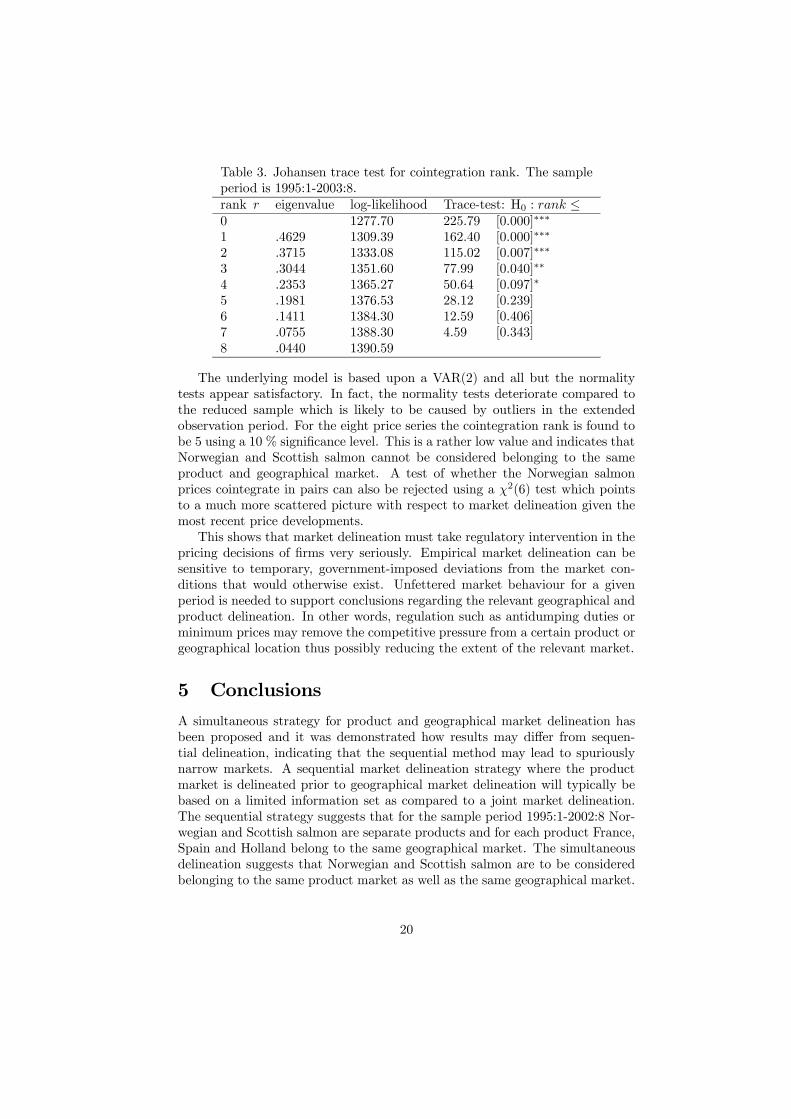
Table 3. Johansen trace test for cointegration rank. The sampleperiod is 1995:1-2003:8.rank r eigenvalue log-likelihood Trace-test: H0 : rank ≤0 1277.70 225.79 [0.000]∗∗∗
1 .4629 1309.39 162.40 [0.000]∗∗∗
2 .3715 1333.08 115.02 [0.007]∗∗∗
3 .3044 1351.60 77.99 [0.040]∗∗
4 .2353 1365.27 50.64 [0.097]∗
5 .1981 1376.53 28.12 [0.239]6 .1411 1384.30 12.59 [0.406]7 .0755 1388.30 4.59 [0.343]8 .0440 1390.59
The underlying model is based upon a VAR(2) and all but the normalitytests appear satisfactory. In fact, the normality tests deteriorate compared tothe reduced sample which is likely to be caused by outliers in the extendedobservation period. For the eight price series the cointegration rank is found tobe 5 using a 10 % significance level. This is a rather low value and indicates thatNorwegian and Scottish salmon cannot be considered belonging to the sameproduct and geographical market. A test of whether the Norwegian salmonprices cointegrate in pairs can also be rejected using a χ2(6) test which pointsto a much more scattered picture with respect to market delineation given themost recent price developments.This shows that market delineation must take regulatory intervention in the
pricing decisions of firms very seriously. Empirical market delineation can besensitive to temporary, government-imposed deviations from the market con-ditions that would otherwise exist. Unfettered market behaviour for a givenperiod is needed to support conclusions regarding the relevant geographical andproduct delineation. In other words, regulation such as antidumping duties orminimum prices may remove the competitive pressure from a certain product orgeographical location thus possibly reducing the extent of the relevant market.
5 ConclusionsA simultaneous strategy for product and geographical market delineation hasbeen proposed and it was demonstrated how results may differ from sequen-tial delineation, indicating that the sequential method may lead to spuriouslynarrow markets. A sequential market delineation strategy where the productmarket is delineated prior to geographical market delineation will typically bebased on a limited information set as compared to a joint market delineation.The sequential strategy suggests that for the sample period 1995:1-2002:8 Nor-wegian and Scottish salmon are separate products and for each product France,Spain and Holland belong to the same geographical market. The simultaneousdelineation suggests that Norwegian and Scottish salmon are to be consideredbelonging to the same product market as well as the same geographical market.
20

In addition, we showed that regulatory intervention in a part of the relevantmarket may reduce the extent of the market since it reduces or eliminates a partof the competitive pressure.
21

LITERATURE:
Asche, F. and F. Steen (2003) “When antidumping measures lead to increasingmarket power; A case study of the European salmon market”, DiscussionPaper27/03, Department of Economics, Norwegian School of Economicsand Business Administration.
Bishop, S. and M. Walker (2002) The Economics of EC Competition Law:Concepts, Application and Measurement, 2nd edition. London: Sweet &Maxwell.
Copenhagen Economics (2003) “The internal market and the relevant geo-graphical market: The impact of the completion of the Single MarketProgramme on the definition of the relevant geographical market” Enter-prise Paper No. 15. Brussels: EU Commission, DG Enterprise.
la Cour, L.F. and P. Møllgaard (2002) “Market Domination: Tests Applied tothe Danish Cement Industry,” European Journal of Law and Economics14(2), 99-127.
Dickey, D. and Fuller, W.(1979), Distribution of Estimators for Autoregres-sive Time Sereis with a Unit Root, Journal of the American StatisticalAssociation, 74, 427-431.
Engle, R.F., and Granger, C.W.J. (1987), Cointegration and Error Correction:Representations, Estimation, and Testing. Econometrica, 55, 252-276.
European Commision (1997) Commission Notice on the definition of relevantmarket for the purposes of Community competition law, Official Journalof the European Union C372/5.
Franses. P.H. and N. Haldrup (1994) “The Effects of Additive Outliers on Testsfor Unit Roots and Cointegration,” Journal of Business and EconomicStatistics 12, 471-478.
Fuller, W.A. (1976) Introduction to statistical time series, New York: Wiley.
Gonzalo, J., (1994). "Five Alternative Methods of Estimating Long Run Equi-librium Relationships" Journal of Econometrics 60, 1-31.
Haldrup, N. (2003) “Empirical analysis of price data in the delineation ofthe relevant geographical market in competition analysis” Working Paper2003-9, Department of Economics, University of Aarhus.
Hodrick, R. J., and E. C. Prescott (1997). "Postwar U.S. Business Cycles: AnEmpirical Investigation", Journal of Money, Credit, and Banking 29(1),1-16.
Kwiatkowski, D.; P.C.B. Phillips, P. Schmidt and Y. Shin (1992) “Testingthe null hypothesis of stationarity against the alternative of a unit root —How sure are we that economic time series have a unit root?” Journal ofEconometrics 54(1-3), 159-78.
Johansen, S., (1991), Estimation and Hypothesis Testing of Cointegration Vec-tors in Gaussian Vector Autoregressive Models, Econometrica, 55, 251-276.
22

Landes, W.M. and R.A. Posner (1981) “Market Power in Antitrust Cases”Harvard Law Review 94(5) 522-568.
Neven, D; R. Nuttall and P. Seabright (1993) Merger in daylight: The eco-nomics and politics of European merger control, London: Centre for Eco-nomic Policy Research.
Office of Fair Trading (1999), Market Definition, OFT 403
Posner, R.A. (2001) Antitrust Law, University of Chicago Press.
Stigler, G. and R.A. Sherwin (1985) “The Extent of the Market” Journal ofLaw & Economics 28: 555-585.
Stocking, G.W. and W.F. Mueller (1955) “The Cellophane Case and the NewCompetition” American Economic Review 45(1): 29-63.
UK Competition Commission (2000): Nutreco Holding NV and Hydro SeafoodGSP Ltd : A report on the proposed merger
Werden, G.J. and Froeb L.M. (1993) “Correlation, Causality, and All thatJazz: The inherent Shortcomings of Price Tests for Antitrust Market De-lineation”, Review of Industrial Organization 8: 329-353.
Wills, H. (2002) “Market Definition: How Stationarity Tests Can ImproveAccuracy” European Competition Law Review 23(1): 4-6.
23