report number 122412-1 final submitted
TRANSCRIPT

BEFORE THE
PUBLIC SERVICE COMMISSION OF WISCONSIN
Application of Highland Wind Farm, LLC for a
Certificate of Convenience and Necessity to
Construct a 102.5 MW Electric Generation Facility Docket No. 2535-CE-100
And Associated Electric Facilities, to Be Located in
The Towns of Forest and Cylon, St. Croix County,
Wisconsin
CLEAN WISCONSIN’S CORRECTIONS TO EXHIBIT AND EXHIBIT NUMBER
Please enter the attached exhibit as “Ex.-CW-7”, “A Cooperative Measurement Survey and Analysis of Low Frequency and Infrasound at the Shirley Wind Farm in Brown County, Wisconsin.” This document replaces what was incorrectly filed as Ex.-CW-6 (PSC Ref. #178200), which was filed on December 27, 2012. The attached Ex.-CW-7 is the final, official version of the Low Frequency Noise (LFN)
testing report that was funded through the Commission’s award of Intervenor Compensation in
connection with the above-captioned docket.
There has been dispute among the parties as to whether this report should or should not
include recommendations for the Highland Wind proposal. Clean Wisconsin, as the proposer, lead
contractor, and retainer of the lead scientists and authors of the report, took responsibility for delivering
precisely what the Commission contemplated when it awarded intervenor compensation to complete
this study and report. Commission staff directed Clean Wisconsin to omit all recommendations
regarding the Highland project, which would more logically appear in the next round of direct testimony
about LFN (see Tr:1127:9-11). Thus, Clean Wisconsin filed the exact report that all the experts signed,
omitting only the Highland recommendations, which presumably each expert would have ample
opportunity to make in subsequent direct and rebuttal testimony.
PSC REF#:178773Public Service Commission of Wisconsin
RECEIVED: 01/08/13, 3:39:41 PM
Clean Wisconsin has no direct knowledge as to whether each individual expert would now sign
this report without the inclusion of the Highland recommendations, although the actual testing results
which are the real substance of the report remain unaltered. Recognizing this, and having attempted to
resolve this dispute to the satisfaction of all the parties without success, Clean Wisconsin hereby
submits the final, correct version of the above-referenced report without Highland recommendations
and without the signatures of each individual consultant. It can be assumed that each acoustician still
agrees with his own independently-authored appendices; the only question is whether they still agree
with the introductory section authored by George Hessler, absent Highland recommendations.
Clean Wisconsin has made every attempt to work cooperatively with the parties to resolve this
issue. We regret that we have not been able to do so.
Respectfully submitted this 8th day of January, 2013,
/s/ Katie Nekola__________
Katie Nekola
General Counsel, Clean Wisconsin
Report Number 122412-1 Page 1 of 12
Report Number 122412-1 Issued: December 24, 2012
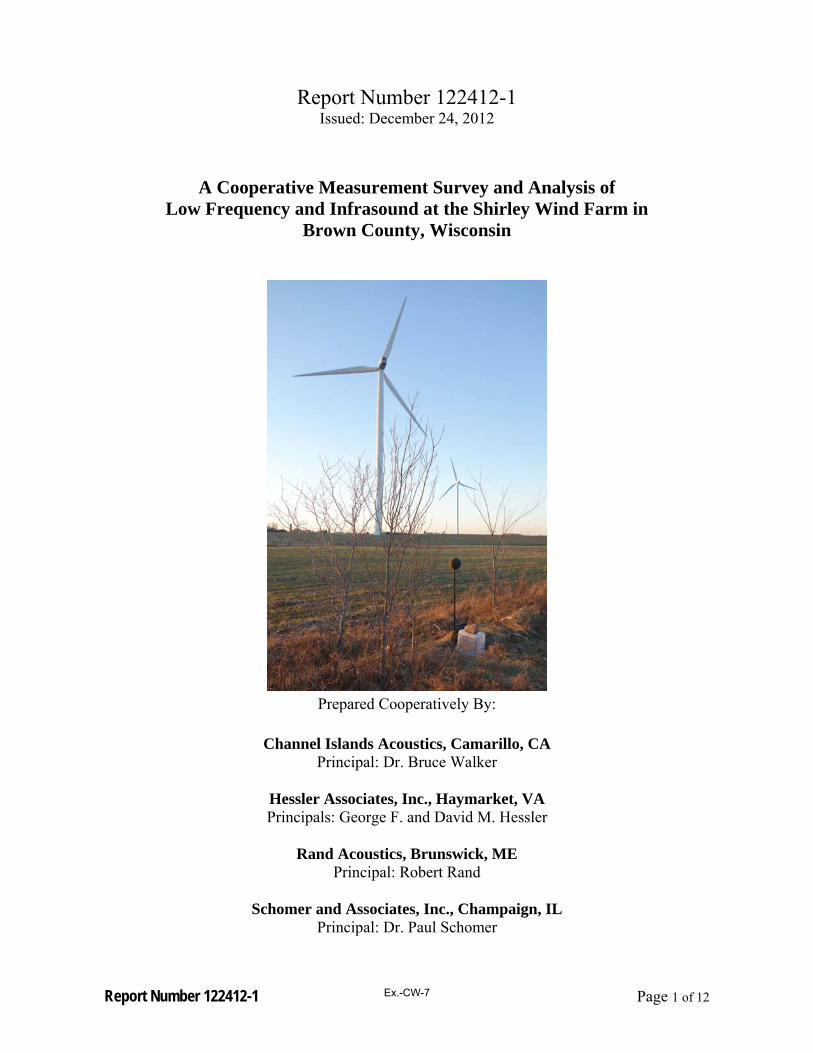
A Cooperative Measurement Survey and Analysis of Low Frequency and Infrasound at the Shirley Wind Farm in
Brown County, Wisconsin
Prepared Cooperatively By:
Channel Islands Acoustics, Camarillo, CA Principal: Dr. Bruce Walker
Hessler Associates, Inc., Haymarket, VA Principals: George F. and David M. Hessler
Rand Acoustics, Brunswick, ME
Principal: Robert Rand
Schomer and Associates, Inc., Champaign, IL Principal: Dr. Paul Schomer
Ex.-CW-7

Report Number 122412-1 Page 2 of 12
1.0_Introduction Clean Wisconsin is a nonprofit environmental advocacy organization that works to protect Wisconsin’s air and water and to promote clean energy. As such, the organization is generally supportive of wind projects. Clean Wisconsin was retained by the Wisconsin Public Service Commission (PSC) to provide an independent review of a proposed wind farm called the Highlands Project to be located in St. Croix County, WI (WI PSC Docket 2535-CE-100). Clean Wisconsin in turn retained Hessler Associates, Inc. (HAI) to provide technical assistance. During the course of the hearings, attorneys representing groups opposed to the Highlands project, presented witnesses that lived near or within the Shirley Wind project in Brown County, WI. The Shirley wind project is made up of eight Nordex100 wind turbines that is one of the turbine models being considered for the Highlands projects. These witnesses testified that they and their children have suffered severe adverse health effects to the point that they have abandoned their homes at Shirley. They attribute their problems to arrival of the wind turbines. David Hessler, while testifying for Clean Wisconsin, suggested a sound measurement survey be made at the Shirley project to investigate low frequency noise (LFN) and infrasound (0-20 Hz) in particular. Partial funding was authorized by the PSC to conduct a survey at Shirley and permission for home entry was granted by the three homeowners. The proposed test plan called for the wind farm owner, Duke Energy, to cooperate fully in supplying operational data and by turning off the units for short intervals so the true ON/OFF impact of turbine emissions could be documented. Duke declined this request due to the cost burden of lost generation, and the homeowners withdrew their permission at the last moment because no invited experts on their behalf were available to attend the survey. Clean Wisconsin, their consultants and attorneys for other groups all cooperated and persisted and the survey was rescheduled for December 4 thru 7, 2012. Four acoustical consulting firms would cooperate and jointly conduct and/or observe the survey. Channel Islands Acoustics (ChIA) has derived modest income while Hessler Associates has derived significant income from wind turbine development projects. Rand Acoustics is almost exclusively retained by opponents of wind projects. Schomer and Associates have worked about equally for both proponents and opponents of wind turbine projects. However, all of the firms are pro-wind if proper siting limits for noise are considered in the project design. The measurement survey was conducted on schedule and this report is organized to include four Appendices A thru D where each firm submitted on their own letterhead a report summarizing their findings. Based on this body of work, a consensus is formed where possible to report or opine on the following:
• Measured LFN and infrasound documentation • Observations of the five investigators on the perception of LFN and infrasound both outside and
inside the three residences. • Observations of the five investigators on any health effects suffered during and after the 3 to 4
day exposure. • Recommendations for the existing Shirley project
Ex.-CW-7
Report Number 122412-1 Page 3 of 12
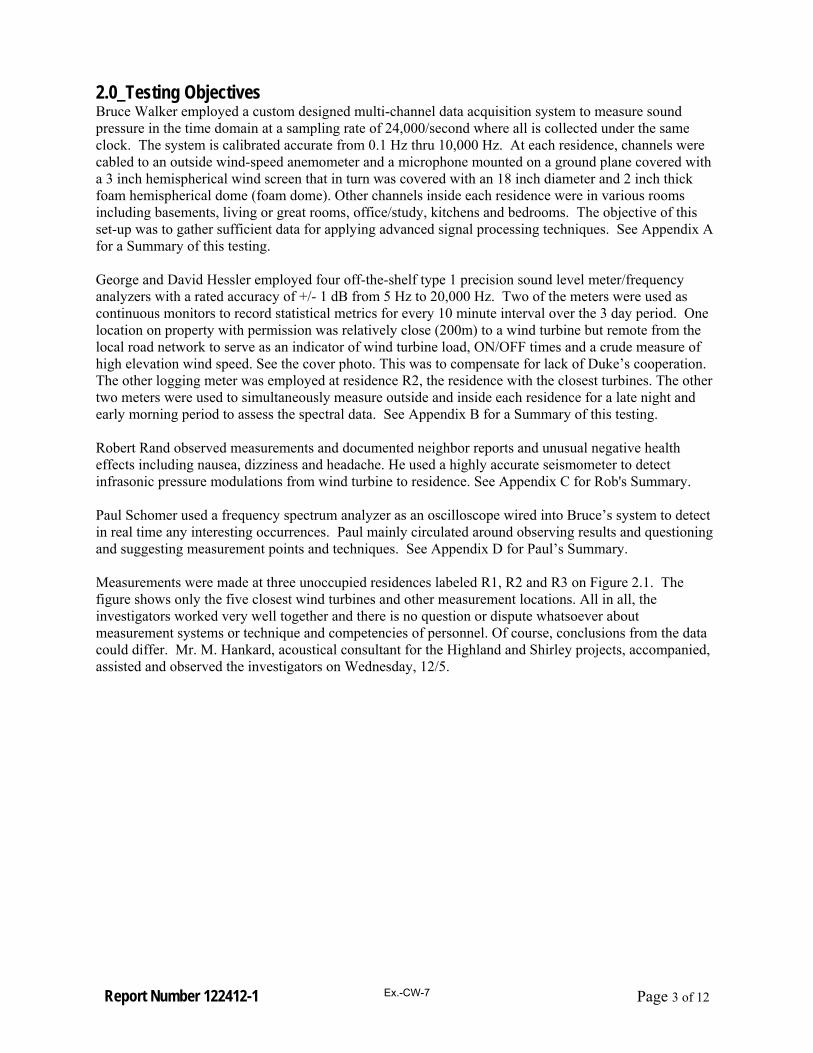
2.0_Testing Objectives Bruce Walker employed a custom designed multi-channel data acquisition system to measure sound pressure in the time domain at a sampling rate of 24,000/second where all is collected under the same clock. The system is calibrated accurate from 0.1 Hz thru 10,000 Hz. At each residence, channels were cabled to an outside wind-speed anemometer and a microphone mounted on a ground plane covered with a 3 inch hemispherical wind screen that in turn was covered with an 18 inch diameter and 2 inch thick foam hemispherical dome (foam dome). Other channels inside each residence were in various rooms including basements, living or great rooms, office/study, kitchens and bedrooms. The objective of this set-up was to gather sufficient data for applying advanced signal processing techniques. See Appendix A for a Summary of this testing. George and David Hessler employed four off-the-shelf type 1 precision sound level meter/frequency analyzers with a rated accuracy of +/- 1 dB from 5 Hz to 20,000 Hz. Two of the meters were used as continuous monitors to record statistical metrics for every 10 minute interval over the 3 day period. One location on property with permission was relatively close (200m) to a wind turbine but remote from the local road network to serve as an indicator of wind turbine load, ON/OFF times and a crude measure of high elevation wind speed. See the cover photo. This was to compensate for lack of Duke’s cooperation. The other logging meter was employed at residence R2, the residence with the closest turbines. The other two meters were used to simultaneously measure outside and inside each residence for a late night and early morning period to assess the spectral data. See Appendix B for a Summary of this testing. Robert Rand observed measurements and documented neighbor reports and unusual negative health effects including nausea, dizziness and headache. He used a highly accurate seismometer to detect infrasonic pressure modulations from wind turbine to residence. See Appendix C for Rob's Summary. Paul Schomer used a frequency spectrum analyzer as an oscilloscope wired into Bruce’s system to detect in real time any interesting occurrences. Paul mainly circulated around observing results and questioning and suggesting measurement points and techniques. See Appendix D for Paul’s Summary. Measurements were made at three unoccupied residences labeled R1, R2 and R3 on Figure 2.1. The figure shows only the five closest wind turbines and other measurement locations. All in all, the investigators worked very well together and there is no question or dispute whatsoever about measurement systems or technique and competencies of personnel. Of course, conclusions from the data could differ. Mr. M. Hankard, acoustical consultant for the Highland and Shirley projects, accompanied, assisted and observed the investigators on Wednesday, 12/5.
Ex.-CW-7

Report Number 122412-1 Page 4 of 12
Figure 2.1: Aerial view showing sound survey locations
R3: 3820 SCHMIDT ROAD
R1: 6034 FAIRVIEW ROAD
R2: 5792 GLENMORE ROAD
Ref. WIND TURBINE LOCATIONS
7000'
3500'
1100'
WTG 3
WTG 7
WTG 8
WTG 6
WTG 5
ON/OFF MEASUREMENT LOCATION(269m TO NACELLE)
MON 2-CONTINUOUS MONITOR
MON 1-CONTINUOUS MONITOR(201m TO NACELLE)
WTG 1 AND 2,11,200' SOUTHOF REIDENCE R3
The four firms wish to thank and acknowledge the extraordinary cooperation given to us by the residence owners and various attorneys.
Ex.-CW-7
Report Number 122412-1 Page 5 of 12
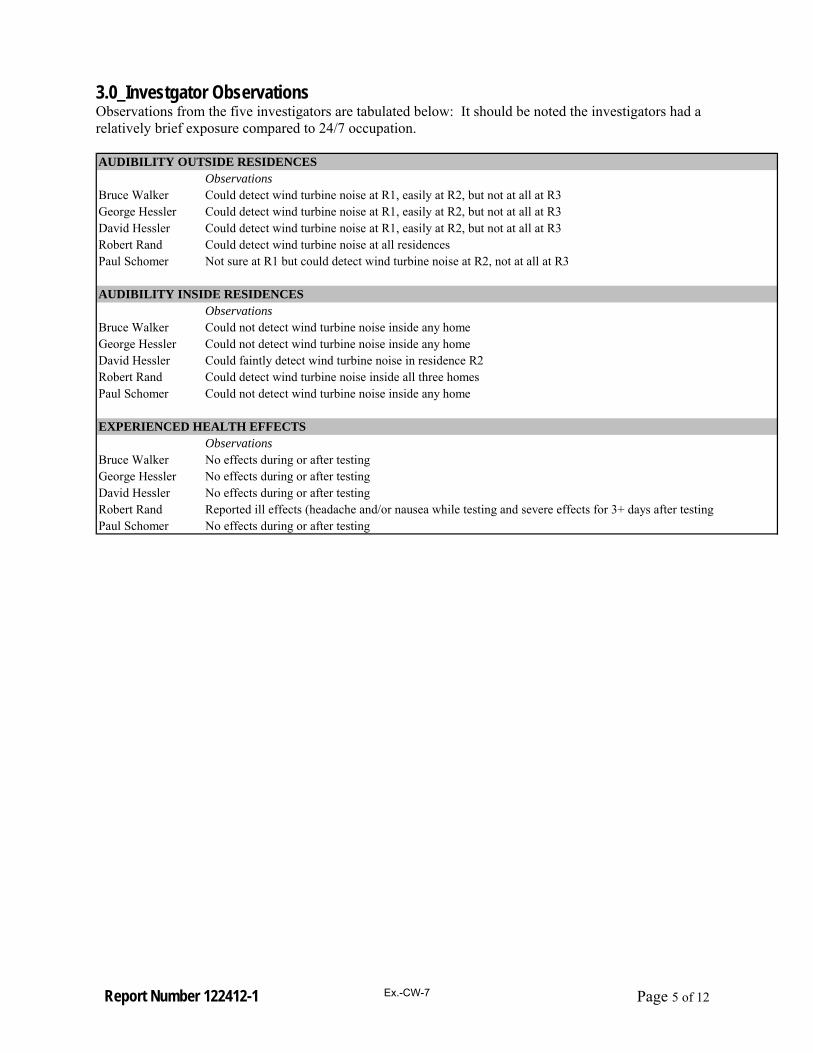
3.0_Investgator Observations Observations from the five investigators are tabulated below: It should be noted the investigators had a relatively brief exposure compared to 24/7 occupation. AUDIBILITY OUTSIDE RESIDENCES
ObservationsBruce Walker Could detect wind turbine noise at R1, easily at R2, but not at all at R3George Hessler Could detect wind turbine noise at R1, easily at R2, but not at all at R3David Hessler Could detect wind turbine noise at R1, easily at R2, but not at all at R3Robert Rand Could detect wind turbine noise at all residencesPaul Schomer Not sure at R1 but could detect wind turbine noise at R2, not at all at R3
AUDIBILITY INSIDE RESIDENCESObservations
Bruce Walker Could not detect wind turbine noise inside any homeGeorge Hessler Could not detect wind turbine noise inside any homeDavid Hessler Could faintly detect wind turbine noise in residence R2Robert Rand Could detect wind turbine noise inside all three homesPaul Schomer Could not detect wind turbine noise inside any home
EXPERIENCED HEALTH EFFECTSObservations
Bruce Walker No effects during or after testingGeorge Hessler No effects during or after testingDavid Hessler No effects during or after testingRobert Rand Reported ill effects (headache and/or nausea while testing and severe effects for 3+ days after testingPaul Schomer No effects during or after testing
Ex.-CW-7
Report Number 122412-1 Page 6 of 12
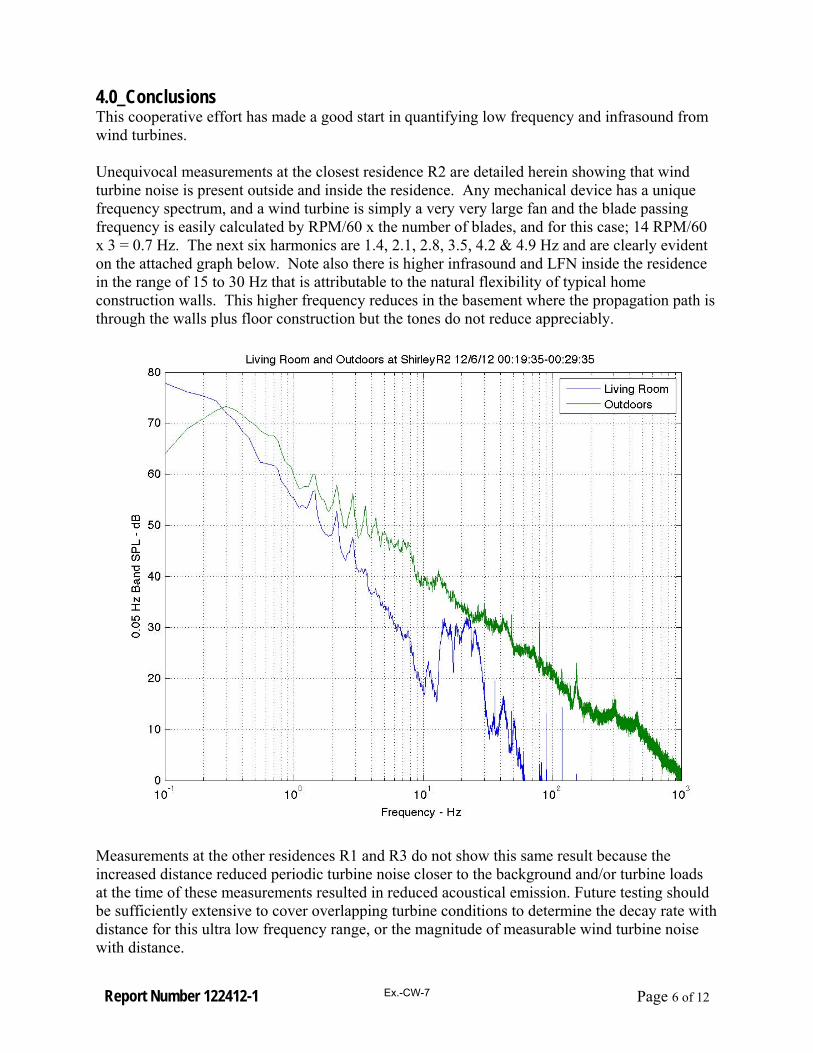
4.0_Conclusions This cooperative effort has made a good start in quantifying low frequency and infrasound from wind turbines. Unequivocal measurements at the closest residence R2 are detailed herein showing that wind turbine noise is present outside and inside the residence. Any mechanical device has a unique frequency spectrum, and a wind turbine is simply a very very large fan and the blade passing frequency is easily calculated by RPM/60 x the number of blades, and for this case; 14 RPM/60 x 3 = 0.7 Hz. The next six harmonics are 1.4, 2.1, 2.8, 3.5, 4.2 & 4.9 Hz and are clearly evident on the attached graph below. Note also there is higher infrasound and LFN inside the residence in the range of 15 to 30 Hz that is attributable to the natural flexibility of typical home construction walls. This higher frequency reduces in the basement where the propagation path is through the walls plus floor construction but the tones do not reduce appreciably.
Measurements at the other residences R1 and R3 do not show this same result because the increased distance reduced periodic turbine noise closer to the background and/or turbine loads at the time of these measurements resulted in reduced acoustical emission. Future testing should be sufficiently extensive to cover overlapping turbine conditions to determine the decay rate with distance for this ultra low frequency range, or the magnitude of measurable wind turbine noise with distance.
Ex.-CW-7
Report Number 122412-1 Page 7 of 12
The critical questions are what physical effects do these low frequencies have on residents and what LFN limits, if any, should be imposed on wind turbine projects. The reported response at residence R2 by the wife and their child was extremely adverse while the husband suffered no ill effects whatsoever, illustrating the complexity of the issue. The family moved far away for a solution. A most interesting study in 1986 by the Navy reveals that physical vibration of pilots in flight simulators induced motion sickness when the vibration frequency was in the range of 0.05 to 0.9 Hz with the maximum (worst) effect being at about 0.2 Hz, not too far from the blade passing frequency of future large wind turbines. If one makes the leap from physical vibration of the body to physical vibration of the media the body is in, it suggests adverse response to wind turbines is an acceleration or vibration problem in the very low frequency region. The four investigating firms are of the opinion that enough evidence and hypotheses have been given herein to classify LFN and infrasound as a serious issue, possibly affecting the future of the industry. It should be addressed beyond the present practice of showing that wind turbine levels are magnitudes below the threshold of hearing at low frequencies. 5.0_Recommendations 5.1_General We recommend additional study on an urgent priority basis, specifically:
• A comprehensive literature search far beyond the search performed here under time constraints.
• A retest at Shirley to determine the decay rate of ultra low frequency wind turbine sound with distance with a more portable system for measuring nearly simultaneously at the three homes and at other locations.
• A Threshold of Perception test with participating and non-participating Shirley residents. 5.2_For the Shirley Project The completed testing was extremely helpful and a good start to uncover the cause of any such severe adverse impact reported at this site. The issue is complex and relatively new. Such reported adverse response is sparse or non-existent in the peer-reviewed literature. At least one accepted paper at a technical conference1 has been presented. There are also self-published reports on the internet along with much erroneous data based on outdated early wind turbine experience. A serious literature search and review is needed and is strongly recommended. Paul Schomer, in the brief amount of time for this project analysis, has uncovered some research that may provide a probable cause or direction to study for the reported adverse health effects. We could be close to identifying a documented cause for the reported complaints but it involves much more serious impartial effort.
1 Ambrose, S. E., Rand, R. W., Krogh, C. M., “Falmouth, Massachusetts wind turbine infrasound and low frequency noise measurements”, Proceedings of Inter-Noise 2012, New York, NY, August 19-22.
Ex.-CW-7
Report Number 122412-1 Page 8 of 12
An important finding on this survey was that the cooperation of the wind farm operator is absolutely essential. Wind turbines must be measured both ON and OFF on request to obtain data under nearly identical wind and power conditions to quantify the wind turbine impact which could not be done due to Duke Energy’s lack of cooperation. We strongly recommend additional testing at Shirley. The multi-channel simultaneous data acquisition system is normally deployed within a mini-van and can be used to measure immissions at the three residences under the identical or near identical wind and power conditions. In addition, seismic accelerometer and dedicated ear-simulating microphones can be easily accommodated. And, ON/OFF measurements require the cooperation of the operator. Since the problem may be devoid of audible noise, we also recommend a test as described by Schomer in Appendix D to develop a “Threshold of Perception” for wind turbine emissions.
Ex.-CW-7

Report Number 122412-1 Page 9 of 12
APPENDIX A by
CHANNEL ISLANDS ACOUSTICS
Ex.-CW-7
Channel Islands Acoustics 676 West Highland Drive
Camarillo, CA 93010 805-484-8000 FAX 805-482-5075
[email protected] LowFrequencyAcousticMeasurementsatShirleyWindParkBruceWalker,Ph.D.,INCEBd.Cert.OVERVIEW
BruceWalkerofChannelIslandsAcoustics(ChIA)wasrequestedbyHesslerAssociatestoassistindefininglowandinfrasonicfrequency(approximately0.5–100Hz)soundsatabandonedresidencesintheenvironsofShirleyWindParknearDePere,WI.ChIAhasbeendevelopingameasurementsystemthatcombinesextendedrangemicrophonesandrecordingequipmentwithmixedtimedomainandfrequencydomainsignalprocessinginanefforttoquantifysoundlevelsandwaveformpropertiesofverylowfrequencyperiodicsignalsradiatedbylargewindturbinesi.
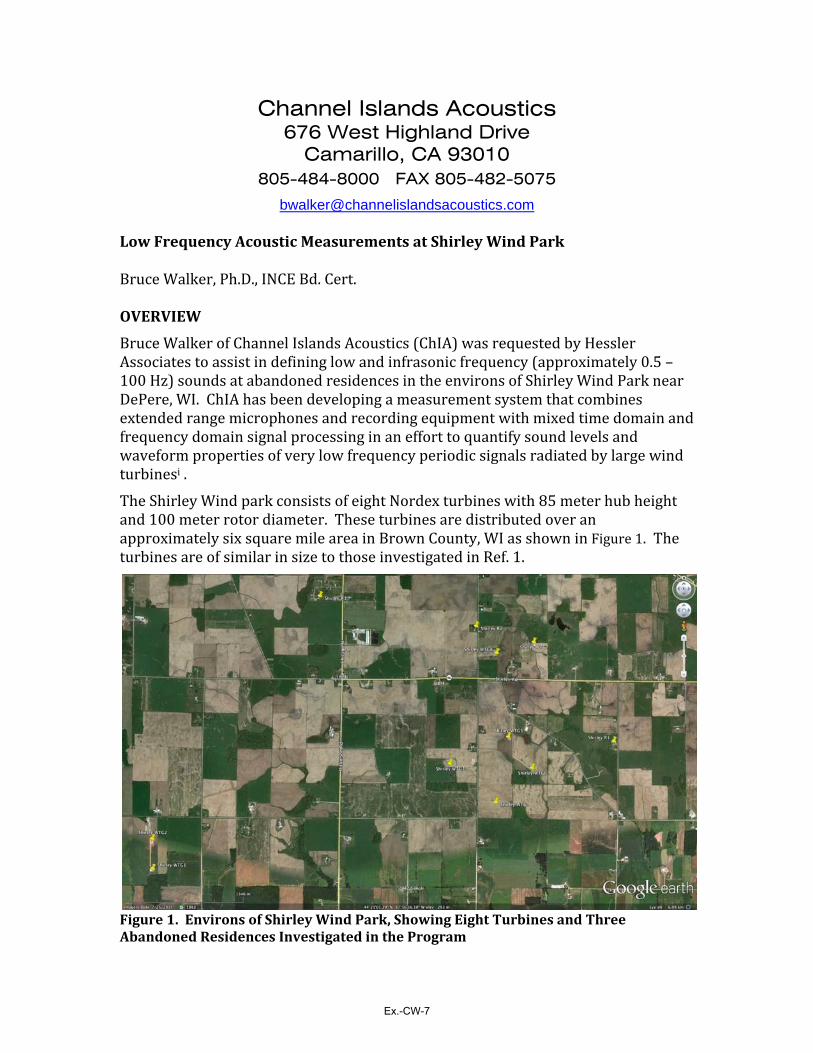
TheShirleyWindparkconsistsofeightNordexturbineswith85meterhubheightand100meterrotordiameter.TheseturbinesaredistributedoveranapproximatelysixsquaremileareainBrownCounty,WIasshowninFigure1.TheturbinesareofsimilarinsizetothoseinvestigatedinRef.1.
Figure1.EnvironsofShirleyWindPark,ShowingEightTurbinesandThreeAbandonedResidencesInvestigatedintheProgram
Ex.-CW-7

Thetestsincludedacousticmeasurementatmultiplelocationsinsideandoutsidethreeabandonedresidences,atnominaldistancesandbearingsfromthethreeturbinesasshowninTable1,andwillbedescribedingreaterdetailinasubsequentsection.TestmethodologyandschedulewereconstrainedtoatestingperiodDecember4‐7andinabilitytoparktheturbinestoestablishareliablebackgroundnoisebaseline.Table1.DistancesinfeetandBearingindegreesEastofNorthfromTurbinestoTestedResidences
ChIAmeasurementswereconductedatresidenceR1(Fairview)ontheeveningofDecember4andtheearlyafternoonofDecember5.MeasurementswereconductedatresidenceR2(Glenmore)duringlateeveningandlatenightDecember5/earlymorningDecember6andmid‐afternoonDecember6.MeasurementswereconductedatresidenceR3(Schmidt)duringlateafternoonDecember6andmid‐morningDecember7.TimesoftestsaremeanwindspeedsareshowninTable3.TERMINOLOGY
Itisassumedthereaderisfamiliarwithcommonlyencounteredacousticaltermsandunitssuchasdecibel(dB),soundlevel,soundpressurelevel,soundpowerlevel,spectrum,frequency,hertz(Hz),etc.Thefollowingisabriefglossaryoftermsandunitsthatlay‐personsmaynotbefamiliarwith,butwhichwillbeusedtodescribesomeofthedataanalysesinthisprogram.
pascals(Pa)–thestandardunitofpressure.Thereferencesoundpressureis20microPa.Atmosphericpressureisjustover100,000Pa.Anacousticsignalof1Parmsamplitudehasasoundpressurelevelof94dB.
correlationfunction(CC())–atime‐domaindescriptionofthecommonalitybetweentwosignalsasafunctionofthetimedelaybetweenthem.TheunitisPa‐squared.Thecorrelationfunctionforasignalanditselfistheauto‐correlation,andthermsamplitudeofthesignalisthesquare‐rootoftheauto‐correlationatzerodelay.Thecorrelationfunctionbetweenseparatesignalsisthecross‐correlation.Thepeakdelayofthecross‐correlationtimethespeedofpropagationshowsthedifferenceinpathlengthbetweenthetwosignalsiftheyresultfromacommon
Ex.-CW-7

source.Thecorrelationcoefficientisthecross‐correlationfunctiondividedbytheproductofthesquarerootsoftheauto‐correlationatzerodelay.
powerspectraldensityfunction(PSD)–theaverageofthesquared‐magnitudeofthefrequencyspectrumofatime‐varyingsignal,dividedbythenominalbandwidth(BWinHz)ofthespectralanalysis.TheunitisPa‐squaredperHz.NarrowbandsoundpressurelevelsinthisreportarecomputedindBas10log(PSDxBW)+94.
cross‐PSD–thefrequency‐by‐frequencyaverageoftheproductsofthespectrafromtwosignals.
coherencefunction‐afrequency‐domaindescriptionoftherelativecommonalitybetweentwosignals.Itisdeterminedasthefrequency‐by‐frequencyratioofthecross‐PSDtotheproductofthesquarerootsofthetwoPSD’s.Ifaspectralcomponentintwosignalsresultsfromacommonsource,thecoherenceisunity(1)andifthespectralcomponentresultsfromtwostatisticallyindependentsources,thecoherenceiszero.
spectrograph–adisplayofamplitudeascolororbrightnessvsfrequencyandtime.
MEASUREMENTSYSTEMandDATAACQUISITION
AbasiclistofthecomponentsinthemeasurementsystemareshowninTable2.Serialnumbersandcalibrationcertificationsareavailableonrequest.
Table2.BasicComponentsofChIALow‐FrequencyAcousticDataAcquisitionSystem
Asdeployedinthisprogram,the4193microphoneswithlow‐frequencyextensions,2639preamplifiersandNEXUSsignalconditionerwereplacedinthreeorfourroomsoftheresidences,whileafifth4193anda2250analyzerwasplacedinastandard3‐1/2inchhemispherewindballunderan18inchfoamsecondarywindscreenonagroundboardapproximately50ftfromtheresidenceinthedirectionofwindturbines.Thesixth4193andsecond2250wereheldinreserveandultimatelydeployedatR3onDecember7.Fullsystemthroughputcalibrationwasrunforallchannelseachdayandaftereachequipmentrelocation.
Measurementdatawascollectedwithsimultaneousin10‐minuteblocksatsamplingrate24kHzasshownintheTestLog,Table3.Thesignalconditioningamplifiersweresetforrange0.1Hzto10kHz.Amplifiersensitivitiesweresettoallowsoundpressuresupto10Pa(114dB)tobeacceptedwithoutsystemoverload.TheoutputoftheNRGcupanemometer/resolverwasrecordedonaseventhchannelofthe
Ex.-CW-7
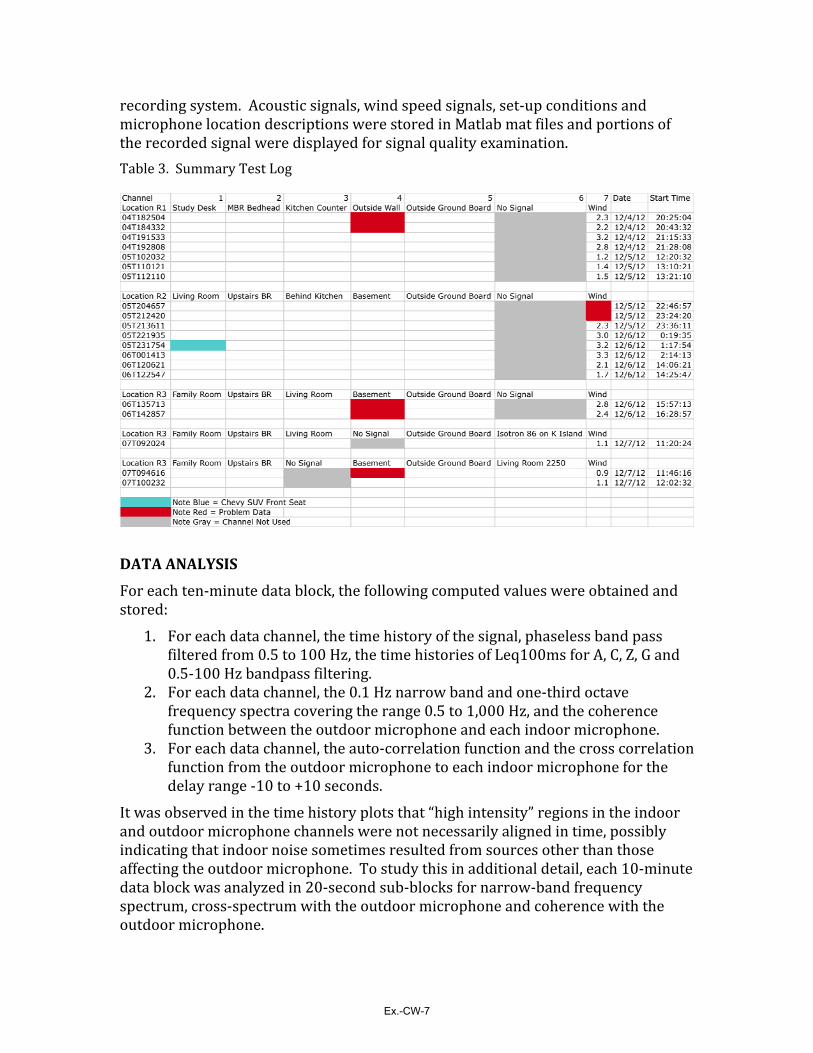
recordingsystem.Acousticsignals,windspeedsignals,set‐upconditionsandmicrophonelocationdescriptionswerestoredinMatlabmatfilesandportionsoftherecordedsignalweredisplayedforsignalqualityexamination.
Table3.SummaryTestLog
DATAANALYSIS
Foreachten‐minutedatablock,thefollowingcomputedvalueswereobtainedandstored:
1. Foreachdatachannel,thetimehistoryofthesignal,phaselessbandpassfilteredfrom0.5to100Hz,thetimehistoriesofLeq100msforA,C,Z,Gand0.5‐100Hzbandpassfiltering.
2. Foreachdatachannel,the0.1Hznarrowbandandone‐thirdoctavefrequencyspectracoveringtherange0.5to1,000Hz,andthecoherencefunctionbetweentheoutdoormicrophoneandeachindoormicrophone.
3. Foreachdatachannel,theauto‐correlationfunctionandthecrosscorrelationfunctionfromtheoutdoormicrophonetoeachindoormicrophoneforthedelayrange‐10to+10seconds.
Itwasobservedinthetimehistoryplotsthat“highintensity”regionsintheindoorandoutdoormicrophonechannelswerenotnecessarilyalignedintime,possiblyindicatingthatindoornoisesometimesresultedfromsourcesotherthanthoseaffectingtheoutdoormicrophone.Tostudythisinadditionaldetail,each10‐minutedatablockwasanalyzedin20‐secondsub‐blocksfornarrow‐bandfrequencyspectrum,cross‐spectrumwiththeoutdoormicrophoneandcoherencewiththeoutdoormicrophone.
Ex.-CW-7

Followingthis,thespectrumwiththemostdistinctrepresentationofturbinebladepassagepulsationwasidentified.FromtheBladePassageharmonicseriesnotedforthisspectrum,waveformsweresynthesizedassumingtwosetsofphaserelationships.Inthefirst,theharmonicswerearrangedassinewaveswithzerophase.Inthesecond,theywerearrangedascosinewaveswithzerophase.Theformerproducesacompositewavewithmaximumwavefrontslopewhilethelatterproducesacompositewavewithmaximumpeak‐to‐rmsratio(crestfactor).
RESULTSEXAMPLES
Thetestproducedalargecompendiumoftestingresults,which,itishoped,canbecorrelatedwithturbineoperatingconditionsfromdatayettobereceived.Meanlocalwindspeedsforallblocksareshown(meterspersecond)inTable3.Illustrativeexamplesshowingdisparitiesamongthethreeresidencesareshowninthefollowinggraphs.Thefullsetofdataisavailableforreview.
Figure2showsasampleofrawdatacollectedduringwindyconditionsatResidenceR2.Notethatapparentlywind‐drivenverylowfrequencypressurefluctuationsarewellsynchronizedandnearlyequalinamplitudeatfourdisparatelocationswithinthehome.
Figure2.FirstMinuteofRawDataCollectedatR2OnDec6Starting00:19:35.Noteverylowfrequencyfluctuationsarenearlyequalatfourlocations.
Ex.-CW-7

Figure3.LowFrequency(0.1‐1,000Hz)SpectraandCoherencefromTwoRoomsinR2measured12/6/12starting00:19:35showingdifferencesindetailandwellcorrelatedlow‐orderblade‐passharmonics.Redcurveismeasuredoutdoorsbetweenturbinesandhome.
Figure4.LowFrequency(0.1‐1,000Hz)SpectraandCoherencefromTwoRoomsinR1measured12/4/12starting21:15:33showingdifferencesindetailandpoorlycorrelatedlow‐orderblade‐passharmonics.Redcurveismeasuredoutdoorsbetweenturbinesandhome.
Ex.-CW-7
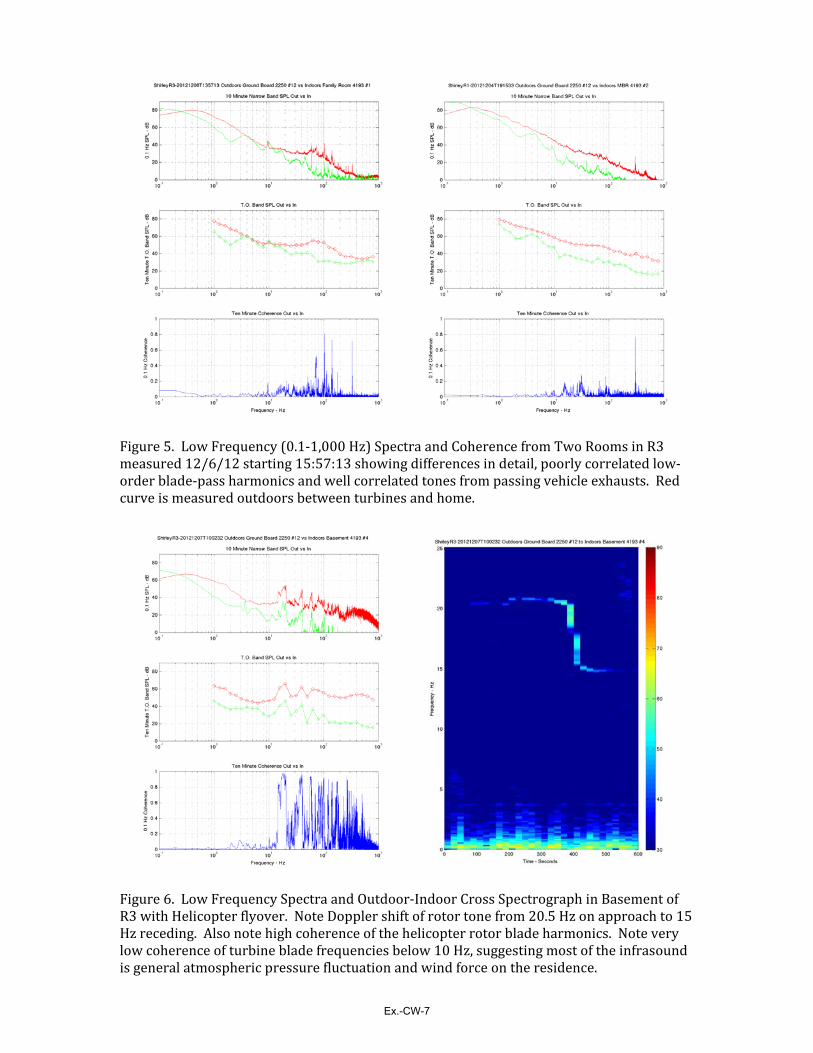
Figure5.LowFrequency(0.1‐1,000Hz)SpectraandCoherencefromTwoRoomsinR3measured12/6/12starting15:57:13showingdifferencesindetail,poorlycorrelatedlow‐orderblade‐passharmonicsandwellcorrelatedtonesfrompassingvehicleexhausts.Redcurveismeasuredoutdoorsbetweenturbinesandhome.
Figure6.LowFrequencySpectraandOutdoor‐IndoorCrossSpectrographinBasementofR3withHelicopterflyover.NoteDopplershiftofrotortonefrom20.5Hzonapproachto15Hzreceding.Alsonotehighcoherenceofthehelicopterrotorbladeharmonics.Noteverylowcoherenceofturbinebladefrequenciesbelow10Hz,suggestingmostoftheinfrasoundisgeneralatmosphericpressurefluctuationandwindforceontheresidence.
Ex.-CW-7

Figure7.Short(20sec)durationspectrumwithbestdefinedturbinebladeharmonics,multiplesof0.7Hz.OverallSPLoftheBladePassSignalis70dB.
Figure8.Turbineblade‐passwaveformssynthesizedfromtheharmonicseriesshowninFigure7.Peak‐to‐peakSPLoftheleft‐hand,moreprobablesignalisabout82dB.
Ex.-CW-7

Figure9.0.5HzPhaselessHigh‐PassFilteredWavesIndoors(upper)andOutdoorsatR2,CorrespondingtoSpectrumofFigure7.Noterepetitivewavesindoors,similartoleft‐handsynthesizedexample.Notetransienteventindoorsat15.5secondsunrelatedtooutsidenoise.
AsummaryofstatisticalsoundlevelsforeachtestisshowninTable4.Notethatthehighfrequencynoisefloorofthelow‐frequencymicrophonesusedindoorslimitstheA‐weightedresultsto29‐30dBminimum.Thecellsmarkedinredwereaffectedbysystemoverloadorotherproblemsandshouldbediscounted.ThecellsmarkedingoldareforaseismicaccelerometermountedontheKitchenislandofR3andarenotcalibratedexceptthat94dBisapproximately1m/sec2.ThecellsmarkedintealaretakenonthefrontseatoftheMini‐SUVparkedoutsideR2.AllothersarenormalmeasurementsasshownintheLog,Table3.
Ex.-CW-7

Table4.StatisticalSoundLevelsforAll10‐minuteTests
Ex.-CW-7

CONCLUDINGREMARKS
InanefforttodetermineacousticalconditionsthatcouldbelinkedtoapparentintensereactionbysomeShirleyenvironshomeowners,simultaneousindoorandoutdooracousticandlocalwindspeedmeasurementswereconductedsequentiallyatthreedisparatelocationsoverathree‐dayperiodstartingtheeveningofDecember4,2012.Averylargecompendiumofrawandprocesseddatawasobtained,asmallfractionofwhichispresentedinthissummary.
Theapparentandtentativeresultindicatesthatatthesecondresidence,locatedapproximately1,280ftfromthenearestturbine,blade‐passageinducedinfrasoundwascorrelatedbetweenoutdoorandindoorlocationsandpeakamplitudesofperiodicwavescomposedofbladeharmonics0.7to5.6Hzontheorder76dBweredetectedbothindoorsandoutdoors.Wellcorrelatedbroadbandlowfrequencynoiseatthisnearestresidencewasalsodetected,withone‐thirdoctavebandsoundpressurelevelsapproximately50dBinthefrequencyrange16‐25Hz.Bothofthesesoundsarebelownormalhearingthreshold;residentsreportbeingintenselyaffectedwithoutaudibility.
Attheothertworesidences,locatedapproximately3,300and7,100ftfromthenearestturbine,respectively,highlevelsofinfrasoundweredetectedindoorsbutthecorrelationwithoutdooracousticsignalswasnotclearexceptatthe3,300ftresidence,wherethebroadbandnoiseinthe20Hzrangewasmoderatelycorrelatedandproduceone‐thirdoctavebandlevelapproximately40dB,whichiswellbelownormalhearingthreshold.Atthe7,100ftresidence,outdoor‐to‐indoorcorrelationwaslowexceptduringmotorvehiclepassagesorinparticularahelicopteroverflight.Again,residentsreportbeingintenselyaffecteddespiteinaudibilityandtobeawareofturbineoperationwhentheturbinesarenotvisible.
Theauthorisnotqualifiedtomakejudgmentsregardinghumanresponsetonormallysubliminalsourcesofacousticexcitation.AdetectiontesthasbeenproposedbytheconsortiumofinvestigatorsandputforthbyDr.Schomer.Theauthorconcursthatthisisanimportantstepinresolvingadifficultissue.
Anadditionalmissingelementintheprogramisabilitytocorrelateacoustictestresultswithturbineoperatingconditions.Near‐turbineacousticmonitorsplacedbyHAIshowedsignificantvariabilityinnear‐fieldsoundlevelsforturbinesWTG6andWTG8overthecourseoftheprogram,withanindicationthatturbinenoiseemissionsmayhavedecreasedshortlybeforetheteamstartedandincreasedshortlyaftertheteamstoppedmeasuringonsomedays.ReviewofturbineSCADArecordswillshowturbine‐heightwindspeedsanddirectionsandturbinepoweroutputaswellastimeswhenturbinewereparkedforflickersuppressionorotherpurposes.Thiswillhelpdeterminetheprogramforadditionalmeasurementsand/orifscalingofmeasuredlevelswouldbeappropriate.
iB.Walker,TimeDomainAnalysisofLowFrequencyWindTurbineNoise,LowFrequencyNoise2012,StratfordUponAvon,UK
Ex.-CW-7

Report Number 122412-1 Page 10 of 12
APPENDIX B by
HESSLER ASSOCIATES, INC.
Ex.-CW-7

Member National Council of Acoustical Consultants 1 Noise Control Services Since 1976
3862 Clifton Manor Place, Suite B Haymarket, Virginia 20169 USA Phone: 703-753-1602 Fax: 703-753-1522 Website: www.hesslernoise.com
Hessler Associates, Inc.Consultants in Engineering Acoustics
Appendix B to Report Number 122412-1 1. Introduction Hessler Associates concentrated on acquiring data to define the low frequency issue at the Shirley site using four Norsonics Model N-140 ANSI Type 1 precision instruments (NOR140). These systems with the standard microphone and preamp are rated at an accuracy of +/- 1 dB from 5 Hz to 20,000 Hz. Two of the systems were used as continuous data loggers and the other two for relevant attended measurements. The systems were also calibrated against the extended frequency range system brought by Channel Islands Acoustics (ChIA). 2. Calibration Two NOR140 units were set-up in the living room of residence R2 adjacent to the high performance ChIA microphone, which is rated accurate from 0.1 Hz to 20,000 Hz. The results of a 10-minute run between the three systems, along with a photograph of the set-up, are shown below. It is clear from the test that the NOR140 off-the-shelf unit can be used with confidence down to about 2 Hz; significantly better than its 5 Hz rating.
10
20
30
40
50
60
70
80
0.4 0.5 0.63 0.8 1
1.25 1.6 2 2.5 3.15 4 5 6.3 8 10 12.5 16 20 25 31.5 40 50 63 80 100
125
160
200
250
315
400
500
630
800
1000
1250
1600
2000
2500
3150
4000
5000
6300
8000
1/3 OCTAVE BAND CENTER FREQUENCY, Hz
SOUN
D PR
ESSU
RE LE
VEL,
dB
B&K MIC, 0.1 Hz up
NOR1 MIC, 5 Hz up
NOR2 MIC, 5Hz up??
Figure 2.1 Instrument Calibration Check Relative to High Performance ChIA System
Ex.-CW-7

Member National Council of Acoustical Consultants 2 Noise Control Services Since 1976
Hessler Associates, Inc.Consultants in Engineering Acoustics
3. Data Logger Because Duke Power would not participate in the test, it became necessary to install an automated sound level recorder near Turbine 6 to get a sense of what load that turbine, and presumably the remainder of the project, was operating at - and, indeed, whether the turbines were operating at all. The test position, designated as Monitor 1, is shown in Figure 2.1 in the cover report. A plot for each 10-minute interval in terms of the L50, L90 and Leq statistical metrics is given below.
20
30
40
50
60
70
80
4PM-
12-4
-12-
MON1 5P
M6P
M7P
M8P
M9P
M10
PM11
PM12
AM-1
2-5-
12-M
ON1
1AM
2AM
3AM
4AM
5AM
6AM
7AM
8AM
9AM
10AM
11AM
12NO
ON 1PM
2PM
3PM
4PM
5PM
6PM
7PM
8PM
9PM
10PM
11PM
12AM
-12-
6-12
-MON
11A
M2A
M3A
M4A
M5A
M6A
M7A
M8A
M9A
M10
AM11
AM12
NOON 1P
M2P
M3P
M4P
M5P
M6P
M7P
M8P
M9P
M10
PM11
PM12
AM-1
2-7-
12-M
ON1
1AM
2AM
3AM
4AM
5AM
6AM
7AM
8AM
9AM
10AM
11AM
12NO
ON
HOURS IN 10-MIN INTERVALS
SOUN
D LE
VEL-
Leq(
10m)
LAeq LCeqLA90 LC90LA50
WEDNESDAY THURSDAY
WT6 AT FULL LOAD
Figure 3.1 Monitor 1 Results
Calculations indicate that the turbine is at full power when the sound pressure at the monitor is approximately 53 dBA. In general, the plot shows when the unit was near or at full power and when it was off (e.g. around midday on Wednesday when the sound level dropped to about 31 dBA). The second long-term logger, Monitor 2, which was located in front of the residence at R2, was not as useful because it was strongly influenced by extraneous, contaminating noise from traffic on Glenmore Road. Nevertheless, the results are given below in Figure 3.2.
20
30
40
50
60
70
80
5PM-
12-5
-12-
MON2 6P
M7P
M8P
M9P
M10
PM11
PM12
AM-1
2-6-
12-
1AM
2AM
3AM
4AM
5AM
6AM
7AM
8AM
9AM
10AM
11AM
12NO
ON 1PM
2PM
3PM
4PM
5PM
6PM
7PM
8PM
9PM
10PM
11PM
12AM
-12-
7-12
-1A
M2A
M3A
M4A
M5A
M6A
M7A
M8A
M9A
M10
AM11
AM
HOURS IN 10-MIN INTERVALS
SOUN
D LE
VEL-
Leq(
10m)
LCeq LC90 LAeq LA50 LA90
THURSDAY
Figure 3.2 Monitor 2 Results
Ex.-CW-7

Member National Council of Acoustical Consultants 3 Noise Control Services Since 1976
Hessler Associates, Inc.Consultants in Engineering Acoustics
4. OUTDOOR/INDOOR Measurements Measurements of the frequency spectra inside and outside of each of three residences on Wednesday night and early Thursday morning while the turbines were operating near full power are plotted below.
10
20
30
40
50
60
70
80
0.4 0.5 0.63 0.8 1
1.25 1.6 2 2.5 3.2 4 5 6.3 8 10 12
.5 16 20 25 32 40 50 63 80 100
125
160
200
250
315 40 500
630
800
1000
1250
1600
2000
2500
3150
4000
5000
6300
8000
1000
0AW
TCW
TZW
T
1/3 OBCF, Hz
SOUN
D PR
ESSU
RE LE
VEL,
dB
R-1 OUTSIDE 10PM-12AMR-1 INSIDE 10PM-12AMR-1 OUTSIDE 2AM-4AMR-1 INSIDE 2AM-4AM
10
20
30
40
50
60
70
80
0.4 0.5 0.63 0.8 1
1.25 1.6 2 2.5 3.2 4 5 6.3 8 10 12
.5 16 20 25 32 40 50 63 80 100
125
160
200
250
315 40 500
630
800
1000
1250
1600
2000
2500
3150
4000
5000
6300
8000
1000
0AW
TCW
TZW
T
1/3 OBCF, Hz
SOUN
D PR
ESSU
RE LE
VEL,
dB
R-2 OUTSIDE 10PM-12AMR-2 INSIDE 10PM-12AMR-2 OUTSIDE 2AM-4AMR-2 INSIDE 2AM-4AM
10
20
30
40
50
60
70
80
0.4 0.5 0.63 0.8 1
1.25 1.6 2 2.5 3.2 4 5 6.3 8 10 12
.5 16 20 25 32 40 50 63 80 100
125
160
200
250
315 40 500
630
800
1000
1250
1600
2000
2500
3150
4000
5000
6300
8000
1000
0AW
TCW
TZW
T
1/3 OBCF, Hz
SOUN
D PR
ESSU
RE LE
VEL,
dB
R-3 OUTSIDE 10PM-12AMR-3 INSIDE 10PM-12AMR-3 OUTSIDE 2AM-4AMR-3 INSIDE 2AM-4AM
Figure 4.1 Inside/Outside Sound Levels during Project Operation
Ex.-CW-7

Member National Council of Acoustical Consultants 4 Noise Control Services Since 1976
Hessler Associates, Inc.Consultants in Engineering Acoustics
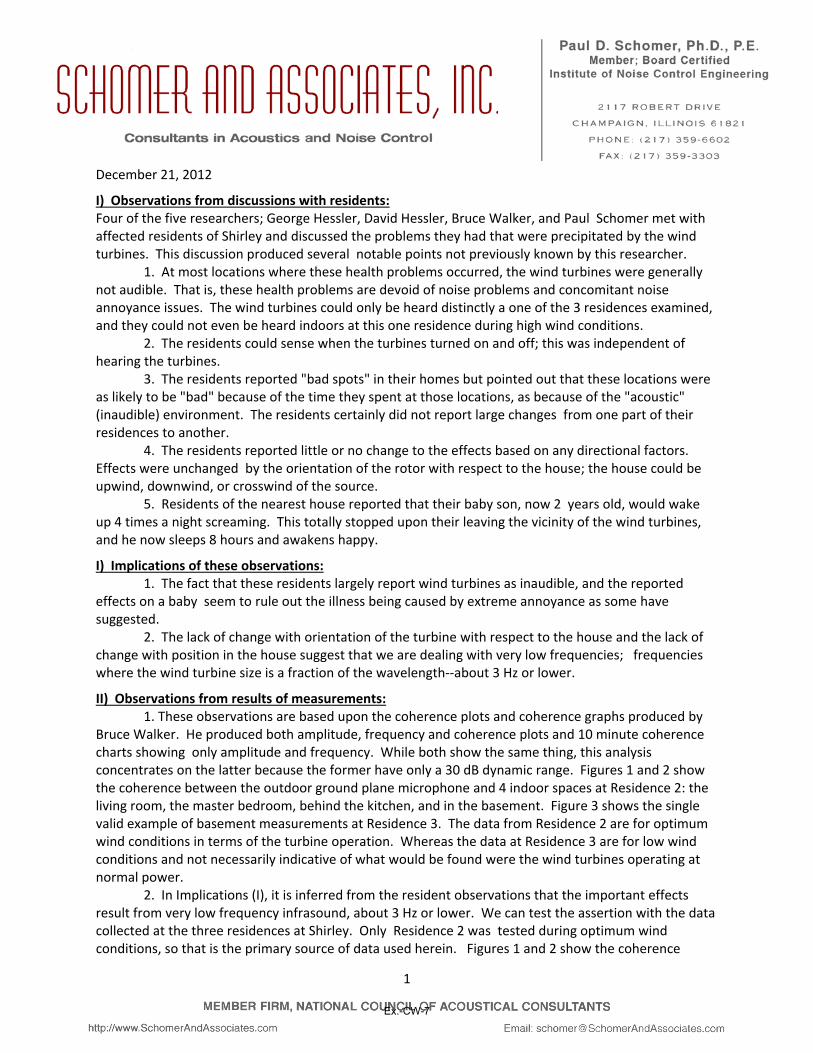
These figures are 10-minute L50 samples made simultaneously outside and inside of the three residences between 10 p.m. and midnight and between 2 and 4 a.m. The measured levels below 1 or 2 Hz may be pseudo noise, or false signal noise from the wind blowing over the microphone, even though the microphone was placed on a reflective ground board under a 7” hemispherical windscreen to minimize this effect. The plotted outdoor levels are the raw measurement results obtained on the reflective ground plane and should be reduced by 3 dB to reflect a standard measurement 1.5 meters above grade. Maximum levels occur at R-2 as one would expect, since it is closest to the turbines and the location where wind turbine noise was most readily audible. What is significant about these plots is that there is a low frequency region from about 10 to 40 Hz where the noise reduction of each house structure appears to be weakest. This behavior is attributed to the frequency response of each structure, which is known to be in this frequency range. The small differences in the magnitude and frequency of the interior sound levels in this region of the spectrum are largely associated with differences in construction, design, openings, etc. The question is: what is the driving or excitation force in this range? It could be acoustic noise immissions from the wind turbines, normal environmental sources (mostly traffic), the natural response of each structure to varying wind pressure or some combination of these causes. The only sure way to discover the driving force is to turn off the wind turbines for a short period to see if the spectrum changes without the turbines in operation. This type of on/off testing was requested in the first test protocol and these rather inconclusive results make it clear that such an approach is essential to the task of identifying and quantifying the sound emissions specifically from the turbines inside of these homes. 5. ON/OFF Measurements In the course of taking some supplemental outdoor measurements of the turbine closest to R-2 at least one on/off sample, although outdoors, was obtained through happenstance. After several measurements at a position 269 m WNW of WTG8, with the turbine in operation at some intermediate load in light winds from the north, the unit was unexpectedly shutdown by O&M personnel. Additional measurements were immediately obtained with all variables constant except for turbine operation. Prior to shutdown the rotor was turning at 11 rpm, which equates to a blade passing frequency of 0.55 Hz. The resulting on/off spectra are plotted below in Figure 5.1. One could conclude that the wind turbine was not producing any low frequency noise since the spectra are essentially equal from 0 to 12.5 Hz; however, despite measuring on a hard surface using a hemispherical windscreen, the low end of both spectra appear to be pseudo, or false-signal noise based on some recent empirical tests of windscreen performance carried out in the Mohave Desert (in support of a new ANSI standard that is being developed for measuring in windy conditions). The objective of this testing was to evaluate measured low frequency sound levels in a moderately windy environment without any actual source of low frequency noise. The on/off measurements of WTG8 show that the levels below about 20 Hz coincide with the sound levels measured in the desert in the presence of a light 1 to 2 m/s wind. Consequently, all that can be concluded is that the low frequency emissions from the turbine were substantially lower in magnitude than the distortion effect produced from a nearly negligible amount of airflow through a 7” windscreen and across the ground-mounted microphone. The overall reduction in audible sound of 8 dBA is attributable to eliminating the “whoosh” sound, which is clearly seen to occur in the higher frequencies; generally from about 200 to 2000 Hz.
Ex.-CW-7

Member National Council of Acoustical Consultants 5 Noise Control Services Since 1976
Hessler Associates, Inc.Consultants in Engineering Acoustics
125 250 500 1k 2k45.80949078 43.66116348 42.35475504 37.03180263 30.6126339941.67886163 34.90850762 31.73556154 27.82394913 25.14155262
0
10
20
30
40
50
60
70
80
0.4 H
z0.5
Hz
0.63 H
z0.8
Hz
1.0 H
z1.2
5 Hz
1.6 H
z2.0
Hz
2.5 H
z3.1
5 Hz
4.0 H
z5.0
Hz
6.3 H
z8.0
Hz
10 H
z12
.5 Hz
16 H
z20
Hz
25 H
z31
.5 Hz
40 H
z50
Hz
63 H
z80
Hz
100 H
z12
5 Hz
160 H
z20
0 Hz
250 H
z31
5 Hz
400 H
z50
0 Hz
630 H
z80
0 Hz
1.0 kH
z1.2
5 kHz
1.6 kH
z2.0
kHz
2.5 kH
z3.1
5 kHz
4.0 kH
z5.0
kHz
6.3 kH
z8.0
kHz
10.0
kHz
AWT
CWT
ZWT
1/3 OBCF, Hz
Leq(
1 MIN
)
R2-1ST MINUTE-ONR3-1ST MINUTE-OFF0 - 1 mps EST. PSEUDO NOISE1 - 2mps EST. PSEUDO NOISE2 - 3 mps EST. PSEUDO NOISE
INFRASOUND FREQUENCIES
NACELLE MACHINERY NOISE AT 15
& 30 Hz
WHOOSHING NOISE FROM BLADE TURNING
Figure 5.1 On/Off Sound Levels Outdoors during Project Operation
6. Proposed Method for Measuring Outdoor LFN in Wind The experience above with on/off measurements outdoors can be combined with a finding made by Walker and Schomer that LFN inside a dwelling was quite uniform throughout all the rooms in the house, and not, as one might intuitively imagine, in the rooms facing the nearest turbine. This prompted them to measure the sound level inside of a vehicle, an SUV, and compare it to the levels measured inside the residence. It was found that the low frequency levels inside the car were similar to those inside the adjacent dwelling. Since an SUV is a closed, wind-free volume, it follows that the problem of obscuring pseudo could be eliminated with such measurements and accurate narrow band measurement of extreme low frequency sound could be measured inside of a car. The spectrum for a wind turbine shows up as a distinct pattern of peaks beginning at the blade passing frequency (about .5 to 1 Hz for modern wind turbines) with several following harmonic peaks that positively identify wind turbine low-frequency infrasound immissions. The beauty of the system sketched below in Figure 6.1 is that it is mobile and can be used at any public assess near or far from a wind farm.
TO M1TO M2
2-CHANNEL SIGNAL ANALYZER0-100 Hz WITH 1600 LINE RESOLUTION (.0625 Hz)BATTERY POWERED
L
M1
>L
M2
Figure 6.1 Schematic of Alternative, Mobile Measurement Technique for
Low Frequency Sound Emissions from Wind Turbines
Ex.-CW-7
Member National Council of Acoustical Consultants 6 Noise Control Services Since 1976
Hessler Associates, Inc.Consultants in Engineering Acoustics
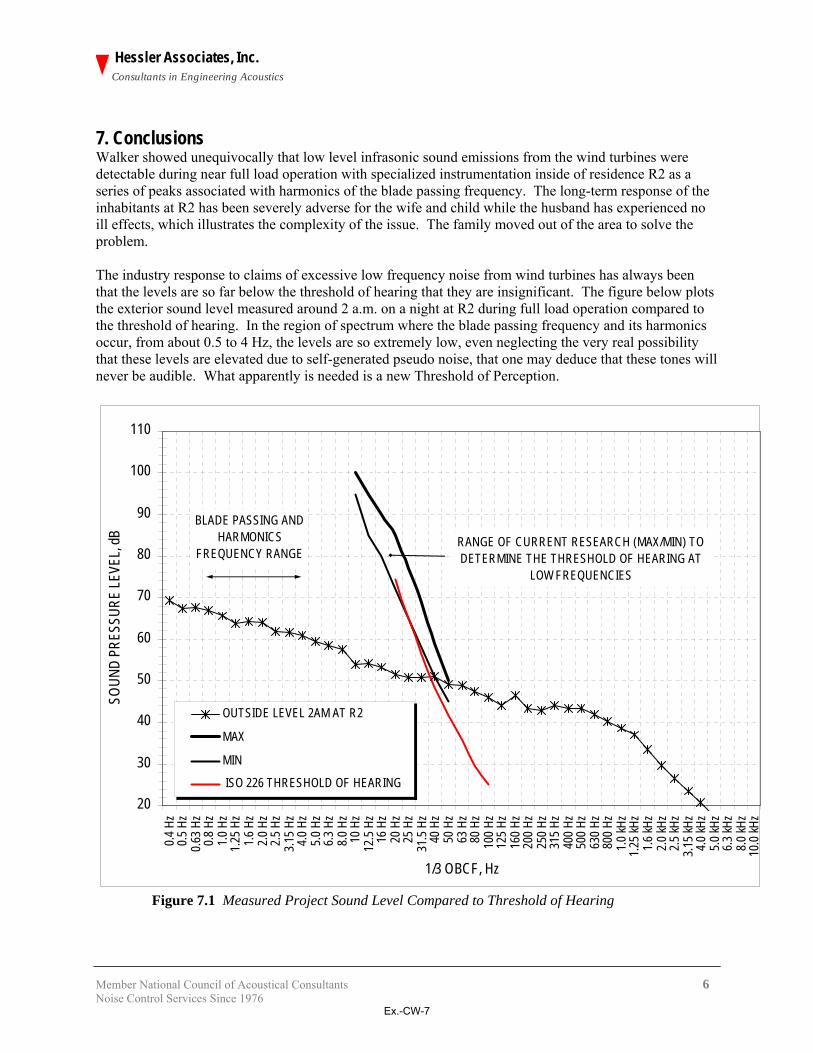
7. Conclusions Walker showed unequivocally that low level infrasonic sound emissions from the wind turbines were detectable during near full load operation with specialized instrumentation inside of residence R2 as a series of peaks associated with harmonics of the blade passing frequency. The long-term response of the inhabitants at R2 has been severely adverse for the wife and child while the husband has experienced no ill effects, which illustrates the complexity of the issue. The family moved out of the area to solve the problem. The industry response to claims of excessive low frequency noise from wind turbines has always been that the levels are so far below the threshold of hearing that they are insignificant. The figure below plots the exterior sound level measured around 2 a.m. on a night at R2 during full load operation compared to the threshold of hearing. In the region of spectrum where the blade passing frequency and its harmonics occur, from about 0.5 to 4 Hz, the levels are so extremely low, even neglecting the very real possibility that these levels are elevated due to self-generated pseudo noise, that one may deduce that these tones will never be audible. What apparently is needed is a new Threshold of Perception.
20
30
40
50
60
70
80
90
100
110
0.4 H
z0.5
Hz
0.63 H
z0.8
Hz
1.0 H
z1.2
5 Hz
1.6 H
z2.0
Hz
2.5 H
z3.1
5 Hz
4.0 H
z5.0
Hz
6.3 H
z8.0
Hz
10 H
z12
.5 Hz
16 H
z20
Hz
25 H
z31
.5 Hz
40 H
z50
Hz
63 H
z80
Hz
100 H
z12
5 Hz
160 H
z20
0 Hz
250 H
z31
5 Hz
400 H
z50
0 Hz
630 H
z80
0 Hz
1.0 kH
z1.2
5 kHz
1.6 kH
z2.0
kHz
2.5 kH
z3.1
5 kHz
4.0 kH
z5.0
kHz
6.3 kH
z8.0
kHz
10.0
kHz
1/3 OBCF, Hz
SOUN
D PR
ESSU
RE LE
VEL,
dB
OUTSIDE LEVEL 2AM AT R2
MAX
MIN
ISO 226 THRESHOLD OF HEARING
RANGE OF CURRENT RESEARCH (MAX/MIN) TO DETERMINE THE THRESHOLD OF HEARING AT
LOW FREQUENCIES
BLADE PASSING AND HARMONICS
FREQUENCY RANGE
Figure 7.1 Measured Project Sound Level Compared to Threshold of Hearing
Ex.-CW-7
Member National Council of Acoustical Consultants 7 Noise Control Services Since 1976
Hessler Associates, Inc.Consultants in Engineering Acoustics
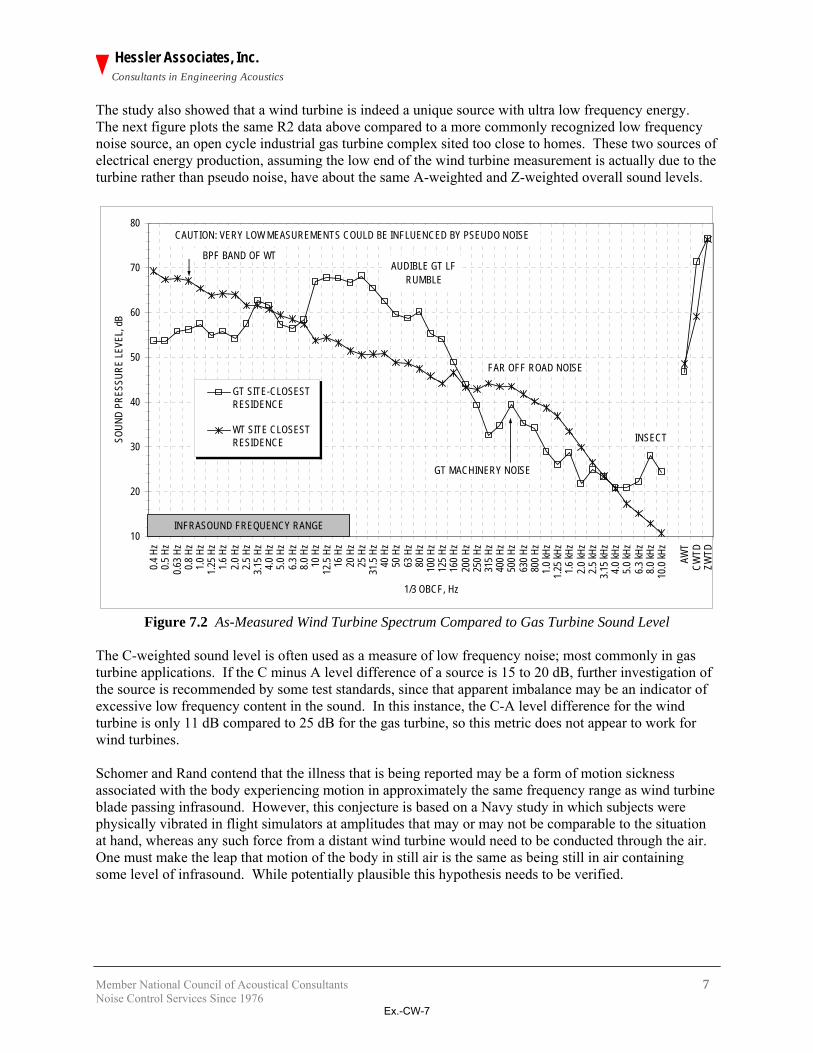
The study also showed that a wind turbine is indeed a unique source with ultra low frequency energy. The next figure plots the same R2 data above compared to a more commonly recognized low frequency noise source, an open cycle industrial gas turbine complex sited too close to homes. These two sources of electrical energy production, assuming the low end of the wind turbine measurement is actually due to the turbine rather than pseudo noise, have about the same A-weighted and Z-weighted overall sound levels.
10
20
30
40
50
60
70
80
0.4 H
z0.5
Hz
0.63 H
z0.8
Hz
1.0 H
z1.2
5 Hz
1.6 H
z2.0
Hz
2.5 H
z3.1
5 Hz
4.0 H
z5.0
Hz
6.3 H
z8.0
Hz
10 H
z12
.5 Hz
16 H
z20
Hz
25 H
z31
.5 Hz
40 H
z50
Hz
63 H
z80
Hz
100 H
z12
5 Hz
160 H
z20
0 Hz
250 H
z31
5 Hz
400 H
z50
0 Hz
630 H
z80
0 Hz
1.0 kH
z1.2
5 kHz
1.6 kH
z2.0
kHz
2.5 kH
z3.1
5 kHz
4.0 kH
z5.0
kHz
6.3 kH
z8.0
kHz
10.0
kHz
AWT
CWTD
ZWTD
1/3 OBCF, Hz
SOUN
D PR
ESSU
RE LE
VEL,
dB
GT SITE-CLOSESTRESIDENCE
WT SITE CLOSESTRESIDENCE
INFRASOUND FREQUENCY RANGE
CAUTION: VERY LOW MEASUREMENTS COULD BE INFLUENCED BY PSEUDO NOISE
BPF BAND OF WT
INSECT
FAR OFF ROAD NOISE
AUDIBLE GT LF RUMBLE
GT MACHINERY NOISE
Figure 7.2 As-Measured Wind Turbine Spectrum Compared to Gas Turbine Sound Level
The C-weighted sound level is often used as a measure of low frequency noise; most commonly in gas turbine applications. If the C minus A level difference of a source is 15 to 20 dB, further investigation of the source is recommended by some test standards, since that apparent imbalance may be an indicator of excessive low frequency content in the sound. In this instance, the C-A level difference for the wind turbine is only 11 dB compared to 25 dB for the gas turbine, so this metric does not appear to work for wind turbines. Schomer and Rand contend that the illness that is being reported may be a form of motion sickness associated with the body experiencing motion in approximately the same frequency range as wind turbine blade passing infrasound. However, this conjecture is based on a Navy study in which subjects were physically vibrated in flight simulators at amplitudes that may or may not be comparable to the situation at hand, whereas any such force from a distant wind turbine would need to be conducted through the air. One must make the leap that motion of the body in still air is the same as being still in air containing some level of infrasound. While potentially plausible this hypothesis needs to be verified.
Ex.-CW-7
Member National Council of Acoustical Consultants 8 Noise Control Services Since 1976
Hessler Associates, Inc.Consultants in Engineering Acoustics
Hessler and Walker have measured overall A-weighted sound levels and levels of infrasound at numerous wind farms that substantially exceed those measured here and to the best of their knowledge there are no reported adverse effects for noise or adverse health issues. It would be informative, in any further study, to survey the reactions of project participants and possibly other neighbors close to turbines, particularly with regard to health effects. In general, enough was learned by these investigators, all with quite different past experiences, that it can be mutually agreed that infrasound from wind turbines is an important issue that needs to be resolved in a more conclusive manner by appropriate study, as recommended in the cover report.
End of Text
Ex.-CW-7

Report Number 122412-1 Page 11 of 12
APPENDIX C by
RAND ACOUSTICS
Ex.-CW-7
Robert W. Rand, INCE
RAND ACOUSTICS 65 Mere Point Road
Brunswick, Maine 04011
TEL 207.632.1215
FAX 206.339.3441
December 21, 2012
Investigations of infrasonic and low-frequency noise
Shirley Wind Facility, Wisconsin, December 4-7, 2012
1.0 Introduction
This report presents information on an investigation of infrasonic and low frequency noise
performed at the Shirley Wind facility in Wisconsin December 4-7, 2012. The investigation
was conducted by acousticians Dr. Bruce Walker, George Hessler, Dr. Paul Schomer, and
Robert Rand under a Memorandum of Agreement developed for the investigation by Clean
Wisconsin and Forest Voice. Mr. Hessler was accompanied by his son David Hessler. During
the investigation, unexpectedly another consultant, Mr. Michael Hankard, visited the team and
entered the homes under investigation during testing.
The investigation was conducted using instrumentation provided and employed by the
acousticians. Three homes were investigated that had been abandoned by the owners due to
negative health effects experienced since the Shirley Wind facility had started up. The health
effects were reported to make life unbearable at the homes and had affected work and school
performance. It was understood that once relocated far away from the facility, the owners and
families recovered their health; yet revisiting the homes and roads near the facility provoked a
resurfacing of the adverse health effects. The owners had documented their experiences in
affidavits prior to the investigation.
This team functioned very well together with a common goal, and found collectively a new
understanding of significant very low frequency wind turbine acoustic components that
correlated with operating conditions associated with an intolerable condition for neighbors.
2.0 Methodology
It was generally understood that Dr. Walker would acquire simultaneous multi-channel, wide-
bandwidth, high-precision recordings for later analysis. If successful and clear of
contamination, those recordings would form the primary database for the investigation.
George Hessler would acquire precision sound level meter measurements to correlate with
wind turbine operations and for his project requirements. Paul Schomer and Rob Rand would
serve as observers and, would also analyze and acquire measurements according to their
investigative needs during the test. Measurements by acousticians would be catalogued and
made available for later research and analysis. These general understandings were not detailed
in the MOU due primarily to time constraints for the unusual, unprecedented collaboration
brought together for this investigation.
Having investigated other wind turbine facilities and directly experienced the negative health
Ex.-CW-7

Investigations of infrasonic and low-frequency noise Shirley Wind Facility, Wisconsin, December 4-7, 2012
2
effects reported by others living near wind turbines [1,2], Mr. Rand focused on acquiring
neighbor reports on health impacts during and prior to testing and correlated those to data
being acquired. The working assumption borne out by experience is that the human being is
the best reporting instrument.
Correlation: When investigating community noise complaints, value can be derived from
measurements and analysis primarily when they are highly correlated to neighbor reports. In
simple terms: if a recording or analysis is made when the turbines are turning, and the
neighbors are present and report feeling intolerable, tolerable, or not a problem, and report
such details as headache, nausea, vomiting, dizziness, vertigo, or cloudy thinking, or the
absence of health effects, the correlation to the neighbor reports provides very useful
information for assessing the utility of those data. Without the neighbor reports, it is difficult
to determine the significance of acoustic data. From details given in neighbor reports, the
investigators can look for unusual or distinctive acoustic characteristics or differences to
clarify what acoustical conditions correspond to the degree of health effects being reported.
Self-reports taken as valid: The team agreed prior to testing that neighbor reports would be
useful. They also agreed that neighbor reports are sincere and truthful, not "claims" as often
alleged by the wind industry. Neighbors considered and agreed to requests to be available
during testing. Mr. Rand also agreed to note his condition during the testing, since unlike the
other acousticians he is prone to seasickness and has also proved vulnerable to negative health
effects when near large wind turbines.
Due to schedule constraints, Mr. Rand was unable to attend a preliminary meeting with the
owners of the three homes during the midday on Tuesday, December 4. However he met with
the owners during the evening of December 4 shortly after arriving, and observed and
acquired owner health reports and noted his own health over the next three days.
2.1 Equipment
Equipment used by Mr. Rand included:
Gras 40AN microphone
Larson Davis Type 902 Preamplifier
Larson Davis Type 824 Sound Level Meter
M-Audio MicroTrackII 24-bit line-level audio recorder
Bruel & Kjaer Type 4230 Acoustic Calibrator
SoundDevices USBPre audio interface
Infiltec Model INFRA-20 seismometer (acoustic pressure, 0.1 to 20 Hz)
SpectraPlus 5.0 acoustic analysis software
Amaseis helicorder datalogger software
1 Robert W. Rand, Stephen E. Ambrose, Carmen M. E. Krogh, "Occupational Health and Industrial Wind
Turbines: A Case Study", Bulletin of Science Technology Society October 2011 vol. 31 no. 5 359-362.
2 Ambrose, S. E., Rand, R. W., Krogh, C. M., “Falmouth, Massachusetts wind turbine infrasound and low
frequency noise measurements”, Proceedings of Inter-Noise 2012, New York, NY, August 19-22.
Ex.-CW-7
Investigations of infrasonic and low-frequency noise Shirley Wind Facility, Wisconsin, December 4-7, 2012
3
2.2 Protocol
Measurements would be obtained during higher-wind conditions as possible to derive a
contrast from low- or no-wind conditions at the three homes under investigation. A "control"
home in a quiet location far away from the Shirley Wind facility would be measured to
provide background acoustic levels and signatures with no wind turbines nearby. Walker
measurements would be observed and discussed and independent analysis performed by the
observers as possible during the testing. The first primary goal was to obtain clean precision
audio recordings for later analysis. The second primary goal was to obtain neighbor reports
and discern acoustic contrast during the field investigations for immediate reporting of
significant noise components to concerned parties. Mr. Rand would remain attentive to and
report his health state during the testing.
At times during the testing Mr. Rand moved to other locations independently of the Walker
system because of easier instrumentation mobility and to reduce noise contamination from
activity by the other investigators.
3.0 Data collected
Mr. Rand took notes on health reports during the investigations, conveyed his state to the team
during the testing, and compiled notes for later analysis, provided in Table 1. Neighbors were
interviewed and they assembled reports for the team's use, listed in Table 2.
Mr. Rand referred primarily to Dr. Walker's acoustic recordings and analysis during testing
and analysis. He acquired recordings and infrasonic acoustic pressure data separately for
backup and reference.
Weather data were obtained from Wunderground as shown in Table 3.
Note: Although requested prior to the survey and again while at the site, Mr. Hessler made a
decision not to acquire acoustic data with the Walker system at a control home far away from
the Shirley Wind facility, citing "too many variables."
4.0 Analysis
Analysis focused on health state and, the levels and time-varying waveforms during higher-
wind conditions when neighbors reported conditions as intolerable or difficult, versus quieter
conditions which neighbors reported as tolerable.
5.0 Results
Results are preliminary. Nausea was experienced and nauseogenicity is indicated.
5.1 Neighbors report either tolerable or intolerable conditions, with little rating scale in
Ex.-CW-7
Investigations of infrasonic and low-frequency noise Shirley Wind Facility, Wisconsin, December 4-7, 2012
4
between. They said if the turbines are operating, it's intolerable. Mr. Rand observed neighbors
unable to stay at the homes at times even under moderate wind conditions during the testing.
5.2 Neighbors do not always hear the turbines. The neighbors indicated there is no real
difference in wind compass direction on the negative health effects. The house could be
upwind, downwind or crosswind to the turbine; no difference.
5.3 Neighbors retreated to the basement and gained partial relief from symptoms. Tested
sound levels are the same everywhere in the home except less in the basement. Lower sound
levels in the basement matches the neighbor reports to Mr. Rand to the effect that, when the
turbines are operating, it's about the same level of difficulty everywhere in the house, except
the basement, where they would retreat to gain partial relief, until they either left or
abandoned the home to get substantial relief. The neighbors reported that they felt a need to
get outside when conditions were intolerable. Their reports are supported by and correlate to
the ubiquitous presence of the acoustic energy inside in all locations, except in the basement
where it is slightly less. The neighbors take to the basement or if that is not sufficient to gain
relief, they leave the home.
5.5 Acoustic energy outside was strongly coupled into the home at infrasonic frequencies
when turbines operating in design range. Neighbors reported feeling worst when turbines are
turning compared to light-wind conditions with some or all turbines off when they report
using words such as "tolerable". Coherence between outdoor and indoors time-series was high
at infrasonic frequencies below 8 Hz when wind turbines operating compared to when wind
turbines off or turning slowly in light winds.
5.6 Neighbors reported being highly annoyed by the interior sound. Elevated acoustic
energy was observed inside all three homes in the range of 10 to 40 Hz. Room, house, wall
and floor acoustic modes (resonant frequencies) are found in the 10 to 40 Hz range. The
Nordex N100 has in-flow turbulence noise at a peak frequency of 9 to 14 Hz depending on
rotational speed, which might be involved in exciting resonant frequencies in walls and floors.
More analysis and/or survey work appears needed to determine the extent of the problem. Mr.
Rand was able to discern panel excitation in R3 where the owner reported feeling pressure on
his ears as he moved toward the southerly wall of the sitting area in the open-area. Two wind
turbines operating at a distance were faintly audible in R3 and detectable with ear to wall. Dr.
Walker and Mr. Rand discussed the sensation, examined the walls, and made measurements
of the home room dimensions for a future check of room modes against acoustic recordings.
5.7 Neighbors reported that at a distance of 3-1/2 miles, they could find relief when
turbines were operating. Outdoor average sound levels at the nearest home R2, a distance of
1100 feet, were measured at approximately 48 dBA. Assuming 6 dB per doubling of distance
for the A-weighted sound level, a probable A-weighted sound level at 3-1/2 miles is 48-
20log(1100/18480) or, 48-23 or, 25 dBA. Measured infrasonic unweighted average levels
outdoors were approximately 73 dB at 0.3 Hz at 1100 feet. Assuming 3 dB per doubling of
Ex.-CW-7
Investigations of infrasonic and low-frequency noise Shirley Wind Facility, Wisconsin, December 4-7, 2012
5
distance (cylindrical spreading) [2][3] for infrasonic propagation, a probable average
infrasonic level at 3-1/2 miles is 73-10log(1100/18480) or, 73-12 or, 61 dB. More work is
needed to establish what infrasonic levels are consistent with relief for the neighbors.
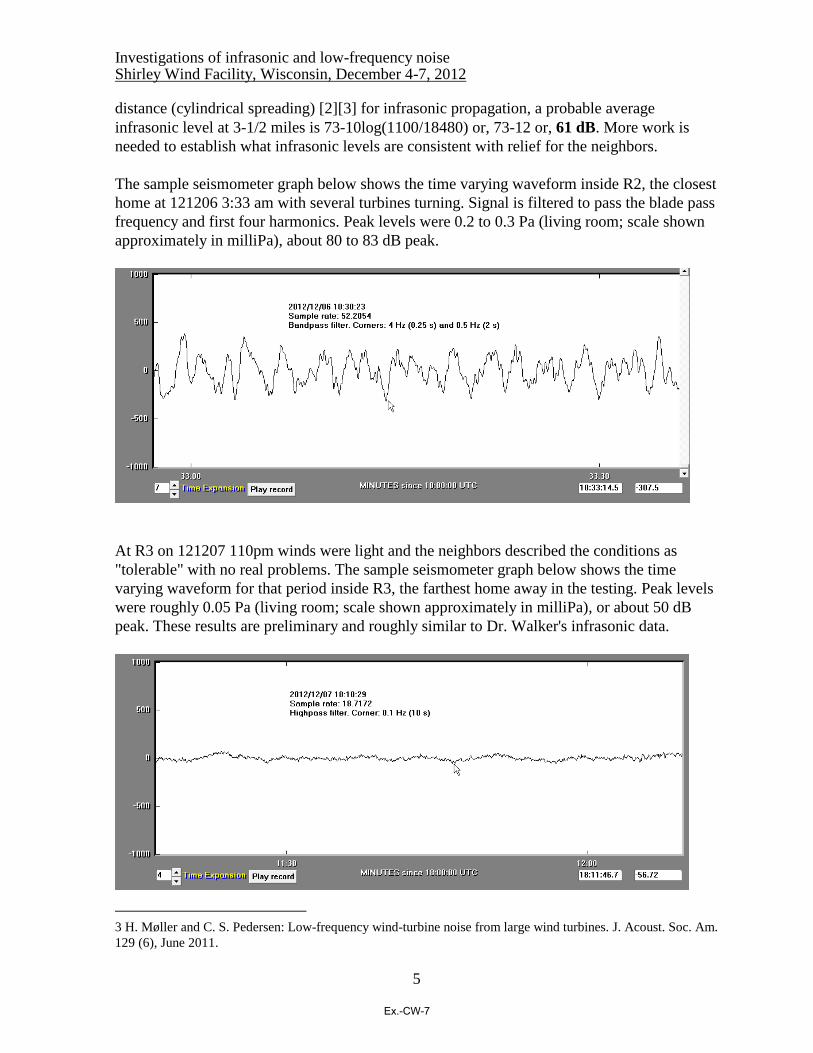
The sample seismometer graph below shows the time varying waveform inside R2, the closest
home at 121206 3:33 am with several turbines turning. Signal is filtered to pass the blade pass
frequency and first four harmonics. Peak levels were 0.2 to 0.3 Pa (living room; scale shown
approximately in milliPa), about 80 to 83 dB peak.
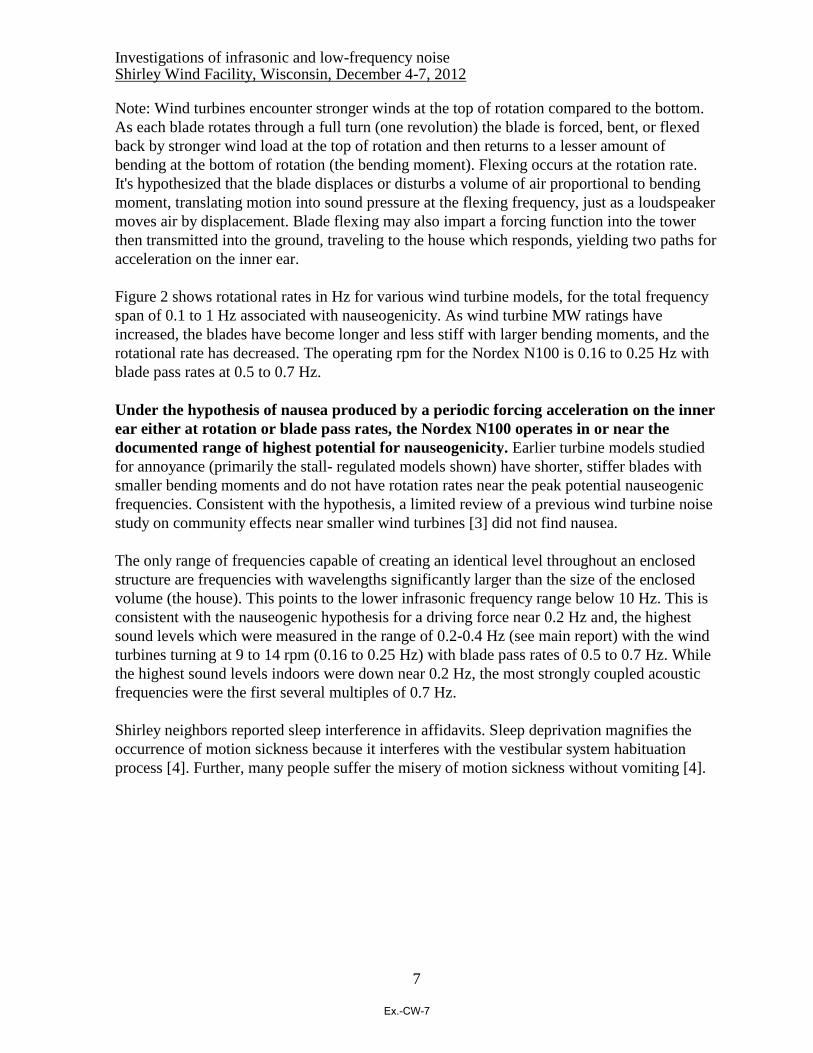
At R3 on 121207 110pm winds were light and the neighbors described the conditions as
"tolerable" with no real problems. The sample seismometer graph below shows the time
varying waveform for that period inside R3, the farthest home away in the testing. Peak levels
were roughly 0.05 Pa (living room; scale shown approximately in milliPa), or about 50 dB
peak. These results are preliminary and roughly similar to Dr. Walker's infrasonic data.
3 H. Møller and C. S. Pedersen: Low-frequency wind-turbine noise from large wind turbines. J. Acoust. Soc. Am.
129 (6), June 2011.
Ex.-CW-7

Investigations of infrasonic and low-frequency noise Shirley Wind Facility, Wisconsin, December 4-7, 2012
6
5.7 Negative health effects were experienced. During testing Mr. Rand experienced again [4]
some of the adverse health effects reported by the neighbors. In effect, Mr. Rand "peer-
reviewed" the neighbors by staying in two of the homes for extended periods of time
overnight to experience what they are reporting. Mr. Rand slept in R1 the night of December
4th to assess the effects on sleep, and worked at R2 much of the second night (to 5:30 am) to
assess audibility and effects while awake. Wind turbine sound levels were faintly detectable
with interior sound levels in the range of 18-20 dBA. Note: Although he had arrived the
previous night feeling good, on awakening on December 5 Mr. Rand felt nauseous (very
unusual). To summarize, Mr. Rand encountered unusual negative health effects during the
testing period when near the operating wind turbines, including, at various times:
- Nausea
- Headache
- Dizziness
Symptoms persisted after the testing for about a week, relieved by rest away from the site. The
other investigators do not get seasick and did not report the same negative health effects.
Implications
A nauseogenic factor is present. Naval, aviation and other research has established human
sensitivity to motion producing nausea. While mechanism for motion sickness is not well
understood, "theories all describe the cause of motion sickness via the same proposition: that
the vestibular apparatus within the inner ear provides the brain with information about self
motion that does not match the sensations of motion generated by visual or kinesthetic
(proprioceptive) systems, or what is expected from previous experience". The range of motion
nauseogenicity has been measured at 0.1 to 0.7 Hz and with a maximum nauseogenic potential
at 0.2 Hz [5][6] (see Figure 1). The Nordex N100 has a rotational rate of 0.16 to 0.25 Hz and a
nominal blade passage rate of 0.5 to 0.7 Hz (three times the rotational rate). A hypothesis is
suggested based on the limited, preliminary research correlating acceleration and
nauseogenicity: Nauseogenicity is present at Shirley due to acceleration on inner ear from
modulated, impulsive acoustic pressure at rotation and/or blade passage rates.
Note: Wind turbines produce periodic acoustic pressure modulations at the rotation rate (per
blade) and blade passage rate (per turbine), due to changes in wind speed and turbulence as
blades are rotated top to bottom, and as they pass the tower where a pressure blow zone
changes local wind speed. Pressure modulations at BPF with strong rates of change were
documented by Dr. Walker (see Dr. Walkers report and the main report, conclusions).
4 Nausea/dizziness/headache (very unusual) experienced at three other wind turbine sites including Falmouth,
MA, April 2011 (Vestas V82); Hardscrabble, NY, August, 2012 (Gamesa G90-2MW); Vader Piet, Aruba,
October, 2012 (Vestas V90-3MW).
5 Samson C. Stevens and Michael G. Parsons, Effects of Motion at Sea on Crew Performance: A Survey. Marine
Technology, Vol. 39, No. 1, January 2002, pp. 29–47.
6 Golding JF, Mueller AG, Gresty MA., A motion sickness maximum around the 0.2 Hz frequency range of
horizontal translational oscillation. Aviat Space Environ Med. 2001 Mar;72(3):188-92.
Ex.-CW-7
Investigations of infrasonic and low-frequency noise Shirley Wind Facility, Wisconsin, December 4-7, 2012
7
Note: Wind turbines encounter stronger winds at the top of rotation compared to the bottom.
As each blade rotates through a full turn (one revolution) the blade is forced, bent, or flexed
back by stronger wind load at the top of rotation and then returns to a lesser amount of
bending at the bottom of rotation (the bending moment). Flexing occurs at the rotation rate.
It's hypothesized that the blade displaces or disturbs a volume of air proportional to bending
moment, translating motion into sound pressure at the flexing frequency, just as a loudspeaker
moves air by displacement. Blade flexing may also impart a forcing function into the tower
then transmitted into the ground, traveling to the house which responds, yielding two paths for
acceleration on the inner ear.
Figure 2 shows rotational rates in Hz for various wind turbine models, for the total frequency
span of 0.1 to 1 Hz associated with nauseogenicity. As wind turbine MW ratings have
increased, the blades have become longer and less stiff with larger bending moments, and the
rotational rate has decreased. The operating rpm for the Nordex N100 is 0.16 to 0.25 Hz with
blade pass rates at 0.5 to 0.7 Hz.
Under the hypothesis of nausea produced by a periodic forcing acceleration on the inner
ear either at rotation or blade pass rates, the Nordex N100 operates in or near the
documented range of highest potential for nauseogenicity. Earlier turbine models studied
for annoyance (primarily the stall- regulated models shown) have shorter, stiffer blades with
smaller bending moments and do not have rotation rates near the peak potential nauseogenic
frequencies. Consistent with the hypothesis, a limited review of a previous wind turbine noise
study on community effects near smaller wind turbines [3] did not find nausea.
The only range of frequencies capable of creating an identical level throughout an enclosed
structure are frequencies with wavelengths significantly larger than the size of the enclosed
volume (the house). This points to the lower infrasonic frequency range below 10 Hz. This is
consistent with the nauseogenic hypothesis for a driving force near 0.2 Hz and, the highest
sound levels which were measured in the range of 0.2-0.4 Hz (see main report) with the wind
turbines turning at 9 to 14 rpm (0.16 to 0.25 Hz) with blade pass rates of 0.5 to 0.7 Hz. While
the highest sound levels indoors were down near 0.2 Hz, the most strongly coupled acoustic
frequencies were the first several multiples of 0.7 Hz.
Shirley neighbors reported sleep interference in affidavits. Sleep deprivation magnifies the
occurrence of motion sickness because it interferes with the vestibular system habituation
process [4]. Further, many people suffer the misery of motion sickness without vomiting [4].
Ex.-CW-7

Investigations of infrasonic and low-frequency noise Shirley Wind Facility, Wisconsin, December 4-7, 2012
8
Conclusions
Nauseogenicity is a factor at Shirley. Acceleration of the inner ear is suggested due to
extremely low-frequency pulsations at the rotation and blade pass rates that occur in or near
the frequencies of highest potential for nauseogenicity and, are coupled strongly into the
homes now abandoned. More research at Shirley is recommended to understand
nauseogenicity from wind turbine operations, to properly design and site large industrial wind
turbines (over 1 MW) near residential areas to prevent the severe health effects. More work is
needed to establish what infrasonic levels are consistent with relief for the neighbors.
Medical research and measurement is urgently needed to be field coordinated along with
infrasonic acoustic and vibration testing. The correlations to nauseogenicity at the 2.5MW
power rating and size suggest worsening effects as larger, slower-rotating wind turbines are
sited near people.
Ex.-CW-7

Investigations of infrasonic and low-frequency noise Shirley Wind Facility, Wisconsin, December 4-7, 2012
9
Figure 1. From Stevens et al (2002) Figure 5 showing incidence of vomiting associated with
vertical oscillation according to McCauley et al (1976) and modeled. Colored patches
postulate association between rotational rate (solid), BPF(striped) and response at Shirley
(nausea, did not vomit); acceleration level was not measured.
Figure 2. Chart of wind turbine rotation rates (Hz) for various wind turbine models including
the Nordex N100. Note nauseogenicity range is 0.1 to 1 Hz with peak potential noted at 0.2
Hz. Note bars on GE 1.5 and Vestas V90 models indicate nominal rotation rate.
Ex.-CW-7

Investigations of infrasonic and low-frequency noise Shirley Wind Facility, Wisconsin, December 4-7, 2012
10
Figure 3. Weather conditions during investigations, December 4-7, 2012.
Weather source: KGRB Green Bay, WI. December 4-7, 2012
http://www.wunderground.com/history/airport/KGRB/2012/12/4/CustomHistory.html?dayend=7&mont
hend=12&yearend=2012&req_city=NA&req_state=NA&req_statename=NA&MR=1
Ex.-CW-7
Investigations of infrasonic and low-frequency noise Shirley Wind Facility, Wisconsin, December 4-7, 2012
11
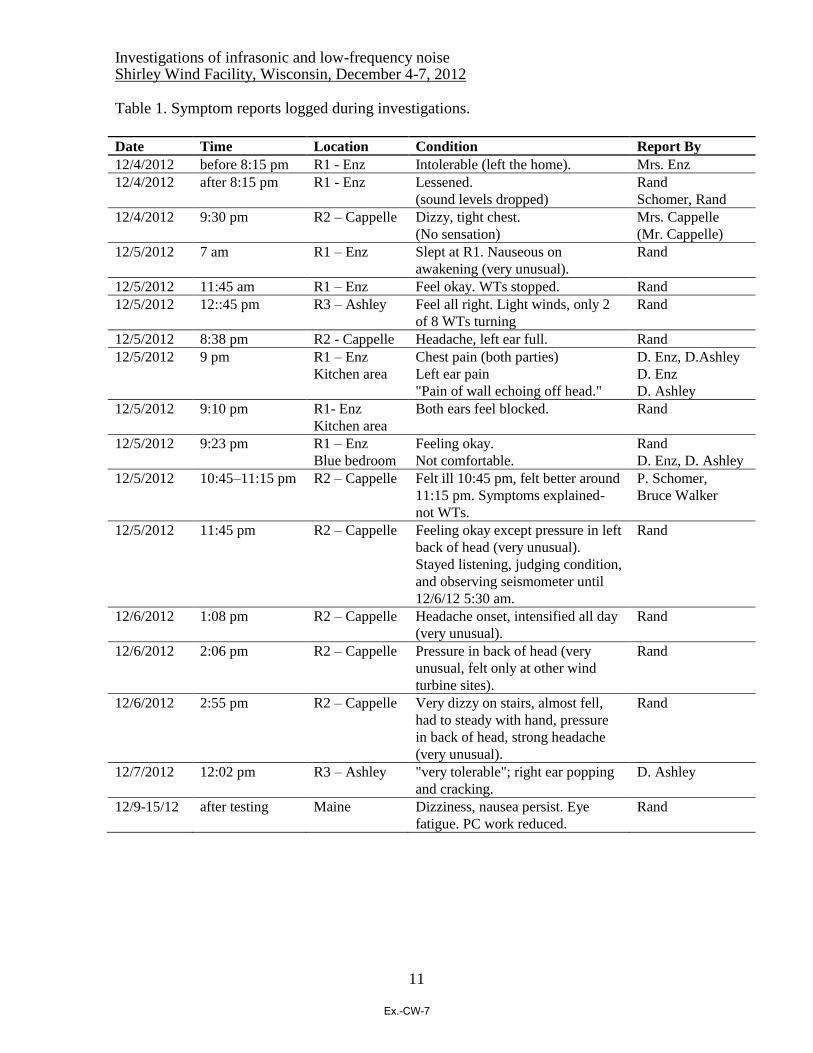
Table 1. Symptom reports logged during investigations.
Date Time Location Condition Report By
12/4/2012 before 8:15 pm R1 - Enz Intolerable (left the home). Mrs. Enz
12/4/2012 after 8:15 pm R1 - Enz Lessened.
(sound levels dropped)
Rand
Schomer, Rand
12/4/2012 9:30 pm R2 – Cappelle Dizzy, tight chest.
(No sensation)
Mrs. Cappelle
(Mr. Cappelle)
12/5/2012 7 am R1 – Enz Slept at R1. Nauseous on
awakening (very unusual).
Rand
12/5/2012 11:45 am R1 – Enz Feel okay. WTs stopped. Rand
12/5/2012 12::45 pm R3 – Ashley Feel all right. Light winds, only 2
of 8 WTs turning
Rand
12/5/2012 8:38 pm R2 - Cappelle Headache, left ear full. Rand
12/5/2012 9 pm R1 – Enz
Kitchen area
Chest pain (both parties)
Left ear pain
"Pain of wall echoing off head."
D. Enz, D.Ashley
D. Enz
D. Ashley
12/5/2012 9:10 pm R1- Enz
Kitchen area
Both ears feel blocked. Rand
12/5/2012 9:23 pm R1 – Enz
Blue bedroom
Feeling okay.
Not comfortable.
Rand
D. Enz, D. Ashley
12/5/2012 10:45–11:15 pm R2 – Cappelle Felt ill 10:45 pm, felt better around
11:15 pm. Symptoms explained-
not WTs.
P. Schomer,
Bruce Walker
12/5/2012 11:45 pm R2 – Cappelle Feeling okay except pressure in left
back of head (very unusual).
Stayed listening, judging condition,
and observing seismometer until
12/6/12 5:30 am.
Rand
12/6/2012 1:08 pm R2 – Cappelle Headache onset, intensified all day
(very unusual).
Rand
12/6/2012 2:06 pm R2 – Cappelle Pressure in back of head (very
unusual, felt only at other wind
turbine sites).
Rand
12/6/2012 2:55 pm R2 – Cappelle Very dizzy on stairs, almost fell,
had to steady with hand, pressure
in back of head, strong headache
(very unusual).
Rand
12/7/2012 12:02 pm R3 – Ashley "very tolerable"; right ear popping
and cracking.
D. Ashley
12/9-15/12 after testing Maine Dizziness, nausea persist. Eye
fatigue. PC work reduced.
Rand
Ex.-CW-7
Investigations of infrasonic and low-frequency noise Shirley Wind Facility, Wisconsin, December 4-7, 2012
12
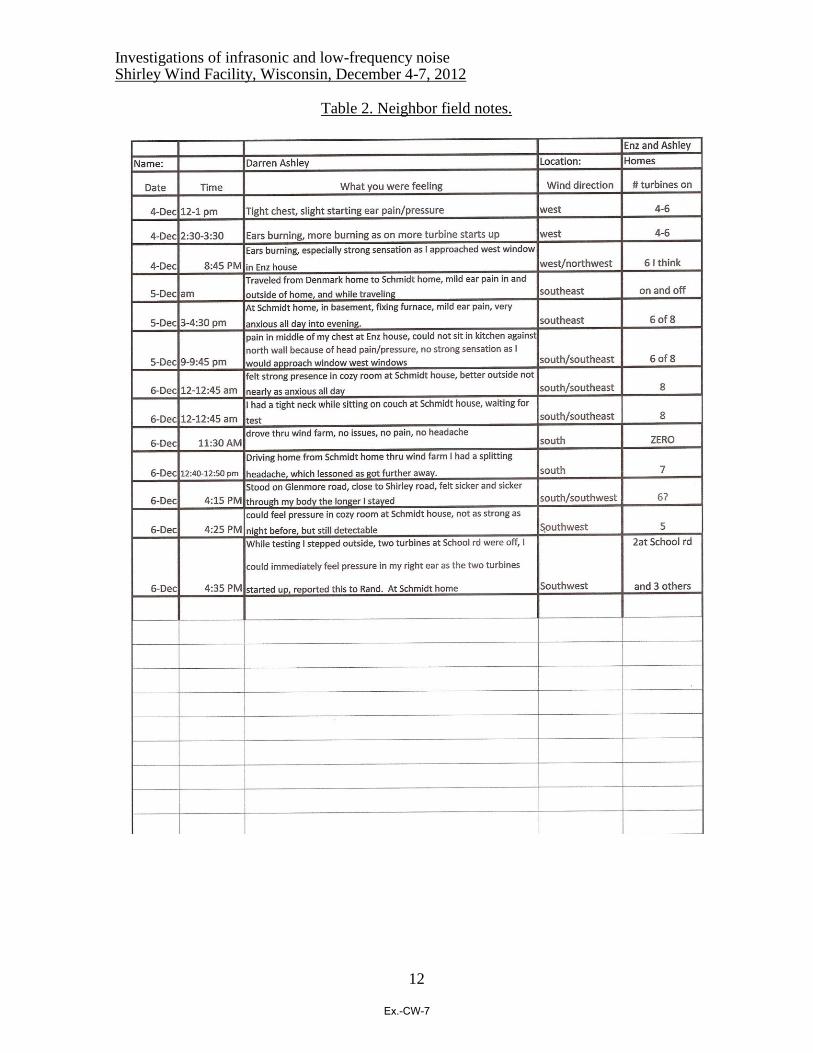
Table 2. Neighbor field notes.
Ex.-CW-7

Investigations of infrasonic and low-frequency noise Shirley Wind Facility, Wisconsin, December 4-7, 2012
13
Table 2 (continued). Neighbor field notes.
Ex.-CW-7

Report Number 122412-1 Page 12 of 12
APPENDIX D by
SCHOMER AND ASSOCIATES, INC.
Ex.-CW-7
1
Paul Schomer
December 21, 2012
I) Observations from discussions with residents: Four of the five researchers; George Hessler, David Hessler, Bruce Walker, and Paul Schomer met with affected residents of Shirley and discussed the problems they had that were precipitated by the wind turbines. This discussion produced several notable points not previously known by this researcher. 1. At most locations where these health problems occurred, the wind turbines were generally not audible. That is, these health problems are devoid of noise problems and concomitant noise annoyance issues. The wind turbines could only be heard distinctly a one of the 3 residences examined, and they could not even be heard indoors at this one residence during high wind conditions. 2. The residents could sense when the turbines turned on and off; this was independent of hearing the turbines. 3. The residents reported "bad spots" in their homes but pointed out that these locations were as likely to be "bad" because of the time they spent at those locations, as because of the "acoustic" (inaudible) environment. The residents certainly did not report large changes from one part of their residences to another. 4. The residents reported little or no change to the effects based on any directional factors. Effects were unchanged by the orientation of the rotor with respect to the house; the house could be upwind, downwind, or crosswind of the source. 5. Residents of the nearest house reported that their baby son, now 2 years old, would wake up 4 times a night screaming. This totally stopped upon their leaving the vicinity of the wind turbines, and he now sleeps 8 hours and awakens happy.
I) Implications of these observations: 1. The fact that these residents largely report wind turbines as inaudible, and the reported effects on a baby seem to rule out the illness being caused by extreme annoyance as some have suggested. 2. The lack of change with orientation of the turbine with respect to the house and the lack of change with position in the house suggest that we are dealing with very low frequencies; frequencies where the wind turbine size is a fraction of the wavelength‐‐about 3 Hz or lower.
II) Observations from results of measurements: 1. These observations are based upon the coherence plots and coherence graphs produced by Bruce Walker. He produced both amplitude, frequency and coherence plots and 10 minute coherence charts showing only amplitude and frequency. While both show the same thing, this analysis concentrates on the latter because the former have only a 30 dB dynamic range. Figures 1 and 2 show the coherence between the outdoor ground plane microphone and 4 indoor spaces at Residence 2: the living room, the master bedroom, behind the kitchen, and in the basement. Figure 3 shows the single valid example of basement measurements at Residence 3. The data from Residence 2 are for optimum wind conditions in terms of the turbine operation. Whereas the data at Residence 3 are for low wind conditions and not necessarily indicative of what would be found were the wind turbines operating at normal power. 2. In Implications (I), it is inferred from the resident observations that the important effects result from very low frequency infrasound, about 3 Hz or lower. We can test the assertion with the data collected at the three residences at Shirley. Only Residence 2 was tested during optimum wind conditions, so that is the primary source of data used herein. Figures 1 and 2 show the coherence
Ex.-CW-7

2
between the outdoor ground plane microphone and the four indoor spaces listed above. First, we examine Figure 1. All of the four spaces exhibit coherence at 0.7 Hz, 1.4 Hz, 2.1 Hz, 2.8 Hz and 3.5 Hz, and in this range there is no coherence indicated except for these five frequencies. The basement continues, with coherence exhibited at 4.2 Hz, 4.9 Hz. 5.6 Hz, 6.3 Hz and 7 Hz. The coherence in the basement drops low from 10‐18 Hz and is more or less random and low after 18 Hz. Figure 1b shows the coherence just for the frequency range from 10 Hz to 35 Hz, and essentially this figure exhibits random patterns with no correlation from one room to the next. For example, coherence with the microphone behind the kitchen is high from 10‐14 Hz and the master bedroom is high from 12‐14 Hz while the other two spaces exhibit low coherence, and again the master bedroom is high 28‐35 Hz with the others being low, and the living room is high from 50‐58 Hz with the other spaces low; no pattern. In contrast all four spaces are lock step together in their coherence with the outdoor microphone below about 4 Hz. Figure 2, another sample from Residence 2 shows much the same pattern. In this case, 0 .7 Hz, 1.4 Hz, 2.1 Hz clearly are evident for all four spaces. For some reason 2.8 Hz is much reduced for the living room but 3.5 Hz is evident for all four spaces. In terms of the basement a number of other peaks are evident up to about 8 Hz where the basement then falls low until about 18 Hz and is random thereafter. As with Figure 1, there is no pattern to the coherence function above about 8 Hz. 3. Residence 2, and indeed all three residences, exhibit classic wall resonances in about the 10‐35 Hz range which are different for each room and exposure, so it is reasonable to suppose that the randomness in the 10‐35 Hz region in the above ground rooms is the result of wall resonances. The basement, which has no common wall with the outside, exhibits generally the lowest coherence in the 10‐35Hz region. Thus, I conclude that the only wind turbine related data evident in the measurements at Residence 2 are the very low frequencies ranging from the blade passage frequency of 0.7 Hz to up to about 7 Hz. This conclusion is consonant with the residents' reports that the effects were similar from one space to another but a little to somewhat improved in the basement, the effects were independent of the direction of the rotor and generally not related to audible sound. 4. Figure 4 shows the coherence as functions of both time and frequency, and it is clear that the basement shows the greatest coherence below 8Hz of the four spaces and the least coherence above 8Hz. This result further supports the conclusion that it is the very low frequencies that are important. 5. Figure 3 is for Residence 3 which was 7000 feet from the nearest turbine, in contrast to Residence 2 which was only 1100 feet from the nearest turbine. Even here with much reduced amplitude there seems to be several frequencies where the four spaces have peaks together beginning at 0.8 Hz. However, unlike Residence 2, the coherence functions for all four of the space move together from about 15 Hz to 70 Hz. The sound pressure level at the outdoor microphone and at each of the four indoor spaces shows every harmonic from what appears to be the first harmonic at 20 Hz through 200 Hz. To my thinking this was clearly a loud outdoor source with a fundamental frequency of just under 20 Hz. And indeed it was. I called Bruce and he told me it was a helicopter. (I was not present the last day) 6. Figure 5 shows the sound pressure level for first minute of the 10 minutes represented by Figure 1, above. This figure, which is sensitive to the lowest frequencies shows that at these very low frequencies the sound pressure level in all four spaces is quite similar. The small changes from different positions in the house also suggests that the house is small compared to the wavelength so that the insides of the house are acting like a closed cavity with uniform pressure throughout being driven by very low‐frequency infrasound.
II) Implications of the measurements: 1. The measurements support the hypothesis developed in (I )that the primary frequencies are very low, in the range of several tenths of a Hertz up to several Hertz. The coherence analysis shows that only the very low frequencies appear throughout the house and are clearly related to the blade
Ex.-CW-7
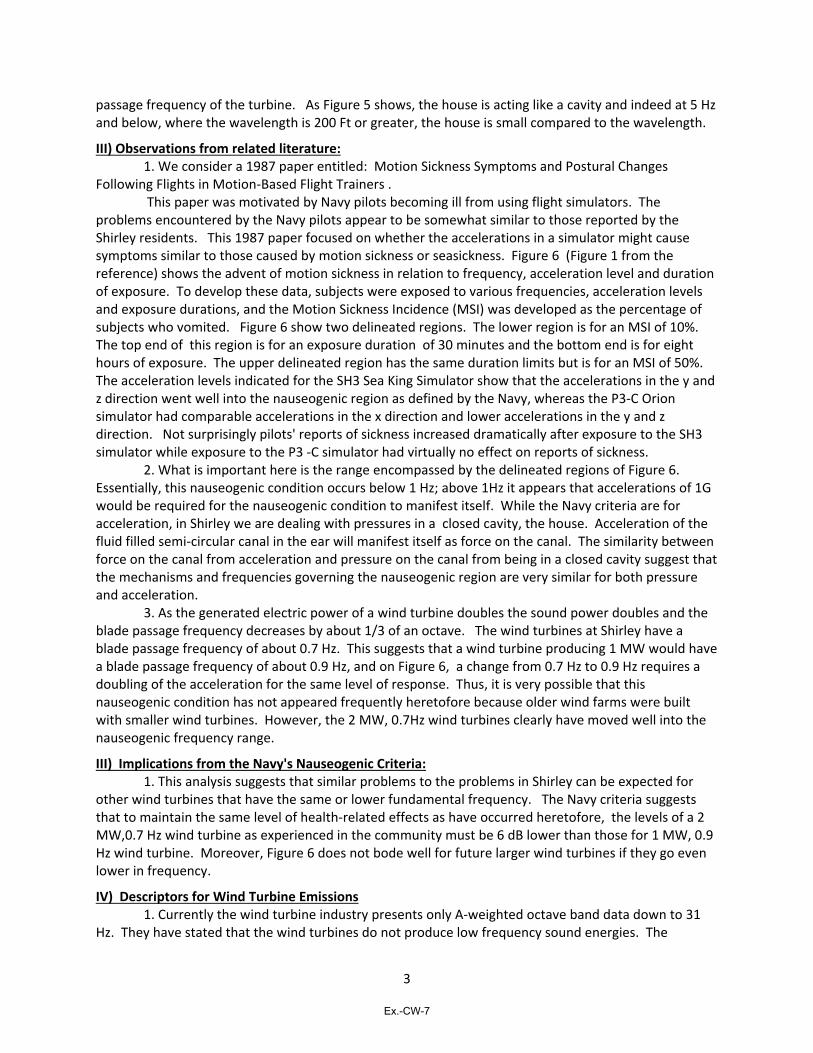
3
passage frequency of the turbine. As Figure 5 shows, the house is acting like a cavity and indeed at 5 Hz and below, where the wavelength is 200 Ft or greater, the house is small compared to the wavelength.
III) Observations from related literature: 1. We consider a 1987 paper entitled: Motion Sickness Symptoms and Postural Changes Following Flights in Motion‐Based Flight Trainers . This paper was motivated by Navy pilots becoming ill from using flight simulators. The problems encountered by the Navy pilots appear to be somewhat similar to those reported by the Shirley residents. This 1987 paper focused on whether the accelerations in a simulator might cause symptoms similar to those caused by motion sickness or seasickness. Figure 6 (Figure 1 from the reference) shows the advent of motion sickness in relation to frequency, acceleration level and duration of exposure. To develop these data, subjects were exposed to various frequencies, acceleration levels and exposure durations, and the Motion Sickness Incidence (MSI) was developed as the percentage of subjects who vomited. Figure 6 show two delineated regions. The lower region is for an MSI of 10%. The top end of this region is for an exposure duration of 30 minutes and the bottom end is for eight hours of exposure. The upper delineated region has the same duration limits but is for an MSI of 50%. The acceleration levels indicated for the SH3 Sea King Simulator show that the accelerations in the y and z direction went well into the nauseogenic region as defined by the Navy, whereas the P3‐C Orion simulator had comparable accelerations in the x direction and lower accelerations in the y and z direction. Not surprisingly pilots' reports of sickness increased dramatically after exposure to the SH3 simulator while exposure to the P3 ‐C simulator had virtually no effect on reports of sickness. 2. What is important here is the range encompassed by the delineated regions of Figure 6. Essentially, this nauseogenic condition occurs below 1 Hz; above 1Hz it appears that accelerations of 1G would be required for the nauseogenic condition to manifest itself. While the Navy criteria are for acceleration, in Shirley we are dealing with pressures in a closed cavity, the house. Acceleration of the fluid filled semi‐circular canal in the ear will manifest itself as force on the canal. The similarity between force on the canal from acceleration and pressure on the canal from being in a closed cavity suggest that the mechanisms and frequencies governing the nauseogenic region are very similar for both pressure and acceleration. 3. As the generated electric power of a wind turbine doubles the sound power doubles and the blade passage frequency decreases by about 1/3 of an octave. The wind turbines at Shirley have a blade passage frequency of about 0.7 Hz. This suggests that a wind turbine producing 1 MW would have a blade passage frequency of about 0.9 Hz, and on Figure 6, a change from 0.7 Hz to 0.9 Hz requires a doubling of the acceleration for the same level of response. Thus, it is very possible that this nauseogenic condition has not appeared frequently heretofore because older wind farms were built with smaller wind turbines. However, the 2 MW, 0.7Hz wind turbines clearly have moved well into the nauseogenic frequency range.
III) Implications from the Navy's Nauseogenic Criteria: 1. This analysis suggests that similar problems to the problems in Shirley can be expected for other wind turbines that have the same or lower fundamental frequency. The Navy criteria suggests that to maintain the same level of health‐related effects as have occurred heretofore, the levels of a 2 MW,0.7 Hz wind turbine as experienced in the community must be 6 dB lower than those for 1 MW, 0.9 Hz wind turbine. Moreover, Figure 6 does not bode well for future larger wind turbines if they go even lower in frequency.
IV) Descriptors for Wind Turbine Emissions 1. Currently the wind turbine industry presents only A‐weighted octave band data down to 31 Hz. They have stated that the wind turbines do not produce low frequency sound energies. The
Ex.-CW-7
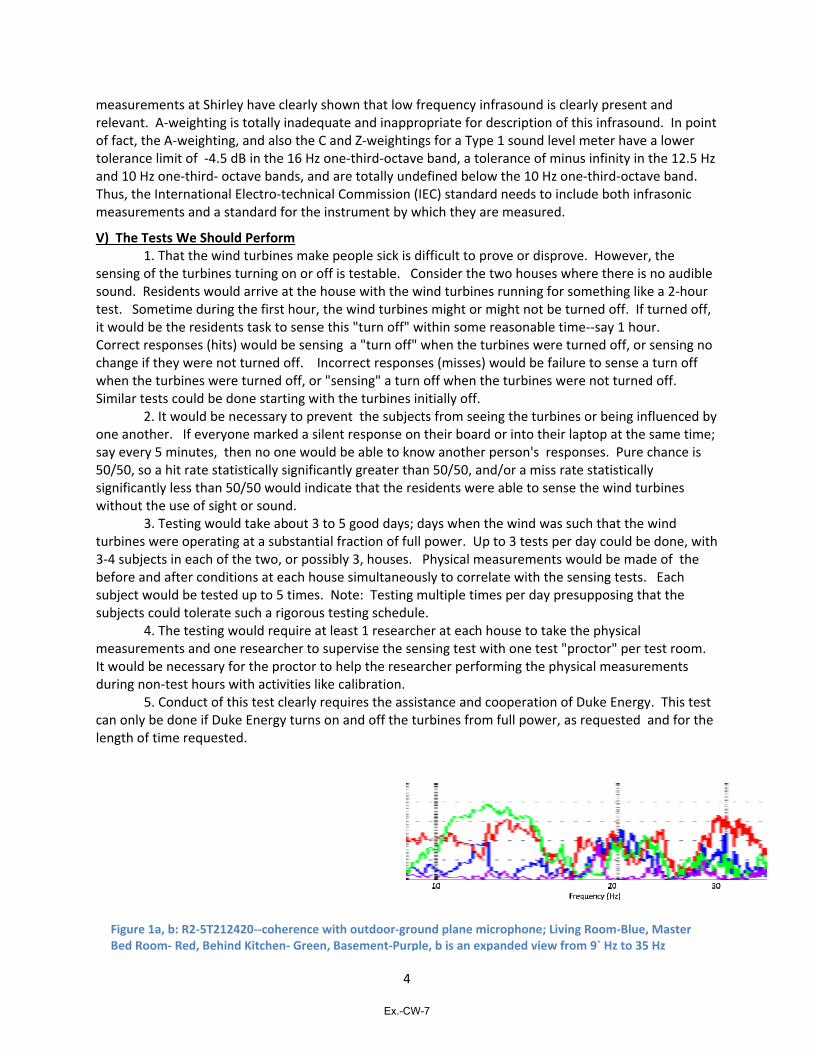
4
measurements at Shirley have clearly shown that low frequency infrasound is clearly present and relevant. A‐weighting is totally inadequate and inappropriate for description of this infrasound. In point of fact, the A‐weighting, and also the C and Z‐weightings for a Type 1 sound level meter have a lower tolerance limit of ‐4.5 dB in the 16 Hz one‐third‐octave band, a tolerance of minus infinity in the 12.5 Hz and 10 Hz one‐third‐ octave bands, and are totally undefined below the 10 Hz one‐third‐octave band. Thus, the International Electro‐technical Commission (IEC) standard needs to include both infrasonic measurements and a standard for the instrument by which they are measured.
V) The Tests We Should Perform 1. That the wind turbines make people sick is difficult to prove or disprove. However, the sensing of the turbines turning on or off is testable. Consider the two houses where there is no audible sound. Residents would arrive at the house with the wind turbines running for something like a 2‐hour test. Sometime during the first hour, the wind turbines might or might not be turned off. If turned off, it would be the residents task to sense this "turn off" within some reasonable time‐‐say 1 hour. Correct responses (hits) would be sensing a "turn off" when the turbines were turned off, or sensing no change if they were not turned off. Incorrect responses (misses) would be failure to sense a turn off when the turbines were turned off, or "sensing" a turn off when the turbines were not turned off. Similar tests could be done starting with the turbines initially off. 2. It would be necessary to prevent the subjects from seeing the turbines or being influenced by one another. If everyone marked a silent response on their board or into their laptop at the same time; say every 5 minutes, then no one would be able to know another person's responses. Pure chance is 50/50, so a hit rate statistically significantly greater than 50/50, and/or a miss rate statistically significantly less than 50/50 would indicate that the residents were able to sense the wind turbines without the use of sight or sound. 3. Testing would take about 3 to 5 good days; days when the wind was such that the wind turbines were operating at a substantial fraction of full power. Up to 3 tests per day could be done, with 3‐4 subjects in each of the two, or possibly 3, houses. Physical measurements would be made of the before and after conditions at each house simultaneously to correlate with the sensing tests. Each subject would be tested up to 5 times. Note: Testing multiple times per day presupposing that the subjects could tolerate such a rigorous testing schedule. 4. The testing would require at least 1 researcher at each house to take the physical measurements and one researcher to supervise the sensing test with one test "proctor" per test room. It would be necessary for the proctor to help the researcher performing the physical measurements during non‐test hours with activities like calibration. 5. Conduct of this test clearly requires the assistance and cooperation of Duke Energy. This test can only be done if Duke Energy turns on and off the turbines from full power, as requested and for the length of time requested.
Figure 1a, b: R2‐5T212420‐‐coherence with outdoor‐ground plane microphone; Living Room‐Blue, Master Bed Room‐ Red, Behind Kitchen‐ Green, Basement‐Purple, b is an expanded view from 9` Hz to 35 Hz
Ex.-CW-7

5
vvv
0
Figure 2a, b: R2‐5T204657‐‐coherence with outdoor, ground‐plane microphone; Living Room‐Blue, Master Bed Room‐Red, Behind Kitchen‐ Green, Basement‐Purple, b is an expanded view from 9 Hz to 35 Hz
4a‐ Living Room 4b‐ Master Bed Room 4c‐ Behind Kitchen 4d‐ Basement
Figure 4a,b,c,d‐ Coherence with the outside ground microphone and the four inside microphones in the locations
indicated. Note the Basement (4d) which does not have walls coincident with outside shows high coherence at the
wind turbine blade passage frequency for several harmonics and almost no coherence above about 8 Hz where the
at or above ground walls are resonant.
aFigure 3a, b: R2‐5T204657; Living Room‐Blue, Upstairs Bed Room‐ Orange, Family Room‐ Turquoise, Basement‐Purple, b is an expanded view from 10 Hz to 100 Hz. Note the strong coherence from 20 through at least 80 Hz that resulted from a nearby Helicopter.
Ex.-CW-7
6
5
R.S. Kennedy, G.O. Allgood, B.W. Van Hoy, M.G. Lilienthal, (1987). " Motion Sickness Symptoms and
Postural Changes Following Flights in Motion‐Based Flight Trainers," Journal of Low Frequency Noise and
Vibration, 6 (4), 147‐154.
Figure 5‐ First of the ten minute period of 5T212420. Note that the SPL is very similar for all indoor locations.
Figure 1 from "Motion Sickness Symptoms and Postural Changes Following Flights in
Motion‐Based Flight Trainers"
6.
Ex.-CW-7