report no xxxx – the gambia - world...
TRANSCRIPT

Report No – The Gambia
THE GAMBIA: An Assessment of the Investment Climate
June 2009
Africa RegionPrivate Sector and Finance UnitRegional program on Enterprise Development
Document of the World Bank_____________________________
69479

THE GAMBIA – FISCAL YEARJanuary 1st – December 31st
CURRENCY (Nominal Exchange Rate as of June 22, 2009)
Currency Unit: Gambian Dalasi1,00 US$ = 26.8397 GMD
ABBREVIATIONS AND ACRONYMS
C. PCT COLUMN PERCENTAGECET COMMON EXTERNAL TARIFF DB 2009 DOING BUSINESS 2009 REPORTEPZ EXPORT PROCESSING ZONEECOWAS ECONOMIC COMMUNITY OF WEST AFRICAN STATESES ENTERPRISE SURVEYFDI FOREIGN DIRECT INVESTMENT FEZ FREE ECONOMIC ZONEGAMTEL GAMBIA TELECOMMUNICATIONS COMPANYGCI GLOBAL COMPETITIVENESS INDEXGDA GAMBIA DIVESTITURE AGENCYGIPFZA GAMBIA INVESTMENT PROMOTION & FREE ZONES AGENCYGOG GOVERNMENT OF THE GAMBIAGPA GAMBIA PORTS AUTHORITYHDI HUMAN DEVELOPMENT INDICATORIEF INDEX OF ECONOMIC FREEDOMIMF INTERNATIONAL MONETARY FUNDICJ INTERNATIONAL COURT OF JUSTICEIPC INVESTMENT PROMOTION CENTERJIC JOINT INDUSTRIAL COUNCIL AGREEMENTLDCS LEAST DEVELOPED COUNTRIES NAWEC NATIONAL WATER AND ELECTRICITY COMPANYNER NOMINAL EXCHANGE RATEPCT PERCENTAGEPPPA PURCHASING POWER PARITYPRSP POVERTY REDUCTION STRATEGY PAPERROA RETURN ON ASSETSR. PCT ROW PERCENTAGE SSA SUB SAHARAN AFRICATFP TOTAL FACTOR PRODUCTIVITYULC UNIT LABOR COSTUNDP UNITED NATIONS DEVELOPMENT PROGRAMWAEMU WEST AFRICAN ECONOMIC AND MONETARY UNION WDI WORLD DEVELOPMENT INDICATORSWDR WORLD DEVELOPMENT REPORTWTO WORLD TRADE ORGANIZATION
Vice President: Obiageli Ezekwesili Country Director: Madani M. TallSector Director: Marilou UySector Manager: Iraj AlikhaniCountry Economist: Hoon Sahib SohTask Team Leader: Jean-Michel N. Marchat
2

AUTHORS
Zena Angesom (Consultant, World Bank)James Habyarimana (Consultant, World Bank)Philippe Alby (Consultant, Arqade – Toulouse, France)George Clarke (ECSPF, World Bank)Magueye Dia (Consultant, World Bank)Jean-Michel Marchat (MNSED, World Bank – Team Leader)
AKNOWLEDGMENTS
The authors wish to thank Mr. Fares Khoury, President of "Étude Économique Conseil" in Montreal, whose teams were in charge of improving the survey instrument and collecting the data in The Gambia.
The authors would like to express their gratitude to the Gambian authorities, to the various business associations of the country, and especially to the managers and staff of the 301 firms visited in the Gambia in late 2006 for their contribution, their patience and kindness.
Finally, the authors wish to thank Iraj Alikhani, Demba Ba, Françoise Perrot, McDonald P. Benjamin, Ganesh Rasagam, Ivan Rossignol, Hoon Sahib Soh, and Michaela Weber for their valuable assistance, comments and suggestions on preliminary versions of this document.
3

FOREWORDS
In recent years, the World Bank Group has created several tools aimed at analyzing the Investment Climate in its member countries. The two most important instruments are: the Doing Business Indicators and the Enterprise Surveys.
The Doing Business database provides measures of business regulations. The 10 annual Doing Business indicators are comparable across 181 economies in 2008-2009. They indicate the regulatory costs of business and can be used to analyze specific regulations that enhance or constrain investment, productivity, and growth. The database was created thanks to contributions of lawyers, judges, business people and public officials in the countries covered (www.doingbusiness.org).
The Enterprise Survey database provides detailed information on the investment climate in about 110 countries. Enterprise surveys provide insights, analysis and benchmarking for countries seeking to promote private investment and enterprise growth. Each survey is based on a standardized establishment level survey methodology designed at measuring a number of investment climate constraints in a country and compares the findings across countries. In each country, between 300 and 2000 formal and informal establishments are surveyed in manufacturing, trade and the rest of the economy (www.enterprisesurveys.org).
The World Bank Group’s Investment Climate Assessments (ICA) serie of reports, of which this report belongs to, identify and prioritize investment climate constraints, benchmark progress on reforms, provide cross-country comparisons of investment climate indicators, and aims at helping countries forge a broad consensus on priority areas for reform. These assessments feed into World Bank and IFC operations and technical assistance. This type of comprehensive report uses both the Doing Business and the Enterprise Survey Data.
4

TABLE OF CONTENT
AKNOWLEDGMENTS..........................................................................................................................................3
FOREWORDS.........................................................................................................................................................4
EXECUTIVE SUMMARY....................................................................................................................................10
INTRODUCTION..................................................................................................................................................21
1 THE ENVIRONMENT OF FIRMS....................................................................................................................23
1.1. RECENT ECONOMIC DEVELOPMENTS.............................................................................................231.1.1. Robust growth and recent efforts at improving macroeconomic management..................................231.1.2. A service based economy which attracts large FDI inflows...............................................................24
1.2. RECENT REFORMS IN THE PRIVATE SECTOR AREA.....................................................................251.2.1. Trade policy........................................................................................................................................251.2.2. Divesture of public assets...................................................................................................................261.2.3. Incentives for investors: The Gambia Investment Promotion Act.....................................................27
1.3. CHALLENGES FACED BY THE GAMBIA...........................................................................................291.4. GAMBIA’S BUSINESS ENVIRONMENT ACCORDING TO INTERNATIONAL RANKINGS........301. 5. CONCLUSION.........................................................................................................................................31
2. MANUFACTURING’S FIRM PERFORMANCE IN THE GAMBIA.................................................................................32
2.1. FIRM PERFORMANCE............................................................................................................................322.1.1. Labor Productivity..............................................................................................................................322.1.2. Labor Costs and Unit Labor Costs......................................................................................................342.1.3. Capital Intensity..................................................................................................................................352.1.4. Factor productivity by types of firms.................................................................................................37
2.2. TOTAL FACTOR PRODUCTIVITY........................................................................................................392.3. EXPORTING.............................................................................................................................................402.4. PROFITABILITY......................................................................................................................................412.5. CONCLUSION..........................................................................................................................................42
3. BUSINESS ENVIRONMENT IN THE GAMBIA: THE POINT OF VIEW OF FIRMS................................43
3.1 FIRM PERCEPTIONS: A STARTING POINT.........................................................................................433.1.1. The Leading Constraints.....................................................................................................................43
The formal sector.....................................................................................................................................43The informal sector..................................................................................................................................47Other noticeable constraints....................................................................................................................48
3.1.2. What is the Intensity of Constraints outlined above?.........................................................................493.2. THE BUSINESS ENVIRONMENT FACED BY FIRMS........................................................................50
3.2.1. Variation in constraints across categories of manufacturing firms....................................................50Exporters versus non-exporters...............................................................................................................51Ownership................................................................................................................................................51Location...................................................................................................................................................51
3.2.2. The Leading Constraints for manufacturers in an international perspective......................................513.2.3. The Quality of Infrastructure..............................................................................................................53
Electricity.................................................................................................................................................53Other infrastructures...............................................................................................................................56
3.2.4. Foreign trade.......................................................................................................................................583.2.5. Other elements of the business environment......................................................................................60
Corruption...............................................................................................................................................60The regulatory framework.......................................................................................................................63
3.4. CONCLUSION..........................................................................................................................................67
5

4. FACTOR MARKETS IN THE GAMBIA.........................................................................................................68
4.1. THE FORMAL LABOR MARKET..........................................................................................................684.1.1. Institutional characteristics of the formal labor market in The Gambia.............................................694.1.2. The main characteristics of formal sector employees: education, training and health.......................71
Employees’ education and training.........................................................................................................71Health status............................................................................................................................................75
4.1.3. Employees earnings............................................................................................................................76Earnings: level and structure..................................................................................................................76Wage determination.................................................................................................................................78
4.1.4. Conclusion..........................................................................................................................................804.2. FIRM'S FINANCE IN THE GAMBIA: SOME DEMAND ASPECTS....................................................81
4.2.1. An overview of the financial sector in the Gambia............................................................................814.2.2. Perception of finance matters as a constraint.....................................................................................834.2.3. Financing Structure.............................................................................................................................844.2.4. Who uses bank finance?.....................................................................................................................864.2.5. The process of obtaining credit...........................................................................................................884.2.6. Credit Characteristics..........................................................................................................................90
Larger firms or those operating in the manufacturing sector receive more financing than firms in other sectors......................................................................................................................................................90A high cost of credit.................................................................................................................................91
4.2.7. Other financing instruments...............................................................................................................91Overdrafts................................................................................................................................................91Trade Credit.............................................................................................................................................92
4.2.8. Conclusion..........................................................................................................................................93
5 . SYNTHESIS AND PROPOSALS....................................................................................................................94
ANNEXES...........................................................................................................................................................100
6

LIST OF CHARTS AND TABLES
Chapter 1.Chart 1. 1. Real GDP growth: 1996-2007 (Pct.)....................................................................................................23Chart 1. 2. GDP structure (1985-2006)..................................................................................................................24Chart 1. 3. Average foreign direct investments 1996-2006 (Net Inflows).............................................................25Chart 1. 4. International rankings for Gambia.......................................................................................................30Chart 1. 5. Ease of doing business index for 2008................................................................................................31
Chapter 2.Chart 2. 1. Labor productivity is lower in The Gambia than in other low income countries in SSA....................33Chart 2. 2. Labor costs in the Gambia are low and unit labor costs are relatively high.........................................34Chart 2. 3. Capital intensity is also lower in Gambia than in other low income countries in SSA........................36Chart 2. 4. Firms in The Gambia are labor intensive but capital productivity is not particularly high.................37Chart 2. 5. Despite the low level of capital intensity, TFP remains very low in the Gambia................................39Chart 2. 6. Few manufacturing firms from The Gambia export............................................................................40Chart 2. 7. Firms in small countries are more likely to export than in large countries – making Gambia more of
an outlier in this respect................................................................................................................................41Chart 2. 8. Profitability is low in The Gambia.......................................................................................................42
Table 2. 1. Median productivity by industry and size in Gambia..........................................................................38
Chapter 3.Chart 3. 1. The leading constraints to firm’s operations........................................................................................44Chart 3. 2. Property registration.............................................................................................................................45Chart 3. 3. Tax burden in The Gambia...................................................................................................................46Chart 3. 4. The intensity of constraints in the formal sector..................................................................................49Chart 3. 5. Differences in perceptions by export status, ownership and location for manufacturers.....................50Chart 3. 6. Concerns about infrastructure are mostly uniform across all sectors...................................................53Chart 3. 7. Experiences with unreliable electricity supply: The need for generators............................................54Chart 3. 8. A high cost of unreliable electricity supply..........................................................................................55Chart 3. 9. Waiting times for an electric connection..............................................................................................55Chart 3. 10. Proportion of paved roads..................................................................................................................57Chart 3. 11. Gambia’s customs delays...................................................................................................................59Chart 3. 12. Administrative export/Import costs are low in The Gambia (USD per container)............................59Chart 3. 13. Perception of corruption.....................................................................................................................60Chart 3. 14. Unofficial payments to get things done..................................................................................................60Chart 3. 15. Contract value typically paid in informal payments/gifts to secure the contract in manufacturing...62Chart 3. 16. Gift or informal payment expected/requested.........................................................................................62Chart 3. 17. Regulations are consistent and predictable........................................................................................63Chart 3.18. Perceptions of the efficiency of the court system................................................................................64Chart 3. 19. Starting a business..............................................................................................................................65Chart 3. 20. Closing a business..............................................................................................................................65
Table 3. 1. Percentage of firms reporting constraint as major or very severe........................................................47Table 3. 2. Percentage of firms reporting major or very severe constraints..........................................................48Table 3. 3. Cross country constraints to firm operation........................................................................................52Table 3. 4. Electricity services are very poor.........................................................................................................53Table 3. 5. Quality of procedures associated with external trade..........................................................................58
Chapter 4.Chart 4.1. 1. Labor market regulations in The Gambia..........................................................................................70Chart 4.1. 2. Employees’ education levels in the manufacturing sector across selected countries........................72Chart 4.1. 3. Educational achievement of employees in manufacturing by gender (Pct.C)..................................73Chart 4.1. 4. Pct of firms providing formal training..............................................................................................74Chart 4.1. 5. Training needs expressed by employees (Pct)..................................................................................74Chart 4.1. 6. Employees’ health status...................................................................................................................75Chart 4.1. 7. Remuneration differential between men and women (unskilled production worker).......................77Chart 4.1. 8. Remuneration differential..................................................................................................................77
7

Chart 4.1. 9. Monthly earnings for unskilled production workers in 2005, manufacturing sector (USD)............78Table 4.1. 1. Monthly cash earnings by job position in 2005, manufacturing sector (USD). 76
Chart 4.2. 1. Ratio M2 over GDP in 2006 (Pct.)....................................................................................................82Chart 4.2. 2. Domestic credit to the private sector in 2006 (Pct. of GDP).............................................................82Chart 4.2. 3. Perception of access to finance as an issue across categories of firms.............................................83Chart 4.2. 4. Pct of long term assets funded by bank credit...................................................................................85Chart 4.2. 5. Financing structure of long term assets by sector.............................................................................85Chart 4.2. 6. Impact of location on financing structure of long term assets..........................................................85Chart 4.2. 7. Access to bank finance......................................................................................................................86Chart 4.2. 8. Real lending interest rates (Pct.)........................................................................................................91
Table 4.2. 1. Regression of access to finance perceptions on selected firms variables.........................................84Table 4.2. 2. Regression of access to finance indicator on firms specific variables..............................................87Table 4.2. 3. Reasons for not applying for a credit................................................................................................88Table 4.2. 4. Current credit characteristics.............................................................................................................90Table 4.2. 5. Overdraft characteristics...................................................................................................................92Table 4.2. 6. Proportion of firms reporting access to trade credit..........................................................................92
Figure 4.2. 1. Steps of the demand for credit in the formal sector.........................................................................89
ANNEXES
Chapter 2.Chart A.2. 1 Total Factor Productivity is lower in Gambia than in the middle-income comparator countries.. .103
Table A.2. 1. Test for Constant Returns to Scale.................................................................................................104Table A.2. 2. Comparison of Point Estimates for Whole Sample and for the Gambia........................................107Table A.2. 3. Determinants of Firm-Level Productivity for Manufacturing Enterprises.....................................107
Chapter 3.Chart A.3. 1. Structure of taxation.......................................................................................................................109Chart A.3. 2. Bureaucratic requirements for tax compliance...............................................................................109Chart A.3. 3. GRAFT index.................................................................................................................................110
Table A.3. 1. Paying Taxes in The Gambia.........................................................................................................109
Chapter 4.Table A.4.1. 1. Trade Union Presence.................................................................................................................111Table A.4.1. 2. Information’s flows in the formal labor market..........................................................................111Table A.4.1. 3. Highest educational achievement of employees in the manufacturing sector (Pct.C)................112Table A.4.1. 4. Employees’ formal training.........................................................................................................112Table A.4.1. 5. Formal training needs expressed by employees..........................................................................112Table A.4.1. 6. Illness, number of working days lost due to illness....................................................................113Table A.4.1. 7. Unskilled production worker remuneration................................................................................113Table A.4.1. 8. Wage equations...........................................................................................................................118
Annex 5 - SamplingChart A.5. 1. Comparison of firms’ distributions................................................................................................120
Table A.5. 1. Population size by stratum and sampling region............................................................................119Table A.5. 2. Sample of formal firms..................................................................................................................120Table A.5. 3. Sample of micro/informal firms.....................................................................................................121
8

9

EXECUTIVE SUMMARY
The Gambia is the smallest country in continental Africa and is surrounded by Senegal, except for a 60 km Atlantic Ocean front. The Gambia’s economy is still largely based on agriculture which accounted for 31.4 percent of GDP over 1996-2006 and provides an activity for roughly 80 percent of the population. The small industrial sector (about 13.4 percent of GDP over 1996-2006), consists mostly of construction and agro-processing activities. Services accounted for 55.2 percent of GDP over 1996-2006 with trade and transport, and communications being its two largest components. Tourism is Gambia’s primary foreign-exchange earner.
The situation in The Gambia is a good example of the many challenges small states have to deal with. The country is faced with institutional capacity constraints and due to a narrow resource base and a small domestic market, its production base and exports show yet little diversification. Like other small states, the country tends to rely heavily on external trade and foreign investment to overcome its scale and resource limitation, increasing its vulnerability to external shocks.
In spite of this, The Gambia has fared relatively well in recent years. The Gambian economy has been relatively strong, with an average annual real GDP growth rate of about 4.4 percent during 1996-2006, a performance slightly above the average growth in Sub-Saharan Africa (4.1 percent). Growth was at 7 percent in 2007 and is estimated to be around 5.5 percent in 20081. However, The Gambia still faces specific challenges, especially as the economy is undiversified and highly vulnerable to external shocks. In effect:
Growth still largely depends on the fate of the agricultural sector. In recent years, there has been significant growth in important sectors such as tourism, industry, re-export trading activities and construction. However, none of these can outweigh the negative effects of an eventual poor agricultural season.
The re-export sector is becoming less attractive over time. The recent implementation of CETs (at the WAEMU and ECOWAS level) has eroded Gambia’s advantage as a trade hub and, owing to a poor business environment and ageing port infrastructure; the sector is at risk of loosing competitiveness. Furthermore, the fate of this sector also largely depends on relations between The Gambia and Senegal.
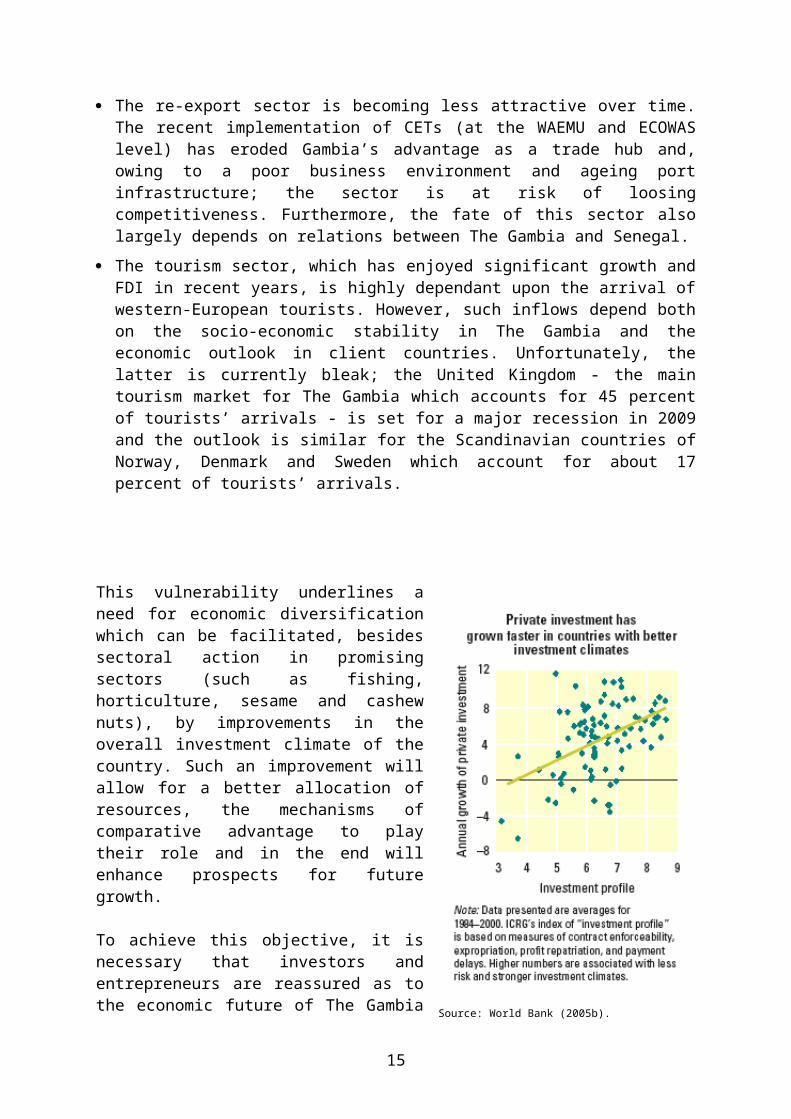
The tourism sector, which has enjoyed significant growth and FDI in recent years, is highly dependant upon the arrival of western-European tourists. However, such inflows depend both on the socio-economic stability in The Gambia and the economic outlook in client countries. Unfortunately, the latter is currently bleak; the United Kingdom - the main tourism market for The Gambia which accounts for 45 percent of tourists’ arrivals - is set for a major recession in 2009 and the outlook is similar for the Scandinavian countries of Norway, Denmark and Sweden which account for about 17 percent of tourists’ arrivals.
1 - February 2009 estimate by the IMF.
10

This vulnerability underlines a need for economic diversification which can be facilitated, besides sectoral action in promising sectors (such as fishing, horticulture, sesame and cashew nuts), by improvements in the overall investment climate of the country. Such an improvement will allow for a better allocation of resources, the mechanisms of comparative advantage to play their role and in the end will enhance prospects for future growth.
To achieve this objective, it is necessary that investors and entrepreneurs are reassured as to the economic future of The Gambia and its capacity to adopt a framework more favorable to the private sector. As shown in World Bank (2005b), it is now widely recognized that the development of the private sector requires an improvement in its “investment climate” in order to promote stronger economic growth within a market economy and a reduction of poverty. Indeed, comparative development experiments indicate that countries having a favorable investment climate have a higher rate of quality investment, which enables them to achieve stronger growth. Source: World Bank (2005b).
The objective of this report is to analyze the investment climate of The Gambia in its every dimension. It is the first time such a comprehensive report is prepared by the World Bank about the investment climate in The Gambia. Recent World Bank reports (such as the 2007 DTIS or the annual Doing Business reports) only look at specific areas of the investment climate and do not provide a global assessment of investment climate issues based on firm level data as does this report.
In effect, this document relies partly on the results of an Enterprise Survey undertaken in 2006 in The Gambia in which 174 formal companies and 127 micro-companies of the urban informal sector were surveyed in the Greater Banjul Area2. The sample of formal firms accounts for 72.8 percent of formal firms in activity in The Gambia in the surveyed sectors while the micro-informal sample accounts for 2.1 percent of this category of firms at the time of the survey3. This report underlines the fact that Gambian firms have operated in recent years within a decent macroeconomic environment but are still not very productive because of limitations in the local business environment. In effect, many severe constraints remain that limits the development of firms in The Gambia, thus impeding a successful diversification of the economy and possibilities for future growth.
Productivity analysis.
The starting point of this report is an analysis of firm level productivity in Gambian manufacturing. The computation of different measures of firm performance is intended to provide an indication of how competitive firms in The Gambia are in both international and
2 - The Greater Banjul Area comprises the City of Banjul and the Kanifing Municipal Council.
3 - Details on the sample and the sampling methodology followed for the survey appear in Annex 5 of this report.
11
domestic markets. The analysis is confined to the manufacturing sector as measures of productivity/efficiency for this sector are well defined from a technical point of view and comparative data are widely available through the enterprise survey dataset.
One of the major findings of this report is that the median labor productivity in manufacturing is very low in The Gambia, even when compared with the other low-income countries of Sub-Saharan Africa. For example, it is eight times lower than the observed rate of productivity in Senegal, the country with the best performance of all low-income countries in sub-Saharan Africa so far. Labor productivity in The Gambia is also always lower than that of sub-Saharan African countries with intermediate incomes, as well as countries with intermediate incomes outside of the Africa region.
In spite of the relatively low wages that prevail in The Gambia, this low labor productivity explains why ULCs (wage costs adjusted for productivity levels) remain high compared to those of the selected comparators.
In other words, the negative effect of low labor productivity is not really compensated for by the level of remunerations, which limits the competitiveness of the Gambian firms. The data also indicate that capital intensity and capital productivity are low in Gambian manufacturing.
Labor productivity in Gambia (USD per worker).
27,548
8,989
6,464
2,770
1,023
12,089
18,318
1,574
0 5,000 10,000 15,000 20,000 25,000 30,000
Hangzhu(China)
Brasil
South Africa
Senegal
Mali
Benin
Guinea-Bissau
Gambia, The
Unit labor costs (pct. of value added).
46%
18%
25%
34%
40%
45%
51%
0% 20% 40% 60%
Gambia, The
Mali
Senegal
Benin
Brazil
South Africa
Guinea-Bissau
labor cost per worker (% of value added)
Although the measures of firm productivity discussed above provide useful information on firm performance, they can be misleading when considered in isolation. To get an overall assessment of productivity, it is necessary to take both capital and labor use into account. The net impact of the different factors of production on firm-level productivity can be assessed by calculating total factor productivity (TFP). Differences in TFP are those differences in output that cannot be explained by differences in the use of labor, capital and other inputs. Firms for which total factor productivity is higher are more efficient than other firms because they produce more with less capital and workers.
Estimates of various specifications of functions of production indicate that TFP is very weak in the manufacturing sector in The Gambia. On average, firms in Guinea-Bissau are about 20 percent more productive than firms in The Gambia, firms in Benin are twice as productive,
12

and firms in South Africa (the country which has the best TFP of the continent) over six times as productive. These indicators of productivity suggest that, currently, Gambian industry is not competitive, even compared to other low income countries in Sub-Saharan Africa.
This low level of productivity (whether at the factor level or in terms of TFP) can be explained by deficiencies in the business environment in the country which revolve around issues such as infrastructure provision, the working of factor markets and the regulatory environment. The remainder of the report is devoted to an analysis of these problems.
Investment climate issues.
Survey results presented in this report, indicate that the investment climate in The Gambia, in 2006, was not favorable to the private sector, regardless of the sector. There is also evidence that few improvements have occurred since then.
The leading constraints to firm’s operations.(Pct. of firms which quote the item as a "major" or "very severe obstacle")
Manufacturing
78.5
58.3
31.8 30.6
17.7 15.2 15.2 12.1
0
10
20
30
40
50
60
70
80
90
Elec
trici
ty
Acc
ess t
ofin
ance
Acc
ess t
o La
nd
Tax
Rate
s
Prac
tices
of
com
petit
ors i
nin
form
al se
ctor
Tax
Adm
inist
ratio
n
Inad
equa
tely
educ
ated
wor
kfor
ce
Custo
ms a
ndTr
ade
Regu
latio
ns
Services
74.5
42.6
29.8 27.7 27.7 27.7
19.1 19.1
0
10
20
30
40
50
60
70
80
Elec
trici
ty
Acc
ess t
ofin
ance
Tax
Rate
s
Acc
ess t
o La
nd
Prac
tices
of
com
petit
ors i
nin
form
al se
ctor
Mac
roec
onom
icin
stabi
lity
Tax
Adm
inist
ratio
n
Busin
ess
licen
sing
and
Perm
its
O ther
79.8
3430.9
24.521.3 20.2 19.1
14.9
0
10
20
30
40
50
60
70
80
90
Elec
trici
ty
Acc
ess t
ofin
ance
Tax
Rate
s
Acc
ess t
o La
nd
Prac
tices
of
com
petit
ors i
nin
form
al se
ctor
Mac
roec
onom
icin
stabi
lity
Busin
ess
licen
sing
and
Perm
its
Tax
Adm
inist
ratio
n
Informal
66.963.8
29.9 29.122 19.7
15.7 13.4
0
10
20
30
40
50
60
70
80
Elec
trici
ty
Acc
ess t
o fin
ance
Mac
roec
onom
icin
stabi
lity
Acc
ess t
o La
nd
Tax
Rate
s
Prac
tices
of
com
petit
ors i
nin
form
al se
ctor
Tele
com
mun
icat
ions
Corr
uptio
n
Across the three formal sectors (manufacturing, services, others), the four perceived leading constraints are the same, although they differ a little in magnitude and ranking:
Electricity; Access to finance (availability and cost); Access to land; Tax Rates.
13

The data also show that constraints faced by informal firms are very similar to the ones quoted by formal firms. Electricity, access to finance, access to land and macroeconomic instability are the leading constraints for micro/informal firms. Hence, 63 to 68 percent of the informal firms find finance and electricity to be major or severe constraints. About 30 percent of informal firms also report access to land to be a major or severe constraint. A similar proportion of informal firms reports macro-economic instability to be a serious impediment.
These major constraints relate to infrastructure issues, problems on factor markets and the regulatory framework. Each broad category of concern is addressed by the report.
Infrastructures. Problems with electricity supply are perceived as the main barrier to the growth of firms in the Gambia. Across sectors, between 67 and 80 percent of the firms consider electricity as a “major” or “very severe” obstacle to the development of the private sector in the Gambia.
13.7
6.55 4.3
1.7 1.6 1.20.4
0
2
4
6
8
10
12
14
16
Gam
bia
Beni
n
Gui
nea
-Biss
au
Sene
gal
Mal
i
Braz
il
Chi
na
Sout
h A
fric
a
Value lost due to electrical outages (% of sales)194.2
55.632 20.7 20.5 10.5 10.3 5.3
0
50
100
150
200
250
Gam
bia
Beni
n
Mal
i
Braz
il
Gui
nea
-Biss
au
Chi
na
Sene
gal
Sout
h A
fric
a
Delay in obtaining an electrical connection (days)
Note. Manufacturing sector.
In comparative terms, the poor reliability of electricity services in The Gambia tends to confirm these negative perceptions. Given the importance of electricity in the production function of most sectors, an unreliable service is likely to have a large impact on productivity and export competitiveness.
The cost of poor electricity services is also non-negligible: manufacturing firms lose nearly 14 percent of sales as a result of interruptions in power supply, firms in the retail services and tourism sectors lose an average of 15-16 percent of their sales while informal firms report an average just above 20 percent of sales. Poor electricity supply is a significant comparative disadvantage. For example, while firms in neighboring Senegal also face an uncertain electricity regime (as measured by the extent of generator ownership), they only lose about a quarter of the output loss in the Gambia as a result of poor electricity services. The problems of electricity services are not only restricted to customers that are already on the grid. Getting an electricity connection in the Gambia can be very time consuming too: a manufacturing firm in The Gambia has to wait an average of 6 months to get an electricity connection, largely because of persisting inefficiencies in the distribution infrastructure.
In the area of infrastructure, water supply also appears to be an issue for firms. Nearly one third of manufacturing firms reported that they had insufficient levels of water. Firms reported an average of a little over 9 water outages per month and an average duration of nearly 7 hours.
Other infrastructures like transport and telecommunication are perceived as less problematic by firms.
14
Factor market issues. Access to Finance is perceived as the second most important barrier to the growth of firms in The Gambia. Across sectors, between 34 and 58 percent of the formal firms consider access to finance as a “major” or “very severe” obstacle to their development.
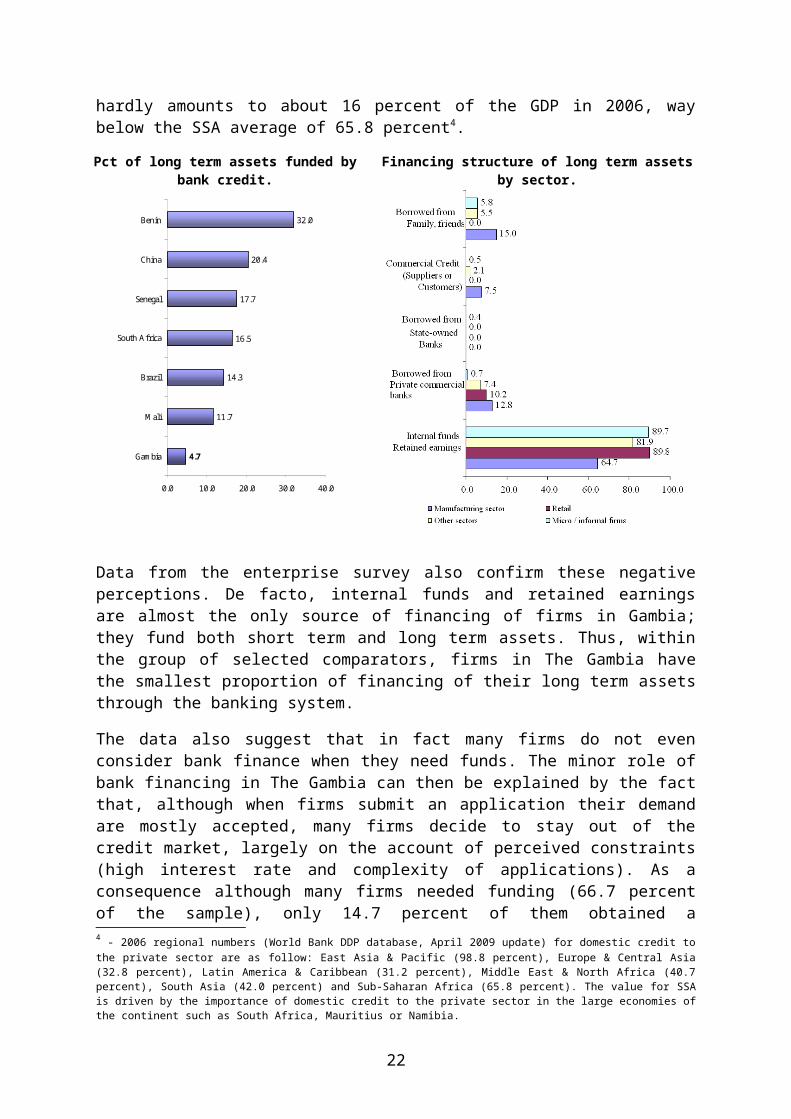
Such a negative perception is confirmed by the fact that, despite its relative soundness (NPL rates are moderate and ROAs relatively high), many indicators suggest that the Gambian financial system remains nonetheless slightly underdeveloped and does not serve the private sector as much as it should. Hence, domestic credit to the private sector hardly amounts to about 16 percent of the GDP in 2006, way below the SSA average of 65.8 percent4.
Pct of long term assets funded by bank credit.
11.7
14.3
16.5
17.7
20.4
32.0
4.7
0.0 10.0 20.0 30.0 40.0
Gambia
Mali
Brazil
South Africa
Senegal
China
Benin
Financing structure of long term assets by sector.
Data from the enterprise survey also confirm these negative perceptions. De facto, internal funds and retained earnings are almost the only source of financing of firms in Gambia; they fund both short term and long term assets. Thus, within the group of selected comparators, firms in The Gambia have the smallest proportion of financing of their long term assets through the banking system.
The data also suggest that in fact many firms do not even consider bank finance when they need funds. The minor role of bank financing in The Gambia can then be explained by the fact that, although when firms submit an application their demand are mostly accepted, many firms decide to stay out of the credit market, largely on the account of perceived constraints (high interest rate and complexity of applications). As a consequence although many firms needed funding (66.7 percent of the sample), only 14.7 percent of them obtained a credit/line of credit as roughly 78.4 percent of them decided to not ask for any funding from the banks. This suggests that the mechanism at play in the Gambia at the time of the survey had little to do with credit rationing per see and was more related to a process of self-exclusion by firms.
4 - 2006 regional numbers (World Bank DDP database, April 2009 update) for domestic credit to the private sector are as follow: East Asia & Pacific (98.8 percent), Europe & Central Asia (32.8 percent), Latin America & Caribbean (31.2 percent), Middle East & North Africa (40.7 percent), South Asia (42.0 percent) and Sub-Saharan Africa (65.8 percent). The value for SSA is driven by the importance of domestic credit to the private sector in the large economies of the continent such as South Africa, Mauritius or Namibia.
15

Finally, the data also shown that most of the funding provided by the banking system is of a short term nature (the average credit maturity is about 9 months), requires a high collateral ratio (on average 220 percent) and is fairly expensive. Real interest rates in 2006 averaged 28 percent in The Gambia, which is quite high in an international perspective. Such rates were at around 5 percent in South Africa and 2 percent in China the same year.
Access to land is the third most important issue, for 25 to 32 percent of the formal firms. The problem lies in the weight of the regulatory burden. In addition, DB data show little changes for The Gambia in recent years from what was underlined at the time of the survey in 2006 (besides a slight decline in cost - from 7.6 percent of the value of the property in 2006 to 4.6 percent in 2008).
Crucial to the access to land problems, a typical firm must still wait more than a year before it has full legal title. This is nearly four times the length of time required in the rest of SSA. An examination of the time required for each step of the process provides insights to the source of land problem in The
Property registration.
109.9
95.6
11.6
10.5
7
6.8
371
371
7.6
4.6
5
5
2
2
0.1
0.1
2
2
0 50 100 150 200 250 300 350 400
2006
2008
2006
2008
2006
2008
Sub-Saharan Africa Gambia, the New Zealand
Gambia. The first procedure, the application for ministerial approval for the transfer of leasehold, still takes 365 days.
Labor Market. Although labor market issues do not appear at the top of firm’s perceived constraints, the education of the workforce and its health status remain problematic and are worth considering as they impact productivity in a negative way.
Education. Data suggest that manufacturers employ a very large proportion of employees without any education (25.4 percent), far above what can be observed in the some of weakest countries surveyed so far in Sub-Saharan Africa. In addition, The Gambia is one of the countries which display the lowest proportion of employees with technical education. Finally, the proportion of firms providing formal training (22.1 percent) is low, comparable to the situation in Mali and below what is observed in Senegal. This is also far below from what was observed in countries like China or Brazil. These findings are consistent with the fact that most manufacturing in The Gambia is labor intensive and that labor productivity is low. Typically, labor intensive industries use a large proportion of unskilled labor;
Health. 35 percent of manufacturing workers reported being ill within the last 30 days preceding the survey. This proportion is well above what was observed in other comparator countries. About 3 workdays were lost after a disease during the month preceding the survey. This figure puts The Gambia within the average of the sample of
16

African countries but it is nonetheless equivalent to a 16 percent diminution of working time; a clear impediment to firm’s productivity and employees well-being.
Issues in the regulatory area. Tax rates and tax administration are perceived as a significant problem by managers; 29 to 31 percent of formal firms consider tax rates as an obstacle to their growth. In addition, the administrative requirements of tax compliance constitute an important impediment. About 15 to 19 percent of all formal sector firms report the administration of taxation to be a major or very severe impediment. Taken together, tax rates and the bureaucratic costs associated with compliance are as important as access to finance.
Such negative perceptions seem justified. In effect, in 2006 at the time of the survey, a medium sized firm in Gambia would have had to pay/collect the equivalent of 291 percent of its profits in taxes compared to 71 percent in SSA on average. This was the highest fiscal burden of the countries surveyed in the 2006 Doing Business country sample. Tax obligations of a firm in The Gambia - as a share of profits - were nearly four times those of a similar firm in the next highest taxing countries: China and Brazil. Other comparator countries roughly pay/collect only half their annual profits in taxes. This is almost six times smaller than the tax obligations in The Gambia. The latest data available, for 2009, suggest that very little has changed since then.
The source of The Gambia’s high tax burden is, according to the DB methodology, a 15 percent sales tax levied on total sales. Data clearly shows that the so-called other taxes dominated the tax burden in The Gambia in 2006. In particular, a firm was expected to pay/collect nearly the equivalent of about 240 percent of its profits in other taxes. On the other components of the fiscal burden, tax rates on profits were the highest of the comparator group at about 35 percent, compared to 25 percent in South Africa. Labor taxes were particularly low at 13 percent of gross profits and were only higher than labor taxes in South Africa (2.3 percent).
Other aspects of the Gambian regulatory framework are worth mentioning as they also shape the business environment of the country and could benefit from improvements in the future:
Credibility of regulations. As a whole, managers of manufacturing firms in The Gambia have little confidence in the consistency and predictability of regulations. Only about half of manufacturing firms consider (48.5 percent) that Government officials’ interpretations of the laws and regulations affecting their establishment are consistent and predictable. In the other surveyed sectors, the point of view is more moderate. Between 54 (retail services) and 65-66 percent of the firms (tourism and informal firms), depending on the sector, have the same point of view. Nonetheless, this still implies that about a third of the surveyed firms has a mistrust in this area, hardly a good news.
Entry/exit regulations. Starting a business is relatively easy in The Gambia according to the Doing Business indicators. Whether in 2006 or in 2008, the country performs better than SSA on average, with the exception of the cost of the procedures which remains high. This high cost is mainly driven by the need to obtain an operational license which costs 5000 GMD (roughly 240 USD). Closing a business is also relatively easy. Related costs are slightly lower than in SSA on average and the recovery rate on assets is much higher than in SSA. However, in terms of duration, procedures are slower than in SSA on average, which is not a good performance.
Corruption. It is often a by-product of inefficiencies in the regulatory system and distorted incentives. Data indicate that corruption remains a problem in The Gambia; it generates instability in the business environment and increases the operating costs of firms. Although
17

less than 9 percent of firms in the manufacturing sector reported corruption to be a major constraint, which is very low and much lower than in neighboring Senegal and Mali, the cost of corruption is high. Gambia is only second to Benin in the size of the ‘informal’ tax on economic activity. Informal payments to get “things done” account for 4 percent of manufacturing firms’ sales in The Gambia, and this is very similar in other sectors surveyed. This apparent contradiction between perceptions and the effective cost of corruption may be explained by the fact that this type of behavior is probably endogeneised by firms and therefore, being common and known in advance, becomes a cost item like any other. Obtaining an electrical connection and a construction permit are the two activities most likely to require a bribe. Nearly 30 percent of firms reported that they either expected or were requested to pay a bribe before receiving the service.
More favorable aspects of the investment climate.
In spite of all the above mentioned issues, the picture is not totally bleak in The Gambia. There are areas where The Gambia does relatively well.
The court system. Most of the formal firms seem to have a relatively positive view of the working of the courts in case of a business dispute. Like firms in the manufacturing sector, a majority of firms in the other surveyed sectors (32 to 76 percent of them) find courts to be able to enforce decisions, to be affordable and fair in the case of business disputes. However, most of the firms consider that the speed at which the court system operates is still not satisfactory.
Foreign trade . Consistent with its trading tradition, the country performs well in this area. Clearance times are short. An examination of the length of time required to clear goods against the comparator set of countries confirms that The Gambia has an efficient customs system. Gambian exports and imports have the shortest clearing duration of all comparator countries with data taken from recent enterprise surveys. Clearing costs are also low, the average cost of clearing an imported container into The Gambia is one of the lowest in the group of comparator countries, second only to China. Export costs are similarly low, the cost of clearing a container for export from The Gambia is much lower than the cost of clearing from Senegal and about a half the average cost for Sub-Saharan Africa. These good performances stem from cost effective and efficient customs procedure.
Strategic options to improve the investment climate in The Gambia.
Overall, as underlined by the report, the investment climate in The Gambia still presents serious deficiencies. This will requires corrective measures to ensure a diversified growth of the private sector, especially in the non-agricultural sector. It is now recognized by the political authorities that additional reforms are necessary to increase firm's competitiveness and the performances of the private sector in The Gambia. The Government has already clearly indicated its will to quickly improve the investment climate in the country. This is a positive development for the future, as investment climate reforms require consistency, political will and prioritization.
This report underlines many issues in the investment climate in The Gambia. All of them cannot be addressed in the same time. There is a need to set priorities on the basis of the order of constraints given by Gambian firms. Therefore, this report proposes to focus on selected priority areas of reform - strategic axes - in order to improve quickly the investment climate
18

in the country. Other issues mentioned in the report are important too, but can be addressed in a second wave of reforms, when the binding constraints will have been removed or - at least - alleviated.
A policy aimed at improving the investment climate in The Gambia should therefore include interventions in:
Infrastructures. The key strategic orientation is to improve as quickly as possible the supply of electricity and water, and their reliability in the country. In the current context, in spite of recent improvements, this remains (electricity especially) the critical factor hindering firm’s growth.
In the short-term, ways to obtain such a result may include i) a review of the role and performance of the National Water and Electricity Company (NAWEC) which may also encompass a reform of tariffs, revenue collection/expenditures and management, ii) the promotion of investments having as an objective the upgrading of power and water infrastructure in order to improve supply capacity and reliability and iii) an enhancement of the governance and regulatory capacities of the Public Utilities Regulatory Authority (PURA).
In the medium term, there is a need to i) promote and support investments in power and water supply infrastructure through greater use of private-public partnerships, ii) strengthen regulation by PURA through establishing clear rules for private participation in power generation and transmission and iii) ensure that electricity pricing maintains the financial viability of power companies, while protecting the most vulnerable consumers.
Access to finance. The second major area of intervention should be the promotion of access to finance for firms as the minimal of use of long term financing hinders firms investment.
In the short-term, this would imply to i) simplify property registration processes, taxes and fees to provide property owners with access to collateralized financing, ii) ensure that the Credit Reference Bureau functions effectively, iii) implement the amended Mortgage Act to facilitate collateralized lending, iv) expand Business Development Services (BDS) to SMEs on improving productivity and accessing banking finance and v) enhance the capacity of banks and microfinance institutions.
In the medium term, there is a need to i) strengthen corporate governance in the private sector - including in the banking sector, ii) computerize the property registration process, paying taxes and fees and provide this information in a secure, public access system, iii) create risk-sharing mechanisms such as government guaranteed lending and iv) promote the application of innovative products and technology (credit scoring) to expand access to finance.
Access to land. The third major area of intervention should be the promotion of access to land for firms as it will help them to provide collateral. In this respect, the promotion of a better access to land for firms will also have a positive impact on the access to finance by the private sector.
19

In the short-term, this would imply to i) simplify the property registration process by minimizing or eliminating the need for Ministerial approval and ii) to modernize and update the real estate cadastre in priority development areas.
In the medium term, there is a need to i) computerize the property registration process based on a modern, digital cadastre system and ii) establish a transparent land management policy to support deregulation of the land market, including leasing of public land and the creation of a competitive land market.
Taxation and tax administration. The fourth major area of intervention should be to improve the working of the tax system.
In the short-term, this would imply to i) review and simplify the current tax regime (and consolidating the number of other taxes where possible), ii) review the taxes and fees levied by Municipalities and Local Authorities, and iii) provide training programs and readily available information on self-assessment - especially for SMEs - in partnership with the private sector.
In the medium term, there is a need to i) adopt a new, streamlined tax code, ii) computerize the tax administration process and iii) establish an effective Tax Tribunal that is perceived as serving the business community in an impartial and quick manner.
20

INTRODUCTION
1. The Gambian economy has been relatively strong in recent years, with an average annual real GDP growth rate of about 4.4 percent during 1996-2006, a performance slightly above the average growth in Sub-Saharan Africa (4.1 percent). Growth was at 7 percent in 2007 and is estimated to be around 5.5 percent in 2008 (IMF 2009b). In spite of this growth, poverty remains prevalent: the country ranked 160 out of 179 countries in the 2008 UN Human Development Index. The overall poverty rate in 2003 was estimated at 58 percent (World Bank 2008a). The good performance of agricultural production, the rise of services, re-export trade, and healthy growth of industries as well as Government spending on public sector has contributed to that rate of growth in recent years. However, the Gambia is still vulnerable to external shocks as the main sources of domestically generated foreign exchange come from tourism and re-export trade whose fate depend largely on exogenous factors. In addition, a major part of the labor force is engaged in farming, mainly groundnuts, and is vulnerable to weather conditions.
2. For the future, one of the key structural challenges confronting the Gambia is a need for further openness to private sector development and to speed up structural reforms already outlined by the government in order to reduce its vulnerability to exogenous factors and foster economic diversification. To fulfill these objectives, it is necessary that investors and entrepreneurs are reassured with respect to the future of the economy and its capacity to set up a more favorable framework for the private formal sector, i.e. a better investment climate. Such an improvement will allow for a better allocation of resources, the mechanisms of comparative advantage to play their role and in the end will enhance prospects for future growth. Indeed, it is now admitted that private sector development requires "Investment Climate" improvement in order to promote strong economic growth within a market economy as well as poverty reduction (Stern 2002a and b, World Bank 2005b).
3. It is shown that countries with a favorable investment climate face a higher investment rate, which allows reaching a higher level of economic growth (World Bank 2005b). Indeed, increasing living standards and decreasing poverty can only be obtained through a sustained economic growth, which is highly correlated with an increased level of investment, which depends itself on factor productivity improvement, which itself is built on increased physical and human capital investment and technical progress. The last three elements are highly dependent upon a favorable investment climate. Therefore the investment climate is defined as the present and anticipated political, institutional and behavioral environment, which affects risks and returns on investments. Hence, this concept covers a vast area, from the regulatory framework and infrastructures to firms’ performance and the functioning of factor markets.
4. The objective of this report is to analyze the investment climate of The Gambia in its every dimension. It is the first time such a comprehensive report is prepared by the World Bank about the investment climate in The Gambia. Recent World Bank reports (such as the 2007 DTIS or the annual Doing Business reports) only look at specific areas of the investment climate and do not provide a global assessment of investment climate issues based on firm level data as does this report. Information sources used in this document are multiple; regulatory and legal documents, academic work, reports and survey data. This document is
21
therefore partially built on the results of an Enterprise Survey performed in late 2006 in Gambia by the Canadian consultancy "Etude Economique Conseil".
5. The survey in the formal sector (174 firms) focused on three specific sectors, one of which is the manufacturing sector. The latter is always treated in ES because it allows establishing international productivity comparisons. The manufacturing sector, as defined in the report, includes food, garments, wood and metal industries as well as other manufacturing activities. The other surveyed sectors (services (retail) and other sectors) are now systematically analyzed in ES to enlarge the field of investigation in order to better capture all problems linked with the investment climate at the national level. Survey results provide a snapshot of the business climate in The Gambia in late 2006/early 2007. The sample of formal firms accounts for 72.8 percent of formal firms in activity in The Gambia in the surveyed sectors5 in late 2006. In the manufacturing sector, nearly 60 percent of firms have between 5 and 19 employees and qualify as small firms. These manufacturing firms essentially operate within the national market (for 88 percent of them) and are private Gambian companies (for 85 percent of them). Moreover, 127 firms from the informal sector were interviewed during the same period in Banjul and in the Kanifing Municipal Council. The micro/informal sample accounts for 2.1 percent of this category of firms at the time of the survey. Qualitative data about firms’ perception were collected during the ES in order to reflect managers’ point of view during the survey period. Quantitative data were also collected, accounting and labor force data refer to their 2005 values. Finally, 115 individual interviews were conducted with staff employed within the surveyed firms in manufacturing.
6. At the time of completion of this report, ES have been undertaken in 110 countries since the early 2000s. This huge dataset allows for comparisons of firms’ performance and quality of the investment climate between The Gambia and other countries from various regions. Selected comparators are countries where ES have been realized in the past few years and which are of particular interest: such as China and Brazil as emerging countries; Guinea-Bissau, Senegal, Mali and Benin as neighboring countries and South Africa as the main economic force within the continent.
7. This report is organized as follows. The first chapter provides a general snapshot of the firms’ economic environment in The Gambia. The second chapter analyzes in detail manufacturing firms’ productivity in The Gambia, in order to determine the present status of this particular component of the production system. Chapter three treats the general business environment and analyzes some of its salient aspects, such as the perceived economic or regulatory constraints by firms. Chapter four analyzes factor markets in the Gambia, first the labor market and then the complex relationship between firms and the banking sector. A final and brief chapter provides a synthesis of the report and some strategic directions aimed at improving the business environment in the country.
5 - Details on the sample and the sampling methodology followed for the survey appear in Annex 5 of this report.
22

1 THE ENVIRONMENT OF FIRMS.
8. The Gambia is the smallest country in continental Africa and is surrounded by Senegal, except for a 60 km Atlantic Ocean front. The situation in The Gambia is a good example of the many challenges faced by small states. The country is faced with institutional capacity constraints and due to a narrow resource base and a small domestic market, its production base and exports show yet little diversification. Like other small states, the country tends to rely heavily on external trade and foreign investment to overcome its scale and resource limitation, increasing its vulnerability to external shocks (World Bank 2008a). In spite of this, The Gambia has fared relatively well in recent years, GDP growth has been respectable. However, the current recession in advanced economies triggered by the global financial crisis is now likely to adversely affect the country’s tourism receipts, remittances inflows and overall growth prospects. It further underlines the need to improve the business environment in the country by creating a more enabling environment for the private sector.
1.1. RECENT ECONOMIC DEVELOPMENTS.
1.1.1. Robust growth and recent efforts at improving macroeconomic management.
9. Since 1996, economic growth has been rather robust in the Gambia, with the exception of 2002. Real GDP growth averaged 4.7 percent during 1996-2001 but declined sharply in 2002 due to a drought and poor macroeconomic management (- 3.2 percent). However, GDP growth bounced back to an average annual rate of 5.9 percent during 2003-2006, a very respectable rate mainly driven by strong performance in the tourism, construction and telecommunications sectors. Overall, with an average annual real GDP growth rate of about 4.4 percent during 1996-2006, The Gambia has performed slightly better than SSA (4.1 percent, Chart 1.1). Growth was at 7 percent in 2007 and is estimated to be around 5.5 percent in 2008 (IMF 2009b).
10. In spite of this growth, poverty remains prevalent: the country ranked 160 out of 179 countries in the 2008 UN Human Development Index6. The overall poverty rate in 2003 was estimated at 57 percent in urban areas and 63 percent in rural areas (World Bank 2005a, Republic of Gambia 2006). This suggests there is still a need for more pro-private sector policies and a speeding-up of structural reforms in order to generate the growth needed
Chart 1. 1. Real GDP growth: 1996-2007 (Pct.)
2.2
4.9
3.5
6.4
5.55.8
-3.2
7.0
5.1 5.0
6.57.0
5.0
3.6
2.4 2.4
3.5 3.5 3.3
4.2
6.05.6 5.9
6.2
-4.0
-2.0
0.0
2.0
4.0
6.0
8.0
1996 1997 1998 1999 2000 2001 2002 2003 2004 2005 2006 2007
Gambia Sub-saharan Africa
Source: DDP, World Bank, September 2008 Update.
6 - This statistical update was released in December 2008 and takes into account newly released estimates of PPP which imply substantial adjustments in rankings for many countries. This 2008 HDI represents statistical values for the year 2006.
23

to foster significant poverty reduction.
11. Since 2003, the GoG has made a serious effort at trying to restore macroeconomic stability; monetary policy has become tighter and fiscal policy more prudent. Monetary policy has improved steadily and the inflation rate dropped from 17 percent in 2003 to about 3.2 percent in 2005. However, inflationary pressures grew in 2007 when food prices surged as a result of disruptions in the supply of some foodstuffs7 and increases in import costs (IMF 2009b). As a result, the inflation rate was around 5.5 percent in 2007 and 4.6 percent in 2008. Fiscal performance has been irregular. Although it improved from 2005 onwards, the overall budget balance turned to a 1.5 percent of GDP deficit in 2008, mainly due to lower import tax revenues8.
1.1.2. A service based economy which attracts large FDI inflows.
12. The structure of the Gambian economy has changed very little over the last two decades and a half (Chart 1.2). The economy is still largely based on agriculture which accounts for about 31 percent of GDP. An estimated 80 percent of the people are engaged in farming. Livestock rearing is carried out for local consumption, and 41 percent of cultivated arable area is given over to growing groundnuts, mainly for export. Services - including trading activities, transport, communications, and tourism - accounted for about 55 percent of GDP over 1996-2006. Trade and transport, and communications are the two largest components of the services sector. Tourism accounted for 19 percent of services and is Gambia’s primary foreign-exchange earner, providing a livelihood for a large proportion of the Coastal population9.
Chart 1. 2. GDP structure (1985-2006).
29.9 31.4
6.6 5.6
6.8 7.8
56.7 55.2
0%
10%
20%
30%
40%
50%
60%
70%
80%
90%
100%
Average 1985-95 Average 1996-06
Agriculture Manufacturing Other industries Services
Source: DDP, World Bank, September 2008 Update.
13. The industrial sector remains small, at around 13 percent of GDP in 2006. By the end of 2006, Gambian manufacturing consisted of 42 firms mostly located in the KMC area (81 percent of them). Manufacturing activities includes ground processing, soap making, cottage industries, a foundry, cement bagging and bicycle assembling. There is also a small-scale light industry (furniture, fish processing, metal works) and carving activities.
14. In recent years, the Gambia has enjoyed high FDI inflows reaching up to 16 percent of GDP in 2006. Both as a share of GDP and in per capita terms, FDI in the Gambia has - on
7 - From Guinea and Guinea Bissau.
8 - About two-thirds of the decline came from taxes on non-oil imports, reflecting the relatively appreciated value of the dalasi in the first three quarters of 2008 (compared to the same period in 2007) and possibly a decline in imports for re-export (which comprise consumer goods that attract high import duties). Revenue from petroleum products also fell, as adjustment in retail prices did not keep pace with rising world prices. Furthermore, measures to compensate for revenue loss from the elimination of sales tax on rice imports proved less effective than expected (IMF 2009b).
9 - It is estimated (World Bank 2007b) that hotels generate more than 2700 equivalent full-time jobs. Formal and informal employment in the sector is estimated to be around 10,000 which compares with a total formal, private sector employment of 22,000.
24
average - been higher than in SSA as a whole (Chart 1. 3). Over the last decade, most of the FDI has benefitted the tourism sector as new facilities have been built and older ones refurbished. However, in recent years, the search for new natural-resource reserves has led to increased FDI to many African LDCs10, including The Gambia11, and was mainly directed at new oil exploration and mining activities (UNCTAD, 2007)12.
Chart 1. 3. Average foreign direct investments 1996-2006 (Net Inflows).
9.2
2.5
26.5
15.0
0.0
5.0
10.0
15.0
20.0
25.0
30.0
The Gambia SSA The Gambia SSA
FDI net inflows (% of GDP) Net FDI inflow per capita (current USD)
Source: DDP, World Bank, Septembre 2008 Update.
1.2. RECENT REFORMS IN THE PRIVATE SECTOR AREA.
15. Based on the premises of market-based policies and private sector development, the government of the Gambia established in 199413 the Vision 2020 document which still underlines the overall development objectives of the country. This orientation was further reaffirmed when the government outlined “an Enabling policy environment – to promote economic growth and poverty reduction” as its first pillar of the 2007-2011 PRSP II14.
1.2.1. Trade policy.
16. Like in many other LDCs, trade taxes in The Gambia are a tool to promote economic development while providing a substantial part of government revenues. However, a specificity of The Gambia - re-exports to the sub-region - imposes an additional constraint on the use of such a type of taxation. In effect, re-exports to the sub-region15 roughly amount to 70-80 percent of merchandise exports from The Gambia (World Bank 2007b) and contribute
10 - According to the 2007 World Investment Report, African LDCs which saw the largest increase in FDI include Burundi, Cape Verde, Djibouti, Ethiopia, The Gambia, Guinea-Bissau, Madagascar, Somalia and Sudan.
11 - The Gambia's natural resources consist of deposits of kaolin, tin, limonite, rutile, and zircon, though these remain largely unexploited (WTO 2004).
12 - This last type of FDI, which accounted for a large part of recent inflows, is largely immune against domestic conditions and is therefore not an indication of the quality of the investment climate in a country.
13 - The Vision 2020 policy document, originally drawn up in 1994, is still promoted as the key program for the country’s development. Its economic objectives are to achieve poverty reduction and food self-sufficiency, to strengthen and diversify the manufacturing base, and to develop an export-oriented industrial sector (EIU 2009b).
14 - The Republic of Gambia: Strategy for Poverty Reduction (PRSPII). Page 8.
15 - Goods imported into The Gambia and transported unofficially into Senegal and beyond.
25
substantially to government revenues as imported goods destined for re-export generally pay full duties when entering the country16. As a consequence, Gambian authorities have consistently sought to maintain trade taxes below those of neighboring countries in order to promote the country’s role as a regional entrepôt. Therefore, since independence, The Gambia has had a relatively liberal trade regime.
17. The Gambia has been implementing significant trade reforms since the mid-1980s that have - to an extent - further liberalized its trade regime. Under the Economic Recovery Program of 1985, the country dismantled almost all quantitative restrictions to trade, import prohibitions were maintained only on security, environmental, health, and morality grounds, as well as under international conventions to which the country was (and still is) a party. In 1998-2000, the implementation of a CET in the eight WAEMU countries led to significant declines in trade taxes, posing a new challenge to the role of The Gambia as an entrepôt, and led to substantial further liberalization (World Bank 2007b). In 2000-2001, the 1998 tariff structure with 30 rates ranging from zero to 90 percent was therefore replaced with four rates running from zero to 18 percent (WTO 2004). Overall, it is estimated that agriculture is the most protected sector, with applied tariffs averaging 14.4 percent in 2003, in contrast to non-agricultural products at 12.3 percent (WTO 2004).
18. After numerous delays, ECOWAS has agreed in 2006 to the adoption of a common external tariff (CET) as part of its move to a customs union. This will involve the adoption of the WAEMU tariff structure of 0, 5, 10, 20 (and now 35 percent) rates17, though with some room for changes in the assignment of products by tariff band. As a consequence, in 2006, The Gambia moved to align its tariff to the ECOWAS configuration. This move towards a customs union has however created new challenges as, to the extent that countries continue to harmonize import taxes within ECOWAS, The Gambia’s competitive advantage as an entrepôt could be further eroded if the country is not able to maintain its good comparative performance in terms of trade logistics.
1.2.2. Divesture of public assets.
19. The Gambia undertook a state-owned enterprise reform under the Gambia Divestiture Program. The major aim of this program was to facilitate the structural transformation of Gambian enterprises to ensure their sustainable improvement and increased impact in the accelerated development of the country.
20. The first phase of the privatization of State-owned enterprises took place between 1986 and 1994, under the Economic Reform Program, in which the government sold 60 of the state-owned enterprises. The second phase took place following the adoption of Vision 2020, after the parliament passed a Divestiture Act in 2001. The government planned to privatize the enterprises based on a two track approach and the targeted sectors were energy, communication, transportation, pension funds & housing finance, and agriculture.18
16 - The consequences of this policy is manifested by the fact trade taxes are even more important for The Gambia than for most other African countries, accounting for about half of tax revenues and 40 percent of all government income, although the dependence on trade taxes has fallen about 10 percentage points since the late 1990s (World Bank 2007b).
17 - The initial WAEMU tariff structure included four tariffs from 0 to 20 percent. However, in November 2008, an extra band (of 35 percent) request made by Nigeria on the ECOWAS Common External Tariff (CET) has been adopted by the West African Ministers of Trade and Finance.
18 - For the Gambia Divestiture Agency, track one consists of enterprises - mainly utilities – that are in need of substantial reform, and the privatization of which would require a substantial improvement in regulatory capacity. The second track consists of state-owned enterprises that can be divested without the need for major regulatory or legislative changes.
26

21. However, as of 2008/09, progress on privatization has been slow. There have been some regulatory reforms, namely the Gambia Public Utilities Regulatory Authority Act (2001) and the subsequent establishment of the Authority. The 2004 Electricity Act was supposed to liberalize the sector and let in private sector investment. However, this has only been partially implemented when private management was brought into NAWEC (public utility on water and electricity). In addition, the government has identified possible divestitures19, but again progress has been slow. More recently, the GoG sold off 50 percent of its stake in Gambia Telecommunications, along with its mobile-phone business, in 2007 to a private foreign company.
1.2.3. Incentives for investors: The Gambia Investment Promotion Act.
22. The Gambia Investment Promotion Act and Gambia Free Zones Act (2001) give both foreign and local investors incentives and guidelines (See Box 1). The country recognizes the need to support and encourage both local and foreign investors. The judicial system supports the inviolability of contracts and foreign investors are treated like domestic investors. The only tax that specifically applies to foreign investors is the payroll tax, which is paid for every expatriate employee of a company. There are no laws or regulations that limit or prohibit foreign investment, participation or control.
23. Funded by the World Bank, the Gambia Gateway Project has been established in 2002. The aim of this project was to lay the foundation for expanded private investment export-oriented production and employment, through the establishment of the Free Zone and an improved institutional environment. This objective was to be achieved by (i) establishing a self-sustaining GIPFZA, (ii) marketing and facilitating local and foreign investments in well-targeted economic sectors, (iii) developing a Pilot Free Zone (FZ) at the airport20, (iv) promoting privately financed and operated FZ-related businesses and (v) helping the government to implement its divestiture strategy.
24. GIPFZA’s activity in promoting investment has initially been satisfactory. Since the establishment of GIPFZA in 2002, 50 of the companies awarded an SIC have become fully established and operational. They belong to various sectors such as agriculture, fisheries, manufacturing, ICT, tourism and services. They have created nearly 3000 direct jobs. By the end of 2008, total actual investment of all projects registered with GIPFZA is estimated at about $130 million21. The program has been restructured in 2008 and is still on-going.
19 - These include, inter alia, the Gambia Groundnut Corporation; the Maintenance Services Agency, the National Water and Electricity Company, and the government’s stakes in the Gambia Cotton Company and Banjul Breweries.
20 - The establishment of free zones is an integral part of the Gambia Gateway Project, and the 2001 Free Zones Act provides the necessary legal framework. An area measuring 164 hectares at Banjul International Airport has been designated a Free Economic Zone (FEZ). Almost 9 hectares have been developed with factory space, access roads and electricity. There are also some bonded warehouses at the Banjul port which have not yet been designated as FEZs. The following concessions are extended to investors in the FEZs:
exemption from import duty, excise duty and sales tax on raw materials, intermediate goods and supplies for manufacturing imported into the zones;
exemption from import duty, excise duty and sales tax on goods produced within or imported into the zones except those for consumption inside the customs territory;
exemption from import duty on capital equipment; exemption of corporate tax or income tax for business involved in trading activities in the zones for the first 10 years, and
thereafter the rate shall not exceed six percent per annum; corporate tax on business in tourism activities within the zones will be charged flat corporate tax rate of 10 percent, and this rate
will be guaranteed over a period of 20 years; exemption from withholding tax from dividends and other payments during the tax holiday period; and licensed companies will be free to bring in foreign staff, whose work permits will be arranged by GIPFZA.
21 - Investment Climate Statement (2009). The Gambia, Bureau of Economic, Energy and Business Affairs, US Department of State, Washington DC.
27

Box 1. The Gambia Investment Promotion Act and Gambia Free Zones Act.
The Gambia Investment Promotion and Free Zones Agency (GIPFZA) administer The Gambia Investment Promotion Act, signed into law in 2001. The objectives of the GIPFZA are to promote the country as a trade gateway and investment haven by:
providing an attractive business environment and incentives for business activities in The Gambia;
establishing a "one-stop shop" for investors, where every government department, agency, or other relevant body, cooperates to provide permits, exemptions, authorizations, licenses, land, or other accommodation required to establish a business enterprise;
attracting, promoting, and increasing the manufacture of goods and trade in goods and services;
coordinating, promoting, and facilitating investment in The Gambia; and advising government on investment policy and related matters.
Investments must fulfill the following criteria to qualify for special investment status:
investment outlay in fixed assets of at least $100,000 or its equivalent in Gambian dalasis or other freely convertible currencies at the time of application;
investment activities targeted in one of the following priority sectors: agriculture, fisheries, tourism, forestry, manufacturing, energy, skills development, financial and off-shore services, health and veterinary, river and air transportation, information technology, minerals exploration and exploitation, and communications;
expectation of new earnings or savings of foreign exchange through exports, resource-based import substitution, or other activities;
utilization of local materials, supplies and services;
creation of employment opportunities in The Gambia;
introduction of advanced technology or upgrading of indigenous technology; and
contribution to locally or regionally balanced socio-economic development.
The Act requires special investment status be conferred on approved investment proposals. Such investments will be awarded special investment certificates (SIC) and will be entitled to the following incentives:
exemption from customs duties and sales tax on importation of capital equipment, machinery, appliances, furniture, and fittings to be used in establishing the investment;
exemption from customs duty and sales tax on approved quantities of semi-furnished products, spare parts, raw materials and supplies and consumables involved in the production process;
exemption from withholding tax on dividends for five years;
exemption from turn-over tax for five years;
preferential treatment for the allocation of land for the site of the proposed investment and infrastructure facilities (utilities and telephone); and
a special scheme of accelerated depreciation.
The Act provides for negotiated incentive packages above those specified for such period as deemed necessary for major or strategic investment. The Act makes no discrimination between foreign and local investors and there are no requirements that nationals own shares or that the share of foreign equity be reduced over time.
Source: Investment Climate Statement (2009). The Gambia, Bureau of Economic, Energy and Business Affairs, US Department of State, Washington DC.
28

1.3. CHALLENGES FACED BY THE GAMBIA.
25. In spite of the recent growth and of improvements in overall management of the economy, The Gambia still faces specific challenges, especially as the economy is undiversified and highly vulnerable to external shocks. In effect:
Growth still largely depends on the fate of the agricultural sector. In recent years, there has been significant growth in important sectors such as tourism, industry, re-export trading activities and construction. However, none of these can outweigh the negative effects of an eventual poor agricultural season (EIU 2009b).
The re-export sector is becoming less attractive over time. The recent implementation of CETs at the WAEMU and ECOWAS level has eroded Gambia’s advantage as a trade hub (World Bank 2007b) and, owing to a poor business environment and ageing port infrastructure; the sector is at risk of loosing competitiveness (IMF 2009b). Furthermore, the fate of this sector also largely depends on relations between The Gambia and Senegal as issues regarding passenger traffic between the two countries have plagued travelers for the last few years and re-export trade has suffered from delays and occasional stoppage at the Senegalese border (EIU 2009b).
The tourism sector, which has enjoyed significant growth and FDI in recent years, is highly dependant upon the arrival of western-European tourists. However, such inflows depend both on the socio-economic stability in The Gambia22 and the economic outlook in client countries. However, the latter is currently bleak. The United Kingdom - the main tourism market for The Gambia which accounts for 45 percent of tourists arrivals - is set for a major recession in 2009 and the outlook is similar for Scandinavian countries of Norway, Denmark and Sweden which account for about 17 percent of tourists’ arrivals. Therefore, tourist arrival numbers fluctuate greatly and can be expected to decline in the near term.
26. This underlines a major need for economic diversification which can be facilitated, besides sectoral action in promising sectors (such as fishing, horticulture, sesame and cashew nuts), by improvements in the overall investment climate of the country. Such an improvement will allow for a better allocation of resources, the mechanisms of comparative advantage to play their role and in the end will enhance prospects for future growth. As shown below, a lot remains to be done in this area.
22 - After the 1994 events, most Western European governments advised their nationals against travelling to the country. As a result, for most hotels, the overall occupancy rate in the first half of 1995 was estimated at around 20 percent compared to 100 percent the previous year. In a similar way, unrest in 2000 saw tourist numbers fall after their late 1990s recovery (charter tourist arrivals fell from 121,797 in 1999 to 75,209 in 2001, (EIU 2009b)).
29

1.4. GAMBIA’S BUSINESS ENVIRONMENT ACCORDING TO INTERNATIONAL RANKINGS.
27. Businesses in the Gambia have benefited from a growing economy and from a gradual liberalization process undertaken by the GoG in the past two decades. Although positive, these developments are not still sufficient to fundamentally change the perception of investors towards the country and its investment climate, as shown by several of the available rankings.
28. In effect, based on the 2009 Index of Economic Freedom (Chart 1.4), Gambia is ranked 112th out of 179 economies. This is a small improvement compared to the ranking of the country at the time of the enterprise survey in 2006. For that year, the 2007 IEF ranked The Gambia 123 over 159 countries.
29. The Gambia's 2009 economic freedom score is 55.8 (on a maximum of 100). In the terminology of the IEF, the Gambian economy is considered as “mostly unfree”. The Gambia is ranked 15th out of 46 countries in the Sub-Saharan Africa region, and its overall score is lower than the world average. Out of the 10 factors on which the ranking is based, Gambia scores the highest on government size23 and monetary freedom24.
Chart 1. 4. International rankings for Gambia.
Ranking according to the 2009 IEF.
1
61
105
110
115
132
179
112
114
165
0 50 100 150 200
Honk Kong
South Africa
Brazil
Senegal
Gambia, The
Mali
Benin
China
Guinea-Bissau
North Korea
Best performance
Worst performance
Source: "Index of Economic Freedom 2009", Heritage Foundation.
Ranking according to the 2008-09 GCI.
1
30
45
64
117
87
106
96
134
0 50 100 150
United States
China
South Africa
Brazil
Gambia, T he
Senegal
Benin
Mali
Chad
Best performance
Worst performance
Source: "Global Competitiveness Index 2008-09", World Economic Forum.
30. The World Economic Forum, in its 2009 “Global Competitiveness Report 2008-2009”, ranks The Gambia 87th country out of 134 countries (Chart 1.4). Again, this is a relatively small improvement compared to the ranking of the country at the time of the enterprise survey in 2006. For that year, the 2007 GCI ranked The Gambia 102 over 125 countries.
23 - According to the 2009 IEF: “Total government expenditures, including consumption and transfer payments, are moderate. In the most recent year, government spending equaled 29.2 percent of GDP. A consistently high fiscal deficit makes sound public finance management increasingly critical to economic growth. Most leading companies are still controlled or majority-owned by the government.”
24 - According to the 2009 IEF: “Inflation is moderate, averaging 4.3 percent between 2005 and 2007”.
30

According to the 2009 WEF ranking, the most important constraints to do business in The Gambia are i) access to financing, ii) the education of the workforce, iii) taxation and iv) infrastructures.
31. Gambia is also ranked 130 out of 181 countries in the 2009 Doing Business Indicator report, with little change in its overall ranking in recent years. This suggests that regulations remain fairly complex and it is a questionable signal sent to investors, domestic and foreign alike.
Chart 1. 5. Ease of doing business index for 2008.
1
32
83
125
169
181
130
166
149
179
0 50 100 150 200
Singapore
South Africa
China
Brazil
Gambia, The
Senegal
Mali
Benin
Guinea Bissau
Congo, Dem. Rep.
Best performance
Worst performance
Source: “Doing Business 2009”, World Bank.
1. 5. CONCLUSION.
32. Macroeconomic data suggest that, at least until 2007/2008, Firms in The Gambia operated in an improved macroeconomic environment as growth had been sustained for quite a few years and the GoG was improving its handling of the economy. In addition, in recent years, some reforms had been implemented to improve the business environment in the country, although at a moderate pace as suggested by the ranking of the country according to several well-know indicators (WEF, IEF, and Doing Business).
33. However, despite the previous, the economic performance of The Gambia still depends largely on the agricultural output and on the performance of the service sector, including i) a trading sector which is largely dependant on the evolution of trade reforms in the sub-region (WAEMU and ECOWAS CETs) and relations with Senegal, and ii) the Tourism sector whose level of activity depends a lot from the worldwide economic situation. In addition, the contribution of the secondary sector to growth is still small. 34. This suggests that the previous waves of reforms, although positive, have not improved yet enough investors perception about the country and that additional work is needed to ensure further improvement in the investment climate.
31
2 MANUFACTURING’S FIRM PERFORMANCE IN THE GAMBIA
35. Macroeconomic performances in The Gambia have been correct in recent years as shown in the previous chapter. However, the economy still exhibits some structural weaknesses (such as a large reliance on the agricultural sector and on the performance of the services sector). Further developments in the services sector - and in the secondary sector too - will require cross-cutting improvements in the investment climate of the country. This chapter aims at assessing the performance of Gambian firms in order to define the initial conditions of the productive sector in the Gambia.
36. This chapter therefore compares the performance of firms in The Gambia with firms in selected comparator countries and in other countries in Sub-Saharan Africa. The different measures of firm performance are intended to provide an indication of how competitive firms in The Gambia are in both international and domestic markets. The analysis is confined to the manufacturing sector as i) measures of productivity/efficiency for this sector are well defined from a technical point of view and ii) comparative data are widely available through the enterprise survey dataset. While this chapter provides an overview of how well firms in The Gambia perform, other subsequent chapters assess how elements of the investment climate affect their competitiveness.
2.1. FIRM PERFORMANCE.
37. As a first step in analyzing firm competitiveness, this section examines several traditional measures of firm productivity. The chapter first examines labor productivity - the amount of output per worker that firms produce. It then looks at capital stock and capital productivity and compares labor productivity with labor costs, to obtain the unit labor costs. These measures are compared across different firms within The Gambia, and also with firms in other countries. This is followed by an analysis of total factor productivity, a measure of firm performance that takes into account use of both capital and labor.
2.1.1. Labor Productivity.
38. Labor productivity is the value of output that the firm produces excluding the value of raw materials (such as iron or wood) and intermediate inputs (such as engine parts or textiles) used to produce the output divided by the number of workers. Labor productivity is higher in firms that produce more output with fewer raw materials and fewer workers. Differences in labor productivity can be the result of differences in technology, differences in organizational structure, differences in worker skills, differences in management ability or differences in the amount of capital that the firm uses. Because labor productivity does not take the use of capital (i.e., machinery and equipment) into account, it will generally be higher in firms that use capital in place of labor (i.e., firms that are capital intensive).
39. Labor productivity is low in The Gambia even when compared to other low income countries in Sub-Saharan Africa. Value added per worker is about $1000 per worker for the median manufacturing firm in The Gambia. Although higher than in Ethiopia and close to productivity in Guinea-Conakry, Mozambique and Madagascar, it is only about one-ninth of
32

value added per worker in the best performing low income countries in Sub-Saharan Africa such as Senegal.
Chart 2. 1. Labor productivity is lower in The Gambia than in other low income countries in SSA.
27,548
6,464
8,989
2,770
1,574
12,089
1,023
18,318
0 5,000 10,000 15,000 20,000 25,000 30,000
Hangzhu (China)Brasil
Shenzen (China)Morocco
KazakhstanIndonesia
South AfricaNamibia
CameroonBotswanaMauritiusSwaziland
Cap VerdeAngola
Lesotho
SenegalCameroon
MaliNigeriaKenya
Burkina FasoZambia
NigerEritrea
MauritaniaTanzania
BeninMalawi
DRCRwandaUgandaBurundi
Guinea-BissauMadagascarMozambique
Guinea-ConakryGambia, The
Ethiopia
Source: Investment Climate Surveys, World Bank.
Note. Data were collected between 2002 and 2006 depending on survey period for each country. Data collected prior to 2006 is converted to 2005 figures using GDP deflators. Several African countries with investment climate data on labor productivity are excluded from the graph for presentational purposes. The exclusions do not have a large impact on the Gambia’s relative position - all have higher productivity than The Gambia.
40. The Gambia compares even less favorably with the mostly middle income comparator countries. Although labor productivity is only slightly lower than in Guinea-Bissau, it is less than one-tenth of the level observed in China (Shenzen region) and much lower than in Brazil
33

or South Africa. In this respect, it is clear that Gambian firms have a long way to go before they catch up with firms in these other countries in terms of labor productivity.
2.1.2. Labor Costs and Unit Labor Costs.
41. Although labor productivity is important, it can vary for a number of reasons. For example, labor productivity will generally be high in firms with highly skilled or educated workers. Since highly skilled workers will generally demand higher wages than their less skilled counterparts, firms can be relatively productive but might not be highly competitive due to the cost of paying their highly skilled workforce.
42. To get an idea of how competitive a firm is, it is important to also look at firm wages—firms that are not highly productive in terms of output per worker can remain competitive if wages are low. Labor costs per worker are about $580 (in 2005 US$) for the median firm in The Gambia. As with labor productivity, this is lower than in other countries in Sub-Saharan Africa. Among the 31 countries in Sub-Saharan Africa with comparable data, wages are lower in The Gambia than in all countries but three (Madagascar, Ethiopia, and Guinea-Conakry).
43. Labor costs are also low compared to the comparator countries (see Chart 2.2). Wages in the manufacturing sector are about one-fifth of wages in neighboring Senegal and are about half of wages in China. Wages in Guinea-Bissau and Benin are about 45 percent higher.
Chart 2. 2. Labor costs in the Gambia are low and unit labor costs are relatively high.
$851
$880
$1,222
$1,326
$2,546
$13,754
$580
$0 $5,000 $10,000 $15,000
Gambia, The
Guinea-Bissau
Benin
Mali
China
Senegal
South Africa
labor cost per worker (2005 US$)
46%
18%
25%
34%
40%
45%
51%
0% 20% 40% 60%
Gambia, The
Mali
Senegal
Benin
Brazil
South Africa
Guinea-Bissau
labor cost per worker (% of value added)
Source: Investment Climate Surveys, World Bank.
44. Since both labor productivity and labor costs are low in The Gambia, it is difficult to assess the net impact on firm competitiveness. Unit labor costs (labor costs as a percent of value-added) are a measure of labor costs that make it easier to assess the net impact of labor costs on competitiveness by taking difference in productivity into account when assessing labor costs. Unit labor costs are higher when high labor costs are not fully reflected in high
34
productivity. When unit labor costs are higher (i.e., when labor costs are higher compared to productivity), firms will find it more difficult to compete on international markets than when they are lower all else equal. Although unit labor costs are not the only important factor in this respect—they do not take the cost of capital or capital intensity into account, they are probably a better measure of competitiveness than labor costs alone.
45. Unit labor costs are high in The Gambia - that is although wages are low, productivity is relatively lower. For the median firm in The Gambia, labor costs are equal to about 46 percent of value-added. In comparison, unit labor costs are between about 25 percent and 40 percent of value added for the median firm in most country in Sub-Saharan Africa. In fact, unit labor costs are higher in only four of the thirty-one countries where recent ICA data are available. They are also high compared to most of the comparator countries—although they are relatively close to labor costs in South Africa (45 percent) and slightly lower than in Guinea-Bissau (51 percent). This suggests that firms in The Gambia will find it difficult to remain competitive on international markets.
2.1.3. Capital Intensity.
46. Differences in labor productivity often reflect differences in capital use. Firms that have more capital generally produce more output per worker than firms with less capital. For example, they might substitute capital for labor (e.g., automating supply lines). For this reason, this chapter also looks at capital intensity, how much capital per worker the firm has, and capital productivity, how much the firm produces relative to the capital it has.
47. In general, it is more difficult to measure capital than labor (i.e., it is relatively easy to measure wages and number of workers), making it more difficult to make international comparisons of capital intensity. That is, most machinery and equipment is large and relatively long-lived, providing services over a long period of time. As capital ages, its value depreciates. In practice, this is difficult to measure because spot markets for used capital are thin. As a result, managers might not know how much it would cost to replace old machines with equally productive new machines or how much they could sell their machinery or equipment for. Although accounting rules for depreciating machinery and equipment exist, these often bear little resemblance to true rates of economic depreciation. Further, the mostly small firms in the investment climate surveys often do not keep detailed audited company accounts making it even more difficult to measure capital. The end result is that it is generally more difficult to compare capital intensity and capital productivity across countries than to compare labor productivity.
48. The Investment Climate Survey collects several measures of capital. One of these is the sales value of machinery and equipment, the amount that the manager estimates it would cost to replace his equipment with similar equipment. A second measure is the net book value of capital. This is the amount of machinery and equipment that the firm has as recorded in the firms’ balance sheet. As the machinery ages, the manager applies standard accounting depreciation rules to calculate its current book value. Although book value has the advantage that it is calculated using standard rules and is not merely the managers’ estimate. The most notable problem is that accounting depreciation often bears little resemblance to economic depreciation. One of the results of this is that for firms with only old machinery, the net book value of capital is often zero or very close to zero. Since the firm is still using the equipment, the real value of services that the capital provides is clearly not zero. A second problem is that although large firms keep detailed company accounts, many of the small firms covered
35

by the investment climate survey do not keep detailed audited accounts. Of the 33 manufacturing firms in this sub-sample, only 10 kept audited accounts. For firms without detailed audited accounts, it is not clear that the estimate of the sales value will be much worse than the estimate of book value. For this reason, this section compares sales value rather than net book value, when sales value is available. For many countries outside of Sub-Saharan Africa, only book value has been collected, so for comparisons with the comparator countries, the report looks at net book value.
49. In practice, whether capital is valued at net book value or sales value, firms in the Gambia use relatively little capital per worker - that is, they are highly labor intensive. When compared to the other countries in Sub-Saharan Africa, firms in The Gambia use less capital per worker than in most of the other countries (see Chart 2.3). In part, this might account for low labor productivity (because firms use little capital per worker) and for high unit labor costs (because firms use little capital, they can remain profitable despite high unit labor costs).
Chart 2. 3. Capital intensity is also lower in Gambia than in other low income countries in SSA.
$196
$7,292
$933
$0
$5,000
$10,000
Gui
nea-
Cona
kry
Cong
o, D
R
Buru
ndi
Gam
bia,
The
Gui
nea-
Biss
au
Mad
agas
car
Ethi
opia
Uga
nda
(200
5)
Ang
ola
Burk
ina
Faso
Mal
awi
Rwan
da
Nig
er
Tanz
ania
Moz
ambi
que
Mal
i
Mau
ritan
ia
Sene
gal
Ken
ya
Beni
n
Eritr
ea
Zam
bia
Cam
eroo
n
Capi
tal p
er w
orke
r (20
05 U
S D
olla
rs)
Source: Investment Climate Surveys, World Bank.
Note: Data were collected between 2002 and 2006 depending on survey period for each country. Data collected prior to 2006 is converted to 2005 figures using GDP deflators.
Several African countries with investment climate data on capital per worker are excluded from the figure for presentational purposes. The exclusions do not have a large impact on the Gambia’s relative position—all have more capital per worker than Gambia.
50. Although capital per worker gives an idea about how capital intensive firms are, it does not provide much information on how productively that capital is being used. Capital productivity, the ratio of value added to the net book value of machinery and equipment, measures how productively firms use capital. It is analogous for capital to (the inverse of) unit labor costs for workers. Capital productivity is higher in firms that produce a lot of output with only a small amount of machinery and equipment. Hence, capital productivity is generally higher for labor intensive firms (i.e., firms that rely relatively heavily on labor to produce their output) since they produce a lot of output, due to their heavy use of labor, with relatively little capital.
36

51. Data show that, despite being relatively labor intensive, capital productivity is not especially high for the median firm in The Gambia (Chart 2.4). Although higher than in Benin, it is lower than in the other countries, where firms are generally more capital intensive than in the Gambia.
Chart 2. 4. Firms in The Gambia are labor intensive but capital productivity is not particularly high.
$434
$871
$2,191
$6,597
$206
$0 $2,500 $5,000 $7,500
Gambia, The
Guinea-Bissau
Benin
Brazil
South Africa
capital per worker (US$)
1.7
2.5
3.1
4.2
5.0
2.6
0% 200% 400% 600%
Gambia, The
Benin
Malaysia
Guinea-Bissau
South Africa
Brazil
capital productivity (capital over value added)
Source: Investment Climate Surveys, World Bank.
Note: Capital is the book value of machinery and equipment. This measure is used rather than the replacement value, because the replacement value is not available for most countries.
2.1.4. Factor productivity by types of firms.
52. Because the manufacturing sample is extremely small - only about 33 manufacturing firms25 - it is difficult to present detailed information on firm performance by firm type. For example, there are too few garment firms and too few large firms with over 100 employees to break figures out for these groups separately. Similarly, there are only a few foreign-owned enterprises in the sample, making it difficult to compare productivity between foreign and domestic firms. Keeping this is in mind, Table 2.1 presents some breakdowns for groups with at least five observations. These numbers should be treated with extreme caution given the very low number of observations. In practice, most differences are not statistically significant at conventional significance levels. That is, the differences could be due to random sampling variation rather than actual differences between the groups.
53. In contrast to most countries, where small enterprises are less productive than medium-sized and large enterprises, median labor productivity appears to be slightly higher for small enterprises in The Gambia than for medium-sized and large enterprises. It is important to note that the sample of medium-sized and large enterprises is very small (only about six enterprises with all data available). Not surprisingly, given the small number of observations, the difference is not statistically significant. Although medium-sized and large enterprises
25 - This small sized sample is a reflection of the small size of manufacturing in the country. At the time of the survey, 42 manufacturers were in activity in the Banjul and KMC areas. This random sample, albeit small, accounts for 78.6 percent of manufacturing firms.
37

generally report being capital intensive that small enterprises (i.e., they have more capital per worker), the difference again is not statistically significant. Similarly, although as in most countries where investment climate surveys have been completed, labor productivity and capital intensity are higher for exporters than non-exporters, the differences are relatively small (about $1600 and $2700 for exporters compared to roughly $900 and $1900 for non-exporters). Moreover, the difference is also not statistically significant at conventional significance levels.
54. One difference that is statistically significant is that firms with university education managers are more productive than firms without university educated managers. The median firm with a university educated manager produces over $2700 of value added per worker, compared to about $900 for firms with managers with only a secondary education and $700 for a firm with a manager with a vocational education. The difference between firms with managers with a secondary education and firms with managers with vocational education is not statistically significant. In part, this could be because firms with university educated managers are more capital intensive.
Table 2. 1. Median productivity by industry and size in Gambia.
Value-Added per Worker
Labor cost per worker Unit labor cost Capital per
worker (rep)Capital
Productivity (rep)
All $1,023 $580 0.46 $2,041 0.41Sub-sector Furniture $1,629 $630 0.54 $2,041 0.32 Metal $670 $437 0.57 $1,050 0.65 Food and Beverage $1,858 $672 0.30 $5,468 0.53 Other $932 $630 0.53 $2,680 0.56Size Very Small/Small $1,067 $580 0.46 $1,329 0.53 Medium/Large $944 $759 0.42 $5,468 0.18Manager Education Secondary $944 $553 0.55 $787 0.53 Vocational $749 $277 0.35 $2,500 0.19 University $2,725 $1,445 0.40 $5,468 0.32Exports Exporter $1,645 $1,009 0.40 $2,680 0.31 Non-Exporter $944 $553 0.46 $1,909 0.53
Source: Gambia Investment Climate Survey, World Bank.
Note:
All values are medians for enterprises with available data. Value added is calculated by subtracting intermediate inputs and energy costs from sales from manufacturing. Workers include both permanent and temporary workers. Capital is the replacement value of machinery and equipment (i.e., the amount it would cost to replace the firm’s machinery and equipment with new machinery and equipment).
Because this measure of capital is only available for some countries, figure below use book value of capital instead. Labor cost is the total cost of wages, salaries, allowances, bonuses and other benefits for both production and non-production workers. Unit labor costs are labor costs divided value-added and capital productivity is value added divided by the book value of machinery and equipment.
38

2.2. TOTAL FACTOR PRODUCTIVITY.
55. A natural question is what the net impact of these differences is - i.e. does the low level of labor productivity in The Gambia reflect the low capital intensity or is it due to something else? This can best be answered by looking at total factor productivity, a measure of productivity that takes into account how capital intensive firms are. The annex to this chapter discusses how this measure of productivity is calculated.
56. After controlling for differences in productivity due to differences in capital use, firm size, the use of different factors of production, and sector of operations (i.e., using results from column 1 of Table A.2.3), enterprises in the Gambia remain less productive than firms in the comparator countries (see Chart 2.5). That is, the relatively low labor productivity observed for the median firm in the Gambia cannot be explained completely by the low capital intensity among firms in the Gambia.
57. On average, firms in Guinea-Bissau are about 20 percent more productive than firms in The Gambia, firms in Benin are twice as productive, and firms in South Africa over six times as productive. Overall, productivity in the Gambia also remains below most other countries in Sub-Saharan Africa for which comparable data are available. Of the 23 countries in Sub-Saharan Africa for which comparable data are available, this includes seven middle-income countries, Gambia ranks 22nd in terms of total factor productivity. Although the difference between Gambia and many of the other low ranked countries within Sub-Saharan Africa is not generally statistically significant (that is, it could be due to sampling variation), the point estimates suggest that productivity is low even compared to other low income countries in Sub-Saharan Africa.
Chart 2. 5. Despite the low level of capital intensity, TFP remains very low in the Gambia.
0%
25%
50%
75%
100%
Sout
h A
fric
a
Braz
il
Nam
ibia
Swaz
iland
Botsw
ana
Ang
ola
Cam
eroo
n
Cape
Ver
de
Burk
ina
Faso
Tanz
ania
Beni
n
Gui
nea-
Cona
kry
Nig
er
Zam
bia
Mau
ritan
ia
DR
of C
ongo
Mal
awi
Leso
tho
Uga
nda
Rwan
da
Gui
nea-
Biss
au
Buru
ndi
Eritr
ea
Gam
bia
Ethi
opia
TFP
(as %
of T
FP in
Sou
th A
fric
a)
Source: Investment Climate Surveys, World Bank.
Note: Data were collected between 2002 and 2006 depending on survey period for each country. Data collected prior to 2006 is converted to 2005 figures using GDP deflators.
39

2.3. EXPORTING.
58. As well as giving an idea about how well firms in The Gambia are integrated into international markets, exporting gives additional information on how competitive firms are. In general, firms that are not competitive will find it hard to compete on international markets even if structural or real barriers to imports protect them in local markets.
59. Data suggest that manufacturing firms in the Gambia were less likely to export than firms in most of the comparator countries, which is consistent with the fact that most of the sector is domestically oriented. Whereas less than one in five enterprises in the Gambia exported any part of their output, about three in ten exported some part of their output in Benin and Brazil, close to half exported in Senegal and China and six out of ten exported in South Africa. Firms also exported only a relatively small part of their output—on average, only about 3 percent, lower than in any of the comparator countries.
Chart 2. 6. Few manufacturing firms from The Gambia export.
9%
19%
30%
31%
46%
52%
61%
18%
0% 20% 40% 60% 80%
Gambia
Guinea-Bissau
Mali
Benin
Brazil
Senegal
China
South Africa
Pct of firms exporting
3.9
7.3
7.8
13.7
14.1
23.7
26.0
3.3
0 10 20 30
Gambia
Guinea-Bissau
Mali
Brazil
South Africa
Benin
Senegal
China
Exports (Pct of sales)
Source: Investment Climate Surveys
Note: Data vary between 2002 and 2005, depending on survey period for each country.
60. Although manufacturing firms from the Gambia compare unfavorably with firms from the comparator countries with respect to exporting, they compare slightly more favorably with firms from other countries in Sub-Saharan Africa. Although firms from the Gambia were less likely to export than in 20 of 30 countries, firms from several countries (such as, Angola, Cape Verde and Ethiopia) were even less likely to export. Average exports were also lower for four out the 30 countries.
61. Although the comparisons with other countries in Sub-Saharan Africa are more favorable, it is important to note that few countries in Sub-Saharan Africa perform well in this respect - manufacturing exports from the region are low compared to countries in other regions. Second, firms from small countries tend to export more than firms from larger
40

countries. With small domestic markets, firms have to expand outside of the country to grow. The correlation between size and export also appears to hold in Sub-Saharan Africa (see Chart 2.7). In this respect, the Gambia lags even further behind the mostly larger comparator countries than the raw figures suggest.
Chart 2. 7. Firms in small countries are more likely to export than in large countries – making Gambia more of an outlier in this respect.
Source: Investment Climate Surveys, World Bank.
Note: Dark line is fitted line from regression of exports as percent of sales on population. Red square is point for Gambia.
2.4. PROFITABILITY.
62. At the enterprise-level, profitability is associated with better firm performance. Firms that are more productive and that have lower overhead costs will be more profitable than other firms because they manage to produce more output at lower cost. But at an industry or country level, high profitability could also reflect a lack of competition. When markets are less competitive, firms will be able to earn higher profits than in more competitive markets where profits will typically be competed away.
63. Although the investment climate survey does not collect any data on taxation, meaning that profits can only be calculated before taxation, it is possible to calculate before-tax measures of profitability in a consistent way for the most recent set of investment climate surveys. Because, as discussed earlier, capital is difficult to measure accurately, this section focuses on return on sales (profits over sales) rather than return on assets (profits over capital).
64. Although labor and other costs are low in dollar terms in The Gambia, productivity is also quite low. The net impact of this is that profitability is low (see Chart 2.8). In fact, close to one-quarter of firms reported pre-tax losses for 2005, higher than in any of the other countries in Sub-Saharan Africa for which comparable data were available. Overall, this is consistent with the earlier evidence suggesting that firms in Gambia are not highly competitive.
41

Chart 2. 8. Profitability is low in The Gambia.
31%28%
21% 20% 19% 19% 19%17% 17%
15% 14% 13% 12% 11% 11% 10% 9%
3%
0%
10%
20%
30%
40%
Swaz
iland
Nam
ibia
Tanz
ania
Bur
undi
Gui
nea-
Con
akry
Cam
eroo
n
Ang
ola
Mal
awi
Bot
swan
a
Con
go, D
R
Bur
kina
Fas
o
Uga
nda
Rw
anda
Nig
er
Cap
e V
erde
Gui
nea-
Bis
sau
Gam
bia,
The
Mau
ritan
ia
Ret
urn
on S
ales
Note: Data vary between 2002 and 2005, depending on survey period for each country.
Source: Investment Climate Surveys
2.5. CONCLUSION.
65. The previous analysis underlines the fact that manufacturing firms in The Gambia are not very productive: capital and labor productivity are low and therefore prevailing low wages do not translate into lower unit labor costs which make Gambian firms poorly competitive. In addition, TFP is usually low in Gambian manufacturing. Furthermore, few manufacturers export and profitability is low.
66. This low level of productivity can be explained by deficiencies in the business environment in the country which revolve around issues such as infrastructure provision, the working of factor markets and the regulatory environment. The remainder of the report is devoted to an analysis of these problems.
42
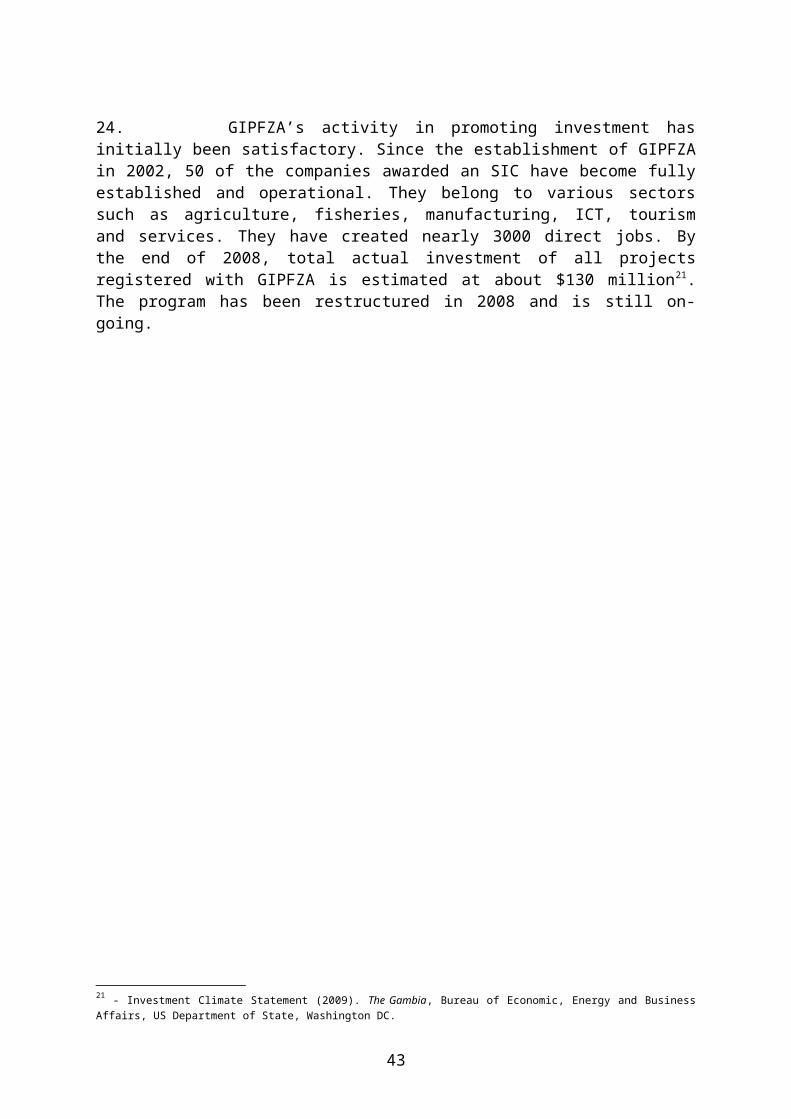
3 BUSINESS ENVIRONMENT IN THE GAMBIA: THE POINT OF VIEW OF FIRMS
67. An enabling business environment is critical to support the diversification of the economy, improvements in productivity levels, employment growth, private sector development and ultimately poverty reduction in The Gambia. This is clearly recognized by the GoG which states in its PRSP II that the Government has formulated a medium term macroeconomic framework that has as key objective, market-based incentives that are conducive to robust private sector activity and poverty alleviation (Republic of The Gambia 2006). To reach these objectives, it is necessary to have a better understanding of the status of the business environment in the country. This is the objective of this third chapter which describes the business environment in The Gambia using data from the investment climate survey and other sources of information. 68. The regulatory regime and its application, the availability and quality of infrastructure services constitute key elements of the business environment26. As a starting point for the analysis of the investment climate, this chapter looks at what firm managers say about the obstacles they face. Hence, we begin this chapter with a description of each key element of the investment climate in The Gambia starting with firm’s perceptions of the quality of these and we corroborate perceptions results with objective measures. We then benchmark the business environment using data from selected comparator countries in order to underline The Gambia’s competitive advantages and disadvantages. Such a procedure, cross-checking perception data with other objective data from the survey and external sources of information, allows compensating for some well known limitations of perception data (see Annex 3).
69. Much of the discussion will focus on the manufacturing sector; three other sectors that were surveyed will also be covered in detail throughout the chapter. However, as will be clear, many of the investment climate elements that are salient for the manufacturing sector are as important for the retail services, other services and the informal/micro sectors.
3.1 FIRM PERCEPTIONS: A STARTING POINT.
3.1.1. The Leading Constraints.
70. Chart 3.1 shows the top constraints listed by firms in the manufacturing, retail services, other services and informal sectors. The chart shows the percentage of firms in each sector that report a particular constraint as major or very severe.
The formal sector
71. Across the three formal sectors, the four perceived leading constraints are the same, although they differ a little in magnitude and ranking:
Electricity; Access to finance (availability and cost); Access to land; Tax Rates;
26 - Factor market issues are addressed in Chapter 4.
43

Chart 3. 1. The leading constraints to firm’s operations.(Pct. of firms which quote the item as a "major" or "very severe obstacle")
Manufacturing
78.5
58.3
31.8 30.6
17.7 15.2 15.2 12.1
0
10
20
30
40
50
60
70
80
90
Elec
trici
ty
Acc
ess t
ofin
ance
Acc
ess t
o La
nd
Tax
Rate
s
Prac
tices
of
com
petit
ors i
nin
form
al se
ctor
Tax
Adm
inist
ratio
n
Inad
equa
tely
educ
ated
wor
kfor
ce
Custo
ms a
ndTr
ade
Regu
latio
ns
Services
74.5
42.6
29.8 27.7 27.7 27.7
19.1 19.1
0
10
20
30
40
50
60
70
80
Elec
trici
ty
Acc
ess t
ofin
ance
Tax
Rate
s
Acc
ess t
o La
nd
Prac
tices
of
com
petit
ors i
nin
form
al se
ctor
Mac
roec
onom
icin
stabi
lity
Tax
Adm
inist
ratio
n
Busin
ess
licen
sing
and
Perm
its
Other
79.8
3430.9
24.521.3 20.2 19.1
14.9
0
10
20
30
40
50
60
70
80
90
Elec
trici
ty
Acc
ess t
ofin
ance
Tax
Rate
s
Acc
ess t
o La
nd
Prac
tices
of
com
petit
ors i
nin
form
al se
ctor
Mac
roec
onom
icin
stabi
lity
Busin
ess
licen
sing
and
Perm
its
Tax
Adm
inist
ratio
n
Informal
66.963.8
29.9 29.122 19.7
15.7 13.4
0
10
20
30
40
50
60
70
80El
ectri
city
Acc
ess t
o fin
ance
Mac
roec
onom
icin
stabi
lity
Acc
ess t
o La
nd
Tax
Rate
s
Prac
tices
of
com
petit
ors i
nin
form
al se
ctor
Tele
com
mun
icat
ions
Corr
uptio
n
Source: Gambia Enterprise Survey, World Bank.
72. Electricity: 75 to almost 80 percent of formal firms, depending on the sector, state that electricity is a major or very severe constraint to their operation. The state-owned NAWEC is in charge of the electricity sector in The Gambia and manages the Kotu, Farafenye and Kerewan electricity-generating plants. However, supply is inadequate, and power cuts are frequent because of insufficient generation and a historical lack of investment in infrastructure. Furthermore, there is only 5 percent of the population that has access to electricity mostly in urban and provincial centers (MSRA 2009 and EIU 2009a). In this context, it is hardly a surprise that electricity appear to be the most important constraint faced by firms at the time of the survey. NAWEC has a monopoly in the distribution and transmission of electricity, but in the generation segment an Independent Power Producer (IPP) was licensed in 2006. Following the approval of the National Energy Policy in 2005, and the enactment of the Electricity Act, the situation has improved somewhat since the survey in late 2006, in terms of generation capacity and reliability of supply, although this has implied a 30 percent increase in tariffs, making electricity far more expensive in The Gambia than in most other African countries (World Bank 2008a). This large increase illustrated the shift from a subsidy-based tariff policy to a cost-based approach. Note that
44
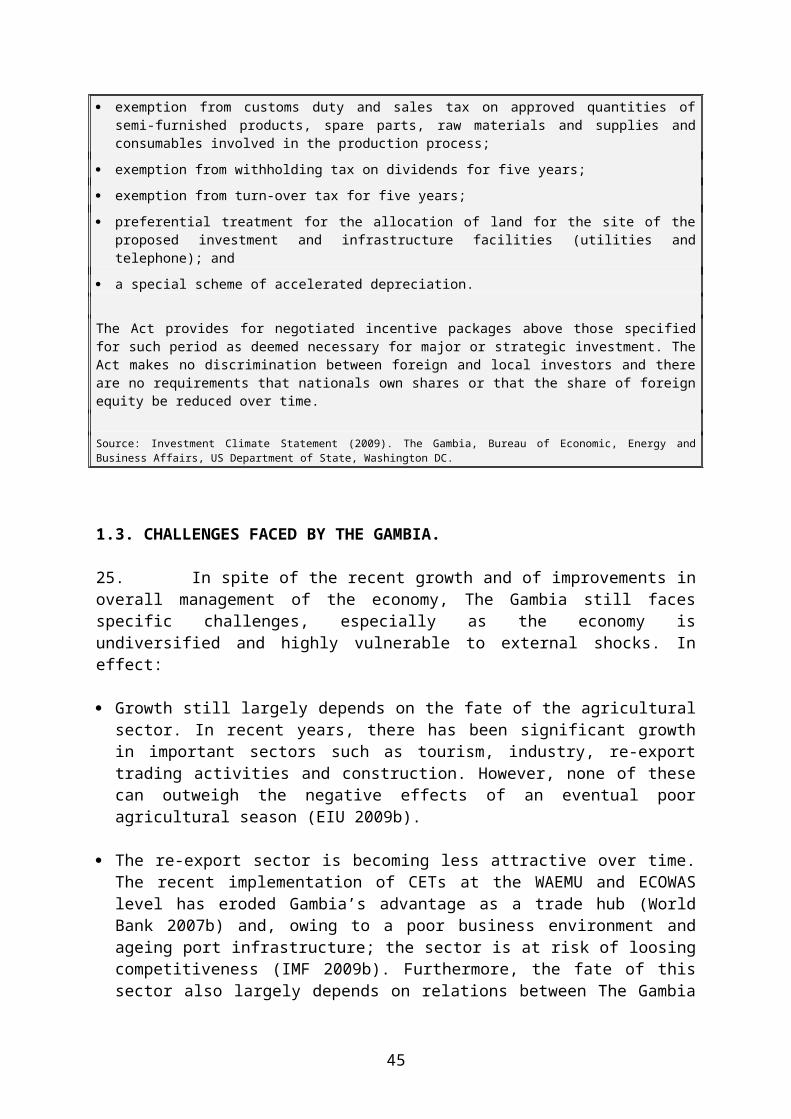
since 2005, the electricity sector is covered by a multi-sector regulatory agency (PURA)27. However, further research is needed to assess whether the multi-regulatory model has benefited PURA’s performance, and whether it has played an actual role in the infrastructure sector development, including in the two success stories of private sector participation in the energy and telecommunication sectors (MSRA 2009).
73. Access to finance: It is the second most important constraint for 34 to 58 percent of the formal firms. This is hardly a surprise as the financial sector, while being relatively healthy with a moderate level of nonperforming loans, is very concentrated in terms of assets and has a weak institutional capacity (EIU 2009b). In effect, there are only a few banks in The Gambia and the most important one - Standard Chartered Bank Ltd - accounts for more than half of deposits and loans. There is limited capacity to service SMEs and access to bank finance (loans and overdraft) is limited. As a consequence, banks do not provide significant credit to the local private sector; as of 2006-2007, the share of domestic credit provided to the private sector was only about 15.5 to 16 percent of GDP against an SSA average of roughly 65 percent of GDP.
74. Access to land: is the third most important issue, for 25 to 32 percent of the formal firms. The problem lies in the importance of the related regulatory burden. The chart below, based on DB data, shows the number of procedures, the cost of registration and time required to obtain or transfer a property title, in The Gambia, in New Zealand (the best performer for this indicator) and an average for SSA. Data show little changes for The Gambia in recent years from what was underlined at the time of the survey in 2006 (besides a decline in cost - from 7.6 percent of the value of the property in 2006 to 4.5 percent in 2008). Although the costs and number of procedures required in The Gambia are lower than the SSA average, they are still way above the values of the best performer. For example, while it takes 2 procedures in New Zealand to obtain or transfer a property title, it still takes 5 procedures in The Gambia.
Chart 3. 2. Property registration.
109.995.6
11.6 10.5 7 6.8
371 371
7.6 4.6 5 52 2 0.1 0.1 2 20
50
100
150
200
250
300
350
400
2006 2008 2006 2008 2006 2008Duration (days) Cost (% of property value) P rocedures (number)
Sub-Saharan Africa Gambia, the New Zealand
Source: Doing Business 2007 and 2009, World Bank
27 - The Public Utilities Regulatory Authority was created in 2001 and began its activity in 2005. PURA covers energy services (electricity, petroleum, gas), communication services (telecommunications, broadcasting, postal) water and sewage services.
45

75. Crucial to the access to land problems, a typical firm must still wait more than a year before it can obtain a full legal title (371 days in total). This is nearly four times the length of time required in the rest of SSA and much more than the processing duration in New Zealand (2 days). An examination of the time required for each step of the process provides insights to the source of land problem in The Gambia. The first procedure, application for ministerial approval for the transfer of leasehold, still takes 365 days28 (while all the remaining steps only take 6 days). The long wait is likely to be associated with significant costs.
76. Tax rates: 29 to 31 percent of formal firms consider tax rates as an obstacle to their growth. In addition, the administrative requirements of tax compliance constitute an important impediment. About 15 to 19 percent of all formal sector firms report the administration of taxation to be a major or very severe impediment. Taken together, tax rates and the bureaucratic costs associated with compliance are as important as access to finance.
77. Such perceptions are justified. In effect, in 2006 at the time of the survey, a medium sized firm in Gambia would have had to pay/collect the equivalent of 291 percent of its profits in taxes compared to 71 percent in SSA on average. This was the highest fiscal burden of the countries surveyed in the 2006 Doing Business country sample29. Tax obligations of a firm in The Gambia - as a share of profits - were nearly four times those of a similar firm in the next highest taxing countries: China and Brazil. Other comparator countries roughly pay/collect only half their annual profits in taxes. This is almost six times smaller than the tax obligations in The Gambia. The latest data available, for 2009, suggest that very little has changed since then and that the tax burden is still very high in the country (Chart 3.3).
Chart 3. 3. Tax burden in The Gambia (Pct. of profits)
71 69 72 77
291
48 50 48 3867 73 69 80
292
46 51 46 34
0
50
100
150
200
250
300
350
SSA
Beni
n
Braz
il
Chin
a
Gam
bia,
The
Gui
nea
Biss
au
Mal
i
Sene
gal
Sout
h A
fric
a
2006 2008
Source: Doing Business 2007 and 2009, World Bank
78. The source of The Gambia’s high tax burden is, according to the DB methodology, a 15 percent sales tax levied on total sales. Note that these sales taxes are not applied equally with many companies operating with paying sales taxes. This distorts the market and creates unfair competition. Data clearly shows that the so-called other taxes30 dominated the tax burden in The Gambia in 2006. In particular, a firm was expected to pay/collect nearly the
28 - The Government of The Gambia owns most of the land in Banjul and leases it out to individuals/corporations. There is no change in this sub-indicator between 2006 and 2008.
29 - See Annex 3 for details on the computation of the equivalent tax on profits, Table A.3.1.
46

equivalent of about 240 percent of its profits in other taxes. On the other components of the fiscal burden, tax rates on profits were the highest of the comparator group at about 35 percent, compared to 25 percent in South Africa. Labor taxes were particularly low at 13 percent of gross profits and were only higher than labor taxes in South Africa (2.3 percent). As shown by Chart A.3. 1, the situation is the same in 2008.
79. What can also be shown is that this unfavorable perception of taxation is not driven by the compliance requirements. Using the same Doing Business dataset, Chart A.3. 2 show the number of payments that must be made to fully comply with tax obligations in several countries, including The Gambia. It appears that, relative to the comparator countries, The Gambia is in the middle of the pack when it comes to the number of payments required for full tax compliance.
80. Other formal sectors. As outlined earlier, many of the leading constraints to operations in The Gambia are common across all sectors. Hence, data show that four of the five leading constraints: electricity, access to finance, tax rates and access to land, are common to all sectors. However, macroeconomic instability, crime and theft and disorder are uniquely important to the non-manufacturing sectors. The table below shows the share of firms in each sector that report the three constraints as major or very severe.
Table 3. 1. Percentage of firms reporting constraint as major or very severe.
Manufacturing Retail Other Services Tourism
Macroeconomic instability 11.6 27.7 20.2 23.9
Crime, theft and disorder 0.0 14.9 14.9 21.7
Source: Gambia Enterprise Survey, World Bank
81. From 20 (other services) to almost 28 percent (retail firms) consider macroeconomic instability to be an important constraint. This is 2 to 3 times the proportion of firms in the manufacturing sector which have the same point of view. Crime, theft and disorder are much more important to firms in the retail services, tourism and other services sector than in the manufacturing sector. In effect, none of the firms in the manufacturing sample report this constraint as a major/very severe constraint. An investigation of crime perceptions by location confirms that it is the type (sector) of the firm and not its location that determines whether crime is a serious constraint or not.
The informal sector
82. Constraints faced by informal firms are very similar to the ones faced by formal firms. Electricity, access to finance, access to land and macroeconomic instability are the leading constraints for micro/informal firms. Hence, 63 to 67 percent of the informal firms find finance and electricity to be major or very severe constraints. About 30 percent of informal firms also report access to land to be a major or very severe constraint. A similar proportion of informal firms reports macro-economic instability to be a serious impediment.
83. As shown in Table 3.1, macro-economic instability is quoted by nearly 30 percent of the firms in the informal sector as a major constraint/very severe constraint. In 2006, on the
30 - These include taxes such as: the Sales tax, the Corporate Income Tax, the Social security contributions, the National Education Levy, a Capital gains tax, a Municipal business tax, a Contribution to injuries compensation fund, a Fringe benefits tax, a Property tax, a Fuel tax, a Vehicle tax, an Environmental tax, a Business license and a Stamp duty.
47
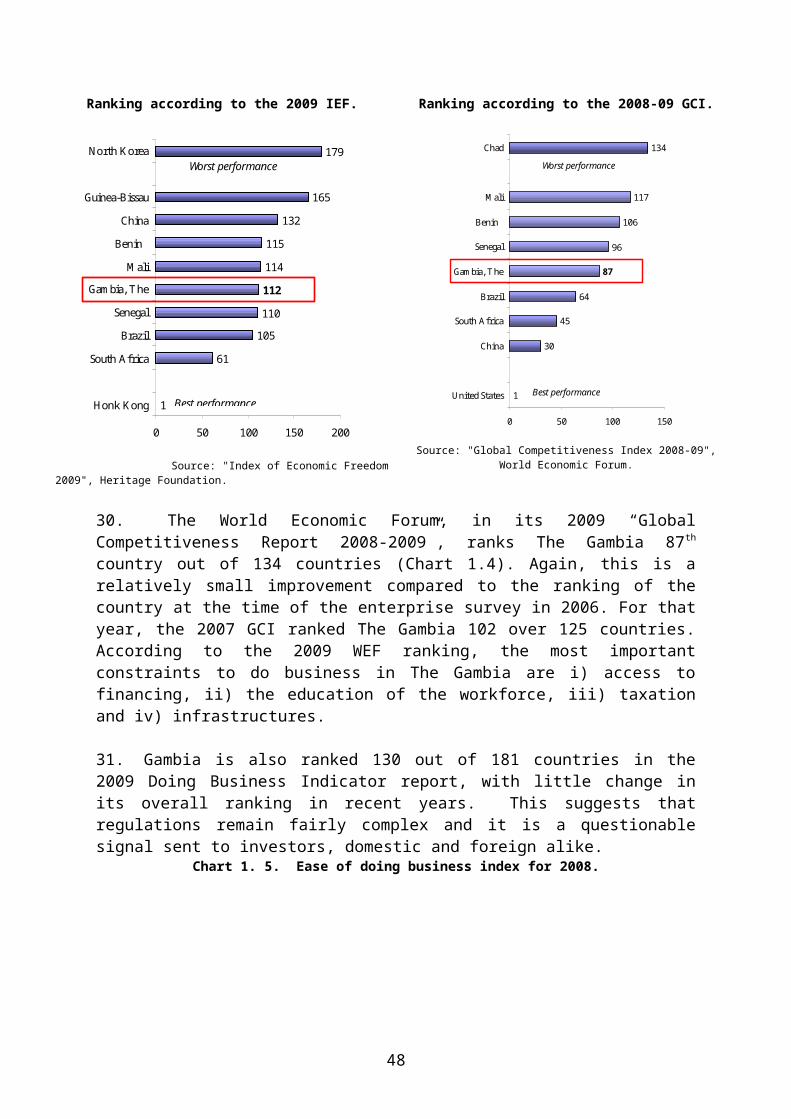
back of tight monetary policy, inflation and exchange rates were relatively stable. However, difficult relations - at the time - with neighboring Senegal which led to a blockade of the borders in 2005 created severe issues for the re-export sector. In addition, in 2006, The Gambia announced its intention to start implementing the ECOWAS CET, another potential blow for the sector. Both events are likely to have fuelled this perception. Between 2007 and early 2009, such expectations are unlikely to have diminished as inflationary pressures grew in 2007 and 2008 saw the advent of the current worldwide economic crisis which starts to affect the country (IMF 2009b).
Other noticeable constraints
84. Firms in the manufacturing sector appear to be more concerned about the quality of the education of their workforce than the other formal sector firms. Current plans outlined in the PRSP II suggest that there is scope for long-term gains in the quality of the work-force. However, in the short run, on-the-job training and vocational training improvements are the only available options.
85. The quality of customs and trade regulations is perceived as good given Gambia’s level of development. Following the gradual computerization of the Gambia Customs since the late 1990s, serious progress has been made in improving customs procedures. While 17 percent of retail services firms report that customs/trade regulations are a major constraint, only about 12 percent of manufacturing firms concur. An even lower proportion of other services firms find customs regulations to be problematic.
86. The next table synthesizes the set of constraints perceived by firms in The Gambia at the time of the survey.
Table 3. 2. Percentage of firms reporting major or very severe constraints.
Manufacturing Services Other InformalElectricity 78.5 74.5 79.8 66.9Access to finance 58.3 42.6 34 63.8Access to Land 31.8 27.7 24.5 29.1Tax Rates 30.6 29.8 30.9 22Practices of competitors in informal sector 17.7 27.7 21.3 19.7Tax Administration 15.2 19.1 14.9 11.8Inadequately educated workforce 15.2 10.6 10.6 11.8Customs and Trade Regulations 12.1 17 10.6 3.1Business licensing and Permits 12.1 19.1 19.1 8.7Macroeconomic instability 11.6 27.7 20.2 29.9Political instability 9.8 4.3 12.8 11.8Corruption 8.6 10.6 9.6 13.4Transportation 6.1 12.8 11.7 10.2Telecommunications 3.0 2.1 6.4 15.7Functioning of Courts 0.0 2.1 7.4 5.5Labor Regulations 0.0 0 6.4 3.9Crime, theft and disorder 0.0 14.9 14.9 11.8
Source: Gambia Enterprise Survey, World Bank.
48

3.1.2. What is the Intensity of Constraints outlined above?
87. The estimates discussed above treat reports of “major” or “very severe” constraints in a uniform way. However, this is likely to hide the intensity of particular constraints as it does not clearly distinguish between the two responses. The figure below makes an attempt at disentangling these for 4 classes of constraints: electricity, factors of production, other infrastructure and regulations.31 Every response for a “major” constraint is recoded as a 0 value and a response of “very severe” as a 1 value, so that the average for a particular set of constraints captures the share of reports of major/severe that are actually “very severe” (Chart 3.4).
88. The size of each of the polygons provides an indication of the extent to which reports of a constraint tend to be “very severe” relative to “major”. Results show that firms in the retail sector are more likely to report “very severe” constraints along the four categories shown above. Manufacturing firms in contrast, are least likely to report constraints as “very severe”.
Chart 3. 4. The intensity of constraints in the formal sector.
0.0
0.1
0.2
0.3
0.4
0.5
0.6Electricity
Factors of production
Other infrastructures
Regulatory regime
Manufacturing Retail Other services
Source: Gambia Enterprise Survey, World Bank.
89. 60 percent of the concerns about electricity in the retail sector are noted as “very severe” compared to only 30 percent and 40 percent in the manufacturing and services sectors respectively. Concerns about the regulatory regime are least likely to be “very severe”: only 10 percent of manufacturing firms’ concerns about the regulatory regime are “very severe”. Both manufacturing and retail firms report about 30 percent of their concerns about factors of production to be “very severe”.
31 - Factors of Production include: inadequately educated workers, Access to Finance, and Access to Land; Other Infrastructure includes telecommunications and transport. Finally the Regulatory Regime includes corruption, functioning of the courts, labor regulations, customs and trade regulations, tax rates and administration and business licensing procedures.
49

3.2. THE BUSINESS ENVIRONMENT FACED BY FIRMS.
3.2.1. Variation in constraints across categories of manufacturing firms.
90. There is a significant variation in the extent to which constraints affect the operation of firms that derives from differences in firm characteristics. Understanding the association between a variety of characteristics and firm perceptions is a vital input for policy formulation. For instance, outlining the problems that exporting firms face is a crucial input to any export-led growth strategy that the GoG may intend to implement. In what follows, we explore differences across ownership, export-orientation and location. Chart 3.5 shows differences across six constraints for which the largest differences across categories are registered. The chart shows the magnitude of differences: dark panels show negative differences, while light panels show positive differences.
Chart 3. 5. Differences in perceptions by export status, ownership and location for manufacturers.
Exporter-Non Exporter Differences
56.7
26.7
23.3
20
16.6
13.3
0
10
20
30
40
50
60
Tax Administration Access to finance Electricity Inadequately educatedworkforce
Practices ofcompetitors in informal
sector
Customs and TradeRegulations
Domestic-Foreign Differences
37.1
22.4 22.421.6
20.7
14.7
0
5
10
15
20
25
30
35
40
Access to finance Access to Land Tax Rates Transportation Practices ofcompetitors in informal
sector
Business licensing andPermits
KMC-Banjul Differences
37
18.5 18.5
16.6
14.8 14.8
0
5
10
15
20
25
30
35
40
Access to Land Tax administration Inadequately educatedworkforce
Tax Rates Customs and TradeRegulations
Business licensing andPermits
Source: Gambia Enterprise Survey, World Bank
50

Exporters versus non-exporters.
91. The four constraints with the largest differences in reports between exporters and non-exporters are tax administration, access to finance, electricity and inadequately trained workers.
92. Exporting firms are about 57 percentage points more likely to report problems with the tax administration compared to non-exporters. Similarly, exporters are much more frustrated by the unreliability of electricity services: exporters are 23 percentage points more likely to report electricity as a major or severe constraint compared to non-exporters.
93. Access to finance is much more of a constraint for non-exporting firms. This is not particularly surprising given the strong association between export status and firm quality (Tybout and Roberts, 1996). However, what is a little surprising is that non-exporters are more likely to report that their workers are inadequately skilled compared to exporters. While, this result could be explained by differences in other firm characteristics, a plausible explanation is sorting in the labor market so that good workers are matched with good firms, leaving non-exporters with a less educated workforce.
Ownership.
94. Domestic firms are about 37 percentage points more likely to report access to finance as a severe constraint. In addition, domestically owned firms are more likely to complain about competitive practices in the informal sector, but are 20 percentage points less likely to complain about tax rates, transportation and access to land.
Location.
95. Firms in Kanifing Municipal Council face a more unfavorable business environment. An examination of differences by location of enterprise reveals a consistent pattern of firms located in Kanifing Municipal Council (KMC) area of the Greater Banjul Area as being more likely constrained than firms in the city of Banjul, the administrative center. These differences are likely due to the decisions to locate a commercial enterprise in the different parts of the Greater Banjul Area. Less than 20 percent of the sample is located in the city of Banjul. As a consequence many of the constraints to operation are salient in KMC. In particular, KMC firms are about 37 percentage points more likely to report access to land as a severe constraint, and about 19 percentage points more likely constrained by tax administration and an ill-equipped workforce.
96. Crime, theft and disorder are much more important to firms in the retail services, tourism and other services sector than in the manufacturing sector. In effect, none of the firms in the manufacturing sample report this constraint as a major/very severe constraint. An investigation of crime perceptions by location confirms that it is the type (sector) of the firm and not its location that determines whether crime is a serious constraint or not.
3.2.2. The Leading Constraints for manufacturers in an international perspective.
97. Delineating the leading constraints in The Gambia and showing how these constraints compare to a set of peer countries provides useful insights to possible sources of
51

competitiveness for the country. Table 3.3 below show the percentage of firms in each country reporting the various constraints as major or very severe.32
Table 3. 3. Cross country constraints to firm operation.
Constraint Gambia Benin Mali Guinea-Bissau
Senegal South Africa
China Brazil
Electricity 78.5 69.2 24.2 81.5 30.6 9.0 29.7 20.3Access to finance 58.3 75.2 57.3 67.4 64.5 14.5 22.3 71.8
Access to Land 31.8 33.7 37.9 19.4 29.7 4.0 14.7 19.9
Tax Rates 30.6 87.7 36.4 48.0 50.4 19.0 36.8 84.5
Practices of competitors in informal sector 17.7 71.7 42.2 23.8 48.6 16.0 23.7 56.4
Tax Administration 15.2 55.7 30.1 33.9 47.2 11.0 26.7 66.1
Inadequately educated workforce 15.2 25.6 20.1 16.7 17.3 35.0 30.7 39.6
Customs and Trade Regulations 12.1 64.7 19.9 14.1 36.6 17.0 19.3 42.3
Business licensing and Permits 12.1 53.9 10.7 18.5 7.2 3.0 21.3 29.8
Macroeconomic instability 11.6 - 13.0 66.1 26.2 33.0 30.2 74.9
Political instability 9.8 - - 37.4 - - - -
Corruption 8.6 83.9 48.7 43.6 39.9 16.0 27.3 67.2
Transportation 6.1 42.1 20.1 41.9 36.1 10.0 19.1 19.3
Telecommunications 3.0 40.7 14.3 23.8 3.5 3.0 23.5 6.2
Functioning of Courts 0.0 - - 8.4 - - - -
Labor Regulations 0.0 35.4 3.9 2.6 15.8 33.0 20.7 56.9
Crime, theft and disorder 0.0 47.5 22.1 30.0 14.9 29.0 20.0 52.2
Nb. Manufacturing only.
Source: Gambia Enterprise Survey, World Bank.
98. A number of the leading constraints in The Gambia are shared by many countries in the comparator set. In particular, Guinea-Bissau, Benin, Mali, and Senegal share many of the leading constraints facing firms in The Gambia. Consistent with the general level of economic development, access to finance is an important constraint across the majority of countries in the comparator set.
99. However, problems with the reliability of electricity are salient in The Gambia, Benin and Guinea-Bissau. As in The Gambia, electricity is the most important constraint in Guinea-Bissau. However, in neighboring Senegal, only 30 percent of firms find electricity to be a major/very severe constraint. Predictably, the middle income countries of Brazil and South Africa are more likely to report being constrained by inadequate skills, labor regulations and crime, theft and disorder than the poorer countries in the comparator set. Three times as many firms in Senegal relative to The Gambia find customs and trade regulations to be constraining.
100. Similarly while tax rates and tax administration is particularly onerous in The Gambia, nearly half of firms surveyed in Senegal find tax rates/administration to be an important constraint. This is about 20 percentage points higher than the corresponding proportion in The Gambia.
32 - It is important to point out that while the perceptions estimates are not directly comparable across countries, they provide a useful ranking of constraints within each country. As Gelb and al. (2007) show, perceptions data are highly correlated to objective measures of the quality of services/regulation which are comparable across countries.
52

3.2.3. The Quality of Infrastructure.
Electricity.
101. Nearly 4 out of 5 firms surveyed in the manufacturing sector found electricity to be a major or very severe constraint to operation. Given the importance of electricity in the production function for most manufactures, an unreliable service or very costly alternatives are likely to have a large impact on productivity and export competitiveness. This constraint is likely to hamper even the most productive firms. As has been highlighted above, exporters are 23 percentage points more likely to report being constrained by the quality of electricity services. Below, we investigate the source of these complaints. While we might not expect the retail, other services and informal sectors to use electricity services as intensively as manufacturing, firms in these sectors also describe electricity services as a heavy constraint. The survey also reveals that electricity supply seems to be the most binding in the Tourism sector (Chart 3.6).
Chart 3. 6. Concerns about infrastructure are mostly uniform across all sectors.
74.5
12.8
2.1
84.8
6.5
8.7
79.8
11.7
6.4
66.9
10.2
15.7
0 10 20 30 40 50 60 70 80 90
Electricity
Transportation
Telecommunications
Services Tourism Other Informal
Source: Gambia Enterprise Survey, World Bank
102. Table 3.4 shows that manufacturing firms in The Gambia experience just over 19 power outages per month. The average duration of a typical outage is 5.8 hours. It is unlikely that the pattern of these outages is regular enough to permit a rational response such as working shifts. As a result, firms have responded by producing their own electricity. The typical manufacturing firm produces nearly one third of its own electricity needs, which is a costly response to poor public service provision. In other surveyed sectors, the data suggest that firms experience even more power outages per month (up to 36 in the retail sector). The average duration of a typical outage is also greater in these sectors compared with manufacturing. As a result, informal firms produce on average nearly half of their own electricity needs.
Table 3. 4. Electricity services are very poor.
Electricity Issues Manufacturing
Retail Other Services Tourism Informal
Number of power outages per month 19.2 35.8 22.9 24.1 23.3
Duration of outages (hours) 5.8 7.5 6.9 6.9 8.4
Pct. of sales lost due to electricity shortage 13.7 14.8 12.2 16.7 20.1
Pct of electricity self-generated 32.1 na na na 49.2
53

Source: Gambia Enterprise Survey, World Bank
103. Chart 3.7 shows the proportion of manufacturing firms that own a generator in international perspective. The Gambia is second only to Guinea-Bissau in the proportion of firms that own a generator. The three other West African comparator countries have widespread generator ownership, ranging from 27 percent in Benin to 63 percent in Senegal. Generator ownership is however much less widespread in the middle income countries of China, South Africa and Brazil; for example less than 10 percent of firms in South Africa own a generator. Generators are both costly to purchase and maintain; and likely crowd out potential productivity increasing investments. In other sectors, firm responses to the poor electricity services are less muted: only 30 percent of informal firms own a generator. This is to be expected given the large fixed costs associated with acquiring generators. However, conditional on owning a generator, the amount of self-provided electricity is higher for micro-informal firms than for the manufacturing sector.
104. An examination of the quality of electricity services by location suggests that electricity is a widespread problem across the metropolitan area of Greater Banjul. Chart 3.7 shows that firms in Banjul experience slightly fewer power cuts - and when they occur, they are of shorter duration - but the costs in sales lost are of the same magnitude. Private provision of electricity services is considerably higher in KMC than in Banjul city.
Chart 3. 7. Experiences with unreliable electricity supply: The need for generators.
Owns or shares a generator (%)
68.4
63.962.5
45.3
26.9
17.5 17.0
9.5
0.0
10.0
20.0
30.0
40.0
50.0
60.0
70.0
80.0
Guinea-Bissau Gambia Senegal Mali Benin China Brazil South Africa
Electricity Problems By City
30.6
8.7
15.6
35
23.5
7.2
15.7
44
0
5
10
15
20
25
30
35
40
45
50
# power cuts, typical month Duration, hours % Sales Lost % Self-generated power
BANJUL KMC
Nb. Manufacturing only
Source: Enterprise Survey, World Bank
105. The cost of poor electricity services is important: manufacturing firms lose nearly 14 percent of sales as a result of interruptions to power supply. The chart below shows the proportion of sales lost in the comparator countries as a result of poor or unreliable electricity services. As with generator ownership, the cost of poor electricity services is correlated with per capita income. Even then, the proportion of output lost by firms in The Gambia is twice as large the next worst country, Benin. The cost of poor electricity services is likely to be a major factor in the competitiveness of Gambian exports. While firms in neighboring Senegal also face an uncertain electricity regime (as measured by the extent of generator ownership), they only lose about a quarter of the output loss in The Gambia as a result of poor electricity services.
54

106. In other sectors, costs associated with poor electricity services are also huge. Firms in the retail services and tourism sectors lose an average of 15-16 percent of their sales while informal firms report an average just above 20 percent of all sales.
Chart 3. 8. A high cost of unreliable electricity supply.Value lost due to electrical outages (% of sales)
13.7
6.5
5.04.3
1.7 1.61.2
0.4
0.0
2.0
4.0
6.0
8.0
10.0
12.0
14.0
16.0
Gambia Benin Guinea-Bissau Senegal Mali Brazil China South Africa
Nb. Manufacturing only
Source: Enterprise Survey, World Bank
Chart 3. 9. Waiting times for an electric connection.Delay in obtaining an electrical connection (days)
194.2
55.6
32.0
20.7 20.510.5 10.3
5.3
0.0
50.0
100.0
150.0
200.0
250.0
Gambia Benin Mali Brazil Guinea-Bissau China Senegal South Africa
Nb. Manufacturing only
Source: Enterprise Survey, World Bank
107. The problems of electricity services are not only restricted to customers that are already on the grid. Getting an electricity connection in The Gambia is very time consuming: a manufacturing firm in The Gambia has to wait an average of 6 months to get an electricity connection, largely because of persisting inefficiencies in the distribution infrastructure. (Chart 3.9). This is nearly three and half times longer than in Benin where it takes just under two months. An examination of the middle income countries data suggests average waiting times on the order of one or two weeks. A firm in South Africa waits an average of just over 5 days, nearly 40 times shorter than in Gambia.
55

108. Note that the delay to get an electric connection seems to be much more reasonable in other economic sectors (more or less a month in the retail, service and informal sector). Firms in Tourism appear to be less constrained as it takes only 13 days on average to get an electricity connection.
109. As shown earlier, the issue of electricity provision in The Gambia is widely shared across sectors. Historically, the sector has been under the purview of the state-owned NAWEC Gambia Ltd. which is the country's main utilities supplier. It was incorporated in June 1996 as a company limited by shares under the Companies Act of 1955. Its main Kotu Power Station is the principal generator serving the Greater Banjul Area in the Kanifing Municipality. In addition to the Kotu power station, NAWEC also manages an extra two oil-fired electricity-generating plants. However, the supply from these is inadequate, and power cuts are frequent, as shown above, because of insufficient generation and a historical lack of investment in infrastructure (EIU 2009b). The sector face two key issues:
Under generation and inefficiencies in distribution. NAWEC is still plagued by inefficiency reflected in system losses (35 to 45 percent), far above industry norms, leading to a severe strain on the utility's as well as the government's finances. Even with the relatively new Independent Power producer (IPP) at Brikama, the power situation remains strained, with total available capacity of 60 MW against a suppressed peak power demand of perhaps 150 MW. Adding further generating capacity by itself will not resolve the issue, given the overloaded transmission and distribution system, with a transmission capacity of about 50 MW (World Bank 2008a).
Concentration of supply in urban areas. Electricity is available mostly in the urban areas and provincial centers of rural areas with coverage of less than 25 percent. Electricity consumption represents some three percent of total energy consumption in the country.
110. Recognizing the issue, the GoG - with the 2004 Electricity Act - liberalized the sub-sector and opened it up for private sector investment. However, it has only been partially implemented since then. NAWEC is poised for future divestiture under the Track I privatization category. The GDA is assessing the possibility of divesting NAWEC through public-private partnerships. In this respect, the role of PURA, the multi-sector regulatory agency which covers the electricity sector is important. To further fulfill its role, PURA needs to overcome crucial constraints in order to build private-public coordination in the electricity sector. Mainly, PURA must secure financial revenues from private and public actors and overcome its slow take-off to become an unavoidable partner in the electricity sector. Moreover, progress has to be made to insure transparency and independence (World Bank 2009).
111. It must also be mentioned that the situation has improved somewhat since the survey in 2006, both in terms of generation capacity and reliability of supply. However, this has implied a 30 percent increase in tariffs, making electricity far more expensive in The Gambia than in most other African countries (World Bank 2008a)
Other infrastructures.
112. Water. The supply of water to firms is perceived as inadequate. Nearly one third of firms reported that they had insufficient levels of water. Firms report an average of a little over 9 water outages per month and an average duration of nearly 7 hours. In addition to
56

displacing resources that are used to purchase or maintain large storage facilities, supply disruptions are likely unpredictable.
113. Transportation. While the quality of transportation services appears to be adequate to manufacturing firms in The Gambia (Table 3. 2), transportation is still a concern for non-manufacturing firms. A firm in the retail and other services sectors is on average twice as likely to report transportation as a major or very severe constraint as is a manufacturing firm. Only firms in the tourism sector have a view similar to the manufacturing sector. We focus here on road and maritime transport which are of key importance for the country.
114. Road transport is the dominant mode of transportation, accounting for more than 90 percent of the total motorized freight and passenger movements (World Bank 2007b). The quality of related transportation services is, inter alia, a function of the availability of roads. More than one third of Gambia’s roads are paved; this is nearly three times the Sub-Saharan Africa average. Overall, the road network of The Gambia comprises about 1,559 km of roads of which 495 km are paved and 1,064 km are unpaved. There are also approximately 1,300 km of rural feeder roads. However, it must also be noted that the road network in
Chart 3. 10. Proportion of paved roads.% Roads Paved
35.4
29.3
20.3
12.1 12.1
5.6
0
5
10
15
20
25
30
35
40
Gambia, The Senegal South Africa Mali Sub-Saharan Africa Brazil
Source: World Development indicators
and around the capital city is much better developed than in other parts of the country. Traffic volume on some of the trunk roads in Greater Banjul area is in excess of 10,000 vehicles per day; while outside Banjul, traffic volume is generally quite low varying between 150 and 1,600 vehicles per day on the trunk network (Republic of The Gambia, 2006). Furthermore, the road conditions, in spite of the comparatively large size of the network, are generally poor, resulting from under-investment in routine and periodic maintenance. Late 1990s data suggest that only about 20 percent of existing roads were in excellent or good conditions.
115. Maritime transport. The key of the maritime transport system is the port of Banjul which is run by a public entity, the GPA, and shares some activities with private operators33. The port is rather small but quite efficient, mainly because of the rapid clearance of merchandise (World Bank 2007b). Banjul is at least as efficient as Dakar for ship-to-shore handling, and much more efficient for on-shore handling. Shipping agents estimate that it is 10 to 30 percent cheaper to import a container through Banjul as opposed to Dakar. The main advantage of Banjul is the speedy clearance of merchandise due to close cooperation with customs – usually a few days, as opposed to 10 to 15 days in neighboring alternative ports (World Bank 2007b).
33 - Movements, handling, and stevedoring.
57

116. In spite of this good performance, there is room for improvement as competition at the sub-regional level is fierce and the Dakar port is improving rapidly. According to the PRSP II (Republic of The Gambia, 2006), there are three key constraints which will need to be alleviated in the future: Lack of funds to fund GPA operation and infrastructural development projects; Inadequate ground space for future expansion; Administrative weaknesses because of delays to establish a proper Maritime
Administration.
117. Telecommunications. Telecommunication services are not a significant constraint according to the perceptions of manufacturing firms. Only 3 percent of manufacturing firms report these to be a major or very severe constraint to operation. However, data still show that the quality of telecommunications services is a much more important and major concern for firms in the informal sector. In recent years, the sector has been opened to the private sector. The state-owned Gambia Telecommunications (Gamtel), along with its mobile phone business, Gambia Cellular (Gamcel), was part-privatized in August 2007 when the GoG sold a 50 percent stake to a Lebanese-owned company, Spectrum Group (EIU 2009b).
3.2.4. Foreign trade.
118. While Gambia’s geography allows for a relatively easy access to and from international trade, the efficiency with which customs regulations are conducted could be an important bottleneck. The table below shows average estimates for how long it takes to claim or clear goods for Gambian importers and exporters. Consistent with its trading tradition, the country performs well in this area.
Table 3. 5. Quality of procedures associated with external trade.
Total Very Small
Small Medium and
Large
Domestic Foreign
ImportsDays to claim goods, Average 3.0 3.0 2.9 3.3 2.9 3.3
Days to claim goods, Longest 6.7 6.0 7.3 5.0 7.2 5.0
Exports% Exports with external clearing Agent 36.7 - 50.0 10.0 50.0 10.0
% Exports Inspected 90.0 - 100.0 70.0 100.0 70.0
Days to clear goods, Average 2.0 - 1.5 3.0 1.5 3.0
Days to clear goods, Longest 4.3 - 4.0 5.0 4.0 5.0
Source: Gambia Enterprise Survey, World Bank
119. The average duration required for an importer to claim goods is 3 days. The longest duration averages at just under a week for importers34. There is very little variation across firm size or ownership status. A little more than one third of firms use an external clearing agent to handle their exports. On average even though 90 percent of exports are inspected, export clearing takes only 2 days.
120. An examination of the length of time required to claim or clear goods against the comparator set of countries confirms that The Gambia has an efficient customs system. Gambian exports and imports have the shortest clearing duration of all comparator countries 34 - Note that these numbers differ from the “days to export/import” data from Doing Business Indicators. The Doing Business indicator collects data about the entire process of importing/exporting including the packing of goods and how long goods remain at the port. Their estimates for customs clearance durations are consistent with the data presented here. The total export/import durations including document preparation, inland transportation and time at port is 19/23 days respectively.
58

with data taken from recent enterprise surveys. The time it takes to clear import/exports is shorter than for middle income countries such as South Africa and China. Compared to countries at the same level of income, average clearing times are less than half of what is required in Mali, Guinea-Bissau or Senegal.
Chart 3. 11. Gambia’s customs delays.
Average time to clear direct exports through customs (days)
7.9
6.3 6.25.9 5.8
5.6
4.3
2.0
0.0
1.0
2.0
3.0
4.0
5.0
6.0
7.0
8.0
9.0
Brazil Benin China Senegal Mali Guinea-Bissau South Africa Gambia
Average time to claim imports from customs (days)
12.4
11.0
10.1
7.6 7.6
6.2
5.6
3.0
0.0
2.0
4.0
6.0
8.0
10.0
12.0
14.0
Brazil Guinea-Bissau Benin Mali China South Africa Senegal Gambia
Source: Enterprise Surveys, World Bank
121. The efficient handling of goods at entry and exit contributes to lower the costs of trading for the country. Overall, the average administrative cost of importing a container into The Gambia is one of the lowest in the group of comparator countries, second only to China. Of particular relevance to a potential role of The Gambia as a trading-hub in the region, the cost of importing a container in Senegal is more than two to three times (depending on the year) as high as the cost to The Gambia. Export costs are similarly low: at $422 in 2006 and $831 in 2008, the cost of exporting a container from The Gambia is much lower than the cost of exporting from Senegal and about a half the average cost for Sub-Saharan Africa.
Chart 3. 12. Administrative export/Import costs are low in The Gambia (USD per container).
1,752
2,012
2,680
2,902
1,6561,545
1,749
2,349
1,550
1,879 1,947
2,279
980
1,2371,452 1,393
9781,078
1,674
1,920
895
1,2401,145
1,275
850
1,445
850
1,721
422
831
494
922
335460
375545
0
500
1,000
1,500
2,000
2,500
3,000
3,500
2006 2008 2006 2008Cost to export (US$ per container) Cost to import (US$ per container)
Mali Guinea-Bissau SSA average Benin Senegal Brazil South Africa Gambia China
Source: Doing Business 2007 and 2009, World Bank
3.2.5. Other elements of the business environment.
59
Corruption.
122. Corruption can be defined as an abuse of public office for private gains. It hampers public interest as it entails confusion of the private with the public sphere or an illicit exchange between the two spheres. This includes bribery, fraud, diversion, and related offenses. Corruption generates instability in the business environment and increases the cost of operations for firms. Enterprise survey data show that corruption remains an issue in The Gambia.
123. A first glance, corruption does not seem to be a major concern. In effect, less than 9 percent of firms in the manufacturing sector report corruption to be a major or very severe constraint to their development. As in manufacturing, most firms in the retail, tourism, other services and informal sector do not perceive corruption as an impediment to operation. 10 percent or fewer report corruption as a major or very severe constraint. This is a particularly weak perception of the issue for a low-income country such as The Gambia; the percentage of firms that consider corruption as a serious issue in neighboring Senegal and Mali for example is nearly 4-5 times as large as that in The Gambia (Chart 3.13). Furthermore, even in middle income countries such as China and South Africa, corruption is perceived by firms as a more serious issue. Although, as mentioned earlier, international comparisons of perception data have to be considered with care, it appears nonetheless that, in The Gambia, the perception of corruption as an issue is low, even in comparative terms.
Chart 3. 13. Perception of corruption.(Pct. of firms which quote the item as a "major" or "very severe
obstacle")
Chart 3. 14. Unofficial payments to get things done.(Pct of Sales)
16.0
27.3
39.9
43.6
48.7
67.2
83.9
8.6
0 20 40 60 80 100
Gambia
South Africa
China
Senegal
Guinea-Bissau
Mali
Brazil
Benin
0.1
0.2
1.6
2.8
2.9
4.6
4.4
0.0 2.0 4.0 6.0
South Africa
Senegal
China
Guinea-Bissau
Mali
Gambia
Benin
Source: Enterprise Surveys, World Bank
124. However, data show that corruption is just as costly to Gambian firms as it is in other low income countries. The Gambia is only second to Benin relative to the size of the ‘informal’ tax on economic activity. Informal payments account for 4.4 percent of
60

manufacturing firms’ sales in The Gambia (Chart 3.14). Data show that while informal firm pay an average of 2.5 percent of sales in unofficial payments, more formal firms pay the equivalent of 4-5 percent of sales (according to sectors) in unofficial payments. The lower costs of corruption for informal firms suggest a price discriminating regulator who extracts more money from firms with a greater ability to pay.
125. This apparent paradox of a joint low perception of corruption as an issue combined with a high cost of this practice may be explained in several ways. First, this discrepancy may stem from a kind of endogeneization of the phenomenon within the Gambian society; in other words the phenomenon is rather widespread and has become somehow entrenched in local practices. This analysis is confirmed to some extend by the data. In effect, 42 percent of manufacturers declare it is common to give “something” in order to get things done and 22 percent of the manufacturers declare having advance knowledge of how much it will cost to “get things done”. In addition, as shown by the GRAFT index (Gonzalez and al. 2007) - which is an experience-based index that reflects the probability that a firm will be asked for a bribe in order to complete a specified set of business transactions - the probability of being asked for a bride in The Gambia is non negligible (Chart A.3. 3). Second, there are several constraints which are considered by manufacturers as much more important (e.g. electricity, access to finance…), a fact which may explain the relatively low rank of corruption within the set of constraints faced by firms (ranked as 12th constraint out of 17). Thirdly and finally, it may also be a pure survey issue of reluctance of respondents to provide clear responses to these questions. It is highly plausible that the reality is a mix of all the above explanations.
126. As other sources of information also indicate, corruption is de facto not a minor phenomenon in The Gambia.
127. The 2007 IEF (which matches the date of the survey) ranks poorly The Gambia. Corruption is the sub-indicator for which the country has the worst rating. Little seems to have changed since then, according to the 2009 IEF which states: Corruption is perceived as widespread. Corruption among senior government officials is a serious problem, and the few prosecutions of high-profile politicians have not been conducted in a way that would signal a serious intent by the government to deal with it.
128. In a similar way, Transparency International’s 2007 CPI35 (which matches the date of the survey) ranked The Gambia as 143rd country out of 179 and the 2009 ranking was even worse, 158th out of 180 countries.
Chart 3. 15. Contract value typically paid in informal payments/gifts to secure the contract in manufacturing.
(Pct.)
Chart 3. 16. Gift or informal payment expected/requested.
(Pct of Yes)
35 - The Transparency International CPI measures the perceived levels of public-sector corruption in a given country and is a composite index, drawing on different expert and business surveys. The 2008 CPI scores 180 countries on a scale from zero (highly corrupt) to ten (highly clean). Gambia is ranked
61

3.10
6.00
25.00
0.00
5.00
10.00
15.00
20.00
25.00
30.00
Ave
rage
Stan
dard
Dev
iatio
n
Max
imum
28.6 28.6
22.220.0 20.0
10.79.1
0.0
5.0
10.0
15.0
20.0
25.0
30.0
35.0
Elec
trica
lco
nnec
tion
Cons
truct
ion
perm
it
Mai
nlin
e te
l.co
nnec
tion
Wat
er c
onne
ctio
n
Impo
rt lic
ense
Insp
ectio
n/m
eetin
gw
ith ta
x of
ficia
ls
Ope
ratin
g lic
ense
Note:Within the last two years for all items except inspection with tax officials which is one year.
Source: Gambia Enterprise Survey, World Bank
129. An examination of the nature of transactions with the administration suggests that, in The Gambia, securing a government contract can be “expensive”. A manufacturing firm in Gambia must part with an average of 3.1 percent of the contract value, but the maximum needed can be much higher (up to 25 percent of the value of the contract, Chart 3.15). Firms in retail and other services are expected to pay more in order to secure government contracts. A retail firm is expected to give up 6.4 percent of the contract value compared to 5.9 percent for other services firms, 4.7 percent in Tourism, and about 3 percent for informal firms. Consistent with these estimates, a larger fraction of firms know in advance that they need to pay bribes to obtain contracts. Nearly 40 percent of firms in the retail and other services sector report such priors. This suggests that, particularly in these two sectors, there is a well established norm of required side payments in order to do business.
130. In addition, it must be noted that obtaining some services can frequently require a gift or an informal payment. Hence, obtaining an electrical connection and a construction permit are the two activities most likely to require a bribe. Nearly 30 percent of manufacturing firms reported that they were either expected or were requested to pay a bribe before receiving the service (Chart 3.16). Same evidences can be observed in non manufacturing sectors as more than 20 percent of other services firms and tourism enterprises, and 18 percent of informal firms report that an informal payment was requested/expected during the last visit from tax officials.36
36 - Ideally, one would like to separate expectations from actual requests. However, the data does not permit separate measurement of the two quantities.
62

The regulatory framework.
131. The role of good governance and of the credibility of government decisions in the development process is now well recognized. Poorly implemented decisions, unpredictable or inconsistent government actions can hamper the development of the private sector. De facto, what matter is not only the regulatory framework per see, but also its application. We consider here three salient elements of the regulatory framework i) the credibility of regulations, ii) the working of the court system, iii) selected business regulations and iv) the impact of the regulatory framework on the decision of becoming formal.
132. Credibility of regulations. As a whole, managers of manufacturing firms in The Gambia have little confidence in the consistency and predictability of regulations. Only about half of manufacturing firms consider (48.5 percent) that Government officials’ interpretations of the laws and regulations affecting their establishment are consistent and predictable. Such a point of view puts The Gambia in a median position, in a better position than Benin or Guinea-Bissau but well below countries such as China or South Africa (Chart 3.17). Non manufacturing firms’ managers tend to have a more optimistic view as between 54 (retail services) and 65-66 percent of the firms (tourism and informal firms), consider that Government officials’ interpretations of the laws and regulations are consistent and predictable.
Chart 3. 17. Regulations are consistent and predictable.(Pct. of firms which "tend to agree" or "strongly agree")
66.3 64.761.5
57.5
36.6
11.9
48.5
0
10
20
30
40
50
60
70
China Mali SouthAfrica
Senegal Gambia Benin Guinea-Bissau
Source: Enterprise Surveys, World Bank
133. The court system. In The Gambia, the judicial system is based on a composite of English common law, Koranic law, and customary law. It accepts compulsory ICJ jurisdiction (with reservations), and includes subsidiary legislative instruments enacted locally. The constitution provides for an independent judiciary, and although the courts are not totally free from influence of the executive branch, they have demonstrated some independence on occasion. There is only one system of courts which form a hierarchy. The subordinate courts consist of (i) Khadis (Muslim) Courts, (ii) District tribunals, and (iii) Magistrates courts. These courts have limited jurisdiction to hear both civil and criminal matters.
63

Chart 3.18. Perceptions of the efficiency of the court system.
84.4%
71.9%68.8%
18.8%
69.8%
53.5%48.8%
32.6%
68.8%65.2%
59.1%
35.5%
76.7%
67.5%
54.2%
40.0%
33.3%
45.8%
63.3% 62.5%
0%
10%
20%
30%
40%
50%
60%
70%
80%
90%
Able to enforce its decision Fair, impartial and uncorrupted Affordable Quick
Manufacturing Retail services Other services Tourism Informal
Source: Enterprise Surveys, World Bank
134. Overall, in the event of a business dispute, manufacturing firms in The Gambia have a mostly positive assessment of the working of the courts. For 68 to 84 percent of the formal firms, courts are able to enforce their decision. Most of the manufacturing firms also consider they are fair, impartial and uncorrupted and affordable. However, firms are not particularly happy with the speed at which the court system operates. Only 19 percent of manufacturing firms consider that courts are quick in delivering a judgment. Like firms in the manufacturing sector, a majority of firms in the other sectors find courts to be able to enforce decisions, to be affordable and fair. A much higher percentage of firms in non-manufacturing find the courts to be quick in their deliberations. One third or more of firms in the other sectors agree that courts are quick. However, informal firms tend to be much more critic towards the enforcement, fairness, impartiality and absence of corruption in the court system.
135. Entry/exit regulations. The data used above comes from incumbent firms already in activity. As a result, the perspective they provide relates to ongoing concerns and is not very appropriate to assess issues related to firm’s creation (entry into a market) and closure (exit from the market) which are key to have competitive markets. A way to assess issues in this area is to use the two relevant doing business indicators. We compare the estimates for Gambia with the SSA average and selected comparator countries. 136. Starting a business is moderately difficult in The Gambia (Chart 3.19). Whether in 2006 (time of the survey) or in 2008 (latest dataset available), the country performs better than SSA on average, with the exception of the cost of the procedures which remains high (about 255 percent of the income per capita). This high cost is mainly driven by the need to obtain an operational license which costs 5000 GMD (roughly 240 USD) from the Banjul City Council and the largest municipality (Kinifing Municipality). As a further impediment, this license must be renewed annually.
137. Closing a business is also moderately difficult (Chart 3.20). Related costs are slightly lower than in SSA on average and the recovery rate on assets is much higher than in SSA.
64

However, in terms of duration, procedures are slower than in SSA on average, which is not a good performance.
Chart 3. 19. Starting a business.
8 827 27
292.1
254.9
119.7
0.011.1 10.2
61.847.8
162.8
111.2
209.9
173.4
0
100
200
300
400
500
600
2006 2008 2006 2008 2006 2008 2006 2008Procedures (number) Time (days) Cost (% of income per capita) Min. capital (% of income per capita)
Benin Brazil China Gambia, the Mali Senegal South Africa SSA
Source: Doing Business 2007 and 2009, World Bank
Chart 3. 20. Closing a business.
3 3
14.5 15
31.4
19.5
2.63.4
16.0
20.2
17.716.9
0
5
10
15
20
25
30
35
40
2006 2008 2006 2008 2006 2008
Time (years) Cost (% of estate) Recovery rate (cents on the dollar)
Benin Brazil China Gambia Mali Senegal South Africa SSA
Source: Doing Business 2007 and 2009, World Bank
65
138. Decision to become formal. Given the importance of the informal sector in The Gambia, it is especially interesting to check if specific regulations constitute a barrier to formalization. Specific questions in the survey where devoted to this issue. Rates of taxation, the administrative burden of registration and paying taxes are the three leading constraints to formalization quoted by informal firms as shown below. This is consistent with many available explanations in the academic literature of why firms remain informal. As outlined at the beginning of this chapter, the tax burden in The Gambia is high. It is therefore not surprising that this is the leading constraint to formalization.
Figure 3.1. Constraints to formalization: The role of registration.
Constraints to Formalization
5.51
9.45
10.24
11.9
12.6
14.17
23.62
26.77
0 5 10 15 20 25 30
Strict labor market rules thatregistered businesses must comply
with
Time to complete registrationprocedures
Other administrative burdensimposed on registered businesses
Difficulty of getting information onwhat you need to do to register
Minimum capital requirements forregistered enterprises in my sector
Administrative burden of complyingwith all tax laws for registered
Financial cost of completingregistration procedures
Financial burden of taxes onregistered enterprises
Source: Gambia Enterprise Survey, World Bank
139. Two aspects of registration are highlighted as major impediments to formalization: the direct and indirect costs, such as fees and the time required to register and a lack of information about the registration process. As the evidence from the Doing Business data of the time suggests, the cost of registration in Gambia is not trivial for micro-informal firms. An informal firm must be prepared to pay up to $1000 to fulfill all the registration procedures (roughly 292 percent of GNI in 2006). The major expenditures in this process include obtaining a company seal and paying a corporate tax deposit. In addition, the entire process takes about a month.
66
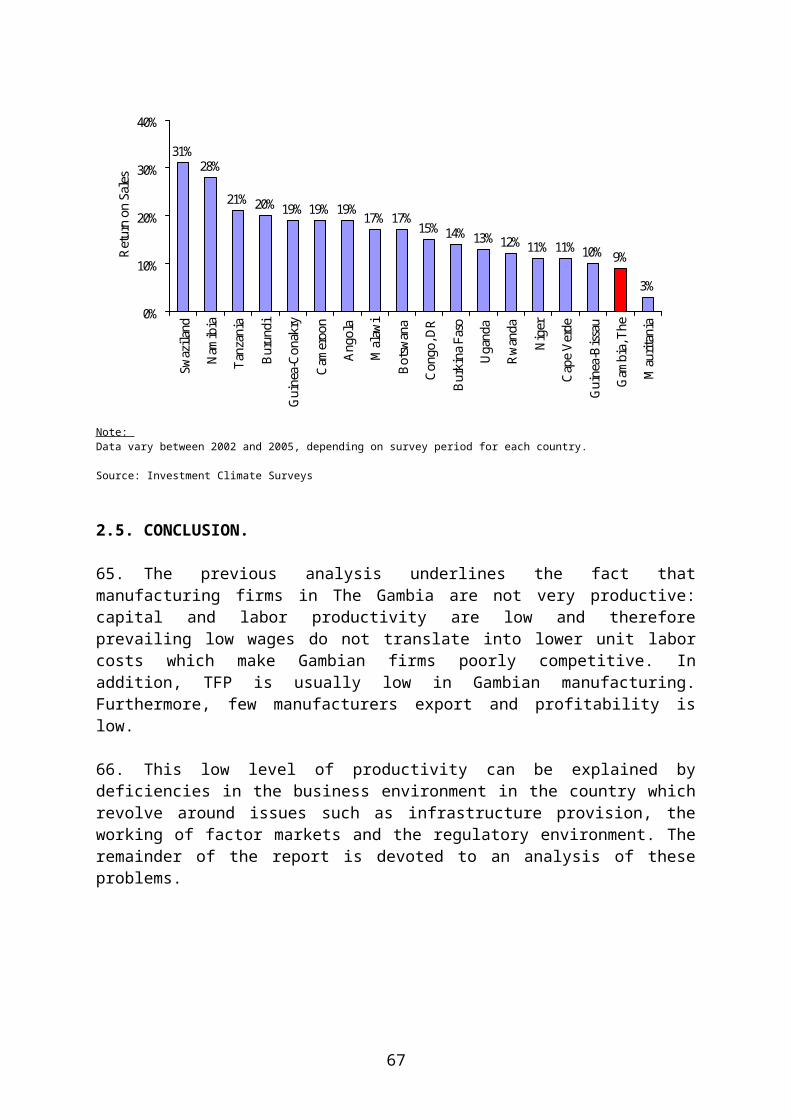
3.4. CONCLUSION.
140. The previous analysis of the business environment in The Gambia outlines the need for a fairly clear reform agenda in this area. While there are a number of positive aspects in the investment climate such as the ease of trading across borders, there are also a number of significant issues that require immediate and sustained attention. Across the three formal sectors (manufacturing, services, others), the four perceived leading constraints are the same, (although they differ a little in magnitude and ranking) and relate to Electricity, Access to finance, Access to land and Tax Rates. The data also show that constraints faced by informal firms are very similar to the ones quoted by formal firms.
141. Therefore, the most important policy intervention required is to improve the quality and reliability of infrastructure services, especially electricity. The second most important issue to address is the access to finance for firms, especially SMEs. Two other aspects of importance are tax issues, and access to land.
67

4 FACTOR MARKETS IN THE GAMBIA
142. The previous chapter has provided an analysis of the overall business environment in The Gambia, focusing on infrastructures, customs, and regulations. This chapter now focuses on a major component of firms’ performance: the working of factor markets. This relates to one of the biggest class of constraints quoted by firms37.
143. The working of the labor market is treated in the first part of this chapter. Then, the second part provides information on the relationships between firms and the banking sector, which is the second most important constraint faced by firms in The Gambia.
4.1. THE FORMAL LABOR MARKET. 144. A well-functioning formal labor market in The Gambia is critical both for its macroeconomic performance, as well as for a sustainable improvement in living standards. 38
With this in mind, a large section of the firm survey in The Gambia was devoted to the collection of worker data. A sample of up to 10 workers in each firm was interviewed, to obtain information on wages, occupation, union status, education, tenure, layoff, experience, and demographics39. This section first discusses the relative importance of institutional rigidities in the labor market in The Gambia. Then, it explores some key workers’ characteristics such as education, training, health and remunerations. Finally, this section also provides an examination of the wage setting mechanisms in The Gambia.
145. The labor force in The Gambia was about 585 000 in 2003, or about 43 percent of the population. The agricultural sector remains the main job supplier, 80 percent of the workforce is employed in agriculture, 19 percent in industry and 6 percent in services. The “formal” or “modern” labor market represents only a small fraction of the whole labor market. Modern jobs (i.e. wage employment in the public or private formal sector) employ roughly less than 20 percent of the workforce. The Greater Banjul Area concentrates a huge part of the population (about one-fourth) as well as the majority of job opportunities in the modern sector.
37 - It includes sub-constraints as: labor regulation, skills/education of available workers, cost of financing and access to financing.
38 - The formal labor market plays a key role in terms of resource allocation between sectors. It is worth to analyze because:
The formal sector, essentially urban and concentrated around the Greater Banjul Area, attracts a huge part of the population seduced by the existing income differentials. Indeed, in 2003 about one-in-four Gambians lived in the Greater Banjul Area, the region comprising the City of Banjul and the Kanifing Municipal Council;
The formal sector generates relatively high incomes. For instance, in 2006, survey data indicate that an unskilled production worker employed in the manufacturing sector earns in less than four month the equivalent of the annual GDP per capita;
Indirectly, the evolution of the formal labor market also affects the informal labor market which mostly attracts individuals (rural migrants or young graduates) who do not succeed in obtaining a job in the formal sector;
Finally, the functioning of the formal labor market partly determines domestic firms’ performance and hence, the evolution of the economic sectors analyzed in this report.
39 - Thus, besides common questions concerning the firms’ workforce, training and remuneration policies, the survey includes answers from 115 individual interviews with formal firms’ employees.
68

146. Although not so high in comparative terms, unemployment in The Gambia remains a source of concern. In effect, while the national unemployment rate is estimated to be at around 6 percent, the urban youth unemployment rate is very high, reaching around 22 percent in 2003. Underemployment does not seems to be a critical issue on the Gambian labor market, household survey data indicate that most categories of workers worked around 200 days or more a year and that, in the case of wage workers, most of them worked year round (Heintz and al 2008).
4.1.1. Institutional characteristics of the formal labor market in The Gambia.
147. One can think of several - non-exclusive - potential explanations for the persistence of high youth unemployment in the country. This could be linked to a lack of investment opportunities able to generate jobs, issues with the export sectors, and also, inter alia, to the inner working of the labor market which is largely determined by its institutional setting. In effect, various institutional elements can affect the functioning of the formal labor market and its ability to match supply and demand. Trade unions, the nature of the labor contracts, labor regulations and the circulation of information on this market can all have an impact on the efficiency of this market. These elements are now briefly analyzed.
148. Trade unions. The Gambia has ratified the Freedom of Association and Protection of the Right to Organize ILO Convention in 1948 and the Right to organize and Collective Bargaining ILO Convention in 194940. In 2004 and according to the ILO, approximately 30,000 workers were members of a union, around 4 percent of the labor force. However, labor unions appear to have a minor impact as most trade unions are small and fragmented41. Therefore, while collective bargaining is allowed, it does not seem to work well in practice even if some of these mechanisms at the industry level are formally in place (Heintz and al 2008) 42.
149. Overall, although the country's Labor Act gives private sector workers the right to form unions, to go on strike, and protects them against retribution from their employers, in practice this is inconsistently enforced because of insufficient and inadequately trained staff, both on the unions and administration side.
150. Survey data show that about 15 percent of the manufacturing firms indicate that some of their employees belong to a union; this proportion increases up to 40 percent in the retail services sector and 32 percent in the other sectors of the economy (Table A.4.1. 1). In almost all sectors, the trade union presence seems to grow with the size of the firm which is a fairly classical pattern. Moreover, in the manufacturing and retail services sectors, trade union presence is slightly higher in domestic firms than in foreign ones. Considering manufacturing firms that report the presence of at least one trade union, union membership among the firm’s workforce is about 59 percent. This membership rate seems also to increase with the size of
40 - Discrimination against or dismissal of members of registered unions while engaging in union activities is contrary to the law and generally the government offers protection against such acts. Moreover, there are no restrictions on participation in international labor activities by unions. The Labor Act allows workers to bargain collectively.
41 - The Gambian Worker's Confederation (GWC) and the Gambian Workers' Union (GWU) are the two main independent organizations. The GoG recognizes both organizations.
42 - Each recognized union has guidelines for its activities determined by the JIC, an arrangement among all of the active trade unions and their employers, which was drafted and signed by the unions. Unions are able to negotiate without government interference; however, in practice the unions lack the experience, organization, and professionalism to effectively negotiate.
69

the firm in all economic sectors. Finally, we note that even if unions are more present in domestic firms, they are better established in foreign-owned firms.
151. The nature of the labor contracts. The firm survey data suggest that a huge part of the full-time workforce of formal firms in The Gambia, between 70 and 81.5 percent according to sectors,43 has a permanent worker status. The remaining workforce is employed under casual full-time or part time contracts. In theory, under rigid employment termination rules, this high proportion of permanent workers may eventually hamper firms’ performance as this type of labor contract may not always allow for enough flexibility in the event of an economic downturn. However, in practice, it is unlikely to be major issues as labor regulations in The Gambia are rather flexible as shown below.
152. Regulation. The Labor Act, 1990 (LA) is the major source of labor market regulation in The Gambia. The country is well known for its flexible labor market practice. According to the 2009 IEF, Gambia's (has) relatively flexible labor regulations. Similarly, the Doing Business44
indicators show that labor market regulations in The Gambia are more flexible than the average for SSA and most countries, whether in 2006, time of the survey, or now (Chart 4.1.1).
153. The rigidity of employment is very low in The Gambia. It is twenty points less than the average of the SSA region and this underlines that procedures for employing workers are not complex and that there are few
Chart 4.1. 1. Labor market regulations in The Gambia.
47.1
12.7
71.2
27
11
8.7
0 20 40 60 80
Rigidity ofEmployment Index
Nonwage labor cost(% of salary)
Firing costs (weeksof wages)
SSA Gambia
Note: A value of 100 indicating maximum rigidity.
Source: "Doing Business 2007".
limitations in terms of hiring, working hours or retrenchment procedures. Non wage labor costs, which measures social contribution made by employers, are comparable to what is observed in the SSA region but, in terms of firing costs (expressed in weeks of wages due) The Gambia is much below the average.
154. In this context, it is not a surprise to note that firms’ managers do not consider labor market regulations a serious issue for them. Indeed, depending on sectors, none to 5.6 percent of the interviewed firms’ managers consider labor regulations as a “major” or “very severe”
43 - The proportions of permanent full-time workers among full-time workers in the manufacturing sector, services and the other sectors are respectively about 70.1, 81.5 and 79 percent.
44 - Doing Business 2007 measures the regulation of employment. It specifically examines the difficulty of hiring, nonstandard work schedules and paid annual leave, and the costs and rules governing redundancy termination. The main related indicators include: - Firing costs: The indicator includes notice requirements, severance payments and penalties due when terminating a redundant worker, expressed in weeks of salary;- Non wage labor costs: The indicator measures all social security payments (including retirement fund; sickness, maternity and health insurance; workplace injury; family allowance; and other obligatory contributions) and payroll taxes associated. The cost is expressed as a percentage of the worker’s salary;- The rigidity of employment index is the average of three sub indices: a difficulty of hiring index, a rigidity of hours index and a difficulty of firing index. All the sub indices have several components. And all take values between 0 and 100, with higher values indicating more rigid regulation.
70

constraint. Moreover, only a minority of firms - less than 8 percent - indicates that labor regulations influenced their hiring or retrenchment decisions.45
155. However, the previous should be considered in the light of other information coming from the survey. Indeed, it appears that firms only declare a small fraction of their workforce to the administration. In the manufacturing sector, firms only declare about 42 percent of their workforce to the administration. As well, firms of the “other economic sectors” only declare 43 percent of their workforce. Firms in the retail sector tend to be in an even more extreme situation towards the administration by declaring only 34 percent of their workforce. This may suggests that relatively to other issues, constraints linked to the labor regulation are indeed perceived as minor ones, but may still be restrictive enough to induce formal firms to under-evaluate the size of their workforce, probably for tax evasion purposes. This suggests that problems associated with labor regulations should not be totally neglected.
156. Labor market information. The functioning of the formal labor market can be affected by the circulation of information relative to job availability. In The Gambia, public announcement or advertisements for vacant or opening jobs are a very scarce practice. As a result, networks such as family or friends prevail. About 66 percent of firms and employees use these networks in the manufacturing sector (Table A.4.1. 2). The proportion of firms using these kinds of networks is even larger in other economic sectors. Public and private placement offices play a very minor role. Moreover, foreign-owned firms, which may generally use more formal recruitment means, rely more on such informal networks (family or friends) than domestic firms in the manufacturing sector.
157. Such a result can be understood as the consequence of informational deficiencies on the labor market. In an economy characterized by an abundant labor supply and difficulties to evaluate the true skill level of job seekers, firms use reliable (or at least considered as such) sources of information like friends, current employees or relatives to collect useful information before hiring. This may affect in a negative way the matching of supply and demand for labor as these informal networks do not guarantee that the collected information is neutral and truthfully reflects the actual skills of the job seekers.
4.1.2. The main characteristics of formal sector employees: education, training and health.
158. Hereafter we present the main characteristics of the formal sector employees in The Gambia. These individual characteristics come from personal interviews with employees and provide some explanatory elements of workers’ productivity levels and hence of firms’ performance in The Gambia.
Employees’ education and training
159. The linkages between economic growth and level of education are well-understood. The externalities generated by improved education levels (better adaptability, easier learning-by-doing) on growth can take two forms. First, improved education increases the intrinsic quality and productivity of the labor factor. Secondly, education can be seen as a specific factor of the growth process that increases the individual impact of the production factors (labor and capital) and hence TFP (Bosworth and Collins, 2003).
45 - This figures are 13.3 percent in the manufacturing sector, 4.8 percent in the retail services sector and 8.8 percent in the “other sectors”.
71
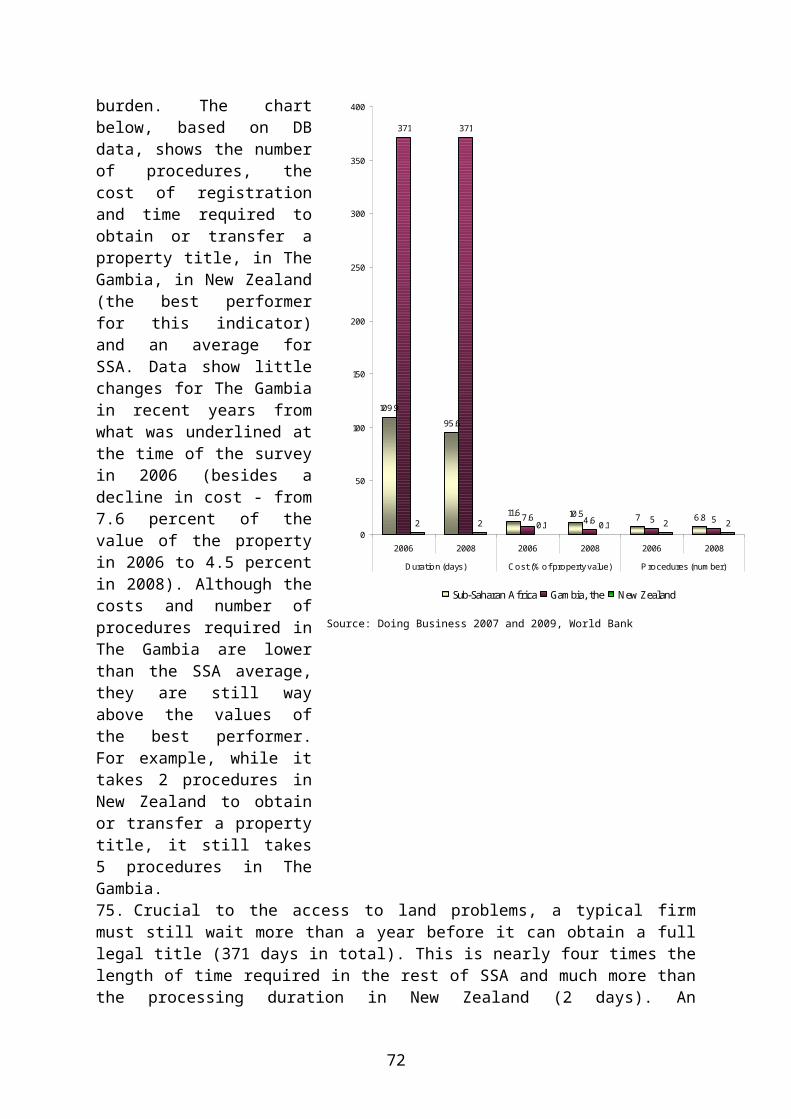
160. In spite of its importance, the sector has long been neglected in The Gambia. Although in recent years GoG spending on education has increased, between 2002 and 2005 only 8.9 percent of total public expenditure was on education, equating to just 2 percent of GDP - a relatively low figure (EIU 2009b). Despite limited resources, the education sector has benefited from an extensive government program of expanding infrastructure, teacher training and school materials. The sector has seen some important gains since the early 2000s. The literacy rate has increased from 35.5 percent in 1998 to 47.7 percent in 2004 for the whole population. However, it still remains low in comparison to regional levels of literacy, which were already above 50 percent in 1990. Access to education, across all levels of the school system, has improved a lot with a gross enrollment rate of 76 percent in 2006. Gender parity was attained at the basic cycle level (World Bank 2008a).
161. However, the system still faces many challenges which limit the scope of current improvements. In effect, the transition to higher grades for pupils is usually constrained by the limited number of schools, especially at the secondary level. Consequently, the system provides a large number of inadequately trained graduates who face stiff competition on entering a narrow formal labor market. Furthermore, available statistics suggest that government expenditures (on per pupil basis) are biased toward the non-poor. Hence, attendance figures are considerably lower for the children of poor households, and even lower for female children. Finally, drop-out rates, particularly among girls, remain high and there is a need to improve the quality and relevance of existing programs.
162. Therefore, further increasing access to education and improving the quality of mainstream schooling and vocational training are key improvements that the education system in The Gambia needs. Doing so will help promote future growth and poverty reduction, and help overcome the results of past weaknesses in this area with are fairly obvious in the data from the enterprise survey.
Chart 4.1. 2. Employees’ education levels in the manufacturing sector across selected countries.
Note: Exclusively for manufacturing firms. Employees Questionnaire.
Source: Enterprise Surveys, World Bank.
163. Chart 4.1. 2 compares the proportion of employees who achieved a given education level across some African countries for which firm survey data are available.46 The data 46 - The comparison is made on the basis of the “employees” questionnaire performed on manufacturing sector workers. These questionnaires are only available in firm surveys performed in the Africa Region. Therefore, the comparators are different from those mentioned in the rest of the report and come exclusively from Sub-Saharan Africa.
72

suggest that a large part of The Gambia’s manufacturing workforce - 38.5 percent - has achieved a general education level (secondary education). However, the Gambia has an extremely large proportion of employees without any education - 25.4 percent- far above what can be observed in the weakest countries of the sample, namely Burkina Faso and Niger.
164. Two other striking facts appear: The Gambia is one of the countries which displays the lowest proportion of employees
with a technical education (13.9 percent); The Gambia displays the lowest proportion of employees with university degrees in the
manufacturing sector.
165. Data further indicate that differences in educational levels persist between men and women (Chart 4.1.3). Although women are more represented than men at the primary level, they are under-represented at higher educational levels and even absent at the university level.
Chart 4.1. 3. Educational achievement of employees in manufacturing by gender (Pct.C).
Note: Exclusively for manufacturing firms. Employees Questionnaire.
Source: Gambia Enterprise Survey, World Bank
166. In a situation where almost half of the workforce has received no education or only a primary education and where technical and university education are under-developed, professional training provided by firms to their employees is a key element to improve workers’ qualifications and productivity. According to the data, almost one forth of manufacturing firms in Gambia provides formal training to their employees (Chart 4.1.4). Comparing this proportion to what was observed in other countries; the proportion of firms providing formal training is low, comparable to the situation in Mali and below what is observed in Senegal. Note also that the proportion of employees receiving formal training is very low compared to what was observed in countries like China or Brazil.
Chart 4.1. 4. Percentage of firms providing formal training.
73
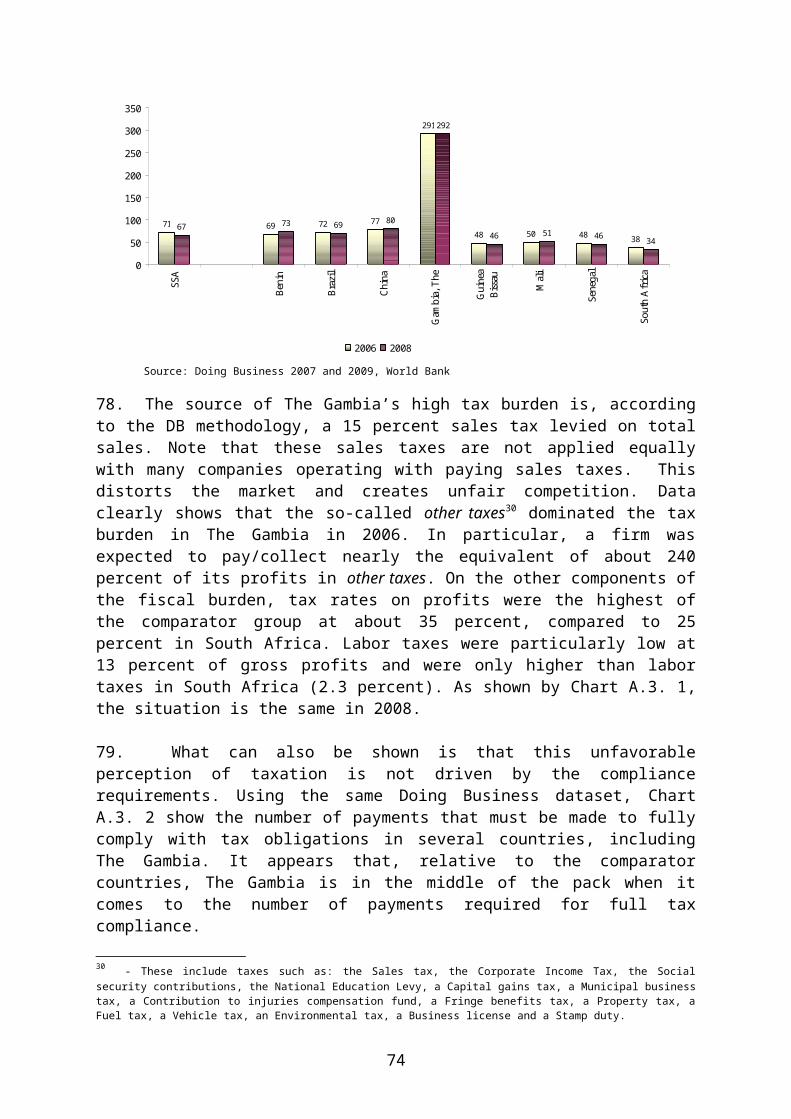
84.8
67.164.1
35.332.7
25.5
12.4
22.1
0
10
20
30
40
50
60
70
80
90
Chin
a
Braz
il
Sout
h A
fric
a
Beni
n
Sene
gal
Mal
i
Gam
bia
Gui
nea-
Biss
au
Note: Exclusively for manufacturing firms.
Source: Gambia Enterprise Survey 2006 and other Enterprise Surveys, World Bank
167. The proportion of employees receiving such formal training varies across sectors. This proportion ranges from zero percent in garments, to 48 percent for other manufacturing firms and almost 70 percent in food and beverage. The proportion of employees benefiting from formal training sessions in the manufacturing varies also with the size of firms and their ownership (Table A.4.1. 4); foreign-owned firms tend to rely more on formal training than domestic-owned ones. In the manufacturing sector, production workers are those who benefit the most from training, in proportion.
Chart 4.1. 5. Training needs expressed by employees (Pct).
Note: Exclusively for manufacturing firms. Employees Questionnaire. Pct of employees declaring that they actually wish to receive formal training.
Source: Gambia Enterprise Survey, World Bank
168. In terms of qualification needed to fulfill their tasks in a more efficient way, employees essentially wish to benefit from training session in the fields of creativity and innovation as well as technical and professional skills (Chart 4.1.5). In terms of workers category, most of the skilled and unskilled production workers (respectively 52 and 34 percent of them) declare they do not need any additional training. Directors and managers on the other hand express a
74

need to follow training sessions in the field of IT and production technology (directors) and marketing and technical/professional skills (managers).
Health status
169. It is important to assess the health status of the workforce because it has consequences on workers’ productivity. At this level, the situation in The Gambia is quite unusual in comparison of other African countries for which recent data are available.47 Indeed, the health status of the workforce seems to be worse than in other countries but the number of workdays lost due to illness remains comparable. This suggests a high frequency of minor diseases. Moreover, the expenses linked to treatments are high but seems to be shared between employers, insurance companies and extended households.
Chart 4.1. 6. Employees’ health status.
Note: Exclusively for manufacturing firms. Employees Questionnaire.
Source: Gambia Enterprise Survey 2006, World Bank
170. Considering our workers sample, almost 35 percent of manufacturing workers, who have accepted to answer that question, report having been ill within the last 30 days preceding the survey. This proportion is well above what was observed in other selected countries. However, following these diseases, about 3 workdays were lost during the month preceding the survey. In other words, even if the frequency of illness is high, their impact is relatively limited. This figure puts The Gambia within the average of our sample of African countries. Note that even if this seems relatively low, it is still equivalent to a 16 percent diminution of the working time.
171. Like in other countries, a huge proportion of employees, 84 percent, obtain treatments from public facilities in case of illness. This situation differs from what is usually observed in Anglophone countries (Kenya) where employees rely essentially on the private sector. This can be easily explained by the weakness of public services in these countries. Focusing on the various possible financial arrangements in case of illness, The Gambia appears to be an outlier as we cannot observe a dominant type of financial arrangement.
172. Indeed, in a country like Benin, the costs of treatments are essentially borne by the employee’s household whereas in Senegal these costs are fully or partially reimbursed by the employer. In The Gambia, all types of financial arrangements seem to be used by employees.
47 - The comparison is made on the basis of the “employees” questionnaire performed on manufacturing sector workers. These questionnaires are only available in firm surveys performed in the Africa Region. Therefore, the comparators are different from those mentioned in the rest of the report and come exclusively from Sub-Saharan Africa.
75

Contrary to other countries, we also note that a large proportion of employees (21 percent) regard the costs of treatment as negligible. We also note that private insurance mechanisms seem to be well developed as 26 percent of employees rely on this type of financial arrangement. Finally, the data underlines the importance of solidarity mechanisms as almost 25 percent of employees rely on financial supports from friends or family which do not belong to the household (Table A.4.1.6).
4.1.3. Employees earnings.
173. The data on earnings, presented hereafter, were provided by employees of the manufacturing sector themselves during individual interviews. In each firm, a minimum of one employee per category was interviewed. During the firm survey, data concerning average and global remunerations as well as employment levels for other sectors were also collected at the firm level. First, we study the level and structure of the workers’ remuneration by taking into account all the remuneration’s components (wage, allowance and performance bonus). Then, we analyze the wage determination mechanisms. Earnings: level and structure.
174. Table 4.1.1 presents the structure of employees’ monthly cash earnings, expressed in dollars according to the average exchange rate observed in 2006. Over the sample of manufacturing firms the average monthly earning is about 103 dollars. The magnitude of the standard deviations indicates that the remunerations strongly vary inside each job position. Moreover, wage differentials are large between job positions as an unskilled production worker earns on average 71.6 dollars per month, whereas a manager earns 128.4 dollars per month in the manufacturing sector. Finally, we note that the wage dispersion, measured by the standard deviation, tends to increase with the hierarchical position of workers.
Table 4.1. 1. Monthly cash earnings by job position in 2005, manufacturing sector (USD). Wage Allowance Bonus Total
Director and Manager Average value 120,5 7,9 0,0 128,4% Wage composition 93,9 6,1 0,0 100,0% of employees with 100,0 23,1 0,0 -Standard deviation 54,5 16,5 0,0 55,4Frequency 13 13 13 13
Skilled Production Worker Average value 105,9 3,5 3,0 112,5% Wage composition 94,2 3,1 2,7 100,0% of employees with 100,0 23,8 19,0 -Standard deviation 73,1 9,4 13,2 81,8Frequency 42 42 42 42
Unskilled production worker Average value 63,6 5,6 2,4 71,6% Wage composition 88,7 7,8 3,4 100,0% of employees with 100,0 43,5 30,4 -Standard deviation 33,5 8,8 4,5 37,3Frequency 23 23 23 23
Sample Average value 95,9 4,9 2,3 103,1% Wage composition 93,0 4,7 2,3 100,0Standard deviation 64,0 10,7 10,0 69,9
Frequency 78 78 78 78
Note: Exclusively for manufacturing firms. Employees Questionnaire. Source: Gambia Enterprise Survey, World Bank.
175. Over the sample, wages account for about 93 percent of the total remuneration, the remaining 4 percent is divided between allowance and bonus. Note that the bonus component, which may correspond to a productivity premium, is very small, 2.3 percent of the total remuneration.
76

176. However, the structure of earnings in terms of allowances and bonus differs across job positions. The proportion of bonus and allowances in total earnings tends to decrease with the hierarchical position of the worker. Thus, the wage represents 93.9 percent of the directors/managers’ earnings while it only represents 88.7 percent of the unskilled production workers remuneration. Focusing on the proportion of employees who benefits from non-wage payments, we note that it also decreases with the hierarchical position of the worker. For instance, neither directors nor managers receive yearly performance bonus while 30 percent of unskilled production workers do. Finally, the value of these allowances and bonus, relative to the remuneration also decreases with the hierarchical position. This surprising structure of earnings may highlight the fact that bonus and allowances do not only reflect workers’ productivity. They introduce some flexibility into the workers remuneration. In case of bad events, the firm can cut down bonus and allowances for unskilled production workers, as wages are much more difficult to adjust downward.48 On the other hand, managers and directors, whose wages can be negotiated directly with the firm, are insured against bad events and are able to renegotiate their wages.
177. Focusing on gender segmentation, we first notice the low level of women employment in the manufacturing sector. Indeed, women only hold 13.6 percent of permanent positions in the sector. Focusing on the unskilled production worker position, differences in remuneration between men and women appear to be huge as the average wage differential is about 55 percent in favor of men (Chart 4.1.7).
Chart 4.1. 7. Remuneration differential between men and women (unskilled production worker).
0.44
1.00
0.00
0.20
0.40
0.60
0.80
1.00
1.20
Women Men
Note: Manufacturing sector. Employee’s questionnaire.
Source: Gambia Enterprise Survey, World Bank
Chart 4.1. 8. Remuneration differential.
1.00
0.87
0.73
0.37
0.00
0.20
0.40
0.60
0.80
1.00
1.20
Retail and IT Other Manufacturing Informal
Note: Firms’ accounting data.
178. At the subsector level, data also underline the presence of strong differentials. The average earnings49 are 27 percent lower in the manufacturing sector and 63 percent lower in the informal sector than those observed in the retail and IT sector (Chart 4.1.8).
48 - Because wages, in particular unskilled production workers ones, are fixed through collective agreements that cannot be easily renegotiated.
49 - Obtained by dividing the firms’ total wage bill by the total number of workers employed by the firm.
77

179. At this stage, it is useful to examine the pattern of earnings of unskilled production workers. Unskilled worker earnings are usually the most homogenous of the wage categories and thus fairly comparable across firms and countries. In addition, the wage level of unskilled production workers also serves as a barometer for foreign firms when they decide whether or not to invest in a country.
180. Data suggests that the unskilled production workers’ average remuneration strongly vary according to the firms’ size, commercial status (exporting or non-exporting firms), and economic sectors. Descriptive analysis shows that small firms, exporting firms and garment firms pay more, on average, their unskilled production workers (Table A.4.1.7). Data also suggest that the average remuneration of unskilled production worker in The Gambia is moderate (Chart A.4.9). It belongs to the average range observed in Sub-Saharan Africa. This remuneration is well below what was observed in South Africa and Brazil and comparable to what was found in Uganda and Benin.
Chart 4.1. 9. Monthly earnings for unskilled production workers in 2005, manufacturing sector (USD).
Note: Exclusively for manufacturing firms. Current NER.
Source: Gambia Enterprise Survey 2006 and other Enterprise Surveys, World Bank.
Wage determination.
181. These results indicate that remuneration in The Gambia is relatively low in manufacturing. The data also suggest that the issue of earnings differentials in The Gambia deserves greater attention. There appears to be a large variation in wages across sub-sectors and it is plausible that the labor market is not fully integrated. It is thus required to analyze in greater depth the factors which are at the root of this situation.
182. First, it shall be kept in mind that even if the regulatory burden is not so heavy in The Gambia, it still influences the wage setting mechanism. This regulatory burden relies on a minimum wage mechanism which is a compulsory lower bound for remuneration in the formal sector.50 Moreover, some labor market regulation are negotiated through collective agreement, in particular minimum wages and working hours are established through six JIC, comprising representatives from labor, management, and the government.
50 - The minimum wage was approximately 1.79 dollars per day for unskilled workers in 2006.
78

183. In such a frame, the wage determinants will be, besides individual workers abilities, the balance of power between trade unions and firms as well as the general state of the labor market. A simple way to understand the wage determination mechanism is to estimate wage equations with workers data (see Annex 4).
184. Three econometric models are estimated. The first one is an extension of the seminal model of Mincer (1974) which assumes that employers are able to discover differences in productivity between workers by looking at their human capital, nationality, gender… and to adjust their remunerations consequently. The second model is more complete and includes, besides worker’s individual characteristics, some variables capturing various institutional wages fixing mechanism (Azam and Ris, 2001). Finally, the last model includes all the preceding specifications and tries to address the non-significance issues of some key variables encountered during the estimation of the second econometric model.
185. The results obtained from these econometric estimations are rather clear (Table A.4.1.8). The wage formation mechanism in the manufacturing sector in Gambia seems to result from some kind of rent-sharing.51 The other alternative theories of wage determination, namely the efficiency wage theory52 and to a lesser extend the hold-up theory53 do not have a satisfactory explanatory power.
186. We note that the level of experience obtained before the current employment affects positively and significantly the level of remuneration. Moreover, the fact that the worker is a foreigner also increases the wage. The fact that the gender dummy is not significant underlines the absence of some intrinsic gender discrimination on the manufacturing labor market. Hence, the large wage differentials between men and women described earlier seems to be due to an educational and/or experience deficit for women who cannot access higher paying jobs. We also note also that individual firms’ characteristics partly determine the wage. The fact that the firm is young and foreign-owned increases significantly the level of remuneration.
187. Importantly, the rent-sharing phenomenon between firms and workers seems to affect positively the level of wages. However, this phenomenon does not seem to come from any trade union pressures (the variable indicating a trade union presence within the firm is not significant, this is consistent with evidence of the relative weakness of unions in the country), neither from existing tensions on the labor market. In addition, the hierarchical position inside the firm influences significantly the size of the rent captured by workers. Indeed,
51 - The rent-sharing theory suggests that the remuneration paid to the workers actually includes a share of the firm’s profit ("the share") and thus reflects the firm’s performances (Blanchflower, Oswald and Sanfey, 1996).
52 - The efficiency wage theory, stipulates in one of his variants that the firms should pay wages above workers’ marginal productivity (i.e. above the wage that would led to the labor market clearing condition). The intuition is quite straightforward: knowing that the worst penalty that a worker can encounter is the loss of his job, the cost of this loss for the worker is increasing with the wage he receives when he is employed. Hence, the firm can use high wages as a means of increasing the threat of being fired when caught shirking. As a result the firm has two means to enhance worker’s effort: either it increases the supervision of the worker’s effort, to increase the probability of unmasking shirking workers, or it can offer a higher wage to increase the loss of being fired. As a result, the firm faces a trade off between supervising workers, which is costly in terms of supervision technology and offering higher wages to increase workers efficiency. 53 - Another way to explain the wage determination is the hold-up theory (Malcomson, 1997). This theory assumes a situation where labor contract are not complete and hence can be renegotiated, in particular when the firm has made a specific investment that cannot be easily resold. This new investment leaves the possibility for workers to renegotiate the wage agreement in their favor. As a result, workers can obtain an additional rent from the surplus generated by this new specific investment. However, the firm may internalize the renegotiation of the labor contracts and hence reduces its level of investment.
79
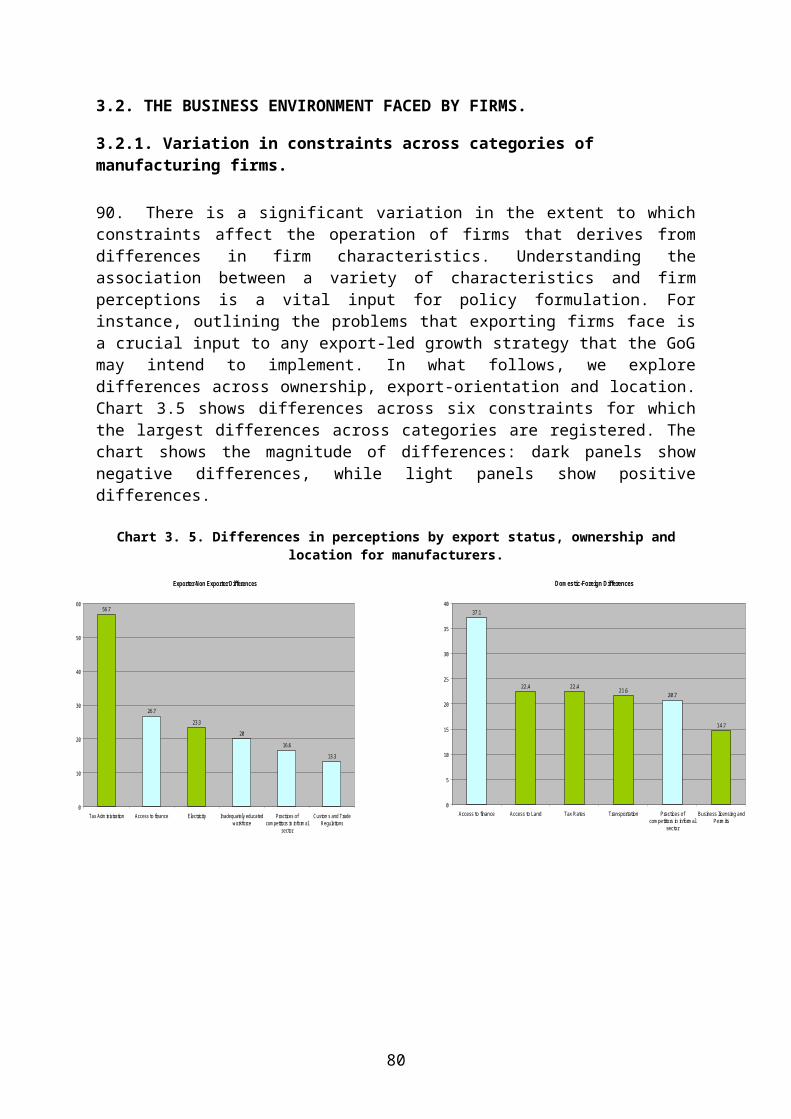
directors and managers manage to take over a larger share of the firm’s profit (through a higher fixed component of their remuneration) than less skilled workers.
188. Finally, we observe that the hold-up variable influences positively the wage rate (at only 10 percent significance level) which may underline the presence of some labor contract renegotiation. This may explain why directors and managers do not benefit from allowances and performance bonus: they prefer the security of wages (which can be renegotiated in favorable economic conditions) to the fluctuations of bonus and allowances (which can be reduced by the firm in case of economic difficulties).
4.1.4. Conclusion.
189. Labor market issues do not appear as a major constraint for manufacturing firms in The Gambia. This perception is quite consistent with what is known of the working of the formal labor market in the country. In effect, at the institutional level, unions have a relatively limited role and labor regulations are fairly flexible by SSA standards. Wages and employees earnings are relatively low and the wage setting mechanism is largely based on a kind of rent-sharing scheme at the firm level.
190. However, some issues persist. In effect, levels of education of employees currently in activity appears to be quite low - a legacy of past limited interest on the GoG side, a trend fortunately reversed now - and employees seem to fall frequently ill. Both issues should be addressed as they hamper further improvements in labor productivity.
80

4.2. FIRM'S FINANCE IN THE GAMBIA: SOME DEMAND ASPECTS.
191. As shown in the previous chapter, access to finance is the second most important constraint for 34 to 58 percent of the formal firms. It is also an important constraint for informal firms. In this context, it is especially important to have a better understanding of the working of this specific market in The Gambia.
192. The object of this section is therefore to provide an analysis of the main sources of finance for firms, with a special focus on bank finance. It is important however to also remember that the availability and the cost of capital rely on the fundamentals of supply and demand. An analysis of supply conditions, which requires inter alia an examination of macroeconomic conditions, of budget financing and of the efficiency of the related legal framework is not addressed here. Such issues are not looked at by enterprise surveys - they are usually addressed within the FSAP framework. Therefore, the following analysis is focused on the demand side and the perception of firms.
4.2.1. An overview of the financial sector in the Gambia.
193. The Gambia’s financial sector consists of commercial banks, insurance companies, foreign exchange bureaus, microfinance institutions and other non-bank finance companies. The Gambian financial system is relatively small and is dominated by the banking system. By of the end of December 2006, the banking sector in The Gambia comprised 7 private commercial banks. By 2009, the number of bank had increased to eleven54. The top two banks still control around three-fourth of the banking sector’s assets despite a slight erosion on their market share following the licensing of a few new banks since 2002.
194. This pattern of asset concentration in a few banks is much more salient in The Gambia than in many neighboring countries, for example in Senegal the top three banks control roughly 60 percent of total banking assets. As the time of the survey in 2006, the Gambian banking sector was relatively sound and profitable and is still considered as such now (EIU 2009b). Furthermore, the ratio of non-performing loans over gross loans was among the lowest in the ECOWAS zone in September 2006. It amounted to 13 percent which compared favorably to the level in Senegal (13.3 percent). Gambian banks profitability also compared favorably to the performance of the sector in neighboring Senegal where in 2004 ROAs averaged 6.5 percent while the ROA for Standard Chartered Ltd (the largest bank in the country) was 15 percent. When benchmarked with comparable banks (in terms of size), Gambian banks usually perform better than their African counterparts.
195. Despite its relative soundness, several indicators suggest that the Gambian Financial system remains nonetheless slightly underdeveloped and does not serve the private sector as much as it should. The ratio of money and quasi-money (M2) as a percentage of GDP was around 48.5 percent in 2006 (Chart 4.2.1). Although larger than the SSA average (35.9 percent), is still relatively low with respect to some comparator countries such as Brazil, China and South Africa. Intermediation indicators reveal also that The Gambia is somehow lagging behind many other African countries. The loan to deposit ratio averaged 45.5 percent between 2000 and 2004 compared to 70.6 percent in other SSA countries. This ratio is 20 percent under the median value in SSA. Comparatively low returns 54 - Banks in activity in The Gambia include: Standard Chartered Bank (Gambia) Ltd, Trust Bank Ltd, Bank PHB, Arab Gambia Islamic Bank, First International Bank, Guaranty Trust Bank (Gambia) Ltd, International Commercial Bank (G) Ltd, Access Bank Gambia Limited Ecobank (Gambia) Ltd, Banque Sahelo-Saharienne pour L'investissement et commerce (BSIC) and Oceanic Bank (Gambia) Limited.
81

on deposits (by reducing incentives for saving) and high lending interest rate (by discouraging investment) are potential factors that might explain the relatively low intermediation level observed in The Gambia.
Chart 4.2. 1. Ratio M2 over GDP in 2006 (Pct.)
28.2
28.3
35.9
54.7
60.0
48.5
152.1
0.0 50.0 100.0 150.0 200.0
Benin
Mali
Sub-SaharanAfrica
Gambia, The
Brazil
South Africa
China
Chart 4.2. 2. Domestic credit to the private sector in 2006 (Pct. of GDP).
17.2
17.2
41.1
65.9
113.0
15.6
160.8
0.0 50.0 100.0 150.0 200.0
Gambia, The
Benin
Mali
Brazil
Sub-SaharanAfrica
China
South Africa
Source: DDP dataset, September 2008 Update, World Bank.
196. Furthermore, the credit to domestic private sector hardly amounted to about 16 percent of the GDP in 2006 (Chart 4.2.2), falling far short from the Sub-Saharan Africa average that amounted to 65.9 percent.
197. The insurance sector in The Gambia is small in terms of assets. As of December 2008, 11 insurance companies were operating in the country, with eight focusing on non-life insurance.
198. Micro-finance is becoming more prevalent, with about 20 microfinance institutions operating in the country. Recently, two commercial banks have entered the microfinance industry. The Central Bank has put in place prudential guidelines based on the principles of reducing barriers to the entry of new non-bank financial institutions in the sector, regulating the service providers through licensing, financial reporting and accountability, and making the mobilization of savings mandatory (AfDB).
82
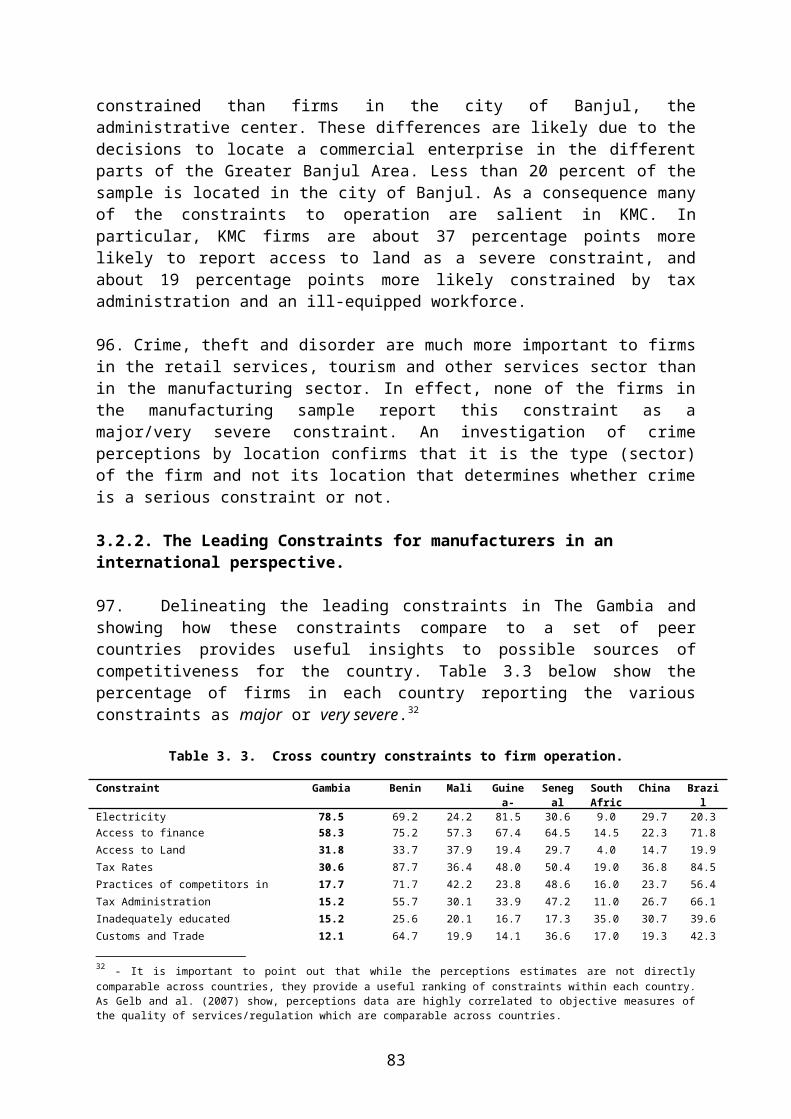
4.2.2. Perception of finance matters as a constraint.
199. Similar to many other SSA countries, enterprises in The Gambia voice strong concerns in this area. Depending on the sector of activity, 34 to 58 percent of formal Gambian firms and 64 percent of the informal enterprises rate access to finance (availability and cost) as a major or very severe obstacle to their operations and growth.
200. In manufacturing, for which comparable data from enterprise surveys are available, 58 percent of the firms consider access to finance (availability and cost) as a major or very severe obstacle. It is high relative to what is observed in middle income comparator countries such as South Africa (15 to 19 percent) and China (21 to 23 percent). However, this is close to the values observed in neighboring low income countries such as Senegal (55 to 64 percent) and Mali (56 to 57 percent).
Chart 4.2. 3. Perception of access to finance as an issue across categories of firms.(Pct. of firms which quote the item as a "major" or "very severe obstacle")
58
43
34
45
35
72
46
39
32
4946
4945
39
49
60
0
10
20
30
40
50
60
70
80
Man
ufac
turi
ng
Serv
ices
Oth
ers
Smal
l
Med
ium
Larg
e
Non
Aud
ited
Aud
ited
Dom
estic
Fore
ign
Expo
rter
Non
-exp
orte
r
0-5y
ears
5-10
yea
rs
10 y
ears
+
Form
al S
ampl
eSector Size Accounts Ownership Trade orientation Age Total
Source: Gambia Enterprise Survey, World Bank
201. The percentage of firms rating access to finance as a serious obstacle varies along firm’s characteristics. With respect to size, larger firms are more concerned with access to financing than their smaller counterparts. Similarly foreign companies rated more often access to finance as a very severe or a major constraint than domestic Gambian companies. Furthermore, age does not seem to play a key role in the perception of access to finance as an obstacle. Finally, exporters are slightly less likely than non-exporters to voice concerns regarding finance.
202. The above numbers reveal differences in perception across types of firms. In order to determine whether these differences can be linked with firms’ characteristics in a statistically significant way, we run a Probit regression of perception data about finance as an obstacle on some of the characteristics of the firms such as its ownership, whether or not the accounts are audited, its size (proxied by the natural log of sales), its age, … (Table 4.2.1). Estimation results are presented below. In accordance with the descriptive statistics, it appears that ownership significantly affects the probability that a firm perceives access to finance and cost
83

of finance as a very severe or major constraint, in other words this characteristic significantly determines firm’s perception The results indicate however that neither the age of the firm nor the audit of accounts, or any other explanatory, variable have a significant impact on the perception of finance as an obstacle.
Table 4.2. 1. Regression of access to finance perceptions on selected firms variables.
4.2.3. Financing Structure.
203. The limited use of bank financing for long term investments in an international perspective tends to confirm the concerns voiced by Gambian firms on access to finance and cost of finance as an obstacle to growth and development. Internal funds and retained benefits appear to be the main source of funding of long term assets for Gambian companies
204. As revealed by Chart 4.2.4, the share of long term investments financed with bank funds in The Gambia is the lowest among comparators countries. At the sector level, Chart 4.2.5 shows that internal funds represent 64.7 to 89.7 percent (respectively for manufacturing enterprises and informal firms) of funds used to finance long term investments. The use of bank finance remains very limited for manufacturing or retail services enterprises (less than 13 percent of the global long term investment) and almost non-existent for other sectors and micro/informal enterprises. Personnel network support (family, friends) is slightly more important, especially in manufacturing. Such funds provide up to 15 percent of the long term investment needs in the manufacturing sector.
Chart 4.2. 4. Pct of long term assets funded by bank credit.
Chart 4.2. 5. Financing structure of long term assets by sector.
Major or severe constraints =1
significant at 5%
Dependant Variable Access / cost of finance
Other response = 0
Ownership(2.82)**
Audit(-0.45)
Logs Sales
(-0.33)Age of the firm
(-1.16)Woman as the principal owner
(-0.83)Perception of corruption
0.294
-0.053
-0.021
-0.06
-0.096
0.07(-0.73)
Observations 115Absolute value of z statistics in parentheses * significant at 10%; **
84
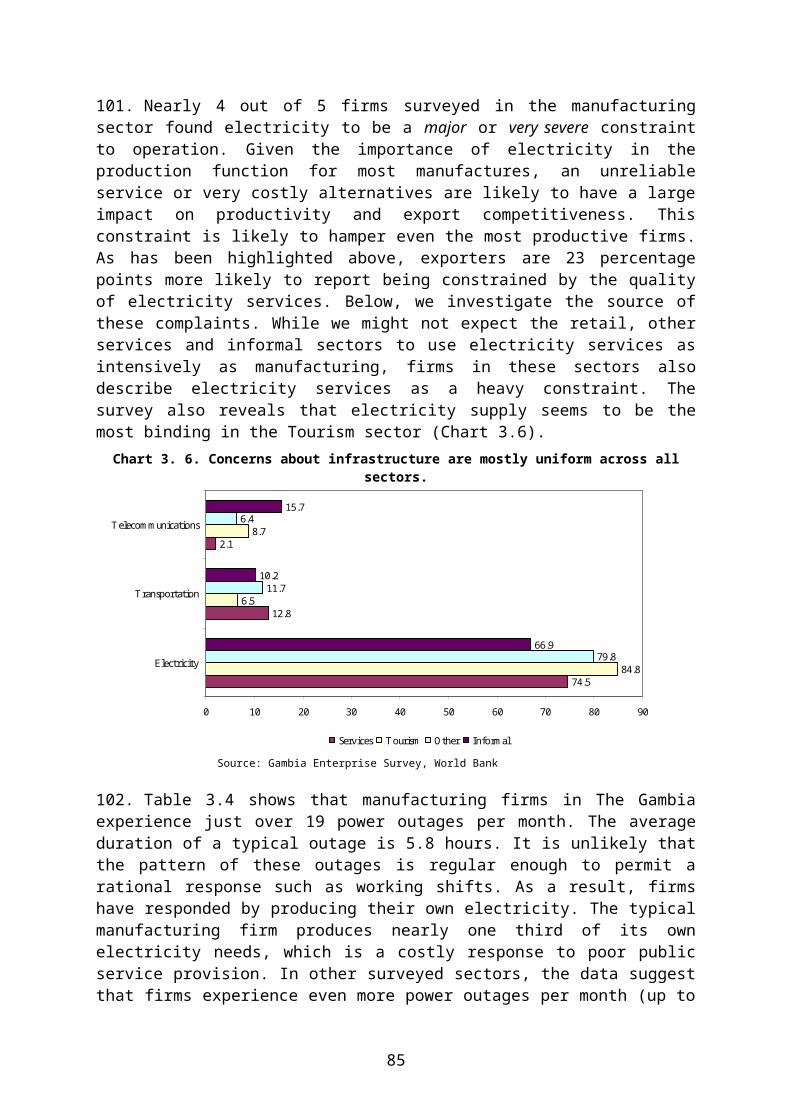
11.7
14.3
16.5
17.7
20.4
32.0
4.7
0.0 10.0 20.0 30.0 40.0
Gambia
Mali
Brazil
South Africa
Senegal
China
Benin
Note:Manufacturing only.
Source: Enterprise surveys, World Bank. Source: Gambia Enterprise Survey, World Bank
205. The reliance on internal funds documented above suggests that investment projects launched by Gambian companies do not always go through the banking sector screening process and might be sometimes of low quality, which may help to explain the low levels of productivity observed (see Chapter 2). Moreover, it epitomizes the lack of access to alternative source of financing for Gambian companies.
Chart 4.2. 6. Impact of location on financing structure of long term assets.
73.33
7.5
66.1
62.5
25.0
59.7
0 20 40 60 80
Internal funds
Loans fromprivate bank
Is Finance aserious constraint
Out of Industrial Zone Industrial Zone
Source: Gambia Enterprise Survey, World Bank
206. Even though operating in an industrial zone does not significantly modify firms’ financing structure, Chart 4.2.6 suggests that it has a nonetheless positive impact on the source of finance they use. In fact, this category of enterprise finance 25 percent of their long term assets with bank credit, compared to only 7 percent for firms operating outside of the industrial zone. This naturally reduces the share of internal funds on the financing of long term investments even though it remains predominant. It is interesting to note that using more
85

bank funds affect the perception of firms located on industrial zones regarding finance as a constraint. Chart 4.2.6 shows that they are slightly less concerned about access to finance than other firms.
4.2.4. Who uses bank finance?
207. In the remainder of the study, we will consider that an enterprise has access to bank financing if it currently has a loan or a line of credit from a bank at the time of the survey.
Chart 4.2. 7. Access to bank finance.
33.1
12.214.7
9.1
31.1
48.2
6.2
36.4
13.8
21.3
6.1
24.7
55.5
0.0
4.2
11.1
0.0
10.0
20.0
30.0
40.0
50.0
60.0
Man
ufac
turin
g
Serv
ices
Oth
ers
Smal
l
Med
ium
Larg
e
Non
Aud
ited
Aud
ited
Dom
estic
Fore
ign
Rent
Ow
n
Expo
rter
Non
-exp
orte
r
Info
rmal
sam
ple
Form
al S
ampl
e
Sector Size Accounts Ownership Land Trade orientation Total
Source: Gambia Enterprise Survey, World Bank
208. Consistent with the level of concerns expressed by firms with respect to access to finance, only 11.1 percent of formal firms of the sample had either a loan or a line of credit at the time of the survey. Microenterprises and informal firms face even more difficulties on the credit market since only about 4 percent of them report having access to finance. Chart 4.2.7 shows that manufacturing enterprises enjoy a better access to bank finance than firms operating in other sectors. In fact, about 1 manufacturing enterprise out of 3 had a bank loan or a credit line in 2005.
209. Unsurprisingly, firm size is strongly associated with access to finance. The percentage of firms with a bank loan or a line of credit increases with size: 48 percent of large firms have access to bank finance compared to 31.1 percent of medium size firms or 9.1 percent of small firms. Gambian owned firms are less likely to report having access to finance than firms with foreign ownership. This pattern is probably a consequence of the strong correlation between size and ownership and on the other hand the positive correlation between size and access previously documented. Some other factors brought by foreign investors such as quality of information might as well explain the significant impact of ownership.
210. Similarly, the credibility of financial information positively affects access to finance. Firms that do not have audited accounts are much less likely to report access to finance. In fact only 6.2 percent of such companies had a loan or a credit line in 2005 as opposed to 36.4
86

percent of firms with audited accounts. Land ownership matters also as it can be used as collateral when requesting bank finance. Among firms that own at least a portion of their workplace 24.7 percent report having access to finance, four times the proportion in the category of firms renting the land they use. Finally, presence on the export market is a key element with respect to access to finance. None of the non-exporting firms reported having access to finance.
Table 4.2. 2. Regression of access to finance indicator on firms specific variables.
211. In order to gain a deeper insight about the determinants of access to finance, we run a regression on a set of explanatory variables such as the firm nationality, the presence of audited account, the age, the gender of the owner, the size (proxied by the log of sales), land ownership, sector of activity … Three specifications are tested and estimations results are presented above in Table 4.2.2.
212. Results show that having audited accounts and being the owner of its land are two positive and statistically significant determinants of access to finance in The Gambia. Not surprisingly, these estimates also show that women owned firms struggle more to access finance, the coefficient attached to the corresponding variable is negative and significant.
87
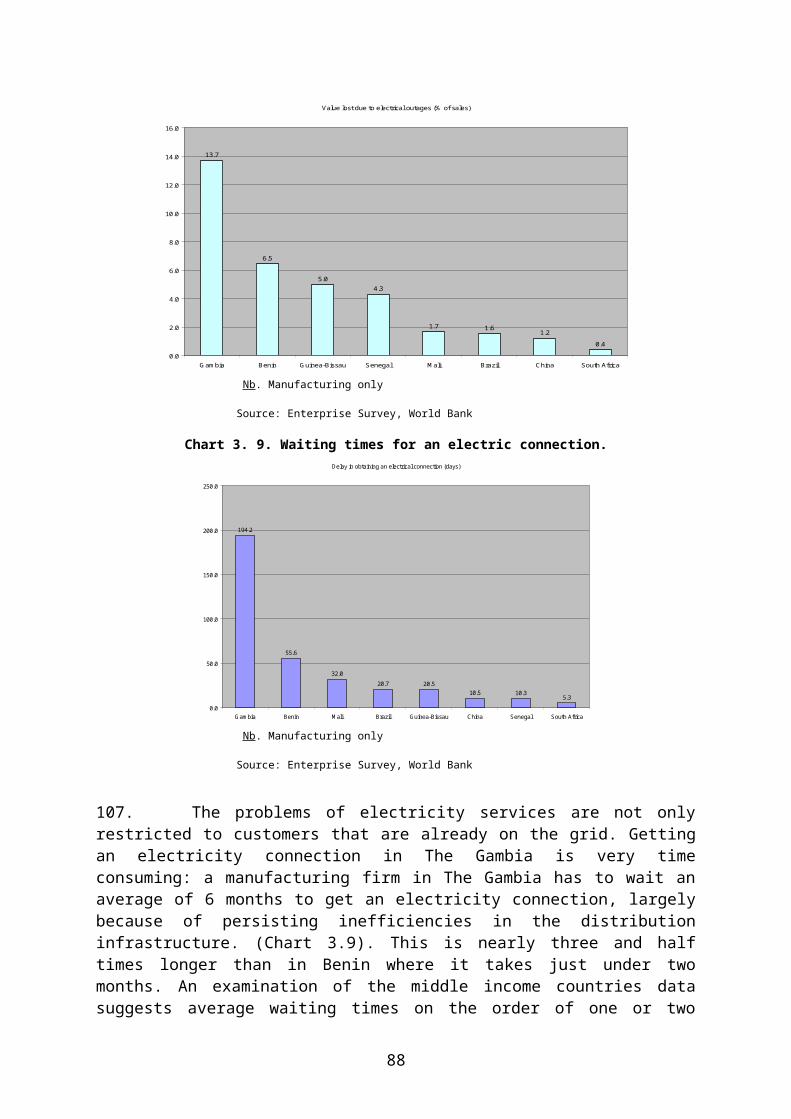
4.2.5. The process of obtaining credit.
213. The analysis of the process of demand of credit by firms yields further interesting insights about access to finance for firms in the Gambia.
A large proportion of firms do not apply for credit.
214. A firm may decide to apply for bank financing or choose to not do so (irrespective of whether or not it needs financing). This last category is dominant in The Gambia. About 86 percent of the formal firms surveyed did not apply for a bank credit in 2005 (Figure 4.2. 1). Within this group of firms which did not apply for any kind of bank funding, 63 percent of them reported a need for financing that same year. In other words, a significant proportion of the firms decided - rightly or wrongly - to stay out of the credit market even if they needed funds. Manufacturing, and to a lesser extent, services/retail firms were more likely to refrain from applying for a bank credit.
215. Several reasons are put forward by firms to explain their choice to forego bank financing. What is important to note is that, irrespective of the sector, cost of finance is the most common reason reported by enterprises. Manufacturing firms placed the complexity of the application procedures second among the reasons for not seeking bank credit, as opposed to many retail firms which just expected a rejection.
Table 4.2. 3. Reasons for not applying for a credit.
Manufacturing Retail Others 5 to 9 employees 10 to 49 employees > 50 employeesDo not need a loan or a line of of credit 23.8 27.8 42.4 33.1 44.1 75.9Need a credit or a line of credit but did not apply for it 76.2 72.2 57.6 66.9 56.0 24.1
Reason for not applying for a bank creditInterest rates are not favorable 28.3 27.8 23.7 21.6 39.5 24.1
Application procedures for loans are too complicated 1.3 16.7 13.6 16.1 3.7 0.0others 14.1 2.8 0.0 13.5 6.0 0.0
Collateral requirements are unattainable 10.2 5.6 11.9 10.9 3.7 0.0Did not think it would be approved 14.1 16.7 8.5 2.2 3.0 0.0
size of loan and maturity are insufficient 8.1 2.8 0.0 2.3 0.0 0.0
Sector Size
Source: Gambia Enterprise Survey, World Bank
A small proportion of firms requested funding, but a majority of applications was accepted.
216. None of these reasons reported above was a strong enough deterrent to prevent about 14 percent of formal firms from applying for a bank credit (Figure 4.2.1). Nearly half of these firms operated either in the retail or the manufacturing sector. Firms with some foreign ownership and firms with audited accounts were also more likely to submit bank credit application.
217. Figure 4.2.1 reveals that the vast majority of credit applications were accepted. In fact of the 25 firms that submitted to banks a credit application, 17 reported being accepted (68 percent of acceptation rate). This suggests that submitting an application might (almost) be tantamount to obtaining a positive answer. For the few firms (8) turned down by banks, the key reason for rejection was a poor credit history (3 firms) and incomplete applications (2 firms).
88
Figure 4.2. 1. Steps of the demand for credit in the formal sector.
Source: Gambia Enterprise Survey, World Bank
89

218. The minor role of bank financing in The Gambia can be explained by the fact that, although when firms submit an application their demand are mostly accepted, many firms decide to stay out of the credit market, largely on the account of perceived constraints (high interest rate and complexity of applications). As a consequence (Figure 4.2.1) although many firms needed funding (66.7 percent of the sample), only 14.7 percent of them obtained a credit/line of credit as roughly 78.4 percent of them decided to not ask for any funding from the banks. This suggests that the mechanism at play in the Gambia at the time of the survey had little to do with credit rationing per see and was more related to a process of self-exclusion by firms.
4.2.6. Credit Characteristics.
219. Data show that banks mostly grant short term credit to Gambian companies. In fact the average credit maturity is about 9 months, much shorter than the average maturity in Senegal (132 months) or Mali (72 months). As noted in World Bank (2007b), long term financing for productive investment is largely unavailable in The Gambia, especially for small and medium enterprises. It is noteworthy that manufacturing firms have slightly longer term credit.
Larger firms or those operating in the manufacturing sector receive more financing than firms in other sectors.
220. Most of bank credits required pledging of some sort of collateral; over 83 percent of formal firms in The Gambia, irrespective of their size, pledged collateral for their most recent credit. Some differences exist across sectors however: this proportion reaches 100 percent in the retail/service sector while it is only around 71 percent in manufacturing. In addition, the value of collateral required as a percentage of loan value is very high and averages 220 percent. It is higher for small firms than for medium sized ones.
Table 4.2. 4. Current credit characteristics.5 to 9 employees 10 to 49 employes > 50 employees
Manufacturing Retail Others Formal FirmsAmount at the time of approval (Dalasis) 3.24E+06 4.39E+06 1.77E+05 6.64E+05 6.79E+06 1.12E+06 2.60E+06Annual interest rate 18 27.31 13.1 25.66 29.2 17.5 21.57Duration (months) 6.5 12.35 5.03 13.33 9 6.72 8.79Pct. Of credit for which a collateral was required
50 92.93 79.27 71.42 100 81.81 83.62Value of the collateral 198.48 243.34 NA 284 252.6 166.62 220.139Assets use as a collateral (% Total)
Land, Building 100 69.97 100 100 60 88.88 82.85Machinery and equipements 0 24.75 29.12 40 0 33.33 25.03
Personnal assets of the owner 0 39.57 29.12 0 40 44.44 33.5
Source: Gambia Enterprise Survey, World Bank.
221. In an international perspective, these figures remain high. The average value of collateral as a percentage of the credit in middle income countries was about 125 percent in Brazil and 85 percent in China; for neighboring low income countries it was about 103 percent in Senegal and 136 percent in Mali. Land and buildings are the most commonly used collateral; they represent about 83 percent of properties pledged by firms to guarantee the repayment of their loan. Posting land or building as a collateral is another way for entrepreneurs to convey a signal to banks on the creditworthiness of their projects and the faith they bear on it. This is consistent with the previous findings identifying land ownership as a key factor for firms’ access to finance (Table 4.2.2). Finally it is important to notice that banks, besides land or buildings, also favor entrepreneur’s personal properties as collateral.
90

A high cost of credit.
222. After a significant decline between 2000 and 2003, the average real interest rate in The Gambia increased very sharply to 29.5 percent in 2005, far above the 1.7 percent found in China at the time, the 10.9 percent applied in Senegal and even the African average of 19.7 percent, itself a high rate by international standards (Chart 4.2.8). In this context, the negative perception of firms with respect to access to finance and the fact that interest rates were the main reason behind the decision by many firms to not apply for a loan are easily understandable.
Chart 4.2. 8. Real lending interest rates (Pct.).
-5
0
5
10
15
20
25
30
35
2000 2001 2002 2003 2004 2005 2006 2007
China Gambia, The South Africa
Source: DDP dataset, April 2009 Update, World Bank.
223. Echoing the perception of firms regarding the cost of finance and the previous macroeconomic data, survey data indicate that interest rates remained high in Gambia at the time of the survey. The average nominal rate for a bank loan was about 21.3 percent, or about 16.3 percent in real terms. Firm size did not seem to affect the level of interest rate charged by banks, there’s no clear pattern emerging from the data.
4.2.7. Other financing instruments.
Overdrafts.
224. When available, overdraft facilities are an attractive alternative short term financing, with low transaction costs. Additionally, trade credit can act as an entry point to access other category of bank financing. Along with bank credits, access to overdraft facility varies across firms. Large firms are more likely to have access to overdraft facility than smaller ones. Similarly manufacturing firms report more access to overdraft than other categories of firms.
225. On average, overdrafts remain costly sources of funds for formal firms in The Gambia. In addition, the cost of this type of financing seems to increase with the size of the firm and to be higher for manufacturers.
Table 4.2. 5. Overdraft characteristics.
91

5 to 9 employees 10 to 49 employes > 50 employees Manufacturing Retail Others Formal Firms
Pct. Of firms having an overdraft facilty 3.9 30.9 36.4 27.5 6.5 11.7 16.0
Annual interest rate 13.5 15.6 19.3 18.2 16.2 11.8 15.7
Source: Gambia Enterprise Survey, World Bank
Trade Credit.
226. Trade credit is primarily used to finance short-term assets. As such, it seems to be an important alternative not only to short-term bank debt but also to long-term financial debt. Despite being of a short term nature, it can be an important and stable source of funds for firms. From the supplier’s perspective, it offers the advantage of being easier to seize in case of default. Moreover Biais & Gollier (1997) have shown that trade credit provision by a supplier can act as a valuable signal on the creditworthiness of a firm and help it secure later bank credit that it wouldn’t get otherwise.
Table 4.2. 6. Proportion of firms reporting access to trade credit.
Size5 to 9 employees 74.55
10 to 49 employees 86.75> 50 employees 96.44
Decade of CreationBefore 1990 85.92
years 1990 76.47After 2000 77.32
SectorManufacturing 84.23
Retail 76.47Other sectors 77.32
Source: Gambia Enterprise Survey, World Bank
227. It can be seen from Table 4.2.6, that within formal companies in The Gambia, larger firms, firms operating in the manufacturing sector are more likely to use trade credit. No clear pattern emerges regarding firms’ age.
92

4.2.8. Conclusion.
228. Access to finance is the second most important issue for formal firms in The Gambia; it is also a major issue for micro/informal firms. This perception is largely backed by facts. In effect, bank finance is a minor source of funding for firms in The Gambia which use mostly internal funds and retained earnings to finance their short-term needs and their investments. Firms in The Gambia actually have the lowest share of financing of long term assets in comparator countries.
229. Data suggest that access to finance, measured by whether or not a firm had a loan or a line of credit from a bank at the time of the survey, is mainly triggered by land ownership (to serve as a guarantee) and the fact of having audited accounts (assessment of the quality of the borrower). In fine, as confirmed by the share of bank finance in the funding of firm’s activity and investment, few firms have access to bank financing (loan, line of credit, overdraft…). However, this should not be taken as indicating any kind of credit rationing, the analysis shows that the mechanism at play is more related to a process of self-exclusion by firms (few firms apply for various reasons, but for whose which apply the approval rate is high).
93

5 SYNTHESIS AND PROPOSALS.
A synthesis.
230. The Gambia has fared relatively well in recent years. The Gambian economy has been relatively strong, with an average annual real GDP growth rate of about 4.4 percent during 1996-2006, a performance slightly above the average growth in Sub-Saharan Africa over the same period of time. The good performance of agricultural production, the rise of tourism services, re-export trade, and a healthy growth of industries as well as Government spending on public sector has contributed to this positive outcome in recent years.
231. However, in spite of these developments, The Gambia still faces specific and serious challenges in the future, especially as the economy is not enough diversified and highly vulnerable to external shocks. In effect: Growth still largely depends on the fate of the agricultural sector; The re-export sector is at risk of becoming less attractive over time; The tourism sector, a key foreign exchange earner, faces difficult prospects - at least in the
short term due to the current worldwide economic crisis.
249. This vulnerability underlines a need for economic diversification which can be facilitated, besides sectoral action in promising sectors (such as fishing, horticulture, sesame and cashew nuts), by improvements in the overall investment climate of the country. Such an improvement will allow for a better allocation of resources, the mechanisms of comparative advantage to play their role and in the end will enhance prospects for future growth. To achieve this objective, it is necessary that investors and entrepreneurs are reassured as to the economic future of The Gambia and its capacity to adopt a framework more favourable to the private sector. It is now widely recognized that the development of the private sector requires an improvement in its “investment climate” in order to promote stronger economic growth within a market economy and a reduction of poverty. As shown by the previous chapters of this report, a lot remains to be done as initial conditions are not very favorable.
250. Survey data show in effect that manufacturing firm’s productivity is low in The Gambia. Labor productivity is very low (even when compared with other low-income countries from SSA) and unit labor costs (the wage costs adjusted for productivity levels) remain high. De facto, the negative effect of low labor productivity is not really compensated for by the level of remunerations, which limits the competitiveness of the Gambian firms. Furthermore estimates of various specifications of functions of production indicate that TFP is very weak in Gambian manufacturing: on average, firms in South Africa (the country with the best TFP of the continent) are about six times as productive as firms in The Gambia. Not surprisingly, data show that few manufacturers export and firm’s profitability is low.
251. These weak performances can be understood as a result of a mostly weak investment climate within the country. Data show in effect that the investment climate in The Gambia, in 2006, was not favorable to the private sector, regardless of the sector. There is also evidence that little progress has occurred since then as showed by the relatively minor improvements reported by several organization generating world-wide rankings of the business environment (IEF, GCI, DB) between 2006 and 2008.
94

252. Data from the enterprise survey help to get a better understanding of the factors at play. Across the three formal sectors (manufacturing, retail services and other sectors - which include tourism activities), the four perceived leading constraints are the same: electricity, access to finance, access to land and tax rates. They only differ a little in magnitude and ranking. The data also show that the constraints faced by informal firms are very similar to the ones faced by formal firms.
Problems with electricity supply are perceived as the main barrier to the growth of firms in the Gambia. In comparative terms, the poor reliability of electricity services in the country tends to confirm these negative perceptions. The cost of poor electricity services is non-negligible and creates a significant comparative disadvantage. For example, while firms in neighboring Senegal also face an uncertain electricity regime, they only lose about a quarter of the output loss in the Gambia as a result of poor electricity services.
Access to finance is perceived as the second most important barrier to the growth of firms in The Gambia. De facto, internal funds and retained earnings are the dominant source of financing of firms in The Gambia and within the group of selected comparators, Gambian firms have the smallest proportion of financing of their long term assets through the banking system. The analysis suggests that many firms do not even consider bank finance when they need funds; it seems that the mechanism at play in The Gambia at the time of the survey had little to do with credit rationing per see and was more related to a process of self-exclusion by firms. To make things worse, most of the funding provided by the banking system is of a short term nature, requires a high collateral ratio and is fairly expensive.
Access to land is the third most important issue for formal firms. The problem lies in the weight of the regulatory burden. A typical firm must wait more than a year before it has full legal title. This is nearly four times the length of time required in the rest of SSA.
Tax rates and tax administration are also perceived as a significant problem by managers. Tax obligations of a firm in The Gambia - as a share of profits - were nearly four times those of a similar firm in the next highest taxing countries: China and Brazil. The source of The Gambia’s high tax burden seems to be, according to the DB methodology, a sales tax levied on total sales. On the other components of the fiscal burden, tax rates on profits were the highest of the comparator group.
253. Besides these key issues, some other limitations of the business environment in The Gambia are worth noticing. Hence, although labor market issues do not appear at the top of firm’s perceived constraints, data show that the education of the workforce and its health status remain problematic. The credibility of regulations is questioned by many firms and corruption, while not perceived as a key constraint, is still widespread and costly.
254. All the above issues affect negatively the production function of firms and act as a severe constraint for their operations. Furthermore, although The Gambia fares relatively well in two areas of the business environment (working of the courts in case of a business dispute and efficient import/export procedures) it is highly unlikely that this will compensate for the previous limitations of the investment climate.Strategic options to improve the investment climate in The Gambia.
95

255. It is now recognized by the political authorities (see the recent PRSP II) that additional reforms are necessary to increase firm's competitiveness and the performances of the private sector in The Gambia. The Government has already clearly indicated its will to quickly improve the investment climate in The Gambia. This is a positive development for the future, as investment climate reforms require consistency, political will and prioritization.
256. This report underlines many issues in the investment climate in The Gambia. All of them cannot be addressed in the same time. There is a need to set priorities on the basis of the order of constraints given by Gambian firms. Therefore, this report proposes to focus on selected priority areas of reform - strategic axes - in order to improve quickly the investment climate in the country. Other issues mentioned in the report are important too, but can be addressed in a second wave of reforms, when the binding constraints will have been removed or alleviated.
257. A policy aimed at improving the investment climate in The Gambia should therefore include interventions in:
Infrastructures. The key strategic orientation is to improve as quickly as possible the supply of electricity and water, and their reliability in the country. In the current context, in spite of recent improvements, this remains (electricity especially) the critical factor hindering firm’s growth.
In the short-term, ways to obtain such a result may include i) a review of the role and performance of the National Water and Electricity Company (NAWEC) which may also encompass a reform of tariffs, revenue collection/expenditures and management, ii) the promotion of investments having as an objective the upgrading of power and water infrastructure in order to improve supply capacity and reliability and iii) an enhancement of the governance and regulatory capacities of the Public Utilities Regulatory Authority (PURA).
In the medium term, there is a need to i) promote and support investments in power and water supply infrastructure through greater use of private-public partnerships, ii) strengthen regulation by PURA through establishing clear rules for private participation in power generation and transmission and iii) ensure that electricity pricing maintains the financial viability of power companies, while protecting the most vulnerable consumers.
Access to finance. The second major area of intervention should be the promotion of access to finance for firms as the minimal of use of long term financing hinders firms investment.
In the short-term, this would imply to i) simplify property registration processes, taxes and fees to provide property owners with access to collateralized financing, ii) ensure that the Credit Reference Bureau functions effectively, iii) implement the amended Mortgage Act to facilitate collateralized lending, iv) expand Business Development Services (BDS) to SMEs on improving productivity and accessing banking finance and v) enhance the capacity of banks and microfinance institutions.
In the medium term, there is a need to i) strengthen corporate governance in the private sector - including in the banking sector, ii) computerize the
96

property registration process, paying taxes and fees and provide this information in a secure, public access system, iii) create risk-sharing mechanisms such as government guaranteed lending and iv) promote the application of innovative products and technology (credit scoring) to expand access to finance.
Access to land. The third major area of intervention should be the promotion of access to land for firms as it will help them to provide collateral. In this respect, the promotion of a better access to land for firms will also have a positive impact on the access to finance by the private sector.
In the short-term, this would imply to i) simplify the property registration process by minimizing or eliminating the need for Ministerial approval and ii) to modernize and update the real estate cadastre in priority development areas.
In the medium term, there is a need to i) computerize the property registration process based on a modern, digital cadastre system and ii) establish a transparent land management policy to support deregulation of the land market, including leasing of public land and the creation of a competitive land market.
Taxation and tax administration. The fourth major area of intervention should be to improve the working of the tax system.
In the short-term, this would imply to i) review and simplify the current tax regime (and consolidating the number of other taxes where possible), ii) review the taxes and fees levied by Municipalities and Local Authorities, and iii) provide training programs and readily available information on self-assessment - especially for SMEs - in partnership with the private sector.
In the medium term, there is a need to i) adopt a new, streamlined tax code, ii) computerize the tax administration process and iii) establish an effective Tax Tribunal that is perceived as serving the business community in an impartial and quick manner.
258. The proposed key priority measures are synthesized in the following matrix.
97

PROPOSED STRATEGIC MEASURES
Main Findings and Issues
Desired Outcomes Policy Options to Achieve OutcomesShort term Medium term
INFRASTRUCTURE
Unreliable and costly electricity supply
Unreliable water supply
Improved supply reliability at competitive tariffs by establishing a policy and regulatory environment conducive to private-public partnerships in electricity generation and distribution as well as water supply production and distribution.
Review the role and performance of the National Water and Electricity Company (NAWEC) including reform of tariffs, revenue collection/expenditures and management.
Invest in priority upgrading of power and water infrastructure in order to improve supply capacity and reliability.
Enhance governance and regulatory capacity of the Public Utilities Regulatory Authority (PURA).
Promote and support investments in power and water supply infrastructure through greater use of private-public partnerships.
Strengthen regulation by PURA through establishing clear rules for private participation in power generation and transmission (and water production and distribution).
Ensure electricity pricing maintains the financial viability of power companies, while protecting the most vulnerable consumers.
ACCESS TO FINANCE
Despite a fairly sound financial system, the role of bank financing of firms’ long term assets is very low.
On average, low firm total factor productivity and high credit risks has led to high collateral ratios and nominal rates.
Increased access to finance especially for small and medium-size enterprises by improving credit risk information, increasing the availability of collateral and strengthening capacity of firms and banks.
Simplify property registration process, taxes and fees to provide property owners with access to collateralized financing;
Ensure that the Credit Reference Bureau functions effectively
Implement the amended Mortgage Act to facilitate collateralized lending
Expand Business Development Services (BDS) to SMEs on improving productivity and accessing banking finance
Enhance capacity of banks and microfinance institutions
Strengthen corporate governance in the private sector including in the banking sector
Computerize the property registration process, paying taxes and fees and provide this information in a secure, public access system;
Create risk-sharing mechanisms such as government guaranteed lending.
Promote the application of innovative products and technology to expand access to finance.
ACCESS TO LAND
The property registration process is very time consuming and cumbersome.
A streamlined property registration system will enable firms to secure collateralized loans and lower their credit risk while creating a competitive land market.
Simplify the property registration process (as above) minimizing or eliminating the need for Ministerial approval
Modernize and update the real estate cadastre in priority development areas
Computerize the property registration process (as above) based on a modern, digital cadastre system
Establish a transparent land management policy to support deregulation of the land market including leasing of public land and the creation of a competitive land market.
98

(Matrix continued)
TAX RATES AND ADMINISTRATION
The tax obligations of firms in The Gambia are extremely high and administrative requirements of tax compliance are heavy.
A transparent and competitive tax regime implemented efficiently, will significantly enhance business growth as well as compliance and revenue collection.
Review and simplify the current tax regime, consolidating and eliminating the number of other taxes where possible
Review the taxes and fees levied by Municipalities and Local Authorities.
Provide training programs and readily available information on self-assessment especially for SMEs in partnership with the private sector
Adopt a new, streamlined tax code
Computerize the tax administration process
Establish an effective Tax Tribunal that is perceived serving the business community in an impartial manner
99

ANNEXES
100

APPENDIX CHAPTER 2. MANUFACTURING FIRM’S PRODUCTIVITY.
Although the measures of firm productivity discussed in chapter 2 provide useful information on firm performance, they can be misleading when considered in isolation. To get an overall assessment of productivity, it is necessary to take both capital and labor use into account. The net impact of the different factors of production on firm-level productivity can be assessed by calculating total factor productivity (TFP). Differences in total factor productivity are those differences in output that cannot be explained by differences in the use of labor, capital and other inputs. Differences between firms can be due to many different factors including the quality of workers, the quality of management, the technology used (as long as it isn’t embodied in capital), or firm organization. Firms for which total factor productivity is higher are more efficient than other firms because they produce more with less capital and workers.
Mechanically, TFP is calculated by estimating a Cobb-Douglas production function, using data for enterprises from twelve different manufacturing sub-sectors, and looking at the residuals and coefficients on various variables in an augmented production function. To allow us to compare total factor productivity between The Gambia and the low- and middle-income comparator countries, we pool the observations for many countries into a single regression including i) all countries in Sub-Saharan Africa where data are available and ii) the middle-income comparator countries used in this study. This makes it possible to compare TFP across countries. As a robustness check, the analysis includes regressions only including countries in Africa and tests to check that results for Gambia are similar to results for the larger sample.
In addition to making it possible to compare TFP in the Gambia with TFP in the comparator countries, this also gives us a sufficiently large sample of enterprises to compare total factor productivity across firms of different types, making it possible to assess the impact of various firm characteristics on TFP. The production function is estimated using a stochastic frontier approach.55 As a robustness check, we also estimate the production function using a Least Absolute Deviations (LAD) estimator. This is used rather than Ordinary Least Squares (OLS), because it is more robust to outliers.56
The model. The dependent variable is the natural log of value added and all regressions control for the enterprises’ use of capital and workers.57 All models include country dummies to pick up differences in total factor productivity between the different countries and also to reduce problems associated with exchange rates. The regressions also include a full set of sector dummies. These dummies are interacted with the measures of labor and capital to allow different technologies in different sectors - that is labor and capital intensities are not assumed to the be the same across sectors.
The augmented production function is:
55 - See Kumbhakar and Lovell (2000) for a description of stochastic frontier models. The model estimated assumes that technical inefficiency component is distributed with an exponential distribution, while the white noise component is distributed with a normal distribution. Firms that are outliers for value added per worker and capita per workers (i.e., enterprises in the top and bottom 5 percent of firms) are dropped in this part of the analysis so that results will not be driven by outliers and to ensure convergence.
56 - Due to concerns about outliers, LAD estimators are often used when estimating production functions. See, for example, Greene (2000, pp. 449-450).
57 - Following Caves (1990), value-added rather than sales is used as the dependent variable.
101

ijkijkjijkj
jjkijk l ijkijk sticsCharacteri Firm workerslogCapitalogVAlog
where VA is value-added in firm i in sector j in country k. Labor and capital are the number of workers and the book value of machinery and equipment. The coefficients on labor and capital, β and γ, are assumed to vary between sectors. Sector and country dummies, α and μ, are included to allow for systematic differences in productivity across countries and sectors. Finally, in some specifications, a series of enterprise level controls (e.g., a dummy indicate whether the firm exports or not and the log of the firm’s age) are included. Finally, two error terms, a one sided term assumed to have a half normal distribution, ν, representing technical efficiency and a two-sided, ε, a two-sided normally-distributed error term representing temporary shocks to productivity and measurement error, is also included. The model is estimated using maximum likelihood estimation. In the LAD regressions, a single error term is assumed (ε). This model does not require strong distributional assumptions.
Sector specific production technologies. A joint test of the significance of the interaction terms rejects the null hypothesis that the coefficients on labor and capital are identical across sectors at a one-percent level or higher in both the frontier regressions and the LAD regressions. This strongly suggests that these terms need to be included in the estimation. This implies that capital and labor intensities are significantly different across sectors and that it is inappropriate to pool enterprises into a single model without controlling for this in the estimation.
Differences between countries. After controlling for differences in productivity due to differences in capital use, firm size, the use of different factors of production, and sector of operations (i.e., using results from column 1), enterprises in the Gambia remain less productive than firms in the comparator countries. That is, the relatively low labor productivity observed for the median firm in the Gambia cannot be explained completely by the low capital intensity among firms in the Gambia. On average, firms in Guinea-Bissau are about 20 percent more productive than firms in the Gambia, firms in Benin are twice as productive, and firms in South Africa over six times as productive. Overall, productivity in the Gambia also remains below most other countries in Sub-Saharan Africa for which comparable data are available. Of the 23 countries in Sub-Saharan Africa for which comparable data are available, this includes seven middle-income countries, Gambia ranks 23rd in terms of total factor productivity. Although the difference between Gambia and many of the other low ranked countries within Sub-Saharan Africa is not generally statistically significant (that is, it could be due to sampling variation).58
Because firms in Mali and Senegal did not provide information on the book value of capital, it is not possible to compare productivity in these countries with productivity in the Gambia. However, comparisons with Botswana and Cameroon—two other countries where firms are relatively productive—suggest that the Gambia also lags behind the best performing countries in Sub-Saharan Africa. On average, TFP is about three times higher in these countries than in the Gambia.
58 - In particular, although the point estimate of TFP suggests TFP is lower in the Gambia than in Eritrea, Burundi, Guinea-Bissau, Rwanda, and Lesotho, the difference between the point estimates is not statistically significant.
102

Chart A.2. 1 Total Factor Productivity is lower in Gambia than in the middle-income comparator countries.
0%
25%
50%
75%
100%
Gambia
Guinea
-Biss
auBen
in
Cameroon
Botswana
Brazil
South
Africa
TFP
(as
% o
f Sou
th A
frica
)
Source: Investment Climate Surveys.
Note: TFP is the coefficient on the country dummies in augmented production functions (see Annex).
In most cases, we would now compare TFP in a single sector to check the robustness of results. Because there are so few firms in the Gambia with data available, we do not do this in this case. That is, the small size of the sample of firms in single sectors would make the results fairly unreliable if we tried to break it down further.
It is important to keep an important caveat in mind when comparing total factor productivity across countries. Although including country dummies is useful because doing so means that the coefficients on other variables will not be affected by assumptions about exchange rates (i.e., the dummies will control for exchange rates in cross-country regressions where monetary variables are in logs), exchange rates can make the coefficients on the country dummies difficult to interpret. That is, the coefficients on the country dummies will depend upon the exchange rate as well as on productivity differences. If a country’s exchange rate is overvalued relative to its long-run equilibrium value, the coefficient on that country’s dummy will appear artificially large (as will value added per worker).
Economies of Scale. If large enterprises were consistently more productive than small enterprises, the sum of the coefficients on labor and capital would be greater than one. If this were the case, total production would more than double if the number of workers and amount of capital were doubled. In practice, the sum of the two coefficients is generally close to one for most of the sectors. For the base sector, food and beverage, the sum of the coefficients is 1.13 suggesting modest economic of scale. That is, large firms appear to be more productive than smaller firms.
Table A.2.1 presents sums of the coefficients for each sector and the test of the null hypothesis that they sum to one (model from column 1). These results suggest in most sectors—with the possible exception of construction materials—modest economies of scale. Larger enterprises appear to be consistently more productive than smaller firms.
103
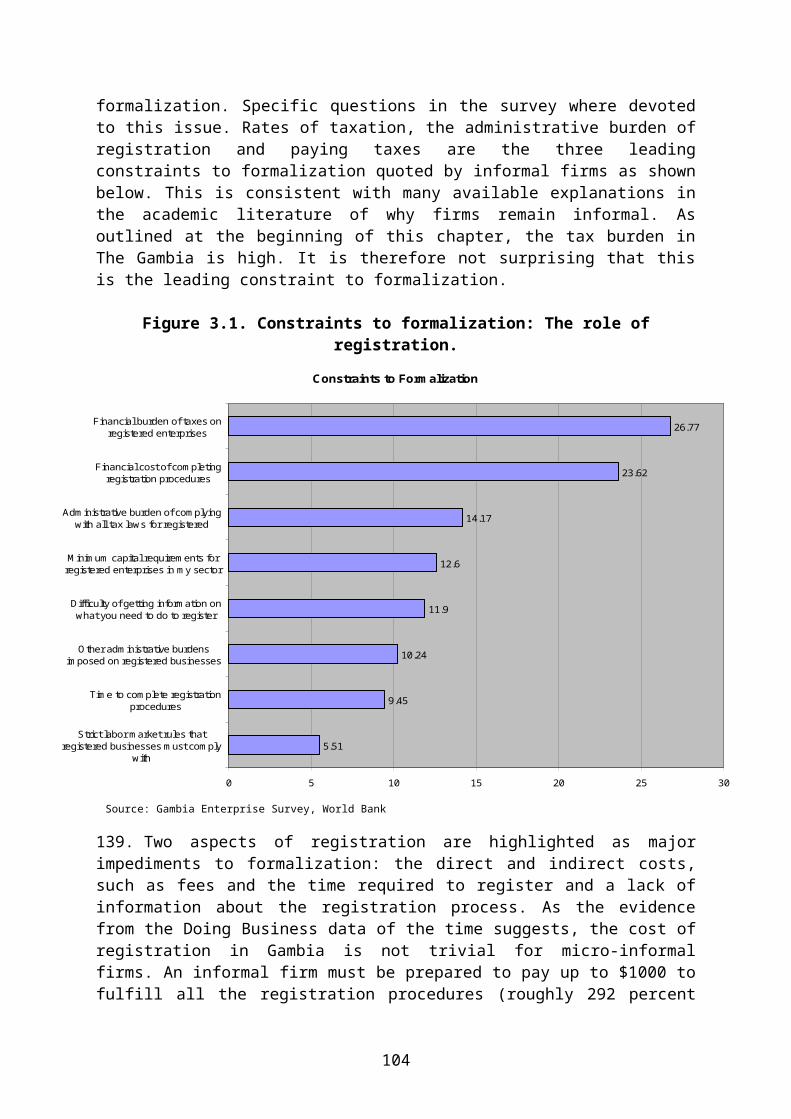
Table A.2. 1. Test for Constant Returns to Scale.
Sector Sum of Coefficients
P-value for test of CRS
Garments 1.086 0.00Food and Beverage 1.133 0.00Chemicals 1.089 0.00Construction Materials 1.085 0.27Furniture 1.162 0.00Metal 1.132 0.00Paper, Printing and Publishing 1.163 0.00
In the context of this study, this suggests that small firms are disadvantaged relative to larger firms. Given the small size of the domestic market in the Gambia, this suggests that firms will find it harder to compete on international markets unless they can expand their operations sufficiently to start benefiting from these economies of scale.
Other enterprise characteristics. In addition to capital, labor, the sector dummies, the interaction terms, and the country dummies, the regressions also include a series of variable to control for other enterprise characteristics. These variables include variables indicating the age of the firm, whether the firm exports, whether the firm is foreign-owned, whether the firm has bank credit (a loan, line of credit or overdraft) whether the firm licenses technology from abroad, whether the firm’s workers belong to a union, and the education of the manager. Results are similar for the frontier and LAD regressions, so only results from the frontier regressions are presented. When the results from the LAD regressions differ significantly from the results from the frontier analysis, this is noted in the text.
Four variables, firm age, a dummy variable indicating that the firm exports, a dummy variable indicating that the firm is foreign-owned, and a dummy variable indicating that the firm uses the Internet are available for most of the countries in the sample. These variables are included first. Several other variables are only available a sub-sample of countries. These include a dummy variable indicating the firm has bank credit, a dummy variable indicating that the firm licenses technology from abroad, and a dummy variable indicating that the firm’s workers are unionized. These variables are included next. Finally, variables indicating whether the firm’s manager has an MBA and whether the manager has a university education are available only for a smaller subset of African countries. These variables are included last.
Exporters are about 16 to 27 percent more productive than similar enterprises that do not export. The coefficients are statistically significant in both the frontier analysis and the LAD model, and remain statistically significant as additional variables are added. This is consistent with other studies that have found similar results for different sets of countries.59
Economists have suggested two possible explanations for the correlation. One is that exporting might result in productivity improvements for the firms that are doing it (the ‘learning-by-exporting’ hypothesis). The discipline of competing in international markets might encourage enterprises to improve their productivity or might expose them to foreign technologies or modes of production. The other explanation is that since firms have to be efficient to compete on international market, only firms that are already efficient are able to
59 - The large literature on this topic is summarized in Tybout (2003) and Keller (2003).
104

export (the ‘self-selectivity’ hypothesis). Although inefficient firms are protected from international competition in domestic markets by natural barriers (e.g., high transportation costs) and policy barriers (e.g., government tariffs and quotas or inefficient ports or customs administration), they are unable to enter international markets. It is important to note that the two hypotheses are not mutually exclusive. Even if efficient firms are more likely to start exporting, this does not rule out the possibility that exporting will help them increase their productivity further.60 Due to the cross-sectional nature of the data included in this study, we are unable to distinguish between the two competing hypotheses in this analysis.
Foreign-owned enterprises are also more productive, on average, than similar domestic enterprises. The point estimates for the parameters in columns 2 through 5 of Table A.2.3 indicate that majority foreign-owned enterprises are about 17 to 27 percent more productive than similar domestic enterprises. The coefficients are statistically significant in both model specifications. This is also consistent with previous results that have often found that foreign-owned enterprises are more productive than domestic enterprises in developing countries. (Saggi, 2002).
Previous studies have found that firms that use the internet to communicate with clients and suppliers are more productive than firms that do not.61 The results from this analysis are consistent with this—firms that use the internet to communicate with other enterprises appear more productive than other firms. In reality, it seems unlikely that internet use alone results in higher productivity. That is, even in the United States, a country where internet use is far more common than in the low- and middle-income countries in this study, most studies have found only modest gains related to internet use.62 Rather than reflecting actual internet use, it seems likely that this reflects difference in the intensity of technology use rather than internet use. Enterprises that use technology more intensively are between 23 and 30 percent more productive than similar firms that do not.
Another variable to proxy for technology use is also correlated with total factor productivity. Firms that license technology from foreign companies are more productive than firms that do not. The point estimates of the coefficient suggest that they are between 20 and 29 percent more efficient than other firms—even after controlling for technology use by including the internet dummy. Together these results suggest that technology use is strongly correlated with productivity.
Enterprises with bank credit are more productive than enterprises without credit—based upon the point estimates of the coefficients, they are between 14 and 20 percent more productive than firms with credit. Although this might imply that firms with access to credit are able to use that credit to improve firm performance, it is possible that causation runs in the opposite direction. That is, firms might get improved access to credit because they are already more productive.
60 - The evidence appears to support both hypotheses. For example, several econometric studies that have looked at whether enterprises improve their productivity before or after they start exporting have found that productivity improvements precede exporting, providing support for the self-selectivity hypothesis. See for example, Clerides et al. (1998), Bernard and Jensen (1999), Liu et al. (1999) and Aw et al. (2000). However, case studies often support the ‘learning by exporting’ hypothesis. Studies of exporters in Korea and Taiwan found that export buyers were an important source for new technologies, which they provided in various forms including complete blueprints, information about manufacturing processes and quality control methods, technical advice and on-site plant inspections, and training for technical and production staff (Westphal, 2002)
61 - Quiang, Clarke, and Halewood (2006) find similar results for a larger sample of developing countries using Investment Climate Surveys.
62 - For example, Oliner and Sichel (2000) estimate that e-commerce has increased multifactor productivity growth in the US by considerably less than 0.1 percent per year.
105

Enterprises with better educated managers are more productive than other enterprises. An enterprise with a manager with a university education is about 21 percent more productive than a similar enterprise where the manager has only a primary or secondary education. Firms with managers with MBAs, in contrast, do not appear to be significantly more productive than firms with university educated managers without an MBA.
Previous studies of firm performance in Africa have stressed the importance of formal training on firm performance. The analysis based upon the samples in this study, however, does not show that training has a large impact on total factor productivity. The coefficient on a dummy variable indicating that the firm has a training program is positive in all specifications, but is never statistically significant in the frontier analysis and is only statistically significant in one regression in the LAD estimation. Replacing the dummy with a variable indicating the number of workers trained gives similar results—the coefficient is positive but is not statistically significant in most specifications.
Are results the same in Africa? The regressions included countries from Sub-Saharan Africa, as well as countries from other regions (e.g., the middle income comparator countries). A natural question, therefore, is whether results hold in Africa specifically or whether they hold only in other regions. As noted earlier, to test this, the main regression is repeated including only countries from Africa (see columns 4 and 5 in Table A.2.3). The results for the African countries are mostly similar to the pooled results—exporters, foreign-owned firms, firms that use technology more intensively, and firms with access to credit are more productive.
The main differences are that older firms do not appear to be any more productive than younger firms in Africa and firms with unionized workers appear more productive in Africa than other firms. Once again, the direction of causation is not clear—this could be that unionization improves firm performance or this could be because firms that are more productive, and hence more profitable, are more likely to unionize.
Are results the same in the Gambia? Finally, an additional question is whether firms from the Gambia specifically appear like firms from the other countries in the sample. To test whether this is the case, a set of interaction terms are added to the regression in column 5. If the point estimates for these coefficients on these interaction terms were very different than the point estimates for the rest of the sample and they were statistically significant, this would suggest that these variables affect firms in the Gambia differently than in other countries. The results are somewhat ambiguous—the point estimates suggest that some of these factors might have very different effects in the Gambia than elsewhere in Africa. But the hypothesis tests fail to reject the null hypotheses that the coefficients are the same in the Gambia and in other countries for all but one variable.
106

Table A.2. 2. Comparison of Point Estimates for Whole Sample and for the Gambia.
Point estimate for whole
sample
Point estimate for the Gambia
Is point estimate for Gambia
differentAge of Establishment 1% -28% NoFirm has bank credit 20% -19% NoFirm exports 19% -44% NoFirm is foreign-owned 22% 144% NoFirm has technology licensed from foreign company 29% 218% NoFirm uses internet 23% -37% NoFirm has training program 0% 34% NoFirm's workers are unionized 12% 3% NoFirm's manager has university education 17% 215% YesFirm's manager has an MBA 6% -77% No
Table A.2. 3. Determinants of Firm-Level Productivity for Manufacturing Enterprises.
107
Frontier RegressionValue Added (natural log)
Observations 10497 8910 3991 1851 1453
Sample All All AllAfrica-
onlyAfrica-
onlyProduction Function
Capital (book value)0.275**
*0.250**
*0.212**
* 0.245*** 0.230*** (natural log) (21.57) (19.69) (11.78) (9.83) (8.39)
Workers0.858**
*0.801**
*0.846**
* 0.776*** 0.775*** (natural log) (44.41) (41.11) (28.49) (17.96) (15.35)Firm Characteristics
Age of Establishment0.079**
*0.054**
* 0.010 0.005 (natural log of years) (7.30) (3.67) (0.45) (0.19)
Firm exports0.240**
*0.151**
* 0.165*** 0.171** (dummy) (10.89) (4.44) (3.11) (2.46)
Firm is foreign-owned0.240**
*0.154**
* 0.191*** 0.197*** (dummy) (7.76) (3.44) (3.42) (2.96)
Firm uses internet0.236**
*0.262**
* 0.228*** 0.205*** (dummy) (10.03) (7.20) (4.47) (3.62)
Firm has bank credit0.148**
* 0.127*** 0.185*** (dummy) (4.48) (2.68) (3.16) Firm has technology licensed from foreign company
0.179*** 0.201*** 0.251***
(dummy) (4.11) (3.25) (3.08) Firm has training program 0.026 0.025 -0.001 (dummy) (0.91) (0.58) (0.02) Firm's workers are unionized 0.051 0.123** 0.117* (dummy) (1.33) (2.34) (1.88) Firm's manager has university education 0.159*** (dummy) (2.91) Firm's manager has an MBA 0.057 (dummy) (0.67)
*** Significant at 1 percent level ** Significant at 5 percent level * Significant at 10 percent level. t-statistics in parentheses.
Dependent variable is log of value-added.
a Coefficients are reported for firms in the food sector. In addition, sector dummies and sector specific production functions are included for 12 additional sectors (Textiles; Construction materials; Garments and Leather; Food and Beverages; Metals and Machinery; Electronics; Chemicals and Pharmaceuticals; Wood and Furniture; Plastics; Paper, Printing and Publishing; other Manufacturing; and autos and auto parts). The dummies are interacted with capital and labor to allow sector-specific production technologies. Coefficients on sector dummies and interaction terms are omitted for presentational reasons.
108

APPENDIX CHAPTER 3.
On the limitations of perception data. As enterprise managers know more about their current problems than outsiders (such as government officials or other experts), it makes a lot of sense to ask their concerns about the business environment in a given country through a survey of firms. Although it is important to consider this information seriously, it is also needed to understand that such perceptions are not a perfect measure of the investment climate for several reasons:
In effect, enterprise managers’ interests might not always be consistent with society’s interests. For example, most firms’ managers would like to pay fewer taxes, and consider therefore taxes as an issue. However, the later from a societal point of view feeds into government budgets and are therefore very useful;
Cultural differences, or persistent differences in expectations about the investment climate, might affect perceptions and cross-country comparisons. For example, for a similar level of cost of corruption (expressed as a percentage of sales), corruption will be considered as a very critical issue in some countries and not in others where is might be incorporated into day to day business activities like any other cost item;
Although managers may be aware of a problem, they might not be aware of the causes. They may complain about the poor quality of a transport system without knowing that specific geological constraints limit what can be done. As a result, additional information is needed to assess how to release any given constraint;
The views of managers of incumbent enterprises - i.e. the firms which are actually surveyed - might not reflect the obstacles that potential entrepreneurs and new entrants might face. For example, managers of old enterprises that have completed registration procedures years earlier might not be concerned about entry costs even if they remain high and are a barrier to entry, actually they might even consider these a useful as they might hamper the arrival of new competitors;
Although concerns about perception-based data are significant, it is also very important not to overemphasize them. Recent work suggests that perception-based measures match reasonably well objective macro- and micro-economic indicators - even on a cross-country basis (Gelb and al. 2007). Furthermore, it must be remembered that objective data also have their own issues (for example correct firm’s accounting data are notoriously difficult to obtain through a survey).
A way to circumvent these issues is to systematically cross-check perception data with other objective data from the survey and external sources of information. This allows i) compensating for some of the limitations of perception data and ii) to define more accurately existing investment climate issues in a country. This is done systematically in this report.
109
Table A.3. 1. Paying Taxes in The Gambia.Tax or mandatory contribution Payments
(number)Notes on Payments
Time (hours) Statutory tax rate Tax base Total tax rate
(Pct. profit) Notes on TTR
Sales tax 12 240 15.00% domestic purchases 221Corporate Income Tax 5 40 35% (2%) taxable profit (turnover) 35.4Social security contributions 12 96 10.00% gross salaries 11.3National Education Levy 1 - 30,000 - 50,000 turnover 10.1
Capital gains tax 1 - higher of 10% of sale price of 25% of gain 6.1Municipal business tax 1 - various rates 6.1
Contribution to injuries compensation fund 0 paid jointly -1% (with a max of D15 per month per
employee) gross salaries 1.1Fringe benefits tax 1 - 35.00% fringe benefits 0.4
Property tax 1 - 0.30% assessed property value 0.3Fuel tax 1 - included in fuel price 0.3Vehicle tax 1 - fixed fee per ton 0.2Environmental tax 12 - D1 per employee per month 0.2Business license 1 - fixed fee 0.1Stamp duty 1 - 2.5%-10% contract value small amountTotals: 50 376 292.4
Notes:Name of taxes have been standardized. For instance income tax, profit tax, tax on company's income are all named corporate income tax in this table.The hours for VAT include all the VAT and sales taxes applicable.The hours for Social Security include all the hours for labor taxes and mandatory contributions in general.
Source: Doing Business.
Chart A.3. 1. Structure of taxation.
0.0
50.0
100.0
150.0
200.0
250.0
300.0
2006 2008 2006 2008 2006 2008
Profit Tax Labor tax and contributions Other taxes
Benin Brazil China Gambia, The Guinea-Bissau Mali Senegal South Africa
Source: Doing Business 2007 and 2009.
Chart A.3. 2. Bureaucratic requirements for tax compliance.(Nber of payments)
72
60 59
48 47 47
23 23
5558 59
9
5046
11 9
0
10
20
30
40
50
60
70
80
Benin Mali Senegal China Gambia Guinea-Bissau Brazil South Africa
2006 2008
Source: Doing Business 2007 and 2009.
110

Chart A.3. 3. GRAFT index.
Source: Gonzalez and al. (2007).
111

APPENDIX CHAPTER 4. Section 4.1. Labor Market.Table A.4.1. 1. Trade Union Presence.
Manufacturing Sector Retail Services Sector
Rest of the Universe
Informal Sector
Pct of firms whose employees belong to a unionBy Size class Very Small 0,00% 22,26% 11,91% 9,57%
Small 8,99% 57,26% 31,62% 18,18%Medium 20,00% 100,00% 73,60% -
Large 86,84% 100,00% 58,55% -By Ownership Private Foreign Firm 13,95% 29,37% 41,30% 0,00%
Private Domestic Firm 15,23% 45,92% 26,00% 11,02%Pct of employees belonging to a union By Size class Very Small - 28,0% 43,3% 37,45%
Small 23,9% 35,0% 40,9% 79,00%Medium 50,0% 100,0% 56,6% -
Large 100,0% 50,0% 49,3% -By Ownership Private Foreign Firm 100,0% 82,5% 53,0% -
Private Domestic Firm 56,4% 23,8% 42,7% 43,8%
Source: Gambia Enterprise Survey, World Bank
Table A.4.1. 2. Information’s flows in the formal labor market.
Private
Foreign FirmPrivate Domestic
Firm TotalManufacturing Sector
Means used by firms to find workersThrough family/friends 76,74% 65,41% 66,22%Public placement office 11,63% 9,68% 9,82%
Private placement office 0,00% 4,84% 4,49%Public announcement/advertisement 11,63% 9,68% 9,82%
Other 0,00% 10,39% 9,65%Means used by workers to find a job
Through family/friends 100,00% 64,13% 65,63%Public placement office 0,00% 8,70% 8,33%
Private placement office 0,00% 7,61% 7,29%Public announcement/advertisement 0,00% 7,61% 7,29%
School-related network 0,00% 2,17% 2,08%Other 0,00% 9,78% 9,38%
Retail Services Sector Means used by firms to find workers
Through family/friends 50,44% 88,86% 77,05%Public placement office 0,00% 0,55% 0,38%
Public announcement/advertisement 32,41% 7,06% 15,00%Other 15,60% 3,53% 7,31%
Rest of the Universe Means used by firms to find workers
Through family/friends 39,97% 80,36% 65,47%Public placement office 0,00% 3,01% 1,90%
Private placement office 10,45% 0,00% 3,86%Public announcement/advertisement 34,83% 3,50% 15,08%
School-related network 6,97% 0,00% 2,57%Other 7,79% 12,73% 10,91%
Informal Sector Means used by firms to find workers
Through family/friends 83,33% 82,14% 82,20%Public placement office 0,00% 0,89% 0,85%
Private placement office 0,00% 5,36% 5,08%Public announcement/advertisement 0,00% 7,14% 6,78%
School-related network 0,00% 1,79% 1,69%Other 16,67% 2,68% 3,39%
Note: Data concerning employees’ means to find a job are not weighted.
Source: Gambia Enterprise Survey, World Bank
112

Table A.4.1. 3. Highest educational achievement of employees in the manufacturing sector (Pct.C).
Men Women TotalNone 13,04% 28,28% 25,41%Primary 4,35% 21,21% 18,03%Secondary school 52,17% 35,35% 38,52%
Technical secondary school 4,35% 8,08% 7,38%Technical / Vocational training 21,74% 3,03% 6,56%University 4,35% 1,01% 1,64%
Others, like koranic school 0,00% 3,03% 2,46%
Note: Exclusively for manufacturing firms. Employees Questionnaire.
Source: Gambia Enterprise Survey, World Bank.
Table A.4.1. 4. Employees’ formal training.
Percentage of firms offering formal training By Size class
Very Small 4,49%Small 26,67%
Medium 20,00%Large 28,95%
By OwnershipPrivate Foreign Firm 25,58%
Private Domestic Firm 20,97%Percentage of employees receiving formal training
% of production workers receiving training 51,31%
% of non production workers receiving training 12,56%
Note: Exclusively for manufacturing firms.
Source: Gambia Enterprise Survey, World Bank.
Table A.4.1. 5. Formal training needs expressed by employees.
CommunicationCreativity / Innovation
French / English Marketing
Technical / Professional IT
Production technology
Intellectual property Other No need
Manufacturing Sector
Director 0,00% 0,00% 0,00% 0,00% 0,00% 50,00% 50,00% 0,00% 0,00% 0,00%
Manager 9,52% 9,52% 4,76% 33,33% 28,57% 0,00% 4,76% 4,76% 4,76% 0,00%
Skilled production worker 1,92% 23,08% 5,77% 1,92% 13,46% 0,00% 1,92% 0,00% 0,00% 51,92%
Unskilled production worker 0,00% 20,45% 2,27% 2,27% 15,91% 9,09% 15,91% 0,00% 0,00% 34,09%
Other 66,67% 0,00% 0,00% 33,33% 0,00% 0,00% 0,00% 0,00% 0,00% 0,00%
Total 4,10% 18,85% 4,10% 8,20% 16,39% 4,10% 8,20% 0,82% 0,82% 34,43%
Note: Exclusively for manufacturing firms. Employee’s questionnaire.
Source: Gambia Enterprise Survey, World Bank
Table A.4.1. 6. Illness, number of working days lost due to illness.
113
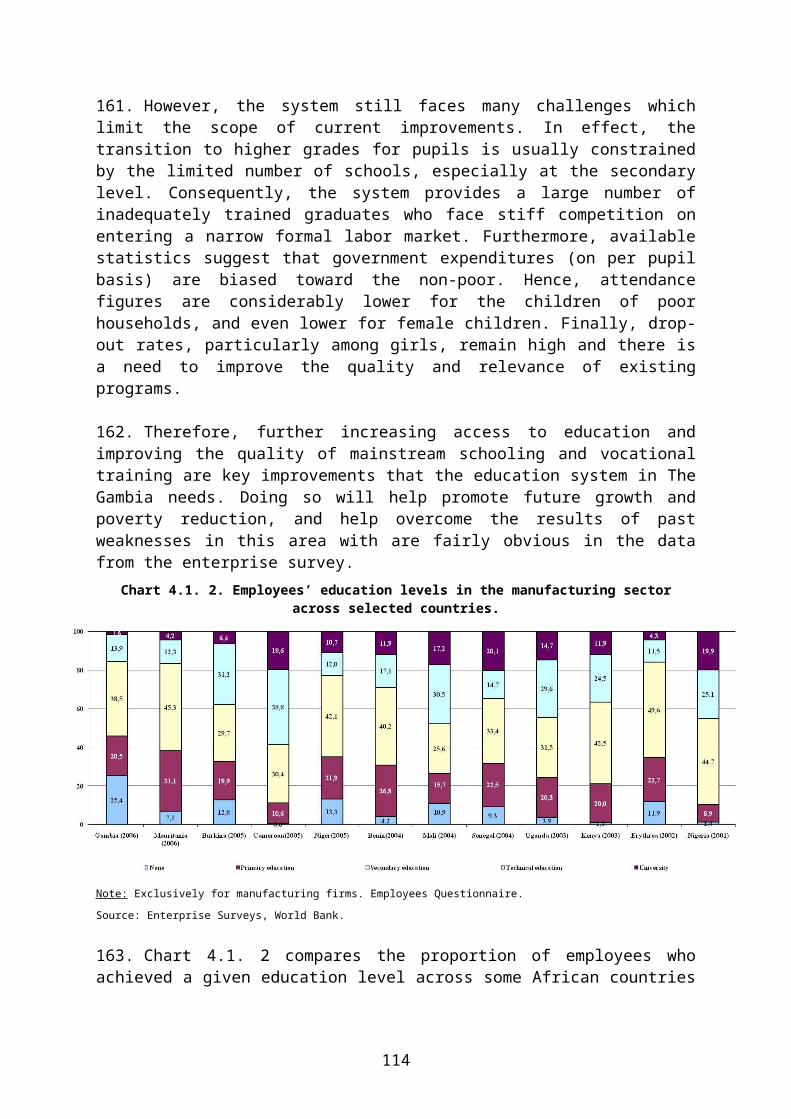
Gambia Mauritania Burkina Faso Cameroon Niger Benin Senegal Kenya MaliManufacturing Sector
Percentage of workers reporting being ill within the last 30 days
Very Small 50,00% 11,54% 13,16% 17,86% 12,50% 20,56% 4,11% 16,22% 8,04%
Small 35,48% 9,32% 14,95% 18,92% 20,28% 17,63% 18,67% 23,33% 13,48%
Medium 26,09% 25,00% 27,03% 21,00% 22,73% 25,66% 16,90% 19,52% 23,38%
Large 42,86% 15,00% 8,62% 19,67% 10,53% 22,78% 19,69% 15,86% 16,26%
Sample 34,38% 12,74% 14,98% 18,58% 17,87% 19,01% 17,31% 19,41% 13,40%
Average workdays missed due to illness within the last 30 days
Very Small 1,00 0,67 3,00 4,20 3,00 3,70 3,71 1,80 4,63
Small 3,59 1,82 2,76 2,40 4,79 2,72 3,71 2,75 3,82
Medium 2,50 2,71 3,20 3,30 3,40 5,21 3,42 2,10 4,83
Large 2,33 2,33 2,60 2,02 1,25 3,64 5,75 3,45 2,65
Sample 3,12 2,04 2,86 2,41 4,12 3,18 4,13 2,09 3,85
In case of illnes s, where to obtain treatment (Pct)
Health care facilies operated by the firm 4,92% 15,57% 16,21% 10,45% 19,57% 8,54% 23,54% 17,65% 8,45%
Private health provider (including traditional healers) 4,92% 3,30% 14,68% 23,08% 32,77% 31,37% 20,62% 49,86% 8,57%
Public facilities 84,43% 79,72% 67,28% 60,09% 41,28% 40,81% 53,24% 16,53% 60,68%
Facilities of NGO or charitable organizations 3,28% 0,00% 0,31% 2,03% na 16,45% 2,16% 3,36% 17,61%
Others 2,46% 1,42% 1,53% 4,35% 6,38% 2,83% 0,44% 12,60% 4,69%
In case of illnes s, applicable financial arrangement (Pct)
No significant out-of-pocket expenses necessary since treatment is free or low cost 20,49% 9,09% 3,18% 2,18% 6,87% 5,08% 7,41% 21,21% 5,80%
High out -of-pocket expenses but reimbursed by employer fully or partially 16,39% 7,66% 11,15% 17,27% 41,20% 22,97% 44,80% 23,70% 36,44%
High out -of-pocket expenses but reimbursed by insurance company fully or partially 26,23% 11,00% 2,87% 10,01% 12,02% 11,79% 13,75% 10,58% 4,97%
High out-of-pocket expenses but financial support from friends/family not belonging to my household 24,59% 19,14% 14,65% 14,51% 1,72% 10,16% 7,54% 6,20% 6,04%
High out -of-pocket expenses borne by my household 12,30% 53,11% 68,15% 55,30% 38,20% 50,00% 26,49% 38,32% 46,75%
Manufacturing Sector
Note: Only for manufacturing firms. Employee’s questionnaire.
Source: Firms surveys 2003-2006, World Bank.
Table A.4.1. 7. Unskilled production worker remuneration.By Size class Small Average Value 88,18
Standard Deviation (36,97)Frequency 15
Medium Average Value 46,32Standard Deviation (23,47)Frequency 6
Large Average Value 44,95Standard Deviation (12,98)Frequency 3
By Export Status Exporter Average Value 80,71Standard Deviation (57,23)Frequency 5
Non-exporter Average Value 69,10Standard Deviation (31,67)Frequency 19
By Sub-sector Garments Average Value 83,11Standard Deviation (47,16)Frequency 8
Other manufacturing sector Average Value 66,59Standard Deviation (32,66)
Frequency 16
Note: Exclusively for manufacturing firms. Employee’s questionnaire.
Source: Gambia Enterprise Survey 2006, World Bank
114

Section 4.1. Labor Market: Annex on wage determinants in The Gambia.
Considering the structure of remunerations in the Gambian manufacturing sector as well as the persistence of significant wage differentials, we now address the issue of the factors that drive wage formation and explain these results. One simple way to understand these results is to estimate wage equations with worker’s individual data (Table A.4.1.8). Three econometric models are estimated. The first one is an extension of the seminal model proposed by Mincer (1974). The second one is more complete and includes various institutional wages fixing mechanism (Azam and Ris, 2001). Finally, the last model includes all the preceding specifications and tries to address the non-significance issues of some key variables. In all specifications, the dependant variable is the logarithm of the total workers’ remuneration.
The basic model. The first estimated model (model 1) assumes that employers are able to discover differences in productivity between workers by looking at their human capital, nationality, gender… The model is estimated on a sample which includes only workers employed in manufacturing firms. We also add some firms’ characteristics variables such as the age of the firm, its ownership and its localization.
This estimation delivers results which fit our expectations. Employees’ human capital variables – education, experience prior to current employment – are significant and influence positively the remunerations. Note that the experience acquired within the firm, and its square value, are not significant and hence do not influence the level of wages. This can be related to the low proportion of firms providing training sessions we have observed earlier. This phenomenon is confirmed by the non significance of the dummy variable controlling for employees’ training. Concerning exogenous workers’ characteristics, we find that foreign employees earn significantly more than Gambians. Moreover, the fact that the gender dummy is not significant underlines the absence of some intrinsic gender discrimination. Hence, the large wage differentials between men and women described earlier seems to be due to some educational and/or experience deficit for women (also mentioned above). The significance of economic sector dummies confirms the existence of wage differentials between manufacturing sub-sectors (in favor of garments firms). Focusing on firms characteristics, it should be noticed that young firms seem to pay higher wage. Contrary to what is usually observed in Sub-Saharan Africa, firms located in the capital offer lower wages. However, and in accordance previous studies, the dummy variable controlling for the firms nationality is positive and significant. Hence, foreign-owned firms offer more attractive remuneration.
The augmented model. The previous results confirm the key role played by human capital variables and specific firms’ characteristics in the wage setting mechanism in The Gambia. However, the previous simple specification does not provide any precise indication about the institutional mechanisms that may also influence wage determination. The second econometric specification (Model 2) gives some additional explanations. In this model, we keep the previous specification and we add other variables that enable us to test the relevance of three well known wage setting theories; 63 the rent-sharing theory, the efficiency wage theory and the hold-up theory.
The rent-sharing theory suggests that the remuneration paid to the workers actually includes a share of the firm’s profit and thus reflects the firm’s performances (Blanchflower, Oswald et Sanfey, 1996). This share of profit in the remuneration can
63 - For a literature survey, see Saint-Paul, 1998, chap. 5; Azam and Ris, 2001.
115

originate in some insider behavior or in external pressures imposed on firms which have to adjust their incentive mechanisms.
The second theory, known as the efficiency wage theory, stipulates in one of his variants that the firms should pay wages above workers’ marginal productivity (i.e. above the wage that would lead to the labor market clearing condition). The intuition is quite straightforward: knowing that the worst penalty that a worker can encounter is the loss of his job, the cost of this loss for the worker is increasing with the wage he receives when he is employed. Hence, the firm can use high wages as a means of increasing the threat of being fired when caught shirking. As a result the firm has two means to enhance worker’s effort: either it increases the supervision of the worker’s effort (to increase the probability of unmasking shirking workers) or it can offer a higher wage to increase the loss of being fired. As a result, the firm faces a trade off between supervising workers, which is costly in terms of supervision technology and offering higher wages to increase workers efficiency.
Finally, a third way to explain the wage determination is the hold-up theory (Malcomson, 1997). This theory assumes a situation where labor contract are not complete and hence can be renegotiated, in particular when the firm has made a specific investment that cannot be easily resold. This new investment leaves the possibility for workers to renegotiate the wage agreement in their favor. As a result, workers can obtain an additional rent from the surplus generated by this new specific investment. However, the firm may internalize the renegotiation of the labor contracts and hence reduces its level of investment.
The results we obtain are rather clear. First of all, we note that the results of the first specification, in terms of variables sign and significance, are still valid. Hence, education, experience and nationality still constitute the individual workers’ characteristics that drive wages up. Concerning firms’ characteristics, younger firms and foreign-owned ones continue to provide more attractive remuneration policies to their employees.
The following block of variables aims to test directly the rent-sharing phenomenon. Hence, we include the profit per worker for managers and directors, and for other job positions. 64 We also take into account the various pressures that can face the firms. These pressures can be internal ones, the trade union presence or the status of employees65, or external ones such as the existence of tension on the labor market.66 Neither of these variables is significant. We note that the profit sharing phenomenon does not have the same impact on remuneration according to the hierarchical position of the employee inside the firm. But surprisingly, directors and managers do not seem to benefit from the rent-sharing mechanism, when other less skilled workers are awarded a part of the firm’s profit. However, the low significance level (10 percent) of the rent-sharing variable for these types of workers suggests that the rent-sharing theory is not, for the moment, the relevant one.
64 - The variables Log Profit per worker* (Director/Manager) and Log Profit per worker * (NON Director/Manager). These variables are obtained by multiplying the logarithm of profit per worker by two dummy variables controlling for the workers’ job position.
65 - Permanent worker status.
66 - The variable Log of average employment change in sub-sector which is computed as the sub-sectoral average of the employment variations within the firm between 2005 and 2002.
116

Concerning the two remaining alternative theories, we notice that the variable controlling for some efficiency wage effect67 is significant at a one percent level. Indeed, the negative sign of this variable suggest that the firm actually trades off between supervision expenses and higher wages. So, the share of profit observed in the remuneration of the less skilled employees may well be deliberately decided by the firm to enhance their effort. This is partially confirmed by the absence of pressures, external or internal, on the firm to increase workers wages. Moreover, the remunerations structure of these less skilled workers described above, which highlighted the importance of allowances and bonus in their total remunerations, lean in favor of the efficiency wage theory. Finally, the variable controlling for the presence of the hold-up phenomenon68 is not significant. This is in line with the weakness of the workers bargaining power stressed by the rejection of the rent-sharing theory. If workers cannot negotiate over their wages to capture a share of the profit, it would be hard to think that they have the possibility to renegotiate their labor contract once investment outlays are made.
Full specification model. The absence of any rent-sharing phenomenon in The Gambia and the fact that firms try to enhance only less skilled workers effort through high wages constitutes an exception in SSA countries analyzed so far. To check the validity of these results, the last specification (Model 3) introduces some additional variables. First we want to refine the impact of formal training sessions on the employees’ remunerations level. Hence, we include a dummy variable which is equal to one if the firm provides formal training to its workers and zero otherwise. Second, we want to capture accurately the nature of the pressures faced by the firm, in particular the internal ones. That’s why we introduce a dummy variable taking the value one if the employee belongs to a trade union and zero otherwise. Then, in the preceding specification we have discovered that the employees’ hierarchical position within the firm was a key element of the wage determination mechanism. Hence, we include another dummy variable which is equal to one if the worker is director or a manager. Finally, focusing on the issue of wage bargaining and labor contract renegotiation, we assume that the degree of informality of the firms is crucial. We call a firm with a high degree of informality a firm which may not declare its entire workforce or may hide some of its profit from the fiscal administration. Such a firm may not by reliable in terms of enforcing negotiated labor contracts. To control for this degree of informality we include the proportion of sales that firms generally declare to the fiscal administration.
The fact that the firm offers formal training to its workforce decreases significantly the wage. This may be because the firm compensates the cost of training sessions by lowering wages. Notice that the introduction of this new training variable does not change the significance of the worker’s training one.
Concerning the possible pressures faced by the firm to increase workers’ wages, we note that the new variable controlling for the worker’s union membership is not significant. However the inclusion of this new variable changes the pattern of the rent-sharing phenomenon. Indeed, both profit per worker variables are now positive and highly significant. This means that the rent-sharing phenomenon between firms and workers seems to affect positively the level of wages. Moreover, the hierarchical position inside the firm influences significantly the 67 - The supervision ratio is a proxy for the workers’ effort supervision technology adopted by the firms. It is computed as the ratio between the numbers of managers and directors and the number of the other less skilled workers who are not directors or managers.
68 - In the frame of the Hold-Up theory, if a firm engages in some irreversible investment and if labor contracts are open to renegotiation, the workers can manage to capture a share of the surplus generated by this investment. In our specification, this phenomenon is captured by the inclusion of the log of specific investment. This variable takes into account the amount of specific investment per worker realized by the firm in 2006.
117
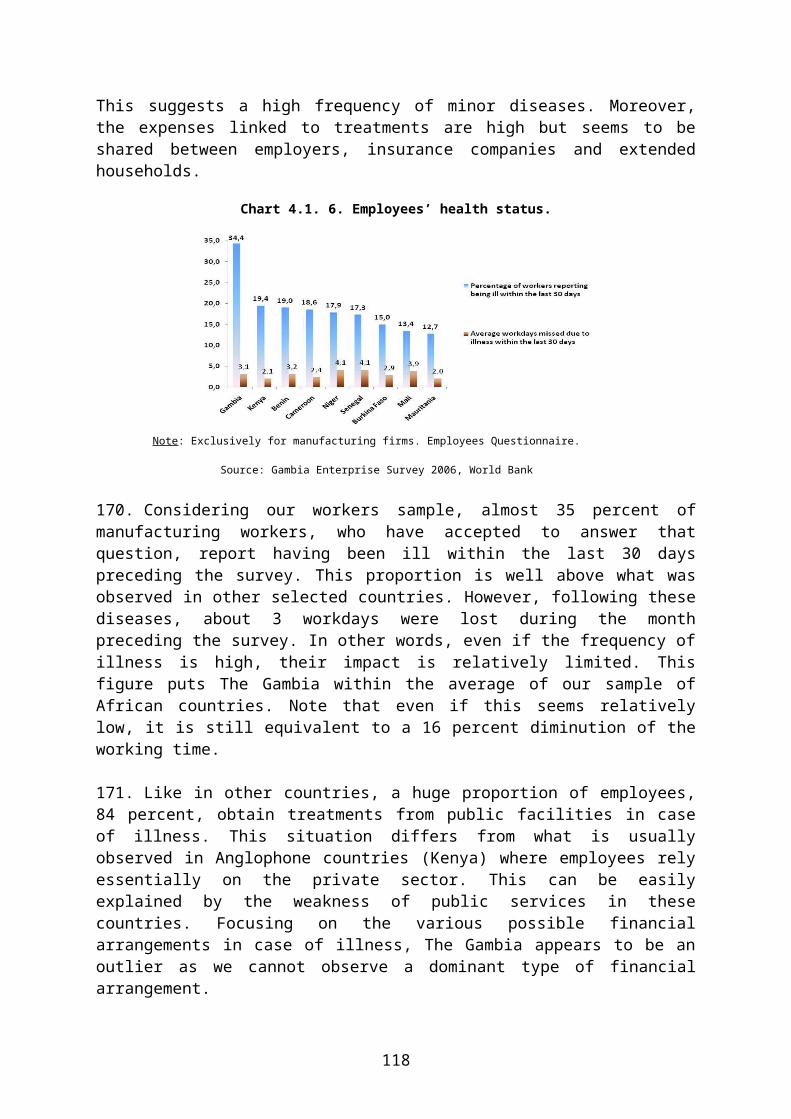
size of the rent captured by workers. Indeed, directors and managers manage to take over a larger share of the firm’s profit than less skilled workers. Note that the efficiency wage variable is no more significant. Hence, the profit sharing is not decided by firm to enhance workers wages but rather imposed by workers through unobservable means such as lobbying (as both internal and external pressures are not significant). Finally, we observe that the hold-up variable influences positively the wage rate (at only 10 percent significance level) which may underline the presence of some labor contract renegotiation. This may explain why directors and managers do not benefit from allowances and bonuses: they prefer the security of wages (which can be renegotiated in favorable economic conditions) to the fluctuations of bonus and allowances (which can be reduced by the firm in case of economic difficulties).
Focusing on the firms’ degree of informality, we notice that the share of sales declared to the fiscal administration does not influence the wage level. However, the inclusion of this key variable allows us to highlight what seems to be the most plausible wage setting mechanism.
The estimations are presented in the following table.
118
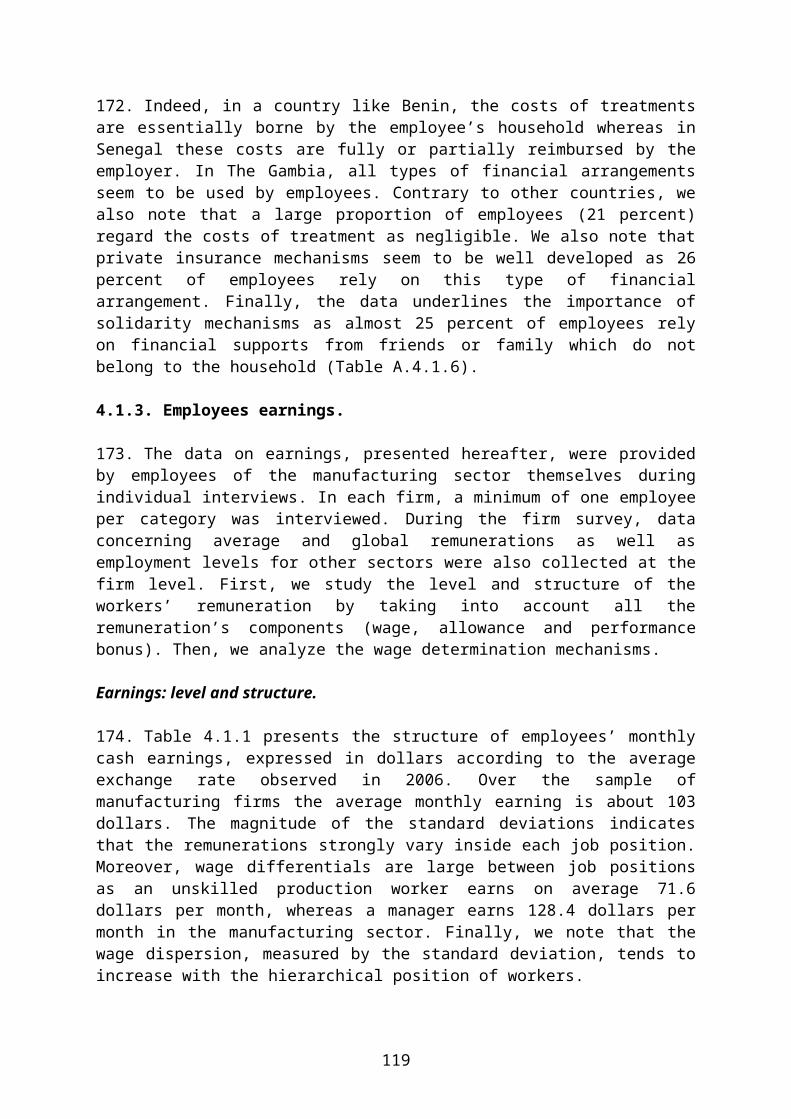
Table A.4.1. 8. Wage equations.
Dependant variable : Log of the individual monthly earnings Model 1 Model 2 Model 3 Intercept 7,804 *** 6,700 ** 4,647 **
(17,17) (3,01) (2,30)Workers Characteristics
Years of schooling 0,033 ** 0,0,42 * 0,025 ns(2,41) (2,25) (1,37)
Experience within the firm (years) 0,049 ns 0,027 ns 0,053 ns(1,03) (0,62) (1,15)
Experience² -0,002 ns -0,001 ns -0,002 ns(0,77) (0,36) (0,81)
Other professional experience (years) 0,041 *** 0,061 *** 0,059 ***(4,69) (7,29) (3,79)
Nationality (dummy=1 if Foreigner, 0 otherwise) 0,709 *** 0,870 *** 0,981 ***(4,02) (5,71) (4,76)
Gender (dummy=1 if Male, 0 otherwise) -0,043 ns -0,004 ns -0,018 ns(0,28) (0,02) (0,13)
Weekly hours worked -0,011 ns -0,016 ns -0,007 ns(1,23) (1,06) (0,39)
Trained (dummy=1 if trained by the firm, 0 otherwise) 0,104 ns 0,034 ns 0,075 ns(0,84) (0,10) (0,25)
Worker's hierarchical position -11,458 * (dummy=1 if director or manager , 0 otherwise) (1,95)
Manufacturing sub-sector dummies Yes Yes Yes
Firms CharacteristicsAge of the firm (years) -0,035 *** -0,056 *** -0,071 ***
(7,27) (7,45) (7,39)Foreign owned firm 1,741 *** 1,390 *** 2,601 ***
(dummy=1 if more than 50% of the capital is foreign) (14,22) (4,45) (8,04)Firm in Banjul -0,535 *** -0,587 ns -0,076 ns
(dummy=1 if firm in Banjul, 0 otherwise) (4,54) (1,81) (0,25)Firm offering formal training -2,946 ***
(dummy=1 if the firm offers formal training , 0 otherwise) (3,85)Rent-sharing variables
Trade union in the firm 0,095 ns 0,077 ns(dummy=1, if there is at least one union in the firm , 0 otherwise) (0,65) (0,38)
Permanent employee -1,654 *** -0,291 ns(dummy=1 if permanent employee, 0 otherwise) (7,45) (1,10)
Log of average employment change in sub-sector 1,913 ns(1,22)
Log of profit per worker * (Director / Manager) 0,262 ns 1,513 **(1,47) (2,75)
Log of profit per worker * (Non Director / Manager)) 0,331 * 0,316 *(1,85) (2,03)
Unionized worker 0,018 ns(dummy=1 if the worker belongs to a union, 0 otherwise) (0,04)
Efficiency WageSupervision ratio -0,521 *** 0,948 ns
(number of directors and managers / number of other employees) (4,47) (1,68)Hold-Up
Log of specific investment 0,031 ns 0,105 *(0,86) (2,05)
InformalityPercentage of sales officially declared to the administration 0,007 ns
(1,74) Number of observations 96 96 96R-Square 0,369 0,609 0,757Number of clusters (firm) 10 10 10NB. White Heteroskedasticity-Constent Standard Errors & Covariance.Significance levels : *** 1%, ** 5%, * 10%.Numbers between brackets are absolute values of the t-ratio.
119

APPENDIX 5 - SAMPLING METHODOLOGY.
This appendix presents the methodology applied to build The Gambia sample. The sample frame for formal establishments with five or more full-time paid permanent employees was developed on the basis of a list acquired from the National Bureau of Statistics. Because the number of establishments with five or more full-time paid permanent employees was small for each of the five strata (food and beverage, garment, other manufacturing, retail trade and rest of the universe), it was decided to check this list and contact every establishment on the initial list, as well as any additional eligible establishments that could be identified over the course of the survey period. Any such additional eligible establishments were added to the master list to define the population of firms.
1. Enterprise survey sampling in the formal sector.
Sample Frame
Like in every ES since 2005, the survey undertaken in The Gambia covers a sample of formal firms in the manufacturing sector (food, garments, metal, wood…), services (retail) as well as the rest of the economy (construction, tourism, transport…). Following the identification of firms with five or more full-time paid permanent employees in 2006, an initial population of 239 establishments was drawn-up. The selected firms were located the city of Banjul and in the Kanifing Municipal Council (KMC). The table below presents the repartition of these firms.
Table A.5. 1. Population size by stratum and sampling region
Banjul KMC TotalManufacturing 6 36 42
Food and Beverage 0 5 5Garments 0 4 4
Other Manufacturing 6 27 33
Retail 9 58 67
Rest of the Universe 25 105 130
Total 40 199 239
Source: EEC Canada
Sample
The resulting sample frame consisted in a population of 239 establishments. Surveyed firms were selected according to a stratified random sampling procedure. Each of those establishments was approached and asked to participate in the survey. In the end:
9 firms were unavailable for interview during the survey period;
56 firms refused to participate to the survey;
174 firms participated to the survey, which ended up to 174 completed questionnaires.
120

Therefore, the global participation rate of firms to the survey is equivalent to an overall sampling rate of 72.8 percent.
Table A.5. 2. Sample of formal firms.
Banjul KMC Total Sampling rateManufacturing 6 27 33 78.57%
Food and Beverage 0 3 3 60.00%Garments 0 4 4 100.00%
Other Manufacturing 6 20 26 78.79%
Retail 6 41 47 70.15%
Rest of the Universe 19 75 94 72.31%
Total 31 143 174 72.80%
Source: EEC Canada
This sample represents about 79 percent of active firms in the manufacturing sector, 70 percent in the retail sector and 72 percent of firms in other existing sectors at the time of the survey. This sample correctly reproduces the main characteristics of the initial population as shown below.
Chart A.5. 1. Comparison of firms’ distributions
16.74%
83.26%
17.57%
28.03%
54.39%
17.82%
82.18%
18.97%27.01%
54.02%
0%
10%
20%
30%
40%
50%
60%
70%
80%
90%
Banjul KMC Manufacturing Retail Rest of the universe
Distribution by location Distribution by Sectors
Sample Base Sample
Source: EEC Canada.
2. Sampling in the micro-informal sector.
121

The enterprise survey in The Gambia also covers microenterprises and firms in the informal sector. Although it does not exist a unique definition for the so-called informal firms, the selected criterion in this survey is the size of the firm – i.e. unregistered firms with less than five employees in 2006.
For many reasons including the small size of establishments, their expected high rate of turnovers, the high level of “informality” of establishments in many activities and consequently the difficulty to obtain trustworthy information from official sources, EEC Canada selected an aerial sampling approach to estimate the population of establishments and select the sample in this stratum for all regions of the survey. In order to randomly select individual micro establishments for surveying, the following procedure was followed:
Selection of districts and specific zones inside each district where there was a high concentration of micro establishments;
Count all micro-establishments in these specific zones;
On the basis of the previous count, creation of a virtual list of firms and selection of establishments at random from that virtual list;
Based on the ratio between the number selected in each specific zone and the total population in that zone, a skip rule was created and applied for selecting establishments in that zone.
The final sample of informal firms is presented in the table below:
Table A.5. 3. Sample of micro/informal firms.
Banjul KMC TotalSample Frame Estimate 823 5,246 6,069Sample 16 111 127Sampling rate (%) 1.94 2.11 2.09
Source: EEC Canada
122
123

REFERENCES
AW, B. Y., CHUNG, S., AND ROBERTS, M. (2000). "PRODUCTIVITY AND TURNOVER IN THE EXPORT MARKET: MICRO-LEVEL EVIDENCE FROM THE REPUBLIC OF KOREA AND TAIWAN." WORLD BANK ECONOMIC REVIEW, 14 (1), 65-90.
AZAM, J.P. AND RIS, C. (2001). RENT-SHARING, HOLD-UP AND MANUFACTURING SECTOR WAGES IN CÔTE D'IVOIRE, MIMEO, ARQADE - TOULOUSE UNIVERSITY, FRANCE.
BERNARD, A. B. AND BRADFORD, J. (1999). "EXCEPTIONAL EXPORTER PERFORMANCE: CAUSE, EFFECT OR BOTH?" JOURNAL OF INTERNATIONAL ECONOMICS 47 (1), 1-25.
BIAIS, B. ET GOLLIER, C. (1997). "TRADE CREDIT AND CREDIT RATIONNING", REVIEW OF FINANCIAL S TUDIES, VOL. 10, 903-937.
BLANCHFLOWER, D.G., OSWALD, J.A. AND SANFEY, P. (1996). WAGES, PROFITS AND RENT-SHARING, QUARTERLY JOURNAL OF ECONOMIC, 111, PP 227-252.
BOSWORTH, B. ET COLLINS, S. (2003). THE EMPIRICS OF GROWTH: AN UPDATE, BROOKINGS INSTITUTION.
CLERIDES, K., LACH, S. AND TYBOUT, J. (1998). "IS LEARNING BY EXPORTING IMPORTANT? MICRO-DYNAMIC EVIDENCE FROM COLOMBIA, MEXICO, AND MOROCCO." QUARTERLY JOURNAL OF ECONOMICS 113 (3), 903-947.
DOLLAR, D., HALLWARD-DRIEMEIER, M., AND MENGISTAE, T., (2003). "INVESTMENT CLIMATE AND FIRM PERFORMANCE IN DEVELOPING COUNTRIES.", MIMEO, WORLD BANK, WASHINGTON D.C.
GELB, A., RAMACHANDRAN, V., SHAH K.M. AND TURNER, G. (2007). WHAT MATTERS TO AFRICAN FIRMS? THE RELEVANCE OF PERCEPTIONS DATA, WORKING PAPER SERIE 4446, THE WORLD BANK, WASHINGTON DC.
GONZÁLEZ, A., LÓPEZ-CÓRDOVA, E. AND VALLADARES, E. (2007). "THE INCIDENCE OF GRAFT ON DEVELOPING-COUNTRY FIRMS. POLICY RESEARCH WORKING PAPER 4394. WORLD BANK, WASHINGTON DC.
GREENE, W. (2003). ECONOMETRIC ANALYSIS. 5TH EDITION. PRENTICE-HALL, UPPER SADDLE RIVER, NJ.
HEINTZ, J., OYA, C. AND ZEPEDA, E. (2008). TOWARDS AN EMPLOYMENT-CENTRED DEVELOPMENT STRATEGY FOR POVERTY REDUCTION IN THE GAMBIA: MACROECONOMIC AND LABOUR MARKET ASPECTS, COUNTRY STUDY NUMBER 16, CARNEGIE ENDOWMENT FOR INTERNATIONAL PEACE, WASHINGTON DC.
HERITAGE FOUNDATION (2009). INDEX OF ECONOMIC FREEDOM, WASHINGTON DC.
EIU (2009A): THE GAMBIA: COUNTRY PROFILE 2009, LONDON.
EIU (2009B): THE GAMBIA: COUNTRY REPORT- JANUARY 2009, LONDON.
124

INTERNATIONAL MONETARY FUND (2009A). THE GAMBIA: POVERTY REDUCTION STRATEGY PAPER - ANNUAL PROGRESS REPORT, IMF COUNTRY REPORT NO. 09/75, WASHINGTON DC.
INTERNATIONAL MONETARY FUND (2009B). THE GAMBIA—FOURTH REVIEW UNDER THE THREE-YEAR ARRANGEMENT UNDER THE POVERTY REDUCTION AND GROWTH FACILITY, AND REQUEST FOR A WAIVER OF NONOBSERVANCE OF PERFORMANCE CRITERION, AUGMENTATION OF ACCESS, AND MODIFICATION OF PERFORMANCE CRITERIA—STAFF REPORT, IMF COUNTRY REPORT NO. 09/92, WASHINGTON DC.
INVESTMENT CLIMATE STATEMENT (2009). THE GAMBIA, BUREAU OF ECONOMIC, ENERGY AND BUSINESS AFFAIRS, US DEPARTMENT OF STATE, WASHINGTON DC.
KELLER, W., (2003). "INTERNATIONAL TECHNOLOGY DIFFUSION." MIMEO, UNIVERSITY OF TEXAS DEPARTMENT OF ECONOMICS, AUSTIN, TX.
KUMBHAKAR, S.C. AND KNOX LOVELL, C.A., (2000). STOCHASTIC FRONTIER ANALYSIS. CAMBRIDGE UNIVERSITY PRESS, CAMBRIDGE, UK.
LIU, JIN-TAN, MENG-WEN T., AND HAMMITT, J.K., (1999). "EXPORT ACTIVITY AND PRODUCTIVITY: EVIDENCE FROM THE TAIWAN ELECTRONICS INDUSTRY." WELTWIRTSCHAFTLICHES ARCHIV 135 (4), 675-91.
MALCOMSON, J (1997). CONTRACTS, HOLD-UP AND LABOR MARKETS, JOURNAL OF ECONOMIC LITERATURE, 35, PP 1916-1957.
MINCER (1974). SCHOOLING, EXPERIENCE AND EARNINGS, NBER WORKING PAPER N° 39, NBER AND COLUMBIA UNIVERSITY.
MRSA (2009). MULTISECTOR REGULATORY AGENCIES IN FIVE AFRICAN COUNTRIES, HELLERSTEIN AND PURC.
OLINER, S.D. AND SICHEL D.E. (2000). "THE RESURGENCE OF GROWTH IN THE LATE 1990S: IS INFORMATION TECHNOLOGY THE STORY?" JOURNAL OF ECONOMIC PERSPECTIVES 14(4):3–22.
QIANG, C, CLARKE G., AND HALEWOOD N. (2006). "THE ROLE OF ICT IN DOING BUSINESS." IN WORLD BANK, EDS., INFORMATION AND COMMUNICATIONS FOR DEVELOPMENT 2006: GLOBAL TRENDS AND POLICIES. WASHINGTON DC: WORLD BANK, PP. 57-86.
REPUBLIC OF THE GAMBIA (2006). POVERTY REDUCTION STRATEGY: 2007-2011, DEPARTMENT OF STATE FOR FINANCE AND ECONOMIC AFFAIRS, BANJUL.
ROBERTS, M AND TYBOUT, J. (1996) INDUSTRIAL EVOLUTION IN DEVELOPING COUNTRIES: MICRO PATTERNS OF TURNOVER, PRODUCTIVITY AND MARKET STRUCTURE, NEW YORK, OXFORD UNIVERSITY PRESS.
SAINT-PAUL, G. (1998). DUAL LABOR MARKETS, MIT PRESS, CAMBRIDGE.
SAGGI, K. (2002). "TRADE, FOREIGN DIRECT INVESTMENT, AND INTERNATIONAL TECHNOLOGY TRANSFER: A SURVEY." WORLD BANK RESEARCH OBSERVER 17(2):191–235.
125

STERN, N. (2002A). "DEVELOPMENT AS A PROCESS OF CHANGE", KEYNES LECTURE: BRITISH ACADEMY, LONDON.
STERN, N. (2002B). "A STRATEGY FOR DEVELOPMENT", MIMEO, WORLD BANK, WASHINGTON, D.C.
TYBOUT, J.R., (2003). "PLANT- AND FIRM-LEVEL EVIDENCE ON "NEW" TRADE THEORIES." IN: E. KWAN CHOI AND JAMES HARRIGAN, EDS. HANDBOOK OF INTERNATIONAL TRADE. BLACKWELL PUBLISHERS, MALDEN, MA, PP. 389-415.
UNCTAD (2007). WORLD INVESTMENT REPORT 2007: TRANSNATIONAL CORPORATIONS, EXTRACTIVE UNDSTRIES AND DEVELOPMENT, UNITED NATIONS, GENEVE.
UNCTAD (2008). WORLD INVESTMENT REPORT 2007: TRANSNATIONAL CORPORATIONS AND THE INFRASTRUCTURE CHALLENGE, UNITED NATIONS, GENEVE.
WESTPHAL, LARRY E., (2002). "TECHNOLOGY STRATEGIES FOR ECONOMIC DEVELOPMENT IN A FAST CHANGING GLOBAL ECONOMY." ECONOMICS OF INNOVATION AND NEW TECHNOLOGY 11 (4-5), 275-320.
WORLD BANK (2005A). HEALTH AND POVERTY IN THE GAMBIA: A BACKGROUND REPORT TO THE NATIONAL POVERTY REDUCTION STRATEGY PAPER, AFRICA REGION HUMAN DEVELOPMENT WORKING PAPER SERIES, WASHINGTON DC.
WORLD BANK (2005B). A BETTER INVESTMENT CLIMATE FOR EVERYONE, WORLD DEVELOPMENT REPORT, WASHINGTON DC.
WORLD BANK (2006). DOING BUSINESS 2007, WASHINGTON DC.
WORLD BANK (2007A). DOING BUSINESS 2008, WASHINGTON DC.
WORLD BANK (2007B). THE GAMBIA: FROM ENTREPÔT TO EXPORTER AND ECO-TOURISM, WASHINGTON DC.
WORLD BANK (2008A). INTERNATIONAL DEVELOPMENT ASSOCIATION, AFRICAN DEVELOPMENT BANK: JOINT ASSISTANCE STRATEGY FOR THE REPUBLIC OF THE GAMBIA FOR FISCAL YEARS 2008-20111, ADVANCE COPY, WASHINGTON DC.
WORLD BANK (2008B). DOING BUSINESS 2009, WASHINGTON DC.
WORLD BANK (2009). MULTISECTOR REGULATORY AGENCIES IN FIVE AFRICAN COUNTRIES: THE GAMBIA – A LIMITED TRACK RECORD BUT POTENTIAL TO GROW PENDING STRONGER POLITICAL COMMITMENT, POLICY NOTE, WASHINGTON DC.
WORLD TRADE ORGANIZATION (2004). TRADE POLICY REVIEW: THE GAMBIA, REPORT BY THE SECRETARIAT, GENEVA.
126