report no. 03-02-46 (2001) statistics south africa 2005 … no. 03-02-46 (2001) statistics south...
TRANSCRIPT

Report no. 03-02-46 (2001) Statistics South Africa2005
Pali LehohlaStatistician-General

Census 2001: Stages in the life cycle of South Africans
Published by Statistics South Africa, Private Bag X44, Pretoria 0001
© Statistics South Africa, 2005
Users may apply or process this data, provided Statistics South Africa (Stats SA) is acknowledged as theoriginal source of the data; that it is specified that the application and/or analysis is the result of the user'sindependent processing of the data; and that neither the basic data nor any reprocessed version or applicationthereof may be sold or offered for sale in any form whatsoever without prior permission from Stats SA.
Stats SA Library Cataloguing-in-Publication (CIP) DataCensus 2001: Stages in the life cycle of South Africans / Statistics South Africa. Pretoria: Statistics SouthAfrica194p. [Report No. 03-02-46 (2001)]ISBN: 03-02-46-0-621-36296-4
1 Families – South Africa2 Statistics – Population3 Life Cycle – Human4 Census5 Migration6 Education7 DisabilityI. Statistics South Africa(LCSH 16)
A complete set of Stats SA publications is available at Stats SA Library and the following libraries: National Library of South Africa, Pretoria Division National Library of South Africa, Cape Town Division Library of Parliament, Cape Town Bloemfontein Public Library Natal Society Library, Pietermaritzburg Johannesburg Public Library Eastern Cape Library Services, King William's Town Central Regional Library, Polokwane Central Reference Library, Nelspruit Central Reference Collection, Kimberley Central Reference Library, Mmabatho
This report is available on the Stats SA website: www.statssa.gov.za
Copies are available from: Printing and Distribution, Statistics South AfricaTel: (012) 310 8044 / 310 8161 (012) 310 8161Fax: (012) 321 7381Email: [email protected]
Statistics South Africa i
PrefaceThis report contains descriptions of the people counted in South Africa during Census 2001,grouped according to the various stages in the life cycle. The analysis therefore presentscensus data from a different perspective than in earlier census publications. Anunderstanding of the numbers and characteristics of people in each life stage and thecircumstances in which they are living is important for understanding the role that bothgovernment and the broader society can play to give support to people as they grow anddevelop, stabilise and then decline, and to help them to live productive lives. Each stage ofthe life cycle influences the next stage.
Presentation of this reportThe bulk of the report consists of graphs illustrating particular findings for the various agegroups, each with accompanying text. Overall findings and comparative text are presented initalics.
Most graphs have abbreviated titles and should be read in the context of the age group andtopic given at the top of each page. For this reason no separate list of figures is provided.
Most data are from Census 2001, so the source is not repeated under each table and graph.Sources are only given where both Census ’96 and Census 2001 data are shown.

ii Stages in the life cycle of South Africans
ContentsList of tables ...................................................................................................................................... ivTechnical notes...................................................................................................................................vExtract from the Report of the Census Sub-committee to the South African Statistics Council on
Census 2001............................................................................................................................ vi
Executive summary.................................................................................................vii
Chapter 1: Description of the South African population........................................1Introduction.........................................................................................................................................1Demographic picture...........................................................................................................................1Educational attainment........................................................................................................................6Attendance at an educational institution ..............................................................................................7Labour market status of the working-age population (15–65) ...............................................................8Occupation of the employed of working age ........................................................................................9Disability ...........................................................................................................................................11Distribution of households .................................................................................................................12Households by type of dwelling .........................................................................................................12Household size .................................................................................................................................13Access to services ............................................................................................................................14Household data compared with individual data..................................................................................16People in collective living quarters.....................................................................................................17Institutions ........................................................................................................................................19People in institutions .........................................................................................................................20The prison population........................................................................................................................21
Chapter 2: Description of South African infants...................................................23Demographic picture.........................................................................................................................24Parents alive.....................................................................................................................................26Living with parents ............................................................................................................................27Relationship to household head ........................................................................................................28Pre-school attendance ......................................................................................................................30Disability ...........................................................................................................................................32Number of people with whom living ...................................................................................................34Type of dwelling................................................................................................................................35Main energy source for lighting .........................................................................................................37Main water source.............................................................................................................................38Main toilet facility...............................................................................................................................39Infants in collective living quarters.....................................................................................................40Infants in institutions..........................................................................................................................42
Chapter 3: Description of South African children.................................................43Demographic picture.........................................................................................................................44Parents alive.....................................................................................................................................46Living with parents ............................................................................................................................48Relationship to household head ........................................................................................................49School attendance ............................................................................................................................52Educational attainment......................................................................................................................53Working children (10–13) ..................................................................................................................55Disability ...........................................................................................................................................56Number of people with whom living ...................................................................................................59Type of dwelling................................................................................................................................60Access to services ............................................................................................................................62Children in collective living quarters...................................................................................................64Children in institutions .......................................................................................................................65

Statistics South Africa iii
Chapter 4: Description of South African youth and young adults ......................67Demographic picture.........................................................................................................................67Parents alive.....................................................................................................................................71Living with parents ............................................................................................................................73Marital status ....................................................................................................................................75Women who had given birth .............................................................................................................76Relationship to household head ........................................................................................................79Attendance at an educational institution ............................................................................................83Educational attainment......................................................................................................................86Labour market status ........................................................................................................................91Industry of the employed...................................................................................................................97Occupation of the employed............................................................................................................100Disability .........................................................................................................................................104Number of people with whom living .................................................................................................107Type of dwelling..............................................................................................................................108Access to services ..........................................................................................................................110Youth in collective living quarters ....................................................................................................112Youth in institutions.........................................................................................................................114
Chapter 5: Description of South African adults..................................................117Demographic picture.......................................................................................................................117Parents alive...................................................................................................................................120Marital status ..................................................................................................................................121Women who had given birth (35–50)...............................................................................................123Relationship to household head ......................................................................................................125Education........................................................................................................................................126Labour market status ......................................................................................................................130Industry of the employed.................................................................................................................134Occupation of the employed............................................................................................................137Disability .........................................................................................................................................140Number of people with whom living .................................................................................................145Type of dwelling..............................................................................................................................147Access to services ..........................................................................................................................149Mature adults in collective living quarters ........................................................................................151Mature adults in institutions.............................................................................................................153
Chapter 6: Description of the South African elderly...........................................155Demographic picture.......................................................................................................................156Marital status ..................................................................................................................................159Relationship to household head ......................................................................................................161Education........................................................................................................................................163The employed elderly......................................................................................................................165Industry of the employed elderly......................................................................................................167Occupation of the employed elderly.................................................................................................168Disability .........................................................................................................................................169Number of people with whom living .................................................................................................172Type of dwelling..............................................................................................................................173Access to services ..........................................................................................................................175The elderly in collective living quarters ............................................................................................177The elderly in institutions ................................................................................................................179
Chapter 7: Conclusion ..........................................................................................181

iv Stages in the life cycle of South Africans
List of tablesTable 1.1: Distribution of the population by province, 1996 and 2001...........................................1Table 1.2: Distribution of households living in housing units by province, 1996 and 2001...........12Table 1.3: Distribution of the population by population group, sex and type of living
quarters....................................................................................................................17Table 1.4 Number of institutions by province and type of institution ..........................................19Table 1.5: Number of people in institutions by population group, sex and type of institution .......20
Table 2.1: Distribution of infants by age, sex and population group............................................24Table 2.2: Number of disabled infants by age, sex and type of disability....................................32Table 2.3: Distribution of infants by age, population group and type of living quarters ................40Table 2.4: Number of infants in institutions by population group and type of institution...............42Table 2.5: Number of infants in prisons, correctional institutions and police cells by age,
sex and population group .........................................................................................42
Table 3.1: Distribution of children by age, sex and population group..........................................44Table 3.2: Number of disabled children by age, sex and type of disability ..................................56Table 3.3: Distribution of children by age and type of living quarters..........................................64Table 3.4: Number of children in institutions by age and type of institution.................................65Table 3.5: Number of children in prisons, correctional institutions and police cells by age,
population group and sex .........................................................................................65
Table 4.1: Distribution of youth by age, sex and population group .............................................68Table 4.2: Number of disabled youth by age and type of disability ...........................................104Table 4.3: Distribution of youth by age and type of living quarters............................................112Table 4.4: Number of youth in institutions by age and type of institution...................................114Table 4.5: Number of youth in prisons, correctional institutions and police cells by age,
population group and sex .......................................................................................115
Table 5.1: Distribution of mature adults by age, sex and population group...............................118Table 5.2: Number of disabled mature adults by five-year age category, sex and type of
disability .................................................................................................................140Table 5.3: Distribution of mature adults by age and type of living quarters ...............................151Table 5.4: Number of mature adults in institutions by age and type of institution......................153Table 5.5: Number of mature adults in prisons, correctional institutions and police cells by
five-year age category, population group and sex ...................................................154
Table 6.1: Distribution of the elderly by five-year age category, sex and population group .......156Table 6.2: Number of disabled elderly by five-year age category, sex and type of disability .....169Table 6.3: Distribution of the elderly by age and type of living quarters ....................................177Table 6.4: Number of elderly in institutions by age and type of institution.................................179

Statistics South Africa v
Technical notesAdjusting for undercountFor both censuses a post-enumeration survey (PES) was undertaken to determine the degree ofundercount or overcount. The numbers and percentages presented in this report have been adjustedaccording to the PES findings.
Adjusting the count in this way leads to the introduction of fractions. These fractions have beenrounded to whole numbers. The sum of the separate numbers may therefore differ slightly from thetotals given. A similar effect can be seen with the percentages, which are rounded to one decimalplace, and therefore may not always sum to 100.
Population groupStatistics South Africa (Stats SA) continues to classify people by population group, in order to monitorprogress in moving away from the apartheid-based discrimination of the past. However membership ofa population group is now based on self-perception and self-classification, not on a legal definition.
In 2001, five options were provided on the questionnaire, Black African, Coloured, Indian or Asian,White, and Other. Responses in the last category and non-responses were minimal and weretherefore imputed. In this report the term African, rather than the longer expression black African, hasbeen used throughout the text for ease of reading.
DefinitionsA publication containing all census concepts and definitions is available electronically (Report no. 03-02-26 (2001)). For the convenience of the reader a few key definitions are given below. Definitionsand descriptions of any other term used or topic analysed in this report can be found in the relevantsection of Chapter 1 as each topic is introduced.
• Household: A household is a group of persons who live together, and provide themselvesjointly with food and/or other essentials for living, or a single person who lives alone.
• Housing unit: A unit of accommodation for a household, which may consist of one structure,more than one structure, or part of a structure. Examples of each are a house, a group ofrondavels, and a flat.
• Informal dwelling: A makeshift structure not erected according to approved architectural plans.Such dwellings can be found in informal settlements or in backyards.
• Traditional dwelling: A dwelling made of clay, mud, reeds or other locally available materials.This is a general term which includes huts, rondavels, etc. Such dwellings can be found assingle units or in clusters.
• Collective living quarters: Living quarters where certain facilities are shared by groups ofindividuals or households. They include hostels, hotels and institutions.
• Educational attainment/ Highest level of (completed) education:o No schooling: This category includes people who had never been to school, as well as
children in pre-school, Grade 0, and Grade 1 at the time of the census. Only children whohad completed Grade 1 fell into the next category.
o Some primary: Grades 1–6 inclusive.o Complete primary: Grade 7o Some secondary: Grades 8–11 inclusiveo Grade 12/ Std 10o Higher: Any tertiary qualification, including certificates and diplomas of at least six months’
full-time study or equivalent as well as degrees. In this report (unlike many other Stats SAreports) this category includes people with a tertiary qualification without havingcompleted secondary education.
• Economically active: All those aged 15–65 who are either employed or unemployed. The restof the working-age population is classified as not economically active, which includesstudents, homemakers, those too ill to work and anyone not seeking work.

Statistics South Africa i
PrefaceThis report contains descriptions of the people counted in South Africa during Census 2001,grouped according to the various stages in the life cycle. The analysis therefore presentscensus data from a different perspective than in earlier census publications. Anunderstanding of the numbers and characteristics of people in each life stage and thecircumstances in which they are living is important for understanding the role that bothgovernment and the broader society can play to give support to people as they grow anddevelop, stabilise and then decline, and to help them to live productive lives. Each stage ofthe life cycle influences the next stage.
Presentation of this reportThe bulk of the report consists of graphs illustrating particular findings for the various agegroups, each with accompanying text. Overall findings and comparative text are presented initalics.
Most graphs have abbreviated titles and should be read in the context of the age group andtopic given at the top of each page. For this reason no separate list of figures is provided.
Most data are from Census 2001, so the source is not repeated under each table and graph.Sources are only given where both Census ’96 and Census 2001 data are shown.

ii Stages in the life cycle of South Africans
ContentsList of tables ...................................................................................................................................... ivTechnical notes...................................................................................................................................vExtract from the Report of the Census Sub-committee to the South African Statistics Council on
Census 2001............................................................................................................................ vi
Executive summary.................................................................................................vii
Chapter 1: Description of the South African population........................................1Introduction.........................................................................................................................................1Demographic picture...........................................................................................................................1Educational attainment........................................................................................................................6Attendance at an educational institution ..............................................................................................7Labour market status of the working-age population (15–65) ...............................................................8Occupation of the employed of working age ........................................................................................9Disability ...........................................................................................................................................11Distribution of households .................................................................................................................12Households by type of dwelling .........................................................................................................12Household size .................................................................................................................................13Access to services ............................................................................................................................14Household data compared with individual data..................................................................................16People in collective living quarters.....................................................................................................17Institutions ........................................................................................................................................19People in institutions .........................................................................................................................20The prison population........................................................................................................................21
Chapter 2: Description of South African infants...................................................23Demographic picture.........................................................................................................................24Parents alive.....................................................................................................................................26Living with parents ............................................................................................................................27Relationship to household head ........................................................................................................28Pre-school attendance ......................................................................................................................30Disability ...........................................................................................................................................32Number of people with whom living ...................................................................................................34Type of dwelling................................................................................................................................35Main energy source for lighting .........................................................................................................37Main water source.............................................................................................................................38Main toilet facility...............................................................................................................................39Infants in collective living quarters.....................................................................................................40Infants in institutions..........................................................................................................................42
Chapter 3: Description of South African children.................................................43Demographic picture.........................................................................................................................44Parents alive.....................................................................................................................................46Living with parents ............................................................................................................................48Relationship to household head ........................................................................................................49School attendance ............................................................................................................................52Educational attainment......................................................................................................................53Working children (10–13) ..................................................................................................................55Disability ...........................................................................................................................................56Number of people with whom living ...................................................................................................59Type of dwelling................................................................................................................................60Access to services ............................................................................................................................62Children in collective living quarters...................................................................................................64Children in institutions .......................................................................................................................65
Statistics South Africa iii
Chapter 4: Description of South African youth and young adults ......................67Demographic picture.........................................................................................................................67Parents alive.....................................................................................................................................71Living with parents ............................................................................................................................73Marital status ....................................................................................................................................75Women who had given birth .............................................................................................................76Relationship to household head ........................................................................................................79Attendance at an educational institution ............................................................................................83Educational attainment......................................................................................................................86Labour market status ........................................................................................................................91Industry of the employed...................................................................................................................97Occupation of the employed............................................................................................................100Disability .........................................................................................................................................104Number of people with whom living .................................................................................................107Type of dwelling..............................................................................................................................108Access to services ..........................................................................................................................110Youth in collective living quarters ....................................................................................................112Youth in institutions.........................................................................................................................114
Chapter 5: Description of South African adults..................................................117Demographic picture.......................................................................................................................117Parents alive...................................................................................................................................120Marital status ..................................................................................................................................121Women who had given birth (35–50)...............................................................................................123Relationship to household head ......................................................................................................125Education........................................................................................................................................126Labour market status ......................................................................................................................130Industry of the employed.................................................................................................................134Occupation of the employed............................................................................................................137Disability .........................................................................................................................................140Number of people with whom living .................................................................................................145Type of dwelling..............................................................................................................................147Access to services ..........................................................................................................................149Mature adults in collective living quarters ........................................................................................151Mature adults in institutions.............................................................................................................153
Chapter 6: Description of the South African elderly...........................................155Demographic picture.......................................................................................................................156Marital status ..................................................................................................................................159Relationship to household head ......................................................................................................161Education........................................................................................................................................163The employed elderly......................................................................................................................165Industry of the employed elderly......................................................................................................167Occupation of the employed elderly.................................................................................................168Disability .........................................................................................................................................169Number of people with whom living .................................................................................................172Type of dwelling..............................................................................................................................173Access to services ..........................................................................................................................175The elderly in collective living quarters ............................................................................................177The elderly in institutions ................................................................................................................179
Chapter 7: Conclusion ..........................................................................................181

iv Stages in the life cycle of South Africans
List of tablesTable 1.1: Distribution of the population by province, 1996 and 2001...........................................1Table 1.2: Distribution of households living in housing units by province, 1996 and 2001...........12Table 1.3: Distribution of the population by population group, sex and type of living
quarters....................................................................................................................17Table 1.4 Number of institutions by province and type of institution ..........................................19Table 1.5: Number of people in institutions by population group, sex and type of institution .......20
Table 2.1: Distribution of infants by age, sex and population group............................................24Table 2.2: Number of disabled infants by age, sex and type of disability....................................32Table 2.3: Distribution of infants by age, population group and type of living quarters ................40Table 2.4: Number of infants in institutions by population group and type of institution...............42Table 2.5: Number of infants in prisons, correctional institutions and police cells by age,
sex and population group .........................................................................................42
Table 3.1: Distribution of children by age, sex and population group..........................................44Table 3.2: Number of disabled children by age, sex and type of disability ..................................56Table 3.3: Distribution of children by age and type of living quarters..........................................64Table 3.4: Number of children in institutions by age and type of institution.................................65Table 3.5: Number of children in prisons, correctional institutions and police cells by age,
population group and sex .........................................................................................65
Table 4.1: Distribution of youth by age, sex and population group .............................................68Table 4.2: Number of disabled youth by age and type of disability ...........................................104Table 4.3: Distribution of youth by age and type of living quarters............................................112Table 4.4: Number of youth in institutions by age and type of institution...................................114Table 4.5: Number of youth in prisons, correctional institutions and police cells by age,
population group and sex .......................................................................................115
Table 5.1: Distribution of mature adults by age, sex and population group...............................118Table 5.2: Number of disabled mature adults by five-year age category, sex and type of
disability .................................................................................................................140Table 5.3: Distribution of mature adults by age and type of living quarters ...............................151Table 5.4: Number of mature adults in institutions by age and type of institution......................153Table 5.5: Number of mature adults in prisons, correctional institutions and police cells by
five-year age category, population group and sex ...................................................154
Table 6.1: Distribution of the elderly by five-year age category, sex and population group .......156Table 6.2: Number of disabled elderly by five-year age category, sex and type of disability .....169Table 6.3: Distribution of the elderly by age and type of living quarters ....................................177Table 6.4: Number of elderly in institutions by age and type of institution.................................179

Statistics South Africa v
Technical notesAdjusting for undercountFor both censuses a post-enumeration survey (PES) was undertaken to determine the degree ofundercount or overcount. The numbers and percentages presented in this report have been adjustedaccording to the PES findings.
Adjusting the count in this way leads to the introduction of fractions. These fractions have beenrounded to whole numbers. The sum of the separate numbers may therefore differ slightly from thetotals given. A similar effect can be seen with the percentages, which are rounded to one decimalplace, and therefore may not always sum to 100.
Population groupStatistics South Africa (Stats SA) continues to classify people by population group, in order to monitorprogress in moving away from the apartheid-based discrimination of the past. However membership ofa population group is now based on self-perception and self-classification, not on a legal definition.
In 2001, five options were provided on the questionnaire, Black African, Coloured, Indian or Asian,White, and Other. Responses in the last category and non-responses were minimal and weretherefore imputed. In this report the term African, rather than the longer expression black African, hasbeen used throughout the text for ease of reading.
DefinitionsA publication containing all census concepts and definitions is available electronically (Report no. 03-02-26 (2001)). For the convenience of the reader a few key definitions are given below. Definitionsand descriptions of any other term used or topic analysed in this report can be found in the relevantsection of Chapter 1 as each topic is introduced.
• Household: A household is a group of persons who live together, and provide themselvesjointly with food and/or other essentials for living, or a single person who lives alone.
• Housing unit: A unit of accommodation for a household, which may consist of one structure,more than one structure, or part of a structure. Examples of each are a house, a group ofrondavels, and a flat.
• Informal dwelling: A makeshift structure not erected according to approved architectural plans.Such dwellings can be found in informal settlements or in backyards.
• Traditional dwelling: A dwelling made of clay, mud, reeds or other locally available materials.This is a general term which includes huts, rondavels, etc. Such dwellings can be found assingle units or in clusters.
• Collective living quarters: Living quarters where certain facilities are shared by groups ofindividuals or households. They include hostels, hotels and institutions.
• Educational attainment/ Highest level of (completed) education:o No schooling: This category includes people who had never been to school, as well as
children in pre-school, Grade 0, and Grade 1 at the time of the census. Only children whohad completed Grade 1 fell into the next category.
o Some primary: Grades 1–6 inclusive.o Complete primary: Grade 7o Some secondary: Grades 8–11 inclusiveo Grade 12/ Std 10o Higher: Any tertiary qualification, including certificates and diplomas of at least six months’
full-time study or equivalent as well as degrees. In this report (unlike many other Stats SAreports) this category includes people with a tertiary qualification without havingcompleted secondary education.
• Economically active: All those aged 15–65 who are either employed or unemployed. The restof the working-age population is classified as not economically active, which includesstudents, homemakers, those too ill to work and anyone not seeking work.
vi Stages in the life cycle of South Africans
• Employed: All those of working age (15–65) who worked for pay, profit or family gain for atleast one hour in the seven days prior to census night. The category includes employers,employees, the self-employed and working family members.
• Unemployed: According to the official or strict definition, the unemployed are those peoplewithin the economically active population who (a) did not work in the seven days prior tocensus night, (b) wanted to work and were available to start work within a week of censusnight, and (c) had taken active steps to look for work or to start some form of self-employmentin the four weeks prior to census night.
Extract from the Report of the Census Sub-committee to the SouthAfrican Statistics Council on Census 2001Preliminary investigations indicate that the 2001 census probably resulted in:
• an underestimate of the number of children below age five*• an overestimate of the number of teenagers aged between 10 and 20• an underestimate of the number of men relative to the number of women*• an underestimate of the number in the white population• higher than expected numbers aged 80 and older, in the African population• an underestimate of the number of foreign-born, since some identified themselves incorrectly
as being South African-born• age misstatement in the range 60–74• an overestimate of the extent of unemployment• an underestimate of those who were employed for only a few hours per week• an underestimate of household income• an overestimate of the number of paternal orphans and the number of fathers missing from
the household.
* This is a common feature of censuses, particularly in developing countries.
In addition:• Scanning problems caused some births to be recorded in the wrong province. The number of
cases is relatively small and should not lead to too much distortion for most purposes forwhich these data are used; however, it does produce obviously erroneous results in when onetries to estimate the extent of inter-provincial migration of those born since the previouscensus.
• The fertility data (numbers of children ever born, children surviving) are problematic.
For further details of these investigations see the full report of the Census Sub-Committee, 2003.

Statistics South Africa vii
Executive summary
Based primarily on Census 2001 data, this report focuses on the circumstances and livingconditions of each of five distinct live stages of the South African population, namely infancy,childhood, youth and young adulthood, mature adulthood and the elderly. The variations fromstage to stage have implications for planning, policy formulation and policy implementation.
Infants (0–4)In 2001 infants comprised almost 10% of the South African population. The proportion of theseinfants that was black African had increased from 1996, whilst the proportion that was white haddecreased.
Although for 93,0% of infants both parents were recorded as alive, only 42,8% of these infantslived in the same household as both parents. Of black African infants, only 37,7% of those withboth parents alive lived with both parents.
Family structures are also revealed by the proportion of infants who were living where agrandparent was the household head rather than a parent. In KwaZulu-Natal this reached 45,7% ofall infants. Moreover over 40% of all infants were living in households of seven or more people.Among these infants, a grandparent was the household head in almost 60% of cases, reflectinglarge extended families. The population group breakdowns, on the other hand, shows that 64,0%of white infants were living with two or three other people, and 86% of white infants were livingwhere a parent was the household head.
Pre-school attendance was higher among the white population group than the other groups, and inthe more industrialised or more densely populated provinces.
The proportion of African infants reported as disabled was higher that the proportions in the otherpopulation groups.
Although more than half of all infants (58,4%) were living in formal dwellings, this proportion waslower than for the total population, whilst the proportions of infants living in traditional or informaldwellings were higher than for the total population.
Children (5–13)In 2001, children between the ages of 5 and 13 comprised almost 20% of the total population. Inthe same pattern as for infants, the proportion of children that was African had increased between1996 and 2001 and the proportion that was white had decreased.
In a continuation of the pattern for infants, with each increase in age a smaller proportion had bothparents alive. By the age of 13, both parents were alive in 81,3% of cases, whilst the proportionwith neither parent alive had risen to 2,0%. However among all white children, only 0,2% werereported as having neither parent still alive.
Of African children with both parents still alive, a greater percentage than of African infants wereliving in households with neither parent present. However the proportion of African children living ina household where a grandparent was the household head was lower than for African infants,particularly among the older age groups. It appears that as children become older they move backto live with their parents.
The vast majority of children of compulsory school-going age were attending school. However only59,1% of 13-year-olds had completed Grade 6, which represents passing through the system atthe right age without repeating. In other words, more than 40% of 13-year-olds had not attainedthis level. This picture varied further by population group.

viii Stages in the life cycle of South Africans
Child labour is not a major problem in South Africa. However at the time of Census 2001,approximately 5 000 children of each age from 10 to 13 were working, and of these about 80%were working a full working week.
Disability increased with each increase in age, particularly among Africans, and next among whitechildren.
The proportion of children living with at least six other people was similar to that for infants (40,5%as against 40,1%). At ages 12 and 13 we start to see a very small proportion of children (0,1%)living on their own.
The proportion of children living in formal dwellings was slightly higher than for infants, those ofchildren living in traditional or informal dwellings slightly lower.
Of a total of almost 9 million children on census night, some 842 were counted in prisons,correctional institutions or police cells. It is notable that although the majority of these children,68,1%, were African, this is far lower than the proportion of Africans among all children of this age(83,8%).
Youth and young adults (14–34)This group comprises 21 single-year age categories, which makes it the group with the secondlargest age range (excluding the open-ended age group of the elderly). Only the mature adultgroup, with 31 single-year age categories, has a larger age range.
Almost 40% of the population fell into this category – youth and young adults – at the time ofCensus 2001. Again the proportion that was African increased between censuses and theproportion in the other three population groups decreased.
The proportion with both parents alive continued to decrease with each increase in age, althoughagain the chance of having both parents alive was greater among the white population group,followed by Indian/Asian and then coloured youth.
Youth classified as Indian or Asian were the most likely to be living with their parents. From the ageof 25 onwards, white youth were the least likely to be living with their parents. Increasingproportions of youth, up to 46,4% of those aged 34, were themselves household heads. Followingthe pattern seen among children, small proportions of youth aged 14–17 were recorded ashousehold heads.
Among youth of all age groups males were less likely to be married, while Indian or Asian womenwere the most likely to be married. The number of children borne by women of each age and themarital status of those women followed expected patterns. African youth were the most likely tohave borne children without ever having been married.
The proportion of youth not attending any educational institution increased sharply after age 18.Attendance at a university or technikon reached a peak of 6,5% at age 20. Population groupdifferences show interesting fluctuations. Whites youth were the most likely to be attending someeducational institution for most ages, but at age 19 and 20 African youth were most likely to beattending, which probably reflects delayed school attendance rather than a tertiary institution.Coloured youth were the least likely to be attending an educational institution at all ages.
Among those aged 34 at the time of Census 2001, 11,6% had tertiary education, 22,6% hadcomplete secondary education, whilst 42,7% had incomplete secondary education. If theseproportions are compared to the proportions for group aged 35–65 (as a whole), improvement ineducational levels achieved can be clearly seen. However population group differences ineducational attainment are still evident, with considerably larger proportions of white andIndian/Asian youth with tertiary or complete secondary education.

Statistics South Africa ix
The ranking of popularity of the field of study of tertiary qualifications among youth reflects for themost part the ranking among mature adults, except that computer science and data processingreplaced engineering in the ranking with a considerable increase in popularity.
Unemployment was particularly a problem in the middle years of this age group, 22–27. Amongyounger youth the majority were not economically active, with many still attending an educationalinstitution. From age 28, increasing proportions were employed and decreasing proportions wereunemployed with each single-year age increase. Overall, unemployment was higher among Africanyouth.
Indian or Asian youth had the lowest proportion of disabled youth. This continues the pattern foundamong children.
Youth tended to live with fewer people than infants or children, and on average white youth wereliving with fewer people than youth of the other population groups.
Increasing proportions of youth were found in formal or informal dwellings and decreasingproportions in traditional dwellings. This probably reflects migration patterns to seek work.
Approximately 0,7% of all youth were counted in prisons, correctional institutions or police cells.Between the ages of 23 and 29 this proportion was 1%. This is the largest proportion of all ages ofthe population.
Mature adults (35–65)Adults of this age group comprised just over 25% of the total population at the time of Census2001. The proportion classified as black African was lower than for the youth, although it hadincreased since 1996, and the proportion classified as white was higher than for the youth,although it had decreased since 1996.
As expected, the proportions of people with one or both parents no longer alive continued toincrease with each increase in age. However differences by population group were less marked inthis age group.
Two-thirds of mature adults were married or living with a partner, while 20% had never beenmarried. A smaller percentage of white mature adults than of other population groups werewidowed, whilst a larger percentage were separate or divorced. In this age group African men andwomen were the least likely to be married, while Indian/Asian men were the most likely.
Mature adult women showed a continuing but gradually decreasing trend to have given birth tomore children with increasing age.
At all ages, most mature adults were either the head of the household in which they were living orthe spouse or partner of the head. Only 7,3% of men described themselves as the spouse of thehousehold head, whilst among women almost equal proportions described themselves as the heador the spouse of the head (42,2% and 41,2% respectively). Population group differences in thisregard were minimal.
As regards educational attainment, the percentage of those with at some secondary education,complete secondary education or tertiary education as their highest level of education decreasedwith increasing age.
Labour market status among mature adults varied according to age, population group, sex, highestlevel of education, field of study where applicable, and province. Unemployment was more markedamong people in their 30s and 40s. Thereafter large proportions were not economically active. Anoticeable proportion of people had retired from age 60 or had stopped seeking work. The steadyincrease in the proportion of not economically active even before age 60 suggests an increase indiscouraged workseekers among older mature adults. Overall the Indian/Asian group had the

x Stages in the life cycle of South Africans
largest proportion of not economically active; and women were more likely to be not economicallyactive than men.
Disability continued to increase with each single-year age category with some slight fluctuations atthe top end of the age range. The lower the level of education the more likely the person was to bedisabled. This clearly reflects how education (and income) give people more control over theirhealth and their lives. Most disabled mature adults were not economically active, although just overone in five was employed.
Proportionately fewer mature women than mature men were living alone. Only 3,6% of white adultsin this age group were living alone, compared with 26,8% of African adults. The proportions livingin different types of dwelling increasingly start to resemble those of infants and children, asopposed to the pattern for youth.
Of the mature adults in an institution on census night, the largest number, approximately 46 000,were in prisons or police cells. Of these 44 000 were male. The majority, 77,2%, were African; thisis a larger proportion than the African proportion of all mature adults.
The elderly (65+)Persons aged 65 and above comprised almost 5% of the total population at the time of Census2001. Again the proportion of Africans was lower than for the population as a whole, although ithad increased between 1996 and 2001, whilst the proportion of white people was much larger thanin the population as a whole, although smaller than in 1996.
As expected the proportions of married people decreased with each increase in age, whilst theproportions of widowed people increased. Among men of this age group the largest proportion wasmarried (72,6%), whilst among women the largest proportion was widowed (54,9%).
The proportion of mature adults that were households heads was stable at about 68% in all agecategories until above age 84. However with each increase in age, fewer were reported as aspouse of the head, and more as a parent of the head.
Educational attainment among the elderly compared to youth and mature adults confirms thefinding that educational attainment has improved over the years.
Some 5% of the elderly were working. Africans, and persons with higher levels of education, weremore likely to be working in this age group.
Almost 18% of the elderly were reported as disabled. The likelihood of being disabled increasedsteadily with each age increase. As before, males, Africans and persons with lower levels ofeducation were more likely to be disabled.
Two patterns emerge regarding the number of people in the household of the elderly person. Thenumber of elderly living in single-person households increased with increasing age. At the sametime, increasing proportions were part of a large household with increasing age.
The proportions living in each type of dwelling reflect those of infants and children rather thanthose of youth and mature adults, where higher proportions were counted in traditional dwellingsand lower in informal dwellings.
Of the 47 000 elderly people counted in institutions, over three in five, 28 000, were in a hospital orother medical facility such as a frail care centre. Across all ages, 57,1% of these were whitewomen.
Census 2001
Statistics South Africa 1
Chapter 1: Description of the South African populationIntroductionThis report contains descriptions of the South African people, and their changing life circumstancesand living conditions at various stages of the life cycle. For the purposes of this report, the life cyclehas been divided as follows:
• Infancy (0–4 years);• Childhood (5–13 years);• Youth (14–34 years); split into two sub-phases:
o the early stage (14–24 years), ando the later stage or early adulthood (25–34 years);
• Mature adulthood (35–64 years); and• Aging (65 years and above).1
In the chapters that follow, each stage of development is discussed separately using Census 2001data, with emphasis on specific aspects that are significant for that particular stage, as well ascomparisons with the other life stages. When appropriate, comparisons are also made betweenCensus 1996 and Census 2001, to show changes over time in various aspects of these life stages.
As background information for the report, and to place the findings within a context of the lifecircumstances of South Africans in general, some of the key findings for both individuals andhouseholds are discussed in this chapter. These are in part based on an earlier report produced byStats SA entitled Census 2001: Achieving a better life for all: Progress between Census ’96 andCensus 2001 (Stats SA, 2005).
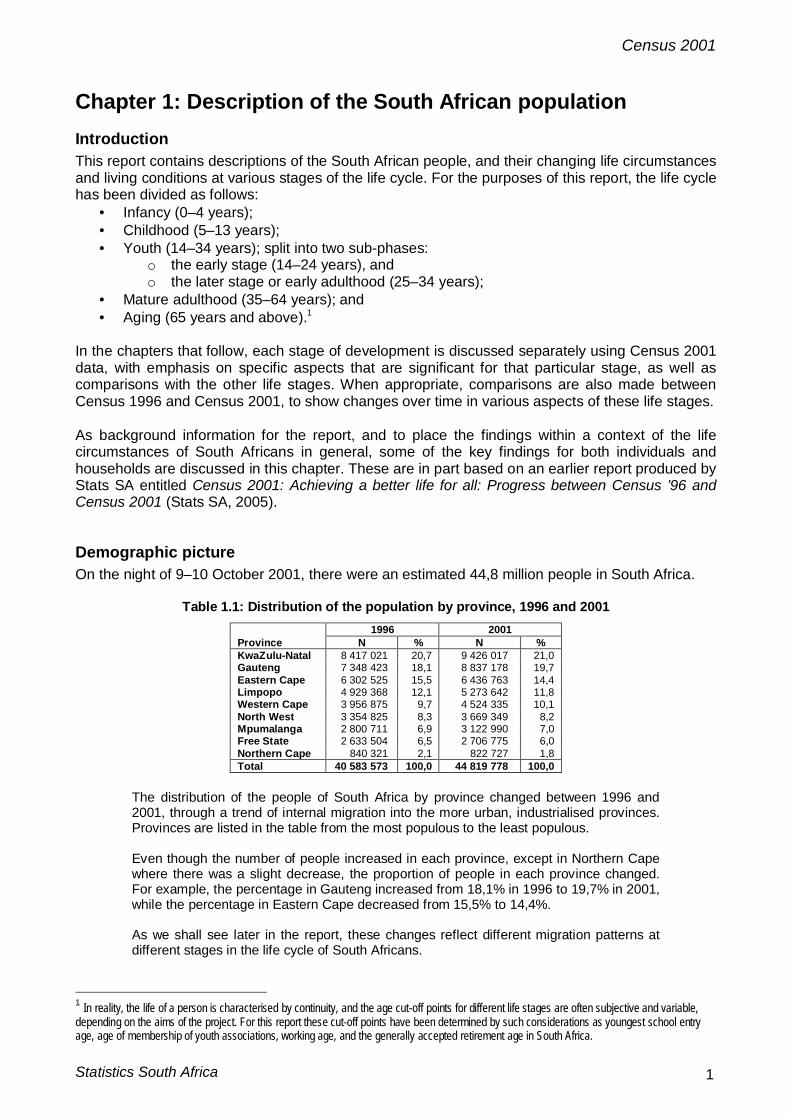
Demographic pictureOn the night of 9–10 October 2001, there were an estimated 44,8 million people in South Africa.
Table 1.1: Distribution of the population by province, 1996 and 20011996 2001
Province N % N %KwaZulu-Natal 8 417 021 20,7 9 426 017 21,0Gauteng 7 348 423 18,1 8 837 178 19,7Eastern Cape 6 302 525 15,5 6 436 763 14,4Limpopo 4 929 368 12,1 5 273 642 11,8Western Cape 3 956 875 9,7 4 524 335 10,1North West 3 354 825 8,3 3 669 349 8,2Mpumalanga 2 800 711 6,9 3 122 990 7,0Free State 2 633 504 6,5 2 706 775 6,0Northern Cape 840 321 2,1 822 727 1,8Total 40 583 573 100,0 44 819 778 100,0
The distribution of the people of South Africa by province changed between 1996 and2001, through a trend of internal migration into the more urban, industrialised provinces.Provinces are listed in the table from the most populous to the least populous.
Even though the number of people increased in each province, except in Northern Capewhere there was a slight decrease, the proportion of people in each province changed.For example, the percentage in Gauteng increased from 18,1% in 1996 to 19,7% in 2001,while the percentage in Eastern Cape decreased from 15,5% to 14,4%.
As we shall see later in the report, these changes reflect different migration patterns atdifferent stages in the life cycle of South Africans.
1 In reality, the life of a person is characterised by continuity, and the age cut-off points for different life stages are often subjective and variable,depending on the aims of the project. For this report these cut-off points have been determined by such considerations as youngest school entryage, age of membership of youth associations, working age, and the generally accepted retirement age in South Africa.

Description of the South African population Census 2001
2 Stages in the life cycle of South Africans
Demographic picture (continued)
Figure 1.1: Number of people in each province according to five-year age category
In Gauteng, there wererelatively few infants andchildren, compared to thenumber of people in theirtwenties and thirties.
In Eastern Cape, on theother hand, there werelarge numbers of children,and a steep drop in thenumber of people in theirtwenties and thirties.
Figure 1.2: Population of each province by broad age category
LP MP KZN EC NC NW FS WC GP Total0,0
20,0
40,0
60,0
80,0
100,0%
0-4 11,4 11,2 10,7 10,2 9,9 9,9 9,4 9,0 8,2 9,95-13 25,2 21,5 21,6 23,9 18,6 19,4 19,2 16,6 13,9 19,9
14-34 37,6 39,3 39,0 35,9 36,8 38,4 39,1 39,3 42,8 39,135-64 20,2 23,8 24,0 23,7 29,1 27,4 27,4 30,0 31,1 26,1
65+ 5,6 4,3 4,6 6,3 5,5 5,0 5,0 5,2 4,0 4,9
Limpopo had the largestpercentage of infants andchildren of all provinces,while Gauteng had thelargest percentage ofyouth and young adults.
These graphs indicate two distinct patterns, which suggest that there is migration among youngadults from the less to the more industrialised provinces such as Gauteng, while some parents areleaving their children in or sending their children to the less industrialised provinces such asLimpopo to live in the extended family for the purposes of childcare and schooling. These patternswill be discussed in more detail in later chapters of this report.

Description of the South African population Census 2001
Statistics South Africa 3
Demographic picture (continued)Over the five years between 1996 and 2001, the proportion of black African people in the countryincreased (from 76,7% in 1996 to 79,0% in 2001), while the proportion of white people decreased(from 10,9% in 1996 to 9,6% in 2001).
Figure 1.3: Number of people of each population group in each age group
Infants (0-4) Children (5-13) Youth (14-34) Adults (35-64) Aged (65+) Total0,0
10,0
20,0
30,0
40,0
50,0Millions
Black African 3,8 7,5 14,2 8,4 1,5 35,4Coloured 0,4 0,8 1,5 1,2 0,2 4,0
Indian or Asian 0,1 0,2 0,4 0,4 0,1 1,1White 0,2 0,5 1,4 1,7 0,5 4,3
Figure 1.3 shows thenumber of people ineach life-stage agecategory bypopulation group.2 It isclear from this graphthat Africans were inthe majority across allstages in the lifecycle, but theproportion increasedwith decreasing age.
Figure 1.4: Distribution of each population group by five-year age categoryFigure 1.4 shows thedistribution innumbers of the peoplein five-year agecategories for eachpopulation group. Itclearly indicates thepreponderance in thenumbers of Africanpeople, particularly inthe younger agecategories.
2 The terms black African, coloured, Indian or Asian and white are used in this report to classify the people of South Africa into the four mainpopulation groups. This classification is based on self-perceptions, rather than any legal definition as in the past. It continues to be meaningful touse this classification, because living conditions and life circumstances may still differ between these groups.
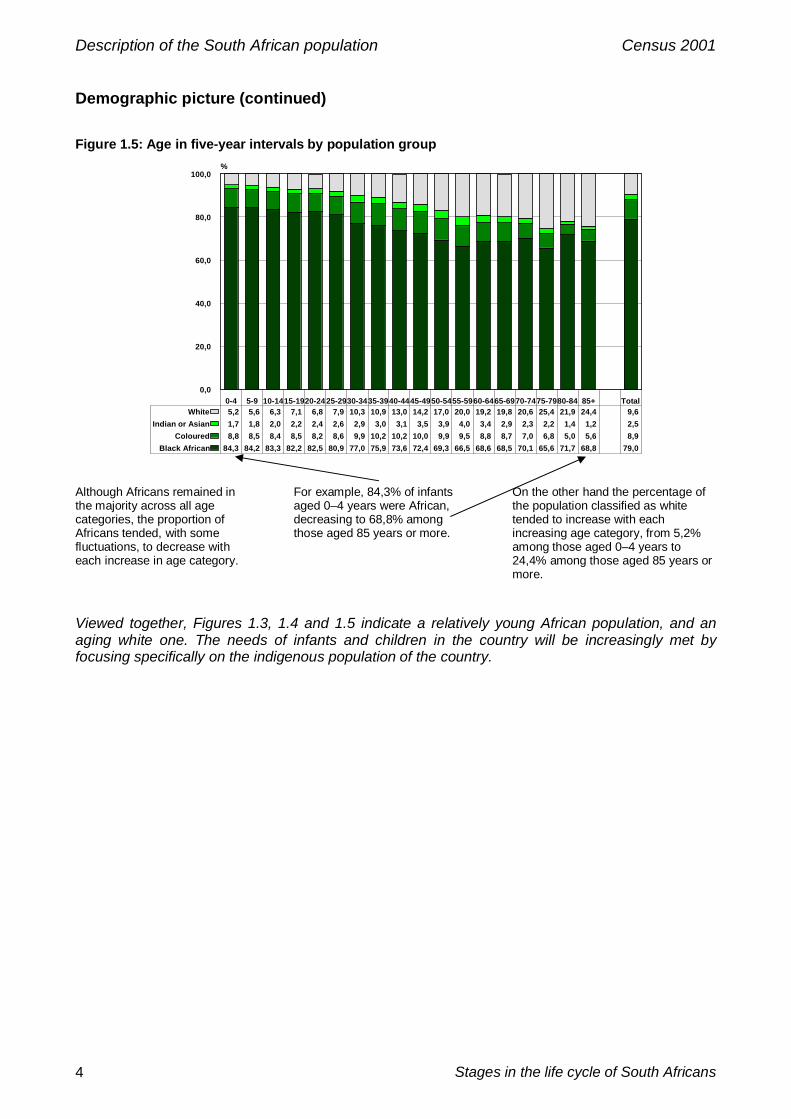
Description of the South African population Census 2001
Stages in the life cycle of South Africans4
Demographic picture (continued)
Figure 1.5: Age in five-year intervals by population group
0-4 5-9 10-1415-1920-2425-2930-3435-3940-4445-4950-5455-5960-6465-6970-7475-7980-84 85+ Total0,0
20,0
40,0
60,0
80,0
100,0%
Black African 84,3 84,2 83,3 82,2 82,5 80,9 77,0 75,9 73,6 72,4 69,3 66,5 68,6 68,5 70,1 65,6 71,7 68,8 79,0Coloured 8,8 8,5 8,4 8,5 8,2 8,6 9,9 10,2 10,2 10,0 9,9 9,5 8,8 8,7 7,0 6,8 5,0 5,6 8,9
Indian or Asian 1,7 1,8 2,0 2,2 2,4 2,6 2,9 3,0 3,1 3,5 3,9 4,0 3,4 2,9 2,3 2,2 1,4 1,2 2,5White 5,2 5,6 6,3 7,1 6,8 7,9 10,3 10,9 13,0 14,2 17,0 20,0 19,2 19,8 20,6 25,4 21,9 24,4 9,6
Although Africans remained inthe majority across all agecategories, the proportion ofAfricans tended, with somefluctuations, to decrease witheach increase in age category.
For example, 84,3% of infantsaged 0–4 years were African,decreasing to 68,8% amongthose aged 85 years or more.
On the other hand the percentage ofthe population classified as whitetended to increase with eachincreasing age category, from 5,2%among those aged 0–4 years to24,4% among those aged 85 years ormore.
Viewed together, Figures 1.3, 1.4 and 1.5 indicate a relatively young African population, and anaging white one. The needs of infants and children in the country will be increasingly met byfocusing specifically on the indigenous population of the country.

Description of the South African population Census 2001
Statistics South Africa 5
Demographic picture (concluded)
Figure 1.6: Number of males and females in each five-year age category
This graph clearlyshows thepreponderance offemales at all agesfrom age 10 onwards.
Figure 1.7: Distribution of the total population by age group and sex
0,10,2
0,30,5
0,7
1,01,2
1,72,2
2,83,2
3,6
4,24,7
5,55,6
5,45,0
0,20,4
0,50,9
1,1
1,41,5
1,92,5
3,13,6
3,9
4,54,9
5,65,7
5,45,0
85+ 80-84
75-79 70-74 65-69
60-64 55-59
50-54 45-49
40-44 35-39 30-34
25-29 20-24
15-19 10-14
5-9 0-4
0,01,02,03,04,05,06,07,0
% of total
0,0 1,0 2,0 3,0 4,0 5,0 6,0 7,0
% of total
Male Female
The distribution of the population of South Africa as awhole by age and sex in 2001 continued to resemblethat of a developing, rather than a highlyindustrialised country.
There was a relatively large proportion of people inthe younger age categories (less than 20 years ofage), and a relatively small proportion of people inthe older age categories (65 years or more).
In general, the percentage age distribution of the population of South Africa by sex differssignificantly for each population group (not shown here). The pyramid of the African populationresembles that of a developing country, while the age distribution of the white populationresembles that of a highly industrialised one. The age distributions of the coloured and Indian orAsian people fall between these two extremes.
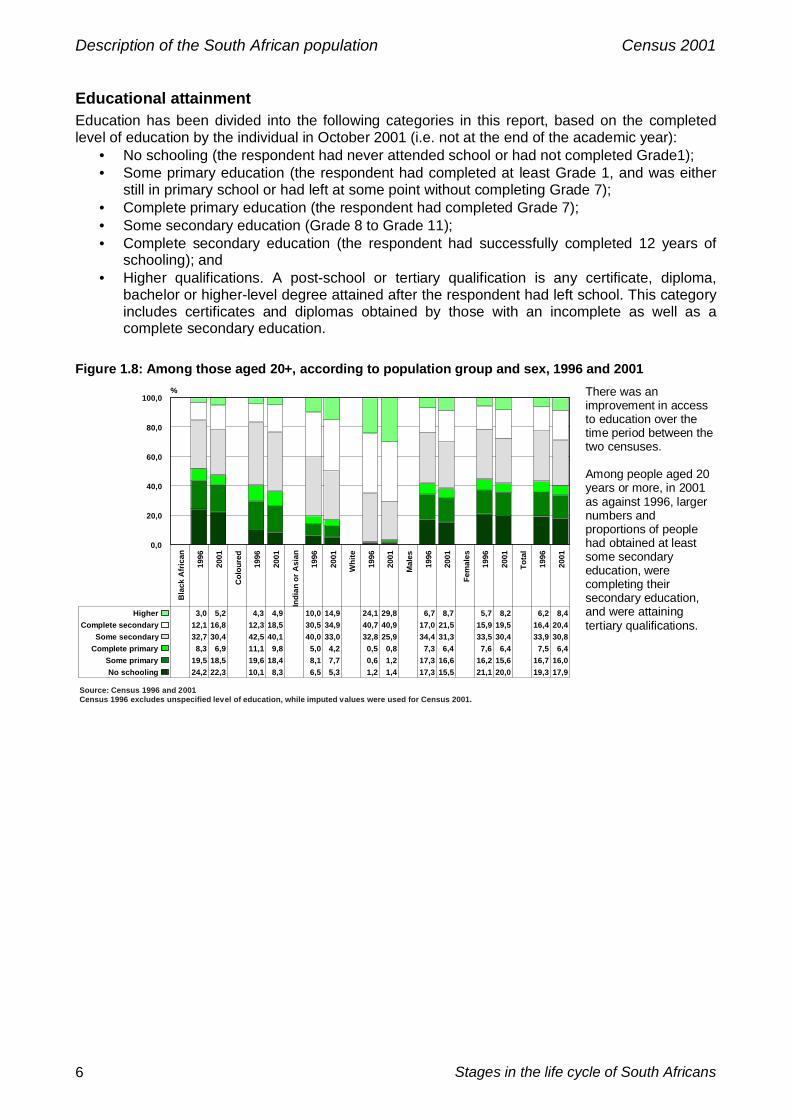
Description of the South African population Census 2001
Stages in the life cycle of South Africans6
Educational attainmentEducation has been divided into the following categories in this report, based on the completedlevel of education by the individual in October 2001 (i.e. not at the end of the academic year):
• No schooling (the respondent had never attended school or had not completed Grade1);• Some primary education (the respondent had completed at least Grade 1, and was either
still in primary school or had left at some point without completing Grade 7);• Complete primary education (the respondent had completed Grade 7);• Some secondary education (Grade 8 to Grade 11);• Complete secondary education (the respondent had successfully completed 12 years of
schooling); and• Higher qualifications. A post-school or tertiary qualification is any certificate, diploma,
bachelor or higher-level degree attained after the respondent had left school. This categoryincludes certificates and diplomas obtained by those with an incomplete as well as acomplete secondary education.
Figure 1.8: Among those aged 20+, according to population group and sex, 1996 and 2001
Bla
ck A
fric
an
1996
2001
Col
oure
d
1996
2001
Indi
an o
r A
sian
1996
2001
Whi
te
1996
2001
Mal
es
1996
2001
Fem
ales
1996
2001
Tota
l
1996
2001
0,0
20,0
40,0
60,0
80,0
100,0%
No schooling 24,2 22,3 10,1 8,3 6,5 5,3 1,2 1,4 17,3 15,5 21,1 20,0 19,3 17,9Some primary 19,5 18,5 19,6 18,4 8,1 7,7 0,6 1,2 17,3 16,6 16,2 15,6 16,7 16,0
Complete primary 8,3 6,9 11,1 9,8 5,0 4,2 0,5 0,8 7,3 6,4 7,6 6,4 7,5 6,4Some secondary 32,7 30,4 42,5 40,1 40,0 33,0 32,8 25,9 34,4 31,3 33,5 30,4 33,9 30,8
Complete secondary 12,1 16,8 12,3 18,5 30,5 34,9 40,7 40,9 17,0 21,5 15,9 19,5 16,4 20,4Higher 3,0 5,2 4,3 4,9 10,0 14,9 24,1 29,8 6,7 8,7 5,7 8,2 6,2 8,4
Source: Census 1996 and 2001Census 1996 excludes unspecified level of education, while imputed values were used for Census 2001.
There was animprovement in accessto education over thetime period between thetwo censuses.
Among people aged 20years or more, in 2001as against 1996, largernumbers andproportions of peoplehad obtained at leastsome secondaryeducation, werecompleting theirsecondary education,and were attainingtertiary qualifications.

Description of the South African population Census 2001
Statistics South Africa 7
Educational attainment (continued)
Figure 1.9: Among those aged 20+, according to five-year age categoryThe largest number ofpeople with partiallycompleted secondaryschooling was found inthe age category 20–24years. The same picturewas found within thecategory of completesecondary education.Younger people werereaching higher levels ofeducation than olderpeople.
Attendance at an educational institution
Figure 1.10: Among those aged 5–25 years, percentage of each age attending, 1996 and 2001
5 6 7 8 9 10 11 12 13 14 15 16 17 18 19 20 21 22 23 24 250,0
20,0
40,0
60,0
80,0
100,0%
1996 22,5 49,1 73,1 81,8 87,9 91,3 93,6 94,4 94,8 94,4 92,7 89,3 84,1 75,7 65,3 54,6 45,8 37,0 28,8 23,1 18,42001 45,6 70,3 88,4 93,4 94,6 94,4 94,8 95,7 95,1 94,0 91,3 87,4 81,5 70,7 57,9 46,2 35,7 25,5 18,8 14,0 9,9
Source: Census 1996 and 2001
In general, theoverwhelming majority ofchildren aged 7–15 wereattending an educationalinstitution in 2001.3
There was, however, atrend for people to bothenter and leaveeducational institutionsat a younger age in 2001than in 1996.
This increase in accessto education, and itspossible impact on thelife stages of theindividual will be furtherdiscussed in this report.
3 Educational institutions include pre-school organisations, schools, technikons, universities, colleges, adult education institutions and othereducational centres.
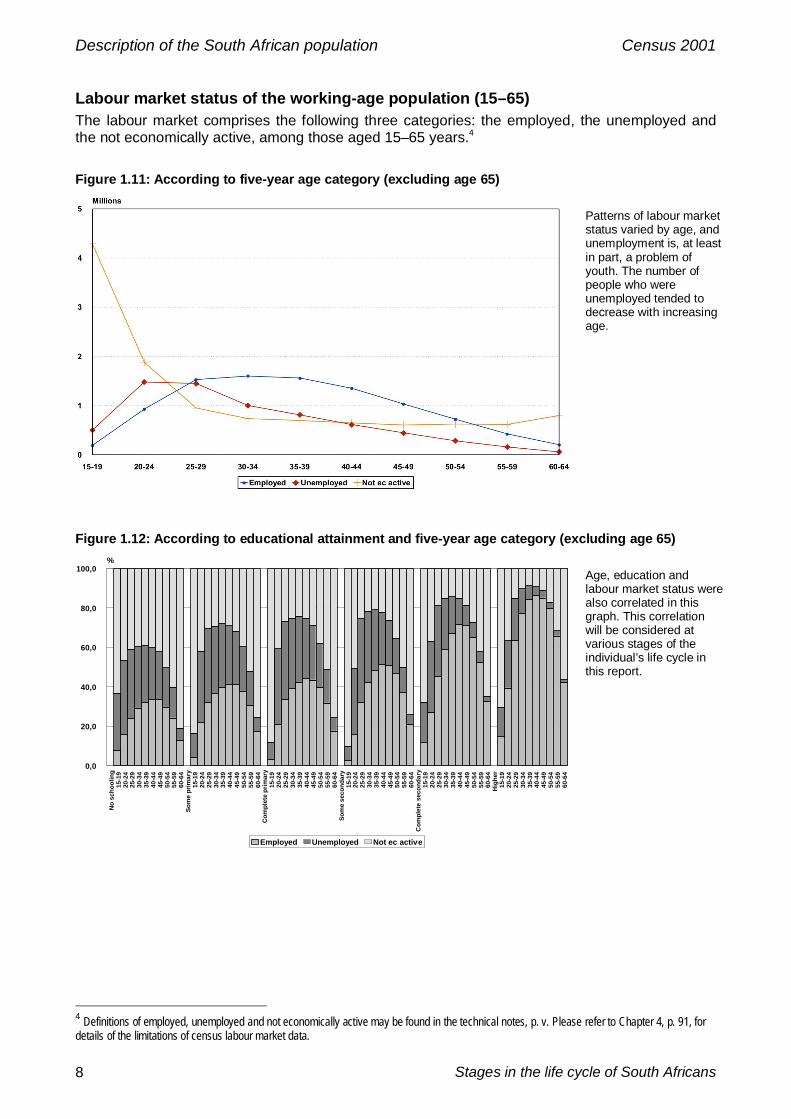
Description of the South African population Census 2001
Stages in the life cycle of South Africans8
Labour market status of the working-age population (15–65)The labour market comprises the following three categories: the employed, the unemployed andthe not economically active, among those aged 15–65 years.4
Figure 1.11: According to five-year age category (excluding age 65)
Patterns of labour marketstatus varied by age, andunemployment is, at leastin part, a problem ofyouth. The number ofpeople who wereunemployed tended todecrease with increasingage.
Figure 1.12: According to educational attainment and five-year age category (excluding age 65)
No
scho
olin
g15
-19
20-2
425
-29
30-3
435
-39
40-4
445
-49
50-5
455
-59
60-6
4So
me
prim
ary
15-1
920
-24
25-2
930
-34
35-3
940
-44
45-4
950
-54
55-5
960
-64
Com
plet
e pr
imar
y15
-19
20-2
425
-29
30-3
435
-39
40-4
445
-49
50-5
455
-59
60-6
4So
me
seco
ndar
y15
-19
20-2
425
-29
30-3
435
-39
40-4
445
-49
50-5
455
-59
60-6
4C
ompl
ete
seco
ndar
y15
-19
20-2
425
-29
30-3
435
-39
40-4
445
-49
50-5
455
-59
60-6
4H
ighe
r15
-19
20-2
425
-29
30-3
435
-39
40-4
445
-49
50-5
455
-59
60-6
4
0,0
20,0
40,0
60,0
80,0
100,0%
Employed Unemployed Not ec active
Age, education andlabour market status werealso correlated in thisgraph. This correlationwill be considered atvarious stages of theindividual’s life cycle inthis report.
4 Definitions of employed, unemployed and not economically active may be found in the technical notes, p. v. Please refer to Chapter 4, p. 91, fordetails of the limitations of census labour market data.
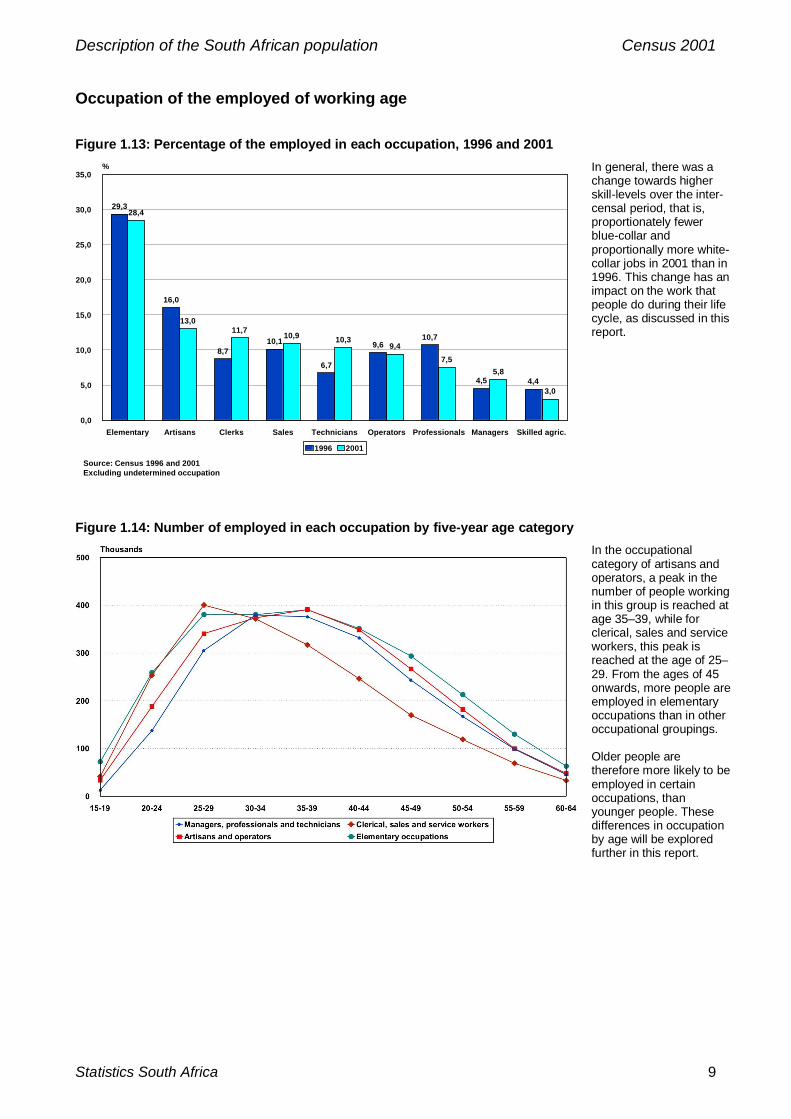
Description of the South African population Census 2001
Statistics South Africa 9
Occupation of the employed of working age
Figure 1.13: Percentage of the employed in each occupation, 1996 and 2001
29,3
16,0
8,710,1
6,7
9,610,7
4,5 4,4
28,4
13,011,7 10,9 10,3
9,47,5
5,8
3,0
Elementary Artisans Clerks Sales Technicians Operators Professionals Managers Skilled agric.0,0
5,0
10,0
15,0
20,0
25,0
30,0
35,0%
1996 2001
Source: Census 1996 and 2001Excluding undetermined occupation
In general, there was achange towards higherskill-levels over the inter-censal period, that is,proportionately fewerblue-collar andproportionally more white-collar jobs in 2001 than in1996. This change has animpact on the work thatpeople do during their lifecycle, as discussed in thisreport.
Figure 1.14: Number of employed in each occupation by five-year age categoryIn the occupationalcategory of artisans andoperators, a peak in thenumber of people workingin this group is reached atage 35–39, while forclerical, sales and serviceworkers, this peak isreached at the age of 25–29. From the ages of 45onwards, more people areemployed in elementaryoccupations than in otheroccupational groupings.
Older people aretherefore more likely to beemployed in certainoccupations, thanyounger people. Thesedifferences in occupationby age will be exploredfurther in this report.

Description of the South African population Census 2001
Stages in the life cycle of South Africans10
Occupation of the employed of working age (concluded)
Figure 1.15: According to population group and sexB
lack
Afr
ican
M
ale
F
emal
e
Col
oure
d
M
ale
F
emal
e
Indi
an o
r Asi
an
M
ale
F
emal
e
Whi
te
M
ale
F
emal
e
Tota
l
0,0
20,0
40,0
60,0
80,0
100,0%
Managers 2,9 1,8 4,4 3,0 15,4 7,7 21,0 11,3 5,8Professionals 4,0 4,6 4,2 4,2 12,4 13,8 20,0 18,4 7,5
Technicians 5,9 12,3 7,0 11,5 11,9 15,2 14,0 19,6 10,3Clerks 6,6 11,0 8,5 20,7 15,4 34,3 6,9 34,7 11,7Sales 12,5 8,9 8,9 9,6 14,3 10,9 12,2 10,1 10,9
Skilled agric. 4,1 2,3 3,6 1,5 0,6 0,2 3,9 1,0 3,0Artisans 20,1 5,2 20,7 6,0 14,2 5,6 15,0 1,7 13,1
Operators 17,8 2,8 11,1 5,8 10,0 7,1 3,6 0,6 9,4Elementary 26,3 51,1 31,5 37,6 5,9 5,2 3,3 2,7 28,3
Excluding undetermined occupation
The population group andgender divide byoccupation is still clearlyevident in this graph.
African and colouredemployed males andfemales were far morelikely to be working inelementary occupationsthan Indian or Asian andwhite males and females.
Employed white and Indianor Asian females weremore likely to be working inclerical occupations thancoloured and black Africanfemales.
Larger proportions of whitemales than males of theother population groupswere working inmanagerial andprofessional occupations.

Description of the South African population Census 2001
Statistics South Africa 11
DisabilityTo measure the extent of disability in the country, the Census 2001 questionnaire asked whetheror not the referent person had any serious disabilities that prevented his or her full participation inlife activities such as education, work, and social ones. Disabilities include those affecting sight,hearing, communication, physical, intellectual, and emotional functioning. Multiple disabilities werealso identified.
Of the approximately 44,8 million people counted in Census 2001, 2,3 million were reported asdisabled. Of these, 577 000 (1,3%) had a visual disability, 558 000 (1,2%) a physical, 314 000(0,7%) a hearing, 269 000 (0,6%) an emotional, 206 000 (0,5%) an intellectual, and 75 000 (0,2%)a communication disability. In addition, 257 000 people (0,6%) had multiple disabilities.
Figure 1.16: The disabled in each five-year age category according to population groupThere was an overallincrease in theproportion of people witha disability with eachincrease in agecategory. At first thisincrease was gradual,but after the age of 44years the increasebecame steeper, and itbecame even steeperafter the age of 69years.
The actual age of thechange in pattern variedby population group.Among Africans, thechange is evident fromabout the age of 39onwards. Among thewhite population, therewas a gradual increasein the rate of disability upto the age category of65–69 years, followed bya steep increase.
These findings support observations in other countries that the age at which the steepness of acurve depicting chronic disease or disability starts to increase is related to the life circumstancesand living conditions. In general, women tend to become disabled at a later age than men. Theeffects of disability on the life stages of individuals will be explored in more detail in later chaptersof this report.

Description of the South African population Census 2001
Stages in the life cycle of South Africans12
Distribution of householdsThe distribution by province of households living in housing units (that is, excluding households incollective living quarters) changed between 1996 and 2001, as indicated in Table 1.2.
• The number of households increased in each province, but not uniformly, and theproportions changed.
• The percentage of households in Gauteng increased from 21,6% of all households in thecountry in 1996 to 23,7% in 2001. In Eastern Cape, however, the percentage decreased,from 14,7% in 1996 to 13,5% in 2001.
Table 1.2: Distribution of households living in housing units by province, 1996 and 20011996 2001
Province N % N %KwaZulu-Natal 1 660 934 18,3 2 086 250 18,6Gauteng 1 964 168 21,6 2 651 244 23,7Eastern Cape 1 332 348 14,7 1 512 664 13,5Limpopo 982 457 10,8 1 179 965 10,5Western Cape 983 015 10,9 1 173 304 10,5North West 720 644 8,0 929 004 8,3Mpumalanga 604 010 6,7 733 131 6,5Free State 625 012 6,9 733 302 6,5Northern Cape 186 984 2,1 206 842 1,8Total 9 059 571 100,0 11 205 705 100,0
Households by type of dwellingHousing units were classified into five basic categories in this report: (a) formal, (b) traditional, and(c) informal dwellings, (d) backyard accommodation, and (e) other.5
Figure 1.17: Distribution of households in each province by type of dwelling, 1996 and 2001
WC
199
6
WC
200
1
NC
199
6
NC
200
1
GP
1996
GP
2001
NW
199
6
NW
200
1
MP
1996
MP
2001
FS 1
996
FS 2
001
LP 1
996
LP 2
001
KZN
199
6
KZN
200
1
EC 1
996
EC 2
001
Tota
l 199
6
Tota
l 200
1
0,0
20,0
40,0
60,0
80,0
100,0%
Formal dwelling 76,8 78,4 74,3 80,2 63,2 65,6 62,5 68,6 59,5 67,3 58,1 62,9 57,8 70,7 49,3 56,6 43,0 47,3 58,1 63,8 Traditional dwelling 1,0 2,2 6,5 3,5 0,7 1,3 9,1 5,3 17,9 12,9 10,3 7,2 32,1 19,7 31,6 27,9 40,9 38,1 18,3 14,8
Informal dwelling 16,6 16,2 13,5 12,5 23,8 23,9 21,6 22,3 16,6 16,0 25,4 26,1 5,6 6,6 11,8 10,8 10,9 11,0 16,2 16,4Backyard accom. 5,2 2,9 5,0 3,0 11,9 8,9 6,4 3,5 5,6 3,5 5,5 3,6 4,4 2,7 6,9 4,3 4,8 3,3 7,0 4,8
Other 0,3 0,3 0,7 0,8 0,3 0,3 0,4 0,2 0,4 0,3 0,8 0,3 0,2 0,2 0,4 0,4 0,4 0,2 0,4 0,3
Source: Census 1996 and 2001
The overall proportion of households living in formaldwellings increased between 1996 and 2001, from58,1% in 1996 to 63,8% in 2001. There was acorresponding decrease in the proportion ofhouseholds living in traditional dwellings over thistime period, from 18,3% in 1996 to 14,8% in 2001.
There was also a decrease in the proportion ofhouseholds living in backyard accomodation, from7,0% in 1996 to 4,8% in 2001. On the other hand,the proportion of households living in informaldwellings remained approximately constant(16,2% in 1996 and 16,4% in 2001).
5 In this report the grouping ‘formal dwelling’ includes the following categories: house, flat, semi-detached house, unit in a complex (e.g. duplex)and room other than in a backyard. ‘Backyard accommodation’ groups ‘room in backyard’ and ‘other accommodation on a shared property’, such asa ‘granny flat’. ‘Other’ includes, for example, caravans and boats. For further definitions of types of dwelling see the technical notes.

Description of the South African population Census 2001
Statistics South Africa 13
Household size
Figure 1.18: Distribution of households in each province by the number of people in the household,1996 and 2001
GP
1996
GP
200
1
NW
199
6
NW
200
1
MP
1996
MP
2001
EC 1
996
EC 2
001
WC
199
6
WC
200
1
FS 1
996
FS 2
001
KZN
199
6
KZN
200
1
NC
199
6
NC
200
1
LP 1
996
LP 2
001
Tota
l 199
6
Tota
l 200
1
0,0
20,0
40,0
60,0
80,0
100,0%
1 21,022,1 16,321,8 16,017,8 15,716,3 15,415,6 15,517,1 15,318,5 14,615,5 12,415,5 16,418,52 22,423,5 15,916,1 15,916,3 15,015,6 19,820,4 19,019,4 15,415,4 17,619,2 12,312,9 17,418,03 16,517,0 13,714,5 13,914,9 13,614,7 16,316,7 16,717,5 12,912,6 16,016,8 13,014,0 14,615,24 15,315,4 14,414,7 14,714,8 14,214,8 18,118,2 16,616,7 14,213,6 16,417,1 14,415,2 15,215,35 10,2 9,4 12,011,3 12,011,6 12,412,1 12,512,3 11,911,7 11,811,2 12,511,7 13,713,4 11,911,36 5,9 5,4 8,9 7,7 8,8 8,3 9,5 9,2 7,4 7,2 7,9 7,3 8,9 8,6 8,0 7,5 11,410,4 8,4 7,8
7+ 8,7 7,1 18,713,9 18,816,3 19,717,3 10,4 9,6 12,510,3 21,520,2 14,812,3 22,818,5 16,213,8
Source: Census 1996 and 2001
The number of people perhousehold, and the averagehousehold size, decreasedbetween 1996 and 2001across all provinces.
In the country as a whole,16,4% of households weresingle-person households in1996, increasing to 18,5% in2001. At the other extreme,16,2% of householdscontained seven or morepeople in 1996, decreasing to13,8% of households in 2001.
In both 1996 and 2001,Gauteng had the smallestproportion of householdscontaining seven or morepeople (8,7% in 1996 and7,1% in 2001).

Description of the South African population Census 2001
Stages in the life cycle of South Africans14
Access to services
Figure 1.19: Households within population group and sex of the household head by main source ofenergy for lighting, 1996 and 2001
Bla
ck A
fric
anM
ale
1996
Mal
e 20
01Fe
mal
e 19
96Fe
mal
e 20
01To
tal 1
996
Tota
l 200
1C
olou
red
Mal
e 19
96M
ale
2001
Fem
ale
1996
Fem
ale
2001
Tota
l 199
6To
tal 2
001
Indi
an o
r Asi
anM
ale
1996
Mal
e 20
01Fe
mal
e 19
96Fe
mal
e 20
01To
tal 1
996
Tota
l 200
1W
hite
Mal
e 19
96M
ale
2001
Fem
ale
1996
Fem
ale
2001
Tota
l 199
6To
tal 2
001
Tota
lM
ale
1996
Mal
e 20
01Fe
mal
e 19
96Fe
mal
e 20
01To
tal 1
996
Tota
l 200
1
0,0
20,0
40,0
60,0
80,0
100,0%
Electricity 47,0 62,6 40,2 61,4 44,0 62,0 83,1 88,0 86,5 90,2 84,0 88,8 99,1 98,9 98,5 98,4 99,0 98,8 99,6 99,1 99,6 99,3 99,6 99,2 63,2 72,0 49,5 66,8 58,0 69,7Candles 37,1 28,1 40,0 29,1 38,4 28,6 12,2 9,0 8,9 7,0 11,3 8,3 0,5 0,6 0,8 1,0 0,6 0,7 0,2 0,3 0,2 0,3 0,2 0,3 25,8 21,0 33,8 25,0 28,8 22,7Paraffin 15,3 8,4 19,3 8,7 17,1 8,5 4,4 2,3 4,4 2,4 4,4 2,3 0,3 0,2 0,6 0,3 0,4 0,2 0,1 0,1 0,1 0,1 0,1 0,1 10,6 6,3 16,3 7,5 12,8 6,8
Gas 0,5 0,3 0,5 0,3 0,5 0,3 0,3 0,2 0,2 0,2 0,3 0,2 0,1 0,1 0,1 0,1 0,1 0,1 0,1 0,2 0,1 0,2 0,1 0,2 0,4 0,2 0,4 0,2 0,4 0,2Other 0,0 0,6 0,0 0,6 0,0 0,6 0,0 0,5 0,0 0,3 0,0 0,4 0,0 0,1 0,0 0,1 0,0 0,1 0,0 0,3 0,0 0,2 0,0 0,3 0,0 0,5 0,0 0,5 0,0 0,5
Source: Census 1996 and 2001Excluding unspecified energy source in 1996
The use of electricity forlighting increasedsignificantly from 58,0%of households in 1996 to69,7% in 2001.Nevertheless,approximately three inten households did nothave this access in2001.
Figure 1.20: Households within population group and sex of the household head by main source ofwater, 1996 and 2001
Bla
ck A
fric
anM
ale
1996
Mal
e 20
01Fe
mal
e 19
96Fe
mal
e 20
01To
tal 1
996
Tota
l 200
1C
olou
red
Mal
e 19
96M
ale
2001
Fem
ale
1996
Fem
ale
2001
Tota
l 199
6To
tal 2
001
Indi
an o
r Asi
anM
ale
1996
Mal
e 20
01Fe
mal
e 19
96Fe
mal
e 20
01To
tal 1
996
Tota
l 200
1W
hite
Mal
e 19
96M
ale
2001
Fem
ale
1996
Fem
ale
2001
Tota
l 199
6To
tal 2
001
All
grou
psM
ale
1996
Mal
e 20
01Fe
mal
e 19
96Fe
mal
e 20
01To
tal 1
996
Tota
l 200
1
0,0
20,0
40,0
60,0
80,0
100,0%
Piped water in dwelling/ in yard 52,0 54,7 41,6 48,3 47,5 51,7 90,1 88,6 92,3 90,4 90,8 89,2 98,7 95,6 98,5 95,5 98,7 95,6 96,6 95,6 98,4 95,5 97,0 95,6 66,5 65,7 50,9 55,4 60,6 61,3 Public tap/ water carrier/ tanker 27,6 29,4 28,8 29,4 28,2 29,4 5,4 9,0 5,4 8,0 5,4 8,6 0,4 3,7 0,6 3,7 0,5 3,7 0,2 3,7 0,2 4,1 0,2 3,8 18,9 22,6 24,3 25,6 20,9 23,9
Borehole/ rainwater tank/ well 5,8 3,4 6,1 4,2 6,0 3,8 2,2 0,7 1,0 0,4 1,9 0,6 0,6 0,3 0,5 0,4 0,6 0,3 3,0 0,4 1,2 0,2 2,6 0,3 4,7 2,6 5,3 3,6 4,9 3,0 Dam/river/stream/spring 12,9 9,4 22,0 15,1 16,9 12,1 1,9 0,9 1,0 0,6 1,6 0,8 0,2 0,1 0,3 0,2 0,2 0,2 0,3 0,1 0,1 0,1 0,2 0,1 8,8 6,9 18,4 12,7 12,4 9,4
Other 1,6 3,0 1,5 3,0 1,6 3,0 0,4 0,8 0,3 0,7 0,3 0,8 0,1 0,2 0,1 0,2 0,1 0,2 0,0 0,2 0,0 0,2 0,0 0,2 1,1 2,3 1,2 2,6 1,2 2,4
Source: Census 1996 and 2001Excluding unspecified water source in 1996
Access among households to piped clean water fordomestic use increased between the census years.The proportion of households with piped water inthe yard or in the dwelling increased from 60,6% in1996 to 61,3% in 2001.
The proportion of households using public taps alsoincreased, from 20,9% in 1996 to 23,9% in 2001.The proportion using dams, rivers, streams andsprings decreased from 12,4% in 1996 to 9,4% in2001.

Description of the South African population Census 2001
Statistics South Africa 15
Access to services (concluded)
Figure 1.21: Households within population group and sex of the household head by main toiletfacility, 1996 and 2001
Bla
ck A
fric
anM
ale
1996
Mal
e 20
01Fe
mal
e 19
96Fe
mal
e 20
01To
tal 1
996
Tota
l 200
1C
olou
red
Mal
e 19
96M
ale
2001
Fem
ale
1996
Fem
ale
2001
Tota
l 199
6To
tal 2
001
Indi
an o
r Asi
anM
ale
1996
Mal
e 20
01Fe
mal
e 19
96Fe
mal
e 20
01To
tal 1
996
Tota
l 200
1W
hite
Mal
e 19
96M
ale
2001
Fem
ale
1996
Fem
ale
2001
Tota
l 199
6To
tal 2
001
All
grou
psM
ale
1996
Mal
e 20
01Fe
mal
e 19
96Fe
mal
e 20
01To
tal 1
996
Tota
l 200
1
0,0
20,0
40,0
60,0
80,0
100,0%
Flush or chemical toilet 38,2 44,9 28,6 38,4 34,1 41,9 78,7 83,2 83,1 87,0 79,9 84,5 98,0 97,9 97,4 97,7 97,9 97,9 99,6 98,7 99,7 98,8 99,6 98,7 56,9 58,8 39,7 47,2 50,4 53,8Pit latrine 41,4 34,4 47,0 38,7 43,8 36,4 8,8 5,5 5,4 3,9 7,8 4,9 1,7 1,1 2,2 1,3 1,8 1,2 0,3 0,4 0,2 0,4 0,3 0,4 28,4 25,3 39,3 32,9 32,5 28,5
Bucket toilet 6,0 5,1 5,1 4,5 5,6 4,8 6,5 4,3 8,7 5,0 7,2 4,5 0,1 0,2 0,1 0,2 0,1 0,2 0,0 0,1 0,0 0,1 0,0 0,1 4,6 4,1 4,8 4,1 4,7 4,1None 14,4 15,6 19,4 18,4 16,5 16,9 6,0 7,0 2,8 4,2 5,1 6,0 0,2 0,8 0,3 0,9 0,2 0,8 0,1 0,7 0,1 0,7 0,1 0,7 10,1 11,9 16,2 15,8 12,4 13,6
Source: Census 1996 and 2001Excluding unspecified toilet facility in 1996
Access to flush orchemical toiletsincreased, from 50,4%in 1996 to 53,8% in2001, while the use ofpit latrines declined from32,5% to 28,5%. But theproportion ofhouseholds without anyaccess to a toilet facilityincreased from 12,4% in1996 to 13,6% in 2001.

Description of the South African population Census 2001
Stages in the life cycle of South Africans16
Household data compared with individual dataThere is a difference, conceptually and numerically, in the numbers and the proportions given for aspecific variable when the data is given for individuals, as against households. The differences areexplained by the different totals for the denominator of individuals (all the people in the country)and the denominator for households (all the households in the country), and the adjustmentfactors, which are calculated separately for individuals and households.
Figure 1.22: Differences in percentages obtained on selected variables when using individual versushousehold weights
64,5
18,7
13,2
3,4
1,4
4,9
8,9
11,8
15,6
14,7
12,1
32,0
18,5
22,8
58,7
50,3
31,6
3,7
14,4
63,8
14,8
16,4
4,8
0,3
18,5
18,0
15,2
15,3
11,3
7,8
13,8
14,8
23,9
61,3
53,8
28,5
4,1
13,6
Housing unitFormal
TraditionalInformal
BackyardOther
Number of people in the household123456
7+Access to piped water
No accessCommunity tap
Tap in dwelling/yardSanitation
Flush/chemical toiletPit latrine
Bucket latrineNone
0,0 10,0 20,0 30,0 40,0 50,0 60,0 70,0 80,0
%
Individual Household
Figure 1.22 shows the differences obtained forselected variables according to the two methods ofanalysis. In most cases the differences are quitesmall – for example 64,5% of all individuals wereliving in a formal dwelling, as against 63,8% of allhouseholds.
However the conceptual difference is demonstratedclearly in the findings for the number of people inthe household. Whilst 4,9% of all individuals lived insingle-person households, this represents 18,5% ofhouseholds. Conversely, while 32,0% of individualslived in households of seven or more persons, only13,8% of households contained seven or morepeople.
The preceding data on type of dwelling, number of people in the household and access to serviceshave been given in terms of households,6 which is the usual method of presenting these data.
However in the subsequent chapters of this report, data on these topics for each age group will begiven in terms of individuals, as the focus is on all the people in a specific age group.
6 Households in housing units only. Persons and households in collective living quarters are described in the next sections.

Description of the South African population Census 2001
Statistics South Africa 17
People in collective living quartersLiving quarters are divided broadly into housing units (private dwellings) and collective (orcommunal) living quarters. The latter are further divided into (a) places where households might befound as well as individuals, for example workers’ hostels and residential hotels, and (b)institutions, such as hospitals or prisons.7 Note however that the accommodation of resident staffmembers of any collective living quarters, such as a room, flat or house on the property, isclassified as a housing unit.
Table 1.3 shows the distribution of the residents of collective living quarters among the varioustypes. People in housing units and the homeless are added to complete the picture.
Table 1.3: Distribution of the population by population group, sex and type of living quarters
Collective living quartersPopulationgroup and sex
Housingunit
Residentialhotel
Otherresidence
Home forthe elderly
Workers'hostel Institution Homeless Total
N N N N N N N N
Black African Male 16 146 657 48 289 34 200 5 366 401 355 246 504 5 457 16 887 830
Female 18 141 796 47 954 39 670 5 641 201 752 89 653 1 872 18 528 336
Total 34 288 453 96 243 73 871 11 007 603 106 336 157 7 329 35 416 166
Coloured Male 1 852 199 5 124 2 819 725 9 838 48 268 1 453 1 920 426
Female 2 037 435 5 835 3 357 1 142 8 936 16 629 744 2 074 079
Total 3 889 634 10 960 6 177 1 867 18 774 64 897 2 197 3 994 505
Indian or Asian Male 535 549 2 961 771 231 1 564 3 905 70 545 050
Female 562 344 3 150 916 415 1 307 2 256 30 570 417
Total 1 097 893 6 111 1 686 645 2 870 6 161 100 1 115 467
White Male 1 992 337 15 906 6 213 7 482 8 146 49 891 760 2 080 734
Female 2 101 351 17 218 8 390 20 505 8 202 56 235 1 005 2 212 905
Total 4 093 687 33 124 14 602 27 987 16 348 106 126 1 765 4 293 640
Total Male 20 526 742 72 281 44 003 13 804 420 902 348 568 7 740 21 434 040
Female 22 842 925 74 157 52 333 27 703 220 195 164 773 3 651 23 385 737
Total 43 369 667 146 438 96 336 41 507 641 098 513 341 11 391 44 819 778
Of the total of approximately 1 439 000 people in collective living quarters,• 641 000 people were counted in workers’ hostels;• 513 000 were counted in institutions;• 146 000 people were counted in residential hotels;• 96 000 people were counted in other residences; and• 42 000 were counted in homes for the elderly.8
In addition, 11 000 homeless people were counted.
7 Further breakdowns for this category are given in the next section.8 Homes for the elderly include retirement homes and similar living quarters. Note however that frail care centres were classified as institutions.
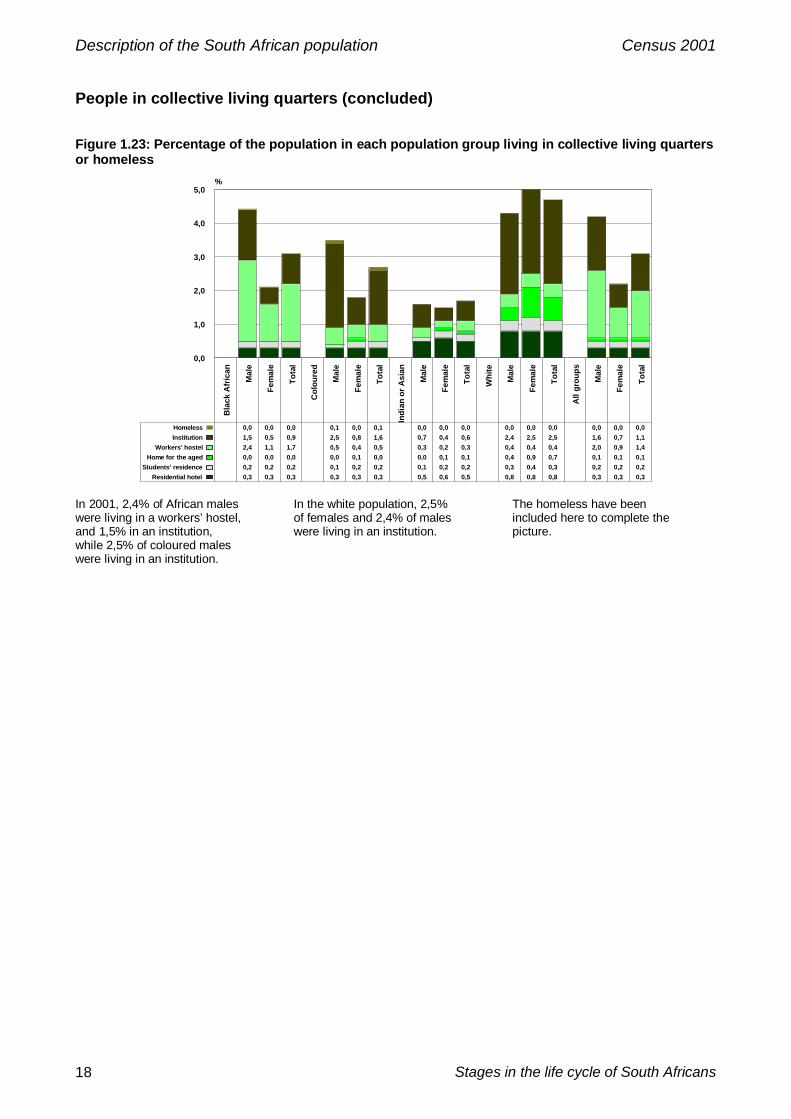
Description of the South African population Census 2001
Stages in the life cycle of South Africans18
People in collective living quarters (concluded)
Figure 1.23: Percentage of the population in each population group living in collective living quartersor homeless
Bla
ck A
fric
an
Mal
e
Fem
ale
Tota
l
Col
oure
d
Mal
e
Fem
ale
Tota
l
Indi
an o
r Asi
an
Mal
e
Fem
ale
Tota
l
Whi
te
Mal
e
Fem
ale
Tota
l
All
grou
ps
Mal
e
Fem
ale
Tota
l
0,0
1,0
2,0
3,0
4,0
5,0%
Residential hotel 0,3 0,3 0,3 0,3 0,3 0,3 0,5 0,6 0,5 0,8 0,8 0,8 0,3 0,3 0,3Students' residence 0,2 0,2 0,2 0,1 0,2 0,2 0,1 0,2 0,2 0,3 0,4 0,3 0,2 0,2 0,2
Home for the aged 0,0 0,0 0,0 0,0 0,1 0,0 0,0 0,1 0,1 0,4 0,9 0,7 0,1 0,1 0,1Workers' hostel 2,4 1,1 1,7 0,5 0,4 0,5 0,3 0,2 0,3 0,4 0,4 0,4 2,0 0,9 1,4
Institution 1,5 0,5 0,9 2,5 0,8 1,6 0,7 0,4 0,6 2,4 2,5 2,5 1,6 0,7 1,1Homeless 0,0 0,0 0,0 0,1 0,0 0,1 0,0 0,0 0,0 0,0 0,0 0,0 0,0 0,0 0,0
In 2001, 2,4% of African maleswere living in a workers’ hostel,and 1,5% in an institution,while 2,5% of coloured maleswere living in an institution.
In the white population, 2,5%of females and 2,4% of maleswere living in an institution.
The homeless have beenincluded here to complete thepicture.

Description of the South African population Census 2001
Statistics South Africa 19
InstitutionsAs noted above, institutions are a subset of collective living quarters. The common characteristic ofthis subset is for the most part less control over one’s own life. The main difference for Census2001 was that in places classified as institutions, no information was collected about households,only about individuals (residents or inmates). Tourist hotels (short-stay accommodation) were alsotreated as institutions in Census 2001 in that people visiting such places were also only capturedas individuals, not as households. (However, once again resident staff members were captured asmembers of households and their accommodation classified as housing units.)
Table 1.4: Number of institutions by province and type of institution
ProvinceTouristhotel
Medicalfacility
Orphan-age
Homefor
disabledSchoolhostel
Convent,etc.
Defenceforce
barracks
Prison/policecells
Refugeecamp/
communityshelter Total
Eastern Cape 221 366 44 38 372 50 31 234 12 1 368
Free State 106 173 33 14 235 22 40 183 5 811
Gauteng 275 695 175 94 183 89 90 418 46 2 065
KwaZulu-Natal 356 513 90 67 303 145 63 368 43 1 948
Limpopo 181 224 13 9 192 26 58 126 6 835
Mpumalanga 150 124 21 17 106 20 39 202 18 697
Northern Cape 189 98 11 8 105 24 16 96 12 559
North West 111 200 44 20 228 38 40 211 7 899
Western Cape 691 464 104 109 294 72 100 295 40 2 169
Total 2 280 2 857 535 376 2 018 486 477 2 133 189 11 351
Table 1.4 shows the number of institutions, as defined above, identified during Census2001, distributed by type and province.
Altogether, there were approximately:• 3 000 hospitals and other medical facilities;• 2 000 tourist hotels or other tourist accommodation facilities;• 2 000 school or other hostels not for workers;• 500 homes for children or orphanages;• 500 convents, monasteries, religious retreats or initiation schools;• 500 defence force barracks or other military accommodation;• 400 homes for the disabled;• 2000 prisons or places with police cells; and• 200 refugee camps, shelters for the homeless, or community or church halls
accommodating people temporarily.
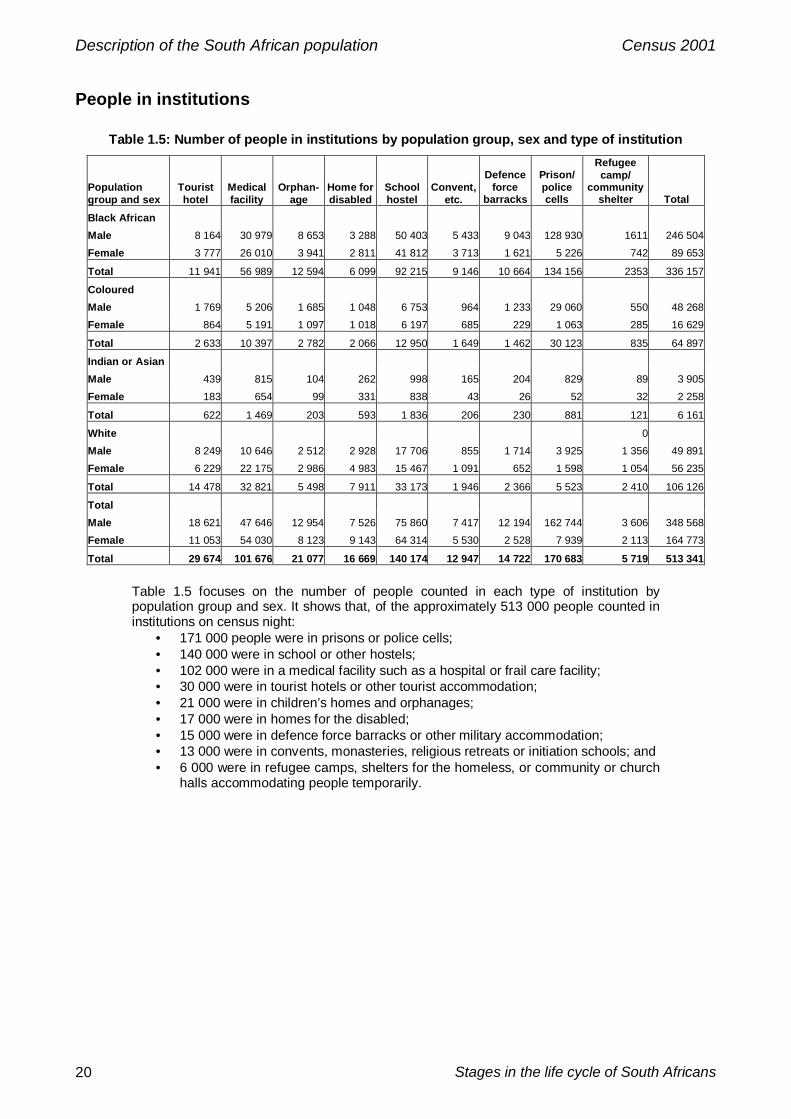
Description of the South African population Census 2001
Stages in the life cycle of South Africans20
People in institutions
Table 1.5: Number of people in institutions by population group, sex and type of institution
Populationgroup and sex
Touristhotel
Medicalfacility
Orphan-age
Home fordisabled
Schoolhostel
Convent,etc.
Defenceforce
barracks
Prison/policecells
Refugeecamp/
communityshelter Total
Black AfricanMale 8 164 30 979 8 653 3 288 50 403 5 433 9 043 128 930 1611 246 504
Female 3 777 26 010 3 941 2 811 41 812 3 713 1 621 5 226 742 89 653
Total 11 941 56 989 12 594 6 099 92 215 9 146 10 664 134 156 2353 336 157
ColouredMale 1 769 5 206 1 685 1 048 6 753 964 1 233 29 060 550 48 268
Female 864 5 191 1 097 1 018 6 197 685 229 1 063 285 16 629
Total 2 633 10 397 2 782 2 066 12 950 1 649 1 462 30 123 835 64 897
Indian or AsianMale 439 815 104 262 998 165 204 829 89 3 905
Female 183 654 99 331 838 43 26 52 32 2 258
Total 622 1 469 203 593 1 836 206 230 881 121 6 161
White 0
Male 8 249 10 646 2 512 2 928 17 706 855 1 714 3 925 1 356 49 891
Female 6 229 22 175 2 986 4 983 15 467 1 091 652 1 598 1 054 56 235
Total 14 478 32 821 5 498 7 911 33 173 1 946 2 366 5 523 2 410 106 126
TotalMale 18 621 47 646 12 954 7 526 75 860 7 417 12 194 162 744 3 606 348 568
Female 11 053 54 030 8 123 9 143 64 314 5 530 2 528 7 939 2 113 164 773
Total 29 674 101 676 21 077 16 669 140 174 12 947 14 722 170 683 5 719 513 341
Table 1.5 focuses on the number of people counted in each type of institution bypopulation group and sex. It shows that, of the approximately 513 000 people counted ininstitutions on census night:
• 171 000 people were in prisons or police cells;• 140 000 were in school or other hostels;• 102 000 were in a medical facility such as a hospital or frail care facility;• 30 000 were in tourist hotels or other tourist accommodation;• 21 000 were in children’s homes and orphanages;• 17 000 were in homes for the disabled;• 15 000 were in defence force barracks or other military accommodation;• 13 000 were in convents, monasteries, religious retreats or initiation schools; and• 6 000 were in refugee camps, shelters for the homeless, or community or church
halls accommodating people temporarily.

Description of the South African population Census 2001
Statistics South Africa 21
The prison population
Figure 1.24: Number of people in each five-year age category in prisons or police cells
0,259
0,28
1,23
18,003
36,185
38,956
28,076
19,782
12,561
7,074
3,891
1,832
0,916
0,459
0,328
0,285
0,274
0,292
0-4
5-9
10-14
15-19
20-24
25-29
30-34
35-39
40-44
45-49
50-54
55-59
60-64
65-69
70-74
75-79
80-84
85+
Age
0 10 20 30 40
Thousands
Of the 171 000 peoplecounted in a police cell,correctional institution orprison, a considerableproportion were relativelyyoung.
The number of detainedpeople reached a peakfor ages 25–29, since39 000 were found in thisage category. A slightlylower number, 36 000,were aged 20–24.
From age 30–34, thenumber decreased witheach age category; fromage 65+ very few peoplewere in prison.
Figure 1.25: Prison and police-cell population by age and sex
The distribution of the detained population by sexwas highly unequal, with 163 000 detainees beingmales (95,3%) and 8 000 (4,7%) being females (notshown here).
The distribution by age of male detainees wasskewed towards the younger age categories. Thedistribution by age of female detainees was lessskewed towards the younger age categories thanthat of males.

Description of the South African population Census 2001
Stages in the life cycle of South Africans22
The prison population (concluded)
Figure 1.26: Prison and police-cell population by age and population group
Variation by population groupOf all detainees, 78,6% were African, while 17,6%were coloured, 3,2% were white, and 0,5% wereIndian or Asian.
The percentage of African detainees (78,6%) was inkeeping with their proportion in the South Africanpopulation as a whole (79,0%).
The proportion of coloured detainees (17,6%)exceeded their proportion of the total population(8,9%).
The proportion of white detainees (3,2%) was lowerthan the proportion of whites in the total population(9,6%). The same applied to Indian or Asiandetainees (0,5% of all detainees were Indian orAsian, compared with 2,5% of the total population).
Variation by population group and ageThe age distribution of African and coloureddetainees closely followed the overall agedistribution of the detainee population.
The age distribution of the Indian or Asian detaineepopulation was slightly older than the agedistribution of the detainee population as a whole.
The age distribution of the white detaineepopulation was more evenly spread, with 15,1% ofall white detainees aged 15–19, while a largerproportion than the overall detainee population wasfound in the older age categories.

Census 2001
Statistics South Africa 23
Chapter 2: Description of South African infantsThe first five years are a crucial time in the life cycle of the individual, when physical, intellectualand emotional development takes place at an extremely rapid rate. The infant learns to roll, sit,crawl, walk, climb and run. Sounds are turned into words and sentences, as the infant learns totalk. The interactions that infants have with the people around them allow them to absorb theculture and values of the society in which they live, and to make sense of their world. Theenvironment presents a series of challenging problems, which encourages the development ofproblem-solving abilities.
The type of home in which the infant lives, and the ability of caregivers to provide a secure andstimulating environment, including supplying sufficient food and adequate shelter, lay thefoundation for later stages of development.
In this chapter, we examine the living conditions and life circumstances of infants in South Africa byprovince, sex, population group and other appropriate variables, at the time of Census 2001, aswell as some comparisons, when appropriate, with Census ’96.

Description of infants (0–4) Census 2001
24 Stages in the life cycle of South Africans
Demographic picture
Table 2.1: Distribution of infants by age, sex and population group
Black African Coloured Indian or Asian White TotalAge and sex N % N % N % N % N %0 Male 382 583 84,3 40 745 9,0 7 364 1,6 23 232 5,1 453 924 100,0
Female 384 395 84,6 40 144 8,8 7 375 1,6 22 568 5,0 454 482 100,0
Total 766 978 84,4 80 889 8,9 14 739 1,6 45 800 5,0 908 406 100,0
1 Male 366 498 84,0 39 407 9,0 7 414 1,7 22 938 5,3 436 258 100,0
Female 365 736 84,2 39 232 9,0 7 226 1,7 22 187 5,1 434 381 100,0
Total 732 234 84,1 78 640 9,0 14 640 1,7 45 125 5,2 870 638 100,0
2 Male 368 533 84,1 38 731 8,8 7 503 1,7 23 218 5,3 437 985 100,0
Female 370 575 84,3 39 091 8,9 7 144 1,6 22 614 5,1 439 424 100,0
Total 739 107 84,2 77 822 8,9 14 647 1,7 45 832 5,2 877 409 100,0
3 Male 368 395 84,3 38 072 8,7 7 585 1,7 23 117 5,3 437 170 100,0
Female 370 974 84,7 37 545 8,6 7 348 1,7 22 373 5,1 438 240 100,0
Total 739 370 84,5 75 618 8,6 14 933 1,7 45 490 5,2 875 410 100,0
4 Male 385 940 84,2 40 150 8,8 7 917 1,7 24 387 5,3 458 394 100,0
Female 388 565 84,6 39 769 8,7 7 734 1,7 23 490 5,1 459 558 100,0
Total 774 505 84,4 79 919 8,7 15 650 1,7 47 877 5,2 917 952 100,0
0-4 Male 1 871 949 84,2 197 105 8,9 37 784 1,7 116 892 5,3 2 223 731 100,0
Female 1 880 246 84,5 195 781 8,8 36 826 1,7 113 232 5,1 2 226 085 100,0
Total 3 752 195 84,3 392 887 8,8 74 609 1,7 230 124 5,2 4 449 816 100,0
Table 2.1 indicates that there were almost 4,5 million infants aged 0–4 years in SouthAfrica on the night of 9–10 October 2001, or one in every ten (9,9%) of the totalpopulation. There were approximately 900 000 infants in each single-year age category.
Approximately 84 in every 100 infants were African (84,3%), while nine in every hundredwere coloured (8,8%), five in every hundred were white (5,2%), and two in every hundredwere Indian or Asian (1,7%).
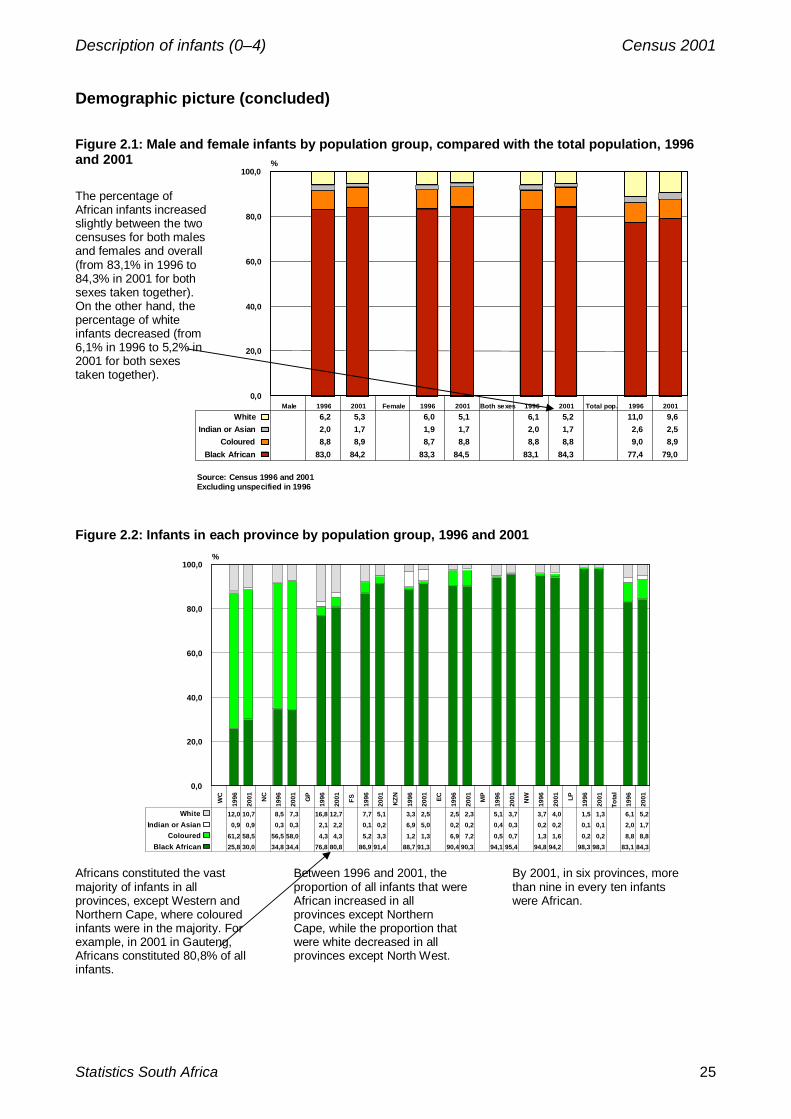
Description of infants (0–4) Census 2001
Statistics South Africa 25
Male 1996 2001 Female 1996 2001 Both sexes 1996 2001 Total pop. 1996 20010,0
20,0
40,0
60,0
80,0
100,0%
Black African 83,0 84,2 83,3 84,5 83,1 84,3 77,4 79,0Coloured 8,8 8,9 8,7 8,8 8,8 8,8 9,0 8,9
Indian or Asian 2,0 1,7 1,9 1,7 2,0 1,7 2,6 2,5White 6,2 5,3 6,0 5,1 6,1 5,2 11,0 9,6
Source: Census 1996 and 2001Excluding unspecified in 1996
Demographic picture (concluded)
Figure 2.1: Male and female infants by population group, compared with the total population, 1996and 2001
The percentage ofAfrican infants increasedslightly between the twocensuses for both malesand females and overall(from 83,1% in 1996 to84,3% in 2001 for bothsexes taken together).On the other hand, thepercentage of whiteinfants decreased (from6,1% in 1996 to 5,2% in2001 for both sexestaken together).
Figure 2.2: Infants in each province by population group, 1996 and 2001
WC
1996
2001 NC
1996
2001 GP
1996
2001 FS 1996
2001
KZN
1996
2001 EC
1996
2001 MP
1996
2001 NW
1996
2001 LP
1996
2001
Tota
l
1996
2001
0,0
20,0
40,0
60,0
80,0
100,0%
Black African 25,8 30,0 34,8 34,4 76,8 80,8 86,9 91,4 88,7 91,3 90,4 90,3 94,1 95,4 94,8 94,2 98,3 98,3 83,1 84,3Coloured 61,2 58,5 56,5 58,0 4,3 4,3 5,2 3,3 1,2 1,3 6,9 7,2 0,5 0,7 1,3 1,6 0,2 0,2 8,8 8,8
Indian or Asian 0,9 0,9 0,3 0,3 2,1 2,2 0,1 0,2 6,9 5,0 0,2 0,2 0,4 0,3 0,2 0,2 0,1 0,1 2,0 1,7White 12,0 10,7 8,5 7,3 16,8 12,7 7,7 5,1 3,3 2,5 2,5 2,3 5,1 3,7 3,7 4,0 1,5 1,3 6,1 5,2
Africans constituted the vastmajority of infants in allprovinces, except Western andNorthern Cape, where colouredinfants were in the majority. Forexample, in 2001 in Gauteng,Africans constituted 80,8% of allinfants.
Between 1996 and 2001, theproportion of all infants that wereAfrican increased in allprovinces except NorthernCape, while the proportion thatwere white decreased in allprovinces except North West.
By 2001, in six provinces, morethan nine in every ten infantswere African.

Description of infants (0–4) Census 2001
26 Stages in the life cycle of South Africans
Parents alive
Figure 2.3: According to age
0 1 2 3 4 0-40,0
20,0
40,0
60,0
80,0
100,0%
Both parents alive 95,7 94,3 92,8 91,7 90,7 93,0Mother alive, father dead 3,6 4,6 5,7 6,5 7,2 5,5Father alive, mother dead 0,5 0,8 1,0 1,2 1,4 1,0
Both parents dead 0,3 0,3 0,5 0,6 0,7 0,5
Both parents werereported as beingalive among93,0% of infantsaged 0–4 years,while only themother wasreported as beingalive among 5,5%of them, and onlythe father among1,0%. Only 0,5%of infants hadneither parentalive.
Figure 2.4: According to sex and population group
Among African infants,92,2% had both parentsalive, increasing to96,6% among coloured,97,9% among Indian/Asian, and 98,6%among white infants.There was nomeaningful difference bysex. M
ale
Bla
ck A
fric
an
Col
oure
d
Indi
an o
r Asi
an
Whi
te
All
grou
ps
Fem
ale
Bla
ck A
fric
an
Col
oure
d
Indi
an o
r Asi
an
Whi
te
All
grou
ps
Bot
h se
xes
Bla
ck A
fric
an
Col
oure
d
Indi
an o
r Asi
an
Whi
te
Tota
l0,0
20,0
40,0
60,0
80,0
100,0%
Both parents alive 92,3 96,6 98,0 98,6 93,1 92,2 96,6 97,8 98,5 93,0 92,2 96,6 97,9 98,6 93,0Mothe alive, father dead 6,1 2,6 1,5 1,0 5,5 6,2 2,6 1,6 1,1 5,6 6,2 2,6 1,6 1,1 5,5
Father alive, mother dead 1,1 0,6 0,4 0,2 1,0 1,1 0,6 0,3 0,2 1,0 1,1 0,6 0,3 0,2 1,0Both parents dead 0,5 0,2 0,1 0,1 0,4 0,5 0,2 0,2 0,1 0,5 0,5 0,2 0,2 0,1 0,5

Description of infants (0–4) Census 2001
Statistics South Africa 27
Living with parents
Figure 2.5: Among infants whose parents were alive, according to population group and sex
Of African infants with bothparents alive, only 37,7%lived in the same householdas both parents. Differencesby sex were negligible.
Bla
ck A
fric
an
Mal
e
Fem
ale
Bot
h
Col
oure
d
Mal
e
Fem
ale
Bot
h
Indi
an o
r Asi
an
Mal
e
Fem
ale
Bot
h
Whi
te
Mal
e
Fem
ale
Bot
h
Tota
l
Mal
e
Fem
ale
Bot
h
0,0
20,0
40,0
60,0
80,0
100,0%
Both parents in household 37,7 37,6 37,7 55,2 55,7 55,5 85,2 84,8 85,0 85,6 85,3 85,5 42,8 42,7 42,8Mother in household not father 39,9 40,3 40,1 32,4 32,1 32,2 8,4 8,8 8,6 8,6 9,0 8,8 36,9 37,3 37,1
Father in household not mother 5,3 5,1 5,2 3,6 3,5 3,6 3,4 3,4 3,4 3,0 3,0 3,0 5,0 4,8 4,9Neither parent in household 17,0 17,1 17,0 8,7 8,7 8,7 3,0 2,9 3,0 2,7 2,6 2,7 15,2 15,3 15,2

Description of infants (0–4) Census 2001
28 Stages in the life cycle of South Africans
Relationship to household head
Figure 2.6: According to ageJust over half (52,3%) of all infants wereliving in households where they were thechildren of the head or acting head of thehousehold. But another large group(38,2%) was living in households where agrandparent or a great-grandparent wasthe household head, while a smallergroup (7,9%) was living where anotherrelative was the household head.
Very young infants were less likely thanolder infants to live with a parent that wasthe head of the household. Just underhalf (49,8%) of infants aged less than oneyear were living in a household with aparent as the household head, increasinggradually to well over half (54,1%) amongfour-year-olds.
Figure 2.7: According to province
KZN EC NW LP MP NC FS WC GP Total0,0
20,0
40,0
60,0
80,0
100,0%
Child 43,5 46,7 47,7 50,0 52,0 52,2 57,0 63,2 66,2 52,3Grandchild/great-grandchild 45,7 43,1 43,1 41,0 38,7 38,8 34,8 27,1 25,6 38,2
Other relative 8,8 8,7 8,2 8,0 8,2 7,1 7,0 6,9 6,3 7,9Adopted child 1,4 1,0 0,6 0,8 0,8 0,9 0,8 1,1 1,0 1,0
Not related 0,4 0,4 0,3 0,2 0,2 0,9 0,2 1,3 0,6 0,5
The proportions ofinfants living where aparent was thehousehold head andliving where agrandparent or great-grandparent was thehousehold head variedby province. In KZN theproportion living where agrandparent or great-grandparent was thehousehold head was45,7%; this proportionwas 25,6% in Gauteng.
Note that when agrandparent is thehousehold head, theinfant’s parent orparents may still beliving in the samehousehold.
0 1 2 3 4 0-40,0
20,0
40,0
60,0
80,0
100,0%
Child 49,8 52,5 52,2 52,9 54,1 52,3Grandchild/great-grandchild 40,9 38,6 38,5 37,3 35,7 38,2
Other relative 7,5 7,4 7,8 8,2 8,4 7,9Adopted child 0,8 0,9 1,0 1,1 1,3 1,0
Not related 0,6 0,5 0,4 0,4 0,4 0,5Not living in a h'hold 0,4 0,1 0,1 0,1 0,1 0,2
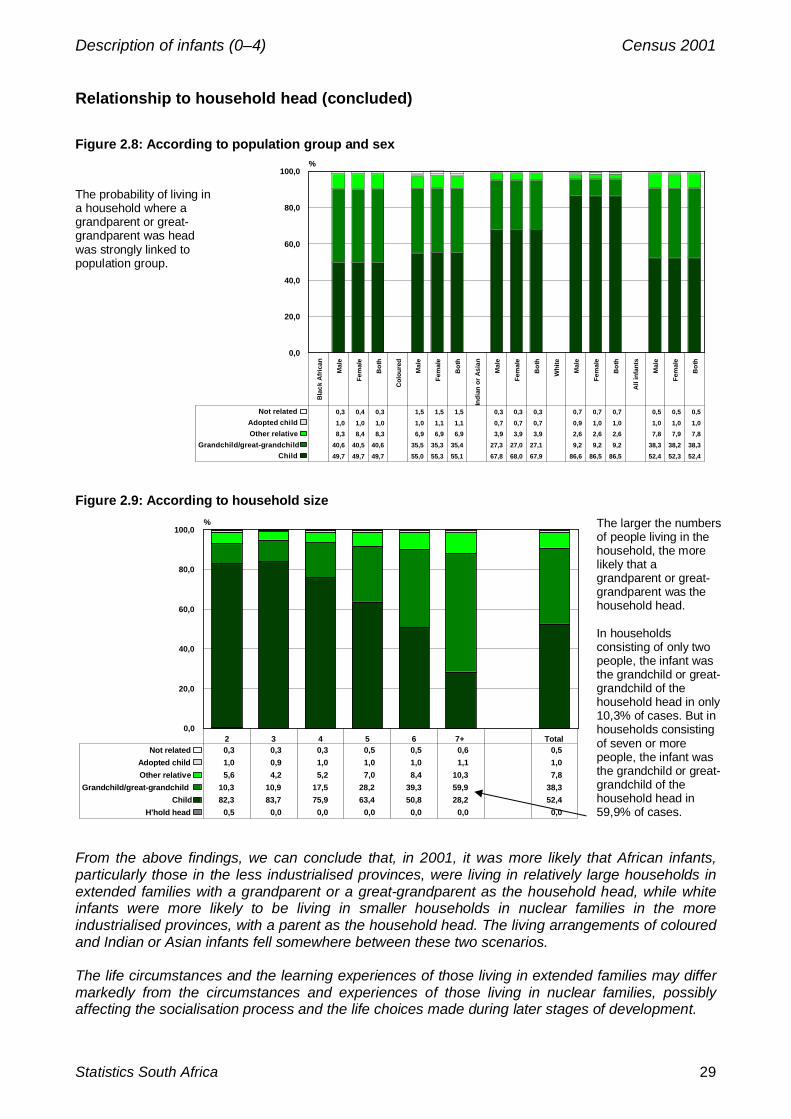
Description of infants (0–4) Census 2001
Statistics South Africa 29
Relationship to household head (concluded)
Figure 2.8: According to population group and sex
The probability of living ina household where agrandparent or great-grandparent was headwas strongly linked topopulation group.
Figure 2.9: According to household size
2 3 4 5 6 7+ Total0,0
20,0
40,0
60,0
80,0
100,0%
H'hold head 0,5 0,0 0,0 0,0 0,0 0,0 0,0Child 82,3 83,7 75,9 63,4 50,8 28,2 52,4
Grandchild/great-grandchild 10,3 10,9 17,5 28,2 39,3 59,9 38,3Other relative 5,6 4,2 5,2 7,0 8,4 10,3 7,8Adopted child 1,0 0,9 1,0 1,0 1,0 1,1 1,0
Not related 0,3 0,3 0,3 0,5 0,5 0,6 0,5
The larger the numbersof people living in thehousehold, the morelikely that agrandparent or great-grandparent was thehousehold head.
In householdsconsisting of only twopeople, the infant wasthe grandchild or great-grandchild of thehousehold head in only10,3% of cases. But inhouseholds consistingof seven or morepeople, the infant wasthe grandchild or great-grandchild of thehousehold head in59,9% of cases.
From the above findings, we can conclude that, in 2001, it was more likely that African infants,particularly those in the less industrialised provinces, were living in relatively large households inextended families with a grandparent or a great-grandparent as the household head, while whiteinfants were more likely to be living in smaller households in nuclear families in the moreindustrialised provinces, with a parent as the household head. The living arrangements of colouredand Indian or Asian infants fell somewhere between these two scenarios.
The life circumstances and the learning experiences of those living in extended families may differmarkedly from the circumstances and experiences of those living in nuclear families, possiblyaffecting the socialisation process and the life choices made during later stages of development.
Bla
ck A
fric
an
Mal
e
Fem
ale
Bot
h
Col
oure
d
Mal
e
Fem
ale
Bot
h
Indi
an o
r As
ian
Mal
e
Fem
ale
Bot
h
Whi
te
Mal
e
Fem
ale
Bot
h
All
infa
nts
Mal
e
Fem
ale
Bot
h
0,0
20,0
40,0
60,0
80,0
100,0%
Child 49,7 49,7 49,7 55,0 55,3 55,1 67,8 68,0 67,9 86,6 86,5 86,5 52,4 52,3 52,4Grandchild/great-grandchild 40,6 40,5 40,6 35,5 35,3 35,4 27,3 27,0 27,1 9,2 9,2 9,2 38,3 38,2 38,3
Other relative 8,3 8,4 8,3 6,9 6,9 6,9 3,9 3,9 3,9 2,6 2,6 2,6 7,8 7,9 7,8Adopted child 1,0 1,0 1,0 1,0 1,1 1,1 0,7 0,7 0,7 0,9 1,0 1,0 1,0 1,0 1,0
Not related 0,3 0,4 0,3 1,5 1,5 1,5 0,3 0,3 0,3 0,7 0,7 0,7 0,5 0,5 0,5

Description of infants (0–4) Census 2001
30 Stages in the life cycle of South Africans
Pre-school attendanceWe have already stressed that the environment in which the infant grows up is important in relationto the socialisation process. In this context, the people with whom infants interact, including peers,older children and adults, and the nature of the interaction, for example in a more formal classroomsetting or in a less formal home setting, may influence the knowledge, values and attitudes ofinfants. This interaction can take place, not only within the home and the neighbourhood, but alsoat pre-school institutions. In this part of the chapter we look at pre-school institution attendanceamong infants.
Figure 2.10: Percentage of infants attending according to age and population group
2,21,71,5
5,1
4,53,3
2,913,3
10,57,0
6,330,8
17,912,412,7
46,2
28,120,3
24,859,2
12,78,8
9,831,0
0Black African
ColouredIndian or Asian
White1
Black AfricanColoured
Indian or AsianWhite
2Black African
ColouredIndian or Asian
White3
Black AfricanColoured
Indian or AsianWhite
4Black African
ColouredIndian or Asian
White 0-4
Black AfricanColoured
Indian or AsianWhite
0,0 10,0 20,0 30,0 40,0 50,0 60,0 70,0
%
In all single-year agegroups, white infantswere more likely to beattending a pre-schoolorganisation than thosein the other populationgroups. For example,among four-year-olds,59,2% of white infantswere attending a pre-school organisation, asagainst 20,3% ofcoloured, 24,8% ofIndian or Asian and28,1% of African infants.
Figure 2.11: Percentage of infants attending according to age and sex
2,32,32,3
4,84,84,8
10,811,1
10,9
18,319,0
18,6
22,823,7
23,2
11,812,2
12,0
0Male
FemaleBoth
1Male
FemaleBoth
2Male
FemaleBoth
3Male
FemaleBoth
4Male
FemaleBoth 0-4
MaleFemale
Both
0,0 5,0 10,0 15,0 20,0 25,0
%
Equal proportions ofgirls and boys aged 0–2years were attending apreschool. In the agegroups of three and fouryears, a slightly higherproportion of girls(19,0% at the age ofthree; 23,7% at the ageof four) than boys(18,3% at the age ofthree; 22,8% at the ageof four) were attending apre-school.

Description of infants (0–4) Census 2001
Statistics South Africa 31
Pre-school attendance (concluded)
Figure 2.12: Percentage of infants attending in each province
19,7
15,7
13,8
11,1
9,2
9,0
8,2
8,0
7,3
12,0
GP
EC
WC
FS
LP
NW
KZN
MP
NC
Total
0,0 5,0 10,0 15,0 20,0 25,0
%
A larger proportion ofinfants attended a pre-school in the moreindustrialised anddensely populatedprovinces.
For example, inGauteng, one in fiveinfants (19,7%) wasattending a pre-schoolinstitution, whereas inNorthern Cape, which issparsely populated, onlyone in 14 infants (7,2%)was attending.
From these findings we can conclude that the socialisation process of infants in relation to contactsthrough a formal pre-school or a less formal home environment, may differ on the basis ofpopulation group, rather than sex. Opportunities for interaction within a pre-school environment aremore available for white infants than for those in other population groups. They are also more likelyto be available in a more densely populated or urban environment than in a more rural one.

Description of infants (0–4) Census 2001
32 Stages in the life cycle of South Africans
Disability
Table 2.2: Number of disabled infants by age, sex and type of disability
Age SexNo
disability Sight HearingCommuni-
cation Physical Intellectual Emotional Multiple
At leastone
disability Total Male 448 841 1 037 1 268 212 741 803 506 516 5 083 453 924
0 Female 449 832 1 006 1 127 217 592 713 457 538 4 650 454 482
Total 898 673 2 043 2 396 429 1 333 1 516 962 1 054 9 733 908 406
Male 429 773 1 503 1 457 236 1 173 806 683 627 6 485 436 258
1 Female 428 595 1 281 1 403 235 922 803 557 585 5 786 434 381
Total 858 367 2 784 2 861 471 2 095 1 608 1 240 1 212 12 271 870 638
Male 430 277 1 705 1 499 372 1 563 999 748 823 7 709 437 985
2 Female 432 652 1 555 1 479 323 1 181 849 679 707 6 773 439 424
Total 862 928 3 260 2 977 696 2 744 1 848 1 426 1 529 14 480 877 409
Male 428 422 1 981 1 649 595 1 619 1 094 882 928 8 748 437 170
3 Female 430 563 1 791 1 628 427 1 290 1 028 680 833 7 677 438 240
Total 858 985 3 771 3 277 1 022 2 908 2 122 1 563 1 761 16 424 875 410
Male 448 581 2 177 1 949 686 1 765 1 226 978 1 033 9 814 458 394
4 Female 450 959 1 941 1 886 508 1 383 1 169 791 920 8 598 459 558
Total 899 540 4 118 3 835 1 194 3 148 2 395 1 769 1 953 18 412 917 952
Male 2 185 894 8 402 7 822 2 101 6 859 4 928 3 797 3 927 37 836 2 223 731
0-4 Female 2 192 600 7 574 7 524 1 711 5 367 4 562 3 163 3 583 33 484 2 226 085
Total 4 378 494 15 976 15 346 3 812 12 227 9 491 6 961 7 510 71 323 4 449 816
Of the approximately 4,5 million infants counted in Census 2001, 71 000 (1,6%) werereported as being disabled.
Of these, 16 000 (22,4%) had a visual disability, 15 000 (21,5%) had a hearing, 4 000(5,3%) had a communication, 12 000 (17,1%) had a physical, 9 000 (13,3%) had anintellectual, and 7 000 (9,8%) had an emotional disability, while 8 000 (10,5%) hadmultiple disabilities.
Figure 2.13: Percentage of infants of each age with each type of disability, compared with the totalpopulation
1,11,4
1,61,9 2,0
1,6
5,0
0 1 2 3 4 0-4 Total pop.0,0
1,0
2,0
3,0
4,0
5,0
6,0%
Sight 0,2 0,3 0,4 0,4 0,5 0,4 1,3Hearing 0,3 0,3 0,3 0,4 0,4 0,3 0,7
Communication 0,1 0,1 0,1 0,1 0,1 0,1 0,2Physical 0,2 0,2 0,3 0,3 0,3 0,3 1,2
Intellectual 0,2 0,2 0,2 0,2 0,3 0,2 0,5Emotional 0,1 0,1 0,2 0,2 0,2 0,2 0,6
Multiple 0,1 0,1 0,2 0,2 0,2 0,2 0,6
There was a steadyincrease in theproportion of disabledinfants with each single-year increase in age.
The proportion ofdisabled infants withineach category ofdisability also increasedsteadily with eachsingle-year increase inage.

Description of infants (0–4) Census 2001
Statistics South Africa 33
Disability (concluded)
Figure 2.14: Percentage of infants that were disabled according to population group and age
1,1
1,5
1,8
2,02,1
1,7
0,8
1,01,1
1,4 1,4
1,1
0,7
0,9
0,7
0,9
1,1
0,90,8 0,8
1,01,1
1,3
1,0
1,6
Bla
ck A
fric
an 0 1 2 3 4
0-4
Col
oure
d 0 1 2 3 4
0-4
Indi
an o
r Asi
an 0 1 2 3 4
0-4
Whi
te 0 1 2 3 4
0-4
Tota
l
0,0
0,5
1,0
1,5
2,0
2,5%
The proportion of Africaninfants reported asdisabled was higher thanthe proportions in theother population groups.
Figure 2.15: Percentage of infants that were disabled according to age and sex
1,11,0
1,5
1,3
1,8
1,5
2,0
1,8
2,1
1,9
1,7
1,51,6
0 MaleFemale 1 MaleFemale 2 MaleFemale 3 MaleFemale 4 MaleFemale 0-4 MaleFemale Total0,0
0,5
1,0
1,5
2,0
2,5%
The proportion of maleinfants reported asdisabled was slightlyhigher than theproportion of femaleinfants for all ages.
The prevalence of disability can be directly linked to the environment in which the infant is growingup, including quality of housing, household size, overcrowding, access to good nutrition, cleanwater and adequate sanitation, and access to primary healthcare facilities, which in South Africacontinue to differ by population group.
Among those infants living in families where there is adequate access to antenatal and post-natalprimary health-care facilities, particularly white families, there is clearly a lower prevalence ofdisability than among those infants where such facilities are less likely to be available, particularlyAfrican families.

Description of infants (0–4) Census 2001
34 Stages in the life cycle of South Africans
Number of people with whom living
Figure 2.16: According to age, compared with the total population and all households
0 1 2 3 4 0-4 Total pop. All h'holds0,0
20,0
40,0
60,0
80,0
100,0%
On their own 0,0 0,0 0,0 0,0 0,0 0,0 4,8 18,51 1,9 2,1 2,0 1,9 1,8 1,9 8,9 18,02 12,3 13,0 12,0 10,8 9,7 11,6 11,8 15,23 15,5 16,7 16,9 17,2 17,5 16,8 15,6 15,34 14,9 15,8 16,0 16,2 16,6 15,9 14,7 11,35 13,5 13,4 13,5 13,8 14,1 13,7 12,1 7,8
6+ 41,8 39,0 39,5 40,0 40,2 40,1 32,0 13,8
A relatively highproportion, four inevery ten infants(40,1%), was livingwith at least sixother people. Onthe other hand, arelatively smallproportion, two inevery hundred(1,9%), was livingwith only one otherperson.
Some slightvariation to thispattern can be seenwithin single-yearage categories.
Figure 2.17: According to population group
Black African Coloured Indian or Asian White Total0,0
20,0
40,0
60,0
80,0
100,0%
On their own 0,0 0,0 0,0 0,0 0,01 2,1 1,1 0,4 1,5 1,92 10,8 10,8 14,0 24,0 11,63 14,8 19,5 26,2 40,0 16,84 15,3 18,8 21,4 18,9 15,95 13,9 14,7 15,5 8,1 13,7
6+ 43,0 35,0 22,5 7,6 40,1
Of African infants,43,0% were livingwith at least sixother people,decreasing to35,0% of coloured,22,5% ofIndian/Asian andonly 7,6% of whiteinfants.
On the other hand,four in every tenwhite infants(40,0%) were livingwith three otherpeople, while one infour (24,0%) wasliving with two otherpeople.

Description of infants (0–4) Census 2001
Statistics South Africa 35
0 1 2 3 4 0-4 Total pop. All h'holds0,0
20,0
40,0
60,0
80,0
100,0%
Traditional 20,5 21,6 22,8 23,5 23,5 22,4 18,1 14,8Formal 58,5 58,4 58,3 58,3 58,6 58,4 62,4 63,8
Informal 15,4 14,9 14,2 13,6 13,4 14,3 12,8 16,4Backyard 3,5 3,3 3,1 3,1 3,0 3,2 3,3 4,8
Other 1,7 1,6 1,5 1,4 1,3 1,5 0,2 0,3Collective 0,4 0,1 0,1 0,1 0,1 0,2 3,3 n/a
Type of dwelling
Figure 2.18: According to age, compared with the total population and all households
More than half (58,4%)of all infants were livingin formal dwellings,while 22,4% were livingin traditional dwellings,and 14,3% in informaldwellings.
The proportion of infantsliving in formal dwellingswas lower than theproportion of the totalpopulation (58,4% asagainst 62,4%), theproportion of infantsliving in traditionaldwellings (22,4% asagainst 18,1%) andinformal dwellings(14,3% as against12,8%) were higher thanfor the total population.
Figure 2.19: According to population group, compared with the total population and all households
Black African Coloured Indian or Asian
White 0-4 Total pop. All h'holds0,0
20,0
40,0
60,0
80,0
100,0%
Traditional 26,5 3,0 1,4 1,1 22,7 18,1 14,8Formal 53,6 85,2 91,7 95,3 59,2 62,4 63,8
Informal 16,3 8,0 1,4 0,5 14,5 12,8 16,4Backyard 3,2 3,2 5,1 2,5 3,2 3,3 4,8
Other 0,2 0,3 0,2 0,4 0,2 0,2 0,3Collective 0,2 0,3 0,2 0,3 0,2 3,3 n/a
Type of dwellingwas clearly relatedto population group,with 26,5% ofAfrican infants livingin traditionaldwellings asopposed to 1,1% ofwhite infants.

Description of infants (0–4) Census 2001
36 Stages in the life cycle of South Africans
Type of dwelling (concluded)
Figure 2.20: According to province, compared with the total population and all households
EC KZN LP MP FS NW NC WC GP 0-4 Totalpop.
Allh'holds
0,0
20,0
40,0
60,0
80,0
100,0%
Traditional 50,2 39,8 21,1 17,9 9,9 6,6 3,8 2,5 1,4 22,4 18,1 14,8Formal 38,5 46,2 69,6 63,9 61,6 68,5 79,2 75,6 63,6 58,4 62,4 63,8
Informal 7,6 8,8 5,6 13,7 24,9 21,6 13,2 17,4 26,6 14,3 12,8 16,4Backyard 2,8 3,3 1,9 2,2 2,6 2,1 1,9 2,5 6,2 3,2 3,3 4,8
Other 0,1 0,2 0,1 0,2 0,2 0,2 0,7 0,3 0,3 0,2 0,2 0,3Collective 0,8 1,5 1,7 2,2 0,7 1,0 1,2 1,7 1,9 1,5 3,3 n/a
Infants countedin the lessindustrialisedprovinces weremore likely to beliving intraditionaldwellings thaninfants living inthe moreindustrialisedand urbanisedprovinces.
For example, inEastern Cape,50,2% of infantswere living intraditionaldwellings,compared with1,4% of infants inGauteng.

Description of infants (0–4) Census 2001
Statistics South Africa 37
Main energy source for lighting
Figure 2.21: Compared with the total population and all households, 1996 and 2001
Infants 1996 2001 Total pop. 1996 2001 All h'holds 1996 20010,0
20,0
40,0
60,0
80,0
100,0%
Electricity 47,4 63,5 56,2 69,8 58,0 69,7Paraffin 15,1 6,8 13,0 6,1 12,8 6,8Candles 36,1 28,8 30,4 23,2 28,8 22,7
Other 1,4 0,9 0,4 0,9 0,7 0,8
Source: Census 1996 and 2001
The proportion ofinfants withelectricity forlighting in thedwelling in whichthey were livingincreased from47,4% in 1996 to63,5% in 2001.This proportionwas still lowerthan for thepopulation overallin 2001 (69,8%).
No graph is givenhere for populationgroup, but as wehave seen inChapter 1, it waslargely those livingin householdsheaded by anAfrican that wereless likely to haveto electricity.
Figure 2.22: According to province, compared with the total population and all households
EC KZN LP MP NW FS NC GP WC Total Total pop. All h'holds0,0
20,0
40,0
60,0
80,0
100,0%
Electricity 41,7 51,0 62,8 65,3 69,1 74,1 76,3 79,1 87,8 63,5 69,8 69,7Paraffin 21,1 2,7 8,2 4,0 2,7 3,8 4,0 3,0 6,8 6,8 6,1 6,8Candles 36,0 45,1 28,0 29,7 27,7 21,3 18,1 17,2 4,8 28,8 23,2 22,7
Other 1,2 1,2 0,9 0,9 0,5 0,8 1,6 0,6 0,5 0,9 0,9 0,8
Just over four inevery ten infantsliving in EasternCape (41,7%) hadelectricity forlighting in thedwelling in whichthey were living,increasing witheach successiveprovince (shown inthe graph from leftto right) to reachalmost nine inevery ten infants(87,8%) inWestern Cape.

Description of infants (0–4) Census 2001
38 Stages in the life cycle of South Africans
Main water source
Figure 2.23: Compared with the total population and all households, 1996 and 2001
The proportion of infantsthat had access to pipedwater inside the dwellingor in the yard increasedfrom 48,3% in 1996 to51,2% in 2001.However, this figureremains lower than theproportion of individuals,overall, with access topiped water in thedwelling or in the yard in2001 (58,7%).
Lack of piped water inthe dwelling or yardagain affects mainlyAfrican infants.
Figure 2.24: According to province
EC KZN LP NW MP FS NC GP WC Total0,0
20,0
40,0
60,0
80,0
100,0%
No access to piped water 49,8 38,8 23,8 15,6 16,7 4,9 3,2 2,7 1,9 22,9Piped water: more than 200m from dwelling 12,7 14,9 25,4 19,1 16,9 11,8 7,7 7,7 7,0 14,3Piped water: less than 200m from dwelling 10,7 10,3 16,4 18,8 13,8 14,8 7,9 7,6 6,6 11,6
Piped water inside dwelling/ in yard 26,8 35,9 34,4 46,5 52,6 68,6 81,2 82,0 84,6 51,1
Just under half ofthe infants living inEastern Cape(49,8%) did nothave access topiped water,decreasing witheach successiveprovince shown inthe graph to onlytwo in everyhundred infants(1,9%) in WesternCape.
Infants 1996 2001 Total pop. 1996 2001 All h'holds 1996 20010,0
20,0
40,0
60,0
80,0
100,0%
Piped water in dwelling/ in yard 48,3 51,2 56,8 58,7 60,6 61,3Piped water public source 22,6 25,9 21,1 22,8 20,9 23,9No access to piped water 29,1 22,9 22,2 18,5 18,5 14,8
Source: Census 1996 and 2001
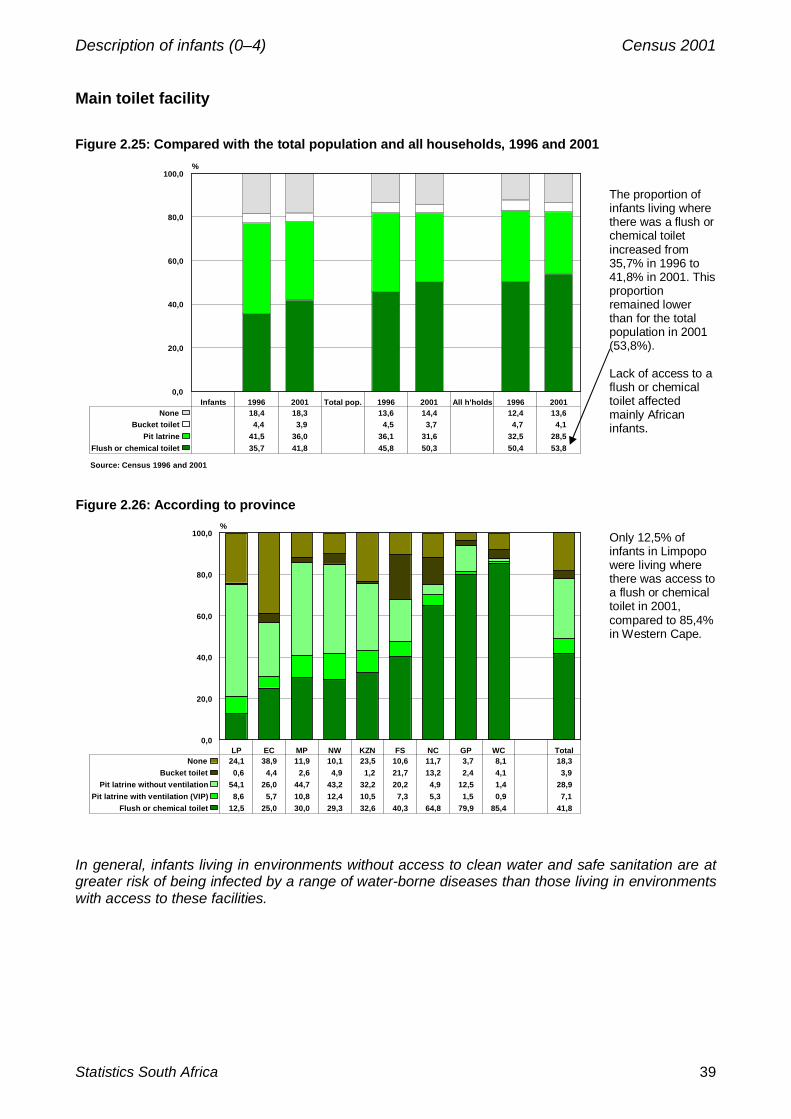
Description of infants (0–4) Census 2001
Statistics South Africa 39
Main toilet facility
Figure 2.25: Compared with the total population and all households, 1996 and 2001
Infants 1996 2001 Total pop. 1996 2001 All h'holds 1996 20010,0
20,0
40,0
60,0
80,0
100,0%
Flush or chemical toilet 35,7 41,8 45,8 50,3 50,4 53,8Pit latrine 41,5 36,0 36,1 31,6 32,5 28,5
Bucket toilet 4,4 3,9 4,5 3,7 4,7 4,1None 18,4 18,3 13,6 14,4 12,4 13,6
Source: Census 1996 and 2001
The proportion ofinfants living wherethere was a flush orchemical toiletincreased from35,7% in 1996 to41,8% in 2001. Thisproportionremained lowerthan for the totalpopulation in 2001(53,8%).
Lack of access to aflush or chemicaltoilet affectedmainly Africaninfants.
Figure 2.26: According to province
LP EC MP NW KZN FS NC GP WC Total0,0
20,0
40,0
60,0
80,0
100,0%
Flush or chemical toilet 12,5 25,0 30,0 29,3 32,6 40,3 64,8 79,9 85,4 41,8Pit latrine with ventilation (VIP) 8,6 5,7 10,8 12,4 10,5 7,3 5,3 1,5 0,9 7,1
Pit latrine without ventilation 54,1 26,0 44,7 43,2 32,2 20,2 4,9 12,5 1,4 28,9Bucket toilet 0,6 4,4 2,6 4,9 1,2 21,7 13,2 2,4 4,1 3,9
None 24,1 38,9 11,9 10,1 23,5 10,6 11,7 3,7 8,1 18,3
Only 12,5% ofinfants in Limpopowere living wherethere was access toa flush or chemicaltoilet in 2001,compared to 85,4%in Western Cape.
In general, infants living in environments without access to clean water and safe sanitation are atgreater risk of being infected by a range of water-borne diseases than those living in environmentswith access to these facilities.

Description of infants (0–4) Census 2001
40 Stages in the life cycle of South Africans
Infants in collective living quartersIn 2001 the vast majority of infants (98,5%) were accommodated in households in housing units.Relatively few were counted elsewhere, but details of these few are given in the next andsubsequent tables.
Table 2.3: Distribution of infants by age, population group and type of living quarters
Collective living quarters
Housing unitResidential
hotelOther
residenceWorkers’
hostel Institution Homeless TotalAge andpopulation group N N N N N N N0 Black African 752 255 1 958 1 037 8 703 2 976 49 766 978
Coloured 79 694 232 109 344 484 26 80 889
Indian or Asian 14 529 87 16 48 58 0 14 739
White 44 698 449 89 170 390 4 45 800
Total 891 176 2 726 1 252 9 264 3 908 80 908 406
1 Black African 720 586 1 860 1 009 7 968 778 33 732 234
Coloured 77 798 215 89 328 206 3 78 640
Indian or Asian 14 452 104 30 42 12 0 14 640
White 44 376 401 69 159 117 3 45 125
Total 857 212 2 580 1 198 8 497 1 113 38 870 638
2 Black African 728 691 1 725 987 6 966 719 20 739 107
Coloured 77 094 202 85 284 150 8 77 822
Indian or Asian 14 504 81 12 37 11 3 14 647
White 45 059 389 94 191 98 0 45 832
Total 865 348 2 396 1 178 7 478 978 31 877 409
3 Black African 729 738 1 739 977 6 277 613 26 739 370
Coloured 74 904 186 107 295 123 3 75 618
Indian or Asian 14 741 98 33 49 12 0 14 933
White 44 755 400 74 150 110 0 45 490
Total 864 138 2 423 1 191 6 771 858 30 875 410
4 Black African 764 947 1 731 965 6 137 690 35 774 505
Coloured 79 145 202 109 293 142 28 79 919
Indian or Asian 15 500 78 15 41 16 0 15 650
White 47 099 376 78 188 121 14 47 877
Total 906 691 2 387 1 168 6 659 969 77 917 952
1-4 Black African 3 696 217 9 013 4 976 36 050 5 776 163 3 752 195
Coloured 388 635 1 036 499 1 544 1 105 68 392 887
Indian or Asian 73 726 448 107 217 109 3 74 609
White 225 988 2 015 405 859 836 22 230 124
Total 4 384 566 12 512 5 986 38 669 7 826 256 4 449 816
Of the total of approximately 65 000 infants not in housing units,• 39 000 were counted in workers’ hostels;• 13 000 were counted in residential hotels;• 8 000 were counted in institutions;• 6 000 were counted in other types of residences; and• there were 256 homeless infants, without shelter.

Description of infants (0–4) Census 2001
Statistics South Africa 41
Infants in collective living quarters (concluded)
Figure 2.27: According to age, population group and sex
Age 0 1 2 3 4
Popu
latio
n gr
oup
Whi
te
Bla
ck A
fric
an
Col
oure
d
Indi
an o
r Asi
an Sex
Mal
e
Fem
ale
Tota
l inf
ants
0,0
0,5
1,0
1,5
2,0%
Residential hotel 0,3 0,3 0,3 0,3 0,3 0,9 0,2 0,3 0,6 0,3 0,3 0,3Non-workers' hostel 0,1 0,1 0,1 0,1 0,1 0,1 0,1 0,1 0,1 0,1 0,1 0,1
Workers' hostel 1,0 1,0 0,9 0,8 0,7 0,4 1,0 0,4 0,3 0,9 0,9 0,9Institution 0,4 0,1 0,1 0,1 0,1 0,4 0,2 0,3 0,1 0,2 0,2 0,2
A slightly higher proportion ofinfants under one year of agewere counted in collective livingquarters, decreasing slowly witheach increase in single-year agecategory.
A larger proportion of whiteinfants than those in otherpopulation groups were countedin collective living quarters,followed by African infants.
Equal proportions of male andfemale infants were counted incollective living quarters.

Description of infants (0–4) Census 2001
42 Stages in the life cycle of South Africans
Infants in institutions
Table 2.4: Number of infants in institutions by population group and type of institution
Population groupTouristhotel
Medicalfacility
Homefor
disabledOrphan-
age
Schoolor otherhostel
Convent,etc.
Defenceforce
barracks
Prison/policecells
Refugeecamp/
communityshelter Total
Black African 76 4 224 778 129 197 50 38 212 71 5 775
Coloured 29 709 169 21 37 91 5 27 17 1 105
Indian or Asian 9 66 8 8 11 0 3 3 0 108
White 144 441 99 16 79 16 5 17 20 837
Total 258 5 440 174 1 054 324 160 51 259 108 7 828
Table 2.4 focuses on the number of infants counted in each type of institution. It showsthat, of the approximately 8 000 infants counted in institutions on census night:
• 5 440 were in a medical facility such as a hospital;• 1 054 were in children’s homes and orphanages;• 324 were in school hostels and other hostels not for workers;• 259 were in prisons or police cells;• 258 were in tourist hotels and related tourist accommodation;• 174 were in homes for the disabled;• 160 were in initiation schools, religious retreats, convents and monasteries;• 108 were in community or church halls, refugee camps and shelters for the
homeless; and• 51 were in defence force barracks or other military accommodation.
Table 2.5: Number of infants in prisons, correctional institutions and police cellsby age, sex and population group
Population group
Age SexBlack
African ColouredIndian or
Asian White Total0 Male 56 10 0 5 71 Female 29 3 0 0 33 Total 85 12 0 7 1041 Male 20 5 0 0 27 Female 16 5 0 3 22 Total 36 10 0 3 492 Male 21 0 0 3 23 Female 29 0 3 0 30 Total 50 0 0 0 533 Male 9 0 0 3 13 Female 8 0 0 0 10 Total 17 3 3 3 234 Male 11 0 0 3 16 Female 13 0 0 0 14 Total 24 3 0 3 300-4 Male 117 19 0 13 150 Female 95 8 3 4 109 Total 212 27 3 17 259
Table 2.5 shows the distribution of infants in prisons, correctional institutions and policecells, in single-year age categories by sex and population group. These infants may havebeen there for various reasons, such as for care-giving, or because they were lost.
Of the 259 infants in detention, 104 (40,2%) were less than one year of age, probablybeing cared for by an arrested or detained parent; 150 (57,9%) were male; and 212(81,9%) were African.

Census 2001
Statistics South Africa 43
Chapter 3: Description of South African childrenThe years between the ages of five and thirteen, or the childhood years, are also fundamentallyimportant for the individual and his or her further physical, intellectual and emotional development.During this period, the child learns basic reading and writing skills, and gains knowledge ofnumbers and their manipulation. Symbols and classification systems are more widely used, andmore abstract explanations may be sought for the events that the child experiences. Gross andfine motor coordination continually improve, and these are further enhanced though physicallychallenging activities (for example, sports and play).
In common with the infant, the type of home in which the child lives, the type of school that he orshe attends, and the ability of both caregivers and the school to provide a secure, yet challengingand stimulating environment, can encourage and enhance, or discourage and slow down thelearning process of the child.
In this chapter, we examine the living conditions and life circumstances of children aged 5–13 inSouth Africa by province, sex, population group, and other appropriate variables, at the time ofCensus 2001, as well as some comparisons, when appropriate, with Census 1996.

Description of children (5–13) Census 2001
44 Stages in the life cycle of South Africans
Demographic picture
Table 3.1: Distribution of children by age, sex and population group
Black African Coloured Indian or Asian White TotalAge and sex N % N % N % N % N %5 Male 407 382 84,0 41 627 8,6 8 899 1,8 27 058 5,6 484 966 100,0 Female 408 173 84,4 40 693 8,4 8 604 1,8 25 960 5,4 483 430 100,0 Total 815 555 84,2 82 320 8,5 17 502 1,8 53 018 5,5 968 396 100,06 Male 399 489 83,9 40 769 8,6 8 848 1,9 27 004 5,7 476 110 100,0 Female 400 060 84,3 40 013 8,4 8 490 1,8 25 921 5,5 474 485 100,0 Total 799 549 84,1 80 783 8,5 17 337 1,8 52 926 5,6 950 595 100,07 Male 412 066 84,3 41 241 8,4 8 774 1,8 26 533 5,4 488 614 100,0 Female 411 355 84,7 40 497 8,3 8 601 1,8 25 125 5,2 485 577 100,0 Total 823 421 84,5 81 737 8,4 17 375 1,8 51 658 5,3 974 191 100,08 Male 395 921 83,8 40 341 8,5 8 630 1,8 27 488 5,8 472 380 100,0 Female 399 855 84,2 40 478 8,5 8 756 1,8 25 999 5,5 475 088 100,0 Total 795 776 84,0 80 819 8,5 17 386 1,8 53 487 5,6 947 468 100,09 Male 421 970 83,8 42 488 8,4 9 408 1,9 29 868 5,9 503 734 100,0 Female 428 892 84,2 42 224 8,3 9 505 1,9 28 549 5,6 509 170 100,0 Total 850 862 84,0 84 713 8,4 18 913 1,9 58 416 5,8 1 012 904 100,010 Male 442 843 83,5 45 263 8,5 10 138 1,9 31 923 6,0 530 167 100,0 Female 444 546 84,0 44 312 8,4 9 762 1,8 30 382 5,7 529 002 100,0 Total 887 389 83,8 89 575 8,5 19 900 1,9 62 305 5,9 1 059 169 100,011 Male 437 469 83,3 45 116 8,6 10 301 2,0 32 565 6,2 525 450 100,0 Female 434 373 83,7 44 030 8,5 9 765 1,9 30 882 5,9 519 049 100,0 Total 871 841 83,5 89 146 8,5 20 065 1,9 63 446 6,1 1 044 499 100,012 Male 405 331 82,9 41 742 8,5 9 995 2,0 31 805 6,5 488 872 100,0 Female 417 805 83,4 42 725 8,5 9 823 2,0 30 766 6,1 501 119 100,0 Total 823 136 83,1 84 466 8,5 19 818 2,0 62 571 6,3 989 991 100,013 Male 407 837 83,0 41 260 8,4 9 886 2,0 32 210 6,6 491 192 100,0 Female 418 274 83,6 41 149 8,2 9 709 1,9 31 089 6,2 500 221 100,0 Total 826 111 83,3 82 408 8,3 19 594 2,0 63 299 6,4 991 413 100,05-13 Male 3 730 307 83,6 379 847 8,5 84 878 1,9 266 453 6,0 4 461 485 100,0 Female 3 763 333 84,1 376 120 8,4 83 014 1,9 254 674 5,7 4 477 141 100,0 Total 7 493 640 83,8 755 967 8,5 167 892 1,9 521 127 5,8 8 938 626 100,0
There were 8,9 million children aged 5–13 years in South Africa on the night of 9–10October 2001, or one in every five (19,9%) of the total population. With some variations,somewhere between 950 000 and one million children were counted in each single-yearage category.
Approximately 84 in every 100 children were African (83,8%), while nine in every hundredwere coloured (8,5%), six in every hundred were white (5,8%), and two in every hundredwere Indian or Asian (1,9%).
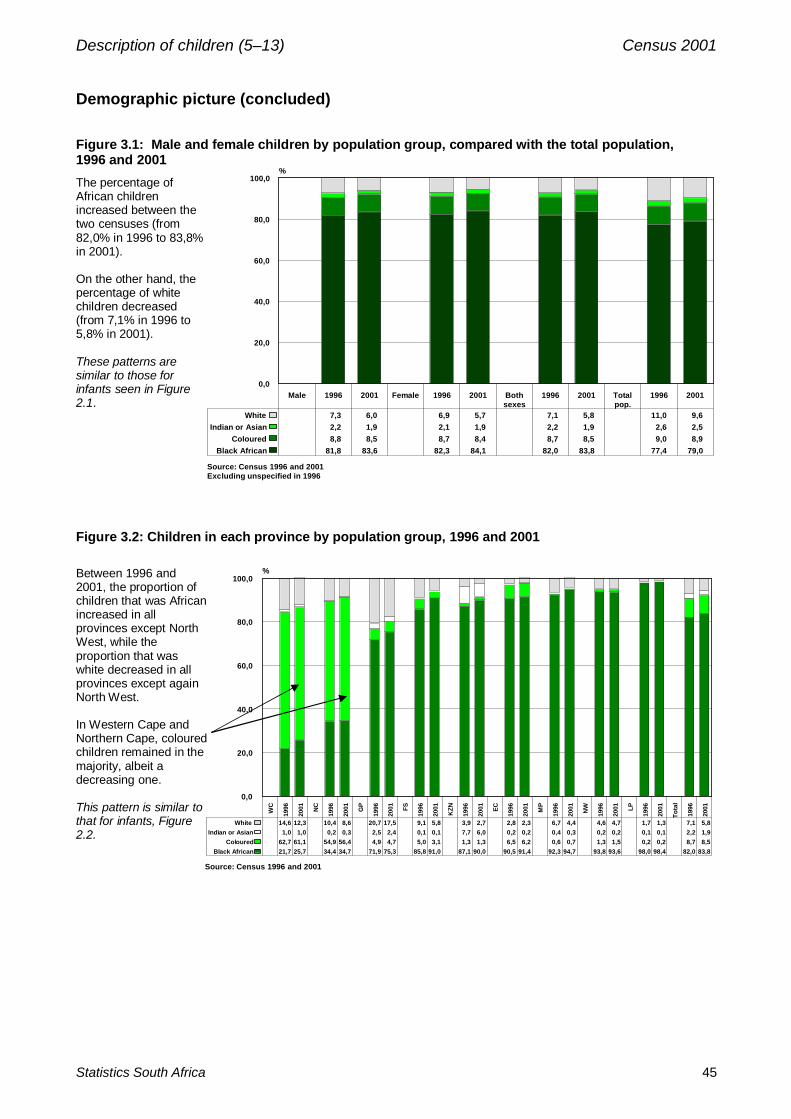
Description of children (5–13) Census 2001
Statistics South Africa 45
Demographic picture (concluded)
Figure 3.1: Male and female children by population group, compared with the total population,1996 and 2001The percentage ofAfrican childrenincreased between thetwo censuses (from82,0% in 1996 to 83,8%in 2001).
On the other hand, thepercentage of whitechildren decreased(from 7,1% in 1996 to5,8% in 2001).
These patterns aresimilar to those forinfants seen in Figure2.1.
Figure 3.2: Children in each province by population group, 1996 and 2001
Between 1996 and2001, the proportion ofchildren that was Africanincreased in allprovinces except NorthWest, while theproportion that waswhite decreased in allprovinces except againNorth West.
In Western Cape andNorthern Cape, colouredchildren remained in themajority, albeit adecreasing one.
This pattern is similar tothat for infants, Figure2.2.
Male 1996 2001 Female 1996 2001 Bothsexes
1996 2001 Totalpop.
1996 20010,0
20,0
40,0
60,0
80,0
100,0%
Black African 81,8 83,6 82,3 84,1 82,0 83,8 77,4 79,0Coloured 8,8 8,5 8,7 8,4 8,7 8,5 9,0 8,9
Indian or Asian 2,2 1,9 2,1 1,9 2,2 1,9 2,6 2,5White 7,3 6,0 6,9 5,7 7,1 5,8 11,0 9,6
Source: Census 1996 and 2001Excluding unspecified in 1996
WC
1996
2001 NC
1996
2001 GP
1996
2001 FS
1996
2001
KZN
1996
2001 EC
1996
2001 MP
1996
2001 NW
1996
2001 LP
1996
2001
Tota
l
1996
2001
0,0
20,0
40,0
60,0
80,0
100,0%
Black African 21,7 25,7 34,4 34,7 71,9 75,3 85,8 91,0 87,1 90,0 90,5 91,4 92,3 94,7 93,8 93,6 98,0 98,4 82,0 83,8Coloured 62,7 61,1 54,9 56,4 4,9 4,7 5,0 3,1 1,3 1,3 6,5 6,2 0,6 0,7 1,3 1,5 0,2 0,2 8,7 8,5
Indian or Asian 1,0 1,0 0,2 0,3 2,5 2,4 0,1 0,1 7,7 6,0 0,2 0,2 0,4 0,3 0,2 0,2 0,1 0,1 2,2 1,9White 14,6 12,3 10,4 8,6 20,7 17,5 9,1 5,8 3,9 2,7 2,8 2,3 6,7 4,4 4,6 4,7 1,7 1,3 7,1 5,8
Source: Census 1996 and 2001
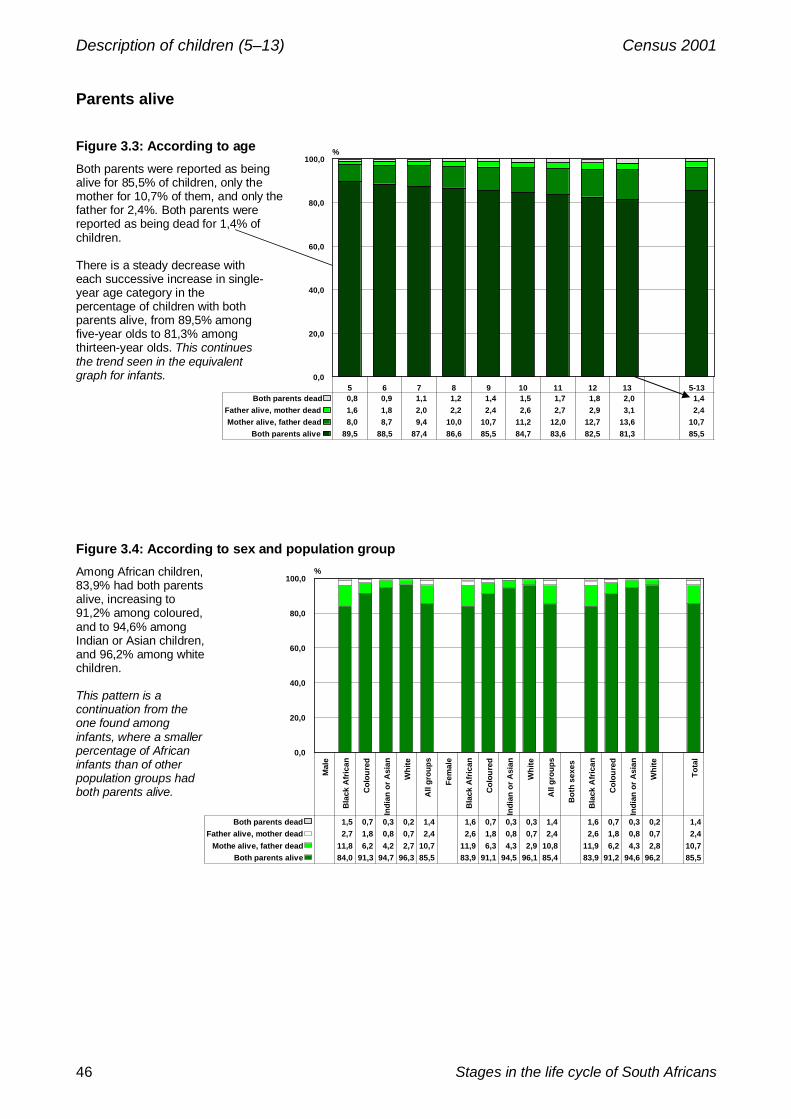
Description of children (5–13) Census 2001
46 Stages in the life cycle of South Africans
Parents alive
Figure 3.3: According to ageBoth parents were reported as beingalive for 85,5% of children, only themother for 10,7% of them, and only thefather for 2,4%. Both parents werereported as being dead for 1,4% ofchildren.
There is a steady decrease witheach successive increase in single-year age category in thepercentage of children with bothparents alive, from 89,5% amongfive-year olds to 81,3% amongthirteen-year olds. This continuesthe trend seen in the equivalentgraph for infants.
Figure 3.4: According to sex and population groupAmong African children,83,9% had both parentsalive, increasing to91,2% among coloured,and to 94,6% amongIndian or Asian children,and 96,2% among whitechildren.
This pattern is acontinuation from theone found amonginfants, where a smallerpercentage of Africaninfants than of otherpopulation groups hadboth parents alive.
5 6 7 8 9 10 11 12 13 5-130,0
20,0
40,0
60,0
80,0
100,0%
Both parents alive 89,5 88,5 87,4 86,6 85,5 84,7 83,6 82,5 81,3 85,5Mother alive, father dead 8,0 8,7 9,4 10,0 10,7 11,2 12,0 12,7 13,6 10,7
Father alive, mother dead 1,6 1,8 2,0 2,2 2,4 2,6 2,7 2,9 3,1 2,4Both parents dead 0,8 0,9 1,1 1,2 1,4 1,5 1,7 1,8 2,0 1,4
Mal
e
Bla
ck A
fric
an
Col
oure
d
Indi
an o
r Asi
an
Whi
te
All
grou
ps
Fem
ale
Bla
ck A
fric
an
Col
oure
d
Indi
an o
r Asi
an
Whi
te
All
grou
ps
Bot
h se
xes
Bla
ck A
fric
an
Col
oure
d
Indi
an o
r Asi
an
Whi
te
Tota
l0,0
20,0
40,0
60,0
80,0
100,0%
Both parents alive 84,0 91,3 94,7 96,3 85,5 83,9 91,1 94,5 96,1 85,4 83,9 91,2 94,6 96,2 85,5Mothe alive, father dead 11,8 6,2 4,2 2,7 10,7 11,9 6,3 4,3 2,9 10,8 11,9 6,2 4,3 2,8 10,7
Father alive, mother dead 2,7 1,8 0,8 0,7 2,4 2,6 1,8 0,8 0,7 2,4 2,6 1,8 0,8 0,7 2,4Both parents dead 1,5 0,7 0,3 0,2 1,4 1,6 0,7 0,3 0,3 1,4 1,6 0,7 0,3 0,2 1,4
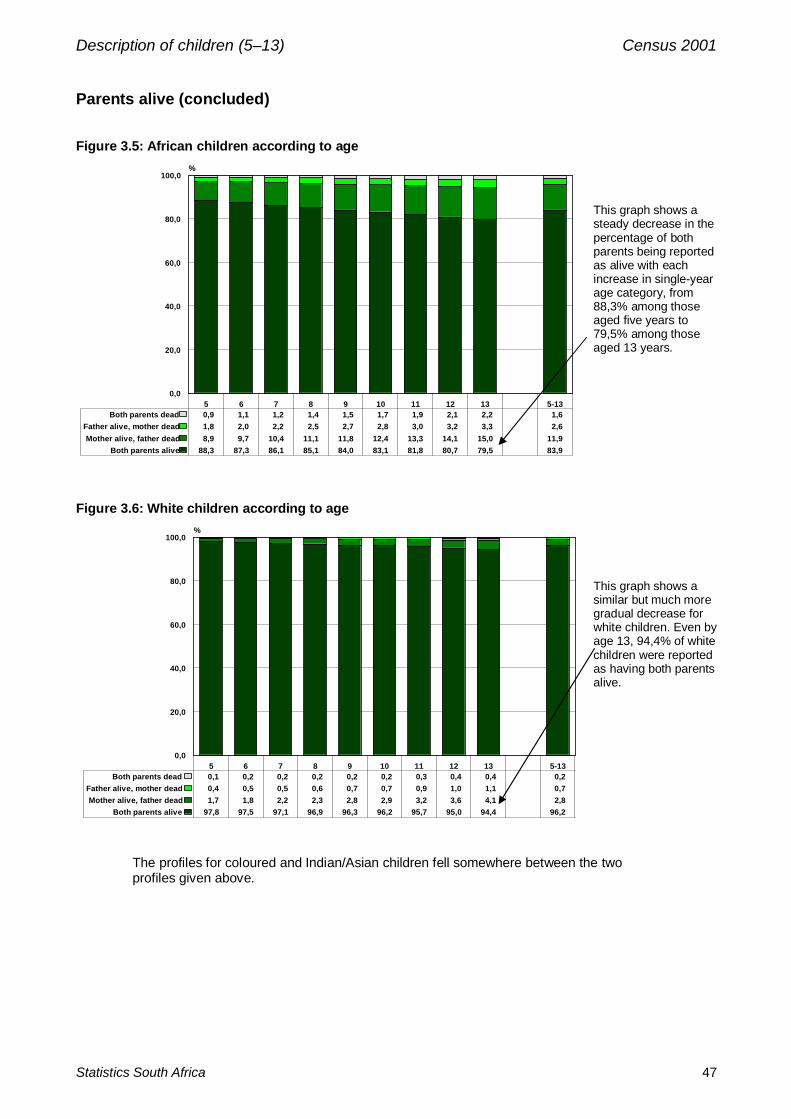
Description of children (5–13) Census 2001
Statistics South Africa 47
Parents alive (concluded)
Figure 3.5: African children according to age
5 6 7 8 9 10 11 12 13 5-130,0
20,0
40,0
60,0
80,0
100,0%
Both parents alive 88,3 87,3 86,1 85,1 84,0 83,1 81,8 80,7 79,5 83,9Mother alive, father dead 8,9 9,7 10,4 11,1 11,8 12,4 13,3 14,1 15,0 11,9
Father alive, mother dead 1,8 2,0 2,2 2,5 2,7 2,8 3,0 3,2 3,3 2,6Both parents dead 0,9 1,1 1,2 1,4 1,5 1,7 1,9 2,1 2,2 1,6
This graph shows asteady decrease in thepercentage of bothparents being reportedas alive with eachincrease in single-yearage category, from88,3% among thoseaged five years to79,5% among thoseaged 13 years.
Figure 3.6: White children according to age
5 6 7 8 9 10 11 12 13 5-130,0
20,0
40,0
60,0
80,0
100,0%
Both parents alive 97,8 97,5 97,1 96,9 96,3 96,2 95,7 95,0 94,4 96,2Mother alive, father dead 1,7 1,8 2,2 2,3 2,8 2,9 3,2 3,6 4,1 2,8
Father alive, mother dead 0,4 0,5 0,5 0,6 0,7 0,7 0,9 1,0 1,1 0,7Both parents dead 0,1 0,2 0,2 0,2 0,2 0,2 0,3 0,4 0,4 0,2
This graph shows asimilar but much moregradual decrease forwhite children. Even byage 13, 94,4% of whitechildren were reportedas having both parentsalive.
The profiles for coloured and Indian/Asian children fell somewhere between the twoprofiles given above.

Description of children (5–13) Census 2001
48 Stages in the life cycle of South Africans
Living with parents
Figure 3.7: Among children whose parents were alive, according to population group and sex
Bla
ck A
fric
an
Mal
e
Fem
ale
Bot
h
Col
oure
d
Mal
e
Fem
ale
Bot
h
Indi
an o
r Asi
an
Mal
e
Fem
ale
Bot
h
Whi
te
Mal
e
Fem
ale
Bot
h
Tota
l
Mal
e
Fem
ale
Bot
h
0,0
20,0
40,0
60,0
80,0
100,0%
Both parents in household 36,5 36,3 36,4 58,8 58,5 58,7 84,1 83,6 83,8 80,2 79,7 80,0 42,4 42,0 42,2 Mother in household not father 31,3 31,7 31,5 24,0 24,3 24,1 8,7 9,2 9,0 12,2 13,0 12,6 28,9 29,3 29,1
Father in household not mother 6,7 6,2 6,4 4,3 4,0 4,1 3,4 3,2 3,3 4,2 3,8 4,0 6,3 5,8 6,0 Neither parent in household 25,5 25,9 25,7 12,9 13,3 13,1 3,8 4,1 3,9 3,4 3,5 3,4 22,4 22,9 22,7
Among African children, both parents were livingin the same household as the child in 36,4% ofcases, while only the mother was living in thesame household as the child in 31,5% of cases,and only the father in 6,4% of cases.
As many as 25,7% of African children were livingin a household where neither parent was present.This is a higher percentage than for infants(17,0%).
Among the children classified as Indian or Asian(83,8%) and white (80,0%), in eight in every tencases or more, both parents were living in the samehousehold as the child.
Among coloured children, however, 58,7% wereliving in the same household as both their parents.

Description of children (5–13) Census 2001
Statistics South Africa 49
Relationship to household head
Figure 3.8: According to ageWhen comparing this profile ofchildren with that of the infants,it seems as if the younger thechild or infant, the more likelyhe or she was to be living witha grandparent or great-grandparent as head ofhousehold.
From the age of 10upwards, we start to noticea small, but increasingproportion of the childrenthemselves being classifiedas the head or acting headof the household, from 0,1%at age 10 years, increasingto 0,4% at age 13.
More than half the children(57,8%) were living in householdswhere they were the children ofthe head or acting head of thehousehold. But another largegroup of children (28,7%) wasliving in households where agrandparent or a great-grandparent was the householdhead, while a smaller group(11,3%) was living with anotherrelative as household head.
With each single-year ageincrease there is a steadyincrease in the percentage ofchildren living in a householdwhere he or she was the child ofthe household head, and acorresponding decrease in thepercentage of children living in ahousehold where a grandparent orgreat-grandparent was householdhead.
There is also a steady increase inthe proportion of children living ina household where a relative otherthan a parent, grandparent orgreat-grandparent was thehousehold head, from 9,0% ofchildren aged five to 13,9% ofchildren aged 13.
Figure 3.9: According to provinceChildren living in the lessindustrialised provinces, suchas Eastern Cape, were morelikely to live in householdswhere the head was agrandparent or a great-grandparent, while those livingin more industrialisedprovinces, such as WesternCape, were more likely to livein households where a parentwas the head.
For example, inEastern Cape, 34,3%of children were livingin households inwhich they were thegrandchildren or thegreat-grandchildren ofthe household head.In Western Cape,17,6% of childrenwere living in suchhouseholds.
EC KZN NW LP NC MP FS GP WC Total0,0
20,0
40,0
60,0
80,0
100,0%
H'hold head 0,1 0,1 0,1 0,2 0,1 0,1 0,1 0,1 0,0 0,1Child 50,3 53,2 53,6 56,2 56,8 58,2 60,2 70,1 71,2 57,8
Grandchild/great-grandchild 34,3 32,9 33,3 28,5 30,3 28,0 27,4 19,7 17,6 28,7Adopted child 1,7 2,3 1,0 1,1 1,8 1,4 1,2 1,5 1,8 1,6Other relative 13,2 11,1 11,9 13,8 10,0 12,0 10,8 8,1 8,1 11,3
Not related 0,4 0,4 0,3 0,2 1,0 0,2 0,3 0,5 1,2 0,4
5 6 7 8 9 10 11 12 13 5-130,0
20,0
40,0
60,0
80,0
100,0%
H'hold head 0,0 0,0 0,0 0,0 0,0 0,1 0,1 0,3 0,4 0,1Child 55,1 55,4 56,0 57,2 57,7 58,1 59,5 60,5 60,9 57,8
Grandchild/great-grandchild 34,2 33,2 32,0 30,2 29,1 28,0 25,8 23,8 22,4 28,7Adopted child 1,3 1,4 1,5 1,6 1,6 1,7 1,7 1,8 1,9 1,6Other relative 9,0 9,5 10,1 10,6 11,2 11,7 12,4 13,1 13,9 11,3
Not related 0,4 0,4 0,4 0,4 0,4 0,4 0,4 0,5 0,5 0,4
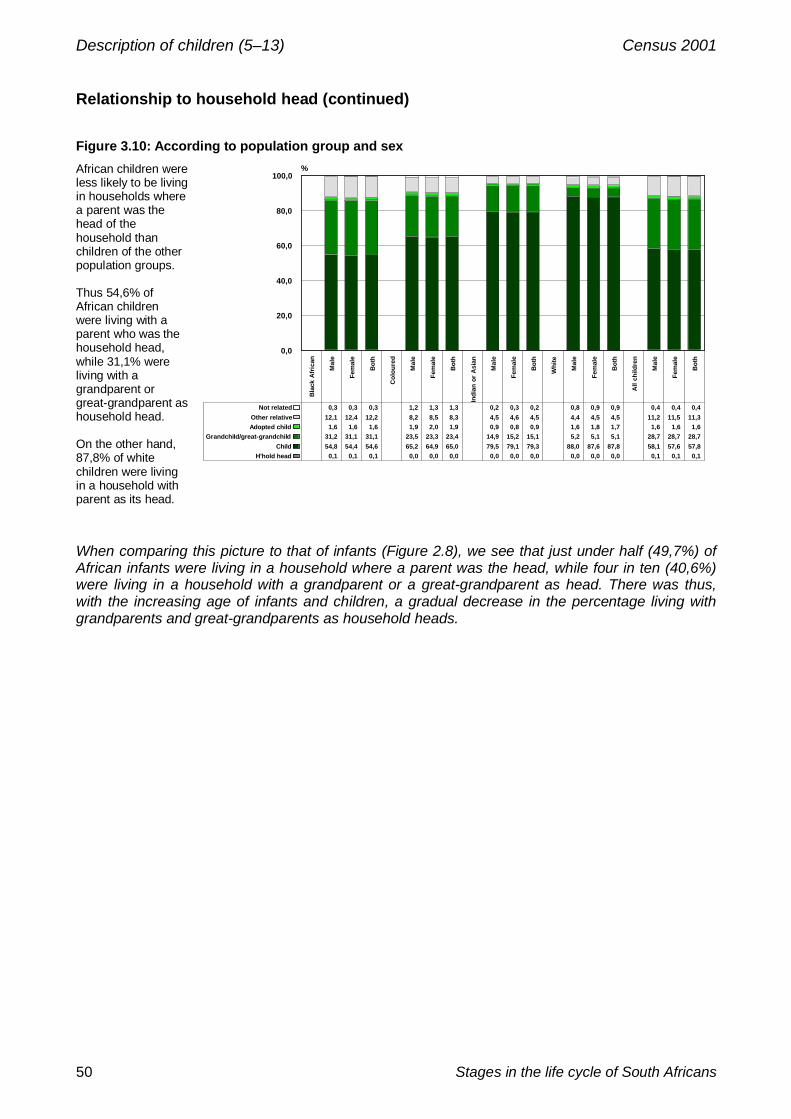
Description of children (5–13) Census 2001
50 Stages in the life cycle of South Africans
Relationship to household head (continued)
Figure 3.10: According to population group and sexAfrican children wereless likely to be livingin households wherea parent was thehead of thehousehold thanchildren of the otherpopulation groups.
Thus 54,6% ofAfrican childrenwere living with aparent who was thehousehold head,while 31,1% wereliving with agrandparent orgreat-grandparent ashousehold head.
On the other hand,87,8% of whitechildren were livingin a household withparent as its head.
Bla
ck A
fric
an
Mal
e
Fem
ale
Bot
h
Col
oure
d
Mal
e
Fem
ale
Bot
h
Indi
an o
r A
sian
Mal
e
Fem
ale
Bot
h
Whi
te
Mal
e
Fem
ale
Bot
h
All
child
ren
Mal
e
Fem
ale
Bot
h
0,0
20,0
40,0
60,0
80,0
100,0%
H'hold head 0,1 0,1 0,1 0,0 0,0 0,0 0,0 0,0 0,0 0,0 0,0 0,0 0,1 0,1 0,1Child 54,8 54,4 54,6 65,2 64,9 65,0 79,5 79,1 79,3 88,0 87,6 87,8 58,1 57,6 57,8
Grandchild/great-grandchild 31,2 31,1 31,1 23,5 23,3 23,4 14,9 15,2 15,1 5,2 5,1 5,1 28,7 28,7 28,7Adopted child 1,6 1,6 1,6 1,9 2,0 1,9 0,9 0,8 0,9 1,6 1,8 1,7 1,6 1,6 1,6Other relative 12,1 12,4 12,2 8,2 8,5 8,3 4,5 4,6 4,5 4,4 4,5 4,5 11,2 11,5 11,3
Not related 0,3 0,3 0,3 1,2 1,3 1,3 0,2 0,3 0,2 0,8 0,9 0,9 0,4 0,4 0,4
When comparing this picture to that of infants (Figure 2.8), we see that just under half (49,7%) ofAfrican infants were living in a household where a parent was the head, while four in ten (40,6%)were living in a household with a grandparent or a great-grandparent as head. There was thus,with the increasing age of infants and children, a gradual decrease in the percentage living withgrandparents and great-grandparents as household heads.
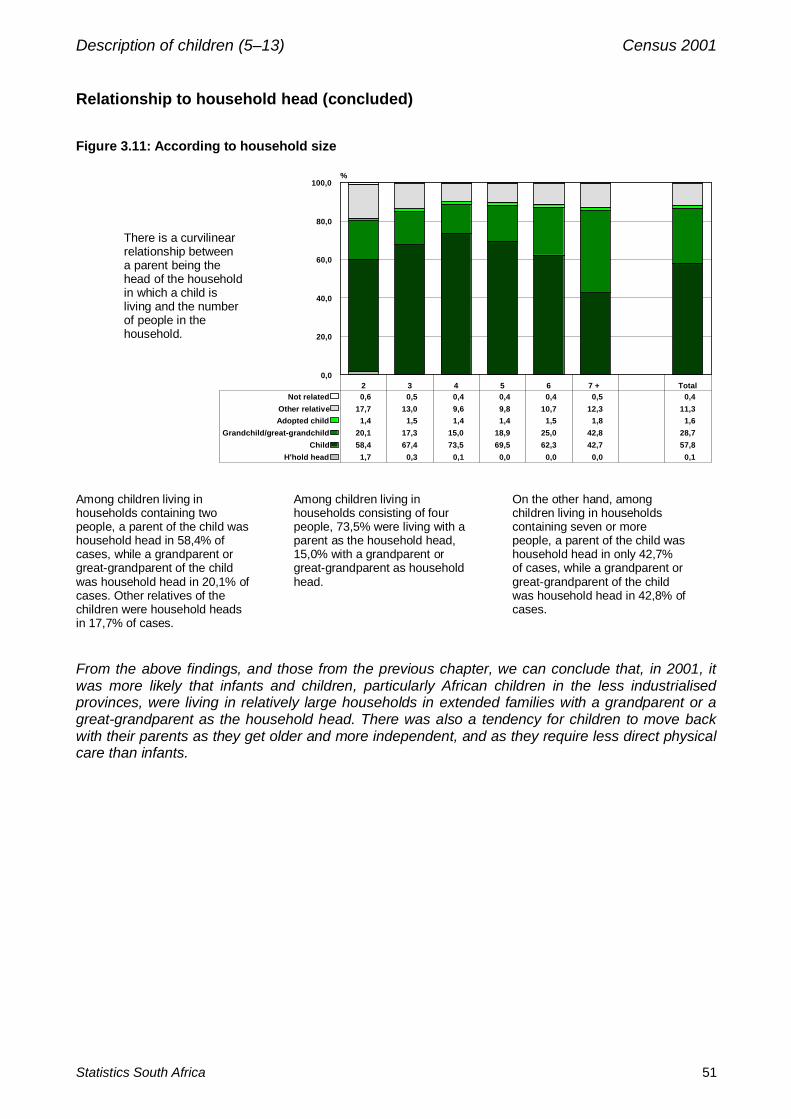
Description of children (5–13) Census 2001
Statistics South Africa 51
Relationship to household head (concluded)
Figure 3.11: According to household size
There is a curvilinearrelationship betweena parent being thehead of the householdin which a child isliving and the numberof people in thehousehold.
Among children living inhouseholds containing twopeople, a parent of the child washousehold head in 58,4% ofcases, while a grandparent orgreat-grandparent of the childwas household head in 20,1% ofcases. Other relatives of thechildren were household headsin 17,7% of cases.
Among children living inhouseholds consisting of fourpeople, 73,5% were living with aparent as the household head,15,0% with a grandparent orgreat-grandparent as householdhead.
On the other hand, amongchildren living in householdscontaining seven or morepeople, a parent of the child washousehold head in only 42,7%of cases, while a grandparent orgreat-grandparent of the childwas household head in 42,8% ofcases.
From the above findings, and those from the previous chapter, we can conclude that, in 2001, itwas more likely that infants and children, particularly African children in the less industrialisedprovinces, were living in relatively large households in extended families with a grandparent or agreat-grandparent as the household head. There was also a tendency for children to move backwith their parents as they get older and more independent, and as they require less direct physicalcare than infants.
2 3 4 5 6 7 + Total0,0
20,0
40,0
60,0
80,0
100,0%
H'hold head 1,7 0,3 0,1 0,0 0,0 0,0 0,1Child 58,4 67,4 73,5 69,5 62,3 42,7 57,8
Grandchild/great-grandchild 20,1 17,3 15,0 18,9 25,0 42,8 28,7Adopted child 1,4 1,5 1,4 1,4 1,5 1,8 1,6Other relative 17,7 13,0 9,6 9,8 10,7 12,3 11,3
Not related 0,6 0,5 0,4 0,4 0,4 0,5 0,4
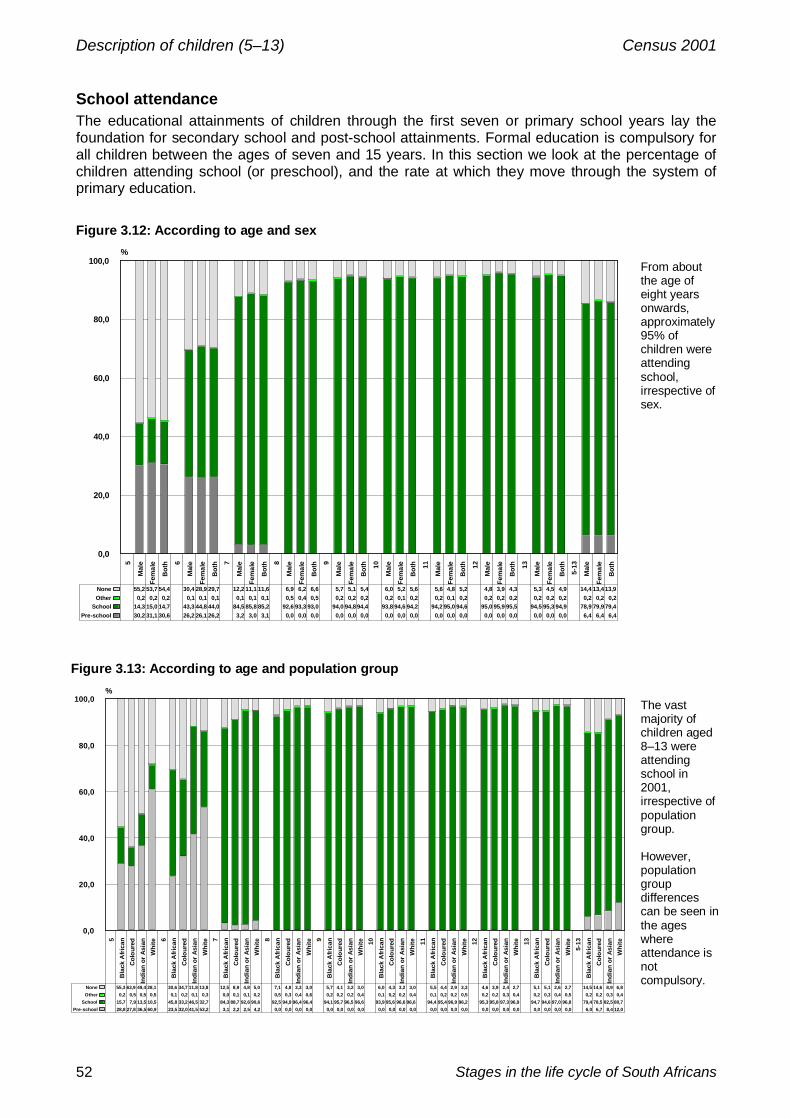
Description of children (5–13) Census 2001
52 Stages in the life cycle of South Africans
School attendanceThe educational attainments of children through the first seven or primary school years lay thefoundation for secondary school and post-school attainments. Formal education is compulsory forall children between the ages of seven and 15 years. In this section we look at the percentage ofchildren attending school (or preschool), and the rate at which they move through the system ofprimary education.
Figure 3.12: According to age and sex
5
Mal
e
Fem
ale
Bot
h 6
Mal
e
Fem
ale
Bot
h 7
Mal
e
Fem
ale
Bot
h 8
Mal
e
Fem
ale
Bot
h 9
Mal
e
Fem
ale
Bot
h 10
Mal
e
Fem
ale
Bot
h 11
Mal
e
Fem
ale
Bot
h 12
Mal
e
Fem
ale
Bot
h 13
Mal
e
Fem
ale
Bot
h
5-13
Mal
e
Fem
ale
Bot
h
0,0
20,0
40,0
60,0
80,0
100,0%
Pre-school 30,2 31,1 30,6 26,2 26,1 26,2 3,2 3,0 3,1 0,0 0,0 0,0 0,0 0,0 0,0 0,0 0,0 0,0 0,0 0,0 0,0 0,0 0,0 0,0 0,0 0,0 0,0 6,4 6,4 6,4School 14,3 15,0 14,7 43,3 44,8 44,0 84,5 85,8 85,2 92,6 93,3 93,0 94,0 94,8 94,4 93,8 94,6 94,2 94,2 95,0 94,6 95,0 95,9 95,5 94,5 95,3 94,9 78,9 79,9 79,4
Other 0,2 0,2 0,2 0,1 0,1 0,1 0,1 0,1 0,1 0,5 0,4 0,5 0,2 0,2 0,2 0,2 0,1 0,2 0,2 0,1 0,2 0,2 0,2 0,2 0,2 0,2 0,2 0,2 0,2 0,2None 55,2 53,7 54,4 30,4 28,9 29,7 12,2 11,1 11,6 6,9 6,2 6,6 5,7 5,1 5,4 6,0 5,2 5,6 5,6 4,8 5,2 4,8 3,9 4,3 5,3 4,5 4,9 14,4 13,4 13,9
From aboutthe age ofeight yearsonwards,approximately95% ofchildren wereattendingschool,irrespective ofsex.
Figure 3.13: According to age and population group
5B
lack
Afri
can
Col
oure
dIn
dian
or A
sian
Whi
te 6B
lack
Afri
can
Col
oure
dIn
dian
or A
sian
Whi
te 7B
lack
Afri
can
Col
oure
dIn
dian
or A
sian
Whi
te 8B
lack
Afri
can
Col
oure
dIn
dian
or A
sian
Whi
te 9B
lack
Afri
can
Col
oure
dIn
dian
or A
sian
Whi
te 10B
lack
Afri
can
Col
oure
dIn
dian
or A
sian
Whi
te 11B
lack
Afri
can
Col
oure
dIn
dian
or A
sian
Whi
te 12B
lack
Afri
can
Col
oure
dIn
dian
or A
sian
Whi
te 13B
lack
Afri
can
Col
oure
dIn
dian
or A
sian
Whi
te5-
13B
lack
Afri
can
Col
oure
dIn
dian
or A
sian
Whi
te
0,0
20,0
40,0
60,0
80,0
100,0%
Pre-school 28,8 27,8 36,5 60,9 23,5 32,0 41,5 53,2 3,1 2,2 2,5 4,2 0,0 0,0 0,0 0,0 0,0 0,0 0,0 0,0 0,0 0,0 0,0 0,0 0,0 0,0 0,0 0,0 0,0 0,0 0,0 0,0 0,0 0,0 0,0 0,0 6,0 6,7 8,4 12,0School 15,7 7,9 13,5 10,5 45,8 33,2 46,5 32,7 84,3 88,7 92,6 90,6 92,5 94,9 96,4 96,4 94,1 95,7 96,5 96,6 93,9 95,6 96,6 96,6 94,4 95,4 96,9 96,2 95,3 95,8 97,3 96,9 94,7 94,6 97,0 96,8 79,4 78,5 82,5 80,7
Other 0,2 0,5 0,5 0,5 0,1 0,2 0,1 0,3 0,0 0,1 0,1 0,2 0,5 0,3 0,4 0,6 0,2 0,2 0,2 0,4 0,1 0,2 0,2 0,4 0,1 0,2 0,2 0,5 0,2 0,2 0,3 0,4 0,2 0,3 0,4 0,5 0,2 0,2 0,3 0,4None 55,3 63,9 49,4 28,1 30,6 34,7 11,8 13,8 12,5 8,9 4,8 5,0 7,1 4,8 3,3 3,0 5,7 4,1 3,2 3,0 6,0 4,3 3,2 3,0 5,5 4,4 2,9 3,3 4,6 3,9 2,4 2,7 5,1 5,1 2,6 2,7 14,5 14,6 8,9 6,8
The vastmajority ofchildren aged8–13 wereattendingschool in2001,irrespective ofpopulationgroup.
However,populationgroupdifferencescan be seen inthe ageswhereattendance isnotcompulsory.

Description of children (5–13) Census 2001
Statistics South Africa 53
Educational attainmentWe now examine the highest level of education that children had completed at a specific age, andthe rate at which they were moving through the school system.
For example, if a child enters school during his or her seventh year, and then completes Grade 1at the age of seven years, and passes every subsequent year, he or she should complete Grade 7at the age of 13. We would therefore expect that, with successful education, the vast majority ofchildren would have completed at least Grade 6 by the age of 13 (i.e. be about to complete Grade7 at the time of the October census).
Figure 3.14: According to age
5 6 7 8 9 10 11 12 130,0
20,0
40,0
60,0
80,0
100,0%
No schooling 84,8 54,9 13,1 5,0 3,4 3,4 2,8 1,8 1,8Grade 1 15,2 42,3 71,0 40,0 16,1 6,4 3,1 1,6 1,0Grade 2 0,0 2,8 12,6 35,7 29,7 14,8 7,9 3,9 2,2Grade 3 0,0 0,0 3,3 16,2 33,3 30,1 18,1 10,3 6,0Grade 4 0,0 0,0 0,0 3,2 14,6 30,2 28,6 18,4 11,9Grade 5 0,0 0,0 0,0 0,0 2,9 12,7 26,3 26,3 18,0Grade 6 0,0 0,0 0,0 0,0 0,0 2,4 11,0 24,9 24,5Grade 7 0,0 0,0 0,0 0,0 0,0 0,0 2,1 10,7 22,9Grade 8 0,0 0,0 0,0 0,0 0,0 0,0 0,0 2,2 9,6Grade 9 0,0 0,0 0,0 0,0 0,0 0,0 0,0 0,0 2,1
Among 13-yearolds, althoughalmost six in everyten children (59,1%)had completed atleast Grade 6, thisstill leaves four inevery ten (40,9%)that had notcompleted Grade 6.
It should be notedthat the category‘no schooling’includes childrenstill in Grade 1 aswell as children stillin pre-school or notyet attending. Thisis evident especiallyfor 5- and 6-year-olds.
Figure 3.15: According to age and sex
5
Mal
e
Fem
ale 6
Mal
e
Fem
ale 7
Mal
e
Fem
ale 8
Mal
e
Fem
ale 9
Mal
e
Fem
ale 10
Mal
e
Fem
ale 11
Mal
e
Fem
ale 12
Mal
e
Fem
ale 13
Mal
e
Fem
ale
0,0
20,0
40,0
60,0
80,0
100,0%
No schooling 85,2 84,5 55,7 54,1 13,7 12,4 5,3 4,6 3,7 3,1 3,7 3,1 3,0 2,5 2,1 1,5 2,0 1,6Grade 1 14,8 15,5 41,7 42,9 71,5 70,4 42,7 37,2 18,5 13,8 7,6 5,1 3,9 2,4 2,0 1,2 1,3 0,8Grade 2 0,0 0,0 2,6 3,0 11,7 13,6 34,7 36,7 31,1 28,2 17,1 12,5 9,6 6,2 4,9 2,9 2,9 1,6Grade 3 0,0 0,0 0,0 0,0 3,1 3,6 14,5 17,9 31,6 35,0 31,3 28,9 20,6 15,7 12,5 8,1 7,7 4,4Grade 4 0,0 0,0 0,0 0,0 0,0 0,0 2,9 3,5 12,7 16,5 27,8 32,6 29,0 28,2 20,5 16,4 14,3 9,6Grade 5 0,0 0,0 0,0 0,0 0,0 0,0 0,0 0,0 2,5 3,3 10,5 14,9 23,2 29,4 25,9 26,6 19,4 16,6Grade 6 0,0 0,0 0,0 0,0 0,0 0,0 0,0 0,0 0,0 0,0 2,0 2,8 9,0 13,1 21,8 27,9 23,5 25,4Grade 7 0,0 0,0 0,0 0,0 0,0 0,0 0,0 0,0 0,0 0,0 0,0 0,0 1,8 2,5 8,6 12,7 19,6 26,1Grade 8 0,0 0,0 0,0 0,0 0,0 0,0 0,0 0,0 0,0 0,0 0,0 0,0 0,0 0,0 1,9 2,5 7,6 11,4Grade 9 0,0 0,0 0,0 0,0 0,0 0,0 0,0 0,0 0,0 0,0 0,0 0,0 0,0 0,0 0,0 0,0 1,7 2,4
A larger proportionof girls than boyshad achievedcertain levels bycertain ages. Forexample, among13-year olds, 65,3%of girls hadcompleted Grade 6or higher, comparedwith 52,4% of boys.

Description of children (5–13) Census 2001
54 Stages in the life cycle of South Africans
Educational attainment (concluded)
Figure 3.16: According to age and population group
5B
lack
Afr
ican
Col
oure
dIn
dian
/Asi
anW
hite 6
Bla
ck A
fric
anC
olou
red
Indi
an/A
sian
Whi
te 7B
lack
Afr
ican
Col
oure
dIn
dian
/Asi
anW
hite 8
Bla
ck A
fric
anC
olou
red
Indi
an/A
sian
Whi
te 9B
lack
Afr
ican
Col
oure
dIn
dian
/Asi
anW
hite 10
Bla
ck A
fric
anC
olou
red
Indi
an/A
sian
Whi
te 11B
lack
Afr
ican
Col
oure
dIn
dian
/Asi
anW
hite 12
Bla
ck A
fric
anC
olou
red
Indi
an/A
sian
Whi
te 13B
lack
Afr
ican
Col
oure
dIn
dian
/Asi
anW
hite
0,0
20,0
40,0
60,0
80,0
100,0%
No schooling Grade 1 Grade 2 Grade 3 Grade 4 Grade 5 Grade 6 Grade 7 Grade 8 Grade 9
Among 13-yearolds, 54,3% ofAfricans hadcompleted at leastGrade 6 (23,6% hadcompleted Grade 6;20,8% Grade 7;8,6% Grade 8; and2,0% Grade 9) astheir highest level ofeducation,compared with74,7% of coloured,88,8% of white and92,8% of Indian orAsian 13-year-olds.
Thus there are variations in the rate at which children move through the education system by bothsex and population group. This may be related to the age at which the child enters the system andthe language of instruction if different from the language spoken at home, but it also probablylargely depends on the quality of teaching received in different schools. Further research isrequired into this issue.

Description of children (5–13) Census 2001
Statistics South Africa 55
Working children (10–13)In the questionnaire for Census 2001, people aged 10 years or more were asked to indicatewhether they had done any work for pay (in cash or in kind), profit or family gain, for one hour ormore, in the week before census night.
While the vast majority of children aged 10–13 years were not engaged in work of this nature,approximately 5 000 in each single-year age category were engaged in such work.
Figure 3.17: Number of working children of each age by broad type of activityFigure 3.17 gives theactual number ofchildren who wereengaged in suchactivities, by type ofactivity. In addition, thesmall number who wereworking, but wereabsent from work duringthe seven days prior toCensus 2001, areindicated.
Figure 3.18: Among children who worked, the number of hours they worked by age
10 11 12 13 10-130,0
20,0
40,0
60,0
80,0
100,0%
1 0,4 0,2 0,3 0,2 0,32-4 0,7 0,8 0,8 1,0 0,85-9 5,3 6,3 5,8 5,3 5,7
10-19 4,5 4,6 4,7 4,6 4,620-39 9,3 8,8 7,7 7,8 8,4
40+ 79,8 79,3 80,7 81,1 80,2
Eight in ten of thechildren who workedwere working fortyhours or more a week.
Thus, while anextremely smallproportion of childrenwere actually working,those who did tended towork for long periods oftime each week,equivalent to full-timeemployment.
Further breakdowns show that of children working in the farming industry, theproportion working at least 40 hours a week reached 88,1%.
10 11 12 130
1 000
2 000
3 000
4 000
5 000
6 000
Formal registered (non-farming) 2 963 2 727 2 595 2 775Informal unregistered (non-farming) 1 043 922 873 1 073
Farming 885 817 875 1 015Temporarily absent from work 186 206 204 199

Description of children (5–13) Census 2001
56 Stages in the life cycle of South Africans
Disability
Table 3.2: Number of disabled children by age, sex and type of disability
Age SexNo
disability Sight HearingCommuni-
cation Physical Intellectual Emotional Multiple
At leastone
disability Total
M 473 927 2 514 2 326 803 1 806 1 417 1 027 1 146 11 039 484 966
5 F 473 808 2 067 2 305 516 1 449 1 372 885 1 028 9 622 483 430
Total 947 735 4 581 4 631 1 319 3 255 2 789 1 911 2 175 20 661 968 396
M 464 343 2 619 2 603 811 1 828 1 561 1 099 1 246 11 767 476 110
6 F 464 439 2 184 2 459 580 1 499 1 440 909 975 10 046 474 485
Total 928 782 4 803 5 062 1 390 3 327 3 000 2 008 2 222 21 812 950 595
M 475 319 2 839 2 928 871 2 005 1 928 1 330 1 394 13 295 488 614
7 F 474 130 2 469 2 829 612 1 633 1 647 1 076 1 180 11 446 485 577
Total 949 449 5 308 5 757 1 483 3 638 3 575 2 407 2 575 24 743 974 191
M 459 021 2 946 2 926 774 1 995 2 015 1 315 1 388 13 359 472 380
8 F 463 646 2 508 2 861 623 1 523 1 694 1 036 1 199 11 444 475 088
Total 922 666 5 454 5 787 1 397 3 518 3 709 2 351 2 587 24 803 947 468
M 489 193 3 306 3 003 841 2 084 2 338 1 451 1 517 14 540 503 734
9 F 496 390 2 871 3 040 605 1 770 2 067 1 144 1 283 12 780 509 170
Total 985 584 6 177 6 044 1 446 3 854 4 405 2 594 2 800 27 320 1 012 904
M 514 566 3 489 3 119 811 2 211 2 757 1 574 1 640 15 601 530 167
10 F 515 331 3 155 3 163 634 1 881 2 187 1 251 1 400 13 671 529 002
Total 1 029 898 6 644 6 282 1 445 4 092 4 943 2 825 3 040 29 271 1 059 169
M 509 361 3 586 3 288 813 2 311 2 795 1 579 1 716 16 088 525 450
11 F 505 073 3 361 3 177 623 1 914 2 220 1 300 1 379 13 974 519 049
Total 1 014 434 6 948 6 466 1 436 4 225 5 016 2 879 3 095 30 065 1 044 499
M 473 524 3 503 3 047 740 2 166 2 694 1 604 1 593 15 347 488 872
12 F 486 816 3 516 3 063 566 1 971 2 328 1 376 1 483 14 303 501 119
Total 960 340 7 020 6 110 1 306 4 137 5 022 2 980 3 076 29 651 989 991
M 475 631 3 642 2 993 763 2 286 2 667 1 582 1 629 15 562 491 192
13 F 485 510 3 757 3 157 607 1 934 2 305 1 365 1 586 14 711 500 221
Total 961 141 7 399 6 151 1 369 4 220 4 972 2 947 3 215 30 273 991 413
M 4 334 886 28 445 26 234 7 227 18 693 20 171 12 561 13 269 126 600 4 461 485
5-13 F 4 365 144 25 888 26 056 5 365 15 573 17 259 10 341 11 514 111 996 4 477 141
Total 8 700 029 54 333 52 289 12 592 34 267 37 430 22 902 24 784 238 597 8 938 626
Of the approximately 8,9 million children aged 5–13 years counted in Census 2001,239 000 (2,7%) were reported as being disabled. Of these, 54 000 (22,8%) had a visualdisability, 52 000 (21,9%) a hearing, 13 000 (5,3%) a communication, 34 000 (14,4%) aphysical, 37 000 (15,7%) an intellectual, and 23 000 (9,6%) an emotional disability, while25 000 (10,4%) had multiple disabilities.

Description of children (5–13) Census 2001
Statistics South Africa 57
Disability (continued)
Figure 3.19: Percentage of children of each age with each type of disability, compared with the totalpopulation
2,1 2,32,5 2,6 2,7 2,8 2,9 3,0 3,1
2,7
5,0
5 6 7 8 9 10 11 12 13 Total Total pop.0,0
1,0
2,0
3,0
4,0
5,0
6,0%
Sight 0,5 0,5 0,5 0,6 0,6 0,6 0,7 0,7 0,8 0,6 1,3Hearing 0,5 0,5 0,6 0,6 0,6 0,6 0,6 0,6 0,6 0,6 0,7
Communication 0,1 0,2 0,2 0,2 0,1 0,1 0,1 0,1 0,1 0,1 0,2Physical 0,3 0,4 0,4 0,4 0,4 0,4 0,4 0,4 0,4 0,4 1,2
Intellectual 0,3 0,3 0,4 0,4 0,4 0,5 0,5 0,5 0,5 0,4 0,5Emotional 0,2 0,2 0,3 0,3 0,3 0,3 0,3 0,3 0,3 0,3 0,6
Multiple 0,2 0,2 0,3 0,3 0,3 0,3 0,3 0,3 0,3 0,3 0,6
There was a steady increase inthe proportion of disabledchildren with each single-yearincrease in age.
Among children aged five years,a total of 2,1% were disabled,increasing to 3,0% among 13-year-olds.
This pattern continues the oneobserved among infants. InFigure 2.13, we saw that 1,1%of all infants younger than oneyear of age was disabled,increasing to 2,0% of infantsaged four years.
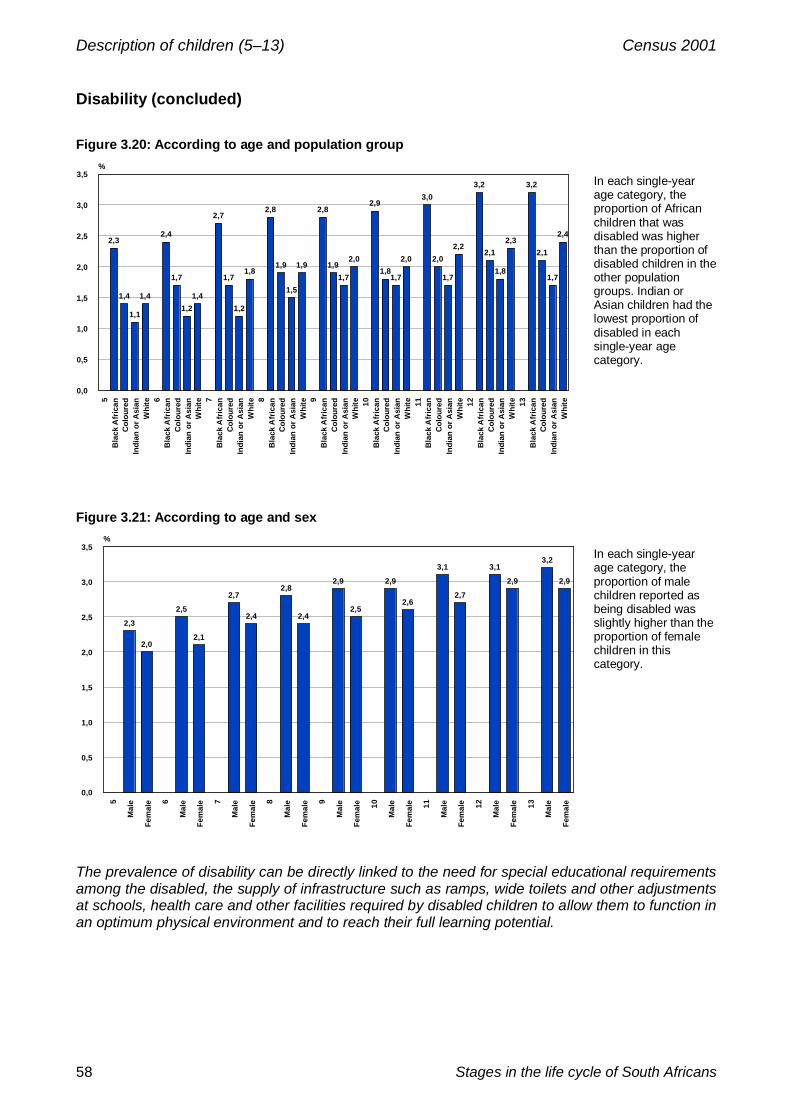
Description of children (5–13) Census 2001
58 Stages in the life cycle of South Africans
Disability (concluded)
Figure 3.20: According to age and population group
2,3
1,4
1,1
1,4
2,4
1,7
1,21,4
2,7
1,7
1,2
1,8
2,8
1,9
1,5
1,9
2,8
1,91,7
2,0
2,9
1,81,7
2,0
3,0
2,0
1,7
2,2
3,2
2,1
1,8
2,3
3,2
2,1
1,7
2,4
5B
lack
Afr
ican
Col
oure
dIn
dian
or A
sian
Whi
te 6B
lack
Afr
ican
Col
oure
dIn
dian
or A
sian
Whi
te 7B
lack
Afr
ican
Col
oure
dIn
dian
or A
sian
Whi
te 8B
lack
Afr
ican
Col
oure
dIn
dian
or A
sian
Whi
te 9B
lack
Afr
ican
Col
oure
dIn
dian
or A
sian
Whi
te 10B
lack
Afr
ican
Col
oure
dIn
dian
or A
sian
Whi
te 11B
lack
Afr
ican
Col
oure
dIn
dian
or A
sian
Whi
te 12B
lack
Afr
ican
Col
oure
dIn
dian
or A
sian
Whi
te 13B
lack
Afr
ican
Col
oure
dIn
dian
or A
sian
Whi
te
0,0
0,5
1,0
1,5
2,0
2,5
3,0
3,5%
In each single-yearage category, theproportion of Africanchildren that wasdisabled was higherthan the proportion ofdisabled children in theother populationgroups. Indian orAsian children had thelowest proportion ofdisabled in eachsingle-year agecategory.
Figure 3.21: According to age and sex
2,3
2,0
2,5
2,1
2,7
2,4
2,8
2,4
2,9
2,5
2,9
2,6
3,1
2,7
3,1
2,9
3,2
2,9
5
Mal
e
Fem
ale 6
Mal
e
Fem
ale 7
Mal
e
Fem
ale 8
Mal
e
Fem
ale 9
Mal
e
Fem
ale 10
Mal
e
Fem
ale 11
Mal
e
Fem
ale 12
Mal
e
Fem
ale 13
Mal
e
Fem
ale
0,0
0,5
1,0
1,5
2,0
2,5
3,0
3,5%
In each single-yearage category, theproportion of malechildren reported asbeing disabled wasslightly higher than theproportion of femalechildren in thiscategory.
The prevalence of disability can be directly linked to the need for special educational requirementsamong the disabled, the supply of infrastructure such as ramps, wide toilets and other adjustmentsat schools, health care and other facilities required by disabled children to allow them to function inan optimum physical environment and to reach their full learning potential.

Description of children (5–13) Census 2001
Statistics South Africa 59
Number of people with whom living
Figure 3.22: According to age, compared with the total population and all households
5 6 7 8 9 10 11 12 13 5-13 Totalpop.
Allh'holds
0,0
20,0
40,0
60,0
80,0
100,0%
On their own 0,0 0,0 0,0 0,0 0,0 0,0 0,0 0,1 0,1 0,0 4,2 18,51 1,8 1,8 1,8 1,8 1,9 2,0 2,1 2,3 2,5 2,0 8,9 18,02 8,8 8,2 7,9 7,7 7,6 7,5 7,8 8,0 8,0 7,9 11,9 15,23 17,5 17,3 16,9 16,8 16,5 15,9 16,1 16,0 15,5 16,5 15,9 15,34 17,1 17,5 17,8 18,1 18,0 17,8 18,2 18,1 17,8 17,8 15,1 11,35 14,4 14,7 15,1 15,3 15,3 15,3 15,6 15,6 15,4 15,2 12,4 7,8
6+ 40,4 40,5 40,5 40,3 40,8 41,4 40,2 39,8 40,7 40,5 31,7 13,8
Four in every ten children aged 5–13 years (40,5%)were living with at least six other people. Thispercentage is similar to the one found among infants.On the other hand, a relatively small but graduallyincreasing proportion of children (from 1,8% amongfive-year olds, increasing to 2,0% among 13-year olds)was living with only one other person.
We also notice a decreasing proportion of childrenliving with two other people with each single-yearincrease in age, from 8,8% among five-year olds,decreasing to 8,0% among 13-year olds.
In addition, we start to see a very small proportion ofchildren aged 12 and 13 living on their own (0,1%).
Figure 3.23: According to population group
Black African Coloured Indian or Asian White Total0,0
20,0
40,0
60,0
80,0
100,0%
On their own 0,0 0,0 0,0 0,0 0,01 2,1 1,3 0,8 2,0 2,02 7,7 7,4 7,2 12,2 7,93 14,2 19,7 28,7 40,7 16,54 16,6 21,9 27,6 25,7 17,85 15,4 16,2 16,9 10,3 15,2
6+ 43,9 33,5 18,9 9,1 40,5
White children were living with fewer people than Indianor Asian, coloured or African children.
Almost forty-four per cent of African children were livingwith at least six other people, decreasing to 33,5% ofcoloured, 18,9% of Indian or Asian and 9,1% of whitechildren.
On the other hand, four in every ten white children(40,7%) were living with three other people, while onein four (25,7%) was living with four other people.

Description of children (5–13) Census 2001
60 Stages in the life cycle of South Africans
Type of dwelling
Figure 3.24: According to age, compared with the total population and all households
5 6 7 8 9 10 11 12 13 5-13 Total pop. All h'holds0,0
20,0
40,0
60,0
80,0
100,0%
Traditional 24,3 24,3 24,6 24,4 24,3 24,4 24,1 23,8 24,2 24,3 18,1 14,8Formal 58,7 59,4 59,5 60,2 60,5 60,7 61,0 61,3 60,9 60,3 62,4 63,8
Informal 12,7 12,1 11,7 11,3 11,1 10,8 10,7 10,6 10,3 11,2 12,8 16,4Backyard 2,9 2,8 2,7 2,7 2,7 2,6 2,6 2,6 2,6 2,7 3,3 4,8
Other 1,3 1,2 1,1 1,1 1,1 1,0 1,1 1,0 1,0 1,1 3,3 0,3Collective 0,1 0,2 0,3 0,3 0,4 0,4 0,5 0,7 1,0 0,4 0,2 n/a
Six in every tenchildren (60,3%)were living in formaldwellings, while24,3% were living intraditional, and11,2% in informaldwellings.
These proportionsdiffer slightly fromthose found amonginfants: 58,4% ofinfants was living informal dwellings,while 22,4% wereliving in traditional,and 14,3% ininformal dwellings.
Figure 3.25: According to population group, compared with the total population and all households
Black African Coloured Indian or Asian White All children Total pop. All h'holds0,0
20,0
40,0
60,0
80,0
100,0%
Traditional 28,6 2,8 1,5 1,1 24,3 18,1 14,8Formal 54,7 86,1 91,6 93,1 60,3 62,4 63,8
Informal 12,7 6,8 1,3 0,4 11,2 12,8 16,4Backyard 2,7 2,6 4,3 2,1 2,7 3,3 4,8
Other 1,1 0,9 1,1 1,5 1,1 0,2 0,3Collective living quarters 0,3 0,8 0,2 1,7 0,4 3,3 n/a
The graph showsthat 28,6% of Africanchildren were livingin a traditionaldwelling, as against1,1% of whitechildren.

Description of children (5–13) Census 2001
Statistics South Africa 61
Type of dwelling (concluded)
Figure 3.26: According to province, compared with the total population and all households
EC KZN LP MP FS NW NC WC GP All children Total pop. All h'holds0,0
20,0
40,0
60,0
80,0
100,0%
Traditional 51,6 40,7 21,7 17,7 9,7 6,5 3,4 2,4 1,4 24,3 18,1 14,8Formal 38,6 47,4 70,6 66,9 63,7 71,9 80,1 79,9 71,3 60,3 62,4 63,8
Informal 6,2 7,1 4,4 11,9 22,9 18,6 11,5 13,6 20,8 11,2 12,8 16,4Backyard 2,5 3,1 1,8 2,0 2,3 1,8 1,7 2,1 4,7 2,7 3,3 4,8
Other 0,7 1,3 1,0 1,4 0,8 0,9 1,5 1,3 1,4 1,1 0,2 0,3Collective 0,3 0,4 0,5 0,2 0,7 0,3 1,8 0,8 0,4 0,4 3,3 n/a
In Eastern Cape,51,6% of childrenwere living intraditional dwellings,compared with 1,4%of children inGauteng.

Description of children (5–13) Census 2001
62 Stages in the life cycle of South Africans
Access to services
Figure 3.27: Main energy source for lighting, compared with total population and all households,1996 and 2001
1996 5 6 7 8 9 10 11 12 13
5-1
3
Tota
l pop
.
All
h'ho
lds
2001 5 6 7 8 9 10 11 12 13
5-1
3
Tota
l pop
.
All
h'ho
lds
0,0
20,0
40,0
60,0
80,0
100,0%
Electricity 48,0 47,7 48,4 48,1 48,6 48,7 49,5 49,7 50,5 48,8 56,2 58,2 63,1 63,8 63,8 64,7 64,9 65,2 65,5 66,0 65,8 64,8 69,8 69,7Paraffin 15,6 15,7 15,6 15,6 15,6 15,6 15,4 15,2 15,0 15,5 13,0 12,7 7,0 6,9 6,9 6,8 6,8 6,8 6,7 6,5 6,6 6,8 6,1 6,8Candles 36,0 36,2 35,6 35,9 35,4 35,2 34,6 34,7 34,0 35,3 30,4 28,7 29,0 28,4 28,4 27,6 27,4 27,1 26,9 26,6 26,7 27,6 23,2 22,7
Other 0,4 0,4 0,4 0,4 0,4 0,4 0,4 0,4 0,4 0,4 0,4 1,5 0,9 0,9 0,9 0,9 0,9 0,9 0,9 0,9 0,9 0,9 0,9 0,8
Source: Census 1996 and 2001
Figure 3.28: Access to piped water, compared with total population and all households, 1996and 2001
1996 5 6 7 8 9 10 11 12 13
5-1
3
Tota
l pop
.
All
h'ho
lds
2001 5 6 7 8 9 10 11 12 13
5-1
3
Tota
l pop
.
All
h'ho
lds
0,0
20,0
40,0
60,0
80,0
100,0%
In dwelling/yard 47,9 47,6 48,1 47,6 47,8 47,9 48,6 48,9 49,5 48,2 56,8 60,6 49,6 49,8 49,5 50,2 50,3 50,5 50,8 51,3 50,8 50,3 58,7 61,3Public source 23,7 23,7 23,6 23,3 23,2 23,0 23,2 22,8 22,5 23,2 21,1 20,9 25,6 25,5 25,5 25,2 25,0 24,8 24,7 24,7 24,6 25,1 22,8 23,9
No access 28,4 28,7 28,3 29,1 29,0 29,1 28,3 28,4 28,0 28,6 22,2 18,5 24,8 24,7 25,0 24,6 24,7 24,6 24,4 24,0 24,5 24,6 18,5 14,8
Source: Census 1996 and 2001

Description of children (5–13) Census 2001
Statistics South Africa 63
Access to services (concluded)
Figure 3.29: Main toilet facility, compared with total population and all households, 1996 and 2001
5 6 7 8 9 10 11 12 13 5-13
Totalpop.
Allh'holds
2001 5 6 7 8 9 10 11 12 13 5-13
Totalpop.
Allh'holds
0,0
20,0
40,0
60,0
80,0
100,0%
Flush or chemical toilet 35,5 35,0 35,3 34,9 35,2 35,5 36,1 36,3 37,3 35,7 45,8 50,4 40,4 40,3 39,8 40,5 40,7 41,1 41,1 41,4 41,0 40,7 50,3 53,8Pit latrine 42,2 42,4 42,5 42,6 42,7 42,4 42,5 42,2 41,5 42,3 36,1 32,5 36,8 37,2 37,6 37,3 37,4 37,1 37,2 37,2 37,4 37,3 31,6 28,5
Bucket toilet 4,4 4,5 4,6 4,5 4,5 4,4 4,5 4,6 4,6 4,5 4,5 4,7 3,6 3,6 3,6 3,6 3,5 3,6 3,6 3,7 3,7 3,6 3,7 4,1None 17,9 18,1 17,6 18,0 17,6 17,7 17,0 16,9 16,6 17,5 13,6 12,4 19,2 18,9 18,9 18,6 18,3 18,2 18,1 17,7 18,0 18,4 14,4 13,6
Source: Census 1996 and 2001
These findings are similar to those for infants. It is largely African children (and infants), particularlythose in the less industrialised provinces, who were less likely to have access to these types ofinfrastructure, even though there had been some improvements between 1996 and 2001.

Description of children (5–13) Census 2001
64 Stages in the life cycle of South Africans
Children in collective living quarters
Table 3.3: Distribution of children by age and type of living quarters
Collective living quartersHousing
unitResidential
hotelOther
residenceWorkers’
hostel Institution Homeless TotalAge N N N N N N N
5 956 821 2 598 1 322 6 555 1 051 49 968 396
6 939 402 2 462 1 241 5 837 1 610 43 950 595
7 962 419 2 398 1 282 5 472 2 560 61 974 191
8 935 874 2 385 1 309 4 779 3 079 43 947 468
9 1 000 311 2 562 1 351 4 871 3 751 58 1 012 904
10 1 045 421 2 525 1 461 4 937 4 727 97 1 059 169
11 1 030 014 2 624 1 364 4 856 5 528 113 1 044 499
12 975 143 2 309 1 360 4 380 6 633 165 989 991
13 973 544 2 367 1 429 4 339 9 517 217 991 413
Total 8 818 950 22 230 12 118 46 025 38 456 846 8 938 626
Overall, as many as 8,8 million of the approximately 8,9 million children (98,7%) wereliving in households in housing units. However, in addition:
• 46 000 children were counted in workers’ hostels;• 38 000 children were counted in institutions;• 22 000 children were counted in residential hotels;• 12 000 children were counted in other types of residences; and• there were 846 homeless children counted, without shelter.
Figure 3.30: Percentage of children in collective living quarters according to age, population groupand sex
Age 5 6 7 8 9 10 11 12 13
Pop.
gro
up
Whi
te
Col
oure
d
Bla
ck A
fric
an
Indi
an/A
sian Se
x
Mal
e
Fem
ale
5-13
0,0
0,5
1,0
1,5
2,0
2,5
3,0%
Other residence 0,1 0,1 0,1 0,1 0,1 0,1 0,1 0,1 0,1 0,1 0,1 0,1 0,1 0,1 0,1 0,1Residential hotel 0,3 0,3 0,2 0,3 0,3 0,2 0,3 0,2 0,2 0,7 0,3 0,2 0,5 0,2 0,3 0,2Workers' hostel 0,7 0,6 0,6 0,5 0,5 0,5 0,5 0,4 0,4 0,4 0,3 0,6 0,2 0,5 0,5 0,5
Institution 0,1 0,2 0,3 0,3 0,4 0,4 0,5 0,7 1,0 1,7 0,8 0,3 0,2 0,4 0,4 0,4
With each increasing single-year age category, with somefluctuations, a slightly higherproportion of children wascounted in collective livingquarters. This is the oppositepattern to that of infants,where we saw a decrease witheach increase in age.
A larger proportion of whitechildren than those in otherpopulation groups was found incollective living quarters,principally in an institution(1,7%), followed by coloured andthen African children.
A slightly higher proportion offemale than male children wascounted in collective livingquarters.

Description of children (5–13) Census 2001
Statistics South Africa 65
Children in institutions
Table 3.4: Number of children in institutions by age and type of institution
AgeTouristhotel
Medicalfacility
Orphan-age
Homefor
disabledSchoolhostel
Convent,etc.
Defenceforce
barracks
Prison/policecells
Refugeecamp/
communityshelter Total
5 32 341 286 95 198 47 4 27 23 1 053
6 44 409 340 142 460 56 3 128 28 1 610
7 85 385 464 177 1 257 113 8 38 32 2 559
8 77 353 524 248 1 655 151 7 37 27 3 079
9 112 410 594 260 2 115 177 8 50 25 3 751
10 198 435 713 304 2 702 225 45 57 48 4 727
11 218 481 898 345 3 151 292 3 80 60 5 528
12 303 550 985 346 3 968 282 14 123 62 6 633
13 399 577 1 042 329 6 402 360 19 302 87 9 517
Total 1 468 3 941 5 846 2 246 21 908 1 703 111 842 391 38 456
This table indicates the number of children of each age counted in each type of institution(as a sub-category of collective living quarters). Of the approximately 38 000 children ininstitutions on census night:
• 22 000 were in school hostels;• 6 000 were in children’s homes and orphanages;• 4 000 were in a medical facility such as a hospital;• 2 000 were in homes for the disabled;• 2 000 were in initiation schools, religious retreats, convents and monasteries;• 1 500 were in tourist hotels and related tourist accommodation;• 842 were in prisons or police cells;• 391 were in community or church halls, refugee camps and shelters for the
homeless; and• 111 were in defence force barracks or other military accommodation.
Table 3.5: Number of children in prisons, correctional institutions and police cellsby age, population group and sex
Black African Coloured Indian or Asian White TotalAge Male Fem. Total Male Fem. Total Male Fem. Total Male Fem. Total Male Fem. Total5 13 11 24 0 3 3 0 0 0 0 0 0 15 12 27
6 25 36 61 13 32 45 0 0 0 7 15 22 45 83 128
7 19 8 27 4 3 5 0 0 0 3 5 6 24 14 38
8 22 9 31 0 0 3 0 0 0 0 0 3 25 12 37
9 31 7 38 4 0 5 0 0 0 5 3 7 40 10 50
10 27 14 41 3 0 3 0 3 3 3 8 11 34 23 57
11 37 26 63 6 3 8 0 0 3 3 7 8 45 35 80
12 70 20 90 16 3 18 0 0 0 7 8 15 93 30 123
13 146 52 198 41 4 45 0 3 4 26 29 55 214 88 302
Total 390 183 573 89 44 133 3 4 7 53 76 129 535 307 842
This table shows the distribution of children in prisons, correctional institutions and policecells, by age, sex and population group. These children may have been there for variousreasons, including being kept in a place of safety or being lost.
• The largest group, or 302 of the 842 children (35,9%) were aged 13 years.• The majority, or 535 of the 842 children, were male (63,5%).• The majority, or 573 of the 842 children, were African (68,1%). This is however a
far smaller proportion than the African proportion of all children aged 5–13 years(83,8%).

Description of children (5–13) Census 2001
66 Stages in the life cycle of South Africans

Census 2001
Statistics South Africa 67
Chapter 4: Description of South African youth and youngadultsThe years between the ages of 14 and 34 are not only a period of further physical, intellectual andemotional development, but also a time of consolidation. During this period, the teenager becomesan adult, with new roles and responsibilities. During this stage, people complete their education.They become economically active; they start to assume new roles and responsibilities in theircommunities; they take up work and develop skills in their new work roles; they may experiencetimes of unemployment, or times devoted to other activity, such as childcare; they develop andconsolidate new relationships; and they may start families of their own. As they proceed throughthis life stage, people assume responsibility, not only for their own life circumstances, butincreasingly, for their dependents (children and aged relatives), who rely on them for their safetyand well-being. They may also start contributing in various ways, financially and otherwise, to thewider society.
In this chapter, we examine the living conditions and life circumstances of the youth in South Africaby province, sex, population group, and other appropriate variables, based on Census 2001, aswell as some comparisons, when appropriate, with Census 1996. When necessary, the data will besplit into two sub-stages, i.e. early youth (14–24 years) and later youth or early adulthood (25–34years). However when the term youth is used without qualification it refers to the entire age group.
Demographic pictureTable 4.1, which spreads over two pages, indicates that 17,5 million people aged 14–34 yearswere counted in South Africa on the night of 9/10 October 2001, or four in ten (39,1%) of the totalpopulation. Of these, 10,3 million people were aged between 14 and 24 (22,9% of the totalpopulation), and 7,3 million were aged between 25 and 34 (16,2%).
With some slight variations, the number of people in each single-year age category between 14and 19 was approximately one million. Thereafter, there was a gradual decline in the number ofpeople of each age, from about 900 000 at age 20 years to about 600 000 at age 34 years.
Approximately 81 in every 100 people in this age group were African (81,0%), while nine in everyhundred were coloured (8,7%), eight in every hundred were white (7,8%), and three in everyhundred were Indian or Asian (2,5%).

Description of youth and young adults (14–34) Census 2001
Stages in the life cycle of South Africans68
Demographic picture (continued)
Table 4:1: Distribution of youth by age, sex and population group
Black African Coloured Indian or Asian White TotalAge Sex N % N % N % N % N %
Male 399 517 82,7 40 502 8,4 10 102 2,1 33 153 6,9 483 275 100,0
14 Female 410 598 83,2 41 180 8,3 9 822 2,0 31 970 6,5 493 571 100,0
Total 810 115 82,9 81 682 8,4 19 924 2,0 65 124 6,7 976 846 100,0
Male 410 253 82,5 41 786 8,4 10 655 2,1 34 511 6,9 497 205 100,0
15 Female 424 224 83,1 42 060 8,2 10 692 2,1 33 621 6,6 510 597 100,0
Total 834 477 82,8 83 845 8,3 21 347 2,1 68 133 6,8 1 007 802 100,0
Male 416 754 81,8 43 515 8,5 11 229 2,2 37 777 7,4 509 275 100,0
16 Female 428 013 82,6 43 496 8,4 11 079 2,1 35 893 6,9 518 482 100,0
Total 844 767 82,2 87 011 8,5 22 308 2,2 73 670 7,2 1 027 757 100,0
Male 393 612 81,5 41 834 8,7 11 259 2,3 36 499 7,6 483 205 100,0
17 Female 409 198 82,0 42 475 8,5 11 169 2,2 35 986 7,2 498 828 100,0
Total 802 810 81,7 84 309 8,6 22 428 2,3 72 485 7,4 982 033 100,0
Male 396 380 81,4 42 225 8,7 11 219 2,3 36 887 7,6 486 711 100,0
18 Female 414 716 82,2 42 822 8,5 10 971 2,2 35 837 7,1 504 345 100,0
Total 811 096 81,8 85 046 8,6 22 190 2,2 72 724 7,3 991 056 100,0
Male 391 511 82,1 39 907 8,4 11 306 2,4 33 958 7,1 476 683 100,0
19 Female 411 599 82,9 41 229 8,3 10 729 2,2 32 833 6,6 496 391 100,0
Total 803 110 82,5 81 136 8,3 22 036 2,3 66 791 6,9 973 073 100,0
Male 368 202 81,7 38 636 8,6 10 873 2,4 33 132 7,3 450 844 100,0
20 Female 380 871 82,3 39 662 8,6 10 658 2,3 31 675 6,8 462 867 100,0
Total 749 073 82,0 78 298 8,6 21 532 2,4 64 807 7,1 913 710 100,0
Male 375 068 82,3 37 620 8,3 10 916 2,4 31 934 7,0 455 538 100,0
21 Female 391 310 83,1 38 514 8,2 10 426 2,2 30 632 6,5 470 882 100,0
Total 766 377 82,7 76 134 8,2 21 342 2,3 62 567 6,8 926 420 100,0
Male 341 909 82,5 33 790 8,2 10 240 2,5 28 374 6,8 414 312 100,0
22 Female 361 393 83,3 34 866 8,0 9 978 2,3 27 571 6,4 433 807 100,0
Total 703 301 82,9 68 655 8,1 20 218 2,4 55 944 6,6 848 119 100,0
Male 314 256 81,8 32 372 8,4 9 855 2,6 27 509 7,2 383 992 100,0
23 Female 338 852 82,8 33 948 8,3 9 478 2,3 26 941 6,6 409 219 100,0
Total 653 108 82,3 66 320 8,4 19 334 2,4 54 450 6,9 793 211 100,0
Male 325 161 82,4 31 269 7,9 9 979 2,5 28 199 7,1 394 608 100,0
24 Female 347 575 83,1 32 985 7,9 9 831 2,3 28 063 6,7 418 455 100,0
Total 672 736 82,7 64 254 7,9 19 810 2,4 56 262 6,9 813 063 100,0
Male 4 132 623 82,1 423 456 8,4 117 633 2,3 361 933 7,2 5 035 648 100,0
Female 4 318 349 82,8 433 237 8,3 114 833 2,2 351 022 6,7 5 217 444 100,0Subtotal14-24
Total 8 450 970 82,4 856 690 8,4 232 469 2,3 712 957 7,0 10 253 090 100,0

Description of youth and young adults (14–34) Census 2001
Statistics South Africa 69
Demographic picture (continued)
Table 4:1: Distribution of youth by age, sex and population group (concluded)
Black African Coloured Indian or Asian White TotalAge Sex N % N % N % N % N %
Male 322 002 81,7 32 093 8,1 10 289 2,6 29 831 7,6 394 216 100,0
25 Female 347 167 82,4 33 574 8,0 10 265 2,4 30 351 7,2 421 357 100,0
Total 669 169 82,0 65 667 8,1 20 554 2,5 60 182 7,4 815 573 100,0
Male 322 469 81,7 32 244 8,2 10 414 2,6 29 611 7,5 394 738 100,0
26 Female 343 784 82,3 33 844 8,1 10 187 2,4 30 136 7,2 417 952 100,0
Total 666 254 82,0 66 088 8,1 20 601 2,5 59 747 7,4 812 691 100,0
Male 302 890 80,6 32 248 8,6 10 301 2,7 30 162 8,0 375 601 100,0
27 Female 327 563 81,2 34 312 8,5 10 333 2,6 31 170 7,7 403 378 100,0
Total 630 452 80,9 66 560 8,5 20 634 2,6 61 333 7,9 778 979 100,0
Male 286 848 79,6 32 509 9,0 9 989 2,8 30 931 8,6 360 277 100,0
28 Female 313 671 80,3 35 196 9,0 9 890 2,5 32 035 8,2 390 792 100,0
Total 600 519 80,0 67 705 9,0 19 879 2,6 62 966 8,4 751 069 100,0
Male 297 079 79,4 33 994 9,1 10 081 2,7 33 139 8,9 374 293 100,0
29 Female 320 696 79,7 37 180 9,2 10 154 2,5 34 305 8,5 402 335 100,0
Total 617 775 79,5 71 174 9,2 20 234 2,6 67 444 8,7 776 628 100,0
Male 244 507 75,8 32 816 10,2 10 445 3,2 34 797 10,8 322 565 100,0
30 Female 263 143 75,9 36 263 10,5 10 405 3,0 36 881 10,6 346 692 100,0
Total 507 650 75,9 69 079 10,3 20 850 3,1 71 678 10,7 669 257 100,0
Male 281 062 78,7 32 119 9,0 9 542 2,7 34 560 9,7 357 284 100,0
31 Female 300 654 78,7 35 557 9,3 9 695 2,5 36 069 9,4 381 975 100,0
Total 581 716 78,7 67 676 9,2 19 237 2,6 70 629 9,6 739 259 100,0
Male 246 700 76,8 31 766 9,9 9 336 2,9 33 244 10,4 321 046 100,0
32 Female 279 115 77,7 35 167 9,8 9 675 2,7 35 471 9,9 359 429 100,0
Total 525 816 77,3 66 933 9,8 19 012 2,8 68 715 10,1 680 475 100,0
Male 246 441 77,5 30 633 9,6 8 653 2,7 32 265 10,1 317 992 100,0
33 Female 273 452 77,7 33 915 9,6 9 363 2,7 34 988 9,9 351 718 100,0
Total 519 893 77,6 64 548 9,6 18 016 2,7 67 253 10,0 669 710 100,0
Male 205 731 74,6 29 101 10,6 8 677 3,1 32 093 11,6 275 602 100,0
34 Female 230 112 75,1 32 723 10,7 9 489 3,1 34 274 11,2 306 598 100,0
Total 435 843 74,9 61 824 10,6 18 166 3,1 66 367 11,4 582 200 100,0
Male 2 755 729 78,9 319 523 9,1 97 727 2,8 320 633 9,2 3 493 614 100,0
Female 2 999 357 79,3 347 731 9,2 99 456 2,6 335 680 8,9 3 782 226 100,0Subtotal25-34
Total 5 755 087 79,1 667 254 9,2 197 183 2,7 656 314 9,0 7 275 841 100,0Male 6 888 352 80,8 742 978 8,7 215 363 2,5 682 566 8,0 8 529 260 100,0
Female 7 317 707 81,3 780 968 8,7 214 290 2,4 686 705 7,6 8 999 669 100,0Total14-34
Total 14 206 059 81,0 1 523 946 8,7 429 654 2,5 1 369 271 7,8 17 528 929 100,0
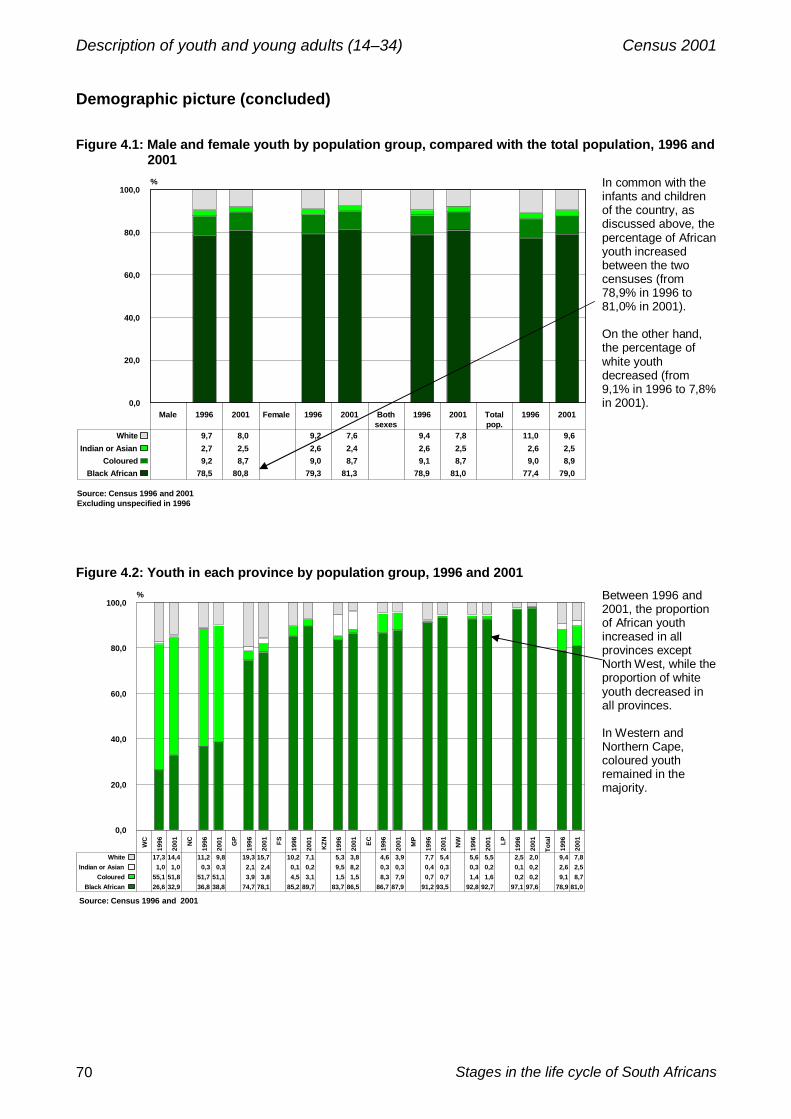
Description of youth and young adults (14–34) Census 2001
Stages in the life cycle of South Africans70
Demographic picture (concluded)
Figure 4.1: Male and female youth by population group, compared with the total population, 1996 and2001
Male 1996 2001 Female 1996 2001 Bothsexes
1996 2001 Totalpop.
1996 20010,0
20,0
40,0
60,0
80,0
100,0%
Black African 78,5 80,8 79,3 81,3 78,9 81,0 77,4 79,0Coloured 9,2 8,7 9,0 8,7 9,1 8,7 9,0 8,9
Indian or Asian 2,7 2,5 2,6 2,4 2,6 2,5 2,6 2,5White 9,7 8,0 9,2 7,6 9,4 7,8 11,0 9,6
Source: Census 1996 and 2001Excluding unspecified in 1996
In common with theinfants and childrenof the country, asdiscussed above, thepercentage of Africanyouth increasedbetween the twocensuses (from78,9% in 1996 to81,0% in 2001).
On the other hand,the percentage ofwhite youthdecreased (from9,1% in 1996 to 7,8%in 2001).
Figure 4.2: Youth in each province by population group, 1996 and 2001
WC
1996
2001 NC
1996
2001 GP
1996
2001 FS
1996
2001
KZN
1996
2001 EC
1996
2001 MP
1996
2001 NW
1996
2001 LP
1996
2001
Tota
l
1996
2001
0,0
20,0
40,0
60,0
80,0
100,0%
Black African 26,6 32,9 36,8 38,8 74,7 78,1 85,2 89,7 83,7 86,5 86,7 87,9 91,2 93,5 92,8 92,7 97,1 97,6 78,9 81,0Coloured 55,1 51,8 51,7 51,1 3,9 3,8 4,5 3,1 1,5 1,5 8,3 7,9 0,7 0,7 1,4 1,6 0,2 0,2 9,1 8,7
Indian or Asian 1,0 1,0 0,3 0,3 2,1 2,4 0,1 0,2 9,5 8,2 0,3 0,3 0,4 0,3 0,3 0,2 0,1 0,2 2,6 2,5White 17,3 14,4 11,2 9,8 19,3 15,7 10,2 7,1 5,3 3,8 4,6 3,9 7,7 5,4 5,6 5,5 2,5 2,0 9,4 7,8
Source: Census 1996 and 2001
Between 1996 and2001, the proportionof African youthincreased in allprovinces exceptNorth West, while theproportion of whiteyouth decreased inall provinces.
In Western andNorthern Cape,coloured youthremained in themajority.

Description of youth and young adults (14–34) Census 2001
Statistics South Africa 71
Parents aliveHaving parents alive in the early stages of youth has different implications to having them alive atlater stages. During the earlier phases, the parents themselves could be the supporters of theirchildren as they move through the education system and start to establish themselves. At laterstages roles may start to be reversed, and some parents may become dependent on their childrenfor support.
Figure 4.3: According to age
14 15 16 17 18 19 20 21 22 23 24 25 26 27 28 29 30 31 32 33 34 14-340,0
20,0
40,0
60,0
80,0
100,0%
Both parents alive 80,4 79,0 77,9 76,7 75,0 73,4 72,0 69,8 67,6 65,8 63,7 61,1 59,0 56,9 54,4 52,2 50,6 47,2 43,9 41,7 40,1 64,2Mother alive, father dead 14,3 15,3 16,1 17,0 18,1 19,2 20,1 21,5 22,9 24,0 25,3 26,7 27,9 29,0 30,2 31,3 31,7 33,3 34,6 35,6 36,0 24,2
Father alive, mother dead 3,2 3,4 3,5 3,7 3,9 4,1 4,3 4,7 4,9 5,1 5,4 5,8 6,0 6,3 6,6 6,8 7,0 7,2 7,4 7,6 7,7 5,2Neither parent alive 2,1 2,3 2,4 2,6 2,9 3,2 3,6 4,1 4,6 5,0 5,6 6,4 7,1 7,9 8,8 9,8 10,7 12,3 14,1 15,1 16,2 6,4
Both parents were reported as being alive for64,2% of youth, while only the mother was reportedas being alive for 24,2% of them, and only thefather for 5,2%. Both parents were reported asbeing dead for 6,4% of youth.
The graph shows a steady decrease with eachsuccessive increase in single-year age category inthe percentage of youth with both parents alive,from 80,4% among 14-year-olds to 40,1% among34-year-olds.
We have already seen in Chapters 2 and 3 that there was a steady decrease in the proportion ofinfants and children with both parents reported as being alive with each single-year increase inage. Thus the trend of losing one or both parents continues through ones youth. But this may varyby population group and sex.
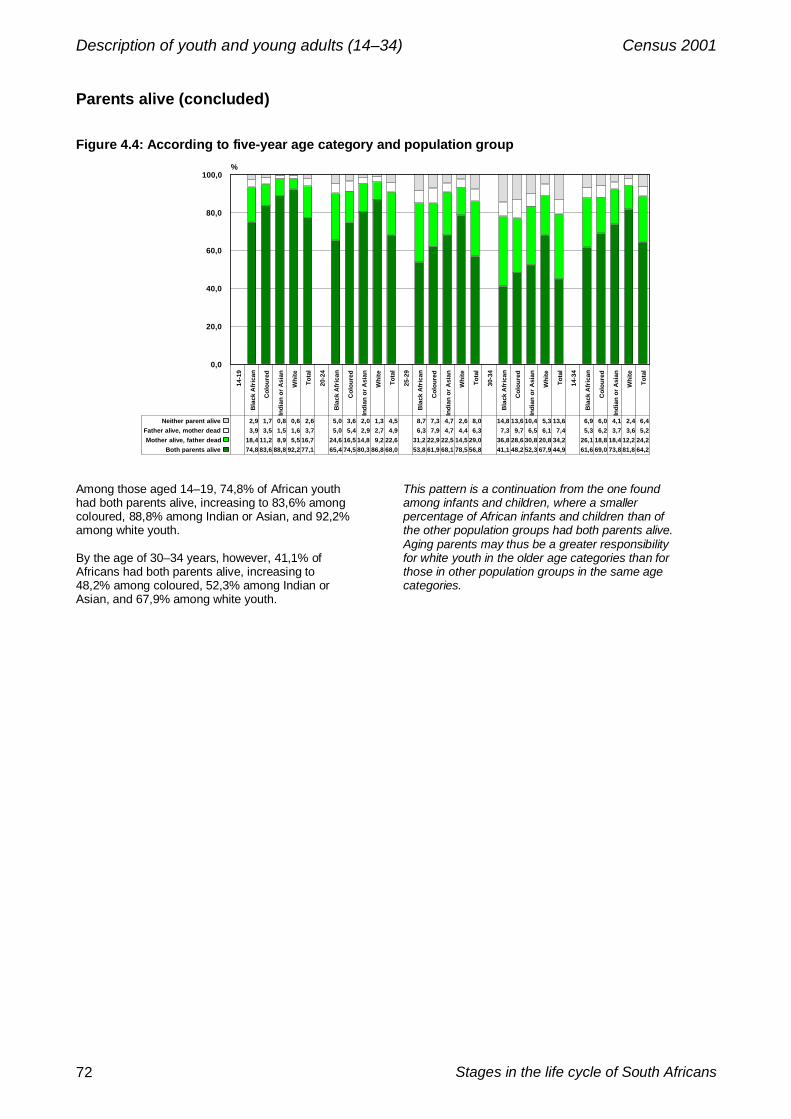
Description of youth and young adults (14–34) Census 2001
Stages in the life cycle of South Africans72
Parents alive (concluded)
Figure 4.4: According to five-year age category and population group
14-1
9
Bla
ck A
fric
an
Col
oure
d
Indi
an o
r Asi
an
Whi
te
Tota
l
20-2
4
Bla
ck A
fric
an
Col
oure
d
Indi
an o
r Asi
an
Whi
te
Tota
l
25-2
9
Bla
ck A
fric
an
Col
oure
d
Indi
an o
r Asi
an
Whi
te
Tota
l
30-3
4
Bla
ck A
fric
an
Col
oure
d
Indi
an o
r Asi
an
Whi
te
Tota
l
14-3
4
Bla
ck A
fric
an
Col
oure
d
Indi
an o
r Asi
an
Whi
te
Tota
l
0,0
20,0
40,0
60,0
80,0
100,0%
Both parents alive 74,8 83,6 88,8 92,2 77,1 65,4 74,5 80,3 86,8 68,0 53,8 61,9 68,1 78,5 56,8 41,1 48,2 52,3 67,9 44,9 61,6 69,0 73,8 81,8 64,2Mother alive, father dead 18,4 11,2 8,9 5,5 16,7 24,6 16,5 14,8 9,2 22,6 31,2 22,9 22,5 14,5 29,0 36,8 28,6 30,8 20,8 34,2 26,1 18,8 18,4 12,2 24,2
Father alive, mother dead 3,9 3,5 1,5 1,6 3,7 5,0 5,4 2,9 2,7 4,9 6,3 7,9 4,7 4,4 6,3 7,3 9,7 6,5 6,1 7,4 5,3 6,2 3,7 3,6 5,2Neither parent alive 2,9 1,7 0,8 0,6 2,6 5,0 3,6 2,0 1,3 4,5 8,7 7,3 4,7 2,6 8,0 14,8 13,6 10,4 5,3 13,6 6,9 6,0 4,1 2,4 6,4
Among those aged 14–19, 74,8% of African youthhad both parents alive, increasing to 83,6% amongcoloured, 88,8% among Indian or Asian, and 92,2%among white youth.
By the age of 30–34 years, however, 41,1% ofAfricans had both parents alive, increasing to48,2% among coloured, 52,3% among Indian orAsian, and 67,9% among white youth.
This pattern is a continuation from the one foundamong infants and children, where a smallerpercentage of African infants and children than ofthe other population groups had both parents alive.Aging parents may thus be a greater responsibilityfor white youth in the older age categories than forthose in other population groups in the same agecategories.

Description of youth and young adults (14–34) Census 2001
Statistics South Africa 73
Living with parents
Figure 4.5: Among youth whose parents were alive, according to five-year age category andpopulation group
14-1
9
Bla
ck A
fric
an
Col
oure
d
Indi
an o
r Asi
an
Whi
te
Tota
l
20-2
4
Bla
ck A
fric
an
Col
oure
d
Indi
an o
r Asi
an
Whi
te
Tota
l
25-2
9
Bla
ck A
fric
an
Col
oure
d
Indi
an o
r Asi
an
Whi
te
Tota
l
30-3
4
Bla
ck A
fric
an
Col
oure
d
Indi
an o
r Asi
an
Whi
te
Tota
l
14-3
4
Bla
ck A
fric
an
Col
oure
d
Indi
an o
r Asi
an
Whi
te
Tota
l
0,0
20,0
40,0
60,0
80,0
100,0%
Both parents in household 35,6 57,6 81,3 72,3 41,7 29,3 48,0 63,9 45,5 33,4 22,2 31,8 38,2 19,7 23,3 16,3 20,6 23,9 9,2 15,9 29,0 44,4 58,3 41,0 32,5
Mother in household not father 27,0 20,6 8,6 13,2 24,9 19,8 16,5 6,5 8,0 18,1 13,7 10,8 4,4 3,7 12,0 9,2 6,9 3,1 2,1 7,7 20,4 15,5 6,3 7,5 18,3
Father in household not mother 6,8 4,4 3,3 5,3 6,4 6,0 3,9 2,7 3,9 5,6 4,2 2,6 2,0 1,7 3,7 2,5 1,7 1,3 0,9 2,1 5,6 3,5 2,5 3,3 5,1
Neither parent in household 30,6 17,4 6,9 9,1 27,0 44,8 31,6 26,9 42,6 42,9 59,9 54,7 55,4 74,8 60,9 72,0 70,9 71,8 87,8 74,3 45,0 36,5 32,9 48,2 44,2
Variation by ageAs expected, the pattern variesby age. Those aged 14–19 weremore likely to be living with atleast one parent than the olderpeople in the youth category,who tend to move out of theirparents’ home.
Thus, in the age group 14–19years, 41,7% of those with bothparents alive were living in thesame household as both theirparents, declining to 15,9%among those aged 30–34 years.
This pattern, however, variesfurther by population group.
Variation by age andpopulation groupIn the youngest age category(those aged 14–19 years),among African youth, bothparents were living in the samehousehold as the youth in35,6% of cases, while only themother was living in the samehousehold as the youth in27,0% of cases, and only thefather in 6,8% of cases. Asmany as 30,6% of African youthwere living in a householdwhere neither parent waspresent.
Among youth aged 14–19classified as Indian or Asian andwhite, however, the vastmajority (81,3% and 72,3%respectively) were living in thesame household as both theirparents. Among coloured youth,57,6% were living in the samehousehold as both parents.
Throughout this life stage but toa decreasing extent withincreasing age, youth classifiedas Indian or Asian, with bothparents alive, were more likelyto be living with their parentsthan those in the otherpopulation groups. From the ageof 25 years onwards, whiteyouth were the least likely to beliving with their parents.

Description of youth and young adults (14–34) Census 2001
Stages in the life cycle of South Africans74
Living with parents (concluded)
Figure 4.6: Among youth whose parents were alive, according to age and sex14
Mal
eFe
mal
e 15M
ale
Fem
ale 16
Mal
eFe
mal
e 17M
ale
Fem
ale 18
Mal
eFe
mal
e 19M
ale
Fem
ale 20
Mal
eFe
mal
e 21M
ale
Fem
ale 22
Mal
eFe
mal
e 23M
ale
Fem
ale 24
Mal
eFe
mal
e 25M
ale
Fem
ale 26
Mal
eFe
mal
e 27M
ale
Fem
ale 28
Mal
eFe
mal
e 29M
ale
Fem
ale 30
Mal
eFe
mal
e 31M
ale
Fem
ale 32
Mal
eFe
mal
e 33M
ale
Fem
ale 34
Mal
eFe
mal
e
0,0
20,0
40,0
60,0
80,0
100,0%
Both parents in household Mother in household not fatherFather in household not mother Neither parent in household
There is a similar pattern among both male and female youth regarding living with parents. Withevery year increase in age, a smaller percentage of youth were living with both or either parent.Girls and young women were slightly less likely to live with their parents than boys and young men.This may in part be explained by the earlier age at which they were getting married, as we shall seein the following section.
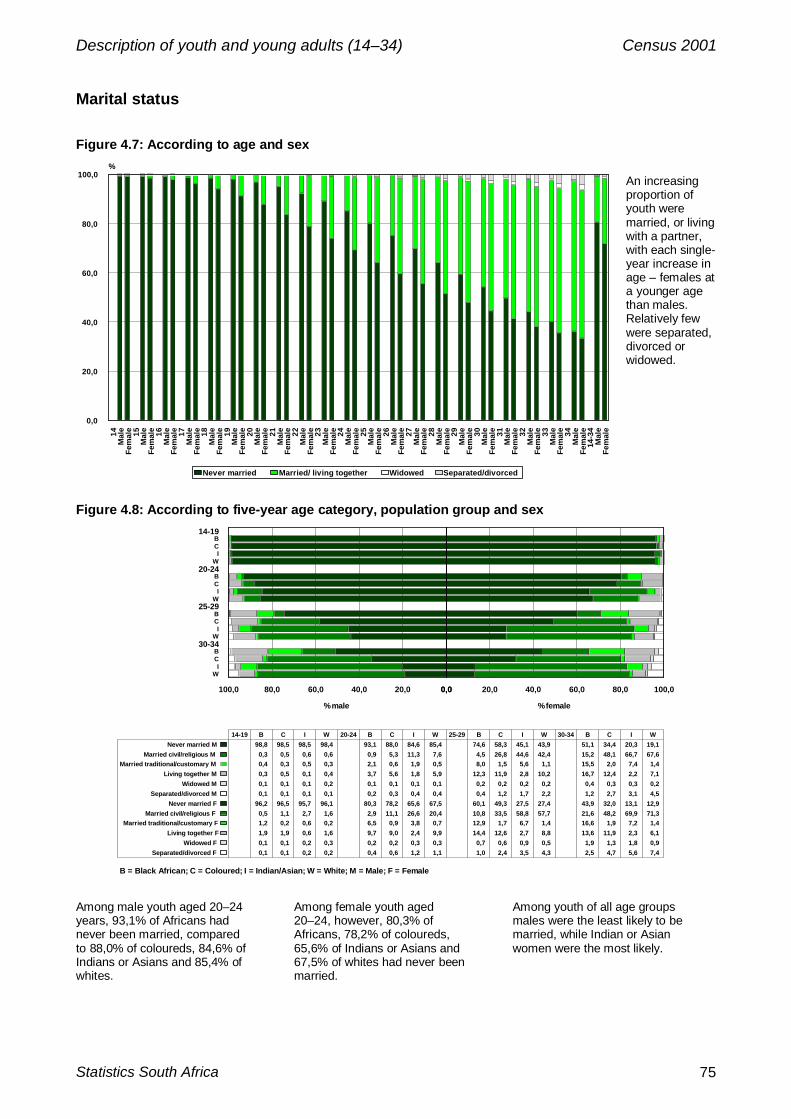
Description of youth and young adults (14–34) Census 2001
Statistics South Africa 75
Marital status
Figure 4.7: According to age and sex
14M
ale
Fem
ale 15
Mal
eFe
mal
e 16M
ale
Fem
ale 17
Mal
eFe
mal
e 18M
ale
Fem
ale 19
Mal
eFe
mal
e 20M
ale
Fem
ale 21
Mal
eFe
mal
e 22M
ale
Fem
ale 23
Mal
eFe
mal
e 24M
ale
Fem
ale 25
Mal
eFe
mal
e 26M
ale
Fem
ale 27
Mal
eFe
mal
e 28M
ale
Fem
ale 29
Mal
eFe
mal
e 30M
ale
Fem
ale 31
Mal
eFe
mal
e 32M
ale
Fem
ale 33
Mal
eFe
mal
e 34M
ale
Fem
ale
14-3
4M
ale
Fem
ale
0,0
20,0
40,0
60,0
80,0
100,0%
Never married Married/ living together Widowed Separated/divorced
An increasingproportion ofyouth weremarried, or livingwith a partner,with each single-year increase inage – females ata younger agethan males.Relatively fewwere separated,divorced orwidowed.
Figure 4.8: According to five-year age category, population group and sex
B = Black African; C = Coloured; I = Indian/Asian; W = White; M = Male; F = Female
14-19BCI
W20-24
BCI
W25-29
BCI
W30-34
BCI
W
0,020,040,060,080,0100,0
% male
0,0 20,0 40,0 60,0 80,0 100,0
% female
14-19 B C I W 20-24 B C I W 25-29 B C I W 30-34 B C I WNever married M 98,8 98,5 98,5 98,4 93,1 88,0 84,6 85,4 74,6 58,3 45,1 43,9 51,1 34,4 20,3 19,1
Married civil/religious M 0,3 0,5 0,6 0,6 0,9 5,3 11,3 7,6 4,5 26,8 44,6 42,4 15,2 48,1 66,7 67,6Married traditional/customary M 0,4 0,3 0,5 0,3 2,1 0,6 1,9 0,5 8,0 1,5 5,6 1,1 15,5 2,0 7,4 1,4
Living together M 0,3 0,5 0,1 0,4 3,7 5,6 1,8 5,9 12,3 11,9 2,8 10,2 16,7 12,4 2,2 7,1Widowed M 0,1 0,1 0,1 0,2 0,1 0,1 0,1 0,1 0,2 0,2 0,2 0,2 0,4 0,3 0,3 0,2
Separated/divorced M 0,1 0,1 0,1 0,1 0,2 0,3 0,4 0,4 0,4 1,2 1,7 2,2 1,2 2,7 3,1 4,5Never married F 96,2 96,5 95,7 96,1 80,3 78,2 65,6 67,5 60,1 49,3 27,5 27,4 43,9 32,0 13,1 12,9
Married civil/religious F 0,5 1,1 2,7 1,6 2,9 11,1 26,6 20,4 10,8 33,5 58,8 57,7 21,6 48,2 69,9 71,3Married traditional/customary F 1,2 0,2 0,6 0,2 6,5 0,9 3,8 0,7 12,9 1,7 6,7 1,4 16,6 1,9 7,2 1,4
Living together F 1,9 1,9 0,6 1,6 9,7 9,0 2,4 9,9 14,4 12,6 2,7 8,8 13,6 11,9 2,3 6,1Widowed F 0,1 0,1 0,2 0,3 0,2 0,2 0,3 0,3 0,7 0,6 0,9 0,5 1,9 1,3 1,8 0,9
Separated/divorced F 0,1 0,1 0,2 0,2 0,4 0,6 1,2 1,1 1,0 2,4 3,5 4,3 2,5 4,7 5,6 7,4
Among male youth aged 20–24years, 93,1% of Africans hadnever been married, comparedto 88,0% of coloureds, 84,6% ofIndians or Asians and 85,4% ofwhites.
Among female youth aged20–24, however, 80,3% ofAfricans, 78,2% of coloureds,65,6% of Indians or Asians and67,5% of whites had never beenmarried.
Among youth of all age groupsmales were the least likely to bemarried, while Indian or Asianwomen were the most likely.

Description of youth and young adults (14–34) Census 2001
Stages in the life cycle of South Africans76
Women who had given birth
Figure 4.9: According to age by the number of children to whom they had given birth
14 15 16 17 18 19 20 21 22 23 24 25 26 27 28 29 30 31 32 33 34 14-340,0
20,0
40,0
60,0
80,0
100,0%
0 99,0 97,2 93,5 86,9 78,2 69,5 61,5 53,6 45,3 39,5 34,1 29,5 25,4 22,0 19,0 16,7 15,4 13,2 11,4 10,2 9,5 44,91 0,9 2,5 6,1 12,2 20,0 27,0 32,5 36,9 40,4 41,5 41,5 40,3 38,4 36,0 33,1 30,0 27,3 24,0 20,9 18,8 17,2 26,42 0,1 0,2 0,3 0,7 1,5 3,0 5,1 8,1 11,8 15,2 18,7 22,0 25,0 27,3 29,1 30,3 30,9 30,8 30,3 29,4 29,1 16,33 0,0 0,1 0,1 0,1 0,2 0,3 0,6 1,0 1,9 2,9 4,4 6,2 8,3 10,4 12,7 14,9 16,3 18,5 20,1 21,3 21,8 7,44 0,0 0,0 0,0 0,1 0,1 0,1 0,2 0,2 0,4 0,6 0,9 1,4 2,2 3,0 4,3 5,5 6,5 8,4 10,1 11,4 12,2 3,05 0,0 0,0 0,0 0,0 0,1 0,1 0,1 0,1 0,1 0,2 0,2 0,3 0,5 0,8 1,2 1,7 2,3 3,3 4,3 5,1 5,7 1,26 0,0 0,0 0,0 0,0 0,0 0,0 0,1 0,1 0,1 0,1 0,1 0,1 0,2 0,2 0,4 0,5 0,8 1,2 1,8 2,3 2,6 0,5
7+ 0,0 0,0 0,0 0,0 0,0 0,0 0,0 0,0 0,0 0,1 0,1 0,1 0,1 0,2 0,2 0,3 0,5 0,7 1,2 1,5 1,9 0,3
Excluding invalid responses
At the age of 14 years, almost all(99,0%) women had never givenbirth, but by the age of 34, onlyone in ten (9,5%) had nevergiven birth.
This graph also indicates thepercentage of teenage women insingle-year age categories whohad given birth to at least onechild. At age 14, 1,0% had givenbirth to at least one child; but atage 15, 2,8% had done so,increasing to 6,5% at age 16;then to 13,1% at 17; to 21,9% at18; and to 30,5% at the age of19.
Regarding giving birth to one ormore children, at the age of 34years, 10,2% of women hadgiven birth to five or morechildren, while 12,2% had givenbirth to four, 21,8% to three,29,1% to two and 17,2% to onechild.

Description of youth and young adults (14–34) Census 2001
Statistics South Africa 77
Women who had given birth (continued)The model of the conventional nuclear family, consisting of a married couple and their children, isreally not an appropriate one to describe relationships and family structures among South Africa’syouth. There is a great deal of variation in family structures.
Figure 4.10: According to age by marital status
14 15 16 17 18 19 20 21 22 23 24 25 26 27 28 29 30 31 32 33 34 14-340,0
20,0
40,0
60,0
80,0
100,0%
Never married 88,3 88,0 88,1 85,8 83,0 79,8 76,6 72,0 68,3 63,9 60,5 56,0 52,4 48,8 45,4 42,0 38,8 36,2 33,6 31,4 29,4 50,2Married civil/religious 2,8 1,9 1,3 1,6 2,1 2,8 3,9 5,3 7,0 9,2 11,2 14,3 16,8 20,0 23,1 25,9 30,3 30,8 33,5 35,2 38,3 20,7
Married traditional/customary 3,0 3,2 3,2 4,1 5,1 6,0 7,0 8,3 9,3 10,5 11,5 12,4 13,2 13,6 13,9 14,5 13,5 15,2 14,8 15,4 14,5 12,4Living together 5,3 6,3 6,8 7,9 9,3 10,8 11,8 13,6 14,4 15,2 15,5 15,7 15,7 15,3 14,8 14,5 13,4 13,3 12,8 12,0 11,1 13,7
Widowed 0,3 0,3 0,2 0,1 0,2 0,2 0,2 0,2 0,3 0,3 0,4 0,5 0,6 0,7 0,9 1,0 1,3 1,5 1,9 2,1 2,5 1,0Separated/divorced 0,4 0,4 0,3 0,5 0,4 0,4 0,4 0,6 0,7 0,8 0,9 1,2 1,4 1,5 1,8 2,1 2,7 2,9 3,5 3,8 4,3 2,0
Excluding invalid responses
Half (50,2%) the women who had given birth to atleast one child had never been married. Thepercentage of women who had given birth to atleast one child and who had never been marrieddecreased with each single-year increase in age,from 88,3% at age 14 to 29,4% at age 34.
Among women who had given birth to at least onechild, 13,7% was living together with a partnerwithout being married. This percentage wasrelatively low at age 14 at 5,3%, but increasing witheach successive increase in single-year agecategory, to reach a peak of 15,7% at ages 25 and26 years. Then there was a gradual decrease toreach 11,1% at the age of 34.

Description of youth and young adults (14–34) Census 2001
Stages in the life cycle of South Africans78
Women who had given birth (concluded)
Figure 4.11: According to five-year age category and population group by marital status
14-1
9
Bla
ck A
fric
an
Colo
ured
Indi
an o
r Asi
an
Whi
te
Tota
l
20-2
4
Bla
ck A
fric
an
Colo
ured
Indi
an o
r Asi
an
Whi
te
Tota
l
25-2
9
Bla
ck A
fric
an
Colo
ured
Indi
an o
r Asi
an
Whi
te
Tota
l
30-3
4
Bla
ck A
fric
an
Colo
ured
Indi
an o
r Asi
an
Whi
te
Tota
l
14-3
4
Bla
ck A
fric
an
Colo
ured
Indi
an o
r Asi
an
Whi
te
Tota
l
0,0
20,0
40,0
60,0
80,0
100,0%
Never married 83,7 82,3 31,2 48,4 82,8 69,7 64,1 12,0 19,1 67,3 53,3 40,1 5,2 6,3 48,6 39,5 26,2 3,1 3,1 33,9 55,1 42,6 5,7 6,5 50,2
Married civil/religious 1,2 5,5 48,3 30,5 2,2 4,3 18,6 70,5 61,6 7,8 13,0 40,0 78,1 79,3 20,2 23,8 53,3 79,1 82,2 33,5 13,5 38,3 76,9 78,2 20,7
Married traditional/customary 5,5 0,9 8,1 1,7 5,0 10,6 1,4 9,6 1,9 9,6 15,6 1,9 8,7 1,8 13,5 18,1 2,0 7,8 1,5 14,7 14,4 1,8 8,4 1,7 12,4
Living together 9,1 10,8 9,6 16,9 9,3 14,5 14,7 3,7 13,1 14,3 16,2 14,5 2,2 6,3 15,2 13,9 12,2 2,1 4,6 12,6 14,5 13,4 2,5 6,2 13,7
Widowed 0,2 0,1 0,7 0,8 0,2 0,3 0,2 0,7 0,6 0,3 0,8 0,6 1,1 0,6 0,7 2,0 1,3 2,0 0,9 1,9 1,0 0,8 1,4 0,8 1,0
Separated/divorced 0,4 0,3 2,1 1,6 0,4 0,6 1,0 3,6 3,8 0,7 1,2 2,8 4,7 5,8 1,6 2,6 5,0 5,9 7,7 3,4 1,5 3,1 5,1 6,6 2,0
Excluding invalid responses
African women who had givenbirth to at least one child weremost likely never to have beenmarried, as against coloured,white and Indian or Asianwomen.
For example, among Africanwomen aged 14–19 who hadgiven birth, 83,7% had neverbeen married. This decreased to69,7% among those aged 20–24, to 53,3% among those aged25–29 and then to 39,5%among those aged 30–34.
Among Indian or Asian womenwho had given birth, however,while the trend is similar, thepercentage in each agecategory that was never marriedis far lower. Thus, among Indianor Asian women, 31,2% of thoseaged 14–19 had never beenmarried, decreasing to 12,0% ofthose aged 20–24, 5,2% ofthose aged 25–29 and 3,1% ofthose aged 30–34.
The life circumstances of those women who had given birth but had never married, and theirchildren, and the differences from the more conventional arrangements should be taken intoaccount in planning, for example planning for poverty alleviation, and for ensuring women’s andchildren’s rights.
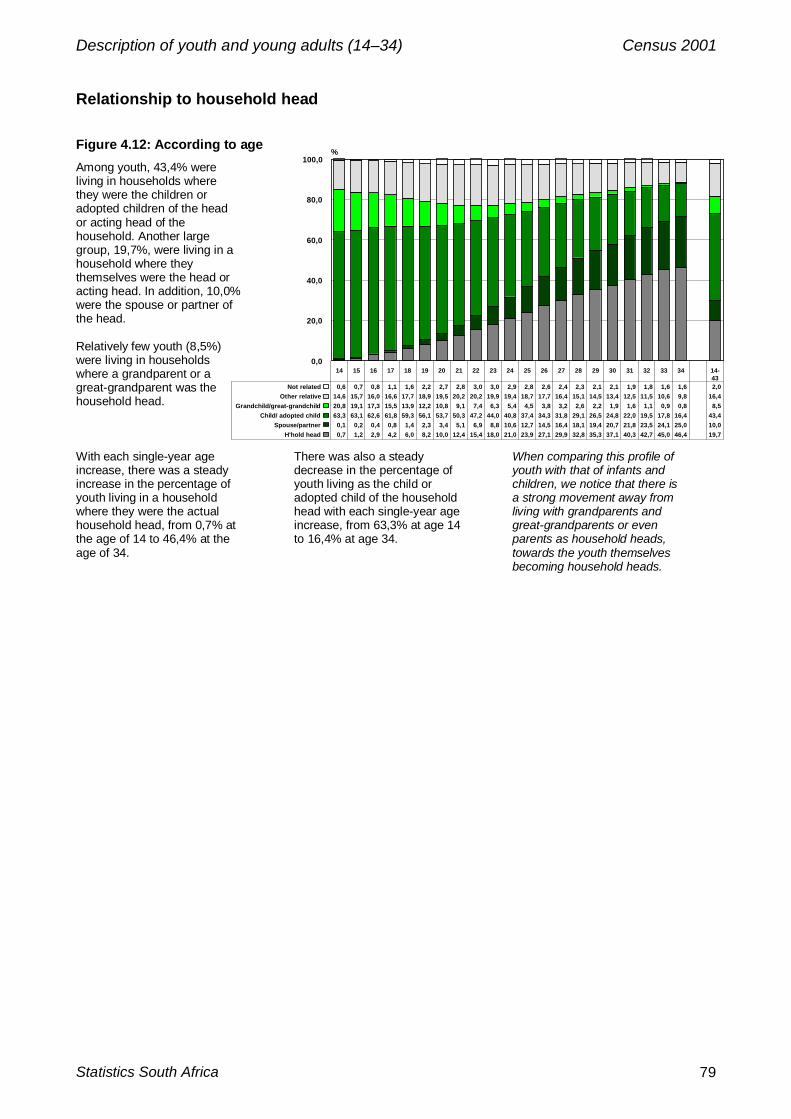
Description of youth and young adults (14–34) Census 2001
Statistics South Africa 79
Relationship to household head
Figure 4.12: According to ageAmong youth, 43,4% wereliving in households wherethey were the children oradopted children of the heador acting head of thehousehold. Another largegroup, 19,7%, were living in ahousehold where theythemselves were the head oracting head. In addition, 10,0%were the spouse or partner ofthe head.
Relatively few youth (8,5%)were living in householdswhere a grandparent or agreat-grandparent was thehousehold head.
With each single-year ageincrease, there was a steadyincrease in the percentage ofyouth living in a householdwhere they were the actualhousehold head, from 0,7% atthe age of 14 to 46,4% at theage of 34.
There was also a steadydecrease in the percentage ofyouth living as the child oradopted child of the householdhead with each single-year ageincrease, from 63,3% at age 14to 16,4% at age 34.
When comparing this profile ofyouth with that of infants andchildren, we notice that there isa strong movement away fromliving with grandparents andgreat-grandparents or evenparents as household heads,towards the youth themselvesbecoming household heads.
14 15 16 17 18 19 20 21 22 23 24 25 26 27 28 29 30 31 32 33 34 14-43
0,0
20,0
40,0
60,0
80,0
100,0%
H'hold head 0,7 1,2 2,9 4,2 6,0 8,2 10,0 12,4 15,4 18,0 21,0 23,9 27,1 29,9 32,8 35,3 37,1 40,3 42,7 45,0 46,4 19,7 Spouse/partner 0,1 0,2 0,4 0,8 1,4 2,3 3,4 5,1 6,9 8,8 10,6 12,7 14,5 16,4 18,1 19,4 20,7 21,8 23,5 24,1 25,0 10,0
Child/ adopted child 63,3 63,1 62,6 61,8 59,3 56,1 53,7 50,3 47,2 44,0 40,8 37,4 34,3 31,8 29,1 26,5 24,8 22,0 19,5 17,8 16,4 43,4 Grandchild/great-grandchild 20,8 19,1 17,3 15,5 13,9 12,2 10,8 9,1 7,4 6,3 5,4 4,5 3,8 3,2 2,6 2,2 1,9 1,6 1,1 0,9 0,8 8,5
Other relative 14,6 15,7 16,0 16,6 17,7 18,9 19,5 20,2 20,2 19,9 19,4 18,7 17,7 16,4 15,1 14,5 13,4 12,5 11,5 10,6 9,8 16,4 Not related 0,6 0,7 0,8 1,1 1,6 2,2 2,7 2,8 3,0 3,0 2,9 2,8 2,6 2,4 2,3 2,1 2,1 1,9 1,8 1,6 1,6 2,0

Description of youth and young adults (14–34) Census 2001
Stages in the life cycle of South Africans80
Relationship to household head (continued)
Figure 4.13: According to age and sex14
Mal
eFe
mal
e 15M
ale
Fem
ale 16
Mal
eFe
mal
e 17M
ale
Fem
ale 18
Mal
eFe
mal
e 19M
ale
Fem
ale 20
Mal
eFe
mal
e 21M
ale
Fem
ale 22
Mal
eFe
mal
e 23M
ale
Fem
ale 24
Mal
eFe
mal
e 25M
ale
Fem
ale 26
Mal
eFe
mal
e 27M
ale
Fem
ale 28
Mal
eFe
mal
e 29M
ale
Fem
ale 30
Mal
eFe
mal
e 31M
ale
Fem
ale 32
Mal
eFe
mal
e 33M
ale
Fem
ale 34
Mal
eFe
mal
e
0,0
20,0
40,0
60,0
80,0
100,0%
H'hold head Spouse/partner Child/ adopted child Grandchild/great-grandchild Other relative Not related
With each single-year increase in age, both men and women were less likely to be livingin a household as the child, grandchild or great-grandchild of the household head.
Males were more likely to be the head or acting head of the household with eachincrease in age, while females were more likely to be the wife or partner of the head oracting head.
For example, among 20-year-old males, 55,2% were classified as a child of thehousehold head, while 10,8% were classified as the household head, 0,2% wereclassified as the spouse or partner of the household head, and 11,4% were thegrandchildren or great-grandchildren of the household head. Among females aged 20, asimilar percentage (52,2%) was the child of the household head, while 9,2% were thehousehold head, 6,5% were the spouse or partner of the household head, and 10,3%were the grandchildren or great-grandchildren.
By age 30, however, relatively few respondents were children of the household head.Instead, 50,6% of males were classified as the household head, and 4,8% as the spouseor partner of the head, but only 24,7% of females in this age category was classified as ahousehold head, while a further 35,2% was classified as the spouse or partner of thehousehold head.

Description of youth and young adults (14–34) Census 2001
Statistics South Africa 81
Relationship to household head (continued)
Figure 4.14: According to five-year age category and population group
14-1
9
Bla
ck A
fric
an
Col
oure
d
Indi
an o
r Asi
an
Whi
te
20-2
4
Bla
ck A
fric
an
Col
oure
d
Indi
an o
r Asi
an
Whi
te
25-2
9
Bla
ck A
fric
an
Col
oure
d
Indi
an o
r Asi
an
Whi
te
30-3
4
Bla
ck A
fric
an
Col
oure
d
Indi
an o
r Asi
an
Whi
te
14-3
4
Bla
ck A
fric
an
Col
oure
d
Indi
an o
r Asi
an
Whi
te
0,0
20,0
40,0
60,0
80,0
100,0%
H'hold head 4,3 1,5 1,1 2,2 15,8 9,0 7,5 16,8 30,0 23,9 21,9 35,5 42,8 35,8 33,9 45,4 19,9 15,6 14,8 24,1Spouse/partner 0,9 0,9 0,5 0,8 6,3 7,4 7,7 12,0 14,1 19,9 22,8 30,9 19,9 28,1 33,0 38,2 8,6 12,5 14,7 19,7
Child/ adopted child 57,7 69,7 83,9 84,6 45,6 57,1 64,8 51,9 32,3 36,1 37,0 21,4 21,6 21,4 20,1 9,1 42,5 48,8 54,0 43,6Grandchild/great-grandchild 18,3 13,0 6,3 2,7 8,7 6,6 2,5 1,3 3,7 2,4 0,8 0,4 1,5 0,9 0,2 0,1 9,6 6,5 2,7 1,2
Other relative 18,0 12,5 7,7 7,2 21,2 15,4 15,7 9,7 17,7 13,7 16,0 7,1 12,6 10,9 11,8 4,7 17,8 13,1 12,5 7,1Not related 0,9 2,5 0,6 2,5 2,3 4,6 1,8 8,3 2,1 4,0 1,6 4,8 1,6 3,0 1,0 2,5 1,7 3,4 1,2 4,3
From age 20,with each five-year increase inage, white youthwere more likelythan those in theother populationgroups to beliving in ahousehold as thehousehold heador spouse of thehead.
Figure 4.15: According to province
GP FS WC MP NC LP NW KZN EC Total0,0
20,0
40,0
60,0
80,0
100,0%
H'hold head 25,8 20,8 20,4 20,1 19,9 19,7 19,1 15,6 15,6 19,7Spouse/partner 14,4 12,1 13,4 10,1 12,2 7,4 9,3 6,9 6,2 10,0
Child/ adopted child 35,6 42,2 42,8 43,4 41,5 46,6 43,5 48,6 46,1 43,4Grandchild/great-grandchild 5,2 9,1 4,3 9,0 9,1 9,2 10,7 9,9 12,5 8,5
Other relative 16,2 14,7 15,3 16,3 13,4 16,3 16,1 17,4 17,8 16,4Not related 2,8 1,2 3,8 1,1 3,9 0,9 1,4 1,6 1,7 2,0
On average, inthe moreindustrialisedprovinces suchas Gauteng, alarger proportionof youth werehousehold heads(25,8%) or theirspouses orpartners (14,4%),than in the lessindustrialisedprovinces suchas Eastern Cape(where 15,6%were householdheads and 6,2%spouses orpartners of thehead).

Description of youth and young adults (14–34) Census 2001
Stages in the life cycle of South Africans82
Relationship to household head (concluded)
Figure 4.16: According to five-year age category and household size
Excluding single-person households
14-19
2 3 4 5 6 7+ 20-24
2 3 4 5 6 7+ 25-29
2 3 4 5 6 7+ 30-34
2 3 4 5 6 7+ 14-34
2 3 4 5 6 7+0,0
20,0
40,0
60,0
80,0
100,0%
H'hold head 19,1 6,8 2,9 1,6 1,1 0,5 35,319,310,3 6,0 4,0 1,9 49,337,526,516,810,4 4,4 57,551,243,334,625,811,5 43,228,718,911,5 7,1 3,0
Spouse/partner 8,4 3,2 0,6 0,2 0,1 0,1 22,918,7 9,2 3,5 1,7 0,7 28,228,527,017,5 9,6 3,0 27,428,134,331,424,610,1 23,619,816,0 9,9 5,9 2,1
Child/ adopted child 33,756,468,470,068,258,0 14,133,350,258,861,760,8 7,017,126,539,249,359,3 5,210,512,219,329,049,5 12,529,242,452,557,457,9
Grandchild/great-grandchild 9,511,410,611,814,224,3 2,4 4,3 5,7 7,0 8,213,4 0,8 1,5 2,2 3,5 4,4 7,0 0,4 0,6 0,7 1,1 1,7 3,3 2,4 4,4 5,4 7,2 9,115,5
Other relative 26,220,416,315,415,416,2 20,320,321,121,721,621,1 11,712,715,220,123,324,0 7,4 7,9 7,911,616,623,3 15,015,315,217,018,519,9
Not related 3,2 1,8 1,2 1,0 1,0 0,9 4,9 4,1 3,6 3,0 2,7 2,0 3,1 2,7 2,6 2,9 3,0 2,3 2,2 1,7 1,5 1,9 2,3 2,3 3,3 2,6 2,1 2,0 2,0 1,7
The youth’s relationship to thehousehold head is related to thenumber of people in thehousehold. The larger thehousehold, the less likely theyouth is to be the householdhead or the spouse of thehousehold head.
In the age category 25–29, inhouseholds consisting of twopeople, 49,3% were householdheads and 28,2% were spousesof household heads.
But in households containingseven or more people, only4,4% of this age category werehousehold heads, and 3,0%were spouses of householdheads.

Description of youth and young adults (14–34) Census 2001
Statistics South Africa 83
Attendance at an educational institutionThe educational attainments of youth through the secondary school years lay the foundation forpost-school attainments, and influence the type of work the youth can undertake, and the type oflifestyle he or she may consequently live. Formal education, particularly the attainment of tertiaryqualifications, is the key to high-level employment opportunities. In this section we look at thepercentage of youth attending an educational institution, and the rate at which they move throughthe system of education, as well as tertiary education.
Figure 4.17: According to age
Among those aged 14–17,6,0% of 14-year-olds were notattending an educationalinstitution, increasing to 8,7%of 15-year-olds, 12,6% of16-year-olds, and 18,5% of17-year-olds.
After the age of 17, there was asteep increase in theproportion not attending aneducational institution, from29,3% among those aged 18 to64,3% among those aged 21,and then to 86,0% amongthose aged 24. Following thissteep increase, there was aslower increase to 95,9%among those aged 34.
At age 18, 65,5% of youth were attending school,while 2,8% were attending a university or atechnikon, and 2,4% another institution such as atechnical college.
The attendance at a technikon or university reacheda peak of 6,5% among those aged 20, and thengradually decline.
14 15 16 17 18 19 20 21 22 23 24 25 26 27 28 29 30 31 32 33 34 14-340,0
20,0
40,0
60,0
80,0
100,0%
None 6,0 8,7 12,6 18,5 29,3 42,1 53,8 64,3 74,5 81,2 86,0 90,1 92,0 93,1 94,0 94,4 94,5 95,1 95,7 95,9 95,9 63,1School 93,8 91,1 86,7 79,9 65,5 48,5 35,4 25,7 16,4 11,1 8,0 5,2 4,1 3,4 2,9 2,7 2,6 2,4 2,0 1,9 1,8 32,5
Technikon/university 0,0 0,0 0,2 0,5 2,8 5,6 6,5 6,1 5,6 4,6 3,5 2,8 2,3 2,0 1,8 1,7 1,8 1,5 1,4 1,4 1,4 2,6Other 0,2 0,2 0,7 1,0 2,4 3,8 4,4 3,9 3,6 3,1 2,5 1,9 1,7 1,5 1,2 1,2 1,1 1,0 0,9 0,9 0,9 2,1

Description of youth and young adults (14–34) Census 2001
Stages in the life cycle of South Africans84
Attendance at an educational institution (continued)
Figure 4.18: According to population group (14–24)14
Bla
ck A
frica
nC
olou
red
Indi
an o
r Asi
anW
hite 15
Bla
ck A
frica
nC
olou
red
Indi
an o
r Asi
anW
hite 16
Bla
ck A
frica
nC
olou
red
Indi
an o
r Asi
anW
hite 17
Bla
ck A
frica
nC
olou
red
Indi
an o
r Asi
anW
hite 18
Bla
ck A
frica
nC
olou
red
Indi
an o
r Asi
anW
hite 19
Bla
ck A
frica
nC
olou
red
Indi
an o
r Asi
anW
hite 20
Bla
ck A
frica
nC
olou
red
Indi
an o
r Asi
anW
hite 21
Bla
ck A
frica
nC
olou
red
Indi
an o
r Asi
anW
hite 22
Bla
ck A
frica
nC
olou
red
Indi
an o
r Asi
anW
hite 23
Bla
ck A
frica
nC
olou
red
Indi
an o
r Asi
anW
hite 24
Bla
ck A
frica
nC
olou
red
Indi
an o
r Asi
anW
hite
0
20
40
60
80
100%
Attending Not attending
In all single-year age groups,coloured youth were less likelyto be attending an educationalinstitution than those in the otherpopulation groups.
For example, at the age of 16,21,8% of coloured youth werenot attending an educationalinstitution, compared with 12,2%of African, 9,3% of Indian orAsian and 6,4% of white youth.
At age 21, 86,4% of colouredyouth were not attending aneducational institution, asagainst 72,0% of Asian or Indian62,0% of African, and 61,9% ofwhite youth.
Figure 4.19: According to population group (25–34)
25B
lack
Afr
ican
Col
oure
dIn
dian
or A
sian
Whi
te 26B
lack
Afr
ican
Col
oure
dIn
dian
or A
sian
Whi
te 27B
lack
Afr
ican
Col
oure
dIn
dian
or A
sian
Whi
te 28B
lack
Afr
ican
Col
oure
dIn
dian
or A
sian
Whi
te 29B
lack
Afr
ican
Col
oure
dIn
dian
or A
sian
Whi
te 30B
lack
Afr
ican
Col
oure
dIn
dian
or A
sian
Whi
te 31B
lack
Afr
ican
Col
oure
dIn
dian
or A
sian
Whi
te 32B
lack
Afr
ican
Col
oure
dIn
dian
or A
sian
Whi
te 33B
lack
Afr
ican
Col
oure
dIn
dian
or A
sian
Whi
te 34B
lack
Afr
ican
Col
oure
dIn
dian
or A
sian
Whi
te
0,0
20,0
40,0
60,0
80,0
100,0%
Attending Not attending
Overall, from the age of 25 years until the age of 34years a smaller and smaller proportion was attendingan educational institution. For example, at the age of25 years, 12,3% of white, 10,2% of African, 9,7% ofIndian or Asian and 4,3% of coloured youth wereattending an educational institution.
By the age of 34 years, however, only 5,4% of white,4,7% of Asian or Indian, 4,1% of African and 2,7% ofcoloured youth were attending an educationalinstitution. Coloured youth remained the smallestproportion in each single-year age category.

Description of youth and young adults (14–34) Census 2001
Statistics South Africa 85
Attendance at an educational institution (concluded)
Figure 4.20: Percentage of youth not attending according to age and sex
14 15 16 17 18 19 20 21 22 23 24 25 26 27 28 29 30 31 32 33 340,0
20,0
40,0
60,0
80,0
100,0%
Male 6,2 8,5 11,7 16,8 26,6 38,9 51,3 62,5 73,4 80,6 85,8 90,1 92,0 93,2 94,0 94,5 94,5 95,2 95,7 95,8 95,9Female 5,8 8,9 13,4 20,2 31,9 45,2 56,2 66,0 75,6 81,6 86,1 90,2 92,0 93,1 94,0 94,4 94,5 95,1 95,7 95,9 95,9
Between the ages of 15 and 25 years, a higherproportion of females than males were not attendingan educational institute. For example at the age of 18years, 31,9% of females were not attending aneducational institution, as against 26,6% of males.
From the age of 26 to the age of 34, virtually equalpercentages of males and females were notattending an educational institution. For example, atthe age of 27 years, 93,2% of males and 93,1% offemales were not attending an educational institution.

Description of youth and young adults (14–34) Census 2001
Stages in the life cycle of South Africans86
Educational attainment
Figure 4.21: According to age
14 15 16 17 18 19 20 21 22 23 24 25 26 27 28 29 30 31 32 33 34 14-340,0
20,0
40,0
60,0
80,0
100,0%
No schooling 1,8 2,1 2,4 2,9 3,7 4,5 5,2 6,1 6,9 7,3 7,9 8,2 8,6 8,6 9,0 9,5 9,9 10,7 11,2 11,5 11,4 6,7Some primary 41,9 27,8 18,6 13,2 10,6 9,3 9,0 9,1 8,0 8,2 8,9 9,2 10,0 10,5 11,4 12,2 12,4 13,8 14,4 15,1 14,9 14,1
Complete primary 24,5 19,0 14,7 10,8 8,1 6,6 5,4 5,1 4,6 4,6 4,7 4,9 5,2 5,3 5,6 5,8 5,8 6,4 6,7 7,1 7,1 8,4Some secondary 31,8 51,2 63,1 67,9 62,4 54,6 48,0 43,9 40,8 37,8 36,2 34,7 34,2 33,6 33,2 32,9 31,8 32,5 32,4 32,4 32,4 42,7
Complete secondary 0,0 0,0 1,1 5,0 14,1 22,6 28,4 30,6 33,1 34,2 33,8 33,6 32,5 31,8 30,5 29,2 28,5 25,9 24,5 23,1 22,6 22,1Higher 0,0 0,0 0,1 0,2 1,0 2,4 3,9 5,1 6,6 7,8 8,5 9,4 9,5 10,1 10,4 10,5 11,6 10,7 10,8 10,8 11,6 6,1
There was a gradual increase in the proportion of youth with no formal education witheach successive increase in single-year age category, from 1,8% of 14-year-olds to11,4% of 34-year-olds.
The percentage of those with at least some secondary education as their highest levelreached a peak at the age of 17 years, at which stage 67,9% had attained this level. Atthe age of 14 years, 31,8% had attained this level, while at 15 years 51,2%, and at 16years 63,1%, had done so.
From the age of 16 years, we can see some youth with complete secondary educationand some with at least some level of tertiary education.
The highest percentage of those with complete secondary education as their highestlevel of education occurred at the age of 23 years (34,2%).
The percentage of those with tertiary qualifications as their highest level of educationgrew steadily from 1,0% at the age of 18 years, to 11,6% at the age of 30 years, afterwhich this percentage remained relatively stable.

Description of youth and young adults (14–34) Census 2001
Statistics South Africa 87
Educational attainment (continued)The next two figures show clear differences by population group. A relatively high percentage ofwhite and Indian or Asian youth had tertiary qualifications, while coloured and African youth had alower percentage with tertiary qualifications.
Figure 4.22: According to age and population group (14–24)
14B
lack
Afr
ican
Col
oure
dIn
dian
or A
sian
Whi
te 15B
lack
Afr
ican
Col
oure
dIn
dian
or A
sian
Whi
te 16B
lack
Afr
ican
Col
oure
dIn
dian
or A
sian
Whi
te 17B
lack
Afr
ican
Col
oure
dIn
dian
or A
sian
Whi
te 18B
lack
Afr
ican
Col
oure
dIn
dian
or A
sian
Whi
te 19B
lack
Afr
ican
Col
oure
dIn
dian
or A
sian
Whi
te 20B
lack
Afr
ican
Col
oure
dIn
dian
or A
sian
Whi
te 21B
lack
Afr
ican
Col
oure
dIn
dian
or A
sian
Whi
te 22B
lack
Afr
ican
Col
oure
dIn
dian
or A
sian
Whi
te 23B
lack
Afr
ican
Col
oure
dIn
dian
or A
sian
Whi
te 24B
lack
Afr
ican
Col
oure
dIn
dian
or A
sian
Whi
te
0,0
20,0
40,0
60,0
80,0
100,0%
No schooling Some primary Complete primary Some secondary Std 10/ Grade 12 Higher
18-year-oldsAmong 18-year olds, 63,7% of Africans had at leastsome secondary education, while only 10,3% hadsuccessfully completed 12 years of schooling.Among coloured 18-year-olds, the proportion withsome secondary education decreased to 60,7%,while the proportion with 12 years of schoolingincreased to 21,5%. Among white 18-year-olds,57,3% had at least some secondary education,while 36,7% had successfully completed secondaryeducation. Among Indian or Asian 18-year-olds,40,7% had completed at least some secondaryschool, while as many as 51,0% had successfullycompleted 12 years of schooling.
24-year-oldsAt the other end of the age range shown in thisgraph, among those aged 24 years who wereclassified as African, only 31,6% had completedsecondary school, while only 6,2% had post-schoolqualifications. Among coloured 24-year-olds, 36,2%had completed secondary school, while only 5,9%had post-school qualifications. Among Indian orAsian youth in this age group, 55,3% had 12 yearsof schooling as their highest level of education,while 23,3% had post-school qualifications. Amongwhite youth in this age category, 48,9% had acomplete secondary education as their highestlevel, while 33,0% had post-school qualifications.

Description of youth and young adults (14–34) Census 2001
Stages in the life cycle of South Africans88
Educational attainment (continued)
Figure 4.23: According to age and population group (25–34)
25B
lack
Afr
ican
Col
oure
dIn
dian
or A
sian
Whi
te 26B
lack
Afr
ican
Col
oure
dIn
dian
or A
sian
Whi
te 27B
lack
Afr
ican
Col
oure
dIn
dian
or A
sian
Whi
te 28B
lack
Afr
ican
Col
oure
dIn
dian
or A
sian
Whi
te 29B
lack
Afr
ican
Col
oure
dIn
dian
or A
sian
Whi
te 30B
lack
Afr
ican
Col
oure
dIn
dian
or A
sian
Whi
te 31B
lack
Afr
ican
Col
oure
dIn
dian
or A
sian
Whi
te 32B
lack
Afr
ican
Col
oure
dIn
dian
or A
sian
Whi
te 33B
lack
Afr
ican
Col
oure
dIn
dian
or A
sian
Whi
te 34B
lack
Afr
ican
Col
oure
dIn
dian
or A
sian
Whi
te
0,0
20,0
40,0
60,0
80,0
100,0%
None Some primary Complete primary Some secondary Std 10/ Grade 12 Higher
27-year-oldsAmong 27-year olds, 29,9% of Africans hadsuccessfully completed 12 years of schooling, andonly 7,5% had post-school qualifications. Amongcoloured youth aged 27 years, 30,3% hadsuccessfully completed 12 years of schooling andonly 6,4% had tertiary-level qualifications. AmongIndian or Asian 27-year olds, 51,6% hadsuccessfully completed 12 years of schooling, and22,6% had tertiary qualifications. Among white 27-year-olds, 46,2% had successfully completedsecondary education, and 36,0% had tertiaryqualifications.
33-year-oldsAmong those aged 33, only 20,0% of Africans hadcompleted secondary school, while 7,5% had post-school qualifications. Among coloured youth aged33 years, 21,0% had completed secondary school,while 6,4% had post-school qualifications. AmongIndian or Asian youth in this age group, 45,8% had12 years of schooling as their highest level ofeducation, while 19,5% had post-schoolqualifications. Among white youth in this age group,42,7% had a complete secondary education astheir highest level, while 37,7% had post-schoolqualifications.

Description of youth and young adults (14–34) Census 2001
Statistics South Africa 89
Educational attainment (continued)
Figure 4.24: According to age and sex14
Mal
eFe
mal
e 15M
ale
Fem
ale 16
Mal
eFe
mal
e 17M
ale
Fem
ale 18
Mal
eFe
mal
e 19M
ale
Fem
ale 20
Mal
eFe
mal
e 21M
ale
Fem
ale 22
Mal
eFe
mal
e 23M
ale
Fem
ale 24
Mal
eFe
mal
e 25M
ale
Fem
ale 26
Mal
eFe
mal
e 27M
ale
Fem
ale 28
Mal
eFe
mal
e 29M
ale
Fem
ale 30
Mal
eFe
mal
e 31M
ale
Fem
ale 32
Mal
eFe
mal
e 33M
ale
Fem
ale 34
Mal
eFe
mal
e
0,0
20,0
40,0
60,0
80,0
100,0%
No schooling Some primary Complete primary Some secondary Std 10/ Grade 12 Higher
In the younger age groupswomen were obtaining higherlevels of education than men ofthe same age, but among theolder youth this was not clearlyevident.
For example, among 20-yearolds, 26,3% of males hadcompleted secondary schooland 3,5% had post-schoolqualifications, while of femalesin this age group, 30,4% hadcompleted secondary school,while 4,2% had post-schooleducation.
Among those aged 30, 29,4% ofmales had completed theirsecondary education, and11,1% had post-schoolqualifications, compared with27,8% and 12,0% respectivelyof females.

Description of youth and young adults (14–34) Census 2001
Stages in the life cycle of South Africans90
Educational attainment (concluded)
Figure 4.25: Main field of study among those with tertiary qualifications
220 742181 563
121 723111 489
71 17035 62234 277
26 83523 68722 148
19 68017 56416 747
13 63911 46810 839
7 7537 6516 1135 0094 9343 423
94 278
Business, commerce or management sciencesEducation, training or development
Computer science and data processingEngineering or engineering technology
Health care or health sciencePublic administration and social services
LawArts, visual or performing
Social sciences and social studiesAgriculture or renewable natural resources
CommunicationIndustrial arts, trades or technology
Life sciences or physical sciencesPsychology
Architecture or environmental designHome economics
Languages, linguistics or literatureMathematical sciences
Philosophy, religion or theologyMilitary sciences
Physical, education or leisureLibraries or museums
Other and unclassified
0 50 000 100 000 150 000 200 000 250 000
The most popular mainfield of study amongyouth was business,commerce ormanagement sciences,since approximately221 000 had attainedqualifications in thisfield.
The second mostpopular main field ofstudy was education,training ordevelopment, in whichapproximately 182 000youth hadqualifications.
The least popular mainfield of study waslibrary or museumscience (3 000),followed by physicaleducation or leisurestudies (5 000).
One can conclude from these findings that some inroads are being made into tackling theinequalities of the educational system during the apartheid era. Increasing proportions ofpreviously disadvantaged youth are gaining access to opportunities to attend secondary school, tocomplete schooling and to attain higher levels of education. But there are still clear inequalities,which are evident in actual educational attainment by population group. Improvements in theteaching skills of existing teachers, and improved teacher training are major considerations for thepresent, and so is the improvement of the physical environments of schools and other teachingfacilities.

Description of youth and young adults (14–34) Census 2001
Statistics South Africa 91
Labour market statusDefinitionsThe definitions of the employed, the unemployed and the not economically active have been givenin Chapter 1. These definitions are directly relevant to this section.
Limitations of Census 2001 labour market dataIn Chapter 1, we also indicated that Census 2001 has certain limitations in relation to the labourmarket data that it collected, since a population census, worldwide, is not necessarily the mostsensitive tool for collecting these types of figures. These limitations are described below.
The census questionnaire is not as detailed as one that is designed specifically for the purpose ofcollecting labour-market data, for example a questionnaire used in a household-based labour forcesurvey. A census allows for collecting data for small areas of the country and is extensive incoverage. But it does not easily allow for collecting in-depth information and for probing, asrequired to obtain accurate unemployment data. The probing that can be done in a householdsurvey is not possible in a population census.
These factors have a direct bearing on the type of findings one obtains from a census and from asurvey. There are clear differences between the findings regarding the labour market in Census2001 and those of the labour force survey (LFS) of September 2001 conducted by Stats SA.
In spite of these differences, the labour force patterns from Census 2001 are noteworthy, and aresimilar to the patterns found in Stats SA’s household-based labour force surveys. These patterns,rather than the actual numbers from Census 2001, will form the basis of the discussion below. Forexample, we do not calculate or include an unemployment rate as such, but indicate the overallpercentages of youth who are employed, unemployed and not economically active.
Labour market status of those aged 14 years in 2001The official age at which youth are permitted to work is 15 years. For those younger than 15 years,official permission is required. Therefore, in this section, we have excluded 14-year-olds from theoverall labour market analysis of youth.
Nevertheless, we should note that while the vast majority of youth in this age group were notengaged in work, approximately 6 500 14-year-olds (0,7%) were engaged in work in the sevendays prior to census night in 2001.
• Of this small proportion of working 14-year-olds, about 3 400 were working in the formalsector, while 1 400 were working in the informal sector and a further 1 400 were engaged infarming activities; 219 were employed but were absent from work in the seven days prior toCensus 2001.
• Moreover, 80,0% of those working 14-year-olds were working for 40 hours per week ormore.
Thus, while an extremely small portion of 14-year-olds actually worked in 2001, those who didtended to work for long periods of time each week, equivalent to full-time employment. This pictureis similar to the one found among children aged 10-13 who were working, as described in Chapter2. But there was a slight increase in the actual number and the proportion of working 14-year-oldscompared to younger children.

Description of youth and young adults (14–34) Census 2001
Stages in the life cycle of South Africans92
Labour market status (continued)
Figure 4.26: According to age
Among those aged 15–29 years, with each single-year increase in age, the larger theproportion of youth who were either employed or unemployed, and the smaller theproportion of youth who were not economically active.
For example, among those aged 18 years, 5,2% were employed, 13,9% wereunemployed and 70,4% were not economically active, since many were still attendingschool or other educational institutions at this age.
Among those aged 29 years, however, 43,3% were employed, 34,2% were unemployedand only 22,5% were not economically active.
From the ages of 30 to 34 years, we see a gradual increase in the proportion of youththat were employed, and a gradual decrease in the proportion that were unemployed,with some slight variation in the percentage who were not economically active. Forexample, among those aged 30 years, 46,1% were employed, 31,8% were unemployedand 22,1% were not economically active; at the age of 34 years, however, 50,6% wereemployed, 27,7% were unemployed and 21,7% were not economically active.
The percentage of youth that was unemployed reached a peak of 39,1% at 25 years ofage and then gradually decreased.
Unemployment is therefore, at least in part, a problem of youth; this applies particularly to those inthe age categories 22–31 years, where more than 35,0% were unemployed, compared with theproportions of those who were employed or who were not economically active.
15 16 17 18 19 20 21 22 23 24 25 26 27 28 29 30 31 32 33 340,0
20,0
40,0
60,0
80,0
100,0%
Employed 1,0 1,6 2,7 5,2 9,1 13,5 17,5 22,1 26,7 30,2 34,0 36,7 39,2 41,7 43,3 46,1 46,3 48,2 49,0 50,6Unemployed 3,2 5,1 8,2 13,9 20,5 26,8 32,0 36,7 38,7 39,5 39,1 38,3 37,1 35,5 34,2 31,8 31,4 29,9 28,9 27,7Not ec active 95,8 93,3 89,2 80,8 70,4 59,7 50,5 41,2 34,6 30,2 26,9 25,0 23,7 22,8 22,5 22,1 22,3 21,9 22,1 21,7
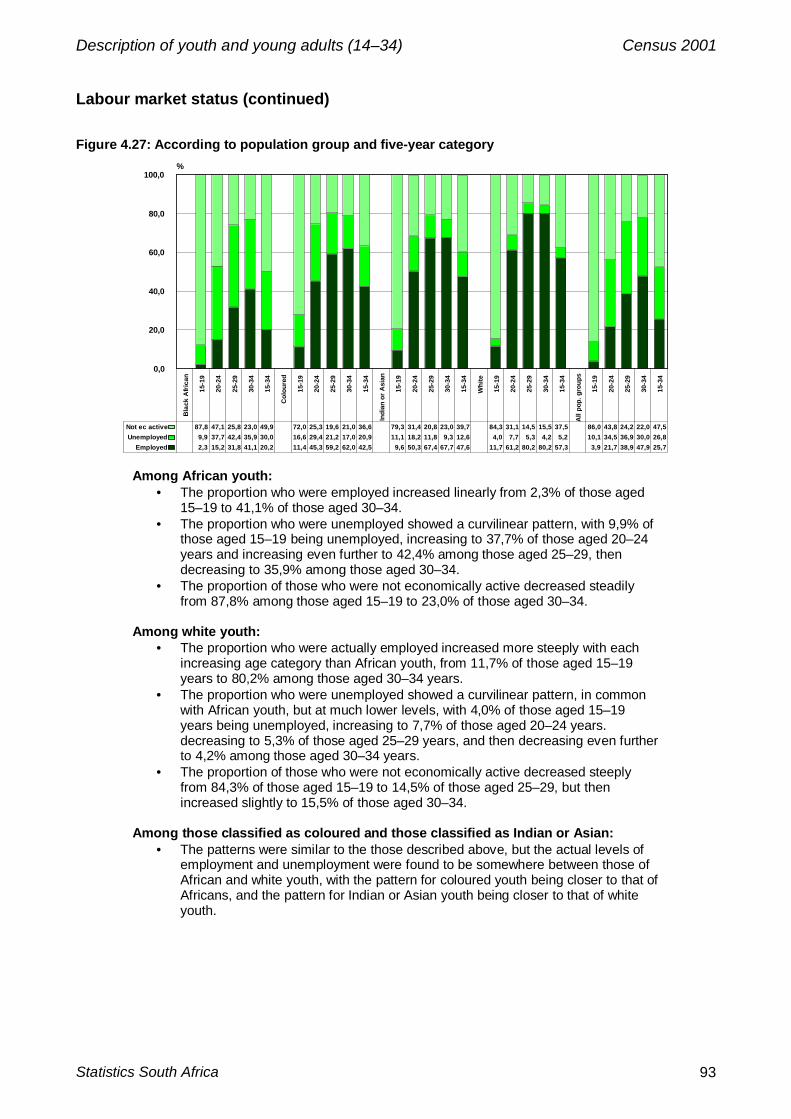
Description of youth and young adults (14–34) Census 2001
Statistics South Africa 93
Labour market status (continued)
Figure 4.27: According to population group and five-year category
Bla
ck A
fric
an
15-1
9
20-2
4
25-2
9
30-3
4
15-3
4
Col
oure
d
15-1
9
20-2
4
25-2
9
30-3
4
15-3
4
Indi
an o
r A
sian
15-1
9
20-2
4
25-2
9
30-3
4
15-3
4
Whi
te
15-1
9
20-2
4
25-2
9
30-3
4
15-3
4
All
pop.
gro
ups
15-1
9
20-2
4
25-2
9
30-3
4
15-3
4
0,0
20,0
40,0
60,0
80,0
100,0%
Employed 2,3 15,2 31,8 41,1 20,2 11,4 45,3 59,2 62,0 42,5 9,6 50,3 67,4 67,7 47,6 11,7 61,2 80,2 80,2 57,3 3,9 21,7 38,9 47,9 25,7Unemployed 9,9 37,7 42,4 35,9 30,0 16,6 29,4 21,2 17,0 20,9 11,1 18,2 11,8 9,3 12,6 4,0 7,7 5,3 4,2 5,2 10,1 34,5 36,9 30,0 26,8Not ec active 87,8 47,1 25,8 23,0 49,9 72,0 25,3 19,6 21,0 36,6 79,3 31,4 20,8 23,0 39,7 84,3 31,1 14,5 15,5 37,5 86,0 43,8 24,2 22,0 47,5
Among African youth:• The proportion who were employed increased linearly from 2,3% of those aged
15–19 to 41,1% of those aged 30–34.• The proportion who were unemployed showed a curvilinear pattern, with 9,9% of
those aged 15–19 being unemployed, increasing to 37,7% of those aged 20–24years and increasing even further to 42,4% among those aged 25–29, thendecreasing to 35,9% among those aged 30–34.
• The proportion of those who were not economically active decreased steadilyfrom 87,8% among those aged 15–19 to 23,0% of those aged 30–34.
Among white youth:• The proportion who were actually employed increased more steeply with each
increasing age category than African youth, from 11,7% of those aged 15–19years to 80,2% among those aged 30–34 years.
• The proportion who were unemployed showed a curvilinear pattern, in commonwith African youth, but at much lower levels, with 4,0% of those aged 15–19years being unemployed, increasing to 7,7% of those aged 20–24 years.decreasing to 5,3% of those aged 25–29 years, and then decreasing even furtherto 4,2% among those aged 30–34 years.
• The proportion of those who were not economically active decreased steeplyfrom 84,3% of those aged 15–19 to 14,5% of those aged 25–29, but thenincreased slightly to 15,5% of those aged 30–34.
Among those classified as coloured and those classified as Indian or Asian:• The patterns were similar to the those described above, but the actual levels of
employment and unemployment were found to be somewhere between those ofAfrican and white youth, with the pattern for coloured youth being closer to that ofAfricans, and the pattern for Indian or Asian youth being closer to that of whiteyouth.

Description of youth and young adults (14–34) Census 2001
Stages in the life cycle of South Africans94
Labour market status (continued)
Figure 4.28: According to sex and five-year age category
Male 15-19 20-24 25-29 30-34 15-34 Female 15-19 20-24 25-29 30-34 15-34 Both 15-19 20-24 25-29 30-34 15-340,0
20,0
40,0
60,0
80,0
100,0%
Employed 4,5 26,1 48,3 59,1 31,3 3,2 17,5 30,1 37,8 20,4 3,9 21,7 38,9 47,9 25,7Unemployed 9,3 32,9 33,7 26,8 24,7 10,9 36,0 39,8 32,9 28,8 10,1 34,5 36,9 30,0 26,8
Not ec active 86,2 41,0 17,9 14,1 44,0 85,9 46,5 30,1 29,3 50,8 86,0 43,8 24,2 22,0 47,5
The percentage of employedmales increased sharply from4,5% of those aged 15–19 to59,1% of those aged 30–34,while that of females increasedless steeply, from 3,2% to37,8%.
Among males aged 30–34years, 26,8% were unemployedand 14,1% were economicallyactive, while among females inthis age group 32,9% wereunemployed and 29,3% werenot economically active.
Overall, a larger proportion offemale youth (50,8%) were noteconomically active than maleyouth (44,0%). A largerproportion of female youth wereunemployed (28,8%) than maleyouth (24,7%).
Figure 4.29: According to educational attainment and five-year age category
.
An increasing proportion of youthwere employed with each increase infive-year age category. Moreover,from the age of 25 onwards, thehigher the level of education, thehigher the proportion that wereemployed
For example, among youth aged25–29 years, 23,8% with no formalschooling were employed, comparedto 31,9% of those with some primaryeducation, 33,4% with completeprimary education, 32,1% with somesecondary education, 45,1% withcomplete secondary education, and63,5% of those with tertiaryqualifications.
Among those aged 30–34, 29,1% ofthose with no formal schooling wereemployed, compared to 36,5% ofthose with some primary education,38,8% with complete primaryeducation, 42,2% with somesecondary education, 58,7% withcomplete secondary education, and77,2% of those with tertiaryqualifications.
No
scho
olin
g
15-1
9
20-2
4
25-2
9
30-3
4
Som
e pr
imar
y
15-1
9
20-2
4
25-2
9
30-3
4
Com
plet
e pr
imar
y
15-1
9
20-2
4
25-2
9
30-3
4
Som
e se
cond
ary
15-1
9
20-2
4
25-2
9
30-3
4
Com
plet
e se
cond
ary
15-1
9
20-2
4
25-2
9
30-3
4
Hig
her
15-1
9
20-2
4
25-2
9
30-3
4
All
educ
atio
n le
vels
15-1
9
20-2
4
25-2
9
30-3
4
15-3
4
0,0
20,0
40,0
60,0
80,0
100,0%
Employed 7,5 15,7 23,8 29,1 4,2 21,8 31,9 36,5 2,9 20,7 33,4 38,8 2,5 15,5 32,1 42,2 11,6 27,1 45,1 58,7 14,6 39,3 63,5 77,2 3,9 21,7 38,9 47,9 25,7
Unemployed 29,3 37,5 35,2 31,2 12,2 36,2 37,5 34,2 9,0 38,6 40,0 36,0 7,2 33,7 42,4 36,1 20,6 36,1 36,0 26,2 15,1 24,1 21,5 12,4 10,1 34,5 36,9 30,0 26,8
Not ec active 63,2 46,9 41,0 39,8 83,6 42,0 30,6 29,2 88,1 40,7 26,6 25,2 90,3 50,8 25,5 21,8 67,8 36,8 18,8 15,2 70,3 36,6 15,0 10,4 86,0 43,8 24,2 22,0 47,5
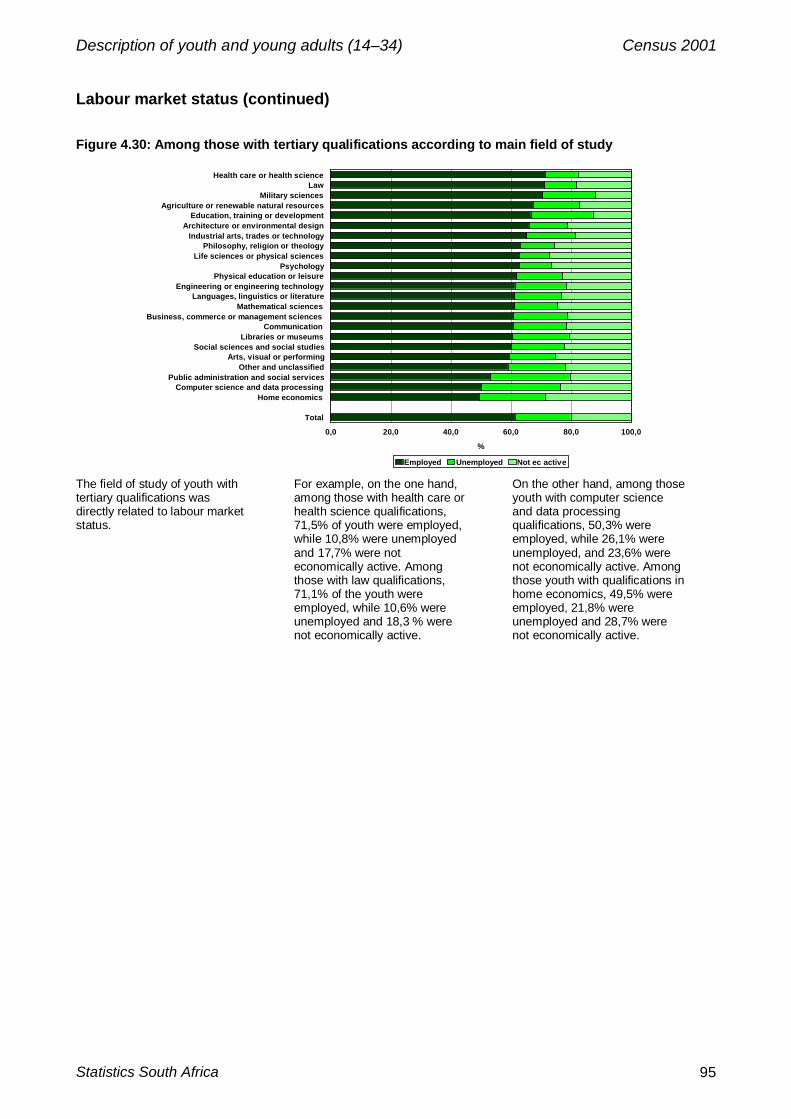
Description of youth and young adults (14–34) Census 2001
Statistics South Africa 95
Labour market status (continued)
Figure 4.30: Among those with tertiary qualifications according to main field of study
The field of study of youth withtertiary qualifications wasdirectly related to labour marketstatus.
For example, on the one hand,among those with health care orhealth science qualifications,71,5% of youth were employed,while 10,8% were unemployedand 17,7% were noteconomically active. Amongthose with law qualifications,71,1% of the youth wereemployed, while 10,6% wereunemployed and 18,3 % werenot economically active.
On the other hand, among thoseyouth with computer scienceand data processingqualifications, 50,3% wereemployed, while 26,1% wereunemployed, and 23,6% werenot economically active. Amongthose youth with qualifications inhome economics, 49,5% wereemployed, 21,8% wereunemployed and 28,7% werenot economically active.
Health care or health scienceLaw
Military sciencesAgriculture or renewable natural resources
Education, training or developmentArchitecture or environmental design
Industrial arts, trades or technologyPhilosophy, religion or theology
Life sciences or physical sciencesPsychology
Physical education or leisureEngineering or engineering technology
Languages, linguistics or literatureMathematical sciences
Business, commerce or management sciencesCommunication
Libraries or museumsSocial sciences and social studies
Arts, visual or performingOther and unclassified
Public administration and social servicesComputer science and data processing
Home economics
Total
0,0 20,0 40,0 60,0 80,0 100,0
%
Employed Unemployed Not ec active
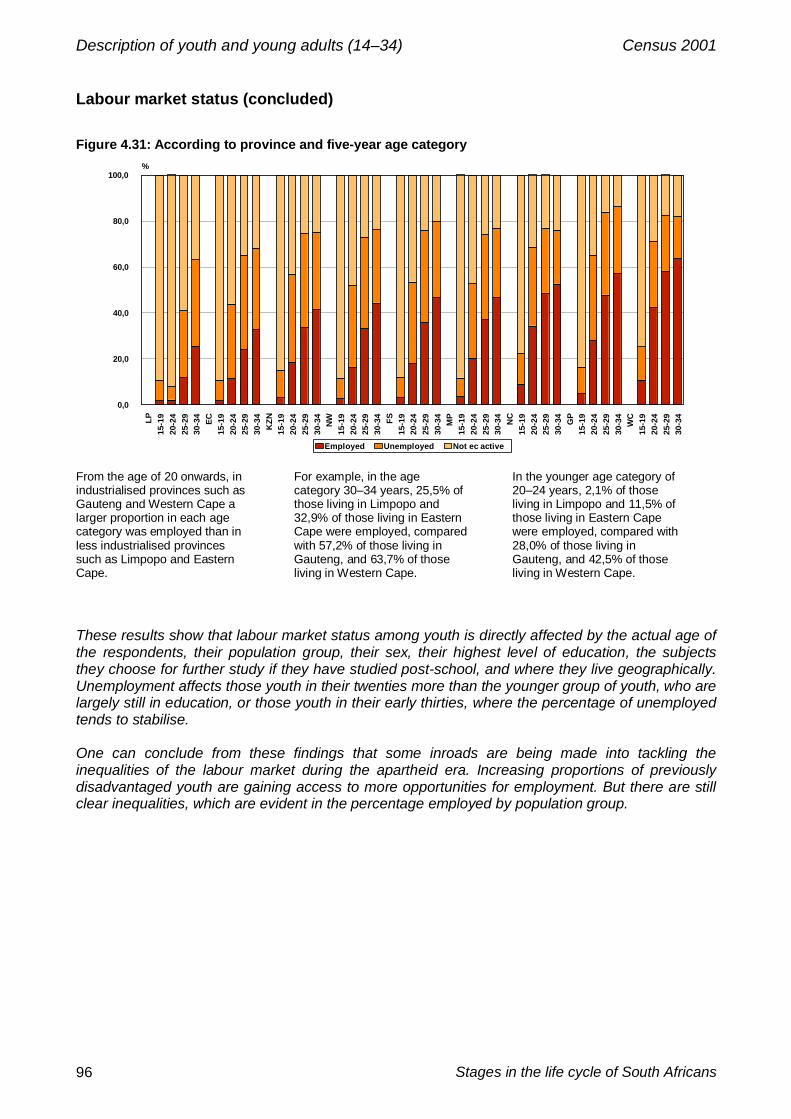
Description of youth and young adults (14–34) Census 2001
Stages in the life cycle of South Africans96
Labour market status (concluded)
Figure 4.31: According to province and five-year age categoryLP
15-1
920
-24
25-2
930
-34
EC15
-19
20-2
425
-29
30-3
4K
ZN15
-19
20-2
425
-29
30-3
4N
W15
-19
20-2
425
-29
30-3
4 FS15
-19
20-2
425
-29
30-3
4M
P15
-19
20-2
425
-29
30-3
4N
C15
-19
20-2
425
-29
30-3
4G
P15
-19
20-2
425
-29
30-3
4W
C15
-19
20-2
425
-29
30-3
4
0,0
20,0
40,0
60,0
80,0
100,0%
Employed Unemployed Not ec active
From the age of 20 onwards, inindustrialised provinces such asGauteng and Western Cape alarger proportion in each agecategory was employed than inless industrialised provincessuch as Limpopo and EasternCape.
For example, in the agecategory 30–34 years, 25,5% ofthose living in Limpopo and32,9% of those living in EasternCape were employed, comparedwith 57,2% of those living inGauteng, and 63,7% of thoseliving in Western Cape.
In the younger age category of20–24 years, 2,1% of thoseliving in Limpopo and 11,5% ofthose living in Eastern Capewere employed, compared with28,0% of those living inGauteng, and 42,5% of thoseliving in Western Cape.
These results show that labour market status among youth is directly affected by the actual age ofthe respondents, their population group, their sex, their highest level of education, the subjectsthey choose for further study if they have studied post-school, and where they live geographically.Unemployment affects those youth in their twenties more than the younger group of youth, who arelargely still in education, or those youth in their early thirties, where the percentage of unemployedtends to stabilise.
One can conclude from these findings that some inroads are being made into tackling theinequalities of the labour market during the apartheid era. Increasing proportions of previouslydisadvantaged youth are gaining access to more opportunities for employment. But there are stillclear inequalities, which are evident in the percentage employed by population group.
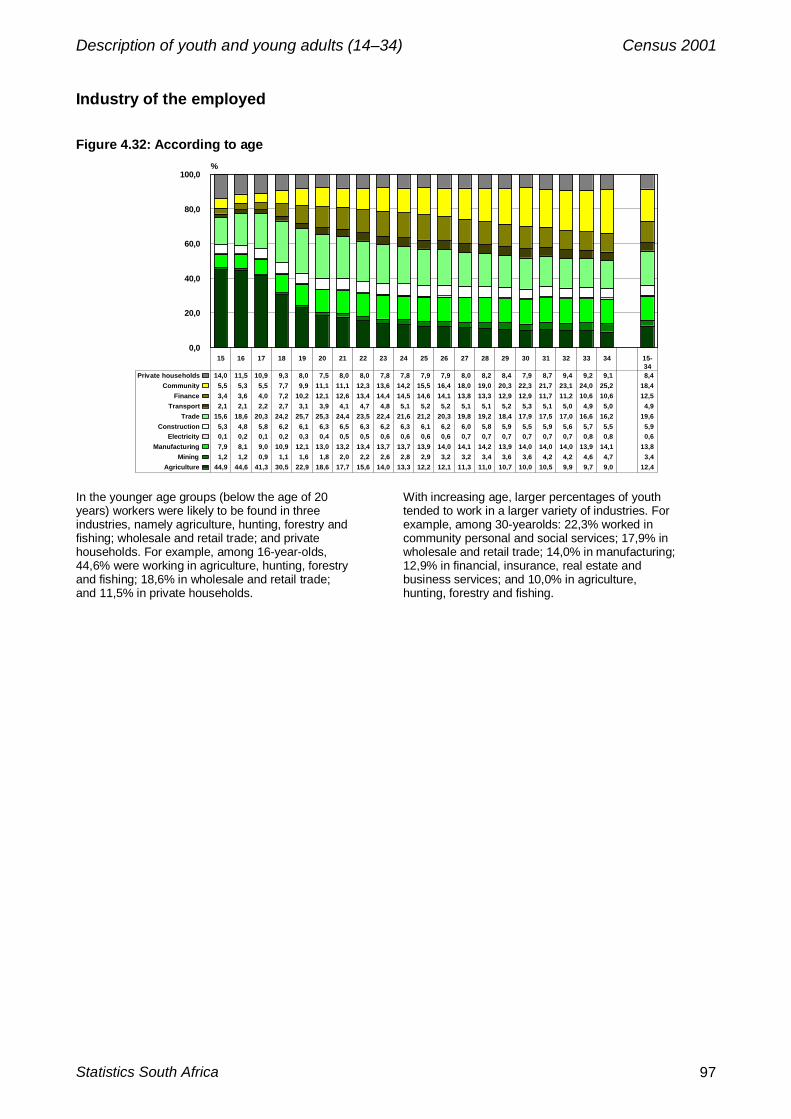
Description of youth and young adults (14–34) Census 2001
Statistics South Africa 97
Industry of the employed
Figure 4.32: According to age
15 16 17 18 19 20 21 22 23 24 25 26 27 28 29 30 31 32 33 34 15-34
0,0
20,0
40,0
60,0
80,0
100,0%
Agriculture 44,9 44,6 41,3 30,5 22,9 18,6 17,7 15,6 14,0 13,3 12,2 12,1 11,3 11,0 10,7 10,0 10,5 9,9 9,7 9,0 12,4Mining 1,2 1,2 0,9 1,1 1,6 1,8 2,0 2,2 2,6 2,8 2,9 3,2 3,2 3,4 3,6 3,6 4,2 4,2 4,6 4,7 3,4
Manufacturing 7,9 8,1 9,0 10,9 12,1 13,0 13,2 13,4 13,7 13,7 13,9 14,0 14,1 14,2 13,9 14,0 14,0 14,0 13,9 14,1 13,8Electricity 0,1 0,2 0,1 0,2 0,3 0,4 0,5 0,5 0,6 0,6 0,6 0,6 0,7 0,7 0,7 0,7 0,7 0,7 0,8 0,8 0,6
Construction 5,3 4,8 5,8 6,2 6,1 6,3 6,5 6,3 6,2 6,3 6,1 6,2 6,0 5,8 5,9 5,5 5,9 5,6 5,7 5,5 5,9Trade 15,6 18,6 20,3 24,2 25,7 25,3 24,4 23,5 22,4 21,6 21,2 20,3 19,8 19,2 18,4 17,9 17,5 17,0 16,6 16,2 19,6
Transport 2,1 2,1 2,2 2,7 3,1 3,9 4,1 4,7 4,8 5,1 5,2 5,2 5,1 5,1 5,2 5,3 5,1 5,0 4,9 5,0 4,9 Finance 3,4 3,6 4,0 7,2 10,2 12,1 12,6 13,4 14,4 14,5 14,6 14,1 13,8 13,3 12,9 12,9 11,7 11,2 10,6 10,6 12,5
Community 5,5 5,3 5,5 7,7 9,9 11,1 11,1 12,3 13,6 14,2 15,5 16,4 18,0 19,0 20,3 22,3 21,7 23,1 24,0 25,2 18,4Private households 14,0 11,5 10,9 9,3 8,0 7,5 8,0 8,0 7,8 7,8 7,9 7,9 8,0 8,2 8,4 7,9 8,7 9,4 9,2 9,1 8,4
In the younger age groups (below the age of 20years) workers were likely to be found in threeindustries, namely agriculture, hunting, forestry andfishing; wholesale and retail trade; and privatehouseholds. For example, among 16-year-olds,44,6% were working in agriculture, hunting, forestryand fishing; 18,6% in wholesale and retail trade;and 11,5% in private households.
With increasing age, larger percentages of youthtended to work in a larger variety of industries. Forexample, among 30-yearolds: 22,3% worked incommunity personal and social services; 17,9% inwholesale and retail trade; 14,0% in manufacturing;12,9% in financial, insurance, real estate andbusiness services; and 10,0% in agriculture,hunting, forestry and fishing.

Description of youth and young adults (14–34) Census 2001
Stages in the life cycle of South Africans98
Industry of the employed (continued)
Figure 4.33: According to population groupAfrican youth who wereworking were found mainly inwholesale and retail trade(18,5%); community, personaland social services (17,5%);agriculture, hunting, forestryand fishing (14,1%);manufacturing (12,6%); andprivate households (11,8%).
Coloured youth whowere working werefound mainly in similarindustries to Africanyouth, but with differentproportions. There wasa larger percentage inwholesale and retailtrade (20,2%);agriculture, hunting,forestry and fishing(19,1%); andmanufacturing (16,9%);but a smallerpercentage incommunity, social andpersonal services(16,1%); and privatehouseholds (5,0%).
Indian or Asian youth who were working were foundmainly in four industries: wholesale and retail trade(27,9%); manufacturing (22,6%); community, socialand personal services (18,7%) and financial,insurance, real estate and business services(17,9%).
White youth who were working were found mainlyin the same industries as Indian or Asian youth:financial, insurance, real estate and businessservices (23,9%); community, social and personalservices (23,7%); wholesale and retail trade(20,7%); and manufacturing (13,1%).
Figure 4.34: According to population group and sex
There were also cleardifferences by sex withineach population group.In general, malesworked in a widervariety of industriesthanfemales.
Black African Coloured Indian or Asian White Total0,0
20,0
40,0
60,0
80,0
100,0%
Agriculture 14,1 19,1 0,9 4,0 12,4Mining 4,3 0,9 0,4 2,9 3,4
Manufacturing 12,6 16,9 22,6 13,1 13,8Electricity 0,6 0,5 0,8 0,7 0,6
Construction 6,6 6,1 3,0 4,2 5,9Trade 18,5 20,2 27,9 20,7 19,6
Transport 4,5 4,3 7,4 6,1 4,9Finance 9,4 10,9 17,9 23,9 12,5
Community 17,5 16,1 18,7 23,7 18,4Private households 11,8 5,0 0,4 0,6 8,4
Bla
ck A
fric
an
Mal
e
Fem
ale
Col
oure
d
Mal
e
Fem
ale
Indi
an o
r Asi
an
Mal
e
Fem
ale
Whi
te
Mal
e
Fem
ale
Tota
l
Mal
e
Fem
ale
0,0
20,0
40,0
60,0
80,0
100,0%
Agriculture 15,5 11,6 21,3 16,6 1,1 0,6 5,7 2,0 14,1 10,0Mining 6,6 0,4 1,5 0,3 0,5 0,3 4,4 1,1 5,3 0,5
Manufacturing 13,9 10,4 18,1 15,6 25,5 18,6 16,2 9,5 15,3 11,5Electricity 0,8 0,3 0,7 0,3 0,9 0,5 0,9 0,4 0,8 0,4
Construction 9,9 1,2 10,5 1,1 4,3 1,2 6,2 1,8 9,1 1,3Trade 17,6 20,0 17,3 23,5 30,2 24,5 21,7 19,7 18,8 20,8
Transport 6,0 2,2 5,6 2,7 9,0 5,2 6,6 5,6 6,2 3,1Finance 10,7 7,3 10,0 11,9 14,8 22,2 20,5 27,9 12,3 12,8
Community 14,2 23,0 13,5 19,0 13,5 26,2 17,4 31,1 14,6 24,1Private households 4,8 23,4 1,5 8,9 0,3 0,7 0,4 0,8 3,5 15,5
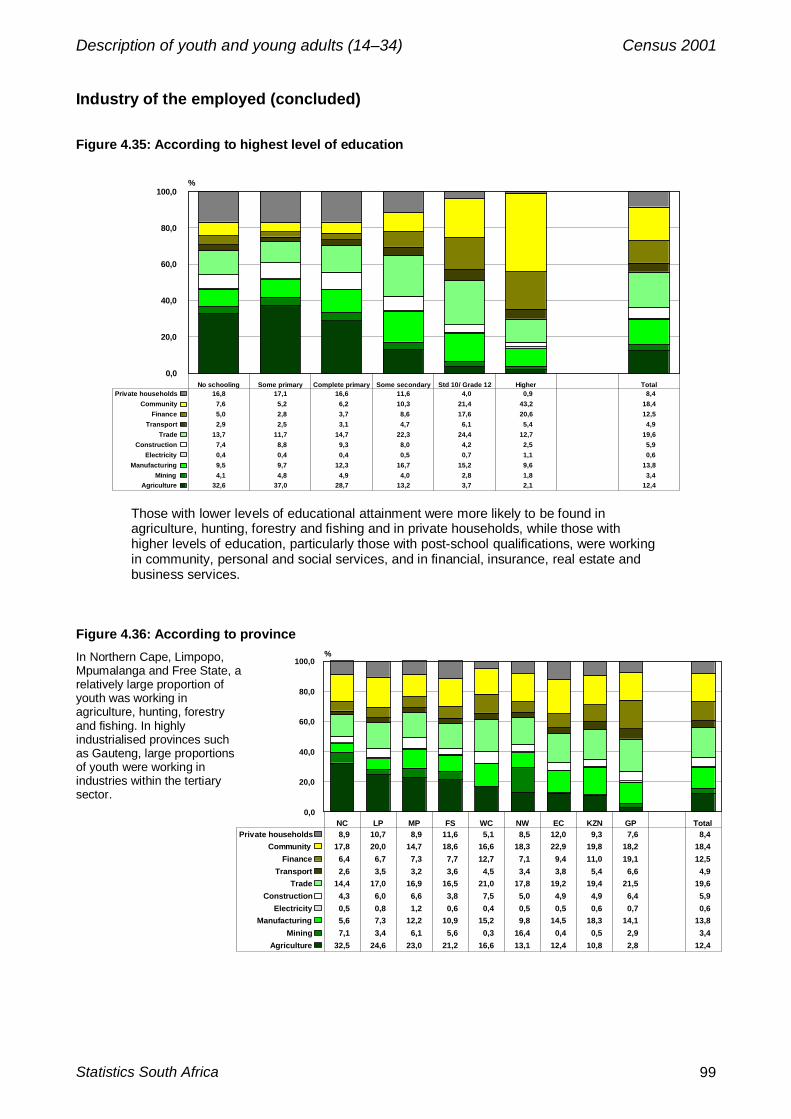
Description of youth and young adults (14–34) Census 2001
Statistics South Africa 99
Industry of the employed (concluded)
Figure 4.35: According to highest level of education
No schooling Some primary Complete primary Some secondary Std 10/ Grade 12 Higher Total0,0
20,0
40,0
60,0
80,0
100,0%
Agriculture 32,6 37,0 28,7 13,2 3,7 2,1 12,4Mining 4,1 4,8 4,9 4,0 2,8 1,8 3,4
Manufacturing 9,5 9,7 12,3 16,7 15,2 9,6 13,8Electricity 0,4 0,4 0,4 0,5 0,7 1,1 0,6
Construction 7,4 8,8 9,3 8,0 4,2 2,5 5,9Trade 13,7 11,7 14,7 22,3 24,4 12,7 19,6
Transport 2,9 2,5 3,1 4,7 6,1 5,4 4,9Finance 5,0 2,8 3,7 8,6 17,6 20,6 12,5
Community 7,6 5,2 6,2 10,3 21,4 43,2 18,4Private households 16,8 17,1 16,6 11,6 4,0 0,9 8,4
Those with lower levels of educational attainment were more likely to be found inagriculture, hunting, forestry and fishing and in private households, while those withhigher levels of education, particularly those with post-school qualifications, were workingin community, personal and social services, and in financial, insurance, real estate andbusiness services.
Figure 4.36: According to provinceIn Northern Cape, Limpopo,Mpumalanga and Free State, arelatively large proportion ofyouth was working inagriculture, hunting, forestryand fishing. In highlyindustrialised provinces suchas Gauteng, large proportionsof youth were working inindustries within the tertiarysector.
NC LP MP FS WC NW EC KZN GP Total0,0
20,0
40,0
60,0
80,0
100,0%
Agriculture 32,5 24,6 23,0 21,2 16,6 13,1 12,4 10,8 2,8 12,4Mining 7,1 3,4 6,1 5,6 0,3 16,4 0,4 0,5 2,9 3,4
Manufacturing 5,6 7,3 12,2 10,9 15,2 9,8 14,5 18,3 14,1 13,8Electricity 0,5 0,8 1,2 0,6 0,4 0,5 0,5 0,6 0,7 0,6
Construction 4,3 6,0 6,6 3,8 7,5 5,0 4,9 4,9 6,4 5,9Trade 14,4 17,0 16,9 16,5 21,0 17,8 19,2 19,4 21,5 19,6
Transport 2,6 3,5 3,2 3,6 4,5 3,4 3,8 5,4 6,6 4,9Finance 6,4 6,7 7,3 7,7 12,7 7,1 9,4 11,0 19,1 12,5
Community 17,8 20,0 14,7 18,6 16,6 18,3 22,9 19,8 18,2 18,4Private households 8,9 10,7 8,9 11,6 5,1 8,5 12,0 9,3 7,6 8,4

Description of youth and young adults (14–34) Census 2001
Stages in the life cycle of South Africans100
Occupation of the employed
Figure 4.37: According to age
15 16 17 18 19 20 21 22 23 24 25 26 27 28 29 30 31 32 33 34 14-34
0,0
20,0
40,0
60,0
80,0
100,0%
Managers 0,9 1,2 1,2 1,6 2,3 2,8 2,9 3,2 3,5 3,7 4,0 4,2 4,4 4,6 4,8 5,4 5,0 5,3 5,2 5,8 4,4Professionals 0,8 1,2 1,2 1,9 2,9 3,8 4,2 5,3 6,5 7,0 7,5 7,4 7,5 7,6 7,8 8,4 7,9 8,0 8,0 8,4 7,1
Technicians 1,8 2,2 2,4 3,7 5,4 6,5 6,8 7,3 7,9 8,1 8,4 8,7 9,4 9,9 10,4 11,5 11,1 11,7 11,8 12,7 9,7Clerks 4,7 6,3 7,3 12,8 16,4 17,7 16,4 16,1 15,8 15,0 14,8 14,0 13,7 13,4 13,0 13,3 12,2 12,0 11,8 11,9 13,6Sales 7,7 9,1 9,9 12,9 14,2 14,3 14,2 14,3 14,2 14,3 14,7 14,5 14,5 14,3 13,8 13,4 12,8 12,3 12,1 11,6 13,5
Skilled agric. 9,8 8,5 8,4 6,4 5,2 4,3 4,2 3,8 3,4 3,3 3,0 3,1 2,9 2,8 2,7 2,6 2,7 2,6 2,5 2,4 3,1Artisans 8,6 8,1 9,4 10,0 10,8 11,4 11,9 12,2 12,3 12,5 12,5 12,8 13,0 12,7 13,0 12,6 13,3 13,1 13,4 13,1 12,7
Operators 4,8 4,3 3,8 4,6 5,0 5,6 6,0 6,5 6,8 7,3 7,5 8,0 8,2 8,4 8,6 8,4 9,2 9,1 9,5 9,4 8,1Elementary 60,9 59,2 56,5 46,0 37,8 33,6 33,4 31,4 29,5 28,7 27,6 27,5 26,4 26,2 25,9 24,3 25,8 25,9 25,6 24,6 27,8
Below the age of 20, the employed were highly likely to be found in elementaryoccupations such as general labour and domestic work. For example, among those aged16 who were employed, 59,2% were in elementary occupations.
The older youth tended to work in a larger variety of occupations. Among 30-year-olds,although 24,3% were still working in elementary occupations, 13,4% were working insales positions, 13,3% were in clerical posts, 12,6% were in artisan occupations, and11,5% were working as technicians or in semi-professional occupations.
While relatively few youth overall were in managerial positions (4,4%), with each increasein single-year age category, there was an increase in the proportion, from 0,9% among15-year-olds to 5,8% among 34-year-olds.
A similar picture was found among those working in most other occupational groups.
Two occupational groups showed a decrease with each single-year age increase, namelyelementary occupations (decreasing from 60,9% at age 15 to 24,6% at age 34), andskilled agriculture (decreasing from 9,8% at age 15 to 2,4% at age 34).

Description of youth and young adults (14–34) Census 2001
Statistics South Africa 101
Occupation of the employed (continued)
Figure 4.38: According to population group
Black African Coloured Indian or Asian White Total0,0
20,0
40,0
60,0
80,0
100,0%
Managers 2,0 2,9 9,8 13,2 4,4Professionals 4,2 4,3 13,6 18,4 7,1
Technicians 7,7 8,3 14,1 16,8 9,7Clerks 9,9 16,7 26,4 21,2 13,6Sales 14,2 10,9 13,1 13,3 13,5
Skilled agric. 3,7 2,7 0,3 1,9 3,1Artisans 13,9 12,4 9,8 9,3 12,7
Operators 9,8 7,4 7,3 2,5 8,1Elementary 34,6 34,4 5,6 3,3 27,8
The graph showsclear differences inoccupation accordingto population group.
A large proportion ofAfrican (34,6%) andcoloured (34,4%)working youth werefound in elementaryoccupations.
Indian or Asian andwhite working youthwere more evenlyspread acrossoccupations, with thelargest proportions inclerical positions.
Figure 4.39: According to population group and sex
Bla
ck A
frica
n
Mal
e
Fem
ale
Col
oure
d
Mal
e
Fem
ale
Indi
an o
r Asi
an
Mal
e
Fem
ale
Whi
te
Mal
e
Fem
ale
All
pop.
gro
ups
Mal
e
Fem
ale
Tota
l
0,0
20,0
40,0
60,0
80,0
100,0%
Managers 2,2 1,7 3,2 2,6 12,2 6,4 16,0 9,9 4,9 3,7 4,4Professionals 3,9 4,8 4,2 4,5 12,5 15,1 18,3 18,6 6,6 8,0 7,1
Technicians 5,8 10,9 7,0 9,8 13,2 15,4 15,7 18,1 7,8 12,3 9,7Clerks 6,8 15,0 9,6 24,7 16,7 40,3 8,4 36,0 7,9 22,0 13,6Sales 15,9 11,3 10,9 11,0 14,9 10,6 14,5 12,0 15,0 11,4 13,5
Skilled agric. 4,3 2,8 3,5 1,7 0,4 0,1 2,9 0,7 3,8 2,1 3,1Artisans 18,8 5,6 18,3 5,8 13,7 4,2 16,0 1,6 18,1 4,8 12,7
Operators 13,9 3,0 9,8 4,7 9,9 3,6 4,2 0,6 11,7 2,8 8,1Elementary 28,4 44,8 33,6 35,3 6,5 4,4 4,0 2,6 24,2 33,0 27,8
In general, males worked in awider variety of occupationsthan females.
For example, 44,8% of youngAfrican women were inelementary occupations,compared with 28,4% of youngAfrican men.
A large proportion of youngIndian or Asian (40,3%) andwhite (36,0%) women wereworking in clerical occupations.

Description of youth and young adults (14–34) Census 2001
Stages in the life cycle of South Africans102
Occupation of the employed (continued)
Figure 4.40: According to sex and five-year age category
Male 15-19 20-24 25-29 30-34 15-34 Female 15-19 20-24 25-29 30-34 15-34 Both 15-19 20-24 25-29 30-34 15-340,0
20,0
40,0
60,0
80,0
100,0%
Managers 2,0 3,5 4,8 6,1 4,9 1,6 3,0 3,8 4,2 3,7 1,8 3,3 4,4 5,3 4,4Professionals 2,1 5,1 6,9 7,6 6,6 2,4 6,4 8,6 8,9 8,0 2,2 5,6 7,6 8,1 7,1
Technicians 3,9 6,7 7,6 9,1 7,8 4,5 8,7 12,0 15,5 12,3 4,2 7,5 9,4 11,7 9,7Clerks 6,9 8,8 8,0 7,4 7,9 21,6 26,3 22,4 19,1 22,0 13,1 16,0 13,7 12,2 13,6
Sales workers 11,2 14,8 16,2 14,4 15,0 14,7 13,5 11,6 9,6 11,4 12,7 14,3 14,3 12,4 13,5Skilled agric. 7,7 4,6 3,5 3,2 3,8 4,5 2,5 2,0 1,7 2,1 6,3 3,7 2,9 2,6 3,1
Artisans 14,6 17,4 18,1 18,8 18,1 3,9 4,7 4,9 4,9 4,8 10,1 12,2 12,8 13,1 12,7Operators 6,6 9,4 11,7 13,4 11,7 2,0 2,5 2,8 3,1 2,8 4,7 6,6 8,2 9,1 8,1
Elementary 45,0 29,8 23,2 19,9 24,2 44,7 32,3 31,9 33,0 33,0 44,9 30,9 26,7 25,3 27,8
Among male youththere was a shift awayfrom elementaryoccupations into morediverse occupationswith each increase infive-year age category.But among youngwomen, this shifttended to be minimalafter the age of 20years.
Figure 4.41: According to highest level of education
No schooling Some primary Complete primary Some secondary Std 10/ Grade 12 Higher Total0,0
20,0
40,0
60,0
80,0
100,0%
Managers 1,2 0,7 0,9 2,3 6,4 8,6 4,4Professionals 1,2 0,7 0,8 1,7 5,7 28,7 7,1
Technicians 3,0 1,2 1,5 4,1 11,0 27,3 9,7Clerks 4,8 2,2 3,1 8,9 23,0 15,4 13,6Sales 8,1 5,1 6,8 13,9 19,5 9,1 13,5
Skilled agric. 8,3 8,3 6,3 3,2 1,2 0,8 3,1Artisans 13,6 14,5 16,3 17,5 11,0 4,7 12,7
Operators 9,3 9,9 10,8 11,2 7,1 1,9 8,1Elementary 50,5 57,5 53,5 37,1 15,0 3,5 27,8
Youth with lower levelsof educationalattainment were morelikely to be found inelementaryoccupations, whilethose with higherlevels of education,particularly those withpost-schoolqualifications, were ina wide variety ofoccupations.
A large proportion ofthose with post-schoolqualifications werefound in professional(28,7%) and technicaloccupations (27,3%).

Description of youth and young adults (14–34) Census 2001
Statistics South Africa 103
Occupation of the employed (concluded)
Figure 4.42: According to province
NC LP MP FS WC EC NW KZN GP Total0,0
20,0
40,0
60,0
80,0
100,0%
Managers 3,1 2,8 2,8 3,0 4,6 3,6 3,2 4,1 6,1 4,4Professionals 3,9 5,0 4,2 4,9 6,8 6,5 5,3 6,2 10,2 7,1
Technicians 6,7 9,4 7,2 8,0 8,6 12,0 8,3 11,1 10,4 9,7Clerks 11,3 10,4 10,3 11,1 13,9 13,2 11,5 13,6 16,1 13,6Sales 10,3 11,4 11,3 11,6 12,9 12,7 12,2 13,3 16,1 13,5
Skilled agric. 6,8 6,1 6,6 5,6 2,6 3,5 3,8 3,1 1,0 3,1Artisans 9,7 11,6 14,6 12,5 11,0 11,5 16,7 12,0 13,3 12,7
Operators 4,7 6,6 8,6 9,8 6,6 7,1 11,7 9,7 7,4 8,1Elementary 43,4 36,7 34,5 33,6 32,9 29,8 27,4 26,9 19,4 27,8
The provinces in thisgraph are orderedaccording to theproportion of peopleworking inelementaryoccupations, from43,4% in NorthernCape to 19,4% inGauteng.
These results show that age, population group, sex, highest level of education, and where theyouth lived related directly to the occupation in which they worked. One can conclude from thesefindings that some inroads are being made into tackling the inequalities of occupational distributionduring the apartheid era. Increasing proportions of previously disadvantaged youth are gainingaccess to opportunities for higher-level occupations. But there are still clear inequalities.

Description of youth and young adults (14–34) Census 2001
Stages in the life cycle of South Africans104
DisabilityTable 4.2: Number of disabled youth by age and type of disability
AgeNo
disability Sight HearingCommun-
ication Physical Intellectual Emotional Multiple
At leastone
disability Total
14 946 681 7 223 5 725 1 360 4 248 5 191 3 081 3 337 30 165 976 846
15 976 126 7 701 5 724 1 377 4 467 5 558 3 271 3 578 31 676 1 007 802
16 995 459 8 017 5 487 1 421 4 571 5 525 3 452 3 825 32 298 1 027 757
17 950 964 7 831 5 117 1 273 4 654 5 193 3 409 3 592 31 069 982 033
18 960 087 7 860 4 876 1 256 4 751 5 070 3 751 3 405 30 969 991 056
19 942 773 7 495 4 831 1 213 4 856 4 895 3 832 3 178 30 300 973 073
20 885 552 6 847 4 299 1 234 4 724 4 390 3 684 2 980 28 158 913 710
21 897 326 6 893 4 445 1 213 5 034 4 402 4 072 3 034 29 093 926 420
22 820 822 6 425 4 123 1 081 5 097 3 932 3 896 2 745 27 299 848 119
23 767 426 5 728 3 840 1 070 5 082 3 621 3 841 2 602 25 784 793 211
24 785 971 5 998 3 881 1 151 5 510 3 744 4 150 2 658 27 092 813 063
25 787 189 6 059 3 890 1 179 5 909 3 822 4 642 2 882 28 383 815 573
26 783 179 6 251 4 151 1 292 6 400 3 804 4 797 2 818 29 513 812 691
27 750 072 6 017 4 005 1 168 6 505 3 594 4 818 2 802 28 909 778 979
28 721 949 6 158 3 878 1 152 6 727 3 537 4 726 2 942 29 120 751 069
29 745 749 6 481 4 037 1 213 7 303 3 718 5 219 2 908 30 879 776 628
30 641 308 5 707 3 694 1 068 6 802 3 346 4 765 2 566 27 948 669 257
31 707 173 6 650 4 219 1 133 7 879 3 604 5 497 3 104 32 086 739 259
32 650 088 6 285 3 914 1 110 7 724 3 227 5 282 2 845 30 387 680 475
33 638 357 6 645 4 014 1 129 8 110 3 260 5 370 2 826 31 354 669 710
34 554 459 5 914 3 407 1 006 7 095 2 925 4 918 2 476 27 741 582 200
Total 16 908 709 140 186 91 556 25 097 123 448 86 357 90 472 63 103 620 219 17 528 929
Of the approximately 17,5 million youth counted in Census 2001, 620 000 (3,5%) werereported as being disabled. Of these, 140 000 (22,6%) had a visual disability, 92 000(14,8%) a hearing, 25 000 (4,0%) a communication, 123 000 (19,9%) a physical, 86 000(13,9%) an intellectual and 90 000 (14,6%) an emotional disability, while 63 000 (10,2%)had multiple disabilities.

Description of youth and young adults (14–34) Census 2001
Statistics South Africa 105
Disability (continued)
Figure 4.43: Percentage of youth of each age with each type of disability, compared with the totalpopulation
2,9 2,8 2,8 2,93,1 3,1
2,83,0 3,1 3,2 3,3 3,2
3,7 3,6 3,7 3,84,0 4,1
4,34,6 4,7
3,5
5,0
14 15 16 17 18 19 20 21 22 23 24 25 26 27 28 29 30 31 32 33 34
Tota
l
Tota
l pop
0,0
1,0
2,0
3,0
4,0
5,0
6,0%
Sight 0,7 0,7 0,7 0,8 0,8 0,8 0,7 0,7 0,7 0,7 0,7 0,7 0,8 0,8 0,8 0,8 0,8 0,9 0,9 1,0 1,0 0,8 1,3Hearing 0,6 0,5 0,5 0,5 0,5 0,5 0,4 0,5 0,5 0,5 0,5 0,4 0,5 0,5 0,5 0,5 0,5 0,5 0,5 0,6 0,6 0,5 0,7
Communication 0,1 0,1 0,1 0,1 0,1 0,1 0,1 0,1 0,1 0,1 0,1 0,1 0,2 0,1 0,1 0,2 0,2 0,2 0,2 0,2 0,2 0,1 0,2Physical 0,4 0,4 0,4 0,4 0,5 0,5 0,5 0,5 0,6 0,6 0,7 0,7 0,8 0,8 0,9 0,9 1,0 1,0 1,1 1,2 1,2 0,7 1,2
Intellectual 0,5 0,5 0,5 0,5 0,5 0,5 0,5 0,5 0,5 0,5 0,5 0,5 0,5 0,5 0,5 0,5 0,5 0,5 0,5 0,5 0,5 0,5 0,5Emotional 0,3 0,3 0,3 0,3 0,4 0,4 0,4 0,4 0,4 0,5 0,5 0,5 0,6 0,6 0,6 0,6 0,7 0,7 0,8 0,8 0,8 0,5 0,6
Multiple 0,3 0,3 0,3 0,3 0,3 0,3 0,2 0,3 0,3 0,3 0,3 0,3 0,3 0,3 0,3 0,3 0,3 0,3 0,3 0,3 0,4 0,4 0,6
With somefluctuations,there was asteady increasein the proportionof disabledyouth with eachsingle-yearincrease in age.
This patterncontinues fromthe onepreviouslyobserved amongboth infants andchildren.
Figure 4.44: According to population group and five-year age category
3,3 3,4
3,9
4,9
2,32,6
3,2
3,7
1,92,1
2,42,6 2,6
2,42,6
2,83,1 3,2
3,7
4,5
Bla
ck A
fric
an
14-1
9
20-2
4
25-2
9
30-3
4
Col
oure
d
14-1
9
20-2
4
25-2
9
30-3
4
Indi
an o
r A
sian
14-1
9
20-2
4
25-2
9
30-3
4
Whi
te
14-1
9
20-2
4
25-2
9
30-3
4
Tota
l
14-1
9
20-2
4
25-2
9
30-3
4
0,0
1,0
2,0
3,0
4,0
5,0
6,0%
Overall, 3,7% of African, 2,9% of coloured, 2,2% ofIndian or Asian and 2,6% of white youth weredisabled. In each five-year age category, theproportion of African youth who were disabled washigher than the proportion in the other populationgroups.
Indian or Asian youth had the lowest proportion ofdisabled in each single-year age category. Thistrend continues from the one found among children.

Description of youth and young adults (14–34) Census 2001
Stages in the life cycle of South Africans106
Disability (concluded)
Figure 4.45: According to age and sex
3,23,0
3,23,1 3,23,13,3
3,1 3,23,0
3,23,0
3,23,0
3,3
3,0
3,4
3,1
3,5
3,0
3,6
3,1
3,8
3,2
4,0
3,3
4,1
3,3
4,3
3,4
4,5
3,5
4,7
3,7
4,9
3,8
5,0
3,9
5,3
4,1
5,4
4,2
14M
ale
Fem
ale 15
Mal
eFe
mal
e 16M
ale
Fem
ale 17
Mal
eFe
mal
e 18M
ale
Fem
ale 19
Mal
eFe
mal
e 20M
ale
Fem
ale 21
Mal
eFe
mal
e 22M
ale
Fem
ale 23
Mal
eFe
mal
e 24M
ale
Fem
ale 25
Mal
eFe
mal
e 26M
ale
Fem
ale 27
Mal
eFe
mal
e
Mal
eFe
mal
e 29M
ale
Fem
ale 30
Mal
eFe
mal
e 31M
ale
Fem
ale 32
Mal
eFe
mal
e 33M
ale
Fem
ale 34
Mal
eFe
mal
e
0,0
1,0
2,0
3,0
4,0
5,0
6,0%
Overall, 3,8% of male youth and 3,3% of female youth were disabled. In each single-yearage category, the proportion of male youth that was reported as being disabled washigher than the proportion of female youth. This difference was more marked amongolder youth.
The prevalence of disability among youth can again be directly linked to the need for workopportunities and special requirements, for example the supply of infrastructure such as ramps,accessible toilets and other adjustments at places of work, communal meeting places, shoppingmalls and public areas. Health care and other facilities are also required by disabled youth to allowthem to function in an optimum physical environment and to reach their full intellectual and socialpotential.

Description of youth and young adults (14–34) Census 2001
Statistics South Africa 107
Number of people with whom living
Figure 4.46: According to age, compared with the total population and all households
14 15 16 17 18 19 20 21 22 23 24 25 26 27 28 29 30 31 32 33 34 14-34
Totalpop.
Allh'holds
0,0
20,0
40,0
60,0
80,0
100,0%
On their own 0,2 0,5 0,7 1,2 2,1 3,2 4,0 4,9 5,9 6,7 7,4 8,0 8,5 8,8 9,0 9,1 8,8 9,2 9,0 9,1 8,7 5,5 4,2 18,51 2,8 3,2 3,7 4,4 5,4 6,5 7,5 8,9 10,3 11,4 12,5 13,4 14,0 14,3 14,4 14,1 13,7 13,5 13,1 12,8 12,2 9,6 8,9 18,02 8,1 8,5 8,9 9,4 9,9 10,2 10,9 11,7 12,6 13,3 13,8 14,6 15,3 15,7 16,1 16,1 16,0 15,8 15,4 14,9 14,5 12,6 11,9 15,23 15,2 15,1 14,9 14,8 14,4 13,7 13,5 13,3 13,1 13,2 13,2 13,4 13,8 14,4 15,1 15,9 16,9 17,4 18,2 18,6 19,4 14,9 15,9 15,34 17,5 17,1 16,7 16,3 15,7 14,7 14,0 13,5 12,6 12,1 11,5 11,2 10,9 11,0 11,2 11,6 12,0 12,6 13,3 14,0 14,8 13,7 15,1 11,35 15,3 15,1 14,8 14,5 13,8 13,3 12,6 12,0 11,3 10,7 10,0 9,5 9,1 8,7 8,5 8,5 8,6 8,7 9,0 9,3 9,7 11,4 12,4 7,8
6+ 40,8 40,6 40,2 39,5 38,7 38,4 37,6 35,6 34,2 32,6 31,7 29,8 28,5 27,0 25,6 24,7 23,9 22,8 21,8 21,3 20,8 32,3 31,7 13,8
A relatively highproportion of youth, onein every three (32,3%),was living with at leastsix other people. Thispercentage is howeverlower than that foundamong infants andchildren.
With each increase insingle-year agecategory, a decreasingpercentage of youthwas living inhouseholds with six ormore people.
In general, youngpeople tended to livewith fewer people thaninfants and children.
A gradually increasing proportion of youth (from0,2% among 14-year-olds, increasing to 9,1%among 29-year-olds) were living on their own as asingle-person household. (This percentagefluctuated somewhat between 30 and 34 years.)
At first, the proportion of youth living with only oneother person increased with each single-year increasein age (from 2,8% among 14-year-olds, to 14,4%among 28-year-olds), then decreased (from 14,1%among 29-year-olds to 12,2% among 34-year-olds).
Figure 4.47: According to population group and sex, compared with the total population and allhouseholds
Bla
ck A
fric
an
Mal
e
Fem
ale
Bot
h se
xes
Col
oure
d
Mal
e
Fem
ale
Bot
h se
xes
Indi
an o
r A
sian
Mal
e
Fem
ale
Bot
h se
xes
Whi
te
Mal
e
Fem
ale
Bot
h se
xes
All
grou
ps
Mal
e
Fem
ale
Bot
h se
xes
Tota
l pop
.
All
h'ho
lds
0,0
20,0
40,0
60,0
80,0
100,0%
On their own 7,5 3,0 5,2 2,1 1,2 1,6 1,3 0,9 1,1 4,7 3,6 4,2 6,7 2,9 4,7 4,2 18,51 10,2 8,6 9,3 5,7 5,6 5,7 7,1 6,6 6,9 16,2 16,8 16,5 10,2 8,9 9,5 8,9 18,02 12,0 11,9 12,0 12,4 11,9 12,1 15,2 14,0 14,6 22,2 21,5 21,9 13,0 12,7 12,8 11,9 15,23 12,9 13,9 13,4 18,7 18,3 18,5 24,9 25,4 25,2 28,0 29,4 28,7 14,9 15,7 15,4 15,9 15,34 12,8 13,8 13,3 18,4 18,0 18,2 21,8 22,4 22,1 15,9 16,0 15,9 13,8 14,6 14,2 15,1 11,35 11,5 12,4 12,0 14,0 14,0 14,0 13,7 14,1 13,9 7,1 7,0 7,0 11,4 12,1 11,8 12,4 7,8
6+ 33,0 36,4 34,8 28,7 31,0 29,9 16,0 16,5 16,3 5,9 5,7 5,8 30,0 33,1 31,7 31,7 13,8
Unlike for infantsand children, the sexof the youth wasrelated to thenumber of peoplewith whom theywere living. Incommon with infantsand children,however, thepopulation group ofthe youth was againrelated to thenumber of peoplewith whom theywere living.
There wereproportionatelyfewer young womenliving on their ownthan young men.
Among African youth, the proportion of males livingon their own as single-person households (7,5%)was higher than the proportion of females (3,0%). Itwas also higher than the proportions in the otherpopulation groups.
White youth were, on average, living with fewerother people in smaller households than Indian orAsian, coloured or African youth.

Description of youth and young adults (14–34) Census 2001
Stages in the life cycle of South Africans108
Type of dwelling
Figure 4.48: According to age, compared with all households
14 15 16 17 18 19 20 21 22 23 24 25 26 27 28 29 30 31 32 33 34 14-34 All h'holds0,0
20,0
40,0
60,0
80,0
100,0%
Formal 62,4 62,8 63,5 64,3 64,1 64,1 64,9 64,0 63,7 64,0 63,3 63,2 63,0 63,6 63,9 63,7 65,9 64,0 65,0 65,1 67,3 64,0 63,8Traditional 24,3 23,8 23,1 21,9 21,3 20,0 18,2 17,3 16,3 15,1 14,8 14,2 13,8 13,0 12,7 12,7 12,2 12,8 12,4 12,3 11,6 17,0 14,8
Informal 10,5 10,6 10,6 10,9 11,6 12,6 13,2 14,8 15,7 16,4 17,2 17,6 18,2 18,3 18,3 18,4 16,9 18,4 17,7 17,8 16,5 14,9 16,4Backyard 2,6 2,6 2,6 2,7 2,9 3,1 3,4 3,7 4,0 4,3 4,4 4,6 4,7 4,8 4,9 4,8 4,6 4,5 4,5 4,4 4,3 3,8 4,8
Other 0,2 0,2 0,2 0,2 0,2 0,2 0,2 0,3 0,3 0,3 0,3 0,3 0,3 0,3 0,3 0,3 0,3 0,3 0,3 0,3 0,3 0,2 0,3
.With each increase in single-year age category, anincreasing proportion of youth were living in aformal dwelling (from 62,4% of 14-year-olds to67,3% of 34-year-olds).
An increasing proportion were also living in aninformal dwelling or shack (from 10,5% among 14-year-olds to 18,4% among 29-year-olds, thendecreasing slightly).
A decreasing proportion, on the other hand, wasliving in traditional dwellings (from 24,3% of 14-year-olds to 11,6% of 34-year-olds).
These proportions differ from those found amonginfants and children, where higher proportions werecounted in traditional dwellings, and lowerproportions in formal or informal dwellings.

Description of youth and young adults (14–34) Census 2001
Statistics South Africa 109
Type of dwelling (concluded)
Figure 4.49: According to population group and sex, compared with all householdsB
lack
Afr
ican
Mal
e
Fem
ale
Bot
h se
xes
Col
oure
d
Mal
e
Fem
ale
Bot
h se
xes
Indi
an o
r Asi
an
Mal
e
Fem
ale
Bot
h se
xes
Whi
te
Mal
e
Fem
ale
Bot
h se
xes
All
grou
ps
Mal
e
Fem
ale
Bot
h se
xes
All
h'ho
lds
0,0
20,0
40,0
60,0
80,0
100,0%
Formal 57,3 57,7 57,5 88,1 87,5 87,7 93,2 93,1 93,2 95,2 95,4 95,3 64,0 64,0 64,0 63,8Traditional 19,9 21,1 20,6 2,6 2,6 2,6 1,5 1,4 1,4 1,1 1,1 1,1 16,4 17,5 17,0 14,8
Informal 18,4 17,0 17,7 6,2 6,6 6,4 1,1 1,0 1,1 0,5 0,5 0,5 15,4 14,5 14,9 16,4Backyard 4,1 3,9 4,0 2,8 3,1 3,0 4,0 4,2 4,1 2,9 2,8 2,9 3,9 3,8 3,8 4,8
Other 0,3 0,2 0,2 0,3 0,3 0,3 0,2 0,2 0,2 0,3 0,3 0,3 0,3 0,2 0,2 0,3
For example,17,7% of Africanyouth were livingin a traditionaldwelling, asagainst 1,1% ofwhite youth.
There weresome differencesin type ofdwelling by sexamong Africanyouth. Forexample, 19,9%of male Africanyouth were livingin a traditionaldwelling,compared to21,1% of femaleAfrican youth.
Figure 4.50: According to provinceThere were largedifferences in thepercentage of youthliving in different typesof dwelling by province.For example, in EasternCape, 47,1% of youthwas living in formaldwellings, comparedwith 81,9% in NorthernCape. In Eastern Cape,40,1% of youth wereliving in traditionaldwellings, comparedwith 1,4% in Gauteng.
In KwaZulu-Natal (9,5%)and Eastern Cape(9,6%), smallerpercentages of youthwere living in informaldwellings or shacksthan in Free State(24,0%) and Gauteng(23,2%).
EC KZN FS GP MP NW LP WC NC Total0,0
20,0
40,0
60,0
80,0
100,0%
Formal 47,1 54,5 64,3 68,1 68,2 71,3 71,5 77,2 81,9 64,0Traditional 40,1 32,0 8,5 1,4 15,0 5,3 20,7 2,3 3,2 17,0
Informal 9,6 9,5 24,0 23,2 13,9 20,5 5,5 17,8 11,7 14,9Backyard 3,1 3,7 2,9 7,0 2,7 2,6 2,2 2,4 2,3 3,8
Other 0,2 0,3 0,2 0,3 0,2 0,2 0,2 0,3 0,8 0,2

Description of youth and young adults (14–34) Census 2001
Stages in the life cycle of South Africans110
Access to services
Figure 4.51: Main energy source for lighting according to age, compared with all households, 1996and 2001
1996 14 15 16 17 18 19 20 21 22 23 24 25 26 27 28 29 30 31 32 33 34
14-3
4
All
h'ho
lds
2001 14 15 16 17 18 19 20 21 22 23 24 25 26 27 28 29 30 31 32 33 34
14-3
4
All
h'ho
lds
0,0
20,0
40,0
60,0
80,0
100,0%
Electricity Paraffin Candles Other
Source: Census 1996 and 2001
Figure 4.52: Access to piped water according to age, compared with all households, 1996 and 2001
1996 14 15 16 17 18 19 20 21 22 23 24 25 26 27 28 29 30 31 32 33 34
14-3
4
All
h'ho
lds
2001 14 15 16 17 18 19 20 21 22 23 24 25 26 27 28 29 30 31 32 33 34
14-3
4
All
h'ho
lds
0,0
20,0
40,0
60,0
80,0
100,0%
In dwelling/ in yard Public source No access
Source: Census 1996 and 2001
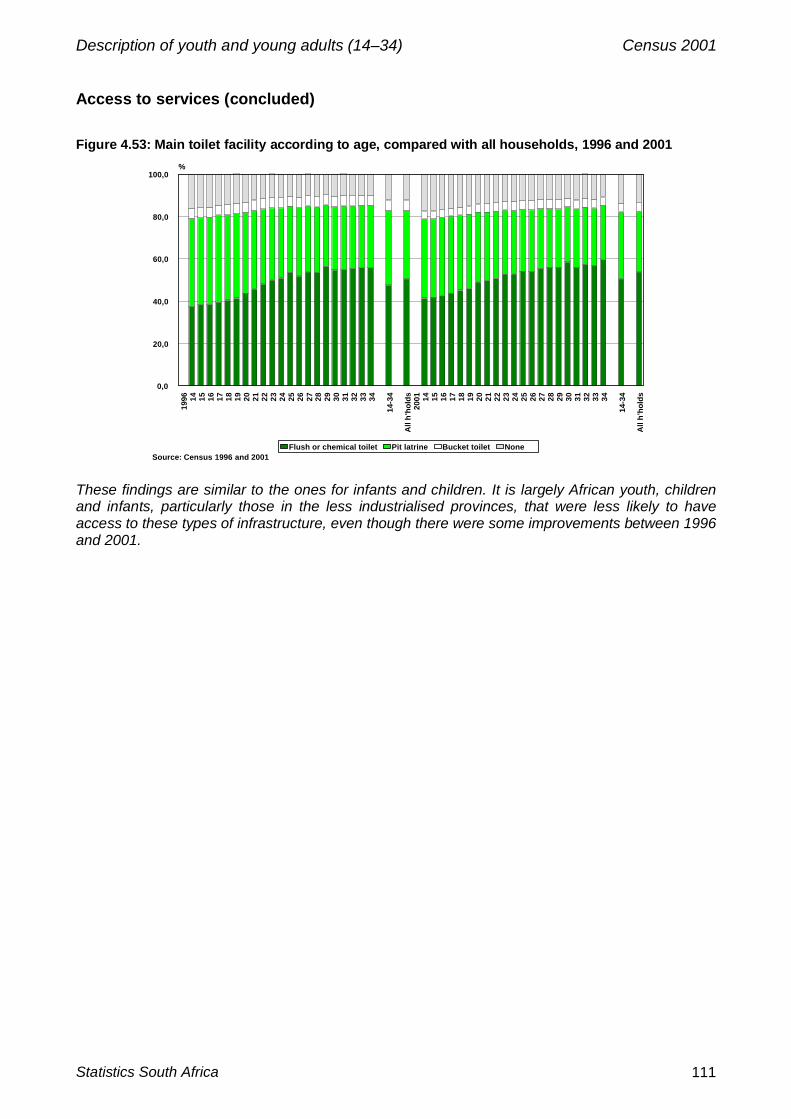
Description of youth and young adults (14–34) Census 2001
Statistics South Africa 111
Access to services (concluded)
Figure 4.53: Main toilet facility according to age, compared with all households, 1996 and 2001
1996 14 15 16 17 18 19 20 21 22 23 24 25 26 27 28 29 30 31 32 33 34
14-3
4
All
h'ho
lds
2001 14 15 16 17 18 19 20 21 22 23 24 25 26 27 28 29 30 31 32 33 34
14-3
4
All
h'ho
lds
0,0
20,0
40,0
60,0
80,0
100,0%
Flush or chemical toilet Pit latrine Bucket toilet NoneSource: Census 1996 and 2001
These findings are similar to the ones for infants and children. It is largely African youth, childrenand infants, particularly those in the less industrialised provinces, that were less likely to haveaccess to these types of infrastructure, even though there were some improvements between 1996and 2001.

Description of youth and young adults (14–34) Census 2001
Stages in the life cycle of South Africans112
Youth in collective living quarters
Table 4.3: Distribution of youth by age and type of living quarters
Collective living quartersHousing
unitResidential
hotelOther
residenceWorkers’
hostel Institution Homeless TotalAge N N N N N N N
14 954 692 2 254 1 455 4 329 13 863 252 976 846
15 982 606 2 393 1 617 4 525 16 369 292 1 007 802
16 999 551 2 458 1 835 5 004 18 616 293 1 027 757
17 953 099 2 540 2 320 5 857 17 967 250 982 033
18 957 412 2 982 4 571 8 290 17 591 210 991 056
19 933 502 3 375 8 069 10 501 17 374 252 973 073
20 873 459 3 402 8 294 11 637 16 711 208 913 710
21 882 816 3 463 7 701 15 355 16 856 229 926 420
22 806 082 3 375 6 197 16 418 15 839 208 848 119
23 753 210 3 283 4 756 17 272 14 494 196 793 211
24 771 609 3 460 3 796 19 475 14 500 223 813 063
25 774 243 3 587 3 209 20 043 14 266 225 815 573
26 770 787 3 593 2 653 21 459 13 987 211 812 691
27 739 253 3 479 2 273 20 229 13 524 221 778 979
28 712 920 3 253 1 917 19 922 12 855 201 751 069
29 738 415 3 327 1 768 20 097 12 788 234 776 628
30 637 649 2 911 1 453 16 551 10 491 202 669 257
31 702 809 3 051 1 480 19 631 12 062 226 739 259
32 648 584 2 861 1 369 16 951 10 468 242 680 475
33 638 213 2 699 1 201 17 105 10 255 237 669 710
34 556 732 2 327 1 051 13 620 8 269 201 582 200
Total 16 787 645 64 071 68 985 304 270 299 145 4 813 17 528 929
Table 4.3 shows that the vast majority of youth were accommodated in households livingin housing units. Relatively few were found in collective living quarters. These weredistributed as follows:
• 300 000 were in workers’ hostels;• 299 000 were in institutions;• a further 64 000 were in residential hotels; and• another 69 000 were in other types of residences.
In addition, there were 5 000 homeless youth, without shelter, counted in Census 2001.
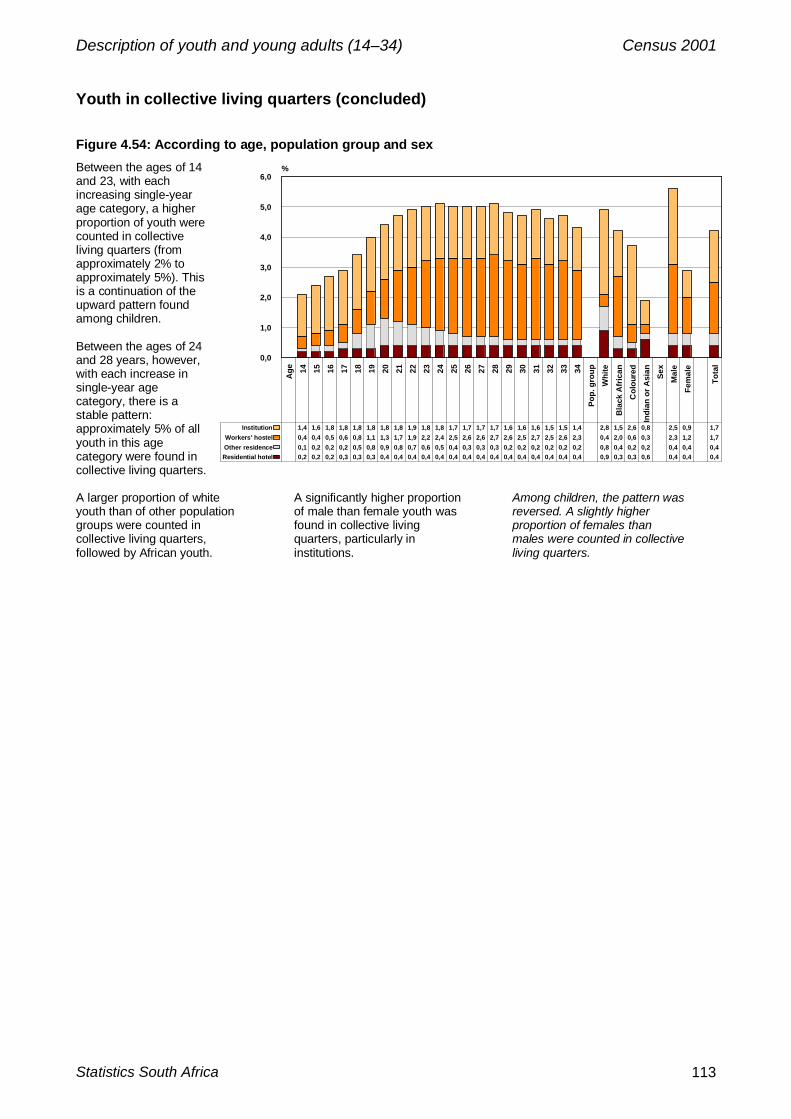
Description of youth and young adults (14–34) Census 2001
Statistics South Africa 113
Youth in collective living quarters (concluded)
Figure 4.54: According to age, population group and sexBetween the ages of 14and 23, with eachincreasing single-yearage category, a higherproportion of youth werecounted in collectiveliving quarters (fromapproximately 2% toapproximately 5%). Thisis a continuation of theupward pattern foundamong children.
Between the ages of 24and 28 years, however,with each increase insingle-year agecategory, there is astable pattern:approximately 5% of allyouth in this agecategory were found incollective living quarters.
A larger proportion of whiteyouth than of other populationgroups were counted incollective living quarters,followed by African youth.
A significantly higher proportionof male than female youth wasfound in collective livingquarters, particularly ininstitutions.
Among children, the pattern wasreversed. A slightly higherproportion of females thanmales were counted in collectiveliving quarters.
Age 14 15 16 17 18 19 20 21 22 23 24 25 26 27 28 29 30 31 32 33 34
Pop
. gro
upW
hite
Bla
ck A
fric
anC
olou
red
Indi
an o
r Asi
an Sex
Mal
eFe
mal
e
Tota
l
0,0
1,0
2,0
3,0
4,0
5,0
6,0%
Residential hotel 0,2 0,2 0,2 0,3 0,3 0,3 0,4 0,4 0,4 0,4 0,4 0,4 0,4 0,4 0,4 0,4 0,4 0,4 0,4 0,4 0,4 0,9 0,3 0,3 0,6 0,4 0,4 0,4Other residence 0,1 0,2 0,2 0,2 0,5 0,8 0,9 0,8 0,7 0,6 0,5 0,4 0,3 0,3 0,3 0,2 0,2 0,2 0,2 0,2 0,2 0,8 0,4 0,2 0,2 0,4 0,4 0,4Workers' hostel 0,4 0,4 0,5 0,6 0,8 1,1 1,3 1,7 1,9 2,2 2,4 2,5 2,6 2,6 2,7 2,6 2,5 2,7 2,5 2,6 2,3 0,4 2,0 0,6 0,3 2,3 1,2 1,7
Institution 1,4 1,6 1,8 1,8 1,8 1,8 1,8 1,8 1,9 1,8 1,8 1,7 1,7 1,7 1,7 1,6 1,6 1,6 1,5 1,5 1,4 2,8 1,5 2,6 0,8 2,5 0,9 1,7

Description of youth and young adults (14–34) Census 2001
Stages in the life cycle of South Africans114
Youth in institutions
Table 4.4: Number of youth in institutions by age and type of institution
AgeTouristhotel
Medicalfacility
Orphan-age
Home forthe
disabledSchoolhostel
Convent,etc.
Prison/police cells
Refugeecamp/
communityshelter
Defenceforce
barracks Total
14 297 659 1 126 351 10 256 377 668 100 29 13 863
15 339 784 1 121 387 12 017 412 1 157 103 49 16 369
16 395 988 1 094 395 12 852 498 2 214 123 57 18 616
17 372 1 254 884 338 11 472 434 3 058 90 65 17 967
18 372 1 252 549 305 9 036 449 5 399 98 131 17 591
19 462 1 485 460 283 7 802 389 6 175 96 222 17 374
20 518 1 537 472 281 6 824 390 6 138 117 434 16 711
21 579 1 697 487 194 5 905 365 7 186 118 325 16 856
22 683 1 667 347 181 4 582 384 7 477 126 392 15 839
23 621 1 644 279 152 3 358 345 7 496 119 480 14 494
24 672 1 649 228 165 2 891 318 7 888 153 536 14 500
25 731 1 838 217 202 2 160 332 8 047 144 595 14 266
26 719 1 773 187 178 1 829 294 8 183 126 698 13 987
27 767 1 767 174 172 1 594 313 7 852 131 754 13 524
28 719 1 746 212 177 1 311 269 7 505 129 787 12 855
29 739 1 876 185 220 1 221 252 7 369 152 774 12 788
30 719 1 622 167 179 966 234 5 808 133 663 10 491
31 773 1 905 237 176 1 154 247 6 674 140 756 12 062
32 781 1 724 226 178 979 187 5 629 116 648 10 468
33 644 1 668 187 184 977 185 5 647 129 634 10 255
34 588 1 455 199 156 771 196 4 318 112 474 8 269
Total 12 490 31 990 9 038 4 854 99 957 6 870 121 888 2 555 9 503 299 145
Table 4.4 indicates the number of youth counted in each type of institution (as a sub-category of collective living quarters) at the time of Census 2001. It shows that, of thetotal of approximately 299 000 such youth:
• 122 000 were in prisons or police cells;• 100 000 were in school hostels and other types of hostels not for workers;• 32 000 were in a medical facility such as a hospital;• 12 000 were in tourist hotels and related tourist accommodation;• 9 000 were in children’s homes and orphanages;• 10 000 were in defence force barracks or other military accommodation;• 7 000 were in initiation schools, religious retreats, convents and monasteries;• 5 000 were in homes for the disabled; and• 3 000 were in community or church halls, refugee camps and shelters for the
homeless.

Description of youth and young adults (14–34) Census 2001
Statistics South Africa 115
Youth in institutions (continued)
Table 4.5: Number of youth in prisons, correctional institutions and police cellsby age, population group and sex
Black African Coloured Indian or Asian White TotalAge Male Fem. Total Male Fem. Total Male Fem. Total Male Fem. Total Male Fem. Total
14 323 53 376 86 12 98 6 0 6 93 95 188 508 160 668
15 668 74 742 171 12 183 4 3 5 124 103 227 967 190 1 157
16 1 430 112 1 542 416 22 438 4 0 4 119 111 230 1 969 245 2 214
17 2 207 97 2 304 525 30 555 5 0 6 105 88 193 2 842 216 3 058
18 3 997 173 4 170 1 070 37 1 107 13 0 13 79 30 109 5 159 240 5 399
19 4 684 166 4 850 1 202 28 1 230 19 3 20 59 16 75 5 964 211 6 175
20 4 591 195 4 786 1 224 37 1 261 22 3 25 56 10 66 5 893 245 6 138
21 5 542 189 5 731 1 322 37 1 359 18 0 18 66 12 78 6 948 238 7 186
22 5 840 192 6 032 1 304 40 1 344 29 3 31 67 3 70 7 240 237 7 477
23 5 867 180 6 047 1 293 26 1 319 23 0 25 94 11 105 7 277 219 7 496
24 6 265 190 6 455 1 272 47 1 319 34 0 35 75 4 79 7 646 242 7 888
25 6 478 181 6 659 1 250 40 1 290 21 0 21 73 4 77 7 822 225 8 047
26 6 540 190 6 730 1 276 36 1 312 37 0 38 91 12 103 7 944 239 8 183
27 6 185 177 6 362 1 275 48 1 323 41 3 44 119 4 123 7 620 232 7 852
28 5 873 180 6 053 1 262 31 1 293 33 3 35 111 13 124 7 279 226 7 505
29 5 688 192 5 880 1 287 35 1 322 49 3 51 107 9 116 7 131 238 7 369
30 4 359 156 4 515 1 107 31 1 138 38 3 41 108 6 114 5 612 196 5 808
31 5 187 170 5 357 1 116 36 1 152 34 0 35 114 16 130 6 451 223 6 674
32 4 256 174 4 430 1 019 29 1 048 28 0 28 109 14 123 5 412 217 5 629
33 4 303 161 4 464 991 30 1 021 39 0 39 109 14 123 5 442 205 5 647
34 3 192 142 3 334 801 25 826 31 0 32 109 17 126 4 133 185 4 318
Total 93 475 3 344 96 819 21 269 669 21 938 528 24 552 1 987 592 2 579 117 259 4 629 121 888
Of the approximately171 000 people counted in prisons, correctional institutions andpolice cells, as many as 122 000 were between the ages of 14 and 34 years (71,4%).
Table 4.5 shows the distribution of these youth by age, sex and population group.• There was an increase in the number of detained youth with each single-year
age increase, from a low count of 700 aged 14 years to a high count of 8 200aged 26 years, followed by a more gradual decrease from a high count of 7 900aged 27 to a low count of 4 300 aged 34 years.
• The largest group, or 8 200 of the 122 000 youth in detention (6,7%) in 2001,were aged 26 years.
• The vast majority of youth in detention, 117 000 of 122 000, were males (96,2%).• The vast majority, 97 000, were African (79,4%). This is however a slightly
smaller proportion than the African percentage of all youth aged 14–34 years(81,0%).
• Coloured youth constituted 22 000 of the 122 000 detained youth (18,0%). Thisproportion is more than double the proportion of coloured youth in the country(8,7%).
• Only 3 000 of the detained youth (2,6%) was either white or Indian or Asian.
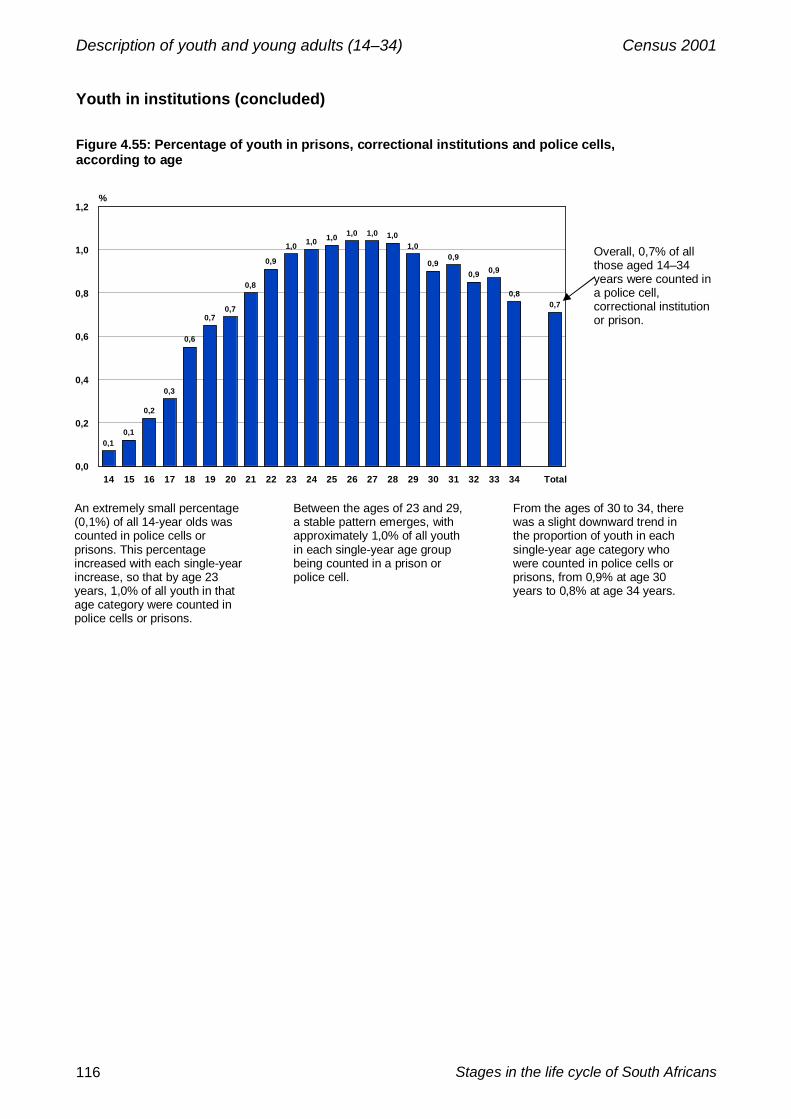
Description of youth and young adults (14–34) Census 2001
Stages in the life cycle of South Africans116
Youth in institutions (concluded)
Figure 4.55: Percentage of youth in prisons, correctional institutions and police cells,according to age
0,10,1
0,2
0,3
0,6
0,70,7
0,8
0,9
1,0 1,0 1,0 1,0 1,0 1,01,0
0,90,9
0,9 0,9
0,80,7
14 15 16 17 18 19 20 21 22 23 24 25 26 27 28 29 30 31 32 33 34 Total0,0
0,2
0,4
0,6
0,8
1,0
1,2%
Overall, 0,7% of allthose aged 14–34years were counted ina police cell,correctional institutionor prison.
An extremely small percentage(0,1%) of all 14-year olds wascounted in police cells orprisons. This percentageincreased with each single-yearincrease, so that by age 23years, 1,0% of all youth in thatage category were counted inpolice cells or prisons.
Between the ages of 23 and 29,a stable pattern emerges, withapproximately 1,0% of all youthin each single-year age groupbeing counted in a prison orpolice cell.
From the ages of 30 to 34, therewas a slight downward trend inthe proportion of youth in eachsingle-year age category whowere counted in police cells orprisons, from 0,9% at age 30years to 0,8% at age 34 years.

Census 2001
Statistics South Africa 117
Chapter 5: Description of South African adultsThe years between the ages of 35 and 64 are essentially a period of consolidation of one’spositions and roles in society. But they are also a period of change: of watching one’s childrenmove through infancy, childhood and early youth to become adults, and then possibly movingaway from the family home; of career change, from reaching the height of one’s career path orstable work situation to planning for retirement, and passing on acquired skills and roles in theworkplace to younger people. During this time of life, the death of at least one parent is likely to beexperienced, and these circumstances may require emotional adjustments to be made. Theperson’s role may change to one of becoming a grandparent, in addition to being a parent ofindependent children.
During this period, the person may start to confront some of the consequences of the agingprocess, in relation to their lifestyle. For example certain health risks and problems may manifestthemselves.
At this stage, relatively few people are likely to be concerned with completing their education orimproving their qualifications. The workplace may become the main means of materialimprovement, not only of their own life circumstances, but also of their dependents’. They may alsocontinue contributing in various ways, financially and otherwise, to their communities and the widersociety.
In this chapter, we examine the living conditions and life circumstances of the mature adultpopulation in South Africa (aged 35–64 years) by province, sex, population group, and otherappropriate variables, at the time of Census 2001, as well as providing some comparisons, whereappropriate, with Census 1996.
Demographic pictureTable 5.1 indicates that there were 11,7 millionmature adults aged 35–64 years in South Africa onthe night of 9–10 October 2001, or 26,1% of totalpopulation.
The table further shows that, bearing in mindpossible age-misreporting, with each five-yearincrease in age there was a decrease in thenumber of people compared with the previous agecategory. Thus there were 3,1 million people aged35–39 (26,3% of all mature adults), 2,6 millionaged 40–44 (22,4%), 2,1 million aged 45–49(17,9%), 1,6 million aged 50–54 (14,0%), 1,2million aged 55–59 (10,3%), and 1,1 million aged60–64 (9,1%).
This decline in numbers follows on the oneobserved among youth aged 20–34, after relativelyhigh percentages of people in the total populationwho were classified as infants, children andteenage youth.
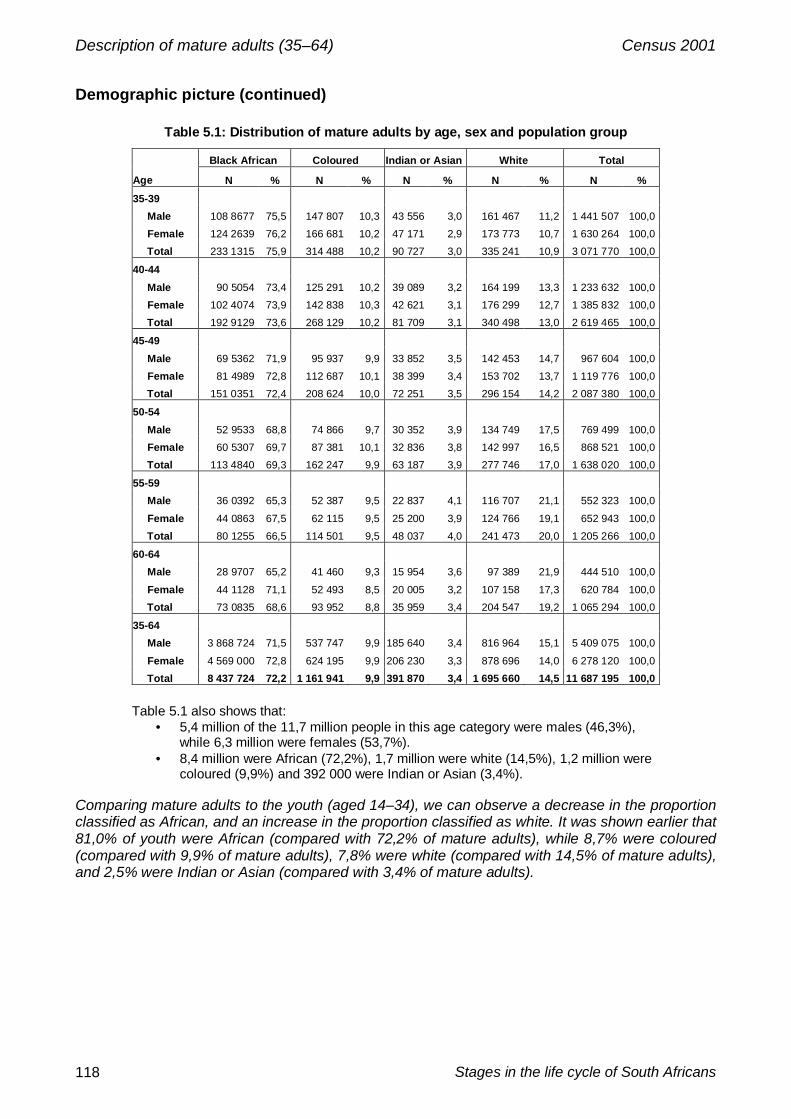
Description of mature adults (35–64) Census 2001
Stages in the life cycle of South Africans118
Demographic picture (continued)
Table 5.1: Distribution of mature adults by age, sex and population group
Black African Coloured Indian or Asian White Total
Age N % N % N % N % N %35-39 Male 108 8677 75,5 147 807 10,3 43 556 3,0 161 467 11,2 1 441 507 100,0
Female 124 2639 76,2 166 681 10,2 47 171 2,9 173 773 10,7 1 630 264 100,0
Total 233 1315 75,9 314 488 10,2 90 727 3,0 335 241 10,9 3 071 770 100,0
40-44 Male 90 5054 73,4 125 291 10,2 39 089 3,2 164 199 13,3 1 233 632 100,0
Female 102 4074 73,9 142 838 10,3 42 621 3,1 176 299 12,7 1 385 832 100,0
Total 192 9129 73,6 268 129 10,2 81 709 3,1 340 498 13,0 2 619 465 100,0
45-49 Male 69 5362 71,9 95 937 9,9 33 852 3,5 142 453 14,7 967 604 100,0
Female 81 4989 72,8 112 687 10,1 38 399 3,4 153 702 13,7 1 119 776 100,0
Total 151 0351 72,4 208 624 10,0 72 251 3,5 296 154 14,2 2 087 380 100,0
50-54 Male 52 9533 68,8 74 866 9,7 30 352 3,9 134 749 17,5 769 499 100,0
Female 60 5307 69,7 87 381 10,1 32 836 3,8 142 997 16,5 868 521 100,0
Total 113 4840 69,3 162 247 9,9 63 187 3,9 277 746 17,0 1 638 020 100,0
55-59 Male 36 0392 65,3 52 387 9,5 22 837 4,1 116 707 21,1 552 323 100,0
Female 44 0863 67,5 62 115 9,5 25 200 3,9 124 766 19,1 652 943 100,0
Total 80 1255 66,5 114 501 9,5 48 037 4,0 241 473 20,0 1 205 266 100,0
60-64 Male 28 9707 65,2 41 460 9,3 15 954 3,6 97 389 21,9 444 510 100,0
Female 44 1128 71,1 52 493 8,5 20 005 3,2 107 158 17,3 620 784 100,0
Total 73 0835 68,6 93 952 8,8 35 959 3,4 204 547 19,2 1 065 294 100,0
35-64 Male 3 868 724 71,5 537 747 9,9 185 640 3,4 816 964 15,1 5 409 075 100,0
Female 4 569 000 72,8 624 195 9,9 206 230 3,3 878 696 14,0 6 278 120 100,0
Total 8 437 724 72,2 1 161 941 9,9 391 870 3,4 1 695 660 14,5 11 687 195 100,0
Table 5.1 also shows that:• 5,4 million of the 11,7 million people in this age category were males (46,3%),
while 6,3 million were females (53,7%).• 8,4 million were African (72,2%), 1,7 million were white (14,5%), 1,2 million were
coloured (9,9%) and 392 000 were Indian or Asian (3,4%).
Comparing mature adults to the youth (aged 14–34), we can observe a decrease in the proportionclassified as African, and an increase in the proportion classified as white. It was shown earlier that81,0% of youth were African (compared with 72,2% of mature adults), while 8,7% were coloured(compared with 9,9% of mature adults), 7,8% were white (compared with 14,5% of mature adults),and 2,5% were Indian or Asian (compared with 3,4% of mature adults).

Description of mature adults (35–64) Census 2001
Statistics South Africa 119
Demographic picture (concluded)
Figure 5.1: Male and female adults by population group, compared with the total population, 1996and 2001
Male 1996 2001 Female 1996 2001 Bothsexes
1996 2001 Totalpop.
1996 20010,0
20,0
40,0
60,0
80,0
100,0%
Black African 69,8 71,5 71,0 72,8 70,4 72,2 77,4 79,0Coloured 9,5 9,9 9,6 9,9 9,6 9,9 9,0 8,9
Indian or Asian 3,5 3,4 3,4 3,3 3,4 3,4 2,6 2,5White 17,2 15,1 16,0 14,0 16,6 14,5 11,0 9,6
Source: Census 1996 and 2001Excluding unspecified in 1996
The percentage ofAfrican matureadults increasedbetween the twocensuses (from70,4% in 1996 to72,2% in 2001). Onthe other hand, thepercentage of whiteadults in this agegroup haddecreased (from16,6% in 1996 to14,5% in 2001).
Figure 5.2: Adults in each province by population group, 1996 and 2001
Between 1996 and2001, the proportionthat was Africanincreased in allprovinces except NorthWest, while theproportion that waswhite decreased in allprovinces exceptEastern Cape, wherethere was an increase,and North West, wherethe proportion remainedsimilar.
In Western Cape andNorthern Cape,coloured adultsremained in themajority.
WC
1996
2001 NC
1996
2001 GP
1996
2001
KZN
1996
2001 FS
1996
2001 EC
1996
2001 MP
1996
2001 NW
1996
2001 LP
1996
2001
Tota
l
1996
2001
0,0
20,0
40,0
60,0
80,0
100,0%
Black African 18,5 21,2 33,2 34,4 66,0 68,5 73,8 76,9 78,8 84,5 81,6 88,1 85,3 88,1 88,9 88,7 94,1 95,0 70,4 72,2Coloured 52,2 53,6 48,0 48,4 3,3 3,5 1,7 1,8 4,3 3,1 8,9 0,8 0,7 0,8 1,4 1,6 0,3 0,2 9,6 9,9
Indian or Asian 1,1 1,1 0,3 0,3 2,3 2,7 13,3 12,6 0,1 0,1 0,5 0,5 0,6 0,5 0,4 0,4 0,2 0,2 3,4 3,4White 28,2 24,2 18,5 16,9 28,4 25,4 11,3 8,7 16,8 12,3 9,0 10,6 13,4 10,6 9,3 9,3 5,4 4,5 16,6 14,5
Source: Census 1996 and 2001

Description of mature adults (35–64) Census 2001
Stages in the life cycle of South Africans120
Parents alive
Figure 5.3: According to ageBoth parents werereported as being aliveamong 17,9% of matureadults, only the motheramong 32,4%, and onlythe father among 6,2%.
The graph shows that asteady decrease withincreasing age in thepercentage of adultswith both parents alive,from 37,2% among 35-year-olds to 1,7%among 64-year-olds.
Note: The total proportion of ‘mothers alive’ can be obtained by adding together the bottom two segments of the bar; thetotal proportion of fathers alive can be obtained by adding the bottom segment with the ‘father alive mother dead’segment.
We have already seen in Chapters 2, 3, and 4 that there was a steady decrease in the proportionof infants, children and youth with both parents reported as alive with each single-year increase inage. As would be expected, the trend of losing one or both parents continued through youth intomature adulthood. But variation by population group and sex was less for mature adults and istherefore not illustrated here.
35 36 37 38 39 40 41 42 43 44 45 46 47 48 49 50 51 52 53 54 55 56 57 58 59 60 61 62 63 64 35-64
0,0
20,0
40,0
60,0
80,0
100,0%
Both parents alive 37,2 34,6 32,4 30,1 28,4 26,7 24,2 21,9 20,0 18,7 16,9 15,5 13,9 12,4 11,2 10,1 8,7 7,6 6,7 6,0 5,2 4,7 4,3 3,8 3,4 3,1 2,6 2,0 1,8 1,7 17,9Mother alive, father dead 36,8 37,6 38,1 38,3 38,5 38,2 38,4 38,1 38,2 37,8 37,0 36,4 35,7 34,8 33,5 31,9 30,8 28,8 27,6 26,3 24,5 23,0 21,6 19,8 18,4 16,2 14,9 12,9 11,7 10,4 32,4
Father alive, mother dead 7,8 7,8 7,8 7,9 7,8 7,8 7,7 7,4 7,2 7,2 7,0 6,8 6,5 6,2 6,0 5,8 5,3 4,9 4,7 4,4 4,0 3,8 3,5 3,3 3,1 2,8 2,5 2,3 2,1 2,0 6,2Neither parent alive 18,2 20,1 21,7 23,7 25,3 27,3 29,7 32,6 34,6 36,4 39,1 41,3 43,8 46,5 49,3 52,1 55,2 58,7 61,0 63,3 66,3 68,5 70,6 73,1 75,2 77,8 80,0 82,8 84,5 86,0 43,6
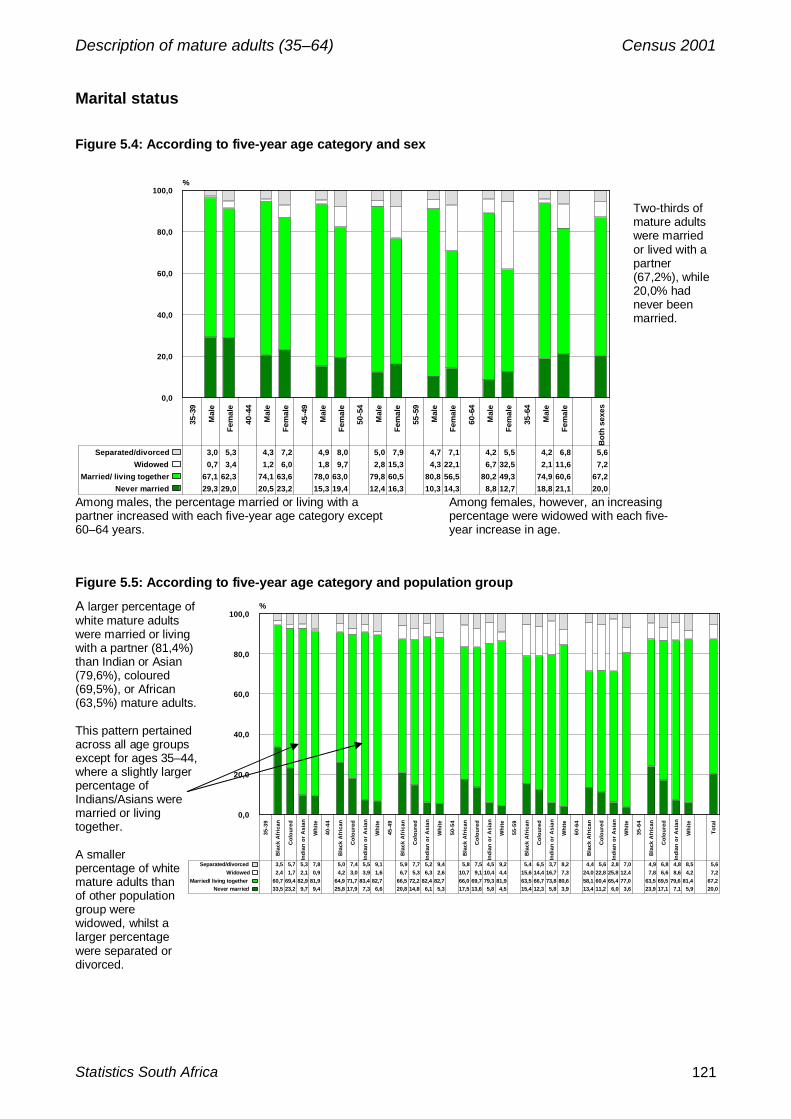
Description of mature adults (35–64) Census 2001
Statistics South Africa 121
Marital status
Figure 5.4: According to five-year age category and sex
35-3
9
Mal
e
Fem
ale
40-4
4
Mal
e
Fem
ale
45-4
9
Mal
e
Fem
ale
50-5
4
Mal
e
Fem
ale
55-5
9
Mal
e
Fem
ale
60-6
4
Mal
e
Fem
ale
35-6
4
Mal
e
Fem
ale
Bot
h se
xes
0,0
20,0
40,0
60,0
80,0
100,0%
Never married 29,3 29,0 20,5 23,2 15,3 19,4 12,4 16,3 10,3 14,3 8,8 12,7 18,8 21,1 20,0Married/ living together 67,1 62,3 74,1 63,6 78,0 63,0 79,8 60,5 80,8 56,5 80,2 49,3 74,9 60,6 67,2
Widowed 0,7 3,4 1,2 6,0 1,8 9,7 2,8 15,3 4,3 22,1 6,7 32,5 2,1 11,6 7,2Separated/divorced 3,0 5,3 4,3 7,2 4,9 8,0 5,0 7,9 4,7 7,1 4,2 5,5 4,2 6,8 5,6
Two-thirds ofmature adultswere marriedor lived with apartner(67,2%), while20,0% hadnever beenmarried.
Among males, the percentage married or living with apartner increased with each five-year age category except60–64 years.
Among females, however, an increasingpercentage were widowed with each five-year increase in age.
Figure 5.5: According to five-year age category and population group
A larger percentage ofwhite mature adultswere married or livingwith a partner (81,4%)than Indian or Asian(79,6%), coloured(69,5%), or African(63,5%) mature adults.
This pattern pertainedacross all age groupsexcept for ages 35–44,where a slightly largerpercentage ofIndians/Asians weremarried or livingtogether.
A smallerpercentage of whitemature adults thanof other populationgroup werewidowed, whilst alarger percentagewere separated ordivorced.
35-3
9
Bla
ck A
fric
an
Col
oure
d
Indi
an o
r A
sian
Whi
te
40-4
4
Bla
ck A
fric
an
Col
oure
d
Indi
an o
r A
sian
Whi
te
45-4
9
Bla
ck A
fric
an
Col
oure
d
Indi
an o
r A
sian
Whi
te
50-5
4
Bla
ck A
fric
an
Col
oure
d
Indi
an o
r A
sian
Whi
te
55-5
9
Bla
ck A
fric
an
Col
oure
d
Indi
an o
r A
sian
Whi
te
60-6
4
Bla
ck A
fric
an
Col
oure
d
Indi
an o
r A
sian
Whi
te
35-6
4
Bla
ck A
fric
an
Col
oure
d
Indi
an o
r A
sian
Whi
te
Tota
l
0,0
20,0
40,0
60,0
80,0
100,0%
Never married 33,5 23,2 9,7 9,4 25,8 17,9 7,3 6,6 20,8 14,8 6,1 5,3 17,5 13,6 5,8 4,5 15,4 12,3 5,8 3,9 13,4 11,2 6,0 3,6 23,9 17,1 7,1 5,9 20,0Married/ living together 60,7 69,4 82,9 81,9 64,9 71,7 83,4 82,7 66,5 72,2 82,4 82,7 66,0 69,7 79,3 81,9 63,5 66,7 73,8 80,6 58,1 60,4 65,4 77,0 63,5 69,5 79,6 81,4 67,2
Widowed 2,4 1,7 2,1 0,9 4,2 3,0 3,9 1,6 6,7 5,3 6,3 2,6 10,7 9,1 10,4 4,4 15,6 14,4 16,7 7,3 24,0 22,8 25,8 12,4 7,8 6,6 8,6 4,2 7,2Separated/divorced 3,5 5,7 5,3 7,8 5,0 7,4 5,5 9,1 5,9 7,7 5,2 9,4 5,8 7,5 4,5 9,2 5,4 6,5 3,7 8,2 4,4 5,6 2,8 7,0 4,9 6,8 4,8 8,5 5,6
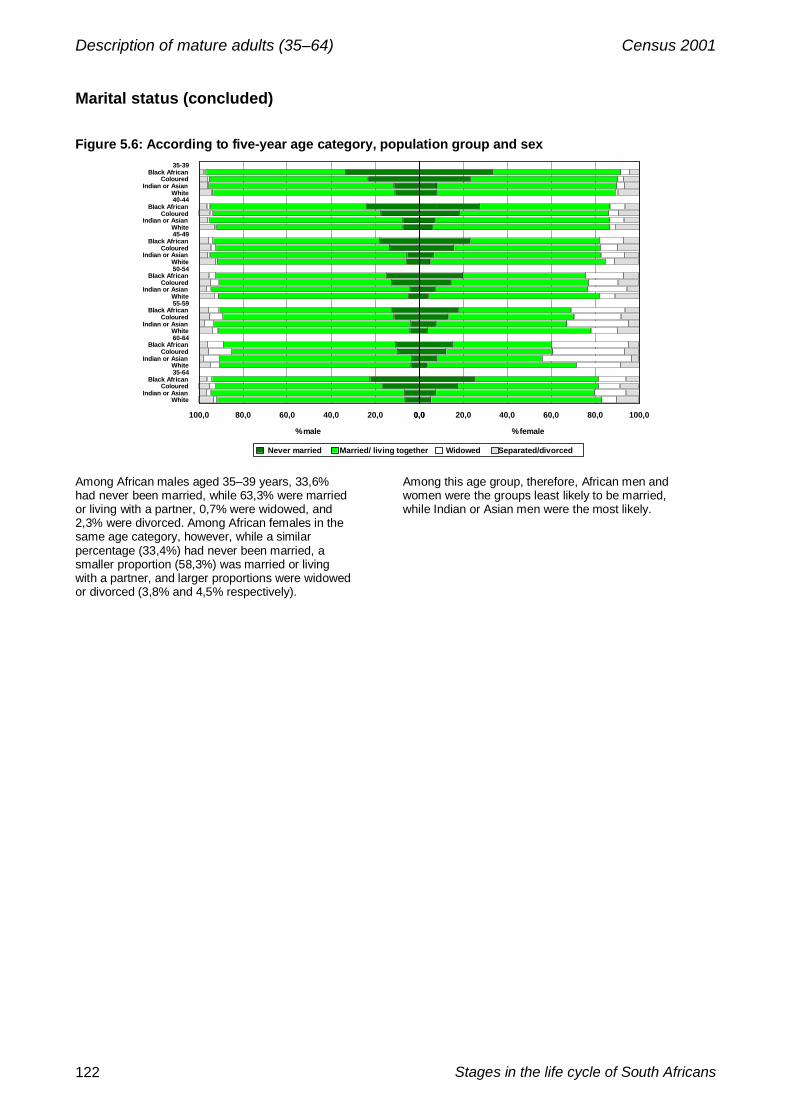
Description of mature adults (35–64) Census 2001
Stages in the life cycle of South Africans122
Marital status (concluded)
Figure 5.6: According to five-year age category, population group and sex35-39
Black AfricanColoured
Indian or AsianWhite40-44
Black AfricanColoured
Indian or AsianWhite45-49
Black AfricanColoured
Indian or AsianWhite50-54
Black AfricanColoured
Indian or AsianWhite55-59
Black AfricanColoured
Indian or AsianWhite60-64
Black AfricanColoured
Indian or AsianWhite35-64
Black AfricanColoured
Indian or AsianWhite
0,020,040,060,080,0100,0
% male
0,0 20,0 40,0 60,0 80,0 100,0
% female
Never married Married/ living together Widowed Separated/divorced
Among African males aged 35–39 years, 33,6%had never been married, while 63,3% were marriedor living with a partner, 0,7% were widowed, and2,3% were divorced. Among African females in thesame age category, however, while a similarpercentage (33,4%) had never been married, asmaller proportion (58,3%) was married or livingwith a partner, and larger proportions were widowedor divorced (3,8% and 4,5% respectively).
Among this age group, therefore, African men andwomen were the groups least likely to be married,while Indian or Asian men were the most likely.

Description of mature adults (35–64) Census 2001
Statistics South Africa 123
Women who had given birth (35–50)The Census 2001 fertility questions were only asked of women aged 12–50 years. Thus noinformation on birth among women older than 50 years is available for this report.
Figure 5.7: According to age by the number of children to whom they had given birth
35 36 37 38 39 40 41 42 43 44 45 46 47 48 49 50 35-500,0
20,0
40,0
60,0
80,0
100,0%
0 8,9 8,4 7,9 7,7 7,4 7,3 7,0 6,8 6,7 6,7 6,8 6,9 6,8 6,7 7,0 7,8 7,41 15,4 14,1 13,3 12,5 12,0 11,7 11,1 11,0 10,7 10,7 10,5 10,5 10,3 10,2 10,1 10,6 11,82 27,6 26,0 24,9 23,7 23,0 23,2 21,8 21,2 20,6 20,7 20,2 19,6 19,1 18,6 18,2 19,0 22,23 22,3 22,3 22,4 22,0 21,8 21,5 21,2 20,8 20,3 20,2 19,8 19,5 19,3 18,6 18,1 18,3 20,84 13,3 14,3 14,7 15,2 15,3 15,1 15,4 15,5 15,5 15,2 15,1 15,1 15,0 15,0 14,7 14,2 14,95 6,8 7,7 8,3 9,1 9,4 9,4 10,0 10,1 10,5 10,3 10,5 10,5 10,7 10,8 11,0 10,4 9,56 3,3 4,0 4,5 5,0 5,4 5,6 6,2 6,5 6,8 6,9 7,2 7,3 7,6 7,8 8,0 7,3 6,0
7 + 2,5 3,2 3,9 4,8 5,6 6,2 7,2 8,0 8,9 9,3 9,9 10,7 11,3 12,1 13,0 12,4 7,5
Excluding invalid responses
Figure 5.7 is essentially a continuation of Figure 4.9 in Chapter 4.
It indicates that after the age of 34 years, the downward trend of never having given birthcontinues, but more gradually, from 8,9% of women aged 35 to 6,7% at the age of 43.After this age the pattern shows a slight upward, if fluctuating trend, to reach 7,8% amongwomen aged 50.
At the age of 34 (previous chapter), 10,2% of women had given birth to five or morechildren. We now see that at the age of 35 years, 12,6% of women had given birth to fiveor more children. By the age of 49 years, 32,0% of women had given birth to five or morechildren.
The proportion of women who had given birth to seven or more children increased witheach single-year age increase, from 2,5% at the age of 35 years to 13,0% at the age of49 years.
There was thus a continuing but gradually slowing trend for women to have given birth to morechildren with increasing age.
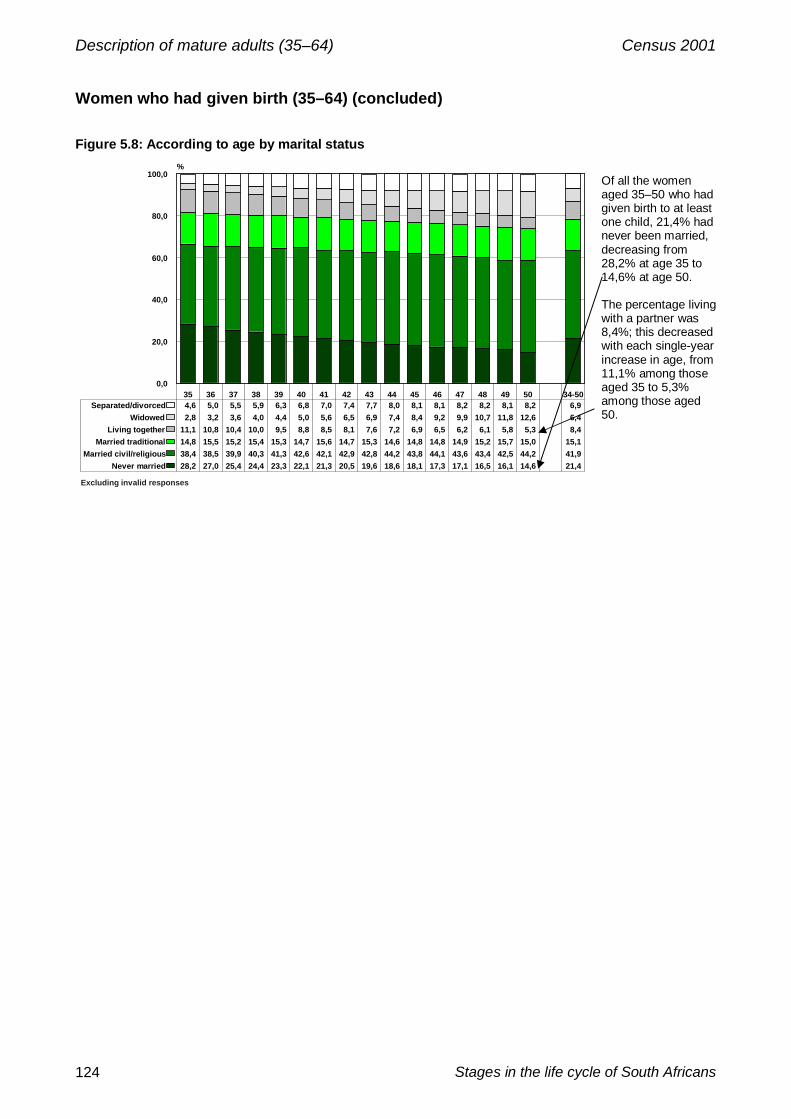
Description of mature adults (35–64) Census 2001
Stages in the life cycle of South Africans124
Women who had given birth (35–64) (concluded)
Figure 5.8: According to age by marital status
35 36 37 38 39 40 41 42 43 44 45 46 47 48 49 50 34-500,0
20,0
40,0
60,0
80,0
100,0%
Never married 28,2 27,0 25,4 24,4 23,3 22,1 21,3 20,5 19,6 18,6 18,1 17,3 17,1 16,5 16,1 14,6 21,4Married civil/religious 38,4 38,5 39,9 40,3 41,3 42,6 42,1 42,9 42,8 44,2 43,8 44,1 43,6 43,4 42,5 44,2 41,9
Married traditional 14,8 15,5 15,2 15,4 15,3 14,7 15,6 14,7 15,3 14,6 14,8 14,8 14,9 15,2 15,7 15,0 15,1Living together 11,1 10,8 10,4 10,0 9,5 8,8 8,5 8,1 7,6 7,2 6,9 6,5 6,2 6,1 5,8 5,3 8,4
Widowed 2,8 3,2 3,6 4,0 4,4 5,0 5,6 6,5 6,9 7,4 8,4 9,2 9,9 10,7 11,8 12,6 6,4Separated/divorced 4,6 5,0 5,5 5,9 6,3 6,8 7,0 7,4 7,7 8,0 8,1 8,1 8,2 8,2 8,1 8,2 6,9
Excluding invalid responses
Of all the womenaged 35–50 who hadgiven birth to at leastone child, 21,4% hadnever been married,decreasing from28,2% at age 35 to14,6% at age 50.
The percentage livingwith a partner was8,4%; this decreasedwith each single-yearincrease in age, from11,1% among thoseaged 35 to 5,3%among those aged50.

Description of mature adults (35–64) Census 2001
Statistics South Africa 125
Relationship to household head
Figure 5.9: According to ageOf mature adults, 57,4%were the actual head oracting head of thehousehold in which theylived. Another largegroup, 25,6%, were thespouses or partners ofthe household head.
A decreasingpercentage, from 15,1%among 35-year-olds to0,5% among 64-year-olds were children of thehousehold head.
When comparing this profile with that of infants, children and youths, we notice a strong movementaway from living with grandparents and great-grandparents or even parents as household heads,towards the person him- or herself becoming the household head.
Figure 5.10: According to five-year age category and sex75,4% of males aged35–64 years definedthemselves as thehousehold head oracting head, while only42,2% of femalesdefined themselves inthis way.
On the other hand,41,2% of femalesdefined themselves asthe spouse of thehousehold head, asagainst 7,3% males whodefined themselves inthis way.
With each increase in five-year age group, anincreasing proportion of men defined themselves ashead or acting head of the household, from 68,1%of those aged 35–39 to 82,7% of those aged 60–64.
A similar increase was found among women, from35,2% of those aged 35–39 to 53,5% of those aged60–64.
The sex of the respondent was the most important variable influencing whether or not matureadults defined themselves as heads of households or spouses of heads. There were relativelyminor population group and provincial differences regarding the way in which mature adultsdefined their relationship to the household head. These minor differences are not discussed furtheror shown graphically.
35-3
9
Mal
e
Fem
ale
40-4
4
Mal
e
Fem
ale
45-4
9
Mal
e
Fem
ale
50-5
4
Mal
e
Fem
ale
55-5
9
Mal
e
Fem
ale
60-6
4
Mal
e
Fem
ale
35-6
4
Mal
e
Fem
ale
Tota
l
0,0
20,0
40,0
60,0
80,0
100,0%
H'hold head 68,1 35,2 73,7 39,8 77,6 43,3 79,9 45,5 81,8 47,8 82,7 53,5 75,4 42,2 57,4Spouse/partner 7,1 42,3 7,5 43,1 7,5 42,7 7,3 41,5 7,0 39,4 6,7 32,9 7,3 41,2 25,6
Child/ adopted child 13,8 11,7 9,2 7,4 5,8 4,6 3,5 2,9 1,9 1,7 0,9 0,8 7,6 6,2 6,8Grandchild/great-grandchild 0,5 0,4 0,2 0,2 0,1 0,1 0,1 0,0 0,0 0,0 0,0 0,0 0,2 0,2 0,2
Other relative 9,0 8,9 8,0 8,0 7,7 7,9 8,0 8,7 8,2 10,0 8,6 11,9 8,3 8,9 8,6Not related 1,5 1,5 1,3 1,5 1,2 1,4 1,2 1,4 1,2 1,2 1,0 0,8 1,3 1,4 1,3
35 36 37 38 39 40 41 42 43 44 45 46 47 48 49 50 51 52 53 54 55 56 57 58 59 60 61 62 63 64 35-64
0,0
20,0
40,0
60,0
80,0
100,0%
H'hold head 47,7 49,1 50,9 51,8 52,9 53,2 54,8 55,8 56,9 57,7 57,9 58,4 59,4 59,6 60,3 59,6 61,9 62,0 62,2 62,5 62,4 62,8 63,1 63,7 64,5 64,1 65,6 65,9 66,5 66,8 57,4Spouse/partner 25,3 25,7 26,0 26,3 26,3 26,4 26,4 26,8 26,4 26,5 26,6 26,8 26,5 26,6 25,9 26,8 25,0 25,2 25,4 25,3 25,3 24,8 25,2 24,4 23,3 23,0 22,2 22,1 21,5 20,8 25,6
Child/ adopted child 15,1 13,7 12,4 11,4 10,6 10,0 9,0 8,0 7,3 6,7 6,1 5,6 5,1 4,7 4,3 3,9 3,6 3,0 2,7 2,4 2,2 2,0 1,6 1,5 1,4 1,2 1,0 0,8 0,6 0,5 6,8Grandchild/great-grandchild 0,6 0,5 0,4 0,4 0,3 0,3 0,2 0,2 0,2 0,1 0,1 0,1 0,1 0,1 0,1 0,1 0,0 0,0 0,0 0,0 0,0 0,0 0,0 0,0 0,0 0,0 0,0 0,0 0,0 0,0 0,2
Other relative 9,6 9,4 8,7 8,6 8,5 8,5 8,2 7,9 7,8 7,6 7,9 7,8 7,6 7,7 8,0 8,2 8,2 8,4 8,5 8,6 8,9 9,1 8,9 9,2 9,7 10,6 10,2 10,5 10,6 11,1 8,6Not related 1,6 1,5 1,4 1,4 1,4 1,5 1,4 1,4 1,3 1,3 1,4 1,3 1,3 1,3 1,4 1,5 1,3 1,3 1,2 1,3 1,3 1,2 1,2 1,1 1,1 1,2 0,9 0,8 0,8 0,8 1,3

Description of mature adults (35–64) Census 2001
Stages in the life cycle of South Africans126
EducationThe educational attainments of mature adults influence the type of work they can undertake, andthe type of lifestyle they may live. Formal education, particularly the attainment of tertiaryqualifications, remains the key for people in this life stage to high-level employment opportunities.In this section we look at the educational profile of mature adults.
Figure 5.11: Percentage attending an educational institution according to five-year age category,population group and sex
35-3
9
Bla
ck A
fric
an
Col
oure
d
Indi
an o
r Asi
an
Whi
te
40-4
4
Bla
ck A
fric
an
Col
oure
d
Indi
an o
r Asi
an
Whi
te
45-4
9
Bla
ck A
fric
an
Col
oure
d
Indi
an o
r Asi
an
Whi
te
50-5
4
Bla
ck A
fric
an
Col
oure
d
Indi
an o
r Asi
an
Whi
te
55-5
9
Bla
ck A
fric
an
Col
oure
d
Indi
an o
r Asi
an
Whi
te
60-6
4
Bla
ck A
fric
an
Col
oure
d
Indi
an o
r Asi
an
Whi
te
35-6
4
Bla
ck A
fric
an
Col
oure
d
Indi
an o
r Asi
an
Whi
te
Tota
l
0,0
1,0
2,0
3,0
4,0
5,0%
Male 3,5 2,5 3,7 4,6 3,0 2,2 2,6 3,4 2,6 1,9 1,8 2,7 2,1 1,7 1,3 2,0 2,1 1,6 1,2 1,7 1,9 1,5 1,1 1,4 2,8 2,1 2,2 2,8 2,7Female 3,7 2,3 3,0 4,1 3,2 2,0 2,1 3,2 2,7 1,7 1,4 2,6 2,1 1,6 1,0 2,0 2,0 1,4 0,9 1,7 1,7 1,4 0,9 1,4 2,8 1,8 1,7 2,7 2,7
Only 2,7% of mature male and female adults wereattending an educational institution. The likelihoodof studying decreased with increasing age.Differences by sex were slight.
In each five-year age category except Indian/Asianmales (35–39 years), a higher proportion of whiteand African mature adults were studying than of theother population groups.

Description of mature adults (35–64) Census 2001
Statistics South Africa 127
Education (continued)
Figure 5.12: Educational attainment according to age
35 36 37 38 39 40 41 42 43 44 45 46 47 48 49 50 51 52 53 54 55 56 57 58 59 60 61 62 63 64 35-64
0,0
20,0
40,0
60,0
80,0
100,0%
No schooling 13,3 14,1 14,5 15,5 16,2 17,1 17,8 18,2 19,0 19,2 20,5 21,4 21,8 22,7 24,2 25,4 27,1 26,4 26,0 25,9 26,4 27,4 28,0 29,2 32,0 35,5 40,2 36,4 35,9 35,7 21,9Some primary 16,5 17,6 18,2 19,2 19,6 19,3 20,2 20,8 21,8 21,4 21,4 22,1 22,4 23,4 24,3 22,2 23,3 23,0 22,9 22,3 21,8 21,6 21,5 21,9 23,3 20,9 21,7 20,2 20,2 20,2 20,8
Complete primary 7,5 8,0 8,0 8,1 8,1 7,7 8,1 8,1 8,3 8,2 8,1 8,0 8,0 8,0 8,0 7,3 7,5 7,4 7,5 7,3 7,2 7,1 6,6 6,6 6,7 5,7 5,6 5,7 5,9 5,7 7,6Some secondary 31,8 31,8 31,8 31,1 30,5 29,7 29,6 29,4 28,9 29,0 28,4 27,6 27,7 26,9 25,8 25,5 24,8 25,0 25,3 25,2 25,2 24,9 24,5 24,2 22,7 21,7 19,5 21,9 22,4 22,8 27,7Std 10/ Grade 12 20,2 18,4 17,6 16,5 16,1 16,2 14,7 14,0 12,8 12,8 12,4 11,8 11,4 10,8 10,3 11,3 10,1 10,7 10,7 11,3 11,4 11,3 11,4 10,7 9,3 9,7 7,8 9,4 9,6 9,6 13,3
Higher 10,7 10,0 9,9 9,5 9,6 10,0 9,5 9,6 9,1 9,4 9,2 9,1 8,6 8,1 7,4 8,3 7,2 7,5 7,5 7,9 8,0 7,6 8,0 7,3 6,1 6,5 5,2 6,3 6,0 6,0 8,7
There was a steady increase inthe proportion of mature adultswith no formal education witheach successive increase insingle-year age category, from13,3% among 35-year-olds toreach 40,2% among 61-year-olds (followed by a slightdownward movement to reach35,7% among 64-year-olds).This pattern continues from theone found among youth, where1,8% of 14-year-olds had noformal education, increasing to11,4% among 34-year-olds.
A similar pattern was found, withsome fluctuations, for those withonly some primary education,starting from 16,5% among 35-year-olds, to reach 24,3%among 49-year-olds (and thenfluctuating, but going graduallydownwards, to reach 20,2%among 64-year-olds).
The percentage of those withsome secondary education astheir highest level actuallydecreased with increasing age,as did the percentage of thosewith a complete secondaryeducation, and of those withtertiary qualifications (with someslight fluctuations).
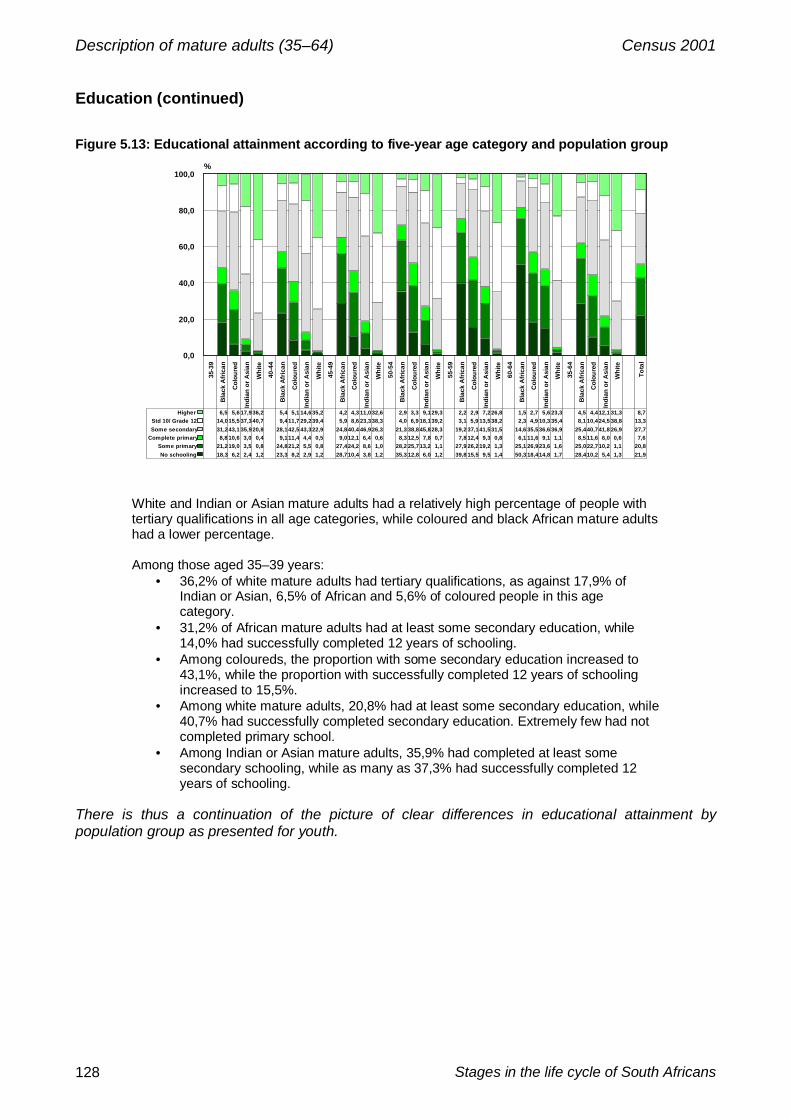
Description of mature adults (35–64) Census 2001
Stages in the life cycle of South Africans128
Education (continued)
Figure 5.13: Educational attainment according to five-year age category and population group
35-3
9
Bla
ck A
fric
an
Col
oure
d
Indi
an o
r Asi
an
Whi
te
40-4
4
Bla
ck A
fric
an
Col
oure
d
Indi
an o
r Asi
an
Whi
te
45-4
9
Bla
ck A
fric
an
Col
oure
d
Indi
an o
r Asi
an
Whi
te
50-5
4
Bla
ck A
fric
an
Col
oure
d
Indi
an o
r Asi
an
Whi
te
55-5
9
Bla
ck A
fric
an
Col
oure
d
Indi
an o
r Asi
an
Whi
te
60-6
4
Bla
ck A
fric
an
Col
oure
d
Indi
an o
r Asi
an
Whi
te
35-6
4
Bla
ck A
fric
an
Col
oure
d
Indi
an o
r Asi
an
Whi
te
Tota
l
0,0
20,0
40,0
60,0
80,0
100,0%
No schooling 18,3 6,2 2,4 1,2 23,3 8,2 2,9 1,2 28,710,4 3,8 1,2 35,3 12,8 6,0 1,2 39,8 15,5 9,5 1,4 50,3 18,414,8 1,7 28,410,2 5,4 1,3 21,9Some primary 21,219,0 3,5 0,8 24,821,2 5,5 0,8 27,424,2 8,6 1,0 28,2 25,713,2 1,1 27,9 26,219,2 1,3 25,1 26,923,6 1,6 25,022,710,2 1,1 20,8
Complete primary 8,8 10,6 3,0 0,4 9,111,4 4,4 0,5 9,012,1 6,4 0,6 8,3 12,5 7,8 0,7 7,8 12,4 9,3 0,8 6,1 11,6 9,1 1,1 8,5 11,6 6,0 0,6 7,6Some secondary 31,243,1 35,920,8 28,142,5 43,322,9 24,840,4 46,926,3 21,3 38,845,828,3 19,2 37,141,531,5 14,6 35,536,6 36,9 25,440,741,8 26,9 27,7Std 10/ Grade 12 14,015,5 37,340,7 9,411,7 29,239,4 5,9 8,6 23,338,3 4,0 6,9 18,139,2 3,1 5,9 13,538,2 2,3 4,9 10,3 35,4 8,1 10,424,5 38,8 13,3
Higher 6,5 5,6 17,936,2 5,4 5,1 14,635,2 4,2 4,3 11,032,6 2,9 3,3 9,129,3 2,2 2,9 7,226,8 1,5 2,7 5,6 23,3 4,5 4,412,1 31,3 8,7
White and Indian or Asian mature adults had a relatively high percentage of people withtertiary qualifications in all age categories, while coloured and black African mature adultshad a lower percentage.
Among those aged 35–39 years:• 36,2% of white mature adults had tertiary qualifications, as against 17,9% of
Indian or Asian, 6,5% of African and 5,6% of coloured people in this agecategory.
• 31,2% of African mature adults had at least some secondary education, while14,0% had successfully completed 12 years of schooling.
• Among coloureds, the proportion with some secondary education increased to43,1%, while the proportion with successfully completed 12 years of schoolingincreased to 15,5%.
• Among white mature adults, 20,8% had at least some secondary education, while40,7% had successfully completed secondary education. Extremely few had notcompleted primary school.
• Among Indian or Asian mature adults, 35,9% had completed at least somesecondary schooling, while as many as 37,3% had successfully completed 12years of schooling.
There is thus a continuation of the picture of clear differences in educational attainment bypopulation group as presented for youth.

Description of mature adults (35–64) Census 2001
Statistics South Africa 129
Education (concluded)
Figure 5.14: Educational attainment according to five-year age category and sex35
-39
Mal
e
Fem
ale
40-4
4
Mal
e
Fem
ale
45-4
9
Mal
e
Fem
ale
50-5
4
Mal
e
Fem
ale
55-5
9
Mal
e
Fem
ale
60-6
4
Mal
e
Fem
ale
35-6
4
Mal
e
Fem
ale
Tota
l
0,0
20,0
40,0
60,0
80,0
100,0%
No schooling 12,9 16,3 16,1 20,1 19,7 24,1 24,0 28,1 26,4 30,4 32,6 40,1 19,4 24,0 21,9Some primary 18,8 17,7 21,1 20,4 23,0 22,5 23,0 22,5 22,0 22,1 20,7 20,7 21,1 20,6 20,8
Complete primary 7,8 8,0 7,9 8,2 7,9 8,2 7,1 7,7 6,5 7,2 5,5 5,9 7,4 7,7 7,6Some secondary 31,4 31,5 29,7 29,0 27,8 26,9 25,5 24,8 24,6 24,0 22,6 20,7 28,1 27,4 27,7Std10/ Grade 12 18,9 16,8 15,3 13,1 12,4 10,4 11,6 10,1 12,0 9,9 10,9 7,9 14,5 12,3 13,3
Higher 10,3 9,7 9,9 9,2 9,2 7,9 8,7 6,8 8,7 6,3 7,7 4,7 9,4 8,0 8,7
Mature adultmen generallyhad higher levelsof education thanwomen in thisage group.
Of the men,14,5% hadcompletedsecondaryschool and 9,4%had post-schoolqualifications,while of thewomen, 12,3%had completedsecondaryschool, while8,0% had post-school educationqualifications.
Figure 5.15: Main field of study among those with tertiary qualifications19,8
18,616,0
6,64,54,34,0
2,52,51,91,91,61,51,51,31,00,80,80,70,40,40,2
7,5
16,81,9
30,47,7
12,61,91,5
0,83,02,9
1,52,7
0,70,4
1,70,61,6
0,21,41,4
0,50,6
7,3
Business, commerce or management sciencesEngineering or engineering technology
Education, training or developmentComputer science and data processing
Health care or health scienceLaw
Agriculture or renewable natural resourcesIndustrial arts, trades or technology
Public administration and social servicesArts, visual or performing
Life sciences or physical sciencesSocial sciences and social studies
Architecture or environmental designPhilosophy, religion or theology
CommunicationMathematical sciences
PsychologyMilitary sciences
Languages, linguistics or literatureHome economics
Physical education or leisureLibraries or museums
Other
0,05,010,015,020,025,030,035,0
% males
0,0 5,0 10,0 15,0 20,0 25,0 30,0 35,0
% females
Men tended tofavour business,commerce ormanagement(19,8%),engineering(18,6%) oreducation,training ordevelopment(16,0%).
Women on theother handtended to favoureducation,training ordevelopment(30,4%),business,commerce ormanagement(16,8%) orhealth sciences(12,6%)

Description of mature adults (35–64) Census 2001
Stages in the life cycle of South Africans130
Labour market statusReaders are reminded of the limitations of census labour data, as described in Chapter 4, p. 91.
Figure 5.16: According to age
35 36 37 38 39 40 41 42 43 44 45 46 47 48 49 50 51 52 53 54 55 56 57 58 59 60 61 62 63 64 35-64
0,0
20,0
40,0
60,0
80,0
100,0%
Employed 50,5 50,4 51,0 51,0 51,3 52,4 51,4 51,8 51,4 51,5 51,0 50,5 49,9 48,6 47,4 47,2 45,1 43,9 42,6 42,0 39,7 37,5 35,7 33,5 30,7 25,0 20,5 18,4 16,3 14,5 45,4Unemployed 27,3 27,0 26,3 26,0 25,4 23,8 24,3 23,5 23,2 22,5 22,0 21,3 21,3 21,3 21,1 18,2 18,7 17,4 16,9 15,9 14,8 14,3 12,9 12,3 11,9 7,6 6,9 4,7 4,4 3,7 20,4Not ec active 22,2 22,5 22,7 23,0 23,3 23,7 24,4 24,8 25,4 26,0 26,9 28,1 28,8 30,1 31,6 34,6 36,2 38,6 40,6 42,1 45,5 48,3 51,4 54,3 57,4 67,4 72,6 76,9 79,2 81,8 34,2
Between the ages of 35 and 46years, between 50% and 52% ofall mature adults wereemployed. From the age of 47there is a gradual and thensteeper decrease, to 14,5% atthe age of 64 years.
It appears that a noticeableproportion of people retire fromage 60, or stop seeking work.
The steady increase of theproportion of not economicallyactive even before age 60suggests an increase indiscouraged workseekers.
Figure 5.17: According to five-year age category and population group
35-3
9
Bla
ck A
fric
an
Col
oure
d
Indi
an o
r A
sian
Whi
te
40-4
4
Bla
ck A
fric
an
Col
oure
d
Indi
an o
r A
sian
Whi
te
45-4
9
Bla
ck A
fric
an
Col
oure
d
Indi
an o
r A
sian
Whi
te
50-5
4
Bla
ck A
fric
an
Col
oure
d
Indi
an o
r A
sian
Whi
te
55-5
9
Bla
ck A
fric
an
Col
oure
d
Indi
an o
r A
sian
Whi
te
60-6
4
Bla
ck A
fric
an
Col
oure
d
Indi
an o
r A
sian
Whi
te
35-6
4
Bla
ck A
fric
an
Col
oure
d
Indi
an o
r A
sian
Whi
te
Tota
l
0,0
20,0
40,0
60,0
80,0
100,0%
Employed 44,9 61,3 65,1 78,5 45,8 58,8 61,2 77,1 44,0 53,9 54,6 73,4 38,8 45,7 46,5 65,2 31,1 34,4 33,8 50,7 16,4 17,8 19,3 30,6 40,4 51,0 51,3 65,4 45,4Unemployed 31,7 15,8 9,0 4,1 28,8 14,6 8,5 3,9 26,6 13,3 8,3 3,9 22,5 10,7 6,8 3,4 17,7 7,9 5,5 2,6 7,4 3,1 2,2 1,1 25,5 12,5 7,4 3,3 20,4Not ec active 23,4 23,0 25,9 17,4 25,3 26,6 30,3 19,0 29,4 32,8 37,2 22,7 38,6 43,6 46,7 31,3 51,1 57,7 60,8 46,7 76,2 79,0 78,5 68,3 34,2 36,4 41,3 31,2 34,2
The Indian/Asian group had the largest proportionof not economically active of all age groups, exceptthe last (60–64 years), where the coloured grouphad the largest proportion.
White adults had the greatest proportion ofemployed at all ages.

Description of mature adults (35–64) Census 2001
Statistics South Africa 131
Labour market status (continued)
Figure 5.18: According to sex and five-year age category
Mal
e
35-3
9
40-4
4
45-4
9
50-5
4
55-5
9
60-6
4
35-6
4
Fem
ale
35-3
9
40-4
4
45-4
9
50-5
4
55-5
9
60-6
4
35-6
4
Both
35-3
9
40-4
4
45-4
9
50-5
4
55-5
9
60-6
4
35-6
4
0,0
20,0
40,0
60,0
80,0
100,0%
Employed 61,9 61,7 60,0 55,4 46,7 30,9 56,5 41,1 42,8 40,5 34,5 26,0 11,1 35,9 50,8 51,7 49,5 44,3 35,5 19,3 45,4Unemployed 24,3 23,1 22,1 19,4 15,9 9,5 20,9 28,3 23,9 20,8 15,8 11,0 2,8 19,9 26,4 23,5 21,4 17,5 13,3 5,6 20,4Not ec active 13,8 15,2 18,0 25,2 37,4 59,6 22,7 30,6 33,3 38,7 49,7 63,0 86,1 44,2 22,7 24,8 29,1 38,2 51,3 75,0 34,2
Overall, the percentage of malesthat were employed (56,5%)was higher than that of females(35,9%). This pertained acrossall age categories.
The overall percentages ofunemployed males and femaleswere similar (20,9% and 19,9respectively). However, themore detailed breakdowns showa higher percentage ofunemployed females in theyounger age groups and ofmales in the older age groups.
Overall, a larger proportion ofwomen (44,2%) were noteconomically active than of men(22,7%).

Description of mature adults (35–64) Census 2001
Stages in the life cycle of South Africans132
Labour market status (continued)
Figure 5.19: According to educational attainment and five-year age categoryN
o sc
hool
ing
35-3
9
40-4
4
45-4
9
50-5
4
55-5
9
60-6
4
Som
e pr
imar
y
35-3
9
40-4
4
45-4
9
50-5
4
55-5
9
60-6
4
Com
plet
e pr
imar
y
35-3
9
40-4
4
45-4
9
50-5
4
55-5
9
60-6
4
Som
e se
cond
ary
35-3
9
40-4
4
45-4
9
50-5
4
55-5
9
60-6
4
Std
10/ G
rade
12
35-3
9
40-4
4
45-4
9
50-5
4
55-5
9
60-6
4
Hig
her
35-3
9
40-4
4
45-4
9
50-5
4
55-5
9
60-6
4
0,0
20,0
40,0
60,0
80,0
100,0%
Employed 31,9 33,4 33,3 29,7 24,2 12,7 39,6 41,2 41,1 37,7 30,5 17,2 42,3 44,0 43,4 39,7 31,7 17,5 48,4 51,6 51,4 46,9 37,4 21,1 67,1 71,5 71,0 65,1 52,3 32,6 84,7 86,7 85,6 80,3 66,3 43,0
Unemployed 29,0 26,4 24,3 19,9 15,5 6,3 32,4 29,8 27,1 22,5 17,3 7,4 33,4 30,6 27,7 22,5 17,0 6,8 30,7 26,4 22,7 17,7 12,8 5,0 18,6 13,4 10,3 7,5 5,4 2,6 6,7 4,3 3,6 3,1 2,5 1,3
Not ec active 39,1 40,2 42,5 50,4 60,3 80,9 28,1 28,9 31,8 39,9 52,2 75,5 24,3 25,4 28,9 37,8 51,4 75,7 20,9 22,0 25,9 35,4 49,8 74,0 14,2 15,1 18,7 27,4 42,3 64,9 8,6 9,0 10,8 16,6 31,2 55,8
Across all age groups, those mature adults with 12years of schooling or with post-school qualificationswere more likely to be employed than those with noeducation or with a level of highest education belowthat of complete secondary school. The higher theeducation level, the higher the percentage that wereemployed.
Within each education category, there was agradual increase in the percentage of those whowere employed, followed by a decrease, especiallyamong those aged 60–64.
Figure 5.20: Of those with tertiary qualifications according to main field of studyAt one extreme, amongthose with engineeringqualifications, 86,6% ofmature adults wereemployed, while 3,9% wereunemployed and 9,5% werenot economically active.
At the other extreme,among those mature adultswith qualifications in thevisual or performing arts,71,6% were employed,4,7% were unemployed,and 23,7% were noteconomically active.
Particularly noticeable is thedifferent pattern amongthose with qualifications inhome economics, where33,6% were noteconomically active, i.e. notseeking work – possiblyusing their skills in their ownhomes from choice.
Engi
neer
ing
Law
Agr
icul
ture
Arc
hite
ctur
e
Bus
ines
s
Indu
stria
l arts
Hea
lth
Mili
tary
sci
ence
s
Mat
hem
atic
al s
cien
ces
Rel
igio
n or
phi
loso
phy
Life
or p
hysi
cal s
cien
ces
Educ
atio
n
Com
mun
icat
ion
Publ
ic a
dmin
istr
atio
n
Psyc
holo
gy
Com
pute
r sci
ence
Phy
sica
l edu
catio
n
Soci
al s
tudi
es
Lang
uage
s
Libr
ary
or m
useu
m
Visu
al o
r per
form
ing
arts
Hom
e ec
onom
ics
Oth
er
Tota
l
0,0
20,0
40,0
60,0
80,0
100,0%
Employed 86,6 85,4 85,4 82,8 82,5 81,8 81,5 81,3 81,1 81,0 80,4 79,5 78,4 78,4 77,2 77,1 76,7 76,2 73,1 73,0 71,6 61,2 77,7 80,6Unemployed 3,9 3,2 3,6 4,0 4,1 5,9 2,6 4,3 3,2 4,0 2,7 4,8 5,3 6,2 3,3 9,0 4,6 4,5 3,6 3,2 4,7 5,2 5,2 4,4
Not ec active 9,5 11,4 11,0 13,2 13,3 12,3 15,9 14,4 15,6 15,0 16,9 15,7 16,3 15,4 19,5 13,9 18,7 19,3 23,3 23,8 23,7 33,6 17,0 15,0
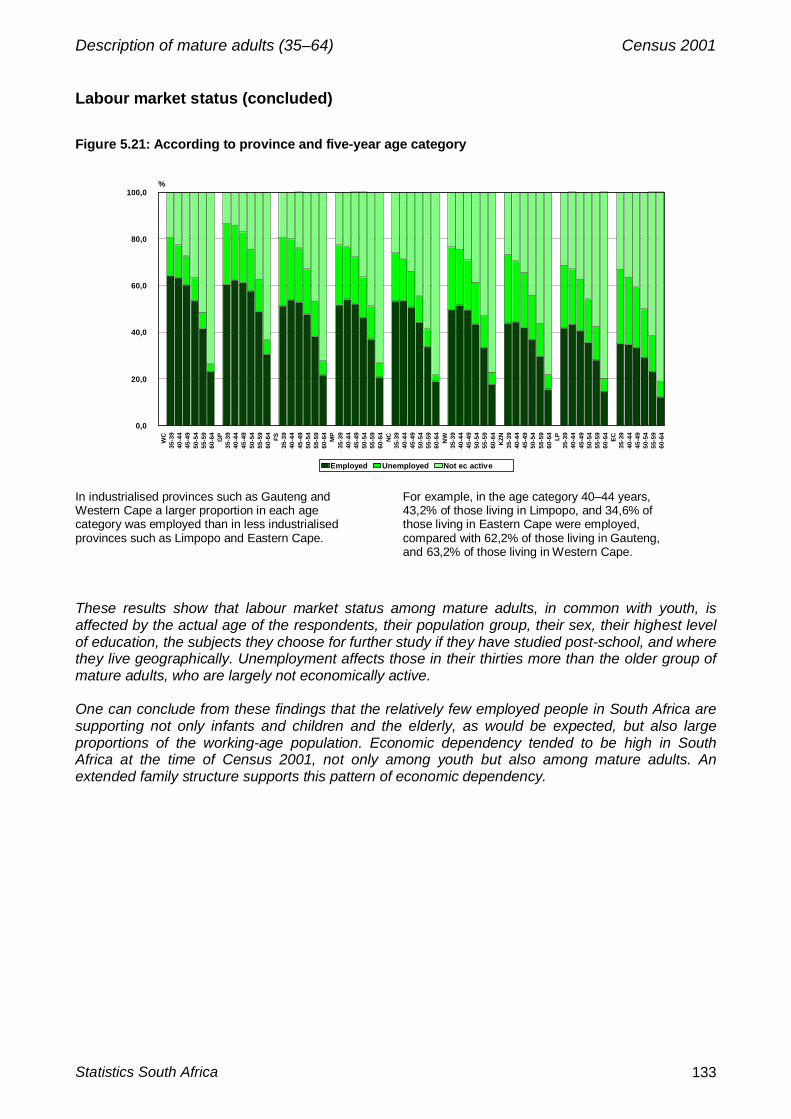
Description of mature adults (35–64) Census 2001
Statistics South Africa 133
Labour market status (concluded)
Figure 5.21: According to province and five-year age categoryW
C35
-39
40-4
445
-49
50-5
455
-59
60-6
4G
P35
-39
40-4
445
-49
50-5
455
-59
60-6
4FS
35-3
940
-44
45-4
950
-54
55-5
960
-64
MP
35-3
940
-44
45-4
950
-54
55-5
960
-64
NC
35-3
940
-44
45-4
950
-54
55-5
960
-64
NW
35-3
940
-44
45-4
950
-54
55-5
960
-64
KZN
35-3
940
-44
45-4
950
-54
55-5
960
-64
LP35
-39
40-4
445
-49
50-5
455
-59
60-6
4EC
35-3
940
-44
45-4
950
-54
55-5
960
-64
0,0
20,0
40,0
60,0
80,0
100,0%
Employed Unemployed Not ec active
In industrialised provinces such as Gauteng andWestern Cape a larger proportion in each agecategory was employed than in less industrialisedprovinces such as Limpopo and Eastern Cape.
For example, in the age category 40–44 years,43,2% of those living in Limpopo, and 34,6% ofthose living in Eastern Cape were employed,compared with 62,2% of those living in Gauteng,and 63,2% of those living in Western Cape.
These results show that labour market status among mature adults, in common with youth, isaffected by the actual age of the respondents, their population group, their sex, their highest levelof education, the subjects they choose for further study if they have studied post-school, and wherethey live geographically. Unemployment affects those in their thirties more than the older group ofmature adults, who are largely not economically active.
One can conclude from these findings that the relatively few employed people in South Africa aresupporting not only infants and children and the elderly, as would be expected, but also largeproportions of the working-age population. Economic dependency tended to be high in SouthAfrica at the time of Census 2001, not only among youth but also among mature adults. Anextended family structure supports this pattern of economic dependency.
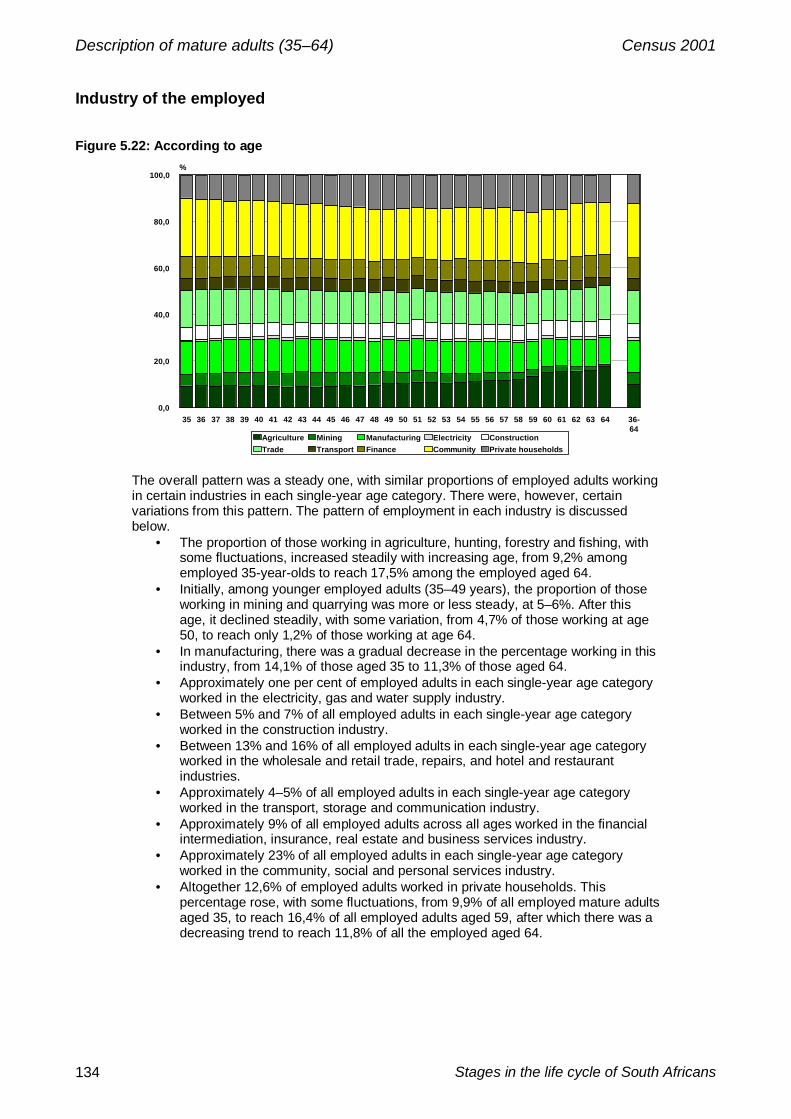
Description of mature adults (35–64) Census 2001
Stages in the life cycle of South Africans134
Industry of the employed
Figure 5.22: According to age
35 36 37 38 39 40 41 42 43 44 45 46 47 48 49 50 51 52 53 54 55 56 57 58 59 60 61 62 63 64 36-64
0,0
20,0
40,0
60,0
80,0
100,0%
Agriculture Mining Manufacturing Electricity ConstructionTrade Transport Finance Community Private households
The overall pattern was a steady one, with similar proportions of employed adults workingin certain industries in each single-year age category. There were, however, certainvariations from this pattern. The pattern of employment in each industry is discussedbelow.
• The proportion of those working in agriculture, hunting, forestry and fishing, withsome fluctuations, increased steadily with increasing age, from 9,2% amongemployed 35-year-olds to reach 17,5% among the employed aged 64.
• Initially, among younger employed adults (35–49 years), the proportion of thoseworking in mining and quarrying was more or less steady, at 5–6%. After thisage, it declined steadily, with some variation, from 4,7% of those working at age50, to reach only 1,2% of those working at age 64.
• In manufacturing, there was a gradual decrease in the percentage working in thisindustry, from 14,1% of those aged 35 to 11,3% of those aged 64.
• Approximately one per cent of employed adults in each single-year age categoryworked in the electricity, gas and water supply industry.
• Between 5% and 7% of all employed adults in each single-year age categoryworked in the construction industry.
• Between 13% and 16% of all employed adults in each single-year age categoryworked in the wholesale and retail trade, repairs, and hotel and restaurantindustries.
• Approximately 4–5% of all employed adults in each single-year age categoryworked in the transport, storage and communication industry.
• Approximately 9% of all employed adults across all ages worked in the financialintermediation, insurance, real estate and business services industry.
• Approximately 23% of all employed adults in each single-year age categoryworked in the community, social and personal services industry.
• Altogether 12,6% of employed adults worked in private households. Thispercentage rose, with some fluctuations, from 9,9% of all employed mature adultsaged 35, to reach 16,4% of all employed adults aged 59, after which there was adecreasing trend to reach 11,8% of all the employed aged 64.

Description of mature adults (35–64) Census 2001
Statistics South Africa 135
Industry of the employed (continued)
Figure 5.23: According to sex and population groupEmployed maturemalestended to work ina more diverse range ofindustries thanemployed females in thisage category.
Large proportions ofemployed maturefemales (30,6%) workedin the community, socialand personal servicesindustry; this appliedparticularly to whitefemales (38,4%). Largeproportions of employedmature females (25,2%)also worked in privatehouseholds; this appliedparticularly to Africanfemales (35,2%).
A large proportion of employed mature Indian orAsian males and females was working in thewholesale and retail trade, repairs, and hotel andrestaurant industries (27,6%).
A large proportion of employed mature colouredmales was working in the agriculture, hunting,forestry and fishing industry (20,7%).
Figure 5.24: According to educational attainment
No schooling Some primary Complete primary Some secondary Std 10/ Grade 12 Higher Total0,0
20,0
40,0
60,0
80,0
100,0%
Agriculture 25,2 18,2 10,8 5,0 4,0 3,0 9,9Mining 6,2 8,2 7,3 5,4 3,5 1,8 5,2
Manufacturing 9,2 11,6 15,6 19,0 15,2 9,0 13,9Electricity 0,8 0,9 1,0 1,0 1,1 0,9 1,0
Construction 7,1 8,0 7,6 6,7 4,4 2,8 6,0Trade 10,0 11,0 14,2 19,0 18,4 8,5 14,4
Transport 3,4 4,0 5,1 6,8 6,5 3,6 5,2Finance 3,4 3,3 4,2 7,6 15,6 14,5 8,7
Community 11,2 10,6 12,8 17,8 28,9 54,9 23,2Private households 23,5 24,1 21,3 11,7 2,5 0,8 12,6
In common with youth, those with lower levels ofeducation were more likely to be found inagriculture, hunting, forestry and fishing; and inprivate households.
Those with higher levels of education, particularlythose with post-school qualifications, were morelikely to be working in community, personal andsocial services, and in financial, insurance, realestate and business services.
Mal
e
Bla
ck A
fric
an
Col
oure
d
Indi
an o
r Asi
an
Whi
te
Tota
l
Fem
ale
Bla
ck A
fric
an
Col
oure
d
Indi
an o
r Asi
an
Whi
te
Tota
l
Bot
h
Bla
ck A
fric
an
Col
oure
d
Indi
an o
r Asi
an
Whi
te
Tota
l0,0
20,0
40,0
60,0
80,0
100,0%
Agriculture 12,9 20,7 1,9 7,8 12,2 7,3 11,8 0,7 2,9 6,7 10,5 16,7 1,5 5,8 9,9Mining 11,3 1,6 0,5 5,6 8,6 0,4 0,3 0,3 1,2 0,6 6,7 1,0 0,4 3,7 5,2
Manufacturing 14,9 17,9 26,8 18,0 16,4 8,5 18,2 28,7 10,1 10,6 12,2 18,0 27,4 14,7 13,9Electricity 1,5 1,1 0,8 1,5 1,4 0,3 0,2 0,3 0,6 0,3 1,0 0,7 0,6 1,1 1,0
Construction 9,7 13,6 6,0 7,3 9,5 1,1 1,0 1,1 2,1 1,3 6,1 7,9 4,3 5,1 6,0Trade 13,0 13,1 29,1 16,5 14,4 12,9 16,6 24,8 16,0 14,3 12,9 14,7 27,6 16,3 14,4
Transport 7,8 6,5 8,2 7,7 7,6 1,2 1,5 2,4 4,3 1,9 5,0 4,3 6,2 6,3 5,2Finance 6,1 6,6 9,4 17,6 8,7 4,1 7,2 12,9 23,2 8,6 5,3 6,9 10,6 19,9 8,7
Community 18,0 16,9 17,1 17,7 17,8 29,2 25,6 27,7 38,4 30,6 22,8 20,8 20,7 26,4 23,2Private households 4,8 2,1 0,4 0,4 3,4 35,2 17,7 1,2 1,2 25,2 17,7 9,1 0,6 0,7 12,6
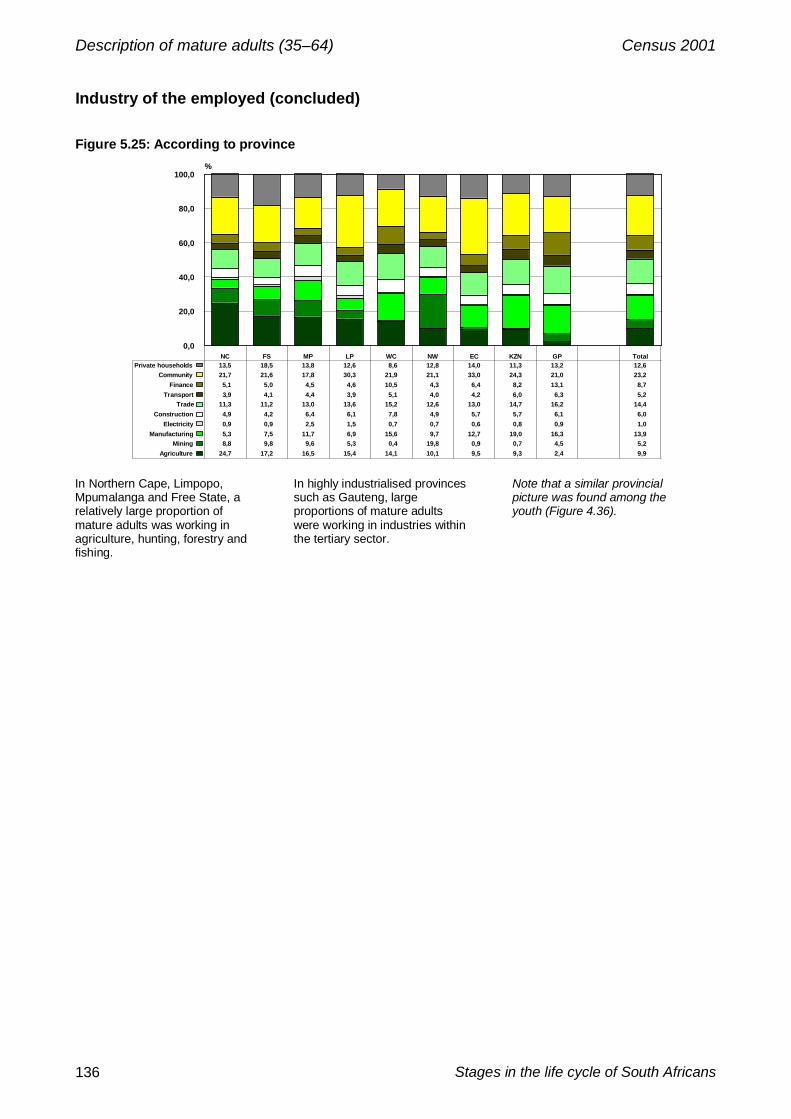
Description of mature adults (35–64) Census 2001
Stages in the life cycle of South Africans136
Industry of the employed (concluded)
Figure 5.25: According to province
NC FS MP LP WC NW EC KZN GP Total0,0
20,0
40,0
60,0
80,0
100,0%
Agriculture 24,7 17,2 16,5 15,4 14,1 10,1 9,5 9,3 2,4 9,9Mining 8,8 9,8 9,6 5,3 0,4 19,8 0,9 0,7 4,5 5,2
Manufacturing 5,3 7,5 11,7 6,9 15,6 9,7 12,7 19,0 16,3 13,9Electricity 0,9 0,9 2,5 1,5 0,7 0,7 0,6 0,8 0,9 1,0
Construction 4,9 4,2 6,4 6,1 7,8 4,9 5,7 5,7 6,1 6,0Trade 11,3 11,2 13,0 13,6 15,2 12,6 13,0 14,7 16,2 14,4
Transport 3,9 4,1 4,4 3,9 5,1 4,0 4,2 6,0 6,3 5,2Finance 5,1 5,0 4,5 4,6 10,5 4,3 6,4 8,2 13,1 8,7
Community 21,7 21,6 17,8 30,3 21,9 21,1 33,0 24,3 21,0 23,2Private households 13,5 18,5 13,8 12,6 8,6 12,8 14,0 11,3 13,2 12,6
In Northern Cape, Limpopo,Mpumalanga and Free State, arelatively large proportion ofmature adults was working inagriculture, hunting, forestry andfishing.
In highly industrialised provincessuch as Gauteng, largeproportions of mature adultswere working in industries withinthe tertiary sector.
Note that a similar provincialpicture was found among theyouth (Figure 4.36).

Description of mature adults (35–64) Census 2001
Statistics South Africa 137
Occupation of the employed
Figure 5.26: According to age
35 36 37 38 39 40 41 42 43 44 45 46 47 48 49 50 51 52 53 54 55 56 57 58 59 60 61 62 63 64 35-64
0,0
20,0
40,0
60,0
80,0
100,0%
Managers 5,6 5,6 5,8 5,8 6,1 6,6 6,4 6,7 6,5 7,0 7,0 7,2 7,1 7,0 6,8 7,6 7,3 7,8 7,8 8,4 8,5 8,4 8,8 8,2 7,2 8,1 7,5 8,5 8,9 9,2 6,8Professionals 8,1 7,7 7,8 7,6 7,8 8,1 7,7 7,9 7,5 7,9 7,8 7,6 7,6 7,4 7,0 7,7 7,1 7,4 7,6 8,0 8,1 8,0 8,3 7,8 6,9 7,7 7,1 8,4 8,7 8,3 7,7
Technicians 12,5 12,0 11,9 11,5 11,5 11,8 11,5 11,6 11,4 11,3 11,1 10,9 10,7 10,0 9,5 10,0 9,1 9,0 9,2 9,2 9,3 8,8 9,1 8,5 7,9 8,0 7,3 8,2 8,4 8,0 10,8Clerks 11,6 11,3 11,2 11,1 11,0 11,2 10,8 10,7 10,2 10,2 10,0 9,9 9,6 9,4 9,0 9,9 9,1 9,4 9,4 9,6 9,5 9,0 9,2 8,8 7,9 8,5 8,0 8,8 8,2 8,1 10,2
Sales workers 11,1 10,7 10,2 9,9 9,5 9,2 8,9 8,5 8,3 8,2 8,1 7,9 7,9 7,5 7,8 7,9 7,8 8,2 8,0 8,3 8,4 8,5 8,5 8,5 8,3 8,7 8,5 9,7 9,7 9,9 8,9Skilled agric. 2,4 2,5 2,4 2,5 2,5 2,5 2,5 2,4 2,6 2,5 2,7 2,7 2,7 2,8 3,0 3,1 3,3 3,3 3,4 3,5 3,7 3,7 4,0 4,3 4,5 5,0 5,6 5,6 6,1 7,3 2,9
Artisans 13,3 13,7 13,9 14,0 14,1 13,7 14,1 13,6 14,2 13,9 13,5 13,4 13,7 13,6 13,6 12,7 13,5 12,7 12,6 12,2 11,8 11,5 11,0 11,2 10,9 10,6 10,6 10,2 10,1 9,9 13,3Operators 9,8 10,0 10,2 10,5 10,6 10,4 10,7 10,8 11,2 11,3 11,0 11,1 10,9 10,8 11,3 10,6 11,1 10,7 10,4 10,1 9,8 9,9 9,6 9,3 10,1 9,5 9,3 8,9 9,0 8,7 10,5
Elementary 25,6 26,5 26,5 27,1 26,7 26,5 27,3 27,8 28,3 27,6 28,7 29,3 29,7 31,5 32,0 30,6 31,7 31,5 31,7 30,7 30,9 32,2 31,6 33,4 36,2 33,9 36,0 31,7 30,8 30,6 28,9
The overall pattern is again a steady one, with similar proportions of employed peopleworking in certain occupations in each single-year age category. There were, however,certain variations from this pattern. Each broad occupational category is discussed below.
• The proportion of those working in management increased steadily withincreasing age, from 5,6% among employed young mature adults aged 35 toreach 9,2% among the employed aged 64.
• The proportion of those working as professionals was more or less steady atapproximately 8% of all the employed between the ages of 35 and 64 years.
• In technical and semi-professional occupations, there was a gradual decrease inthe percentage of employed people working in these occupations, from 12,5% ofthose aged 35 to 8,0% of those aged 64.
• There was also a gradual decrease in the proportion of people working in clericaloccupations with increasing age, from 11,6% among the employed aged 35, to8,1% among those aged 64.
• A similar but even more gradual decrease was found among sales and serviceworkers, from 11,1% among the employed aged 35, to 9,9% among those aged64.
• There was, on the other hand, a steady increase in the proportion of peopleworking in skilled agricultural occupations with increasing age, from 2,4% amongthe employed aged 35, to 7,3% among those aged 64.
• There was also a gradual decrease in the proportion of people working in artisan-related occupations with increasing age, from 13,3% among the employed aged35 years, to 9,9% among those aged 64 years.
• The percentage of employed people in each single-year age category working asoperators presented more of a fluctuating pattern, with 10,5% of all employedmature adults on average working in these occupations.
• Altogether 28,9% of employed mature adults worked in elementary occupations.This percentage tended to increase, with some fluctuations, from 25,6% of allemployed mature adults aged 35, to reach 36,2% of all employed adults aged 59,after which the pattern varies slightly.

Description of mature adults (35–64) Census 2001
Stages in the life cycle of South Africans138
Occupation of the employed (continued)
Figure 5.27: According to sex and five-year age categoryM
ale
35-3
9
40-4
4
45-4
9
50-5
4
55-5
9
60-6
4
35-6
4
Fem
ale
35-3
9
40-4
4
45-4
9
50-5
4
55-5
9
60-6
4
35-6
4
Both
35-3
9
40-4
4
45-4
9
50-5
4
55-5
9
60-6
4
35-6
4
0,0
20,0
40,0
60,0
80,0
100,0%
Managers 7,0 8,3 9,0 9,9 10,7 9,9 8,5 4,2 4,4 4,4 4,5 4,5 4,9 4,4 5,8 6,6 7,0 7,7 8,3 8,3 6,8Professionals 7,6 7,9 7,9 8,1 8,6 8,5 7,9 8,1 7,7 6,9 6,7 6,6 6,6 7,4 7,8 7,8 7,5 7,5 7,8 7,9 7,7
Technicians 9,1 8,2 7,4 6,6 6,2 5,6 7,8 15,7 15,8 14,5 13,2 12,7 12,7 14,8 11,9 11,5 10,5 9,3 8,8 7,9 10,8Clerks 7,1 7,0 6,6 6,4 6,1 5,4 6,7 16,8 15,4 13,5 13,9 13,3 14,3 15,0 11,2 10,6 9,6 9,5 8,9 8,3 10,2
Sales workers 11,7 9,4 8,3 8,5 9,1 9,9 9,7 8,4 7,6 7,3 7,2 7,4 7,6 7,7 10,3 8,6 7,8 8,0 8,4 9,1 8,9Skilled agric. 3,1 3,3 3,7 4,4 5,4 7,5 3,8 1,6 1,5 1,6 1,7 1,8 2,1 1,6 2,5 2,5 2,8 3,3 4,0 5,7 2,9
Artisans 20,3 21,0 20,7 18,9 16,5 14,0 19,8 5,1 4,7 4,4 3,9 3,4 2,8 4,5 13,8 13,9 13,6 12,8 11,3 10,4 13,3Operators 15,3 16,7 17,2 16,2 14,7 12,8 16,0 3,4 3,4 3,1 2,6 2,1 1,6 3,1 10,2 10,9 11,0 10,6 9,8 9,2 10,5
Elementary 18,8 18,3 19,3 20,9 22,6 26,4 19,7 36,7 39,4 44,2 46,1 48,2 47,4 41,4 26,5 27,5 30,2 31,3 32,7 33,2 28,9
The proportion ofemployed matureadult women inelementaryoccupations, at41,4%, wassignificantly higherthan theproportion ofemployed matureadult men inelementaryoccupations, at19,7%.
Figure 5.28: According to population group
Population groupremains an importantdistinguishing variablein the occupation ofemployed respondents.
Black African Coloured Indian or Asian White Total0,0
20,0
40,0
60,0
80,0
100,0%
Managers 2,8 4,6 15,1 19,1 6,8Professionals 4,2 4,2 12,4 19,9 7,7
Technicians 9,1 9,8 12,1 16,3 10,8Clerks 7,1 11,5 18,7 17,6 10,2
Sales workers 8,6 7,5 12,9 9,9 8,9Skilled agric. 3,0 2,7 0,6 3,0 2,9
Artisans 14,3 15,6 12,1 9,1 13,3Operators 13,3 10,0 10,4 2,2 10,5
Elementary 37,6 34,2 5,7 2,8 28,9
At the lower end of the scale, 37,6% of employedAfrican and 34,2% of employed coloured matureadults were working in elementary occupations, asagainst 5,7% of employed Indian or Asian and 2,8%of employed white mature adults.
At the upper end of the scale, 2,8% of employedAfrican and 4,6% of employed coloured matureadults were working in managerial occupations, asagainst 15,1% of employed Indian or Asian and19,1% of employed white mature adults.

Description of mature adults (35–64) Census 2001
Statistics South Africa 139
Occupation of the employed (concluded)
Figure 5.29: According to educational attainment
No schooling Some primary Complete primary Some secondary Std 10/ Grade 12 Higher Total0,0
20,0
40,0
60,0
80,0
100,0%
Managers 1,4 1,2 1,7 5,0 13,9 14,3 6,8Professionals 1,1 1,0 1,2 2,7 7,8 32,8 7,7
Technicians 2,7 1,7 2,4 7,2 16,8 30,6 10,8Clerks 3,1 2,8 4,5 12,3 22,7 8,0 10,2
Sales workers 5,5 5,4 7,2 11,2 13,6 6,3 8,9Skilled agric. 6,7 4,5 2,8 1,7 1,9 1,5 2,9
Artisans 13,6 16,5 18,0 17,9 9,9 3,3 13,3Operators 12,5 14,6 16,1 14,2 5,7 1,1 10,5
Elementary 53,4 52,3 46,3 27,9 7,8 2,1 28,9
As expected, 53,4% of those with no educationwere in elementary occupations, decreasing witheach increase in educational level, to reach 2,1%among those with post-school qualifications.
Conversely, 1,4% of those with no schoolingclassified themselves as managers, compared to14,3% of those with post-school qualifications.
Figure 5.30: According to province
NC FS LP MP EC WC NW KZN GP Total0,0
20,0
40,0
60,0
80,0
100,0%
Managers 5,6 3,9 4,2 4,6 5,3 8,1 4,5 6,8 9,1 6,8Professionals 5,0 5,0 7,0 5,0 7,6 8,6 5,3 7,3 9,9 7,7
Technicians 8,4 8,6 12,4 8,1 14,8 10,6 8,9 12,0 10,5 10,8Clerks 8,5 7,3 7,6 7,6 9,5 11,1 8,4 10,3 12,6 10,2
Sales workers 7,9 7,4 9,3 7,4 9,4 9,1 7,9 9,4 9,3 8,9Skilled agric. 7,7 4,8 4,6 5,2 3,4 2,8 3,3 2,9 1,0 2,9
Artisans 10,9 13,0 12,4 16,1 10,9 11,7 18,4 12,4 13,6 13,3Operators 6,7 12,2 9,0 13,0 8,6 8,3 14,5 11,9 10,0 10,5
Elementary 39,3 37,8 33,6 33,0 30,5 29,9 28,8 26,9 24,1 28,9
In Northern Cape,39,3% of employedmature adults werein elementaryoccupations,compared with24,1% in Gauteng.
On the other hand,9,1% of employedmature adults inGauteng were inmanagerialoccupations,compared with3,9% in Free State.
These results show that, in common with employed youth, the age, population group, sex, highestlevel of education, and where the person lived was directly related to the occupation of theemployed mature adult. Some inroads are being made into tackling the inequalities of occupationaldistribution during the apartheid era, as increasing proportions of previously disadvantaged youthand adults are gaining access to more opportunities for higher-level occupations. But there are stillclear inequalities.
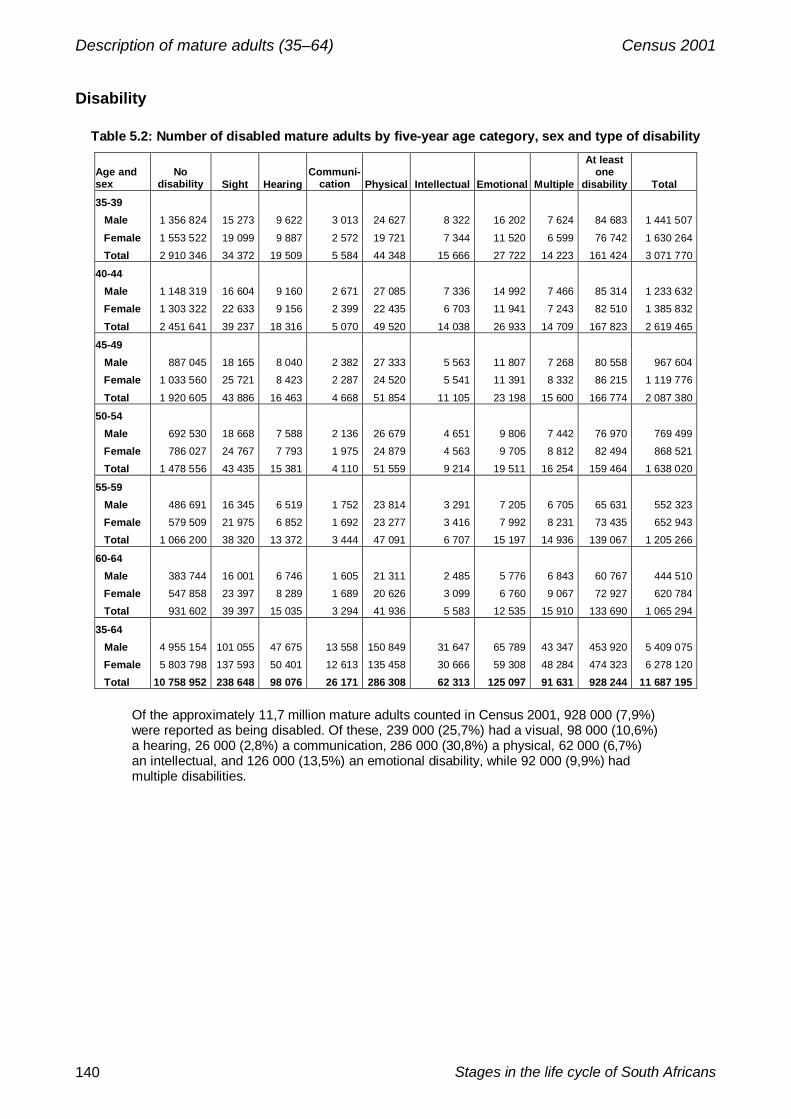
Description of mature adults (35–64) Census 2001
Stages in the life cycle of South Africans140
Disability
Table 5.2: Number of disabled mature adults by five-year age category, sex and type of disability
Age andsex
Nodisability Sight Hearing
Communi-cation Physical Intellectual Emotional Multiple
At leastone
disability Total35-39 Male 1 356 824 15 273 9 622 3 013 24 627 8 322 16 202 7 624 84 683 1 441 507
Female 1 553 522 19 099 9 887 2 572 19 721 7 344 11 520 6 599 76 742 1 630 264
Total 2 910 346 34 372 19 509 5 584 44 348 15 666 27 722 14 223 161 424 3 071 770
40-44 Male 1 148 319 16 604 9 160 2 671 27 085 7 336 14 992 7 466 85 314 1 233 632
Female 1 303 322 22 633 9 156 2 399 22 435 6 703 11 941 7 243 82 510 1 385 832
Total 2 451 641 39 237 18 316 5 070 49 520 14 038 26 933 14 709 167 823 2 619 465
45-49 Male 887 045 18 165 8 040 2 382 27 333 5 563 11 807 7 268 80 558 967 604
Female 1 033 560 25 721 8 423 2 287 24 520 5 541 11 391 8 332 86 215 1 119 776
Total 1 920 605 43 886 16 463 4 668 51 854 11 105 23 198 15 600 166 774 2 087 380
50-54 Male 692 530 18 668 7 588 2 136 26 679 4 651 9 806 7 442 76 970 769 499
Female 786 027 24 767 7 793 1 975 24 879 4 563 9 705 8 812 82 494 868 521
Total 1 478 556 43 435 15 381 4 110 51 559 9 214 19 511 16 254 159 464 1 638 020
55-59 Male 486 691 16 345 6 519 1 752 23 814 3 291 7 205 6 705 65 631 552 323
Female 579 509 21 975 6 852 1 692 23 277 3 416 7 992 8 231 73 435 652 943
Total 1 066 200 38 320 13 372 3 444 47 091 6 707 15 197 14 936 139 067 1 205 266
60-64 Male 383 744 16 001 6 746 1 605 21 311 2 485 5 776 6 843 60 767 444 510
Female 547 858 23 397 8 289 1 689 20 626 3 099 6 760 9 067 72 927 620 784
Total 931 602 39 397 15 035 3 294 41 936 5 583 12 535 15 910 133 690 1 065 294
35-64 Male 4 955 154 101 055 47 675 13 558 150 849 31 647 65 789 43 347 453 920 5 409 075
Female 5 803 798 137 593 50 401 12 613 135 458 30 666 59 308 48 284 474 323 6 278 120
Total 10 758 952 238 648 98 076 26 171 286 308 62 313 125 097 91 631 928 244 11 687 195
Of the approximately 11,7 million mature adults counted in Census 2001, 928 000 (7,9%)were reported as being disabled. Of these, 239 000 (25,7%) had a visual, 98 000 (10,6%)a hearing, 26 000 (2,8%) a communication, 286 000 (30,8%) a physical, 62 000 (6,7%)an intellectual, and 126 000 (13,5%) an emotional disability, while 92 000 (9,9%) hadmultiple disabilities.

Description of mature adults (35–64) Census 2001
Statistics South Africa 141
Disability (continued)
Figure 5.31: Percentage of mature adults of each age with each type of disability, compared with thetotal population
4,9 5,1 5,2 5,4 5,6 5,76,1 6,4
6,8 7,0 7,37,7 7,9
8,38,7 8,9
9,6 9,810,3 10,4
10,911,3 11,5
11,912,3
11,912,8
12,3 12,613,1
7,8
5,0
35 36 37 38 39 40 41 42 43 44 45 46 47 48 49 50 51 52 53 54 55 56 57 58 59 60 61 62 63 64 35-64
Totalpop.
0,0
2,0
4,0
6,0
8,0
10,0
12,0
14,0
16,0%
Sight 1,0 1,1 1,1 1,2 1,2 1,3 1,4 1,5 1,7 1,7 1,8 2,0 2,1 2,3 2,4 2,4 2,6 2,6 2,9 2,8 3,0 3,1 3,2 3,3 3,4 3,4 3,7 3,7 3,8 4,0 2,0 1,3Hearing 0,6 0,6 0,6 0,6 0,7 0,6 0,7 0,7 0,7 0,7 0,7 0,8 0,8 0,8 0,9 0,9 1,0 0,9 0,9 1,0 1,0 1,1 1,1 1,1 1,2 1,3 1,4 1,4 1,4 1,5 0,8 0,7
Communication 0,2 0,2 0,2 0,2 0,2 0,2 0,2 0,2 0,2 0,2 0,2 0,2 0,2 0,2 0,2 0,2 0,2 0,3 0,3 0,3 0,3 0,3 0,3 0,3 0,3 0,3 0,3 0,3 0,3 0,3 0,2 0,2Physical 1,3 1,4 1,4 1,5 1,6 1,6 1,8 1,9 2,0 2,1 2,3 2,4 2,5 2,6 2,7 2,8 3,1 3,2 3,4 3,4 3,6 3,7 4,0 4,1 4,1 3,8 4,0 3,9 4,0 4,1 2,4 1,2
Intellectual 0,5 0,5 0,5 0,5 0,5 0,5 0,5 0,5 0,5 0,6 0,5 0,5 0,5 0,5 0,5 0,6 0,6 0,6 0,5 0,6 0,6 0,6 0,5 0,5 0,6 0,5 0,6 0,5 0,5 0,5 0,5 0,5Emotional 0,8 0,9 0,9 0,9 0,9 1,0 1,0 1,0 1,1 1,1 1,1 1,1 1,1 1,1 1,2 1,1 1,2 1,2 1,2 1,2 1,3 1,3 1,2 1,3 1,3 1,2 1,3 1,1 1,1 1,1 1,1 0,6
Multiple 0,5 0,4 0,5 0,5 0,5 0,5 0,5 0,6 0,6 0,6 0,7 0,7 0,7 0,8 0,8 0,9 0,9 1,0 1,1 1,1 1,1 1,2 1,2 1,3 1,4 1,4 1,5 1,4 1,5 1,6 0,8 0,6
With some slight fluctuations, there was a steady increase in the proportion of disabledmature adults with each single-year increase in age. This pattern continues from the onepreviously observed among infants, children and youth. Among mature adults, however,there were clear differences in the extent of the increase in the proportion that weredisabled in single-year age categories by type of disability.
• The percentage of those with visual disabilities increased steadily with increasingage, from 1,0% among those aged 35, to 4,0% among those aged 64.
• The percentage of those with physical disabilities also increased steadily, from1,3% among those aged 35, to 4,1% among those aged 64.
• The percentage of those with multiple disabilities increased with slightfluctuations (61years), from 0,5% among those aged 35, to reach 1,6% amongthose aged 64.
• The percentage of those with hearing disabilities also increased with slightfluctuations (52–53 years) from 0,6% among those aged 35 to 1,5% among thoseaged 64.
• The percentage of those with emotional disabilities increased gradually but withfluctuations, from 0,8% among those aged 35 to 1,3% among those aged 61.
• The percentage of those with communication disabilities remained approximatelyconstant between 0,2% and 0,3% of all those aged 35–64.
• The percentage of those with intellectual disabilities also remained approximatelyconstant between 0,5% and 0,6% across the single-year age categories.

Description of mature adults (35–64) Census 2001
Stages in the life cycle of South Africans142
Disability (continued)
Figure 5.32: Percentage of males and females of each age that were disabled
Within each agecategory, a slightlylarger proportionof males thanfemales wasdisabled. This wasmore evident inthe older agecategory of 60–64years.
Figure 5.33: Percentage of each age and population group that were disabled
A greaterproportion ofmature Africanswas disabled thenof any otherpopulation group.Moreover thisdifferenceincreased withage.
By age 64, theproportion ofAfricans that wasdisabled wastwice theproportion of whitepeople that wasdisabled. Thismost probablyreflects betteraccess to healthcare among thewhite populationgroup.

Description of mature adults (35–64) Census 2001
Statistics South Africa 143
Disability (continued)
Figure 5.34: Percentage of each age and educational level that were disabled
Within each single-year age category, the highest level of education of the mature adultwas related to the prevalence of disability.
• Of adults with no schooling, 8,7% of 35-year-olds were disabled, increasingsteadily with some fluctuations to reach 16,1% of 64-year-olds.
• Of adults with some primary school education, 7,2% of 35-year-olds weredisabled, increasing steadily with some fluctuations to reach 15,4% of 64-year-olds.
• Of adults with a complete primary school education, 5,5% of 35-year-olds weredisabled, increasing steadily, again with some fluctuations, to reach 14,0% of 64-year-olds.
• Of adults with some secondary education, 4,3% of 35-year-olds were disabled,increasing more gradually to reach 10,8% of 64-year-olds.
• Of adults with complete secondary schooling and those with some level of highereducation, the increase in the prevalence of disability was even more gradual,from 2,7% of 35-year-olds to 6,4% of 64-year-olds for those with completesecondary schooling, and from 2,3% of 35-year-olds to 5,8% of 64-year-olds forthose with some level of higher education.

Description of mature adults (35–64) Census 2001
Stages in the life cycle of South Africans144
Disability (concluded)
Figure 5.35: Labour market status of disabled mature adults according to age
35 36 37 38 39 40 41 42 43 44 45 46 47 48 49 50 51 52 53 54 55 56 57 58 59 60 61 62 63 64 Total
0,0
20,0
40,0
60,0
80,0
100,0%
Employed 26,1 25,8 25,7 26,2 25,5 25,5 25,6 25,8 25,8 25,7 25,4 25,2 25,3 24,3 24,1 23,3 22,0 20,9 20,0 19,7 18,5 17,6 16,9 15,3 14,8 12,2 10,1 8,9 7,9 7,3 21,1Unemployed 19,9 20,1 19,6 19,0 19,1 17,9 17,9 17,7 17,6 16,9 16,6 16,0 16,0 16,2 15,2 13,2 13,3 12,2 12,4 11,7 10,2 9,9 9,2 8,7 8,1 5,2 4,5 3,1 2,9 2,3 13,5Not ec active 54,0 54,1 54,7 54,8 55,4 56,5 56,5 56,5 56,6 57,3 58,0 58,8 58,7 59,5 60,8 63,5 64,8 66,9 67,6 68,6 71,3 72,5 74,0 76,0 77,1 82,6 85,4 88,0 89,2 90,4 65,4
Less than a quarter (21,1%) ofmature disabled adults wereemployed, compared to just overhalf of the age group as a whole.
The proportions of disabledadults that were unemployeddecreased by age, with lowerproportions than for the agegroup as a whole.
The predominant labour marketstatus of mature disabled peoplewas not economically active.
The above findings indicate that, among mature adults, the extent of disability by age is clearlyrelated to variables such as sex, population group and education level of the individual. Those whowere disadvantaged in the apartheid era are more at risk of being disabled with increasing agethan those who were not disadvantaged.

Description of mature adults (35–64) Census 2001
Statistics South Africa 145
Number of people with whom living
Figure 5.36: According to age, compared with the total population and all households
35 36 37 38 39 40 41 42 43 44 45 46 47 48 49 50 51 52 53 54 55 56 57 58 59 60 61 62 63 64 35-64
Totalpop.
Allh'holds
0,0
20,0
40,0
60,0
80,0
100,0%
On their own 7,4 7,4 7,4 7,3 7,3 7,0 7,1 7,0 7,2 7,2 7,1 7,1 7,1 7,3 7,3 7,3 7,5 7,4 7,4 7,5 7,6 7,5 7,7 7,8 7,8 8,0 7,9 7,7 7,9 8,0 7,4 4,2 18,51 11,9 11,8 11,6 11,7 11,4 11,4 11,6 11,5 11,8 11,9 12,4 12,5 12,8 13,5 13,8 14,5 14,8 15,6 16,5 17,6 18,3 18,8 20,0 20,0 19,3 20,1 18,7 20,6 20,7 21,3 14,0 8,9 18,02 14,4 13,9 13,6 13,3 13,2 13,1 13,0 13,2 13,2 13,4 13,6 13,9 14,0 14,2 14,1 14,8 14,5 14,9 14,9 15,1 15,2 14,9 14,7 14,2 13,6 13,6 13,2 13,1 13,0 12,9 13,8 11,9 15,23 19,6 19,5 19,5 19,1 19,0 19,2 18,7 18,4 18,2 18,1 17,7 17,6 17,0 16,5 16,0 15,9 15,3 15,2 14,6 14,3 14,1 13,6 13,1 12,9 12,6 12,3 12,3 12,1 11,8 11,7 16,8 15,9 15,34 15,8 16,1 16,3 16,5 16,5 16,5 16,5 16,4 16,0 15,9 15,5 15,1 14,8 14,3 13,8 13,7 13,3 12,9 12,6 12,3 12,0 11,8 11,6 11,5 11,5 11,3 11,4 11,3 11,2 11,1 14,6 15,1 11,35 10,5 10,9 11,1 11,4 11,6 11,6 11,7 11,7 11,7 11,6 11,6 11,3 11,3 11,0 10,9 10,6 10,5 10,3 10,1 9,8 9,7 9,7 9,5 9,6 9,8 9,7 10,1 9,7 9,7 9,7 10,9 12,4 7,8
6+ 20,4 20,5 20,5 20,7 21,0 21,2 21,4 21,8 21,9 21,9 22,2 22,6 23,1 23,3 24,0 23,3 24,2 23,8 23,9 23,3 23,3 23,6 23,3 23,9 25,4 24,9 26,3 25,5 25,6 25,3 22,5 31,7 13,8
Two main patterns can beseen in this graph.
First there is the pattern of the‘empty nest’, with nuclearfamilies becoming smaller withincreasing age of the adult, aschildren leave home.
Second, there is the pattern ofincreasing proportions ofmature adults becoming part ofan extended multi-generationalfamily with increasing age.
• With each increase in single-year age category, an increasing percentage ofmature adults were living with six or more other people, from 20,4% of thoseaged 35 to 25,3% of those aged 64. This pattern differs from the one found foryouth, where there was a steady decrease in the proportion living in householdswith six or more people with increasing age.
• A fluctuating but generally a very gradually increasing proportion of mature adults(from 7,4% among 35-year-olds, increasing to 8,0% among 64-year-olds) wasliving on their own as a single-person household.
• An increasing proportion of mature adults were living with one other person witheach single-year increase in age (from 11,9% among 35-year-olds, to 21,3%among 64-year-olds).
• Also with increasing age, a decreasing percentage of mature adults were livingwith three to five other people.
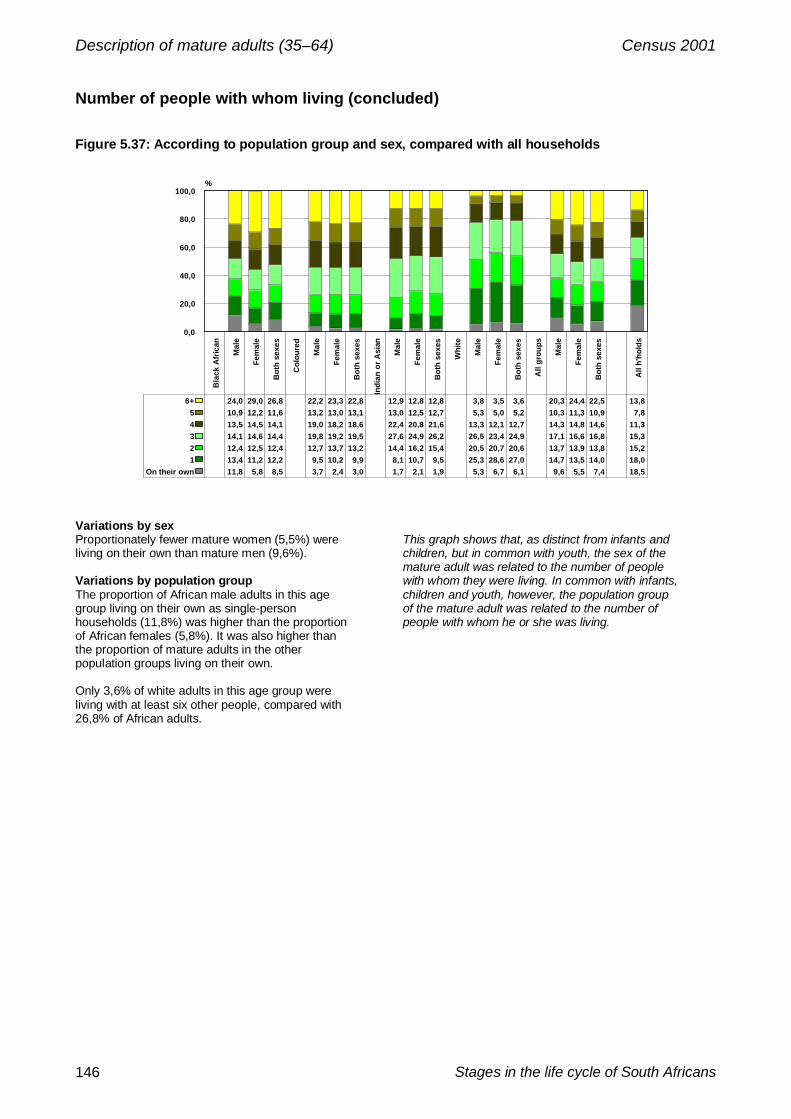
Description of mature adults (35–64) Census 2001
Stages in the life cycle of South Africans146
Number of people with whom living (concluded)
Figure 5.37: According to population group and sex, compared with all households
Bla
ck A
fric
an
Mal
e
Fem
ale
Bot
h se
xes
Col
oure
d
Mal
e
Fem
ale
Bot
h se
xes
Indi
an o
r Asi
an
Mal
e
Fem
ale
Bot
h se
xes
Whi
te
Mal
e
Fem
ale
Bot
h se
xes
All
grou
ps
Mal
e
Fem
ale
Bot
h se
xes
All
h'ho
lds
0,0
20,0
40,0
60,0
80,0
100,0%
On their own 11,8 5,8 8,5 3,7 2,4 3,0 1,7 2,1 1,9 5,3 6,7 6,1 9,6 5,5 7,4 18,51 13,4 11,2 12,2 9,5 10,2 9,9 8,1 10,7 9,5 25,3 28,6 27,0 14,7 13,5 14,0 18,02 12,4 12,5 12,4 12,7 13,7 13,2 14,4 16,2 15,4 20,5 20,7 20,6 13,7 13,9 13,8 15,23 14,1 14,6 14,4 19,8 19,2 19,5 27,6 24,9 26,2 26,5 23,4 24,9 17,1 16,6 16,8 15,34 13,5 14,5 14,1 19,0 18,2 18,6 22,4 20,8 21,6 13,3 12,1 12,7 14,3 14,8 14,6 11,35 10,9 12,2 11,6 13,2 13,0 13,1 13,0 12,5 12,7 5,3 5,0 5,2 10,3 11,3 10,9 7,8
6+ 24,0 29,0 26,8 22,2 23,3 22,8 12,9 12,8 12,8 3,8 3,5 3,6 20,3 24,4 22,5 13,8
Variations by sexProportionately fewer mature women (5,5%) wereliving on their own than mature men (9,6%).
Variations by population groupThe proportion of African male adults in this agegroup living on their own as single-personhouseholds (11,8%) was higher than the proportionof African females (5,8%). It was also higher thanthe proportion of mature adults in the otherpopulation groups living on their own.
Only 3,6% of white adults in this age group wereliving with at least six other people, compared with26,8% of African adults.
This graph shows that, as distinct from infants andchildren, but in common with youth, the sex of themature adult was related to the number of peoplewith whom they were living. In common with infants,children and youth, however, the population groupof the mature adult was related to the number ofpeople with whom he or she was living.

Description of mature adults (35–64) Census 2001
Statistics South Africa 147
Type of dwelling
Figure 5.38: According to age, compared with all households
35 36 37 38 39 40 41 42 43 44 45 46 47 48 49 50 51 52 53 54 55 56 57 58 59 60 61 62 63 64 35-64
Allh'holds
0,0
20,0
40,0
60,0
80,0
100,0%
Formal 66,7 66,1 66,9 66,7 67,3 68,7 67,7 68,9 68,3 69,9 69,8 70,1 70,0 69,7 68,8 70,6 69,2 70,1 71,1 72,4 72,5 72,2 73,5 72,3 69,7 69,2 65,4 70,5 71,4 72,4 69,0 63,8Traditional 12,4 12,8 12,5 12,9 13,1 13,1 13,4 13,1 13,4 12,8 13,4 13,5 13,7 14,0 14,8 14,9 15,7 15,6 14,9 14,3 14,8 15,2 14,5 15,6 17,5 19,2 22,5 18,9 18,4 17,6 14,3 14,8
Informal 16,5 16,7 16,3 16,1 15,5 14,1 14,8 13,9 14,3 13,3 12,9 12,6 12,5 12,5 12,7 10,8 11,3 10,6 10,4 9,8 9,2 9,0 8,6 8,6 9,3 8,2 8,9 7,4 7,0 6,9 12,8 16,4Backyard 4,2 4,1 4,1 4,0 3,9 3,8 3,8 3,8 3,7 3,7 3,6 3,6 3,6 3,6 3,6 3,4 3,5 3,4 3,4 3,3 3,3 3,3 3,2 3,3 3,3 3,2 3,0 3,0 2,9 2,9 3,6 4,8
Other 0,3 0,3 0,3 0,3 0,3 0,3 0,3 0,3 0,3 0,2 0,3 0,2 0,2 0,2 0,2 0,3 0,3 0,3 0,3 0,2 0,2 0,2 0,2 0,3 0,2 0,2 0,2 0,2 0,2 0,2 0,3 0,3
The patterns show that with each increase in age,increasing proportions of mature adults were livingin a formal dwelling or a traditional dwelling.
Conversely, a decreasing proportion of this agegroup were living in an informal dwelling or shack,from 16,5% among 34-year-olds, to 6,9% among65-year-olds.
These proportions differ from those found among youth, but increasingly start to resemble theliving arrangements of infants and children, where higher proportions were counted in traditionaldwellings, and lower proportions in informal dwellings.

Description of mature adults (35–64) Census 2001
Stages in the life cycle of South Africans148
Type of dwelling (concluded)
Figure 5.39: According to population group and sex, compared with all households
Bla
ck A
fric
an
Mal
e
Fem
ale
Bot
h se
xes
Col
oure
d
Mal
e
Fem
ale
Bot
h se
xes
Indi
an o
r A
sian
Mal
e
Fem
ale
Bot
h se
xes
Whi
te
Mal
e
Fem
ale
Bot
h se
xes
All
grou
ps
Mal
e
Fem
ale
Bot
h se
xes
All
h'ho
lds
0,0
20,0
40,0
60,0
80,0
100,0%
Formal 59,5 59,6 59,6 88,6 89,3 88,9 93,7 93,9 93,9 95,8 95,9 95,8 69,3 68,8 69,0 63,8Traditional 16,7 21,3 19,2 2,7 2,5 2,5 1,4 1,4 1,4 1,1 1,1 1,1 12,3 15,9 14,3 14,8
Informal 19,2 14,9 16,9 6,0 5,5 5,7 1,0 1,0 1,0 0,5 0,4 0,5 14,3 11,5 12,8 16,4Backyard 4,2 3,9 4,1 2,5 2,6 2,6 3,5 3,5 3,5 2,3 2,3 2,3 3,7 3,6 3,6 4,8
Other 0,3 0,2 0,2 0,3 0,2 0,2 0,2 0,2 0,2 0,3 0,3 0,3 0,3 0,2 0,3 0,3
Figure 5.40: According to province
EC KZN MP FS NW LP GP NC WC Total0,0
20,0
40,0
60,0
80,0
100,0%
Formal 52,1 59,8 70,2 69,2 73,1 73,2 73,6 83,7 85,1 69,0Traditional 35,3 28,1 13,8 7,8 5,1 18,9 1,3 3,3 2,0 14,3
Informal 9,5 8,2 13,0 19,9 18,9 5,3 18,5 10,1 10,6 12,8Backyard 2,9 3,6 2,7 2,9 2,7 2,3 6,3 2,2 2,1 3,6
Other 0,2 0,3 0,2 0,2 0,2 0,2 0,3 0,6 0,3 0,3
These two figures show that, as in the case of infants, children and youth, the type of dwelling inwhich mature adults were living was clearly related to population group and the province in whichthey lived.

Description of mature adults (35–64) Census 2001
Statistics South Africa 149
Access to services
Figure 5.41: Main energy source for lighting according to five-year age category, compared with allhouseholds, 1996 and 2001
1996 35-39 40-44 45-49 50-54 55-59 60-64 Total Allh'holds
2001 35-39 40-44 45-49 50-54 55-59 60-64 Total Allh'holds
0,0
20,0
40,0
60,0
80,0
100,0%
Electricity 63,9 64,8 65,1 65,2 62,1 59,0 63,8 58,1 73,2 74,3 74,6 74,8 75,4 72,4 74,1 69,7Paraffin 10,5 10,3 10,1 10,2 12,0 12,9 10,8 12,7 5,8 5,7 5,6 5,2 5,1 6,1 5,6 6,8Candles 25,1 24,6 24,4 24,2 25,5 27,7 25,0 28,8 20,3 19,3 19,1 19,2 18,7 20,7 19,6 22,7
Other 0,4 0,4 0,4 0,4 0,4 0,4 0,4 0,4 0,7 0,7 0,7 0,7 0,7 0,8 0,7 0,8
Source: Census 1996 and 2001
Figure 5.42: Access to piped water according to five-year age category, compared with allhouseholds, 1996 and 2001
1996 35-39 40-44 45-49 50-54 55-59 60-64 Total Allh'holds
2001 35-39 40-44 45-49 50-54 55-59 60-64 Total Allh'holds
0,0
20,0
40,0
60,0
80,0
100,0%
In dwelling/ in yard 65,8 66,4 66,2 66,2 62,6 59,1 65,1 60,6 65,3 66,3 66,1 65,7 65,7 60,8 65,4 61,3Public source 18,8 18,0 17,2 16,4 17,1 17,3 17,7 20,9 21,4 20,0 19,8 19,2 18,6 19,8 20,1 23,9
No access 15,3 15,6 16,6 17,4 20,4 23,7 17,2 18,5 13,3 13,6 14,1 15,1 15,7 19,5 14,6 14,8
Source: Census 1996 and 2001

Description of mature adults (35–64) Census 2001
Stages in the life cycle of South Africans150
Access to services (concluded)
Figure 5.43: Main toilet facility according to five-year age category, compared with all households,1996 and 2001
1996 35-39 40-44 45-49 50-54 55-59 60-64 Total Allh'holds
2001 35-39 40-44 45-49 50-54 55-59 60-64 Total Allh'holds
0,0
20,0
40,0
60,0
80,0
100,0%
Flush or chemical toilet 56,7 57,1 57,2 57,4 53,6 49,6 56,0 50,5 58,1 59,3 58,8 58,6 58,6 53,5 58,2 53,8Pit latrine 28,8 28,9 28,9 29,0 30,7 33,3 29,5 32,4 26,6 25,9 26,7 27,0 27,2 29,6 26,8 28,5
Bucket toilet 4,5 4,4 4,2 4,1 4,1 4,1 4,3 4,7 4,0 3,7 3,6 3,4 3,3 3,2 3,6 4,1None 10,0 9,6 9,7 9,5 11,5 13,0 10,2 12,4 11,4 11,2 10,9 11,1 10,8 13,7 11,4 13,6
Source: Census 1996 and 2001
These findings are similar to the ones for infants, children and youth. An increasing proportion ofmature adults had access to electricity for lighting and a slightly increased proportion had access topiped water, while the proportion with access to hygienic toilet facilities remained similar over time.
As with the other age groups considered so far, it was largely African adults, particularly those inthe less industrialised provinces, which were less likely to have access to these types ofinfrastructure, even though there were some improvements between 1996 and 2001.

Description of mature adults (35–64) Census 2001
Statistics South Africa 151
Mature adults in collective living quarters
Table 5.3: Distribution of mature adults by age and type of living quarters
Collective living quartersHousing
unitResidential
hotelOther
residenceWorkers'
hostel Institution Homeless TotalAge N N N N N N N35 588 647 2 338 1097 14 858 8 310 214 615 463
36 603 962 2 313 1044 15 432 8 397 238 631 385
37 582 781 2 225 1018 14 632 8 047 264 608 968
38 595 238 2 224 1005 15 259 7 857 267 621 850
39 568 771 2 112 966 14 722 7 312 221 594 104
40 521 619 1 945 865 13 225 6 248 235 544 137
41 549 001 1 968 863 14 176 6 893 233 573 134
42 499 160 1 787 808 11 854 5 531 214 519 354
43 503 583 1 784 856 12 203 5 537 191 524 154
44 441 018 1 574 694 10 372 4 845 183 458 686
45 430 948 1 638 704 10 073 4 535 171 448 070
46 396 180 1 414 669 8 970 4 068 167 411 468
47 391 291 1 347 642 8 686 3 836 126 405 929
48 390 558 1 395 636 8 621 3 644 140 404 994
49 401 555 1 494 704 9 116 3 884 167 416 919
50 335 875 1 330 691 7 448 3 047 159 348 549
51 350 445 1 270 688 8 074 3 339 157 363 973
52 317 119 1 125 672 6 274 2 660 110 327 961
53 300 640 1 152 610 5 635 2 598 106 310 741
54 277 708 1 078 583 4 863 2 443 120 286 796
55 251 926 912 547 4 143 2 209 91 259 827
56 239 582 852 567 3 706 2 040 71 246 818
57 217 881 817 540 3 236 1 937 79 224 489
58 218 954 754 619 3 261 1 697 74 225 360
59 241 839 833 625 3 487 1 917 70 248 771
60 217 912 783 626 2 761 1 820 64 223 967
61 264 965 841 795 3 053 1 939 86 271 679
62 199 155 651 730 1 966 1 497 56 204 054
63 187 507 585 742 1 561 1 569 48 192 011
64 169 511 528 816 1 299 1 390 36 173 581
Total 11 255 334 41 069 22 423 242 966 121 046 4 358 11 687 195
Table 5.3 shows that the vast majority of mature adults, approximately 11,3 million(96,3%), were living in households in housing units. Relatively few, approximately432 000, were counted in collective living quarters or were homeless. Of these:
• 243 000 were in workers’ hostels;• 121 000 were in institutions;• 41 000 were in residential hotels;• 22 000 were in other types of residences, and• 4 000 were homeless, without shelter.

Description of mature adults (35–64) Census 2001
Stages in the life cycle of South Africans152
Mature adults in collective living quarters (continued)
Figure 5.44: By age, population group and sex
4,4 4,3 4,3 4,4 4,34,1 4,2
3,9 3,9 3,9 3,8 3,73,5 3,5
3,7 3,6 3,6
3,2 3,2 3,2 3,1
2,8 2,9 2,8 2,82,6
2,4 2,4 2,3 2,3
4,4
3,3
2,5
1,7
5,5
2,0
3,7
Age 35 36 37 38 39 40 41 42 43 44 45 46 47 48 49 50 51 52 53 54 55 56 57 58 59 60 61 62 63 64
Pop
. gro
upB
lack
Afr
ican
Whi
teCo
lour
edIn
dian
or A
sian
Sex
Mal
eFe
mal
e
Tota
l
0,0
1,0
2,0
3,0
4,0
5,0
6,0%
Residential hotel 0,4 0,4 0,4 0,4 0,4 0,4 0,3 0,3 0,3 0,3 0,4 0,3 0,3 0,3 0,4 0,4 0,3 0,3 0,4 0,4 0,4 0,3 0,4 0,3 0,3 0,3 0,3 0,3 0,3 0,3 0,3 0,7 0,3 0,5 0,4 0,3 0,4Other residence 0,2 0,2 0,2 0,2 0,2 0,2 0,2 0,2 0,2 0,2 0,2 0,2 0,2 0,2 0,2 0,2 0,2 0,2 0,2 0,2 0,2 0,2 0,2 0,3 0,3 0,3 0,3 0,4 0,4 0,5 0,4 0,9 0,4 0,6 0,2 0,2 0,2Workers' hostel 2,4 2,4 2,4 2,5 2,5 2,4 2,5 2,3 2,3 2,3 2,2 2,2 2,1 2,1 2,2 2,1 2,2 1,9 1,8 1,7 1,6 1,5 1,4 1,4 1,4 1,2 1,1 1,0 0,8 0,7 2,7 0,4 0,5 0,2 3,2 1,1 2,1
Institution 1,4 1,3 1,3 1,3 1,2 1,1 1,2 1,1 1,1 1,1 1,0 1,0 0,9 0,9 0,9 0,9 0,9 0,8 0,8 0,9 0,9 0,8 0,9 0,8 0,8 0,8 0,7 0,7 0,8 0,8 1,0 1,3 1,3 0,4 1,7 0,4 1,0
With each increasing single-yearage category, a smallerproportion of mature adults wascounted in collective livingquarters, except in otherresidences, where theproportion was slightly higher atthe age of 84. This is a changefrom the upward pattern foundamong children and youth aged28 years or younger.
A larger proportion of Africanmature adults than those inother population groups wascounted in collective livingquarters, (particularly workers’hostels) followed by whitemature adults.
A significantly higher proportionof male than female matureadults was found in collectiveliving quarters, particularly inworkers’ hostels.

Description of mature adults (35–64) Census 2001
Statistics South Africa 153
Mature adults in institutions
Table 5.4: Number of mature adults in institutions by age and type of institution
AgeTouristhotel
Medicalfacility
Home forthe
disabled HostelConvent,
etc.
Prison/policecells
Defenceforce
barracks
Refugeecamp/
communityshelter Total
35 601 1 554 177 1 036 187 4 210 440 105 8 31036 613 1 589 195 1 091 175 4 250 391 93 8 397
37 628 1 547 183 1 088 180 3 995 338 88 8 04738 645 1 578 181 1 005 193 3 828 326 101 7 857
39 553 1 512 155 1 049 160 3 499 283 101 7 312
40 518 1 321 169 894 150 2 873 241 82 6 248
41 532 1 535 149 1 101 167 3 046 271 92 6 893
42 450 1 268 150 889 145 2 346 194 89 5 53143 489 1 161 156 859 131 2 386 260 95 5 537
44 467 1 128 177 802 113 1 910 192 56 4 845
45 428 1 187 149 756 104 1 709 138 64 4 535
46 414 1 083 157 666 82 1 426 173 67 4 068
47 391 1 059 139 636 79 1 316 139 77 3 83648 358 1 068 146 546 104 1 241 113 68 3 644
49 382 1 104 170 562 102 1 382 120 62 3 884
50 365 964 149 447 76 906 91 49 3 047
51 383 984 163 552 86 1 008 99 64 3 33952 346 866 167 357 78 714 81 51 2 660
53 350 852 135 412 60 658 67 64 2 598
54 353 815 153 309 64 605 79 65 2 443
55 294 801 148 303 77 484 54 48 2 209
56 302 780 131 288 58 397 43 41 2 04057 305 689 109 314 72 324 82 42 1 937
58 254 700 127 205 52 288 29 42 1 697
59 265 786 118 250 62 339 37 60 1 917
60 295 804 141 197 64 246 22 51 1 820
61 254 867 143 242 78 291 17 47 1 93962 247 721 116 157 52 162 11 31 1 497
63 245 795 137 178 62 112 14 26 1 569
64 191 742 127 140 46 105 8 31 1 390
Total 11 918 31 860 4 517 17 331 3 059 46 056 4 353 1 953 121 046
Table 5.4 indicates the number of mature adults counted in each institution (as a sub-category of collective living quarters) at the time of Census 2001. It shows that, of theapproximately 121 000 mature adults counted in institutions on census night:
• 46 000 were in prisons or police cells;• 32 000 were in a medical facility such as a hospital;• 17 000 were in hostels not for workers;• 12 000 were in tourist hotels and related tourist accommodation;• 5 000 were in homes for the disabled;• 4 000 were in defence force barracks or other military accommodation;• 3 000 were in initiation schools, religious retreats, convents and monasteries; and• 2 000 were in community or church halls, refugee camps and shelters for the
homeless.

Description of mature adults (35–64) Census 2001
Stages in the life cycle of South Africans154
Mature adults in institutions (concluded)
Table 5.5: Number of mature adults in prisons, correctional institutions and police cellsby five-year age category, population group and sex
Black African Coloured Indian or Asian White TotalAge Male Female Total Male Female Total Male Female Total Male Female Total Male Female Total35-39 14 644 602 15 246 3 642 164 3 806 122 5 127 525 78 603 18 933 849 19 78240-44 9 355 428 9 783 2 110 78 2 188 79 3 82 417 91 508 11 961 600 12 561
45-49 5 360 240 5 600 1 009 48 1 057 57 7 64 294 59 353 6 720 354 7 074
50-54 2 946 147 3 093 494 19 513 21 3 24 217 44 261 3 678 213 3 891
55-59 1 358 69 1 427 211 13 224 8 0 8 134 39 173 1 711 121 1 832
60-64 654 47 701 93 5 98 0 3 3 83 31 114 832 84 916
Total 34 317 1 533 35 850 7 559 327 7 886 289 19 308 1 670 342 2 012 43 835 2 221 46 056
Of the approximately 171 000 people counted in prisons, correctional institutions andpolice cells in Census 2001, 46 000 were mature adults (26,9%).
• There was a decrease in the number of detained mature adults with each five-year age increase, from a high count of 20 000 aged 35–39 years to a low countof 916 aged 60-64 years
• The vast majority, 44 000 of 46 000, were males (95,2%).• The majority were African (36 000 or 77,8%). This is a larger proportion than the
African percentage of all mature adults (72,2%).• Coloured persons constituted 8 000 of the 46 000 detained mature adults
(17,1%). This proportion is higher than the proportion of coloured mature adults inthe country (9,9%).
• There were 2 000 white mature adults in detention (4,4%).• Only 308 mature adult detainees were Indian or Asian (0,7%).
Figure 5.45: Percentage of mature adults in prisons, correctional institutions or police cells,according to age
0,7 0,7 0,70,6
0,6
0,5 0,5
0,5 0,50,4
0,40,4
0,3 0,3 0,3
0,30,3
0,2 0,2 0,20,2
0,2 0,1 0,1 0,10,1 0,1
0,10,1 0,1
0,4
35 36 37 38 39 40 41 42 43 44 45 46 47 48 49 50 51 52 53 54 55 56 57 58 59 60 61 62 63 64 Total0,0
0,2
0,4
0,6
0,8
1,0
1,2% Overall, 0,4% of all
those aged 35–64years were countedin a police cell or inprison.
Of all 35-year-olds0,7% was countedin police cells orprisons. Thispercentagedecreased witheach single-yearage increase toreach 0,1% of thoseaged 64.
Relating this pattern to the pattern found among youth, the reader will recall that after aninitial increase among younger youth, there was a fluctuating downward trend amongolder youth (see Figure 4.45). This downward trend continues among mature adults.
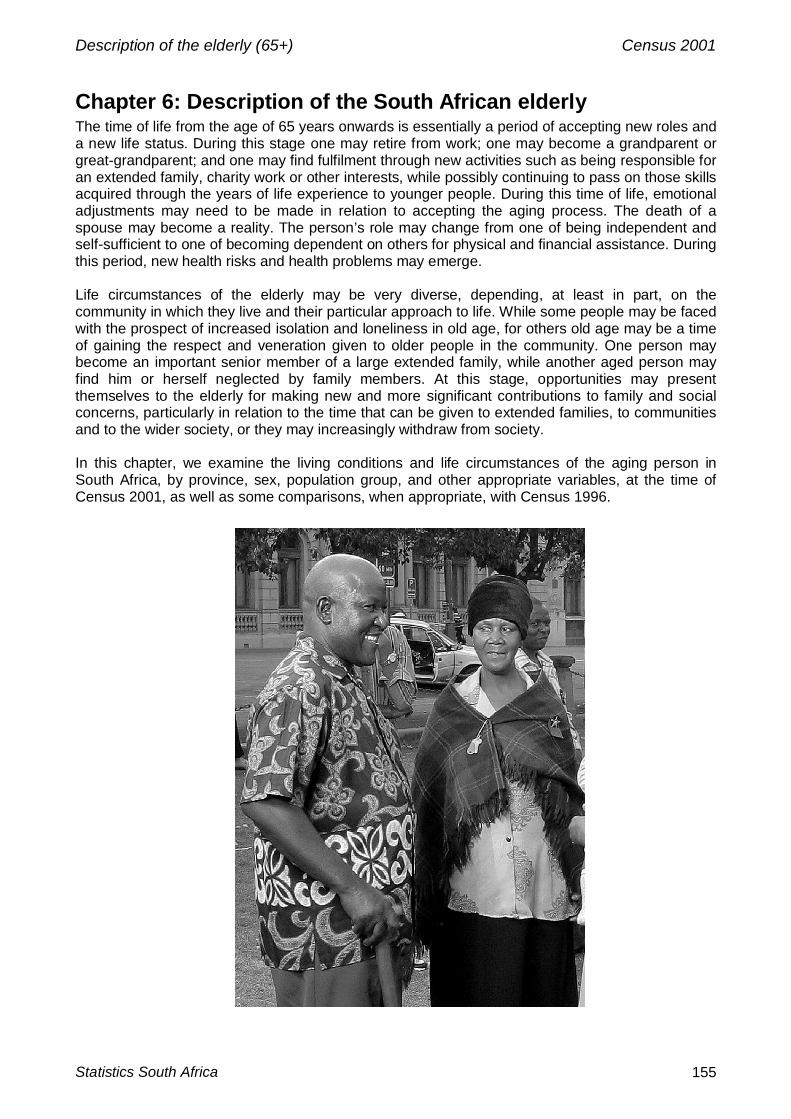
Description of the elderly (65+) Census 2001
Statistics South Africa 155
Chapter 6: Description of the South African elderlyThe time of life from the age of 65 years onwards is essentially a period of accepting new roles anda new life status. During this stage one may retire from work; one may become a grandparent orgreat-grandparent; and one may find fulfilment through new activities such as being responsible foran extended family, charity work or other interests, while possibly continuing to pass on those skillsacquired through the years of life experience to younger people. During this time of life, emotionaladjustments may need to be made in relation to accepting the aging process. The death of aspouse may become a reality. The person’s role may change from one of being independent andself-sufficient to one of becoming dependent on others for physical and financial assistance. Duringthis period, new health risks and health problems may emerge.
Life circumstances of the elderly may be very diverse, depending, at least in part, on thecommunity in which they live and their particular approach to life. While some people may be facedwith the prospect of increased isolation and loneliness in old age, for others old age may be a timeof gaining the respect and veneration given to older people in the community. One person maybecome an important senior member of a large extended family, while another aged person mayfind him or herself neglected by family members. At this stage, opportunities may presentthemselves to the elderly for making new and more significant contributions to family and socialconcerns, particularly in relation to the time that can be given to extended families, to communitiesand to the wider society, or they may increasingly withdraw from society.
In this chapter, we examine the living conditions and life circumstances of the aging person inSouth Africa, by province, sex, population group, and other appropriate variables, at the time ofCensus 2001, as well as some comparisons, when appropriate, with Census 1996.

Description of the elderly (65+) Census 2001
Stages in the life cycle of South Africans156
Demographic pictureTable 6.1 shows that there were 2,2 million people aged 65 years or more in South Africa on thenight of 9–10 October 2001, 4,9% of the total population.
Table 6.1: Distribution of the elderly by five-year age category, sex and population group
Black African Coloured Indian or Asian White TotalAge Sex N % N % N % N % N % Male 193 570 63,5 29 104 9,5 9 939 3,3 72 151 23,7 304 763 100,0
65-69 Female 346 522 71,7 39 428 8,2 13 152 2,7 84 061 17,4 483 164 100,0
Total 540 092 68,5 68 532 8,7 23 091 2,9 156 212 19,8 787 927 100,0
Male 152 237 65,5 17 563 7,6 6 122 2,6 56 626 24,4 232 547 100,0
70-74 Female 290 314 72,8 26 387 6,6 8 499 2,1 73 722 18,5 398 922 100,0
Total 442 551 70,1 43 950 7,0 14 621 2,3 130 348 20,6 631 469 100,0
Male 87 194 63,9 9 187 6,7 3 194 2,3 36 862 27,0 136 436 100,0
75-79 Female 154 094 66,7 15 788 6,8 4 767 2,1 56 452 24,4 231 101 100,0
Total 241 287 65,6 24 974 6,8 7 961 2,2 93 314 25,4 367 537 100,0
Male 63 462 69,9 4 537 5,0 1 484 1,6 21 351 23,5 90 835 100,0
80-84 Female 130 891 72,7 8 939 5,0 2 396 1,3 37 885 21,0 180 111 100,0
Total 194 353 71,7 13 476 5,0 3 881 1,4 59 236 21,9 270 945 100,0
Male 32 034 69,8 2 359 5,1 645 1,4 10 869 23,7 45 907 100,0
85+ Female 76 231 68,4 6 473 5,8 1 242 1,1 27 479 24,7 111 425 100,0
Total 108 265 68,8 8 832 5,6 1 887 1,2 38 348 24,4 157 333 100,0
Male 528 497 65,2 62 749 7,7 21 385 2,6 197 858 24,4 810 489 100,065+ Female 998 051 71,0 97 015 6,9 30 057 2,1 279 600 19,9 1 404 722 100,0 Total 1 526 548 68,9 159 764 7,2 51 441 2,3 477 458 21,6 2 215 211 100,0
Numbers according to five-year age categoriesBearing in mind possible age misreporting, therewas a decrease in the number of people with eachfive-year increase in age. Thus there wereapproximately 788 000 people aged 65–69 years(35,6% of all the elderly), 631 000 aged 70–74years (28,5%), 368 000 aged 75–79 years (16,6%),271 000 aged 80–84 years (12,2%), and 157 000aged 85 years or more (7,1%).
This decline in numbers follows on the oneobserved among those aged 20 and above, afterthe relatively high percentages of infants, childrenand teenagers.
Variation by sexOnly 810 000 of the approximately 2,2 millionpeople in this age category were males (36,6%),while 1,4 million were females (63,4%).
Variation by population groupA decreasing majority, or 1,5 million of theapproximately 2,2 million people in this agecategory, were African, while 477 000 were white,160 000 were coloured and 51 000 were Indian orAsian.
Comparison with the mature adults age groupThe decrease in the proportion of Africanscontinues the pattern observed in the mature adultsage group, together with the increase in theproportion of people classified as white. We saw inChapter 5 that 72,2% of mature adults counted inCensus 2001 were African, while 9,9% werecoloured, 14,5% were white, and 3,4% were Indianor Asian. In contrast, Africans constituted 68,9% ofthe elderly, white people 21,6%, coloured people7,2%, and Indians or Asians 2,3%.

Description of the elderly (65+) Census 2001
Statistics South Africa 157
Demographic picture (continued)
Figure 6.1: Male and female elderly by population group, compared with the total population, 1996and 2001
Male 1996 2001 Female 1996 2001 Bothsexes
1996 2001 Totalpop.
1996 20010,0
20,0
40,0
60,0
80,0
100,0%
Black African 65,7 65,2 68,7 71,0 67,5 68,9 77,4 79,0Coloured 7,0 7,7 6,5 6,9 6,7 7,2 9,0 8,9
Indian or Asian 2,3 2,6 1,9 2,1 2,1 2,3 2,6 2,5White 25,0 24,4 22,9 19,9 23,7 21,6 11,0 9,6
Source: Census 1996 and 2001Excluding unspecified in 1996
In common with allother age groups,the percentage ofAfrican elderlyincreased betweenthe two censuses(from 67,5% in1996 to 68,9% in2001). On the otherhand, thepercentage of whitepeople in this agegroup decreased(from 23,7% in1996 to 21,6% in2001).
Figure 6.2: Distribution of the elderly by age, sex and population group39,939,037,538,0
39,038,4
35,036,637,037,837,436,836,736,8
38,035,4
33,733,0
31,334,2
29,2
36,6
60,161,162,562,0
61,161,5
64,963,562,962,262,663,263,463,3
61,864,6
66,267,0
68,765,8
70,9
63,5
6566676869707172737475767778798081828384
85+
65+
0,020,040,060,080,0100,0
% male
0,0 20,0 40,0 60,0 80,0 100,0
% female
65 66 67 68 69 70 71 72 73 74 75 76 77 78 79 80 81 82 83 84 85+ 65+Black African M 26,0 24,0 23,2 24,2 25,3 24,0 24,5 23,7 24,1 23,9 23,9 24,3 23,7 22,0 24,4 23,8 24,6 22,9 24,1 18,5 20,4 23,9
Coloured M 3,8 3,9 3,6 3,7 3,4 3,3 2,4 2,8 2,7 2,8 2,6 2,4 2,4 2,7 2,4 1,9 1,5 1,9 1,2 2,2 1,5 2,8Indian or Asian M 1,4 1,3 1,4 1,2 1,1 1,2 0,8 1,0 0,9 1,0 1,0 0,8 0,8 0,9 0,8 0,7 0,5 0,5 0,4 0,7 0,4 1,0
White M 8,7 9,8 9,3 8,9 9,2 9,9 7,3 9,1 9,3 10,1 9,9 9,3 9,8 11,2 10,4 9,0 7,1 7,7 5,6 12,8 6,9 8,9Black African F 43,3 43,2 44,9 44,8 43,8 43,0 51,0 46,3 44,6 42,3 43,0 43,7 42,7 39,2 39,3 45,0 50,4 48,3 54,1 37,5 48,5 45,1
Coloured F 5,0 5,0 5,1 5,1 4,9 4,5 3,6 4,3 4,2 4,5 4,2 4,3 4,2 4,7 4,1 3,4 3,0 3,4 2,8 4,9 4,1 4,4Indian or Asian F 1,7 1,8 1,7 1,5 1,5 1,6 1,1 1,4 1,3 1,4 1,4 1,3 1,3 1,4 1,1 1,1 0,7 0,9 0,6 1,3 0,8 1,4
White F 10,1 11,1 10,8 10,6 10,9 12,4 9,2 11,5 12,8 14,0 14,0 13,9 15,2 18,0 17,3 15,1 12,1 14,4 11,2 22,1 17,5 12,6
This graphillustrates starklythe preponderanceof women amongthe elderly.
Moreover there is agradual althoughfluctuating increasein the proportion ofwomen withincreasing age,from 60,1% of 65-year-olds, to 70,9%of people aged 85and above.

Description of the elderly (65+) Census 2001
Stages in the life cycle of South Africans158
Demographic picture (concluded)
Figure 6.3: The elderly in each province by population group, 1996 and 2001
WC
1996
2001 NC
1996
2001 GP
1996
2001
KZN
1996
2001 FS
1996
2001 EC
1996
2001 MP
1996
2001 NW 1996
2001 LP
1996
2001
Tota
l
1996
2001
0,0
20,0
40,0
60,0
80,0
100,0%
Black African 10,4 9,5 28,7 27,8 45,8 49,4 71,3 74,3 68,8 75,6 83,9 84,4 86,1 86,7 86,4 84,6 95,0 95,4 67,5 68,9Coloured 37,2 41,4 43,2 44,0 2,6 3,0 1,3 1,5 3,7 2,4 4,9 4,8 0,4 0,6 1,1 1,2 0,2 0,2 6,7 7,2
Indian or Asian 0,8 0,9 0,2 0,3 1,9 2,3 8,1 8,9 0,1 0,0 0,2 0,2 0,5 0,4 0,2 0,3 0,1 0,1 2,1 2,3White 51,6 48,2 27,8 27,9 49,7 45,2 19,3 15,4 27,5 22,0 11,0 10,6 13,1 12,4 12,3 13,8 4,7 4,3 23,7 21,6
Source: Census 1996 and 2001
In Western Cape, the proportionof the elderly that was colouredincreased from 37,2% in 1996 to41,4% in 2001.
In Northern Cape, the proportionof the elderly that was colouredalso increased, but only slightly,from 43,2% in 1996 to 44,0% in2001
In North West, there was a slightdecrease in the proportion of theelderly that was African (from86,4% in 1996 to 84,6% in2001).
In Gauteng, the Africanproportion of the elderlyincreased from 45,8% in 1996 to49,4% in 2001, while theproportion that was whitedecreased from 49,7% in 1996to 45,2% in 2001.
A similar picture to Gauteng wasfound in the remainingprovinces, namely an increasein the proportion of the elderlyclassified as African, and adecrease in the proportionclassified as white.
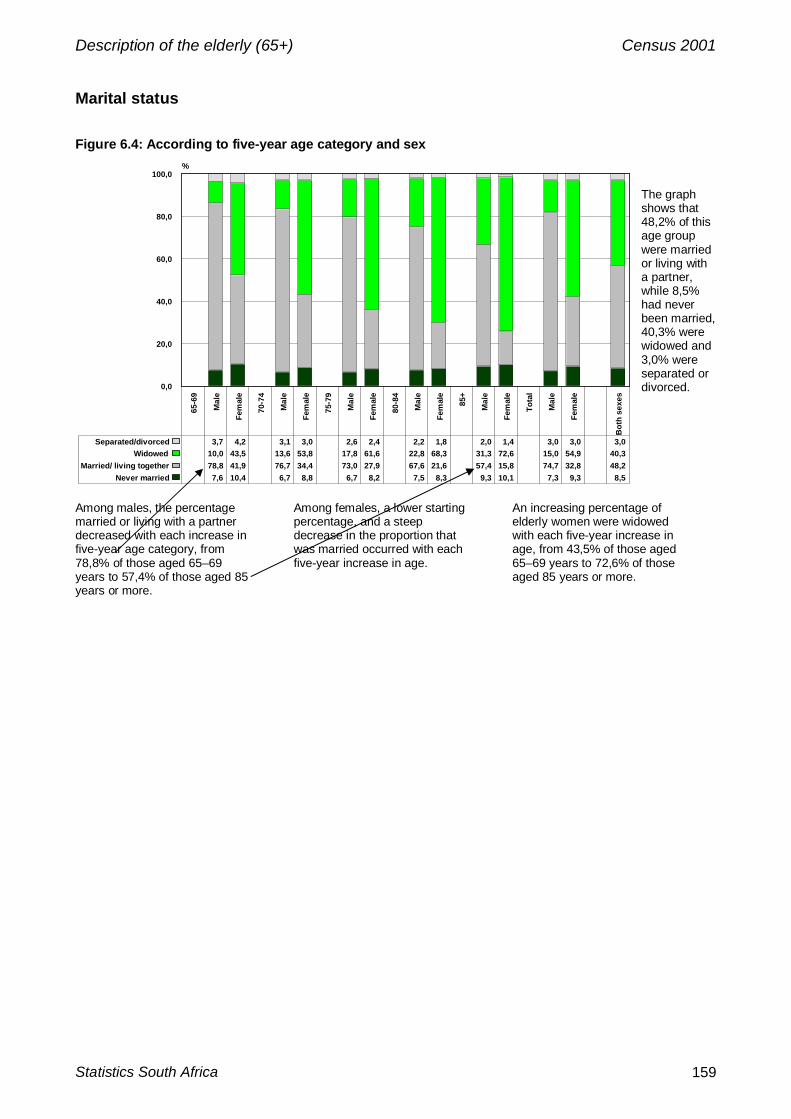
Description of the elderly (65+) Census 2001
Statistics South Africa 159
Marital status
Figure 6.4: According to five-year age category and sex
65-6
9
Mal
e
Fem
ale
70-7
4
Mal
e
Fem
ale
75-7
9
Mal
e
Fem
ale
80-8
4
Mal
e
Fem
ale
85+
Mal
e
Fem
ale
Tota
l
Mal
e
Fem
ale
Bot
h se
xes
0,0
20,0
40,0
60,0
80,0
100,0%
Never married 7,6 10,4 6,7 8,8 6,7 8,2 7,5 8,3 9,3 10,1 7,3 9,3 8,5Married/ living together 78,8 41,9 76,7 34,4 73,0 27,9 67,6 21,6 57,4 15,8 74,7 32,8 48,2
Widowed 10,0 43,5 13,6 53,8 17,8 61,6 22,8 68,3 31,3 72,6 15,0 54,9 40,3Separated/divorced 3,7 4,2 3,1 3,0 2,6 2,4 2,2 1,8 2,0 1,4 3,0 3,0 3,0
The graphshows that48,2% of thisage groupwere marriedor living witha partner,while 8,5%had neverbeen married,40,3% werewidowed and3,0% wereseparated ordivorced.
Among males, the percentagemarried or living with a partnerdecreased with each increase infive-year age category, from78,8% of those aged 65–69years to 57,4% of those aged 85years or more.
Among females, a lower startingpercentage, and a steepdecrease in the proportion thatwas married occurred with eachfive-year increase in age.
An increasing percentage ofelderly women were widowedwith each five-year increase inage, from 43,5% of those aged65–69 years to 72,6% of thoseaged 85 years or more.

Description of the elderly (65+) Census 2001
Stages in the life cycle of South Africans160
Marital status (concluded)
Figure 6.5: According to five-year age category and population group
65-6
9
Bla
ck A
fric
an
Col
oure
d
Indi
an o
r A
sian
Whi
te
70-7
4
Bla
ck A
fric
an
Col
oure
d
Indi
an o
r A
sian
Whi
te
75-7
9
Bla
ck A
fric
an
Col
oure
d
Indi
an o
r A
sian
Whi
te
80-8
4
Bla
ck A
fric
an
Col
oure
d
Indi
an o
r A
sian
Whi
te
85+
Bla
ck A
fric
an
Col
oure
d
Indi
an o
r A
sian
Whi
te
65+
Bla
ck A
fric
an
Col
oure
d
Indi
an o
r A
sian
Whi
te
Tota
l
0,0
20,0
40,0
60,0
80,0
100,0%
Never married 11,0 10,5 5,9 3,4 9,3 10,0 5,8 3,3 8,9 10,7 5,9 3,6 9,0 11,9 6,3 3,9 11,3 12,7 8,2 5,5 9,9 10,7 6,0 3,6 8,5Married/ living together 52,3 52,6 56,7 71,1 47,2 43,4 47,0 62,0 43,6 34,0 36,6 50,9 37,5 25,5 26,7 38,7 30,7 16,6 20,6 23,1 46,0 42,9 47,3 56,8 48,2
Widowed 33,2 32,6 35,2 19,9 40,9 43,2 45,4 30,3 45,4 52,7 56,1 42,0 51,8 60,6 65,6 54,5 56,6 69,0 69,6 69,3 41,4 43,0 44,9 35,3 40,3Separated/divorced 3,5 4,3 2,2 5,6 2,6 3,3 1,8 4,4 2,1 2,6 1,4 3,4 1,7 2,0 1,5 2,9 1,4 1,7 1,5 2,1 2,7 3,4 1,9 4,2 3,0
In the age category 65–69years, a larger percentage ofwhite elderly people weremarried or living with a partner(71,1%) than Indian or Asian(56,7%), coloured (52,6%), orAfrican (52,3%) elderly people.
This pattern changed by age;with each increase in five-yearage category, increasingpercentages in each populationgroup became widowed, and theranking of married people bypopulation group altered.
By the age of 85 or more years,23,1% of white elderly peoplewere married or living with apartner, as against 30,7% ofAfrican, 20,6% of Indian orAsian, and 16,6% of colouredelderly people.
Figure 6.6: According to five-year age category, population group and sex65-69
Black AfricanColoured
Indian or AsianWhite70-74
Black AfricanColoured
Indian or AsianWhite75-79
Black AfricanColoured
Indian or AsianWhite80-84
Black AfricanColoured
Indian or AsianWhite
85+Black African
ColouredIndian or Asian
White65+
Black AfricanColoured
Indian or AsianWhite
Total
0,020,040,060,080,0100,0
% male
0,0 20,0 40,0 60,0 80,0 100,0
% female
Never married Married/ living together Widowed Separated/divorced
This graph depictsthe information inthe last two graphsin a differentmanner. Again itcan be clearly seenthat, acrosspopulation groups,with each five-yearincrease in age, alarger proportion ofwomen than menwere widowed.

Description of the elderly (65+) Census 2001
Statistics South Africa 161
Relationship to household head
Figure 6.7: According to age
Of all the elderly, 68,0%were the head or actinghead of the household.This is an increase fromthe 57,4% of those aged35–64 years. There wasalso an increase, withina shorter age difference,from the 66,8% among64-year olds (asindicated in Chapter 4)to 67,2% among 65-yearolds.
A relatively small group, 13,9%,were the spouses of thehousehold head. This is lowerthan the 25,6% of mature adultsthat were spouses of thehousehold head.
With each five-year increase inage, an increasing proportion ofthe elderly was reported as aparent of the household head,from 5,2% of those aged 65 to18,6% of those aged 85 ormore.
There was a similar increase inthose who were a relative otherthan a parent of the householdhead.
Figure 6.8: According to five-year age category and sex
65-69 Male Female 70-74 Male Female 75-79 Male Female 80-84 Male Female 85+ Male Female 65+ Male Female Total0,0
20,0
40,0
60,0
80,0
100,0%
H'hold head 83,5 58,2 83,7 61,6 82,6 62,0 79,9 60,9 73,3 52,1 82,5 59,7 68,0Spouse/partner 6,3 26,6 5,8 19,6 5,3 14,7 5,0 8,2 4,2 4,4 5,7 18,7 13,9
Parent 2,9 7,4 3,7 9,8 4,7 12,3 6,3 16,6 10,0 22,2 4,2 11,1 8,6Other relative 6,4 7,2 6,1 8,6 6,6 10,5 7,9 13,8 11,6 20,6 6,8 10,0 8,8
Not related 0,9 0,6 0,8 0,5 0,8 0,5 0,8 0,5 0,8 0,7 0,8 0,5 0,6
Of elderly men,82,5% definedthemselves as thehousehold heador acting head,while 59,7% offemales definedthemselves in thisway.
Only 18,7% ofelderly womendefinedthemselves as thespouse of thehousehold head,as against 41,2%of females in theage category 35–64 years. Theproportion ofelderly womenwho werewidowed in partexplains thisfinding.
65 66 67 68 69 70 71 72 73 74 75 76 77 78 79 80 81 82 83 84 85+ 65+0,0
20,0
40,0
60,0
80,0
100,0%
H'hold head 67,2 67,2 67,9 68,5 69,3 68,5 70,0 69,9 70,1 70,2 69,8 69,8 69,9 69,2 69,5 68,3 67,8 66,8 67,6 63,6 58,5 68,0Spouse/partner 19,8 19,8 18,9 17,9 16,8 16,2 14,9 14,0 13,5 13,0 12,2 11,8 11,0 10,5 9,7 8,6 7,8 6,7 5,5 6,1 4,4 13,9
Parent 5,2 5,4 5,7 6,0 6,3 6,9 7,2 7,8 8,1 8,3 8,9 8,9 9,6 10,1 10,3 11,6 12,5 13,7 14,4 15,1 18,6 8,6Other relative 6,9 6,9 6,8 6,9 7,0 7,7 7,4 7,7 7,7 8,0 8,5 8,9 9,0 9,6 9,9 10,8 11,4 12,2 11,9 14,4 17,9 8,8
Not related 0,8 0,7 0,7 0,6 0,7 0,7 0,5 0,6 0,6 0,5 0,6 0,6 0,5 0,7 0,6 0,7 0,5 0,6 0,6 0,8 0,7 0,6

Description of the elderly (65+) Census 2001
Stages in the life cycle of South Africans162
Relationship to household head (concluded)
Figure 6.9: According to five-year age category and population groupAcross populationgroups, with increasingage, smallerpercentages of theelderly were reported asbeing the householdhead. This was mostnoticeable among theIndian/Asian group,where the proportiondecreased from 53,4%of 65–69 year olds to29,7% of those aged 85years or more.
Among the Indian/Asianelderly, the proportionthat was a parent orother relative of thehousehold headincreased withincreasing age.
65-6
9
Bla
ck A
fric
an
Whi
te
Col
oure
d
Indi
an o
r A
sian
70-7
4
Bla
ck A
fric
an
Whi
te
Col
oure
d
Indi
an o
r A
sian
75-7
9
Bla
ck A
fric
an
Whi
te
Col
oure
d
Indi
an o
r A
sian
80-8
4
Bla
ck A
fric
an
Whi
te
Col
oure
d
Indi
an o
r A
sian
85+
Bla
ck A
fric
an
Whi
te
Col
oure
d
Indi
an o
r A
sian
65+
Bla
ck A
fric
an
Whi
te
Col
oure
d
Indi
an o
r A
sian
Tota
l
0,0
20,0
40,0
60,0
80,0
100,0%
H'hold head 72,1 59,1 60,3 53,4 73,4 62,0 60,5 50,2 73,5 64,2 59,3 44,6 69,6 64,3 54,1 38,7 59,7 59,5 45,1 29,7 71,5 61,6 58,9 49,2 68,0Spouse/partner 15,4 29,9 20,4 17,4 11,7 24,4 15,3 11,1 8,7 18,7 10,5 7,4 5,9 12,1 7,0 3,7 3,8 6,8 4,0 3,7 11,2 22,7 15,5 12,6 13,9
Parent 5,4 4,6 7,2 15,4 7,3 6,1 10,2 21,5 9,1 7,8 13,1 28,3 13,0 11,2 17,5 32,8 18,4 16,6 22,9 38,0 8,4 7,1 10,6 21,2 8,6Other relative 6,6 5,4 10,3 13,3 7,2 6,5 12,2 16,7 8,4 8,2 15,2 19,4 11,2 11,2 19,3 24,4 17,7 15,5 26,0 28,2 8,4 7,6 13,2 16,6 8,8
Not related 0,5 1,0 1,8 0,4 0,4 1,0 1,7 0,4 0,3 1,0 1,8 0,3 0,4 1,3 2,1 0,4 0,4 1,7 2,1 0,4 0,4 1,1 1,8 0,4 0,6

Description of the elderly (65+) Census 2001
Statistics South Africa 163
EducationThe educational attainments of the elderly may be less relevant at this stage of life than they arefor younger people. At this age, people may study as a hobby, or to improve their knowledgearound a particular interest, rather than for improving qualifications for the workplace. Theeducational attainments of the elderly are generally relatively low in South Africa, because of therelatively poor opportunities in the past for disadvantaged people to attend school or othereducational institutions.
Figure 6.10: Percentage attending an educational institution according to sex and population group
1,9
1,41,3 1,3
1,7
1,41,3
0,9
1,21,3
Black African Coloured Indian or Asian White Total0,0
0,5
1,0
1,5
2,0%
Male Female
Only 1,5% of theelderly wereenrolled in aneducationalinstitution in2001.
A slightly greaterproportion ofelderly Africanswere studyingthan the elderlyof otherpopulationgroups, withAfrican malesbeing the largestgroup.

Description of the elderly (65+) Census 2001
Stages in the life cycle of South Africans164
Education (concluded)
Figure 6.11: Educational attainment according to sex and population group
Mal
es
Bla
ck A
fric
an
Col
oure
d
Indi
an o
r Asi
an
Whi
te
Tota
l
Fem
ales
Bla
ck A
fric
an
Col
oure
d
Indi
an o
r Asi
an
Whi
te
Tota
l
Bot
h se
xes
Tota
l
0,0
20,0
40,0
60,0
80,0
100,0%
No schooling 58,1 26,2 11,2 2,1 40,7 64,2 24,6 38,2 3,0 48,7 45,8Some primary 22,6 25,4 21,4 2,5 17,9 19,9 29,4 27,2 3,2 17,4 17,6
Complete primary 4,4 8,9 8,1 1,6 4,1 4,2 11,5 6,5 1,9 4,3 4,2Some secondary 11,4 31,8 40,3 36,0 19,7 9,6 29,8 20,9 44,2 18,1 18,7Std 10/ Grade 12 2,2 5,0 11,9 34,4 10,5 1,2 3,0 5,0 33,3 7,8 8,8
Higher 1,3 2,7 7,1 23,4 7,0 1,0 1,6 2,3 14,5 3,7 4,9
The stark contrastof educationalattainment bypopulation groupcan be seen in thisgraph. Among theAfrican elderly,58,1% of men and64,2% of womenhad not receivedany education,compared to 2,1%of elderly white menand 3,0% of elderlywhite women.
Post-schoolqualifications hadbeen obtained by1,3% of Africanmen in this agegroup, and 1,0% ofAfrican women,compared to 23,4%of white men and14,5% of whitewomen.
Figure 6.12: Main field of study among those with tertiary qualifications29 241
16 56512 411
11 7514 041
3 1832 987
2 5372 4592 2122 0061 905
1 6031 5831 4771 4671 2541 021992
694598535
6 554
Education, training or developmentBusiness, commerce or management sciences
Health care or health scienceEngineering or engineering technology
Agriculture or renewable natural resourcesArts, visual or performing
LawSocial sciences and social studiesLife sciences or physical sciencesLanguages, linguistics or literature
Philosophy, religion or theologyPublic administration and social services
Architecture or environmental designComputer science and data processing
Home economicsIndustrial arts, trades or technology
PsychologyMathematical sciences
CommunicationLibraries or museums
Military sciencesPhysical education or leisure
Other
0 5 000 10 000 15 000 20 000 25 000 30 000 35 000
Altogether, 109 000of theapproximately2,2 million elderlypeople counted(4,9%) had post-schoolqualifications.
Of these, 29 000had qualifications inthe field ofeducation, 17 000in business orcommerce, and12 000 in healthand in engineering.Other fields of studywere much lesspopular.

Description of the elderly (65+) Census 2001
Statistics South Africa 165
The employed elderlyIn general, labour market concepts and definitions only apply to those aged between 15 and 65years. Using these labour market concepts for understanding the work of the elderly over the ageof 65 years is not appropriate.9 Therefore, instead of applying labour market definitions to theelderly, we will focus on those who were in fact working at the time of the census. Altogether110 000 of the 2,2 million elderly people (5,0%) were working. We shall call these people theemployed elderly.
Figure 6.13: Number of employed elderly according to age and broad work category
Across all agecategories, the majorityof the working elderlywere found working informal or registeredbusinesses.
Figure 6.14: Number of employed elderly according to population group and sex
2 761
592
3 352
4 774
2 423
7 197
29 285
13 674
42 959
37 652
19 319
56 971
74 472
36 007
110 479
Indian or Asian
Male
Female
Total
Coloured
Male
Female
Total
White
Male
Female
Total
Black African
Male
Female
Total
All groups
Male
Female
Total
0 20 000 40 000 60 000 80 000 100 000 120 000 140 000
More elderly maleswere working(74 000) thanelderly females(36 000).The number ofworking Africanelderly was thelargest (57 000),followed by white(43 000), coloured(7 000) and thenAsian or Indian(3 000) workingelderly. (This graphis ordered to reflectthis pattern.)
9 But this can be done for those aged 65 years. Among the approximately 188 000 people aged 65 years counted in Census 2001, 19 000 wereemployed (10,4%), whereas 5 000 were unemployed (2,7%) and 163 000 were not economically active (87,0%). These people aged 65 years whowere working have also been included in the discussion that follows.
65 66 67 68 69 70 71 72 73 74 75 76 77 78 79 80 81 82 83 84 85+0,0
5,0
10,0
15,0
20,0
25,0Thousands
Formal registered (non-farming) 13,5 9,0 7,3 6,4 5,7 4,9 4,7 3,2 2,6 2,3 1,9 1,7 1,4 1,2 1,2 1,1 1,1 0,7 0,7 0,9 2,5Informal unregistered (non-farming) 3,1 1,9 1,8 1,6 1,5 1,2 1,3 0,8 0,6 0,5 0,5 0,4 0,3 0,3 0,3 0,3 0,3 0,2 0,2 0,1 0,5
Farming 2,5 1,9 1,6 1,6 1,3 1,2 1,3 0,8 0,7 0,6 0,5 0,4 0,3 0,3 0,3 0,3 0,3 0,2 0,2 0,1 0,4Temporarily absent from work 0,4 0,2 0,2 0,2 0,2 0,1 0,2 0,1 0,1 0,1 0,1 0,1 0,0 0,0 0,0 0,0 0,1 0,0 0,0 0,0 0,1

Description of the elderly (65+) Census 2001
Stages in the life cycle of South Africans166
The employed elderly (concluded)
Figure 6.15: Percentage of elderly within each educational level that were employed
2,8
4,2 4,4
5,8
10,3
15,6
5,0
No
scho
olin
g
Som
e pr
imar
y
Com
plet
e pr
imar
y
Som
e se
cond
ary
Gra
de 1
2
Hig
her
Tota
l
0,0
5,0
10,0
15,0
20,0% This shows clearly
that people withhigher educationwere more likelythan others tocontinue workingafter retirementage.
Only 2,8% of theelderly with noeducation wereemployed,increasing to15,6% of thosewith tertiaryqualifications.
Figure 6.16: According to population group and sex by the number of hours worked
BlackAfrican
Male Female Coloured Male Female Indian/Asian
Male Female White Male Female All pop.groups
Male Female Total0,0
20,0
40,0
60,0
80,0
100,0%
0-9 4,5 6,7 3,0 5,4 4,0 6,3 4,0 5,8 4,2 6,2 4,910-19 3,3 4,8 2,7 5,8 2,8 4,2 4,3 6,8 3,7 5,6 4,320-29 2,5 4,9 3,3 6,4 3,7 5,4 6,2 12,1 4,0 7,7 5,230-39 5,2 10,3 5,0 12,0 6,8 7,6 6,4 10,3 5,7 10,4 7,2
40+ 84,4 73,4 85,9 70,4 82,7 76,5 79,0 65,0 82,3 70,1 78,3
Across allpopulationgroups elderlywomen wereless likely towork a fullworking weekthan elderlymen.
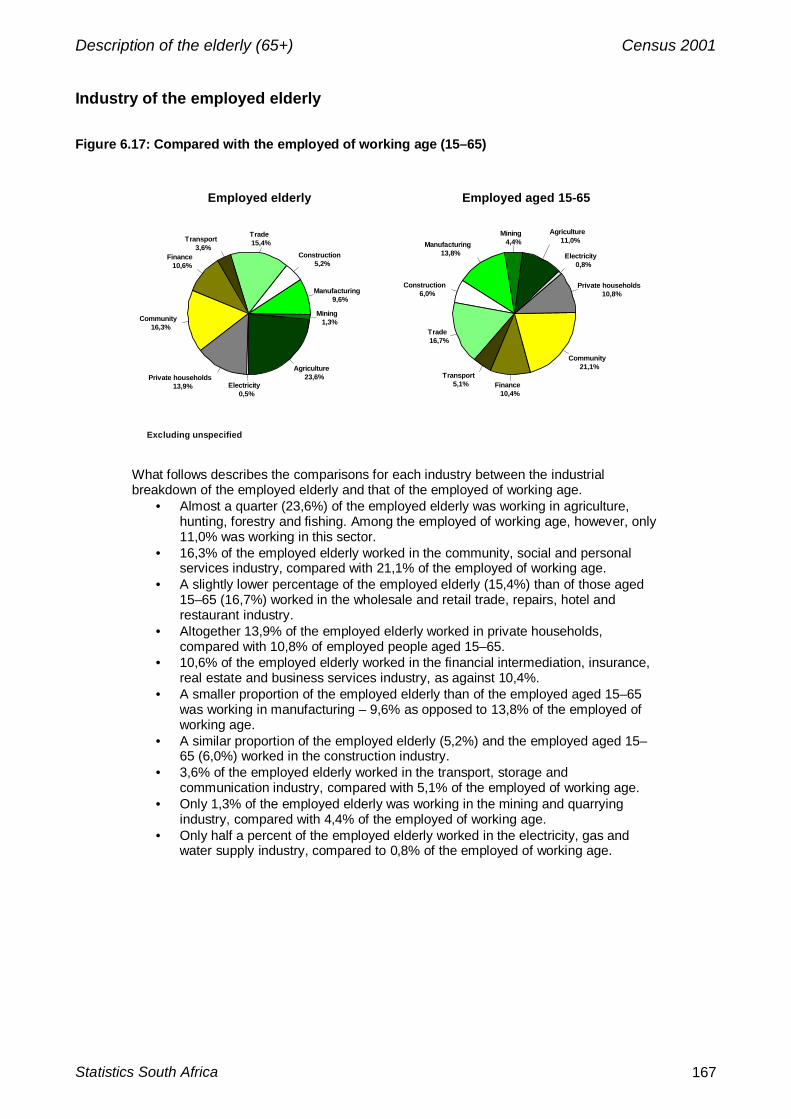
Description of the elderly (65+) Census 2001
Statistics South Africa 167
Industry of the employed elderly
Figure 6.17: Compared with the employed of working age (15–65)
Employed elderly Employed aged 15-65
Agriculture23,6%
Mining1,3%
Manufacturing9,6%
Construction5,2%
Trade15,4%Transport
3,6%Finance
10,6%
Community16,3%
Private households13,9% Electricity
0,5%
Agriculture11,0%
Mining4,4%Manufacturing
13,8%
Construction6,0%
Trade16,7%
Transport5,1% Finance
10,4%
Community21,1%
Private households10,8%
Electricity0,8%
Excluding unspecified
What follows describes the comparisons for each industry between the industrialbreakdown of the employed elderly and that of the employed of working age.
• Almost a quarter (23,6%) of the employed elderly was working in agriculture,hunting, forestry and fishing. Among the employed of working age, however, only11,0% was working in this sector.
• 16,3% of the employed elderly worked in the community, social and personalservices industry, compared with 21,1% of the employed of working age.
• A slightly lower percentage of the employed elderly (15,4%) than of those aged15–65 (16,7%) worked in the wholesale and retail trade, repairs, hotel andrestaurant industry.
• Altogether 13,9% of the employed elderly worked in private households,compared with 10,8% of employed people aged 15–65.
• 10,6% of the employed elderly worked in the financial intermediation, insurance,real estate and business services industry, as against 10,4%.
• A smaller proportion of the employed elderly than of the employed aged 15–65was working in manufacturing – 9,6% as opposed to 13,8% of the employed ofworking age.
• A similar proportion of the employed elderly (5,2%) and the employed aged 15–65 (6,0%) worked in the construction industry.
• 3,6% of the employed elderly worked in the transport, storage andcommunication industry, compared with 5,1% of the employed of working age.
• Only 1,3% of the employed elderly was working in the mining and quarryingindustry, compared with 4,4% of the employed of working age.
• Only half a percent of the employed elderly worked in the electricity, gas andwater supply industry, compared to 0,8% of the employed of working age.

Description of the elderly (65+) Census 2001
Stages in the life cycle of South Africans168
Occupation of the employed elderly
Figure 6.18: Compared with the employed of working age (15–65)
Employed elderly Employed aged 15-65
Managers9,4%
Professionals9,7%
Technicians7,1%
Clerks7,6%
Sales workers10,3%
Skilled agriculture11,0%
Artisans8,0%
Operators6,7%
Elementary30,2%
Managers5,8%
Professionals7,5%Technicians
10,3%
Clerks11,7%
Sales workers10,9%
Skilled agriculture3,0%
Artisans13,0%
Operators9,4%
Elementary28,4%
Excluding unspecified
The following compares the proportions of the employed elderly and the employed ofworking age in each occupation.
• The proportion of the employed elderly working in management (9,4%) washigher than the overall proportion among the employed aged 15–65 years (5,8%).
• The proportion working as professionals was also higher (9,7% as against 7,5%).• 7,1% of the employed elderly were in technical and semi-professional
occupations, compared with 10,3% of the employed of working age.• The proportion of employed elderly working in clerical occupations was 7,6%,
compared to 11,7% of the employed of working age.• 10,3% of the employed elderly were sales and service workers, compared to
10,9% of the employed of working age.• 11,0% of the employed elderly people were found in skilled agricultural
occupations, compared with 3,0% of the employed aged 15–65 years.• 8,0% of the employed elderly were working in artisan-related occupations,
compared with 13,0% of the employed aged 15–65 years.• 6,7% of elderly employed people were working in assembly and operator
occupations, compared with 9,4% of the employed aged 15–65 years.• Altogether 30,2% of employed elderly people worked in elementary occupations,
compared with 28,4% of the employed of working age.

Description of the elderly (65+) Census 2001
Statistics South Africa 169
Disability
Table 6.2: Number of disabled elderly by five-year age category, sex and type of disability
Nodisability Sight Hearing
Communi-cation Physical Intellectual Emotional Multiple
At leastone
disability Total Male 262 714 12 574 5 648 1 112 12 842 1 538 3 158 5 177 42 049 304 763
65-69 Female 417 921 22 182 7 826 1 357 17 391 2 300 5 002 9 185 65 243 483 164
Total 680 635 34 756 13 474 2 469 30 233 3 838 8 160 14 363 107 293 787 927
Male 195 749 11 807 5 285 897 10 153 1 157 2 249 5 251 36 799 232 547
70-74 Female 333 554 22 314 8 551 1 241 16 798 1 884 4 084 10 496 65 368 398 922
Total 529 303 34 122 13 837 2 138 26 950 3 041 6 333 15 747 102 168 631 469
Male 110 839 8 334 4 128 541 6 356 671 1 364 4 203 25 597 136 436
75-79 Female 184 890 14 879 6 468 785 11 744 1 142 2 454 8 738 46 210 231 101
Total 295 729 23 213 10 596 1 326 18 100 1 814 3 818 12 942 71 809 367 537
Male 69 453 7 273 3 545 381 4 772 476 904 4 031 21 382 90 835
80-84 Female 134 622 14 469 6 894 749 10 377 914 2 145 9 941 45 489 180 111
Total 204 076 21 741 10 439 1 130 15 149 1 390 3 049 13 972 66 870 270 945
Male 32 323 4 239 2 339 202 2 724 236 524 3 321 13 585 45 907
85+ Female 75 546 9 882 5 633 516 8 108 542 1 399 9 799 35 879 111 425
Total 107 869 14 121 7 972 718 10 832 778 1 923 13 120 49 464 157 333
Male 671 077 44 227 20 946 3 134 36 845 4 078 8 198 21 983 139 411 810 489
65+ Female 1 146 534 83 726 35 371 4 648 64 418 6 782 15 084 48 159 258 188 1 404 722
Total 1 817 611 127 953 56 317 7 782 101 264 10 860 23 282 70 142 397 600 2 215 211
Altogether, of the 2,2 million elderly counted in Census 2001, 398 000 (17,9%) werereported as being disabled. Of these, 128 000 (32,1%) had a visual, 56 000 (14,2%) ahearing, 8 000 (2,0%) a communication, 101 000 (25,5%) a physical, 11 000 (2,7%) anintellectual, and 23 000 (5,9%) an emotional disability, while 70 000 (17,6%) had multipledisabilities.
Figure 6.19: Percentage of disabled elderly of each age by type of disability, compared with the totalpopulationWith some slightfluctuations, there was asteady increase in theproportion of thedisabled elderly witheach single-yearincrease in age. Thispattern continues fromthe one previouslyobserved among infants,children, youth andmature adults.
Among the elderly,however, there wereclear differences inthe extent of thisincrease accordingto the type ofdisability.
The percentage of those with visual, hearing,physical and multiple disabilities increased steadilywith increasing age.
The proportions of those with emotional,communication and intellectual disabilities remainedstable with increasing age.
13,0 13,0 13,514,6 14,2 14,9
15,8 16,2 16,9 17,6 18,219,6 19,5 20,2
21,322,5 23,0
25,6
27,626,1
31,5
18,1
5,0
65 66 67 68 69 70 71 72 73 74 75 76 77 78 79 80 81 82 83 84 85 + 65 + Total0,0
5,0
10,0
15,0
20,0
25,0
30,0
35,0%
Sight 4,1 4,2 4,5 4,8 4,6 4,9 5,3 5,5 5,7 5,9 6,0 6,5 6,3 6,2 6,7 7,4 7,7 8,2 9,3 7,2 9,0 5,8 1,3Hearing 1,5 1,6 1,7 1,9 1,8 2,0 2,1 2,2 2,3 2,4 2,6 2,8 3,0 3,1 3,1 3,4 3,6 4,1 4,2 4,4 5,1 2,5 0,7
Communication 0,3 0,3 0,3 0,3 0,3 0,3 0,4 0,3 0,3 0,3 0,3 0,4 0,3 0,4 0,4 0,4 0,4 0,4 0,4 0,5 0,5 0,4 0,2Physical 3,8 3,8 3,7 4,0 4,0 4,1 4,1 4,2 4,5 4,6 4,6 4,9 4,8 5,2 5,5 5,3 5,2 5,7 6,0 6,3 6,9 4,6 1,2
Intellectual 0,5 0,5 0,5 0,5 0,5 0,5 0,5 0,5 0,5 0,4 0,5 0,5 0,5 0,5 0,5 0,6 0,5 0,5 0,5 0,4 0,5 0,5 0,5Emotional 1,1 1,0 1,0 1,0 1,0 1,0 1,0 1,0 1,0 1,0 1,0 1,1 1,1 1,0 1,1 1,0 1,1 1,1 1,3 1,2 1,2 1,1 0,6
Multiple 1,7 1,6 1,8 2,1 2,0 2,1 2,4 2,5 2,6 3,0 3,2 3,4 3,5 3,8 4,0 4,4 4,5 5,6 5,9 6,1 8,3 3,2 0,6

Description of the elderly (65+) Census 2001
Stages in the life cycle of South Africans170
Disability (continued)
Figure 6.20: Percentage of males and females of each age that were disabledAt the age of 65 years, aslightly higherpercentage of males(13,4%) was disabledthan females (12,6%).By the age of 70 years,however, a slightlyhigher percentage offemales (15,0%) thanmales (14,6%) wasdisabled.
By the age of 85 yearsor more, 32,2% offemales were disabled,compared with 29,6% ofmales.
Figure 6.21: Percentage of each age and population group that were disabledAmong Africans, 14,7%of those aged 65 weredisabled; this increasedsteadily to reach 29,5%of those aged 85 ormore.
Among coloured people,11,6% of those aged 65were disabled; this alsoincreased steadily forthe most part, to reach28,0% of those aged 85or more.
Among Indian/Asianpeople, 10,3% weredisabled; this increasedrelatively gradually toreach 22,6% at the ageof 85 or more.
Among white people,7,3% of those aged 65were disabled; thisincreased gradually atfirst, and then rathersteeply, to reach 38,1%of those aged 85 yearsor more.

Description of the elderly (65+) Census 2001
Statistics South Africa 171
Disability (concluded)
Figure 6.22: Percentage of each age and educational level that were disabled
Within each single-year age category, the highest level of education of the elderly personwas related to the prevalence of disability. (Note that the disruption in almost all patternsfor age 84 is probably due to age misreporting.)
• Of the elderly with no formal schooling, 14,7% of 65-year-olds were disabled; thisincreased steadily to reach 29,5% of those aged 85 or more.
• Of those with some primary school education, the proportion that was disabledincreased steadily from 11,6% at age 65 to 28,0% of those aged 85 or more.
• Of those with a complete primary school education, the proportion that wasdisabled increased from 10,3% of 65-year-olds to reach 22,6% of those aged 85or more.
• Of those with some secondary education, 7,3% of those aged 65 were disabled;this increased gradually at first, then steeply to reach 38,1% of those aged 85 orolder.
• A higher proportion of 12,9% of those with complete secondary schooling wasdisabled at age 65, increasing to reach 31,4% of those aged 85 years or more.
• Of those with post-school qualifications, 5,9% of 65-year-olds were disabled,increasing gradually at first and then more steeply, with some variation, to reach34,5% of those 85-years-olds.
The above findings indicate that, among the elderly, the extent of disability at each age is clearlyrelated to variables such as sex, population group and education level of the individual. Those whowere disadvantaged in the apartheid era are more at risk of being disabled than those who werenot disadvantaged, but only up to a certain age, after which steeper curves are found among thepreviously advantaged and the most highly educated people than among the previouslydisadvantaged who have survived into old age.

Description of the elderly (65+) Census 2001
Stages in the life cycle of South Africans172
Number of people with whom livingThere are two prevalent patterns regarding the number of people in the household of the elderly.First, there is the pattern of a large proportion of the elderly living as single-person households aschildren leave home and spouses die. Second, there is the pattern of increasing proportions of theelderly becoming part of an extended multi-generational family with increasing age.
Figure 6.23: According to age, compared with the total population and all households
With each increase insingle-year agecategory, but withfluctuations, anincreasing percentageof the elderly were livingwith six or more otherpeople, from 26,7% ofthose aged 65 years to33,9% of those aged 85and more. This patterncontinues from the onefound among matureadults where increasingproportions of peoplewere living in largerhouseholds withincreasing age.
65 66 67 68 69 70 71 72 73 74 75 76 77 78 79 80 81 82 83 84 85 + 65+ Totalpop.
Allh'holds
0,0
20,0
40,0
60,0
80,0
100,0%
On their own 8,2 8,4 8,4 8,6 9,0 9,7 8,9 9,5 10,0 10,7 10,9 11,0 11,7 12,7 12,8 11,9 10,9 11,3 10,2 13,4 10,6 9,8 4,2 18,51 20,1 21,0 20,8 20,5 20,3 21,1 18,4 19,8 20,2 20,7 20,3 19,5 19,9 20,6 19,4 17,8 15,9 16,5 14,7 17,1 13,2 19,2 8,9 18,02 12,3 12,3 12,2 12,1 12,0 11,9 11,5 11,5 11,4 11,4 11,2 11,2 11,3 11,2 11,3 11,3 11,3 11,4 11,7 11,4 11,5 11,7 11,9 15,23 11,5 11,5 11,5 11,4 11,4 10,9 11,4 11,1 11,0 10,8 10,9 10,8 10,7 10,5 10,6 10,7 11,3 11,2 11,5 10,7 11,0 11,2 15,9 15,34 11,3 10,8 11,1 10,9 11,0 10,8 11,3 11,0 11,0 10,6 10,6 10,7 10,5 10,2 10,3 10,5 11,0 10,9 11,4 9,6 10,5 10,9 15,1 11,35 9,9 9,5 9,8 9,8 9,6 9,4 9,9 9,7 9,6 9,2 9,4 9,3 9,2 8,8 8,7 9,3 9,7 9,3 9,8 8,3 9,3 9,5 12,4 7,8
6+ 26,7 26,4 26,3 26,8 26,7 26,2 28,6 27,4 26,8 26,6 26,8 27,4 26,7 26,0 26,8 28,5 30,0 29,5 30,7 29,7 33,9 27,7 31,7 13,8
A fluctuating but in general gradually increasingproportion of the elderly was living on their own assingle-person households (from 8,2% among 65-year-olds, increasing to 13,4% among 84-year-olds).
On the other hand, a fluctuating but in generaldecreasing proportion of the elderly was living withone other person from 20,1% among 65-year-olds, to13,2% among those aged 85 and more.
Figure 6.24: According to population group and sex, compared with all householdsVariation by population groupIn common with all otherage groups studied, thepopulation group of theelderly was related to thenumber of people withwhom they were living. Only5,2% of the Indian or Asianelderly were living on theirown, compared to 6,4% ofcoloured, 6,9% of blackAfrican and 20,9% of thewhite elderly. By contrast asmany as 33,8% of the blackAfrican elderly were living inhouseholds with at least sixother people, compared with26,4% of coloured, 17,6% ofIndian or Asian and 9,8% ofthe white elderly.
Variation by sexAs distinct from infants and children, but in commonwith youth and mature adults, the sex of the elderlywas related to the number of people with whom theywere living. Proportionately more elderly women(10,5%) were living on their own than elderly men(8,7%).
Variation by sex and population groupIn contrast to the overall pattern, a greater proportionof African elderly men lived alone (8,9%) than ofAfrican elderly women (5,9%). Among the whiteelderly, on the other hand, as many as 28,8% ofwomen were living alone, as against 9,6% of men.
Bla
ck A
fric
an
Mal
e
Fem
ale
Bot
h se
xes
Col
oure
d
Mal
e
Fem
ale
Bot
h se
xes
Indi
an o
r A
sian
Mal
e
Fem
ale
Bot
h se
xes
Whi
te
Mal
e
Fem
ale
Bot
h se
xes
All
grou
ps
Mal
e
Fem
ale
Bot
h se
xes
All
h'ho
lds
0,0
20,0
40,0
60,0
80,0
100,0%
On their own 8,9 5,9 6,9 5,6 6,9 6,4 3,1 6,7 5,2 9,6 28,8 20,9 8,7 10,5 9,8 18,51 11,2 11,0 11,1 17,7 15,4 16,3 22,7 15,9 18,7 60,2 36,3 46,2 24,0 16,5 19,2 18,02 10,6 12,4 11,8 13,9 13,3 13,5 17,2 13,3 14,9 11,8 9,7 10,5 11,3 11,9 11,7 15,23 11,5 13,1 12,6 13,3 13,1 13,2 13,7 13,4 13,5 5,6 5,8 5,7 10,3 11,7 11,2 15,34 11,8 12,9 12,5 12,4 13,6 13,2 12,8 17,9 15,8 3,5 4,7 4,2 9,9 11,4 10,9 11,35 11,0 11,5 11,3 10,8 11,3 11,1 12,8 15,2 14,2 2,6 2,8 2,7 9,0 9,8 9,5 7,8
6+ 34,9 33,2 33,8 26,4 26,3 26,4 17,6 17,6 17,6 6,7 11,9 9,8 26,9 28,2 27,7 13,8

Description of the elderly (65+) Census 2001
Statistics South Africa 173
Type of dwelling
Figure 6.25: According to age, compared with all householdsOverall, 69,0% of theelderly were living informal, 22,2% intraditional, and 6,0% ininformal dwellings, while2,7% were living inbackyard rooms orflatlets, and 0,2% inother types of dwellings.This pattern, with somefluctuations, remainedsimilar across all single-year age categories.
These proportionsdiffer from thosefound among youthsand mature adults,but are similar to theliving arrangementsof infants andchildren, wherehigher proportionswere counted intraditional dwellings,and lowerproportions ininformal dwellings.
65 66 67 68 69 70 71 72 73 74 75 76 77 78 79 80 81 82 83 84 85+ 65+ Allh'holds
0,0
20,0
40,0
60,0
80,0
100,0%
Formal 69,5 70,3 69,9 69,1 68,6 68,0 64,3 68,6 69,8 71,3 70,2 70,1 70,0 72,2 70,5 67,1 64,8 69,7 65,8 74,3 69,6 69,0 63,8Traditional 20,7 20,5 20,7 20,6 22,1 23,2 26,9 22,8 21,8 20,3 21,6 21,6 21,7 19,8 21,2 24,7 27,0 21,9 24,9 17,9 22,3 22,2 14,8
Informal 6,7 6,2 6,4 7,2 6,3 5,9 6,1 5,7 5,4 5,4 5,4 5,5 5,4 5,0 5,4 5,4 5,6 5,7 6,5 4,9 5,5 6,0 16,4 Backyard 2,8 2,8 2,8 2,8 2,8 2,7 2,5 2,7 2,7 2,8 2,7 2,7 2,7 2,9 2,8 2,6 2,5 2,4 2,5 2,7 2,5 2,7 4,8
Other 0,2 0,2 0,2 0,2 0,2 0,2 0,2 0,2 0,2 0,2 0,2 0,2 0,2 0,1 0,2 0,2 0,2 0,2 0,2 0,2 0,2 0,2 0,3

Description of the elderly (65+) Census 2001
Stages in the life cycle of South Africans174
Type of dwelling (concluded)
Figure 6.26: According to population group and sex, compared with all householdsB
lack
Afr
ican
Mal
e
Fem
ale
Tota
l
Col
oure
d
Mal
e
Fem
ale
Tota
l
Indi
an o
r Asi
an
Mal
e
Fem
ale
Tota
l
Whi
te
Mal
e
Fem
ale
Tota
l
All
grou
ps
Mal
e
Fem
ale
Tota
l
All
h'ho
lds
0,0
20,0
40,0
60,0
80,0
100,0%
Formal 59,2 58,3 58,6 90,6 91,8 91,3 94,2 94,6 94,4 95,4 95,2 95,3 71,0 67,8 69,0 63,8Traditional 28,7 31,7 30,6 2,9 2,4 2,6 1,5 1,3 1,4 1,3 1,2 1,2 19,6 23,7 22,2 14,8
Informal 9,0 7,3 7,9 4,1 3,3 3,6 0,9 0,9 0,9 0,5 0,4 0,4 6,4 5,7 6,0 16,4Backyard 2,9 2,6 2,7 2,3 2,3 2,3 3,2 3,0 3,1 2,5 2,9 2,7 2,8 2,7 2,7 4,8
Other 0,2 0,1 0,2 0,2 0,2 0,2 0,2 0,2 0,2 0,4 0,3 0,3 0,2 0,2 0,2 0,3
Thirty-one per cent ofAfrican elderly wereliving in traditionaldwellings, comparedwith 2,6% of coloured,1,4% of Indian or Asianand 1,2% of whiteelderly.
Figure 6.27: According to provinceAs many as 49,2%of the elderly inEastern Cape wereliving in traditionaldwellings, as against1,4% of the elderly inGauteng.
EC KZN MP LP FS NW GP NC WC Total0,0
20,0
40,0
60,0
80,0
100,0%
Formal 44,2 54,3 72,2 73,7 74,8 80,8 85,6 86,9 92,8 69,0Traditional 49,2 38,0 17,1 22,0 8,0 6,4 1,4 3,2 1,7 22,2
Informal 4,1 4,4 8,5 2,4 14,5 10,7 7,9 6,9 3,4 6,0Backyard 2,4 3,1 2,0 1,7 2,6 1,9 4,8 2,3 2,0 2,7
Other 0,1 0,3 0,2 0,1 0,2 0,1 0,2 0,7 0,2 0,2
These graphs clearly show that in common with the infant, the child, the youth, and the matureadult, the type of dwelling in which the elderly person was living was clearly related to theirpopulation groups and the province in which they lived.

Description of the elderly (65+) Census 2001
Statistics South Africa 175
Access to services
Figure 6.28: Main energy source for lighting according to five-year age category, compared with allhouseholds, 1996 and 2001
1996 65-69 70-74 75-79 80-84 85+ Total Allh'holds
2001 65-69 70-74 75-79 80-84 85+ Total Allh'holds
0,0
20,0
40,0
60,0
80,0
100,0%
Electricity 55,7 58,9 55,0 60,6 57,3 56,9 58,1 72,3 70,7 73,8 70,9 73,1 72,0 69,7Paraffin 14,3 13,4 15,5 12,7 14,2 14,1 12,7 5,9 6,1 5,6 6,4 5,6 5,9 6,8Candles 29,6 27,4 29,1 26,3 28,1 28,6 28,8 20,9 22,4 19,8 21,9 20,5 21,2 22,7
Other 0,4 0,4 0,4 0,4 0,4 0,4 0,4 0,8 0,8 0,8 0,8 0,9 0,8 0,8
Source: Census 1996 and 2001
Figure 6.29: Access to piped water according to five-year age category, compared with allhouseholds, 1996 and 2001
1996 65-69 70-74 75-79 80-84 85+ Total Allh'holds
2001 65-69 70-74 75-79 80-84 85+ Total Allh'holds
0,0
20,0
40,0
60,0
80,0
100,0%
In dwelling/ in yard 55,1 58,5 54,8 60,4 57,2 56,5 60,6 59,8 56,7 60,3 55,9 58,3 58,4 61,3Public source 18,2 17,3 19,8 17,2 19,4 18,3 20,9 19,8 20,6 19,5 21,9 21,4 20,4 23,9
No access 26,7 24,2 25,3 22,4 23,4 25,2 18,5 20,4 22,7 20,2 22,2 20,3 21,2 14,8
Source: Census 1996 and 2001
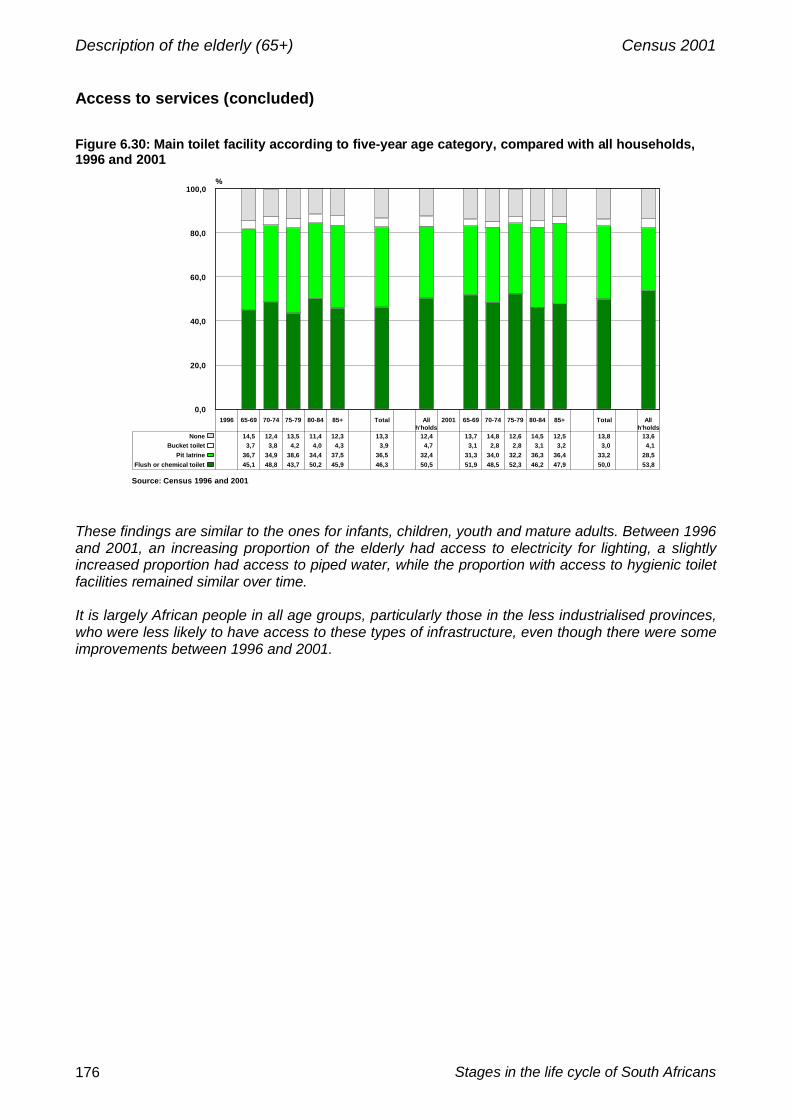
Description of the elderly (65+) Census 2001
Stages in the life cycle of South Africans176
Access to services (concluded)
Figure 6.30: Main toilet facility according to five-year age category, compared with all households,1996 and 2001
1996 65-69 70-74 75-79 80-84 85+ Total Allh'holds
2001 65-69 70-74 75-79 80-84 85+ Total Allh'holds
0,0
20,0
40,0
60,0
80,0
100,0%
Flush or chemical toilet 45,1 48,8 43,7 50,2 45,9 46,3 50,5 51,9 48,5 52,3 46,2 47,9 50,0 53,8Pit latrine 36,7 34,9 38,6 34,4 37,5 36,5 32,4 31,3 34,0 32,2 36,3 36,4 33,2 28,5
Bucket toilet 3,7 3,8 4,2 4,0 4,3 3,9 4,7 3,1 2,8 2,8 3,1 3,2 3,0 4,1None 14,5 12,4 13,5 11,4 12,3 13,3 12,4 13,7 14,8 12,6 14,5 12,5 13,8 13,6
Source: Census 1996 and 2001
These findings are similar to the ones for infants, children, youth and mature adults. Between 1996and 2001, an increasing proportion of the elderly had access to electricity for lighting, a slightlyincreased proportion had access to piped water, while the proportion with access to hygienic toiletfacilities remained similar over time.
It is largely African people in all age groups, particularly those in the less industrialised provinces,who were less likely to have access to these types of infrastructure, even though there were someimprovements between 1996 and 2001.

Description of the elderly (65+) Census 2001
Statistics South Africa 177
The elderly in collective living quarters
Table 6.3: Distribution of the elderly by age and type of living quarters
Collective living quarters
Housingunit
Residentialhotel
Otherresidence
Homefor theelderly
Workers’hostel Institution Homeless Total
Age N N N N N N N N65 183 813 559 212 628 1 163 1 433 40 187 848
66 152 631 470 182 682 896 1 281 40 156 181
67 147 012 455 148 785 697 1 397 29 150 523
68 146 073 440 146 808 707 1 436 49 149 658
69 140 233 429 154 848 663 1 354 35 143 716
70 128 029 391 130 943 636 1 472 53 131 653
71 165 892 430 202 1 118 750 1 650 45 170 087
72 121 485 370 134 1 127 418 1 597 41 125 172
73 106 270 357 125 1 174 350 1 583 42 109 902
74 91 100 285 98 1 205 297 1 622 48 94 655
75 87 243 258 89 1 297 307 1 701 27 90 923
76 81 630 272 87 1 378 249 1 768 48 85 431
77 70 080 208 74 1 362 261 1 718 38 73 741
78 54 577 190 76 1 252 221 1 775 59 58 150
79 55 423 194 69 1 364 218 1 964 59 59 292
80 60 926 210 80 1 399 210 2 175 49 65 049
81 68 186 227 77 1 297 257 2 199 42 72 284
82 44 278 123 45 1 125 156 1 940 48 47 714
83 56 591 137 60 1 016 164 2 110 45 60 123
84 22 412 76 41 863 79 2 266 37 25 775
85 + 139 287 473 195 4 233 473 12 427 244 157 333
Total 2 123 172 6 555 2 424 25 906 9 168 46 868 1 118 2 215 211
The vast majority of the elderly, 2,1 million of the approximately 2,2 million elderly(95,8%) were accommodated in households living in housing units.
Of the approximately 92 000 remaining elderly counted:• 47 000 were in institutions;• 26 000 were in homes for the elderly;• 9 000 were in workers’ hostels;• 7 000 were in residential hotels;• 2 000 were in other types of residences; and• there were 1 000 homeless, without shelter.
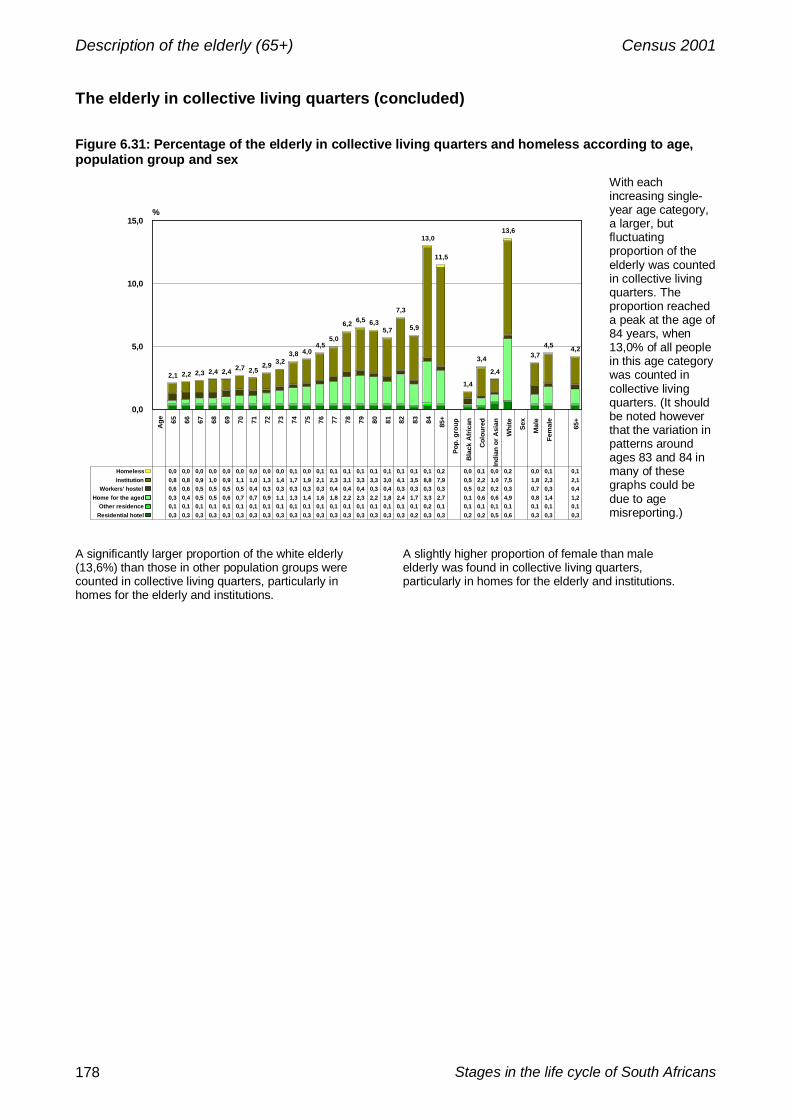
Description of the elderly (65+) Census 2001
Stages in the life cycle of South Africans178
The elderly in collective living quarters (concluded)
Figure 6.31: Percentage of the elderly in collective living quarters and homeless according to age,population group and sex
2,1 2,2 2,3 2,4 2,4 2,7 2,52,9 3,2
4,0
1,4
2,4
3,73,84,5
5,0
6,2 6,5 6,35,7
7,3
5,9
13,0
11,5
3,4
13,6
4,5 4,2
Age 65 66 67 68 69 70 71 72 73 74 75 76 77 78 79 80 81 82 83 84 85+
Pop.
gro
up
Bla
ck A
fric
an
Col
oure
d
Indi
an o
r Asi
an
Whi
te
Sex
Mal
e
Fem
ale
65+
0,0
5,0
10,0
15,0%
Residential hotel 0,3 0,3 0,3 0,3 0,3 0,3 0,3 0,3 0,3 0,3 0,3 0,3 0,3 0,3 0,3 0,3 0,3 0,3 0,2 0,3 0,3 0,2 0,2 0,5 0,6 0,3 0,3 0,3Other residence 0,1 0,1 0,1 0,1 0,1 0,1 0,1 0,1 0,1 0,1 0,1 0,1 0,1 0,1 0,1 0,1 0,1 0,1 0,1 0,2 0,1 0,1 0,1 0,1 0,1 0,1 0,1 0,1
Home for the aged 0,3 0,4 0,5 0,5 0,6 0,7 0,7 0,9 1,1 1,3 1,4 1,6 1,8 2,2 2,3 2,2 1,8 2,4 1,7 3,3 2,7 0,1 0,6 0,6 4,9 0,8 1,4 1,2Workers' hostel 0,6 0,6 0,5 0,5 0,5 0,5 0,4 0,3 0,3 0,3 0,3 0,3 0,4 0,4 0,4 0,3 0,4 0,3 0,3 0,3 0,3 0,5 0,2 0,2 0,3 0,7 0,3 0,4
Institution 0,8 0,8 0,9 1,0 0,9 1,1 1,0 1,3 1,4 1,7 1,9 2,1 2,3 3,1 3,3 3,3 3,0 4,1 3,5 8,8 7,9 0,5 2,2 1,0 7,5 1,8 2,3 2,1Homeless 0,0 0,0 0,0 0,0 0,0 0,0 0,0 0,0 0,0 0,1 0,0 0,1 0,1 0,1 0,1 0,1 0,1 0,1 0,1 0,1 0,2 0,0 0,1 0,0 0,2 0,0 0,1 0,1
With eachincreasing single-year age category,a larger, butfluctuatingproportion of theelderly was countedin collective livingquarters. Theproportion reacheda peak at the age of84 years, when13,0% of all peoplein this age categorywas counted incollective livingquarters. (It shouldbe noted howeverthat the variation inpatterns aroundages 83 and 84 inmany of thesegraphs could bedue to agemisreporting.)
A significantly larger proportion of the white elderly(13,6%) than those in other population groups werecounted in collective living quarters, particularly inhomes for the elderly and institutions.
A slightly higher proportion of female than maleelderly was found in collective living quarters,particularly in homes for the elderly and institutions.

Description of the elderly (65+) Census 2001
Statistics South Africa 179
The elderly in institutions
Table 6.4: Number of elderly in institutions by age and type of institution
AgeTouristhotel
Medicalfacility
Homefor
disabled
Hostelnot for
workersConvent,
etc.
Defenceforce
barracks
Prison/policecells
Refugeecamp/
communityshelter Total
65 237 782 152 95 50 8 83 26 1 433
66 177 700 157 83 46 8 88 22 1 281
67 168 706 184 130 54 6 121 28 1 397
68 168 775 208 116 51 10 92 16 1 436
69 128 787 170 109 58 10 75 17 1 354
70 161 839 178 115 60 9 83 27 1 472
71 145 983 219 124 64 10 85 20 1 650
72 161 929 229 138 39 8 62 31 1 597
73 140 950 238 140 42 12 46 15 1 583
74 122 964 205 200 47 10 52 22 1 622
75 128 1 023 251 160 41 10 70 18 1 701
76 129 1 081 246 172 49 14 57 20 1 768
77 115 1 027 268 177 49 16 44 22 1 718
78 122 1 091 260 177 40 14 52 19 1 775
79 115 1 217 283 216 38 16 62 17 1 964
80 135 1 339 303 224 49 25 67 33 2 175
81 147 1 384 307 227 34 14 53 33 2 199
82 109 1 224 275 205 39 14 52 22 1 940
83 102 1 355 291 221 42 17 53 29 2 110
84 178 1 150 256 197 36 366 49 34 2 266
85 + 653 8 139 1 594 1 171 229 107 292 242 12 427
Total 3 540 28 445 6 274 4 397 1 157 704 1 638 713 46 868
Table 6.4 shows that a total of approximately 47 000 elderly people were counted ininstitutions (as a sub-category of collective living quarters) at the time of Census 2001. Ofthese:
• 28 000 (60,7%) were in a medical facility such as a hospital;• 6 000 (13,4%) were in homes for the disabled;• 4 000 (9,4%) were in hostels not for workers;• 4 000 (7,6%) were in tourist hotels and related tourist accommodation;• 2 000 (3,5%) were in prisons or police cells;• 1 000 (2,5%) were in initiation schools, religious retreats, convents and
monasteries;• 700 (1,5%) were in defence force barracks or other military accommodation; and• 700 (1,5%) were in community or church halls, refugee camps and shelters for
the homeless.

Description of the elderly (65+) Census 2001
Stages in the life cycle of South Africans180
The elderly in institutions (concluded)
Figure 6.32: Percentage of the elderly in healthcare institutions according to age, population groupand sex
43,349,0
42,142,8
44,339,638,8
37,032,832,532,331,4
27,726,726,425,325,7
22,524,2
22,119,1
28,1
56,851,0
57,757,0
55,760,461,2
63,067,167,567,868,5
72,373,273,474,874,4
77,475,8
78,081,0
71,8
6566676869707172737475767778798081828384
85+
Total
0,020,040,060,080,0100,0
% males
0,0 20,0 40,0 60,0 80,0 100,0
% females
65 66 67 68 69 70 71 72 73 74 75 76 77 78 79 80 81 82 83 84 85+ TotalBlack African M 19,7 21,0 18,1 17,9 16,8 14,4 15,5 11,4 10,1 9,4 9,7 9,7 6,7 6,3 5,4 6,1 5,6 4,3 5,2 2,9 2,1 7,6
Coloured M 6,9 6,7 5,8 5,9 7,6 4,9 6,0 5,6 5,1 4,6 4,7 3,7 3,1 2,6 2,1 2,0 2,1 2,1 1,8 1,0 1,3 3,1Indian or Asian M 1,2 1,0 0,8 0,0 0,6 1,0 0,5 0,5 0,8 0,3 0,6 0,4 0,3 0,4 0,0 0,2 0,2 0,0 0,2 0,3 0,1 0,3
White M 15,5 20,3 17,4 19,0 19,3 19,3 16,8 19,5 16,8 18,2 17,3 17,6 17,6 17,4 18,9 17,0 17,8 16,1 17,0 17,9 15,6 17,1Black African F 22,5 19,0 17,3 17,0 15,9 17,8 16,2 12,9 11,2 11,2 10,1 8,3 9,0 5,6 5,1 6,9 8,5 7,4 8,6 4,2 4,1 8,9
Coloured F 8,2 8,0 7,9 7,7 6,2 6,9 7,2 9,0 8,5 6,8 5,7 8,2 6,0 6,1 4,9 5,2 4,7 4,2 3,4 3,6 3,4 5,4Indian or Asian F 0,8 0,9 1,1 0,9 0,8 0,8 0,6 0,9 0,9 0,4 0,4 0,7 0,3 0,0 0,2 0,3 0,4 0,4 0,4 0,0 0,1 0,4
White F 25,3 23,1 31,4 31,4 32,8 34,9 37,2 40,2 46,5 49,1 51,6 51,3 57,0 61,5 63,2 62,4 60,8 65,4 63,4 70,2 73,4 57,1
Among the elderly, within each single-year increase in age an increasingly largerproportion of those who were counted in hospitals, frail care centres or other health-carefacilities were females. For example:
• At age 65 years, 43,3% of all those counted in such facilities were males and56,8% were females.
• At the age of 85 years or more, however only 19,1% were males, while 81,0%were females.
If the pattern shown in this graph is compared to the overall distribution of males andfemales within each single-year age category, as shown in Figure 6.2, we can see clearlythat in the older age categories the proportions of women counted in a health-careinstitution are greater than their proportions overall. It is possible that elderly women aremore likely to seek health care for problems than elderly men in South Africa.
This graph also shows that, with each single-year increase in age, increasing proportionsof people in hospital were white females. For example, at age 65 years, 25,3% of allthose in hospital were white females, increasing to 73,4% of those aged 85 or more. Thisprobably reflects the fact that the white frail elderly are more likely to be in frail carecenters, whilst the frail elderly of other population groups are more likely to be cared for intheir own homes.

Census 2001
Statistics South Africa 181
Chapter 7: Conclusion
The findings of Census 2001 regarding the life stages of South Africans have certain implicationsfor planning, policy formulation and its implementation. Some of these implications are outlinedbelow.
The demographic picture of the country: There is clear evidence that the demographic picture ischanging in South Africa. Decision-makers need to understand the requirements of a growingrelatively young African, coloured and Indian/Asian population, in relation to the needs of theshrinking, aging white population.
Care of infants and children: Information is required so that ongoing and increasing attention canbe given to the ways in which infants and children are cared for in different communities. Theenvironment in an extended family is very different from the environment in a nuclear family.Moreover, opportunities for intellectual and emotional development can more easily be created inthe absence of poverty and hunger, and in the presence of adequate shelter, clean water and safesanitation.
Access to infant and childcare facilities for working mothers, and support of caregivers in extendedfamily structures in the more rural provinces through outreach programmes could also assist inempowering infants through their early development. Providing infants with access to nurseryschools, and other early learning environments and facilities may also be important in exposingthem to new stimulating experiences. The pattern of access to preschool educational facilities canbe found in this report.
The school environment: Emphasis needs to be placed on school attendance, and improving thequality of formal education. Getting children into schools is an important first step, which hasalready been taken. Creating a learning environment within schools becomes the next imperative,which is being tackled. Improving teaching methods and teaching skills, and facilitating interactionsbetween the school and the home, should all contribute to the empowerment of children in thecountry. This report indicates the rate at which children move through schools.
The language in which children are taught needs to be understood in relation to the language orlanguages they speak in the home. Change from one language to another as the medium ofinstruction of children may make learning more difficult for children who do not speak or are lessfamiliar with the language in which they are being taught. This report does not investigate languageof instruction, but there does report on patterns of languages spoken at home.
Internal migration patterns: Understanding the internal migration patterns in the country at thevarious life stages is important for service delivery. There is a tendency for young adults to migrateinto the more industrialised provinces from the more rural ones, leaving their infants, and to alesser extent their children, with the extended family for care and education. Future planning willneed to take information on these migration patterns into account. The priorities set by the planningprocess may be dissimilar in different areas of the country.
Family relations: Findings about family relations, and how these patterns change over time maybe important information to use in planning. The conventional idea that two parents and theirchildren live together as a household in a nuclear family does not apply in South Africa. Evenwhere both parents are alive, infants and children do not necessarily live in the same household asboth parents. The living arrangements of young adults are also reported on.

Conclusion Census 2001
Stages in the life cycle of South Africans182
Labour market status: This report contains information on the work situation of people at allstages of the life cycle, including children from the age of ten, and people above working age.Labour market patterns varied not only by age, but also by sex and population group.Unemployment is partly, but not entirely, a problem of youth. It is also linked with lack of access toappropriate education and training.
Employment by industry: There were clear differences by age, sex, population group andprovince of residence in the industries in which people worked. This type of information could beused for provincial planning.
Employment by occupation: The findings clearly indicate that higher-level qualifications arebecoming increasingly important for the workforce. The occupational structure by age, sex,population group and province is clearly spelt out in this report.
Housing requirements: The findings related to dwellings that people occupy during differentstages of the life cycle, coupled with the findings related to inter-provincial migration, giveinformation that could affect housing plans.
The household head: The situation of the household head in both smaller and larger householdsis outlined in this report and could be used for planning. People identified as household heads,particularly women, may require special attention in terms of receiving training, participating inextended public works programmes and in employment creation schemes.
The situation in collective living quarters: In this report, the circumstances of people of all agesliving in collective living quarters, including institutions, have been discussed. A betterunderstanding of the age distribution of the prison and hospital population, for example, couldinform decision-making in these areas.
The disabled: The findings indicate that disability is partly related to people’s life circumstancesand living conditions. This means that the pattern of an increasing rate of disability at an earlierage, as found among the less advantaged elderly, could be prevented.