report documentation page form approved · bodie hills area take two forms, either as discrete...
TRANSCRIPT

The public reporting burden for this collection of information is estimated to average 1 hour per response, including the time for reviewing instructions,
searching existing data sources, gathering and maintaining the data needed, and completing and reviewing the collection of information. Send comments
regarding this burden estimate or any other aspect of this collection of information, including suggesstions for reducing this burden, to Washington
Headquarters Services, Directorate for Information Operations and Reports, 1215 Jefferson Davis Highway, Suite 1204, Arlington VA, 22202-4302.
Respondents should be aware that notwithstanding any other provision of law, no person shall be subject to any oenalty for failing to comply with a collection of
information if it does not display a currently valid OMB control number.
PLEASE DO NOT RETURN YOUR FORM TO THE ABOVE ADDRESS.
a. REPORT
Advanced signal processing analysis of laser-induced breakdown
spectroscopy data for the discrimination of obsidian sources
14. ABSTRACT
16. SECURITY CLASSIFICATION OF:
Obsidian is a natural glass of volcanic origin and a primary resource used by indigenous peoples across
North America for making tools. Geochemical studies of obsidian enhance understanding of artifact
production and procurement and remain a priority activity within the archaeological community. Laser-induced
breakdown spectroscopy (LIBS) is an analytical technique being examined as a means for identifying obsidian
from different sources on the basis of its ‘geochemical fingerprint’. This study tested
1. REPORT DATE (DD-MM-YYYY)
4. TITLE AND SUBTITLE
13. SUPPLEMENTARY NOTES
The views, opinions and/or findings contained in this report are those of the author(s) and should not contrued as an official Department
of the Army position, policy or decision, unless so designated by other documentation.
12. DISTRIBUTION AVAILIBILITY STATEMENT
Approved for public release; distribution is unlimited.
UU
9. SPONSORING/MONITORING AGENCY NAME(S) AND
ADDRESS(ES)
6. AUTHORS
7. PERFORMING ORGANIZATION NAMES AND ADDRESSES
U.S. Army Research Office
P.O. Box 12211
Research Triangle Park, NC 27709-2211
15. SUBJECT TERMS
laser-induced breakdown spectroscopy, LIBS, obsidian, PLSDA
Jeremiah J. Remus, Russell S. Harmon, Richard R. Hark, Gregory
Haverstock, Dirk Baron, Ian K. Potter, Samantha K. Bristol, Lucille J.
East
Juniata College
Juniata College
1700 Moore Street
Huntingdon, PA 16652 -6124
REPORT DOCUMENTATION PAGE
b. ABSTRACT
UU
c. THIS PAGE
UU
2. REPORT TYPE
New Reprint
17. LIMITATION OF
ABSTRACT
UU
15. NUMBER
OF PAGES
5d. PROJECT NUMBER
5e. TASK NUMBER
5f. WORK UNIT NUMBER
5c. PROGRAM ELEMENT NUMBER
5b. GRANT NUMBER
5a. CONTRACT NUMBER
W911NF-11-1-0430
611102
Form Approved OMB NO. 0704-0188
60674-EV.2
11. SPONSOR/MONITOR'S REPORT
NUMBER(S)
10. SPONSOR/MONITOR'S ACRONYM(S)
ARO
8. PERFORMING ORGANIZATION REPORT
NUMBER
19a. NAME OF RESPONSIBLE PERSON
19b. TELEPHONE NUMBER
Tom Fisher
814-641-3563
3. DATES COVERED (From - To)
Standard Form 298 (Rev 8/98)
Prescribed by ANSI Std. Z39.18
-

Advanced signal processing analysis of laser-induced breakdown spectroscopy data for the discrimination of
obsidian sources
Report Title
ABSTRACT
Obsidian is a natural glass of volcanic origin and a primary resource used by indigenous peoples across
North America for making tools. Geochemical studies of obsidian enhance understanding of artifact
production and procurement and remain a priority activity within the archaeological community. Laser-induced
breakdown spectroscopy (LIBS) is an analytical technique being examined as a means for identifying obsidian from
different sources on the basis of its ‘geochemical fingerprint’. This study tested
whether two major California obsidian centers could be distinguished from other obsidian localities
and the extent to which subsources could be recognized within each of these centers. LIBS data sets
were collected in two different spectral bands using a Nd:YAG 1064 nm laser operated at approx. 23 mJ, a
Czerny–Turner spectrograph with 0.2–0.3 nm spectral resolution and a high performance imaging charge couple
device (ICCD) detector. Classification of the samples was performed using partial least-squares discriminant analysis
(PLSDA), a common chemometric technique for performing statistical regression on high-dimensional data.
Discrimination of samples from the Coso Volcanic Field, Bodie Hills, and other major obsidian areas in north-central
California was possible with an accuracy of greater than 90% using either spectral band.

REPORT DOCUMENTATION PAGE (SF298)
(Continuation Sheet)
Continuation for Block 13
ARO Report Number
Advanced signal processing analysis of laser-ind
Block 13: Supplementary Note
© 2012 . Published in Applied Optics, Vol. Ed. 0 51, (7) (2012), (, (7). DoD Components reserve a royalty-free, nonexclusive
and irrevocable right to reproduce, publish, or otherwise use the work for Federal purposes, and to authroize others to do so
(DODGARS §32.36). The views, opinions and/or findings contained in this report are those of the author(s) and should not be
construed as an official Department of the Army position, policy or decision, unless so designated by other documentation.
Approved for public release; distribution is unlimited.
...
60674.2-EV

Advanced signal processing analysis of laser-inducedbreakdown spectroscopy data for the discrimination
of obsidian sources
Jeremiah J. Remus,1 Russell S. Harmon,2 Richard R. Hark,3,* Gregory Haverstock,4
Dirk Baron,5 Ian K. Potter,3 Samantha K. Bristol,3,6 and Lucille J. East7
1Department of Electrical and Computer Engineering, Clarkson University, Potsdam, New York 31699 USA2Department of Marine, Earth & Atmospheric Sciences, North Carolina State University, Raleigh, North Carolina 27607 USA
3Department of Chemistry, Juniata College, Huntingdon, Pennsylvania 16652 USA4Bureau of Land Management, Bishop Field Office, Bishop, California 93514 USA
5Department of Geology, California State University, Bakersfield, California 93311 USA6Currently at the Department of Geological and Atmospheric Sciences, Iowa State University, Ames, Iowa 50011 USA
7Applied Spectra, Inc., 46661 Fremont Boulevard, Fremont California 94538 USA
*Corresponding author: [email protected]
Received 17 October 2011; accepted 9 December 2011;posted 10 January 2012 (Doc. ID 156647); published 9 February 2012
Obsidian is a natural glass of volcanic origin and a primary resource used by indigenous peoples acrossNorth America for making tools. Geochemical studies of obsidian enhance understanding of artifactproduction and procurement and remain a priority activity within the archaeological community. Laser-induced breakdown spectroscopy (LIBS) is an analytical technique being examined as a means for iden-tifying obsidian from different sources on the basis of its ‘geochemical fingerprint’. This study testedwhether two major California obsidian centers could be distinguished from other obsidian localitiesand the extent to which subsources could be recognized within each of these centers. LIBS data setswere collected in two different spectral bands (350� 130 nm and 690� 115 nm) using a Nd:YAG1064 nm laser operated at ∼23 mJ, a Czerny–Turner spectrograph with 0.2–0.3 nm spectral resolutionand a high performance imaging charge couple device (ICCD) detector. Classification of the samples wasperformed using partial least-squares discriminant analysis (PLSDA), a common chemometric techniquefor performing statistical regression on high-dimensional data. Discrimination of samples from the CosoVolcanic Field, Bodie Hills, and other major obsidian areas in north-central California was possible withan accuracy of greater than 90% using either spectral band. © 2012 Optical Society of AmericaOCIS Codes: 140.3440, 300.6365.
1. Introduction
Obsidian is a natural glass of volcanic origin that hasbeenusedaprimary resource formaking stone tools inmany areas worldwide. Obsidian glass fractures con-choidally to produce sharp-edged tools and frequently
was traded over great distances acrossNorthAmericaby indigenous peoples. Obsidian sources tend to occurin relatively discrete locations that are geochemicallydistinct (e.g., see [1]), although geological erosion canproduce fluvial deposits in which obsidian is presentin clasts of sufficient size and quality to be worked fortools. Geochemical studies of obsidian can provide animportant means of understanding artifact produc-tion and procurement [1–8].
1559-128X/12/070B65-09$15.00/0© 2012 Optical Society of America
1 March 2012 / Vol. 51, No. 7 / APPLIED OPTICS B65

Obsidian sources are widespread across the south-western United States and many are present ineastern California and western Nevada [9–11]. De-termining the provenance of obsidian artifacts re-mains a priority activity within the archaeologicalcommunity. Variations in trace element compositionhave been used in this context as a basis for estab-lishing a chemical signature that can be utilized asa means to distinguish obsidian from differentsources [12,13], but the analytical techniques neededfor such analysis (XRD, INAA, & ICP-MS) are timeconsuming and require expensive laboratory instru-mentation. Laser-induced breakdown spectroscopy(LIBS) is a comparatively low-cost technique thatcan simultaneously detect major and trace elementsand has the potential to be used in the field for in situanalysis of artifacts in real time. This study exam-ined whether two major California obsidian centers,the Bodie Hills and Coso Volcanic Field (CVF), couldbe distinguished from other obsidian localities andthe extent to which subsources could be recognizedwithin each of these centers.
2. Obsidian in North-Central California
Obsidian is found extensively across north-centralCalifornia (Fig. 1). Ten obsidian localities have beenrecorded on the east side of the Sierra Nevada moun-tain range in Inyo and Mono Counties. Of these, wehave sampled Coso, Saline Valley, Mono-Inyo, andBodie Hills localities. Eight localities are located inthe Coast Ranges north of San Francisco in Marin,Sonoma, and Napa Counties. Of these, we haveanalyzed samples from the Annadel, Napa GlassMountain, and Franz Valley locations. Twenty-fourlocalities are known to the far north in Butte, Teha-ma, Plumas, Shasta, Lassen, Siskiyou, and ModocCounties. Of these, we have samples from five siteswithin the Medicine Lake Volcanic Center.
The Bodie Hills are located on the western marginof the Great Basin physiographic region approxi-mately 30 kilometers north of Mono Lake in MonoCounty, California. This area contains one of the
most archaeologically significant obsidian sourcesof California prehistory, with obsidian artifacts ofBodie Hills type identified in archaeological depositsthroughout Northern and Central California and asfar west as the Pacific coast [15,16]. In addition to itssubstantial areal distribution, the Bodie Hillsobsidian source has a well-documented period of uti-lization that began during terminal-Pleistocene/early-Holocene time and continued through the con-tact period [17].
The underlying geologic structure of the BodieHills is comprised of Tertiary volcanics intrudingonto a Paleozoic and Mesozoic basement. The extanttopography reflects a complex geologic landscapeshaped primarily by volcanism and episodic erosionduring the Oligocene, Miocene, and Pliocene epochs.Early Tertiary erosion resulted in significant uncon-formity between pre-Tertiary deposits and those thatfollowed, while the majority of formative events oc-curred during Pliocene time [18–20]. The abundanceof obsidian deposits in the Bodie Hills region wasnoted in a California State Mining and Mineral re-port as early as 1888 [21] and again by Meighan in1955 [22], although most of the contemporary atten-tion directed towards the area has focused on its eco-nomic geology. Natural obsidian occurrences in theBodie Hills area take two forms, either as discreteterrace outcrops eroding from step hillsides or asfluvially/alluvially deposited lag flows [17,23].
The Bodie Hills obsidian source was first describedgeochemically by Jack and Carmichael in 1969 [24]and archaeologically by Singer and Ericson in 1977[16]. Singer and Ericson identified the ‘minimal’ spa-tial extent of the geological obsidian deposit, notedthe variation in obsidian macroattributes, and pro-posed a utilization curve based on an obsidian hydra-tion analysis of what they described as the mainquarry area. That study identified the main sourceas containing eight square kilometers (1462 acres)of culturally modified material derived from threeprimary outcrops. Subsequent research by Halford[23] identified 11 additional primary outcrops intwo loci, termed Bodie Hills North and Bodie HillsWest, as well as a substantial cobble flow trailingfrom them. Field surveys during those studies iden-tified 2215 acres (8.96 km2) of previously unreportedobsidian deposit. In total, 3677 acres (14 km2) of fla-kestone-viable obsidian deposits from 14 primaryoutcrops have been identified within the Bodie Hills.
Singer andEricson [16] also proposed a bell-shapedutilization curve for the Bodie Hills quarry with a ze-nith occurring during the early- and late-Holocenetime (∼2500 YBP). Their hydration sample was se-lected entirely from within the main quarry area.In contrast to Singer and Ericson’s proposed normaldistribution use curve, obsidian hydration valuesfrom a random sample (n � 131) of archaeologicalspecimens selected from both the lag deposit and dis-crete outcrops produced a bimodal and negativelyskewed utilization curve with peaks in the early-and late-Holocene [23]. This bimodal utilization curve
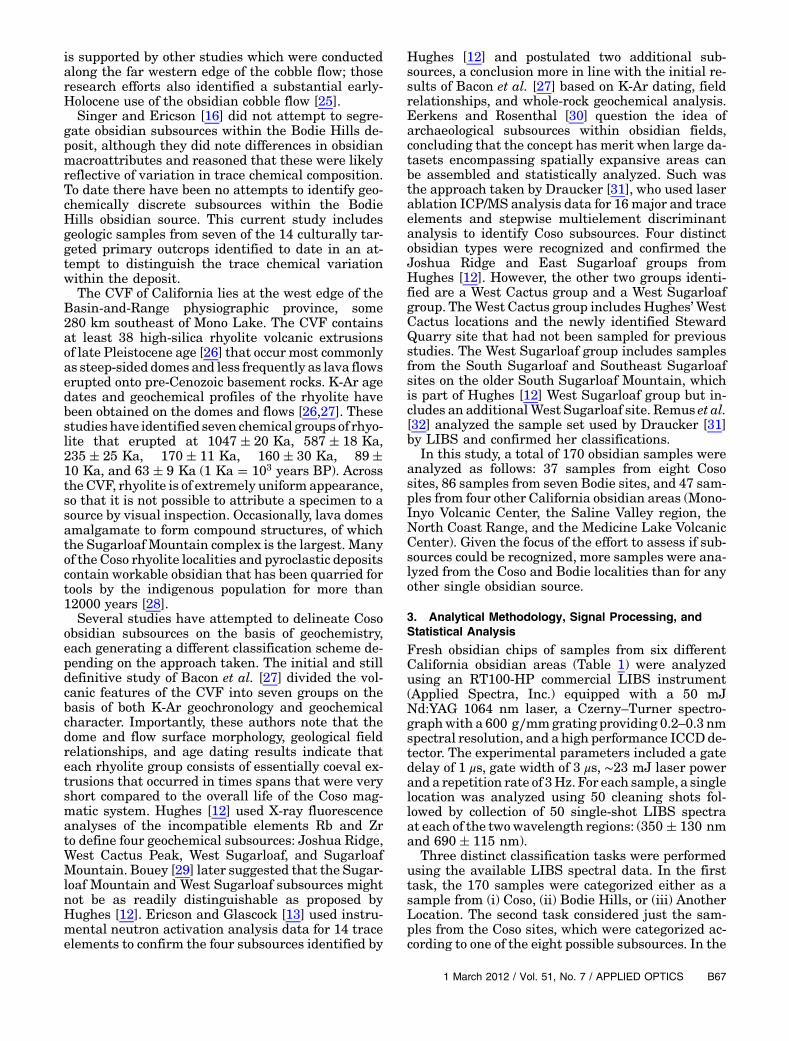
Fig. 1. The major obsidian fields of north-central California [14]sampled in this study.
B66 APPLIED OPTICS / Vol. 51, No. 7 / 1 March 2012
is supported by other studies which were conductedalong the far western edge of the cobble flow; thoseresearch efforts also identified a substantial early-Holocene use of the obsidian cobble flow [25].
Singer and Ericson [16] did not attempt to segre-gate obsidian subsources within the Bodie Hills de-posit, although they did note differences in obsidianmacroattributes and reasoned that these were likelyreflective of variation in trace chemical composition.To date there have been no attempts to identify geo-chemically discrete subsources within the BodieHills obsidian source. This current study includesgeologic samples from seven of the 14 culturally tar-geted primary outcrops identified to date in an at-tempt to distinguish the trace chemical variationwithin the deposit.
The CVF of California lies at the west edge of theBasin-and-Range physiographic province, some280 km southeast of Mono Lake. The CVF containsat least 38 high-silica rhyolite volcanic extrusionsof late Pleistocene age [26] that occur most commonlyas steep-sided domes and less frequently as lava flowserupted onto pre-Cenozoic basement rocks. K-Ar agedates and geochemical profiles of the rhyolite havebeen obtained on the domes and flows [26,27]. Thesestudies have identified seven chemical groups of rhyo-lite that erupted at 1047� 20 Ka, 587� 18 Ka,235� 25 Ka, 170� 11 Ka, 160� 30 Ka, 89�10 Ka, and 63� 9 Ka (1 Ka � 103 years BP). AcrosstheCVF, rhyolite is of extremely uniform appearance,so that it is not possible to attribute a specimen to asource by visual inspection. Occasionally, lava domesamalgamate to form compound structures, of whichthe Sugarloaf Mountain complex is the largest. Manyof the Coso rhyolite localities and pyroclastic depositscontain workable obsidian that has been quarried fortools by the indigenous population for more than12000 years [28].
Several studies have attempted to delineate Cosoobsidian subsources on the basis of geochemistry,each generating a different classification scheme de-pending on the approach taken. The initial and stilldefinitive study of Bacon et al. [27] divided the vol-canic features of the CVF into seven groups on thebasis of both K-Ar geochronology and geochemicalcharacter. Importantly, these authors note that thedome and flow surface morphology, geological fieldrelationships, and age dating results indicate thateach rhyolite group consists of essentially coeval ex-trusions that occurred in times spans that were veryshort compared to the overall life of the Coso mag-matic system. Hughes [12] used X-ray fluorescenceanalyses of the incompatible elements Rb and Zrto define four geochemical subsources: Joshua Ridge,West Cactus Peak, West Sugarloaf, and SugarloafMountain. Bouey [29] later suggested that the Sugar-loaf Mountain and West Sugarloaf subsources mightnot be as readily distinguishable as proposed byHughes [12]. Ericson and Glascock [13] used instru-mental neutron activation analysis data for 14 traceelements to confirm the four subsources identified by
Hughes [12] and postulated two additional sub-sources, a conclusion more in line with the initial re-sults of Bacon et al. [27] based on K-Ar dating, fieldrelationships, and whole-rock geochemical analysis.Eerkens and Rosenthal [30] question the idea ofarchaeological subsources within obsidian fields,concluding that the concept has merit when large da-tasets encompassing spatially expansive areas canbe assembled and statistically analyzed. Such wasthe approach taken by Draucker [31], who used laserablation ICP/MS analysis data for 16major and traceelements and stepwise multielement discriminantanalysis to identify Coso subsources. Four distinctobsidian types were recognized and confirmed theJoshua Ridge and East Sugarloaf groups fromHughes [12]. However, the other two groups identi-fied are a West Cactus group and a West Sugarloafgroup. TheWest Cactus group includes Hughes’WestCactus locations and the newly identified StewardQuarry site that had not been sampled for previousstudies. The West Sugarloaf group includes samplesfrom the South Sugarloaf and Southeast Sugarloafsites on the older South Sugarloaf Mountain, whichis part of Hughes [12] West Sugarloaf group but in-cludes an additionalWest Sugarloaf site. Remus et al.[32] analyzed the sample set used by Draucker [31]by LIBS and confirmed her classifications.
In this study, a total of 170 obsidian samples wereanalyzed as follows: 37 samples from eight Cososites, 86 samples from seven Bodie sites, and 47 sam-ples from four other California obsidian areas (Mono-Inyo Volcanic Center, the Saline Valley region, theNorth Coast Range, and the Medicine Lake VolcanicCenter). Given the focus of the effort to assess if sub-sources could be recognized, more samples were ana-lyzed from the Coso and Bodie localities than for anyother single obsidian source.
3. Analytical Methodology, Signal Processing, andStatistical Analysis
Fresh obsidian chips of samples from six differentCalifornia obsidian areas (Table 1) were analyzedusing an RT100-HP commercial LIBS instrument(Applied Spectra, Inc.) equipped with a 50 mJNd:YAG 1064 nm laser, a Czerny–Turner spectro-graphwith a 600 g∕mmgrating providing 0.2–0.3 nmspectral resolution, and a high performance ICCD de-tector. The experimental parameters included a gatedelay of 1 μs, gate width of 3 μs, ∼23 mJ laser powerand a repetition rate of 3Hz. For each sample, a singlelocation was analyzed using 50 cleaning shots fol-lowed by collection of 50 single-shot LIBS spectraat each of the twowavelength regions: (350� 130 nmand 690� 115 nm).
Three distinct classification tasks were performedusing the available LIBS spectral data. In the firsttask, the 170 samples were categorized either as asample from (i) Coso, (ii) Bodie Hills, or (iii) AnotherLocation. The second task considered just the sam-ples from the Coso sites, which were categorized ac-cording to one of the eight possible subsources. In the
1 March 2012 / Vol. 51, No. 7 / APPLIED OPTICS B67
third task, the Bodie Hills samples were assigned toone of seven collection locations.
Classification assignments were made with partialleast-squares discriminant analysis (PLSDA) thatused the SIMPLS solving method [33]. In the experi-ment design, a leave-one-sample-out (LOSO) para-digm was used to avoid testing on any shots fromsamples used to build the PLSDA models [34]. Ineach iteration, a PLSDA model is generated usingall shots from 169 of the 170 available samples andthen labels are estimated for the 50 shots from thesingle “hold out” test sample; this model-buildingand test process is repeated 170 times until eachsample serves as the test set. Two different represen-tations of the spectra were considered in the classi-fication experiments. In the first scenario, all of theclassification tasks were run using the raw, indivi-dual spectra (50 shots per sample). In the secondscenario, the 50 spectra from each sample were par-titioned into ten groups containing five spectra; thefive spectra in each partition were then averaged.Thus, the second scenario examined classificationperformance with each sample represented by 10averages rather than 50 individual spectra.
One of the primary questions of interest to thisstudy was whether there was any improvement inclassification accuracy when using both the 350-nm-centered and 690-nm-centered spectral bands.The results of the PLSDA classification task for theindividual and averaged spectra for each separatespectral band were compared to results generatedusing “stitched” spectra (a simple concatenation oftwo shots, one from each spectral band). This doubledthe length of the spectrum and provided twice asmanywavelengths for PLSDA to use as features. Thisapproach, using the stitched spectrum, is a feature-level fusion method, since the 350 nm- and 690 nm-centered data were fused at the input to the PLSDAmodel generating state. Alternatively, another ap-proach to fusion of the 350 nm and 690 nm datawas considered. The two data sets were processed se-parately and labels were estimated using PLSDAandthe LOSO experiment paradigm. The labels assignedto each shot from a sample were tallied like votes andthe proportion of votes gathered by the winning labelwas used as an indicator of confidence, e.g., if all shotsfrom a sample are labeled class A by PLSDA, thenthat sample is given the label A with a confidence
of 100%. The two data sets were fused by takingthe highest-confidence classification from the twodata sets (i.e. decision-level fusion) to produce esti-mates of the class label for each sample.
4. Results and Discussion
The idea being tested in this and other recent papers[32,35–38] is that of LIBS ‘geochemical fingerprint-ing’. The concept is that the full LIBS broadbandspectrum, or a sufficiently large portion thereof, con-tains sufficient compositional information to providea unique chemical description of any particular sam-ple. Thus, if advanced statistical signal processingand classification techniques are applied to a suffi-ciently robust spectral data set, it should be possibleto distinguish samples of the same kind originatingfrom one place from those originating in another. Thegeological basis for this hypothesis is that the Earthis composed of rocks of different composition and iscompositionally heterogeneous, both horizontallyand vertically, so that minerals and rocks originatingin the crust will directly inherit the chemical signa-ture of that crust. Similarly, bodies of water and hy-drothermal fluids will differ in composition from oneplace to another, so that minerals precipitated fromsolution at one place under a particular set of geo-chemical boundary conditions should be readily dis-tinguishable from those formed elsewhere on thebasis of their LIBS spectral signature. We demon-strated this concept for different kinds of mineralsin previous studies [32,34–37] and extended the ideato obsidian from the CVF [31]. Obsidian is a particu-larly challenging material for geochemical finger-printing because obsidian is a high-Si, rhyoliticglass that tends to have similar bulk compositionwherever it is found. It is only on the basis of traceelement compositions that obsidian of different pro-venance can be distinguished. Thus the problem ofdistinguishing obsidian sources and subsourcesshould be particularly challenging for LIBS, giventhat elemental detection limits for LIBS are gener-ally in the low parts per million range.
The results of the first classification task, which re-quired discriminating Coso versus Bodie Hills versusOther, are shown in Fig. 2. In each subplot, the clas-sification results for the 350 nm and 690 nm data setsare compared as a function of the number of compo-nents used in the partial least-squares decomposition
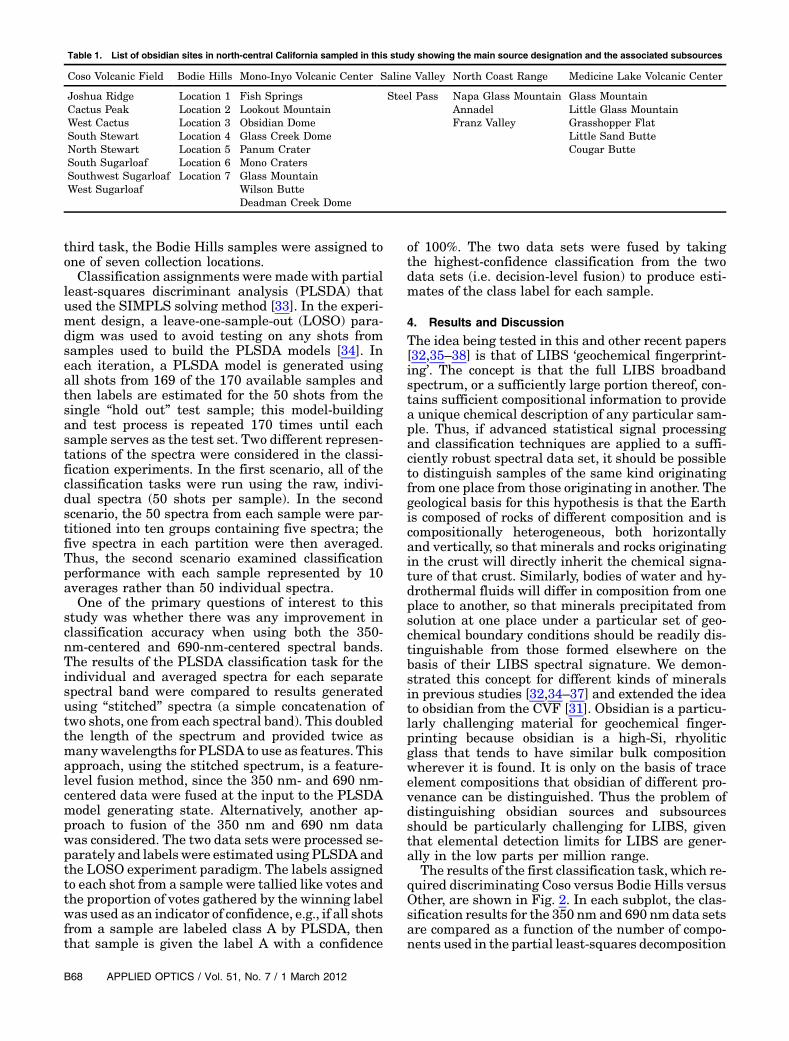
Table 1. List of obsidian sites in north-central California sampled in this study showing the main source designation and the associated subsources
Coso Volcanic Field Bodie Hills Mono-Inyo Volcanic Center Saline Valley North Coast Range Medicine Lake Volcanic Center
Joshua Ridge Location 1 Fish Springs Steel Pass Napa Glass Mountain Glass MountainCactus Peak Location 2 Lookout Mountain Annadel Little Glass MountainWest Cactus Location 3 Obsidian Dome Franz Valley Grasshopper FlatSouth Stewart Location 4 Glass Creek Dome Little Sand ButteNorth Stewart Location 5 Panum Crater Cougar ButteSouth Sugarloaf Location 6 Mono CratersSouthwest Sugarloaf Location 7 Glass MountainWest Sugarloaf Wilson Butte
Deadman Creek Dome
B68 APPLIED OPTICS / Vol. 51, No. 7 / 1 March 2012

(ranging from 5 to 35). Results are shown for PLSDAruns on both the raw, individual spectra (left) and thesets of averaged spectra (right). Classification perfor-mance plateaus near 90% correct, which is well abovechance-level performance for this classification task.For larger numbers of PLSDA components (i.e. great-er than 20), there appears to be little difference be-tween the 350 nm and 690 nm data sets, withslightly higher classification scores (approximately1%) using the averaged spectra.
In Fig. 3, the results from Fig. 2 are reproduced infour separate subplots with the results for thestitched spectra overlaid for comparison. The toprow of subplots shows results using the individualspectra whereas results in the bottom row of subplotsuse the averaged spectra. Results are again shown asthe number of PLSDA components is varied from 5 to35. For this classification task, the stitched spectrafail to provide a noticeable improvement over eitherof the separate spectral bandwidths.
Fig. 2. Comparison of PLSDA discrimination performance using individual single-shot LIBS spectra (left) versus 10-shot averages (right)for the three obsidian classes (Coso, Bodie Hills, and Other).
Fig. 3. Comparison of classification performance between Coso and Bodie Hills individual and averaged shots from each spectral band tothe corresponding “stitched” results in which the emission spectra 350� 130 nm and 690� 115 nm spectral windows are combined.
1 March 2012 / Vol. 51, No. 7 / APPLIED OPTICS B69
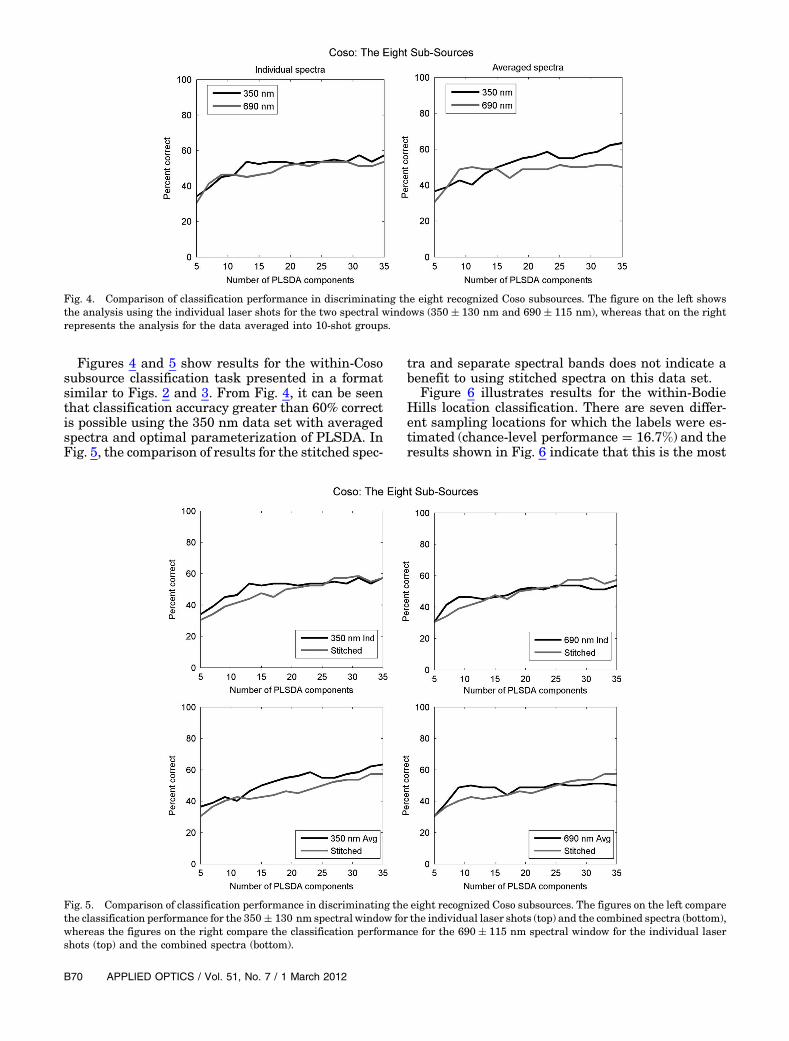
Figures 4 and 5 show results for the within-Cososubsource classification task presented in a formatsimilar to Figs. 2 and 3. From Fig. 4, it can be seenthat classification accuracy greater than 60% correctis possible using the 350 nm data set with averagedspectra and optimal parameterization of PLSDA. InFig. 5, the comparison of results for the stitched spec-
tra and separate spectral bands does not indicate abenefit to using stitched spectra on this data set.
Figure 6 illustrates results for the within-BodieHills location classification. There are seven differ-ent sampling locations for which the labels were es-timated (chance-level performance � 16.7%) and theresults shown in Fig. 6 indicate that this is the most
Fig. 4. Comparison of classification performance in discriminating the eight recognized Coso subsources. The figure on the left showsthe analysis using the individual laser shots for the two spectral windows (350� 130 nm and 690� 115 nm), whereas that on the rightrepresents the analysis for the data averaged into 10-shot groups.
Fig. 5. Comparison of classification performance in discriminating the eight recognized Coso subsources. The figures on the left comparethe classification performance for the 350� 130 nm spectral window for the individual laser shots (top) and the combined spectra (bottom),whereas the figures on the right compare the classification performance for the 690� 115 nm spectral window for the individual lasershots (top) and the combined spectra (bottom).
B70 APPLIED OPTICS / Vol. 51, No. 7 / 1 March 2012

difficult of the three classification tasks. The fourvariations of data processed using PLSDA suggesta peak performance level of approximately 30% cor-rect classification with no consistent improvementthrough the use of amalgamated spectra.
As an alternative to the combined spectra for fu-sion of the 350 nm and 690 nm data sets at thefeature-level, fusion at the decision level was also ex-plored. In the decision-level fusion, each of the twodata sets provides an estimate of the label for eachsample, with a confidence based on the proportionof spectra collected from that sample that were inagreement with the assigned label. The final classi-fication for the sample is based on the most confidentclassification from the 350 nm and 690 nm data sets.Table 2 shows the percent correct classification forthe separate data sets, the stitched spectra, as wellas decision-level fusion results, for the three classifi-cation tasks using both individual shots and aver-aged shots. For each of the experiments, thedecision-level fusion consistently provides a measur-able increase in classification performance over theseparate spectral bands and outperforms thestitched spectra in all but one experiment. Thus,there may be some benefit to providing additional in-formation in the form of LIBS measurements in mul-tiple spectral bands using decision-level fusion.
These results did not appear to be sensitive to thepresence of peaks associated with the major ele-ments in obsidian. The values for percent correctclassification in Table 2 changed by only�1% in most
cases (although a few of the results were significantlyworse) after removing seven wavelength ranges(248–255, 262–264, 285–290, 392–400, 404–405,585–592, and 764–772 nm) associated with promi-nent Na, Al, Si, and K lines.
5. Summary and Conclusion
In this study, the feasibility of using LIBS for discri-minating between obsidian samples from twosources in California, as well as discriminating be-tween locations within those sources, was examinedusing data sets collected in two different spectralbands (350� 130 nm and 690� 115 nm). Discrimi-nation between samples from the CVF, Bodie Hills,and other major obsidian areas in north-central Ca-lifornia was possible with a high degree of accuracy(greater than 90%) using data collected in eitherspectral band. However, the separation of samplesfrom the sublocalities within each source provedmuchmore challenging. In particular, the poor discri-mination between samples from Bodie Hills may in-dicate the labeled locations cannot be isolated basedon the chemical composition of the samples, suggest-ing that the obsidian material at Bodie Hills is de-rived from a single obsidian source.
A primary interest in this study was to determinewhether the classification performance would benefitfrom the inclusion of information from both thespectral bands centered at 350 nm and 690 nm,respectively, or if a single spectral band providedthe maximum achievable classification performance.
Fig. 6. Comparison of classification performance in discriminating the eight recognized Coso subsources. The figure on the left shows theanalysis using the individual laser shots for the two spectral windows (350� 130 nm and 690� 115 nm), whereas that on the right re-presents the analysis for the data averaged into 10-shot groups.
Table 2. Comparison of individual and averaged spectra results for each spectral band and decision-level fusion
350 nm 690 nm Stitched spectra Decision-level fusion
Individual spectra Coso versus Bodie Hills 88.8% 88.8% 90.6% 91.2%Coso subsource 90.6% 91.8% 90.6% 93.5%
Bodie Hills Subsource 53.7% 53.7% 52.4% 56.1%Averaged spectra Coso versus Bodie Hills 54.9% 51.2% 50.0% 58.5%
Coso subsource 27.8% 27.8% 36.1% 30.6%Bodie Hills Subsource 30.6% 30.6% 33.3% 36.1%
1 March 2012 / Vol. 51, No. 7 / APPLIED OPTICS B71

As part of the investigation, twomethods for fusion ofthe information from the two spectral bands wereconsidered: a feature-level fusion where spectra were‘stitched’ together to form an amalgamated spectrumand the PLSDA models were generated using the re-sulting composite spectra and a decision-level fusionapproach where the data from the two spectral bandswas processed separately with different PLSDAmod-els, labels for each sample were estimated, and a fi-nal label estimate was generated from the decisionsmade by the PLSDA models operating on the two se-parate data sets. The results presented in this studyindicate slightly higher performance from fusion ofthe two datasets, with decision-level fusion outper-forming feature-level fusion in most experiments.One reason why the feature-level fusion may nothave provided a greater level of benefit is that theorder for pairing spectra from the 350 nm and690 nm data sets is arbitrary. The 350-nm- and690-nm-centered spectra were not collected simulta-neously, but rather sequentially from separate fir-ings of the laser, thus corresponding to differentsets of plasma events. The feature-level fusion wouldbe able to take advantage of dependence betweenwavelengths in the 350-nm-centered and 690-nm-centered data; however, that is only expected in a sce-nario with simultaneous collection of the spectrasuch that they are observing the same plasma event,as in a multichannel, broadband LIBS analyticalapproach.
The authors wish to thank Applied Spectra, Inc.for technical support and the loan of instrumenta-tion, the II-VI Foundation (RRH) and ARO Grant60674-EV (IP) for financial support, and Peter Tor-rione and KennethMorton of New Folder Consulting,Durham, NC for chemometric software. Partial fi-nancial support for this research was provided byan ARL Fellow stipend to RSH.
References1. R. E. Hughes, “Archaeological significance of geochemical con-
trasts among southwesternNewMexico obsidians,” Texas J. ofSci. 40, 297–307 (1988).
2. R. E. Taylor, Advances in Obsidian Glass Studies: Archaeolo-gical and Geochemical Perspectives (Noyes, 1976).
3. G. Harbottle, “Chemical characterization in archaeology,” inContexts Prehistoric Exchange, J. E. Ericson and T. K. Earle,eds. (Academic, 1982), pp. 13–51.
4. M. S. Shackley, “Sources of archaeological obsidian in thesouthwest: an archaeological, petrological, and geochemicalstudy,” Amer. Antiquity 53, 752–772 (1988).
5. M. D. Glascock, G. E. Braswell, and R. H. Cobean, “A systema-tic approach to obsidian source characterization,” in Archae-ological Obsidian Studies: Methods and Theory, M. S.Shackley, ed., (Plenum, 1998), pp. 15–65.
6. R. E. Hughes, “Obsidian sourcing studies in the Great Basin:problems and prospects,” in Obsidian Studies in the GreatBasin (University of California Archaeological Research Facil-ity, 1984), 45, pp. 1–19.
7. T. G. Baugh and F. W. Nelson, Jr., “New Mexico obsidiansources and exchange on the Southern Plains,” J. FieldArchaeol. 14, 313–329 (1987).
8. R. E. Hughes and R. L. Smith, “Archaeology, geology, andgeochemistry in obsidian provenance studies,” in Effects ofScale on Archaeological and Geoscientific Perspectives, J. K.
Stein and A. R. Linse, eds. (Geol. Soc. Am. Special Paper283, 1993), pp. 79–91.
9. R. F. Heizer and A. E. Treganza, Mines and Quarries of theIndians of California (Ballena, 1972).
10. J. Ericson, T.Hagan, andC. Chesterman, “Prehistoric obsidiansources inCalifornia, II: Geological and geographic aspects,” inAdvances in Obsidian Glass Studies: Archaeological and Geo-chemical Perspectives (Noyes, 1976), pp. 218–239.
11. J. E. Ericson, Exchange and Production Systems inCalifornian Prehistory: the Results of Hydration Dating andChemical Characterization of Obsidian Sources, BritishArchaeol. Reports Int. Series, 110 , (Archaeopress, 1981).
12. R. E. Hughes, “The Coso Volcanic Field reexamined: implica-tions for obsidian sourcing and hydration dating research,”Geoarchaeology 3, 253–265 (1988).
13. J. E. Ericson andM. D. Glascock, “Subsource characterization:obsidian utilization of subsources of the Coso Volcanic Field,Coso Junction, California, USA,” Geoarchaeology 19, 779–805(2004).
14. Northwest Research Obsidian Studies Laboratory SourceCatalog: http://www.sourcecatalog.com/ca/s_ca.html.
15. J. S. Rosenthal, The prehistory of the Sonora region: Archae-ological and geoarchaeological investigations for the Stage I ofthe East Sonora Bypass Project, State Route 108, TuolumneCounty, California (Draft Report submitted to California De-partment of Transportation, District 10 (2006).
16. C. E. Singer and J. E. Erickson, “Quarry analysis at BodieHills, Mono County, California: A case study,” in ExchangeSystems in Pre-History, T. K. Earle and J. E. Erickson eds.(Academic, 1977), pp. 171–188.
17. F. K. Halford, “Archaeology and Environment on the DryLakes Plateau, Bodie Hills, California: Hunter-GathererCoping Strategies for Holocene Environmental Variability,”Unpublished Masters Thesis, Univ. Nevada, Reno (1998).
18. C. A. Nelson, C. A. Hall Jr., and W. G. Ernst, “Geologic historyof the White-Inyo Range,” in Natural History of the WhiteInyo-Range, Eastern California, C. A. Hall, Jr., ed. (Universityof California, 1991), pp. 42–74.
19. C. W. Chesterman, R. H. Chapman, and C. H. Gray, Jr.,“Geology and ore deposits of the Bodie mining district, MonoCounty, California, California Department of Conservation,”Division of Mines and Geology, Bulletin 206 (1986).
20. F. J. Kleinhampl, W. E. Davis, M. L. Silberman, C. W.Chesterman, R. H. Chapman, and C. H. Gray, “Aeromagneticand limited gravity studies and generalized geology of theBodie Hills region, Nevada and California,”U.S. Geologic Sur-vey Bulletin 1384, (1975).
21. “Annual report of the state mineralogist for the year ending1888,” 9th Annual Report of the StateMineralogist, CaliforniaState Mining Bureau (1899).
22. C. W. Meighan, “Notes on the Archaeology of Mono County,”Reports Univ. Calif. Archaeol. Survey 28, 6–28 (1955).
23. F. K. Halford, “The Coleville and Bodie Hills NRCS Soil Inven-tory, Walker and Bridgeport, California: A Reevaluation of theBodie Hills Obsidian Source and its Spatial and ChronologicalUse.” Report on file at the BLM Bishop Field Office (2008).
24. R. N. Jack and I. S. E. Carmichael, “The chemical fingerprint-ing of acid volcanic rocks,” California Division of Mines andGeology Special Report 100, 17–32 (1969).
25. F. K. Halford, “New evidence for acquisition and production ofBodie Hills obsidian,” Society for Calif. Archaeol. Newsletter35, 32–37 (2001).
26. W.A.Duffield,C.R.Bacon,andG.B.Dalrymple, “LateCenozoicvolcanism,geochronology,andstructureoftheCosoRange,InyoCounty, California,” J. Geophys. Res. 85, 2381–2404 (1980).
27. C. R. Bacon, R. Macdonald, R. L. Smith, and P. A. Baedecker,“Pleistocenehigh-silicarhyolitesof theCosovolcanic field, InyoCounty, California,” J. Geophys. Res. 86, 10223–10241 (1981).
28. R. M. Yohe, “The introduction of the bow and arrow and lithicresource use at Rose Spring (CA-INY-372),” J.California and Great Basin Anthropology 20, 26–52 (1998).
29. P. D. Bouey, “Recognizing the limits of archaeological applica-tions of nondestructive energy-dispersive x-ray fluorescenceanalysis of obsidians,” Material Res. Soc. Symp. Proc. 185,309–320 (1991).
B72 APPLIED OPTICS / Vol. 51, No. 7 / 1 March 2012

30. J. W. Eerkens and J. S. Rosenthal, “Are obsidian subsourcesmeaningful units of analysis?: temporal and spatial patterningof subsources in the Coso Volcanic Field, southeasternCalifornia,” J. Archaeol. Sci. 31, 21–29 (2004).
31. A. C. Draucker, “Geochemical characterization of obsidiansub-sources from the Coso Range, California using laser abla-tion inductively coupled plasma mass spectrometry as a toolfor archaeological investigations,” M. S. Thesis (CaliforniaState University Bakersfield, 2007).
32. J. J. Remus, J. L. Gottfried, R. S. Harmon, A. C. Draucker, D.Baron, and R. M. Yohe, “Archaeological applications of LIBS:An example from the Coso Volcanic Field, CA using advancedstatistical signal processing analysis,” Appl. Opt. 49, 120–131(2010).
33. S. de Jong, “SIMPLS: An alternative approach to partial leastsquares regression,” Chemometr. Intell. Lab. Sys. 18, 251–263(1993).
34. J. J. Remus and K. Dunsin, “Robust validation of pattern clas-sification methods for laser-induced breakdown spectroscopy,”Appl. Opt. (2012, in press).
35. R. S. Harmon, J. J. Remus, N. J. McMillan, C. McManus, L. M.Collins, J. L. Gottfried, F. C. DeLucia Jr., and A. W. Miziolek,“LIBS analysis of geomaterials: Geochemical fingerprintingfor the rapid analysis and discrimination of minerals,” Appl.Geochem. 24, 1125–1141 (2009).
36. J. L. Gottfried, R. S. Harmon, F. C. DeLucia Jr., and A. W.Miziolek, “Multivariate analysis of laser-induced breakdownspectroscopy chemical signatures for geomaterial classifica-tion,” Spectrochim. Acta B 64, 109–119 (2009).
37. D. C. Alvey, K. Morton, R. S. Harmon, J. L. Gottfried, J. J.Remus, L. M. Collins, and M A. Wise, “Laser-induced break-down spectroscopy-based geochemical fingerprinting for therapid analysis and discrimination of minerals: the exampleof garnet,” Appl. Opt. 49, C168–C180 (2010).
38. R. S. Harmon, K. M. Shughrue, J. J. Remus, M. A. Wise, L. J.East, and R. R. Hark, “Can the provenance of the conflictminerals columbite and tantalite be ascertained by laser-induced breakdown spectroscopy?,” Anal. Bioanal. Chem.400, 3377–3382 (2011).
1 March 2012 / Vol. 51, No. 7 / APPLIED OPTICS B73