report card 2016/17 - squarespacereport+card+2016-17.pdfubs we remain of the view that business has...
TRANSCRIPT

Founding Corporate Supporter & Lead Sponsor:
Sponsor:
Sponsor:
REPORT CARD 2016/17

2 FEA Report Card 2016/17
OUR VISIONThe Fair Education Alliance is working towards a world where our education system is fair – where children’s educational success is not limited by their socio-economic background. This is a world where disadvantage no longer determines literacy and numeracy rates at primary school, GCSE attainment at secondary school, the emotional wellbeing and resilience of young people, participation in further education or employment-based training and university graduation.
OUR MISSION To use our collective voice and influence to create change by helping a wide range of stakeholders to close the gap between the most disadvantaged children and their wealthier peers.
Acknowledgements:
Editor and FEA Director Lewis IwuProject coordinatorAlex TurnerResearch and data analysisJo Hutchinson and Natalie Perera, Education Policy InstituteReport Card Impact Goal Chairs Catherine Knowles, Claire Coutinho, Bea Stevenson, Emily Lau, Valentine Mulholland, Katy Neep and Andrew Berwick FEA Chair and Vice ChairSir Richard Lambert and Dame Julia Cleverdon
With thanks to:
Founding FEA Corporate Supporter UBS, and to Allen & Overy and KPMG for kindly sponsoring the work of the Fair Education Alliance
2 FEA Report Card 2016/17

FEA Report Card 2016/17 3
Contents
5 Foreword
7 How the report card was compiled
8 Executive Summary
11 Top five priorities for government11 School Funding11 Career11 Selection11 Measurement of Social and Emotional Competencies11 Early Years
12 Wider recommendations 12 Families 12 Teachers 13 Qualifications and Assessments 13 Relationships and Sex Education and PSHE 13 Universities
15 Impact Goal 1: Narrow the gap in literacy and numeracy at primary school
15 The gap15 The national picture16 The regional picture17 Alliance efforts to close the gap
18 Impact Goal 2: Narrow the gap in GCSE attainment at secondary school
18 The gap18 The national picture19 The regional picture19 Alliance efforts to close the gap
21 Impact Goal 3: Ensure young people develop key strengths, including character, wellbeing and mental health to support high aspirations
21 The gap21 The Headstart programme22 Current measurement of the gap22 The national picture23 Policy Developments24 Character25 Social and Emotional Skills25 Mental Health25 The Importance of a ‘Whole School Approach’26 Closing the gap
28 Impact Goal 4: Narrow the gap in the proportion of young people taking part in further education or apprenticeships after finishing their GCSEs
28 The gap28 The national picture30 The regional picture30 Alliance efforts to close the gap
32 Impact Goal 5: Narrow the gap in university graduation, including from the 25% most selective universities
32 The gap32 The national picture32 The regional picture32 Alliance efforts to close the gap
34 Conclusions
35 Appendix: Methodology35 The socio-economic gap35 The gap in months (Impact Goals 1 and 2)37 Impact Goal 337 Impact Goal 437 Impact Goal 5
38 Footnotes and References

4
Foreword
Much has changed in the political world since the publication of our last Report Card in April 2016. In the UK, the Brexit referendum brought down one Prime Minister, and the results of the early General Election badly damaged another. In the US, the election of President Trump seemed likely to change longstanding US relationships with the rest of
the world in the most profound ways.
There are many explanations for these remarkable developments. But one common theme seems to be that large numbers of voters on both sides of the Atlantic felt that they had missed out on the economic progress of recent decades, and had been left behind in a globalising world.
And this is relevant for the work of the Fair Education Alliance. We know that a good education is key to successful participation in a modern economy, and to leading a healthy and fulfilling life. We also know that the gap between the education outcomes and life chances of young people from low-income communities and those of their better-off peers remains damagingly wide here in the UK. Voting patterns both in the Referendum and the General Election showed that this is a country with clear divisions between those who had enjoyed a fulfilling education and those who had not.
So it’s not surprising that education played a prominent part in the Election campaigns. According to post-election polling, 750,000 people said that proposed real-terms cuts in school funding were the dominant explanation for voting in the way that they did. The fact is that although this Report Card shows some progress has been made over recent years in narrowing the gaps between children from high and low income communities, there is still a long way to go – and freezing school budgets at a time of rising inflation will make the journey all the more difficult.
The attainment gap in primary literacy and numeracy has narrowed significantly in the past half dozen years, and there has also been some progress in GCSE average grades and in work-based training. But children from low income families are still more than four times more likely than others to be permanently excluded from school, and the gap in university entry has actually widened a little for the first time since 2010. So the big picture is still very patchy.
Over the past year, our Alliance has worked hard to support the national effort in a number of different ways.
» We have brought together a broad coalition of organisations to develop policies designed to make a difference for the most disadvantaged.
» We have worked with leading organisations in the field of mental health, character and wellbeing to build a consensus on how best to measure these traits in young people.
» Our numeracy group published “Closing the attainment gap in maths” – a tool for schools that pulls together the best practice in early years and primary settings.
» The Alliance worked on a guide to contextualised data for university admissions. The idea was to dispel the myths surrounding this issue, and to spread the results through the FEA network.
» We helped to shape the national debate on the proposed introduction of grammar schools by presenting the evidence against the creation of more selective schools.
» Our working groups met on a monthly basis, bringing together a wide range of organisations to work on their particular challenges.
This report makes clear that there is much more to be done. As the UK seeks to reposition itself in the world, it becomes more obvious than ever that success will be determined by the ability of our young people to fulfil their potential irrespective of their parental background.
Sir Richard LambertChair of the Fair Education Alliance
FEA Report Card 2016/17 5
Statements from Supporters
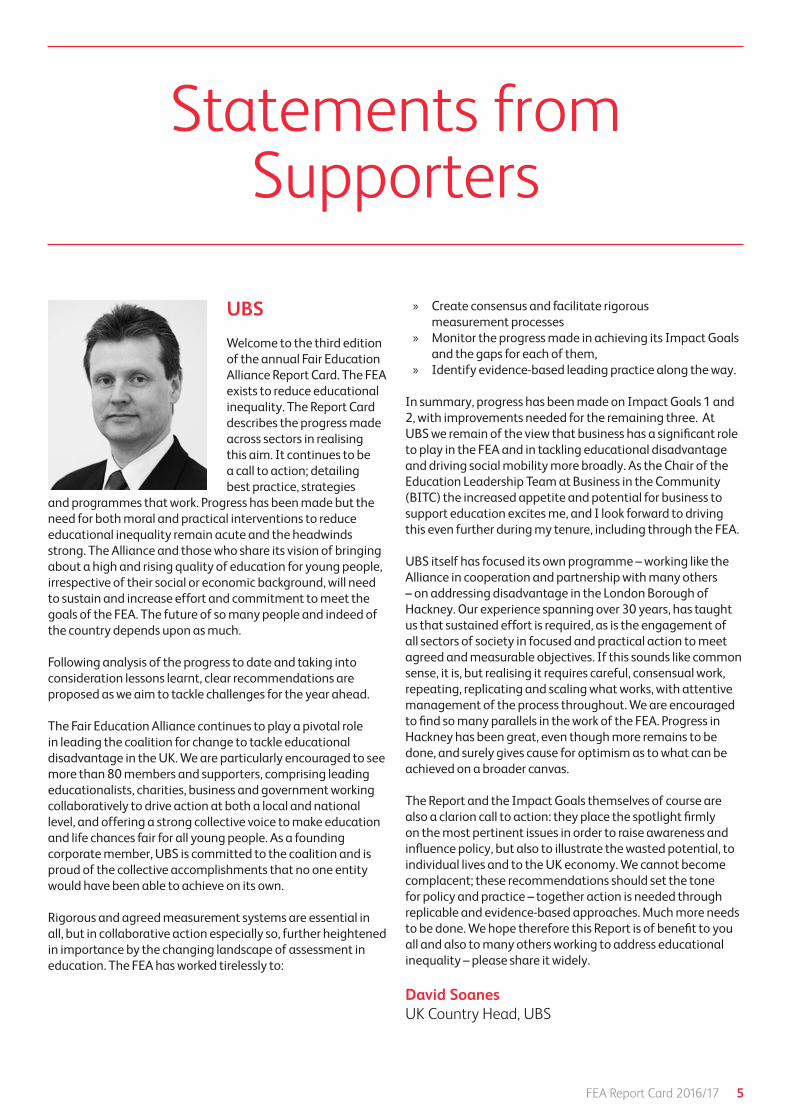
UBS
Welcome to the third edition of the annual Fair Education Alliance Report Card. The FEA exists to reduce educational inequality. The Report Card describes the progress made across sectors in realising this aim. It continues to be a call to action; detailing best practice, strategies
and programmes that work. Progress has been made but the need for both moral and practical interventions to reduce educational inequality remain acute and the headwinds strong. The Alliance and those who share its vision of bringing about a high and rising quality of education for young people, irrespective of their social or economic background, will need to sustain and increase effort and commitment to meet the goals of the FEA. The future of so many people and indeed of the country depends upon as much.
Following analysis of the progress to date and taking into consideration lessons learnt, clear recommendations are proposed as we aim to tackle challenges for the year ahead.
The Fair Education Alliance continues to play a pivotal role in leading the coalition for change to tackle educational disadvantage in the UK. We are particularly encouraged to see more than 80 members and supporters, comprising leading educationalists, charities, business and government working collaboratively to drive action at both a local and national level, and offering a strong collective voice to make education and life chances fair for all young people. As a founding corporate member, UBS is committed to the coalition and is proud of the collective accomplishments that no one entity would have been able to achieve on its own.
Rigorous and agreed measurement systems are essential in all, but in collaborative action especially so, further heightened in importance by the changing landscape of assessment in education. The FEA has worked tirelessly to:
» Create consensus and facilitate rigorous measurement processes
» Monitor the progress made in achieving its Impact Goals and the gaps for each of them,
» Identify evidence-based leading practice along the way.
In summary, progress has been made on Impact Goals 1 and 2, with improvements needed for the remaining three. At UBS we remain of the view that business has a significant role to play in the FEA and in tackling educational disadvantage and driving social mobility more broadly. As the Chair of the Education Leadership Team at Business in the Community (BITC) the increased appetite and potential for business to support education excites me, and I look forward to driving this even further during my tenure, including through the FEA.
UBS itself has focused its own programme – working like the Alliance in cooperation and partnership with many others – on addressing disadvantage in the London Borough of Hackney. Our experience spanning over 30 years, has taught us that sustained effort is required, as is the engagement of all sectors of society in focused and practical action to meet agreed and measurable objectives. If this sounds like common sense, it is, but realising it requires careful, consensual work, repeating, replicating and scaling what works, with attentive management of the process throughout. We are encouraged to find so many parallels in the work of the FEA. Progress in Hackney has been great, even though more remains to be done, and surely gives cause for optimism as to what can be achieved on a broader canvas.
The Report and the Impact Goals themselves of course are also a clarion call to action: they place the spotlight firmly on the most pertinent issues in order to raise awareness and influence policy, but also to illustrate the wasted potential, to individual lives and to the UK economy. We cannot become complacent; these recommendations should set the tone for policy and practice – together action is needed through replicable and evidence-based approaches. Much more needs to be done. We hope therefore this Report is of benefit to you all and also to many others working to address educational inequality – please share it widely.
David Soanes UK Country Head, UBS

6 FEA Report Card 2016/17
KPMG
For KPMG, taking action on educational inequality is not just a matter of fairness, but is critical for the strong foundations of a skilled and diverse future workforce. For the UK to be truly successful in the global market place, we all need to play our part in addressing the low levels
of productivity and chronic skills shortages we face. Simply put, we are failing to make the most of our people – and to compete on a global stage we need the talent in every part of our society to shine.
There are stark reminders of the challenges ahead. Recent OECD stats showed the UK’s literacy levels rank poorly compared to other developed countries, while the government’s Industrial Strategy highlighted the fact that 49% of adults have the numeracy levels of an 11 year old. This report card lays bare the extent of the problem across society, highlighting significant attainment gaps for the most disadvantaged students at Primary and Secondary school, as well as the gaps in crucial areas such as Further Education participation, Higher Education graduation and the development of character, emotional wellbeing and mental health in our young people.
However, we are seeing progress in some areas. Exemplary early years settings, schools and education charities are supporting children to thrive and give them the building blocks they need to succeed in life – there are numerous examples showcased in this report and across the FEA coalition. At KPMG we were delighted to publish an FEA report on numeracy ‘Closing the attainment gap in maths: a study of good practice in early years and primary settings’ in 2017. The report provided powerful case studies where whole school or setting approaches to maths had been effectively embedded, resulting in improved children’s outcomes that in many cases exceeded expectation.
But unfortunately these schools remain the exception rather than the rule. If the challenges underscored in this report are to be addressed, we need to ensure that education, government, business and the third sector work together. At KPMG we are committed to playing our part, whether by publishing reports and research to influence policy, convening business leaders around the key issues or running targeted volunteering programmes across the UK. We are proud for example to have led the development of the Vision for Literacy Business Pledge with the National Literacy Forum. As a co-founder and principal signatory we are delighted that in just the second year of the pledge over 50 companies have now publically committed to taking community, internal and collaborative action to tackle poor literacy in 2017 and beyond.
KPMG is proud to support the Fair Education Alliance coalition, as both corporate sponsor and co-chair of the working group for numeracy. Working together we can accelerate the rate of change, and pursue alongside our fellow Fair Education Alliance members the ambitious - but much needed - 2022 Impact Goals in this report card. The recommendations set out here need to be penetrated deep into schools and amplified to policymakers. There is much to do to ensure that everyone is granted the opportunity to reach their full potential, regardless of their socio-economic background.
Melanie RichardsVice Chair, KPMG in the UK
FEA Report Card 2016/17 7
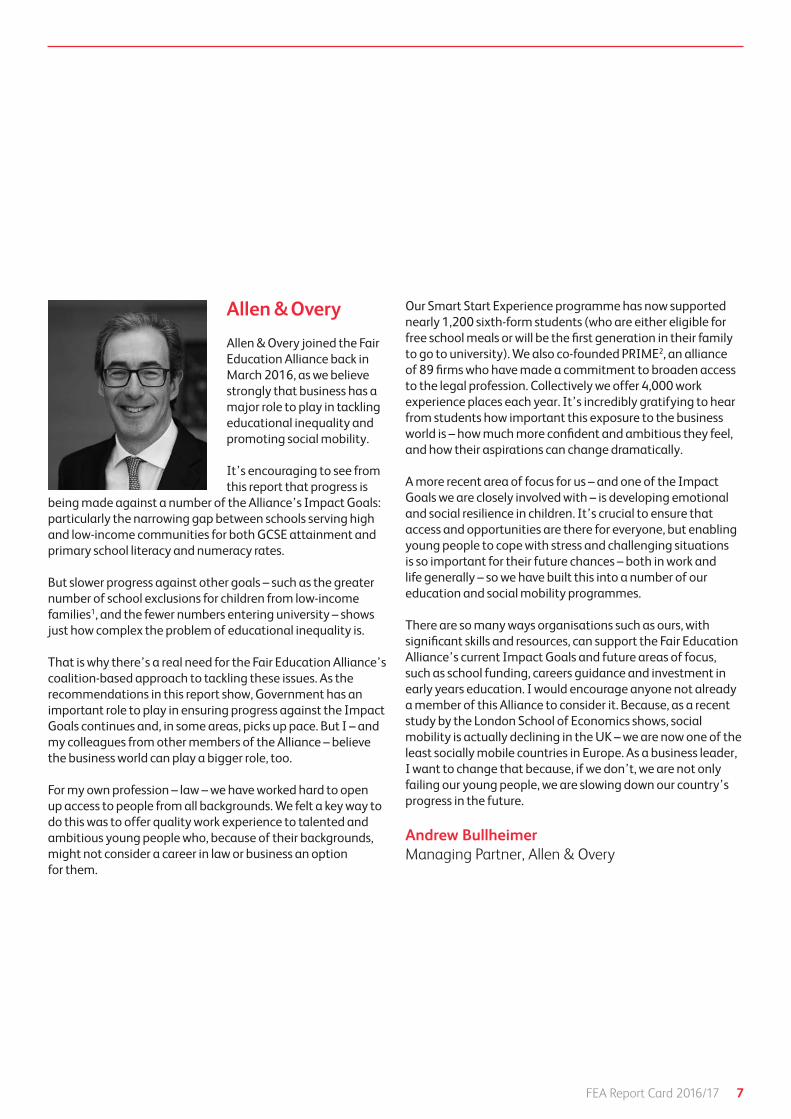
Allen & Overy
Allen & Overy joined the Fair Education Alliance back in March 2016, as we believe strongly that business has a major role to play in tackling educational inequality and promoting social mobility.
It’s encouraging to see from this report that progress is
being made against a number of the Alliance’s Impact Goals: particularly the narrowing gap between schools serving high and low-income communities for both GCSE attainment and primary school literacy and numeracy rates.
But slower progress against other goals – such as the greater number of school exclusions for children from low-income families1, and the fewer numbers entering university – shows just how complex the problem of educational inequality is.
That is why there’s a real need for the Fair Education Alliance’s coalition-based approach to tackling these issues. As the recommendations in this report show, Government has an important role to play in ensuring progress against the Impact Goals continues and, in some areas, picks up pace. But I – and my colleagues from other members of the Alliance – believe the business world can play a bigger role, too.
For my own profession – law – we have worked hard to open up access to people from all backgrounds. We felt a key way to do this was to offer quality work experience to talented and ambitious young people who, because of their backgrounds, might not consider a career in law or business an option for them.
Our Smart Start Experience programme has now supported nearly 1,200 sixth-form students (who are either eligible for free school meals or will be the first generation in their family to go to university). We also co-founded PRIME2, an alliance of 89 firms who have made a commitment to broaden access to the legal profession. Collectively we offer 4,000 work experience places each year. It’s incredibly gratifying to hear from students how important this exposure to the business world is – how much more confident and ambitious they feel, and how their aspirations can change dramatically.
A more recent area of focus for us – and one of the Impact Goals we are closely involved with – is developing emotional and social resilience in children. It’s crucial to ensure that access and opportunities are there for everyone, but enabling young people to cope with stress and challenging situations is so important for their future chances – both in work and life generally – so we have built this into a number of our education and social mobility programmes.
There are so many ways organisations such as ours, with significant skills and resources, can support the Fair Education Alliance’s current Impact Goals and future areas of focus, such as school funding, careers guidance and investment in early years education. I would encourage anyone not already a member of this Alliance to consider it. Because, as a recent study by the London School of Economics shows, social mobility is actually declining in the UK – we are now one of the least socially mobile countries in Europe. As a business leader, I want to change that because, if we don’t, we are not only failing our young people, we are slowing down our country’s progress in the future.
Andrew BullheimerManaging Partner, Allen & Overy

8 FEA Report Card 2016/17
How the report card was compiled
Most of the analysis of progress against the Impact Goals in this report card was undertaken by the Education Policy Institute (EPI) on behalf of the Fair Education Alliance. EPI produced and quality assured the statistics for Impact Goals 1, 2, and 4, and interpreted these in the associated commentary. Analysis for Impact Goal 5 was provided by UCAS, with commentary and additional interpretation by EPI. Some facts and figures, including those reported under Impact Goal 3, are drawn from official statistics published by the Department for Education; these are footnoted with references to the original source documents.
The recommendations and priorities in this report card were developed and voted on by members of the Fair Education Alliance. They should be treated as the recommendations of the Fair Education Alliance, and not attributed to the Education Policy Institute.
The terms ‘disadvantaged’ or ‘children from low-income families’ used in this report are defined by the pupil’s free school meals (FSM) status. The timing of the FSM eligibility differs between Impact Goals and is detailed in the associated footnotes.
This publication includes analysis of the National Pupil Database (NPD):
www.gov.uk/government/collections/national-pupil-database
The Department for Education is responsible for the collation and management of the NPD and is the Data Controller of NPD data. Any inferences or conclusions derived from the NPD in this publication are the responsibility of the Education Policy Institute and not the Department for Education.

FEA Report Card 2016/17 99
Impact Goal One: Narrow the gap in literacy and numeracy at primary school
Impact Goal Two: Narrow the gap in GCSE attainment at secondary school
Impact Goal Three: Ensure young people develop key strengths, including character, wellbeing and mental health, to support high aspirations
Impact Goal Four: Narrow the gap in the proportion of young people taking part in further education or employment-based training after finishing their GCSEs
Impact Goal Five: Narrow the gap in university graduation, including from the 25%most selective universities
FEA Report Card 2016/17

10 FEA Report Card 2016/17
IMPACT GOAL 2
Executive Summary
AT A GLANCE
The gap in primary literacy and numeracy between those at schools serving high and low-income communities has narrowed by 0.2 months in the last year, from 8.4 months to 8.2 months. It has narrowed by 0.6 months since 2014 results in the last report card, and by 1.1 months since 2012.1
The gap in GCSE attainment is measured using the average grade in full GCSE qualifications. The gap between those at schools serving low-income communities and those at schools serving high-income communities has narrowed by 0.3 months in the last year, from 13.1 months to 12.8 months. It has narrowed by 1.0 month since 2014 results in the last report card, and by 1.8 months since 2012.2
IMPACT GOAL 1
20 1 1
2012
2013
2014
2015
2016
Gap in literacy and numeracy (months)
10.00
9 .3
8 .9
8 .8
8 .4
8 .2
20 1 1
2012
2013
2014
2015
2016
GCSE average grade (months)
15 . 1
14 .6
14 .5
13 .8
13 . 1
12 .8

11FEA Report Card 2016/17
IMPACT GOAL 4
In 2014/15, the gap between those from schools serving low and high-income communities remaining in education after their GCSEs has narrowed by one percentage point since 2012/13, and now stands at 7 percentage points. The gap in broader ‘positive destinations’ including work-based training has also narrowed by one percentage point since the last report card, to 6 percentage points in 2014/15.
IMPACT GOAL 5
In 2016, the gap in university entry between children from low-income families4 and their more affluent peers increased fractionally; this was the first increase in the gap since 2010. Children from more affluent backgrounds are currently just over twice as likely to enter university as those from low-income families; this has reduced from almost three times as likely in 2006.
Chance of going to university relative to children from low-income families (ratio)
Not l ow- income, in state schoo l s
Not l ow- income, inc lud ing independent schoo l s
2.97
2.73
2.80
2007
2.58
2.64
2008
2.43
2.53
2009
2.36
2.55
20 10
2.38
2.35
20 1 1
2 .20
2.3 1
20 12
2.14
2.29
20 13
2.15
2.19
20 14
2.07
2.10
20 15
1 .98
2.14
20 16
2.03
2006
Continued education gap between schools serving high and low-income communities
(percentage points)23%
9%
9%
20 12
S ixth form
S ixth form, further education co l l ege & apprenticesh ips
S ixth form, further education , apprenticesh ips & jobs with tra in ing
20%
8%
7%
20 13
19%
7%
6%
20 14
19%
7%
6%
20 15
This year, children from low-income families3 continue to be over four times as likely as other children to be permanently excluded from school; they are also three times as likely to receive one or more temporary ‘fixed period exclusions’. While the size of this gap is very similar to last year, the rate of exclusions overall has risen in 2014/15, resulting in an extra 300 children from low-income families permanently excluded, and an additional 9000 fixed period exclusions handed to these children, compared with the previous year.
IMPACT GOAL 3
4X as likely (2,580
permament exclusions)
3X as likely (1 19,950
fixed period exclusions)
Poorer pupils are
More likely to receive permanent exclusion

12 FEA Report Card 2016/17
Top five priorities for government
School Funding
The Alliance believes that national spending should not decrease in real terms on a per pupil basis. The government should address the underfunding of the schools system to ensure that schools can continue to raise standards in education for all pupils, and continue to meet the additional needs of learners. Sufficient funding in the system is crucial if the government is to deliver on its social mobility aims and industrial strategy. The FEA believes that the government’s announcement of more school funding is a step in the right direction. However, the Treasury will have to provide additional funding if we are to provide every child with a world class education.
Destinations and Careers
Every primary and secondary school in England should have a designated and trained senior leader responsible for developing and delivering a whole school approach to destinations including a bespoke destination pathway for each student.
Selection
Evidence suggests that an expansion of grammar schools would have a negative impact on social mobility. We welcome the decision not to proceed with expanding grammar schools in the immediate future. The government should resist calls to expand selective education in the future.
Measurement of Social and Emotional Competencies
We support the creation of a framework of measures available to all schools in the UK to support their knowledge of the social and emotional competencies of their students. The framework will build on evidence from the Education Endowment Foundation and feedback from practitioners. More broadly we must recognise social and emotional competencies as a critical lever in boosting both attainment and social mobility for young people by creating a national standard setting out the principles of effective practice in partnership with schools, colleges, the third sector, business and government.
Early Years
Support for the continued development of the childcare and early education workforce should be a top priority. Our long-term ambition is for all group settings to be led by an early years teacher or equivalent, supported by well-qualified staff at all levels. Initially, the government should commit to working with the sector to ensure that every group setting serving the 30% most deprived areas in England is led by an early years teacher or equivalent by 2020. The government should also use the recently published early years workforce strategy as the platform to take steps to reverse the decline in early years teacher recruitment; ensure professional development and progression opportunities are available for everyone working in childcare and early education in England; and renew its ambition to driving improvements in quality through a properly supported and trained early years workforce. Ultimately Government must renew its ambition to drive improvements in quality by providing sufficient funding so settings can recruit and retain their workforce and support staff progression, so qualified staff no longer leave settings so rapidly after qualifying as teachers.
FEA Report Card 2016/17 13
Wider recommendations
FEA Report Card 2016/17 13
The Alliance puts forward several wider recommendations for government, education practitioners, voluntary organisations and universities. These are designed to stimulate improvement in areas where performance gaps remain stubbornly high and accelerate change in areas where there are already some signs of improvement.
Families
Parental and carer engagementAll schools should be supported to introduce clear policies on engaging parents and carers in their children’s learning. This should set out whole-school arrangements for reaching all parents and carers – not just those who most readily attend events at the school – and helping them to support their children’s learning in the most effective and age-appropriate ways.
Free School Meal RegistrationOwing to the opt-in policy for free school meals, approximately 200,000 children who are currently eligible do not claim the support meaning they may well be going hungry and schools miss out on much needed pupil premium funding. To rectify this, government should push for automatic registration of eligible pupils for free school meals, and therefore also pupil premium. The current requirement for families to come forward to register often acts as a barrier to entitlement. Local authorities have the information on the families in receipt of benefits and the DfE must bring in changes to allow all local authorities to share this information with schools so that eligible pupils are automatically identified.
Teachers
Teacher RecruitmentThe Alliance recognises that there is a real challenge to recruit and retain teachers into some of the most disadvantaged parts of the country. The government should explore the use of financial incentives such as loan forgiveness and mortgage deposit support as a way of incentivising a long-term commitment to the area. Any financial incentive scheme should be evaluated.

14 FEA Report Card 2016/17
Teacher WellbeingThe FEA is aware that teacher retention and wellbeing are significant issues facing schools. We recognise and welcome the government’s recognition of the importance of teacher workload. We also recognise the role that school leaders and governors can play in creating a supportive and sustainable organisational culture. We call for schools and the government to address teacher retention and wellbeing through a range of measures including increasing flexible working, offering high quality development and support for school leaders and setting sensible expectations about teacher workload and staffing ratios.
Continuing Professional Development in NumeracyThe Alliance recognises the importance of CPD in supporting teachers to help every child to reach their potential, irrespective of their background. Specifically: a) The government should introduce a national maths professional development programme focusing on subject knowledge and pedagogy for early years settings. This could be based on existing models currently offered by a number of educational organisations working in this area and should ensure that staff are confident in the Early Years Foundation Stage Framework, develop positive attitudes to maths, ensure practitioner subject knowledge is developed in the context of working with children and encourage practitioner research. This must be on-going and support settings in developing a culture of CPD, which becomes embedded in the setting. b) Teachers and leaders in primary settings should be supported (including through funding) in accessing a national mathematics-specific professional development programme, which encompasses a coherent curriculum framework with ongoing knowledge and skills development. This should also be aligned to Government’s standards on teachers’ professional development, as laid out by the Department for Education in June 2016. There also needs to be particular focus on supporting teachers to assess children’s progress in mathematics.
Qualifications and Assessments
Reading AssessmentThe FEA believes that a consistent and holistic national measure of children’s reading at age 11 and ways of tracking progress in early language and literacy throughout the early years should be developed. Universities, charities and government should work together to develop proportionate, consistent and effective ways of measuring progress that can be used year on year, including supporting access to relevant data sets.
Socio-economic Disadvantage & Qualification ReformDfE is monitoring the impact of qualification reform on social mobility and the impact on the attainment of certain demographics (e.g. disability, gender). It should also assess the impact on students from disadvantaged socioeconomic backgrounds, using Pupil Premium as an indicator of disadvantage.
Relationships and Sex Education and PSHE
The Alliance welcomes the government’s decision to introduce statutory sex and relationships education and the provision for Relationships and Sex Education (RSE) in all schools. It is now crucial that we build on this development by ensuring statutory RSE delivers for young people and meets their needs so they are able make informed decisions and stay safe. This should include consent, online safety, violence against women and girls, LGBTQ+ issues and healthy relationships. Statutory Personal, Social, Health and Economic Education (PSHE) should support young people to build resilience and learn about gender equality, body confidence and challenge sexism, narrow beauty ideals and pressures to be perfect.

15FEA Report Card 2016/17
Universities
Contextualised Higher Education AdmissionsUniversities should provide clear and transparent information to students, schools, parents and carers about if, and how, they use contextual data and information in admissions decision making. Research should be conducted by the sector to provide evidence of the long-term impact of contextual admissions processes.
Foundation YearsResearch should be conducted by the sector to understand the benefits to students from low-income backgrounds of Foundation Years. The research should address how successful they are in terms of widening access and increased retention on to full degree courses, achievement and graduation rates.
University Retention and ProgressionThe FEA welcomes increased investment from universities into better understanding the gap in degree completion rates between more and less affluent students, and for supporting programmes that seek to address it. The FEA recommends that further research is commissioned into the efficacy of pre-and-post enrolment interventions that support the retention of students from under-represented backgrounds. It recommends that research into retention is included in the scope of Universities UK’s Evidence and Impact Exchange.
University and Careers Funding AlignmentThere should be greater co-ordination and collaboration between the university and careers sector to ensure that guidance activities and funding is aligned for greatest (regional) impact.
Shared Measures of Success in Widening ParticipationThe FEA calls for the evaluation of widening participation activity to be based on a common set of sector-wide data, benchmarks and metrics to more accurately measure impact on young people’s attainment and behaviour, for instance focusing more on intervening earlier on in a child’s life and monitoring this impact. The Alliance believes this approach will make widening participation work more transparent and enable better co-ordination and comparison of the effectiveness of different activities. This should be based on robust evidence from the Universities UK Evidence and Impact Exchange, and we support OFFA’s portfolio of research exploring how the sector is evaluating outreach. We look forward to seeing how forthcoming practical guidance will support institutions to develop, implement and learn from effective evaluation of activity to ensure that outreach is reducing barriers for learners in communities with low rates of progression to higher education.

16 FEA Report Card 2016/17
Impact Goal One
The gap
The gap at primary school is measured using key stage 2 reading and maths tests taken at age 11. The gap between those at schools serving low-income communities and those at schools serving high-income communities has narrowed by 0.2 months in the last year, by 0.6 months since 2014 results in the last report card, and by 1.1 months since 2012.
In 2016, pupils were tested against the new national curriculum for the first time. The government believed that expectations lagged behind the highest-performing jurisdictions in the world, and have revised the curriculum with the aims of raising standards, increasing rigour, and delivering essential subject knowledge. The reformed curriculum and new tests present a challenge in measuring the size of the gap before and after these changes, as the old and new tests cannot be compared like-for-like.
As a result, the Alliance gap measure for Impact Goal 1 has been updated for this report card, using a statistical method which considers the position of each pupil within the national attainment distribution.5 According to this method, the rank position of a pupil’s test results is used to measure the gap in a consistent way across years where reforms have taken place. We then present the gap translated into months of educational progress, to make it easier to understand its size. The new Alliance measure allows comparisons to be made before and after the new curriculum assessments were introduced, providing a better understanding of the trend in the gap over time, which is no longer possible to determine from average point scores or the percentage of children achieving a certain level.
The national picture
Nationally, 53 percent of pupils reached the new, tougher, expected standard in reading, writing and mathematics at key stage 2 in 2016. There was a gap of 21 percentage points between disadvantaged pupils, 39 percent of whom achieved the expected standard, and other pupils, 60 percent of whom did. Only 5 percent of pupils reached higher than the expected standard, with a gap of 5 percentage points between disadvantaged pupils and their peers. These figures cannot be recreated meaningfully for previous years because they are based on a new curriculum and tests. However, the new
Alliance measure allows us to make meaningful comparisons over time; to see the underlying inequality that expresses itself in any given test or attainment measure.
The size of the gap in reading and mathematics is 8.2 months in 2016, and the gap has continued to narrow by 0.2 months in the latest year, and by 1.1 months since 2012.
The new Alliance measure can also be used to examine the gap in reading and in maths separately. The gap in reading has narrowed fitfully over the last five years, not changing in 2016, narrowing by 0.3 months since 2014 data reported in the last report card, but at the same level as in 2012; this was due to a large decrease of 1.0 month in 2012, which then partially reversed in 2013. The reading gap currently stands at 9.2 months.
Reading and maths gaps (months)
In maths, some caution needs to be applied to the latest year’s results because the mathematics test in 2016 produced a skewed distribution of scores that has artificially narrowed the top end of the test mark distribution, where many non-disadvantaged children are found. The Alliance measure recorded a 1.0-month reduction in the maths gap in 2016, contributing to a narrowing of 1.5 months since the last report card, and 2.4 months since 2012. The apparent decrease in the gap in 2016 is three times the average yearly decrease over the last five years, and is likely to be overstated because of a low mark ceiling on the maths test.
The maths gap stood at 6.7 months in 2015 and 5.7 months in 2016, but there is a risk that the 2016 gap is understated, and the gap could appear to increase again in future years if the test is adjusted to increase its ability to measure differences at the top of the ability scale. The reading and maths gap may also be affected by this issue, but to a lesser extent, because the average of reading and maths scores is used in the headline measure, which dampens the effect of the maths test.
Narrow the gap in literacy and numeracy at primary school
2011
10.2
8.3
9.2
8.1
9.7
6.9
9.5
7.2
9.2
6.7
9.2
5.7
2012 2013 2014 2015 2016
Gap in reading & maths
Gap in maths
Gap in reading

FEA Report Card 2016/17 17FEA Report Card 2016/17 17
1
There was a gap of 21 percentage points between disadvantaged
pupils, 39 percent of whom achieved the expected standard, and other pupils, 60 percent of whom did.
The size of the gap in reading and mathematics
is 8.2 months in 2016
The largest reduction in the gap has been in the South East,
where it has fallen by 1.2 months, to 9.3 months
8.221%
18 FEA Report Card 2016/17
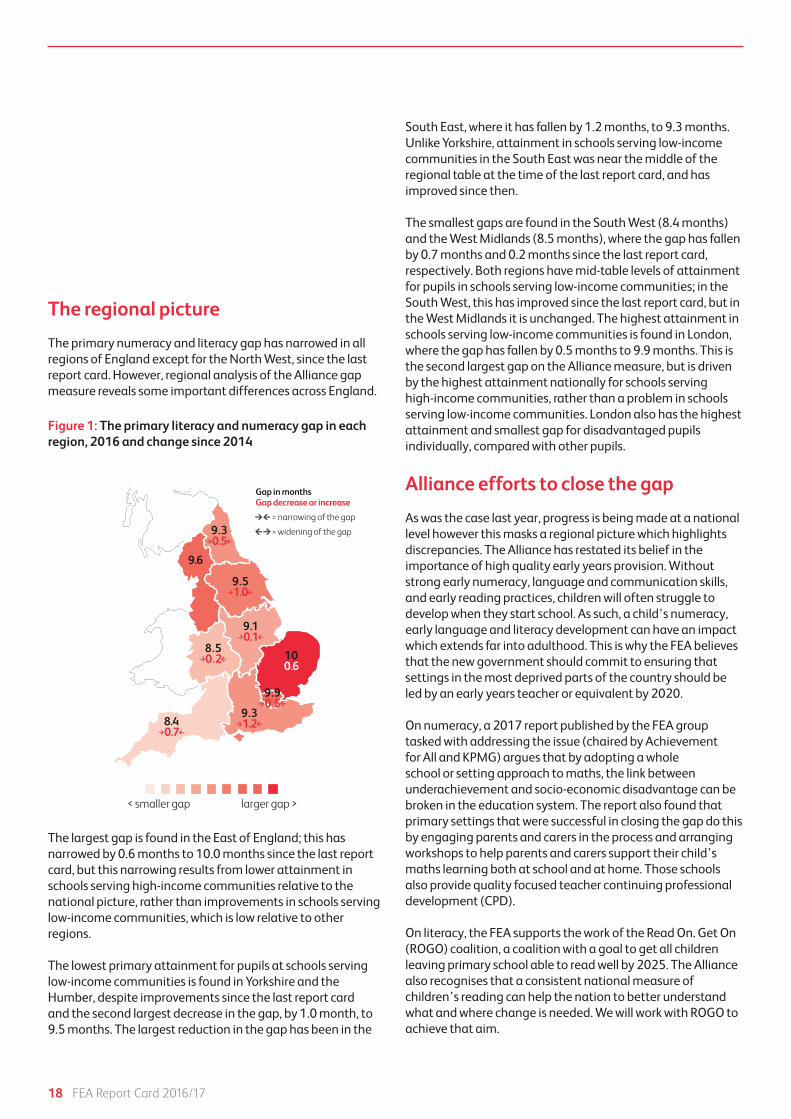
The regional picture
The primary numeracy and literacy gap has narrowed in all regions of England except for the North West, since the last report card. However, regional analysis of the Alliance gap measure reveals some important differences across England.
The largest gap is found in the East of England; this has narrowed by 0.6 months to 10.0 months since the last report card, but this narrowing results from lower attainment in schools serving high-income communities relative to the national picture, rather than improvements in schools serving low-income communities, which is low relative to other regions.
The lowest primary attainment for pupils at schools serving low-income communities is found in Yorkshire and the Humber, despite improvements since the last report card and the second largest decrease in the gap, by 1.0 month, to 9.5 months. The largest reduction in the gap has been in the
South East, where it has fallen by 1.2 months, to 9.3 months. Unlike Yorkshire, attainment in schools serving low-income communities in the South East was near the middle of the regional table at the time of the last report card, and has improved since then.
The smallest gaps are found in the South West (8.4 months) and the West Midlands (8.5 months), where the gap has fallen by 0.7 months and 0.2 months since the last report card, respectively. Both regions have mid-table levels of attainment for pupils in schools serving low-income communities; in the South West, this has improved since the last report card, but in the West Midlands it is unchanged. The highest attainment in schools serving low-income communities is found in London, where the gap has fallen by 0.5 months to 9.9 months. This is the second largest gap on the Alliance measure, but is driven by the highest attainment nationally for schools serving high-income communities, rather than a problem in schools serving low-income communities. London also has the highest attainment and smallest gap for disadvantaged pupils individually, compared with other pupils.
Alliance efforts to close the gap
As was the case last year, progress is being made at a national level however this masks a regional picture which highlights discrepancies. The Alliance has restated its belief in the importance of high quality early years provision. Without strong early numeracy, language and communication skills, and early reading practices, children will often struggle to develop when they start school. As such, a child’s numeracy, early language and literacy development can have an impact which extends far into adulthood. This is why the FEA believes that the new government should commit to ensuring that settings in the most deprived parts of the country should be led by an early years teacher or equivalent by 2020.
On numeracy, a 2017 report published by the FEA group tasked with addressing the issue (chaired by Achievement for All and KPMG) argues that by adopting a whole school or setting approach to maths, the link between underachievement and socio-economic disadvantage can be broken in the education system. The report also found that primary settings that were successful in closing the gap do this by engaging parents and carers in the process and arranging workshops to help parents and carers support their child’s maths learning both at school and at home. Those schools also provide quality focused teacher continuing professional development (CPD).
On literacy, the FEA supports the work of the Read On. Get On (ROGO) coalition, a coalition with a goal to get all children leaving primary school able to read well by 2025. The Alliance also recognises that a consistent national measure of children’s reading can help the nation to better understand what and where change is needed. We will work with ROGO to achieve that aim.
Figure 1: The primary literacy and numeracy gap in each region, 2016 and change since 2014
Gap in monthsGap decrease or increase
= narrowing of the gap
= widening of the gap9.30.5
9.6
9.51.0
9.10.1
8.50.2 10
0.6
9.90.5
8.40.7
9.31.2
< smaller gap larger gap >

Without strong early numeracy, language and communication skills, and early reading practices, children will often struggle to develop when they start school.
19FEA Report Card 2016/17

20 FEA Report Card 2016/17
Impact Goal TwoNarrow the gap in GCSE
attainment at secondary school
The gap
The gap in GCSE attainment is measured using the average grade in full GCSE qualifications. The gap between those at schools serving low-income communities and those at schools serving high-income communities has narrowed by 0.3 months in the last year, by 1.0 month since 2014 results in the last report card, and by 1.8 months since 2012.
In 2014, the list of qualifications that count in the government’s performance statistics was reviewed and reduced resulting in a greater level of challenge, and the rules were changed so that only the first attempt at each core subject GCSE is counted in the results. Further reforms will take place from 2017 as individual GCSEs are reformed resulting in a nine-point grade-scale replacing the current A*-E grades.
As with Impact Goal 1, the Alliance gap measure for Impact Goal 2 has been updated for this report card, using a statistical method which considers the position of each pupil within the national attainment distribution. According to this method, the rank position of a pupil’s grades is used to measure the gap in a consistent way across years where reforms have taken place. We then present the gap translated into months of educational progress, to make it easier to understand its size. The new Alliance measure therefore allows comparisons to be made before and after the reforms providing a better understanding of the trend in the gap over time, which is no longer possible to determine from average point scores or the percentage of children achieving a certain set of grades.
The national picture
In the latest (2016) results, children from low-income families achieved an average D grade in Attainment 8 subjects, compared with an average C grade for other pupils. Disadvantaged children were 1.2 grades behind at the end of secondary school, and had made half a grade less progress over the course of secondary school than their better-off peers (per subject). Disadvantaged children were almost twice as likely as others to miss out on achieving passes at grade C or better in GCSE English and maths.
These figures which describe the gap cannot be replicated meaningfully for previous years because they are based on a new set of expectations for schools and pupils which only
came into force in 2016. However, the new Alliance measure allows us to make meaningful comparisons over time; in effect, to see through the reforms to GCSEs that have changed the type and number of qualifications that are taken by many pupils, and as of this summer are changing the grading scale used to describe individual GCSE results in each subject.
The size of the gap in average GCSE grades is 12.8 months in 2016, and the gap has continued to narrow by 0.3 months in the latest year, and by 1.8 months since 2012.
The regional picture
The gap in GCSE grades varies across the country even more so than the gap in primary literacy and numeracy does. Progress in closing the gap is also uneven, as can be seen in the following regional analysis.
Figure 2: The GCSE gap in each region, 2016 and change since 2014
Gap in monthsGap decrease or increase
= narrowing of the gap
= widening of the gap13.41.4
14.11.1
13.82.1
140.5
12.21.9 16.6
1.4
14.41.4
18.40.5
18.70.7
< smaller gap larger gap >

21
FEA Report Card 2016/17
2
The gap in the South East is the largest in England, at 18.7 months.
Disadvantaged children were 1.2 grades behind at the end of
secondary school
In 2016, almost 50% more young people from poor families in inner
London achieved 5 A*-C GCSEs than other regions of England.
50%

22 FEA Report Card 2016/17
Children attending schools serving low-income communities fare the worst in the South East, both in terms of the lowest GCSE attainment and the largest gap compared with schools serving high-income communities. The gap in the South East has reduced by 0.7 months in the last year, but is still the largest in England, at 18.7 months.
The smallest gap in 2016 is in the West Midlands (12.2 months), which also has the second largest reduction in the gap since 2014 (the latest year in the last report card), of 1.9 months, and the second highest attainment for children at schools serving low-income communities, after London. Yorkshire and the Humber narrowed its gap by 2.1 months since the last report card, to 13.8 months, and improved its attainment for children in schools serving low-income communities relative to the national picture; attainment for these schools is in the middle of the table compared with other regions.
The gap in London has increased by 1.4 months, to 14.4 months, since the last report card, but this has been fuelled by a recovery in attainment of pupils at schools serving high-income communities after the first wave of reforms in 2014. Pupils at schools in London serving low-income communities have continued to increase their attainment gradually each year, and retain the highest absolute levels of attainment in the country for schools serving low-income communities. London also has the smallest gap in attainment for individual children from low-income families compared with their more affluent peers.
The Alliance gap measure has also widened by 0.5 months, to 18.4 months, since the last report card in the South West, but unlike London there has been no improvement relative to the national picture for schools serving low-income communities, and absolute attainment for children at these schools is the second lowest in the country, after the South East.
Alliance efforts to close the gap
The Impact Goal Two gap continues to shrink, although the emerging theme of this report card is that this is dependent on which part of the country a disadvantaged child lives in. Worryingly, independent analysis of the financial situation that many schools are predicted to find themselves in or are already experiencing may hinder the nation’s ability to achieve this goal by 2022. This concern was also highlighted by the general public as one of their top issues over the course of the 2017 General Election. With risks to the number of teachers, amount of extra-curricular activities and other key services in schools, the Alliance believes that the government should maintain the school’s budget on a per pupil basis in real terms.
We know that great teaching and leadership can make the difference. This is why there needs to be a renewed national focus on recruiting teachers into parts of the country where they are most needed through regionally appropriate financial incentives. We should also recognise the challenges the system faces in retaining teachers by exploring the better use of flexible time in teaching. We can make significant progress on this Impact Goal if we develop bold thinking around how we support teachers with their development and their wellbeing to ensure we can attract and retain them.

23FEA Report Card 2016/17
We know that great teaching and leadership can make the difference. This is why there needs to be a renewed national focus on recruiting teachers into parts of the country where they are most needed through regionally appropriate financial incentives.
24 FEA Report Card 2016/17
The gap
The UK consistently ranks poorly in international comparisons of children’s wellbeing and happiness,6,7,8 and evidence from the Millennium Cohort Study suggests poor emotional wellbeing is more prevalent among children from low-income families.9 Since 2014, the Fair Education Alliance and its members have been exploring ways to capture and understand the relationship between economic deprivation, educational disadvantage and children’s social and emotional health.
We have therefore been working with a team from the University of Manchester Institute of Education to apply findings from their research into daily practice in schools. Looking at evidence from collaborative work including the Child Outcomes Research Consortium, the Big Lottery Fund, Common Room and the Evidence Based Practice Unit, we have explored how we can quantify changes year on year in the development of key strengths including character, wellbeing and mental health.
The first step is to collect data to help us understand what is happening nationally, similar to how we try to capture national trends for the other Impact Goals. The FEA has agreed to use the Headstart programme’s Wellbeing Measurement Framework. Evidence collected so far by the programme from over 40,000 students will ensure that this Impact Goal gets the attention it deserves. We are then working with the team to identify and recommend a small number of measurement tools to support teacher understanding and practice in this area.
The Headstart programme
The Headstart programme and projects began in 2013 funded by the Big Lottery Fund, Fulfilling Lives strand. The programme funds partnership working in schools and with families, community groups and charities so that young people can benefit from joined-up support.
Headstart aims to influence changes in policy and services at a national level. Schools from Cumbria, Blackpool, Knowsley, Birmingham, Wolverhampton, Southampton, Kent, Cornwall, Lewisham and Hull have participated in pilot projects measuring the wellbeing of children and young people and following up the outcomes with supported interventions.
The initiative has now launched the Wellbeing Framework, a suite of measurement booklets for primary school, secondary school, and college students and the Fair Education Alliance will report on the aggregated data collected from the schools from 2018. The tools used to measure this Impact Goal will include:
» The Student Resilience Survey » The Perceived Stress Scale » The Trait Emotional Intelligence Questionnaire » The Strengths and Difficulties Questionnaire » The Short Warwick Edinburgh Mental Wellbeing Scale
Current measurement of the gap
We will continue to use proxy measures to aid our collective understanding of what progress has been made in this area. The Fair Education Alliance has previously used permanent and fixed-period exclusions as a proxy measure. This year, disadvantaged children10 continue to be over four times as likely as other children to be permanently excluded from school; they are also three times as likely to receive one or more temporary ‘fixed period exclusions’.11 While the size of this gap is very similar to last year, the rate of exclusions overall has risen in 2014/15, resulting in an extra 300 disadvantaged children permanently excluded, and an additional 9,000 fixed period exclusions handed to disadvantaged children, compared with the previous year. The statistic is proving to be worryingly stubborn.
Impact Goal ThreeEnsure young people develop key strengths, including character,
wellbeing and mental health to support high aspirations

25FEA Report Card 2016/17
3
Disadvantaged children continue to be over four times as likely as other
children to be permanently excluded from school
9 percent of disadvantaged children report poor health, compared with
6.7 percent of other children
26 FEA Report Card 2016/17
Part of the explanation for this high rate of school exclusions among disadvantaged children is the higher incidence of special educational needs and disabilities (SEND) among children eligible for free school meals.11 Pupils with SEND are between four and seven times as likely to be permanently excluded as those without SEND (with / without statements or education, health and care plans (EHCPs)). They are also four to five times as likely to receive one or more fixed period exclusions (without / with statements or EHCPs). Pupils who are eligible for free school meals are over twice as likely to be identified as having a special educational need or disability.12
The national picture
In July 2016, the Longitudinal Study of Young People in England (LSYPE cohort 2) reported on the health and wellbeing of pupils in year 10 in 2014.13 While this is not an annual data collection, comparisons with the same age group in 2005 are reported where it is possible to compare the first and second cohorts of the study, providing some information about medium-term trends. The measures used in the study were self-reported by the 14-15 year-olds surveyed, and indicated that overall health and wellbeing has declined by a small degree since 2005. Larger decreases were seen for girls and for those with longstanding illness or disability that affects their schooling. The LSYPE survey data displayed a clear socio-economic gap in self-reported health, with 9 percent of disadvantaged children reporting poor health, compared with 6.7 percent of other children.
Average levels of psychological distress also increased slightly between 2005 and 2014, although there was no increase in the proportion of pupils experiencing clinically concerning levels of distress nationally; however, there was an increase in the percentage of psychologically distressed girls, which was counterbalanced by a small decrease among boys. Unlike levels of health, psychological distress levels were slightly higher on average among non-disadvantaged pupils than among disadvantaged pupils.140 This is consistent with other studies, but in contrast, the Millennium Cohort Study (MCS) found that disadvantaged children were more likely to have mental health problems at the younger age of 11.8
The MCS uses a broader measure of distress which includes ‘externalising’ behaviour, as well as ‘internalised’ distress as measured in LSYPE.
This evidence of greater early onset of behavioural difficulties among disadvantaged children is particularly worrying, because other research indicates that children with conduct disorders are less likely to receive specialist child and adolescent mental health (CAMHS) services than those with other types of difficulty15, despite increasing evidence that conduct disorders are neurodevelopmental disorders, with biological underpinnings and serious negative long-term outcomes. This leaves more of the burden for schools to pick upprovides a caution that mental health problems can affect children from both disadvantaged and advantaged backgrounds, but may be more likely to manifest itself earlier in disadvantaged children.
Turning to the capacity of schools to support children who are struggling with mental health difficulties, the National Foundation for Educational Research surveyed teachers and head teachers during between May and July of 2016.17 Just over half of school leaders and teachers reported that staff were able to identify mental health problems from children’s behaviour, and that they knew how to activate support systems within the school for those pupils. However, fewer than a third were confident that they knew how to help pupils access specialist support outside of school, and only three in ten school leaders felt staff were equipped to teach pupils with mental health difficulties (four in ten classroom teachers felt they were equipped for this).
FEA Report Card 2016/17 27
Policy Developments
This year, the Fair Education Alliance has identified the following areas where progress has been made nationally in trying to achieve this Impact Goal:
» The previous Health Committee began an inquiry into the role of education in promoting emotional wellbeing in children and young people and preventing the development of mental health problems. The Education Committee was invited to join the inquiry and share its expertise in the education sector with the Health Committee’s overview of mental health services. Due to the general election in June 2017, it is not yet clear whether this issue will be taken up by the incoming Health Committee.
» The Mental Health Taskforce published the Five Year Forward View for Mental Health, including recommendations that at least 70,000 more children and young people should have access to high-quality mental health care by 2020/21. Accepting the Five Year Forward View, NHS England has published Implementing the Five Year Forward View for Mental Health.
» An Education Committee inquiry into the mental health and wellbeing of looked after children has recommended looked after children are given priority access to mental health assessments.
» The Health Select Committee announced an inquiry into suicide prevention and the interim report suggests the 2012 suicide prevention strategy has been characterised by inadequate leadership, poor accountability and insufficient action.
» The Department for Education has re-published advice on Mental Health and Behaviour in Schools, and committed to publishing a green paper on children and young people’s mental health.
» The Department for Education has opened applications for £6million of character grants aimed at schools promoting traits including resilience. Additionally, the Department for Education has commissioned National Children’s Bureau and NatCen Social Research to undertake a national survey of schools, colleges and providers of alternative education, about the provision they offer to promote character education and to support the mental health of pupils (both primary and secondary) and students.
» Government has funded the PSHE Association to provide mental health guidance and lesson plans, which supports age-appropriate teaching about mental illnesses, emotional wellbeing and healthy coping strategies.
» The government has tabled amendments to the Children and Social Work Bill that require all primary schools in England to teach age-appropriate ‘relationships education’; and all secondary schools in England to teach age-appropriate ‘relationships and sex education’. The amendments have also given the government the power to introduce statutory PSHE education, subject to further consultation.
» There continues to be a stronger movement towards the development of a common language and definition around this area; as exemplified by the production of a useful tool for practitioners collectively developed by the Fair Education Alliance’s working group focusing on this goal. We explore some of the terms used below.
The Fair Education Alliance believes that these developments have been broadly positive.
Character
In October 2016, Justine Greening became the new Secretary of State for Education. She outlined a commitment to social mobility and acknowledged that the government will be focusing on the role of schools in children’s mental health as laid out by Theresa May in January 2017.
Character education and wellbeing were personal priorities for previous Secretary of State for Education, Nicky Morgan, and in 2015 she introduced the Character Awards. These awards allocated a share of £6million grant funding available for schools committed to developing attributes and behaviours in children and young people that underpin and promote their academic and longer term success; collectively, these were referred to as ‘character’. Further funding was provided for military ethos projects and youth social action projects (young people taking practical action in the service of others). Concurrently, funding to develop the evidence base was granted to the Education Endowment Foundation (EEF). Justine Greening has renewed the government’s commitment to the character awards – opening for a second year in April 2016 celebrating nine successful schools in July 2017.

28 FEA Report Card 2016/17
Criticisms have been levelled at the purpose and scope of character education, its place in the curriculum, its delivery and the entitlement of all pupils to it. The Alliance believes that character education and social and emotional learning can contribute to enabling all children and young people, irrespective of background, to feel included and to be able to function as critical thinkers in school and throughout their lives.
Research and policy documents alike show inconsistencies in terminology and understanding; ‘non-cognitive skills’, ‘soft skills’, ‘social and emotional skills’ and more recently ‘character’ are often used interchangeably to describe the key strengths which underpin educational achievement. The group within the Fair Education Alliance tasked with addressing this particular area has been working collaboratively to arrive at a consensus on the types of attributes that children and young people should develop, acknowledging the way the terminology can be misused.
Social and Emotional Skills
Like last year, overall findings show that children from low-income families are still more likely to have poorly developed social and emotional skills and are less likely to display the particular positive behavioural skills needed for engagement in learning.
Evidence from the Millennium Cohort Study confirms that 11 year-olds from low-income families display significantly poorer conduct than those from more affluent families.18 The report authors comment that this difference is larger than it was in children born in 1970, and combined with differences in social and emotional skills, is likely to damage the development of children from low-income families, with consequences reaching into adulthood.
Recent government decisions around PSHE, to introduce statutory sex and relationships education and the provision for Relationships and Sex Education (RSE) in all schools is extremely positive. As a group, we believe statutory Personal, Social, Health and Economic education (PSHE) should support young people to build resilience and make safe and informed decisions.
Mental Health
In 2017, Theresa May delivered a speech on mental health announcing that:
» Every secondary school would be offered mental health first aid training;
» New trials would look at how to strengthen the links between schools and local NHS mental health staff; and
» There would be a thematic review of children and adolescent mental health services led by the Care Quality Commission.
The Prime Minister also laid out a green paper on children and young people’s mental health to set out plans to transform services in schools, universities and for families.
Mental health has become a more prominent issue, in part due to the announcement of Heads Together, a campaign spearheaded by the Duke and Duchess of Cambridge and Prince Harry working to eliminate stigma around mental health. Schools are one target of the campaign and the need for guidance for schools is more widely acknowledged. Young Minds has launched Wise Up to Wellbeing in Schools, calling on the Government to rebalance the education system so that the wellbeing of students is as important as academic achievement. This should all be commended. However, the Alliance recognises that funding challenges may mean that schools are at risk of failing to take advantage of this momentum.
FEA Report Card 2016/17 29
The Importance of a ‘Whole School Approach’
We will not make meaningful progress in this area unless we support schools to adopt a whole school approach to this agenda. Research demonstrates that a whole school approach can lead to improvements in the school culture, staff wellbeing, pupil behaviour, school attendance and academic attainment.
While specific provision for pupils with identified social, emotional and mental health needs is unquestionably important, a whole school approach enhances the emotional health of all children and young people. Not only is this vital as both a preventative approach, and to optimise life chances for all pupils but it also creates a positive, supportive environment in which to cultivate those with identified difficulties. Critically, a whole school approach fosters a school culture, which holds the wellbeing of the entire school. This includes:
» Ensuring the Senior Leadership Team are committed to a whole school approach
» Developing school wide policies and practices that support emotional wellbeing
» Using an explicit social and emotional curriculum, alongside embedding skill development across the curriculum
» Involving all members of the school community, and in particular parents and carers
» Additionally, the Department for Education, National Children’s Bureau and NatCen Social Research published in August a national survey of schools, colleges and providers of alternative education, about the provision they offer to promote character education and to support the mental health of pupils (both primary and secondary) and students19
The Fair Education Alliance remains committed to the value of a whole school approach to the development of social and emotional skills or character. A recent Fair Education Alliance survey distributed to five hundred teachers and school leaders showed that 92% believed it was important to accurately identify children’s wellbeing across a whole school, while 88% felt it was important to understand each child’s social and emotional wellbeing to support their learning. While this commitment is evident, 71% reported that the greatest barrier to addressing social and emotional wellbeing was time constraints. Schools also reported that the most important factor to support students was clear next steps for students after carrying out social and emotional wellbeing measures. This survey shows that while teachers and school leaders support a whole school approach to the development of social and emotional skills, there is still a lack of guidance around measurement and next steps as well as concerns about time restraints.

30 FEA Report Card 2016/17
Closing the gap
Evidence from the 1970 British Cohort Study reveals many links between key strengths and positive outcomes in later life.13 The strongest and widest benefits across mental and physical health, wellbeing, education, employment and relationships are associated with locus of control (seeing oneself as generally able to influence one’s own future and the wider world), and conscientiousness and self-regulation. Self-esteem and emotional health during childhood were the best predictors of adult mental health and wellbeing.
Other research has reviewed how much we know about changing or teaching key strengths.20 How people perceive their ability to succeed at a specific task can be increased, as can resilience to obstacles and set-backs, and as can social skills. Self-control and conscientiousness are more difficult to transform, but there is evidence suggesting they can be enhanced. An important finding is that key strengths need to be taught in the context in which they are required, and translated to new contexts with active teaching; they must be learned in concrete not abstract ways.
Child development research tells us that the conditions that support positive character development also tend to support academic learning.21 The good news is that key strengths and academic learning are mutually supportive, and not in competition with one another. The research also reveals that some skills support and scaffold others; for example, the effort and persistence children demonstrate is greater when they are motivated by what they are trying to achieve and when they believe in their ability to succeed if they try. This persistence and belief has the knock-on benefit of increasing the extent to which children try different approaches to solve a problem, attend school regularly and complete their homework and other tasks. There is a virtuous circle between developing key strengths and academic learning.
Some of the conditions that research tells us support the development of key strengths, and learning in general, include:
» Frequent practice in using skills at increasing levels of challenge;
» Social interaction as part of learning (talking, imitating and pretending in younger children; role-play, debating and negotiation in older children);
» Facing conflicts between competing goals or rewards, planning future actions, and practising the delay of gratification to pursue longer-term goals;
» Enrichment and extra-curricular activities (a broad range is associated with enhanced wellbeing, whereas a deep focus on one area is associated with developing persistence);
» Stable and supportive relationships with teachers and other adult carers.
The Alliance is now identifying measurement tools which can be used by schools to better understand the wellbeing of their students. The Alliance will continue to support organisations working to ensure all students can access activities outside school and will also continue to follow developments in PSHE in order to close the gap during school and beyond.

3131
We will not make meaningful progress in this area unless we support schools to adopt a whole school approach to this agenda. Research demonstrates that a whole school approach can lead to improvements in the school culture, staff wellbeing, pupil behaviour, school attendance and academic attainment.
FEA Report Card 2016/17

32 FEA Report Card 2016/17
The gap
In 2014/15, the gap between those from schools serving low and high-income communities remaining in education after their GCSEs has narrowed by one percentage point since 2012/13, and now stands at 7 percentage points. The gap in broader ‘positive destinations’ including work-based training has also narrowed by one percentage point since the last report card, to 6 percentage points in 2014/15.22 The Alliance’s original goal of 90 percent of those from schools serving low-income communities remaining in education and training following their GCSEs has been met seven years early, largely due to the change in policy that raised the participation age to eighteen. The Alliance is currently focusing on continued education destinations including apprenticeships (now standing at 87 percent of those from schools serving low-income communities) and is assessing new measures for the future, to capture the subtler gaps in outcomes that exist within further education.
The national picture
The gap in 2014/15 is down by one percentage point compared with two years previously. However, it did not change in the latest year, having already narrowed by 2013/14. This stall in progress in the latest year coincides with reforms to the qualifications that are counted in official GCSE results measures, and to how GCSE resits are counted, affecting this year group. It is possible that reduced GCSE pass rates in summer 2014 may have influenced the destinations for this year group. Additionally, slower progress might be expected in any case, as the percentage of students continuing in education approaches 90 percent, because there is likely to be a natural ceiling whereby a small minority are unable to sustain full-time further education or prefer not to.
Looking within the continued education category, the gap in participation for apprenticeships remains very close to zero. Previously, those from schools serving low-income communities were slightly more likely to progress into apprenticeships, but in the latest year there was no measurable difference compared with those from schools serving high-income communities; in both cases just over 5 percent follow an apprenticeship following their GCSEs.
Continued education rates for schools serving low-income communities (percentage)
There is a noticeable gap in the percentage pursuing their education within sixth forms (either a school sixth form or a separate sixth form college); this has narrowed by one percentage point since the time of the last report card, but remains as wide as 20 percentage points in 2014/15. In this latest year, 62 percent of those from schools serving high-income communities studied in sixth forms, compared with 43 percent of those from schools serving low-income communities.
Differences in sixth form destinations are often related to the mix of post-16 providers in a local area, resulting from historical local authority decisions. It is therefore open to question whether sixth form destinations are an important outcome, given that A-levels are often offered in FE colleges. However, research for the Social Mobility Commission shows that structure matters to the sorts of qualifications young people end up pursuing.23 Those living in areas with no school sixth form are as likely to continue in education after their GCSEs, but less likely to study for 3 A-levels, and middle attainers are particularly likely to choose vocational rather than academic qualifications where there is a relative shortage of sixth form places.
Impact Goal FourNarrow the gap in the proportion of young people taking part in further education or apprenticeships after finishing their GCSEs
2012 2013 2014 2015
Schools serving low income communities
Jobs with training Sixth form Further education and apprenticeships
38%
81%
42%
85%
43% 42%
43%
87%
43%
44%
87%
44%

33FEA Report Card 2016/17
4
The North East has the largest gap of all the regions for the first time in 2014/15, at 9 percentage points
29 percent of pupils attending PRUs at age 16 are recorded as NEET following the end of key stage 4
29%
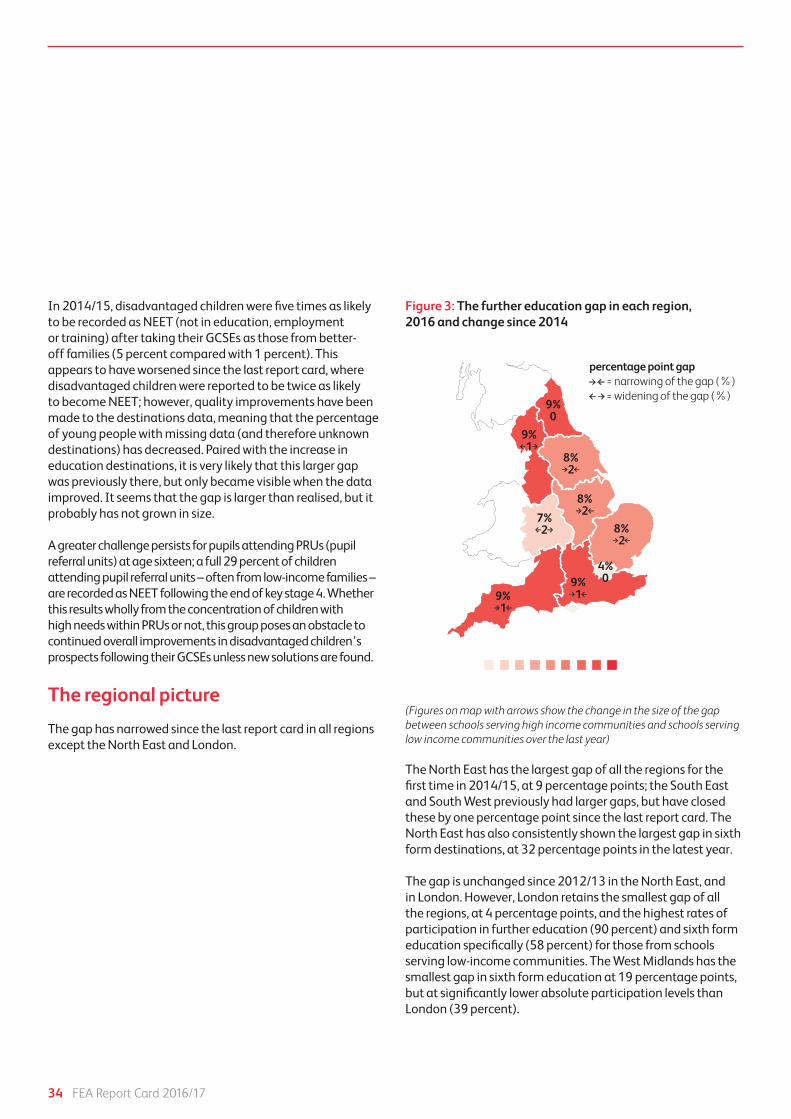
34 FEA Report Card 2016/17
In 2014/15, disadvantaged children were five times as likely to be recorded as NEET (not in education, employment or training) after taking their GCSEs as those from better-off families (5 percent compared with 1 percent). This appears to have worsened since the last report card, where disadvantaged children were reported to be twice as likely to become NEET; however, quality improvements have been made to the destinations data, meaning that the percentage of young people with missing data (and therefore unknown destinations) has decreased. Paired with the increase in education destinations, it is very likely that this larger gap was previously there, but only became visible when the data improved. It seems that the gap is larger than realised, but it probably has not grown in size.
A greater challenge persists for pupils attending PRUs (pupil referral units) at age sixteen; a full 29 percent of children attending pupil referral units – often from low-income families – are recorded as NEET following the end of key stage 4. Whether this results wholly from the concentration of children with high needs within PRUs or not, this group poses an obstacle to continued overall improvements in disadvantaged children’s prospects following their GCSEs unless new solutions are found.
The regional picture
The gap has narrowed since the last report card in all regions except the North East and London.
The North East has the largest gap of all the regions for the first time in 2014/15, at 9 percentage points; the South East and South West previously had larger gaps, but have closed these by one percentage point since the last report card. The North East has also consistently shown the largest gap in sixth form destinations, at 32 percentage points in the latest year.
The gap is unchanged since 2012/13 in the North East, and in London. However, London retains the smallest gap of all the regions, at 4 percentage points, and the highest rates of participation in further education (90 percent) and sixth form education specifically (58 percent) for those from schools serving low-income communities. The West Midlands has the smallest gap in sixth form education at 19 percentage points, but at significantly lower absolute participation levels than London (39 percent).
Figure 3: The further education gap in each region, 2016 and change since 2014
percentage point gap = narrowing of the gap (%) = widening of the gap (%)
9%0
8%2
8%2
4%0
9%1
9%1
7%2
9%1
8%2
(Figures on map with arrows show the change in the size of the gap between schools serving high income communities and schools serving low income communities over the last year)

FEA Report Card 2016/17 35
Alliance efforts to close the gap
With so many options available to young people when they leave formal education, it is no surprise that so many are unsure of what route will help them to maximise their potential. Young people need impartial information, advice and guidance about the options open to them. Young people from low-income families face barriers to employment, further education or training which quality careers advice can help them overcome. The Alliance believes that a designated senior leader who is responsible for developing and delivering a whole school approach to destinations could help to tackle this problem.
We know that a young person who has had access to high quality long-term engagement with an employer or employees is more likely to align their achievement at school with their future career and hence make it less likely that they will be NEET. Research by Business in the Community highlights the role that employers have to play in ensuring that young people understand the behaviours and qualifications required to build successful working lives.24 This is increasingly important at a time when companies are changing their recruitment practices to focus more on skills and competencies, rather than qualifications.
These skills are often cited by employers, universities and organisations supporting entrepreneurs as lacking – for example, through the CBI’s annual employer surveys.25 Research from the Commission for Social Mobility has highlighted that the gap in these broader enterprise and employability skills is one driver behind differences in backgrounds of students with different socio-economic outcomes but the same academic performance.26 The skills most often cited encompass interpersonal, communication, problem-solving, and self-management skills.
Recent research conducted by LKMco on behalf of Enabling Enterprise highlighted that progress on building these critical enterprise and employability skills is held back by a lack of common language or standards.27 As a result, efforts rarely add up, teachers cannot draw together the elements of different programmes, and we struggle to know what really works. In response, members focused on this impact goal including Enabling Enterprise, BITC, Career Ready, Teach First, and Ark are working together along with expert advisors,
and a wider range of piloting organisations to address this. They are refining the Skills Builder framework, used with over 150,000 students by Enabling Enterprise, to act as that shared approach.
This shared Skills Builder framework will allow schools and employers to work in partnership to build these skills. There is evidence here that to be as effective as possible in building these skills, we should start with children in primary school, measure progress, include both direct and embedded skills teaching, and make rich links to the wider working world too.
Finally, evidence indicates youth social action programmes targeting NEET young people, can help them move into employment or training.28
We know that a young person who has had access to high quality long-term engagement with an employer or employees is more likely to align their achievement at school with their future career and hence make it less likely that they will be NEET.

36 FEA Report Card 2016/17
Impact Goal FiveNarrow the gap in university graduation, including from the
25% most selective universities
The gap
In 2016, the gap in university entry between young people from low-income families and their more affluent peers increased fractionally; this was the first increase in the gap since 2010. The gap is defined by the relative chance of attending university for children who were eligible for free school meals compared with other children. Young people from more affluent families are currently just over twice as likely to enter university as young people from disadvantaged backgrounds (2.14 times as likely, increased from 2.10 times as likely in 2015). In 2006, young people from more affluent families were almost three times as likely as young people from low-income families to attend university (2.97 times); over the intervening decade the gap has fallen by 28 percent despite the small increase in the latest year.
The national picture
The percentage of those whose families had low incomes during school starting university in 2016 stalled at 16 percent (roughly one in six) following three years of uninterrupted increases. However, the percentage of their more affluent peers entering university continued to rise from 33 percent in 2015 to 35 percent in 2016 (just over one in three), causing the gap to increase. We include those who attended independent schools in the ‘more affluent’ group in these figures, but participation also increased from 32 percent to 33 percent for more affluent children from state schools.
Looking at the most selective universities, UCAS reports that children from more affluent families from state schools were almost four times as likely as young people from low-income families (3.8 times) to go on to join a higher-tariff university in 2016.29 Only 2.5 percent, or one in forty children who were eligible for free school meals, went on to one of these higher-tariff institutions, compared with 9.5 percent, or almost one in ten better-off children. The gap in the relative chance of entry to a higher-tariff university is unchanged from 2015.

37FEA Report Card 2016/17
5
Children from more affluent families from state schools were almost
four times as likely as young people from low-income families
(3.8 times) to go on to join a higher-tariff university in 2016
Almost four in ten children from London (39.9 percent) went on to university in 2016
Fewer than three in ten from the South West (28.2 percent) went on to university in 2016
4x

38 FEA Report Card 2016/17
The regional picture
Entry rates to university also depend on where in the country children have grown up22. Almost four in ten children from London (39.9 percent) went on to university in 2016, compared with fewer than three in ten from the South West (28.2 percent), North East (28.9 percent), and East Midlands (29.8 percent). Over the last year, entry to university has grown faster proportionally in the East than the West side of the country, led by the East Midlands (up 5.3 percent) and the East of England (up 4.5 percent). Growth was smallest in the South West (up 2.2 percent) and the North West (up 2.9 percent).
Alliance efforts to close the gap
There are challenges in addressing the access gap at all universities, but it remains most acute at highly-selective universities. Figures for 2016 may have been affected by the growing number of alternative options for high-performing 18-year-olds, including degree and higher level apprenticeships. We will look for evidence to see if that is the case.
Universities are aware of these challenges and are investing considerable resource, alongside schools, colleges and third sector organisations to address them. More needs to be done to co-ordinate interventions and directly address some of the most stubborn issues. If we truly want to accelerate progress towards this Impact Goal the sector should embrace the evaluation of widening participation activity, based on a common set of sector-wide data, benchmarks and metrics, to more accurately measure impact on young people’s attainment and behaviour.
It is also important to remember that the attainment of pupils from low-income backgrounds is a major barrier to progression. Existing evidence shows that interventions that start young, are long term, and contribute to a rise in attainment, have the best chance of making an impact on pupil progression.
Finally, where there is a clear gap in participation between the most and least disadvantaged pupils universities need to be supported to make the best use of contextual data. The Alliance has committed to working with a variety of institutions to examine the long-term impact of this approach to admissions.

3939
If we truly want to accelerate progress towards this Impact Goal the sector should embrace the evaluation of widening participation activity, based on a common set of sector-wide data, benchmarks and metrics, to more accurately measure impact on young people’s attainment and behaviour.
FEA Report Card 2016/17

40 FEA Report Card 2016/17
Conclusion
Modest progress has been made towards closing the gap between young people from the most disadvantaged communities and their wealthier peers. However, once again, the progress made has varied across the country and some children still do not have access to a fair education.
The gap in primary school literary and numeracy has decreased, as has the gaps in GCSE attainment and young people going on to a ‘positive destination’. The gap in permanent and fixed period exclusions still remains stubbornly wide and the gap in university entry has increased for the first time since 2010. Our conclusion is that too many children and young people in our education system are being left behind. We need to act with speed to address this. The national focus on our negotiations with the European Union should not distract our leaders from tackling the inequality that exists in our education system.
The Alliance has identified areas that require attention if we are to meet the 2022 Fair Education Impact Goals. These include school funding, careers, selection, social and emotional competencies, and early years. The schools system must be adequately funded with national spending increasing in real terms on a per pupil basis. We must recognise social and emotional competencies as a critical lever in boosting attainment and social mobility and we have to prioritise the development of the early education workforce. Schools should look to having a designated senior leader responsible for developing a whole school approach to destinations in every school. After bringing the sector together against the proposals, we welcome the decision to drop plans to expand selective education as evidence strongly suggested that this would have resulted in a widening of the gap. At a grassroots level, schools must ensure that the programmes they introduce to their schools are backed by demonstrable evidence of what works.
In this period of political and economic uncertainty, it is now more important than ever to ensure that all children and young people have access to a high quality education – where their socioeconomic background does not determine their achievement in literacy and numeracy at primary school, their GCSE attainment, their ability to develop key strengths and be socially and emotionally healthy, their chances of ending up in a ‘positive destination’ post-GCSE, or their entry into higher education.

FEA Report Card 2016/17 41
Appendix: Methodology
The socio-economic gap
The gap for Impact Goals 1, 2 and 4 is measured between children at schools serving low- and high-income communities. Schools serving low-income communities are defined by the FEA as those where 50% of pupils or more live in the most deprived 30% of neighbourhoods, measured using IDACI. Schools serving high-income communities are those where 50% of pupils or more live in the least deprived 30% of neighbourhoods.
» IDACI update: IDACI was updated in 2015 using data from the tax year 2012-13, resulting in changes to which areas appear in the top and bottom 30% of neighbourhoods. The government’s consultation on the schools national funding formula identified large changes in IDACI at school level as a result of the update. We have used 2015 IDACI scores to define low- and high-income neighbourhoods for all years in the time series, to avoid changes to the schools and areas in each group affecting the measure’s stability.
» Pupil coverage: The percentage of pupils at each school living in the most- or least-deprived 30% of IDACI areas is calculated based on pupils at the end of the relevant key stage. This is key stage 2 (year 6) for Impact Goal 1, key stage 4 (year 11) for Impact Goal 2, and key stage 4 (year 11) for Impact Goal 4.
» Neighbourhood definition: IDACI deciles are calculated at the lower-level super output area (LSOA), which contains around 1,500 people per LSOA.
The gap for Impact Goal 3 is measured between children who were eligible for free school meals in the year in which exclusions took place, and those who were not.
The gap for Impact Goal 5 is measured between children who were eligible for free school meals at age 15 and those who were not.
The gap in months (Impact Goals 1 and 2)
Two assessment changes affect the time series for Impact Goal 1 (primary literacy and numeracy):
» Writing assessment: This changed from tests to teacher assessments in 2012. Results prior to 2012 are not strictly comparable with those from 2012 onwards. The assessment change could have contributed to the larger-than-usual increase in results in 2012.
» New curriculum and assessments: pupils were tested against the new national curriculum for the first time in 2016.30 The new assessments may prove to test a different range of abilities from their predecessors and to provide more or less granular outcomes. The new scaled scores may therefore have a different distribution, and one that changes as the assessments bed in.
Three assessment and accountability changes affect the time series for Impact Goal 2 (GCSE attainment):
» Wolf reforms to vocational qualifications: The Wolf reforms in 2014 changed the calculation of the GCSE points scores, stripping out many previously GCSE-equivalent qualifications, capping the number of non-GCSEs counted and reducing the weighting of many non-GCSE qualifications. As well as the changes to the statistical rules used by the Department for Education, schools made resulting changes to the qualifications they enter pupils into.
» GCSE first entry rule: In 2014, the counting of GCSE grades was changed so that each pupil’s best grade in each subject was replaced with their first entry in each subject, for EBAcc subjects. This change was expected to widen the disadvantage gap because pupils with low prior attainment previously benefitted from entering GCSE maths and/or English more than once, whereas middle and high attainers did not benefit from the practice. Therefore, the change is likely to have impacted negatively on low prior attainers, and on average attainment for disadvantaged children. The impact of this change on the gap is staggered across 2014-2016 GCSE results as some early entries sat before the change was announced were allowed to count in 2014 but not in 2015 or subsequent years.

42 FEA Report Card 2016/17
» GCSE reforms: starting with the 2017 GCSE results, pupils are sitting reformed English and maths GCSEs under a new curriculum and grade structure. The new 9-1 grading will increase the differentiation between the highest and lowest attainers, with the likely result of increasing the gap for disadvantaged pupils. Similar reforms will take place in all other GCSE subjects in two further waves beginning from 2018 and 2019 results. While English and maths will affect the vast majority of all pupils, a larger proportion of each pupil’s average score will be affected in 2018 and/or 2019 for most pupils. Because pupils enter different numbers and combinations of GCSE subjects, and both of these differ on average for disadvantaged pupils, it is difficult to predict with confidence when the greatest impact will be felt.
In response to this series of changes, the Alliance has adopted a new methodology for measuring the gap in primary and GCSE attainment. Instead of reporting differences in the percentage of pupils achieving expected levels of attainment, the new measures use a statistical method called the mean rank difference, which is much more stable and reliable for comparing different assessments. This method has previously been used by the Department for Education and the EPI’s Annual report for 2017.
» Calculation: Raw point scores are ranked from highest to lowest for all pupils, and an average decimal rank for each group is calculated.
» Interpretation: The resulting index will always be greater than zero as long as schools serving the most deprived communities have lower average attainment than schools serving the least deprived communities. The basing of the index on rank positions creates a comparable scale for different assessments and ages.
» Units: This measure is expressed in units of months of development based on a multiplier for each decimal rank place. The multiplier is derived from a standardised score that equates one year of development with approximately 0.4 standard deviations at age 16.25 (the average age at which pupils sit GCSEs is 195 months). The effect size of 0.4 standard deviations is drawn from empirical findings for one year of academic progress.31,32
» Attainment scores used (primary): In Impact Goal 1, the average of the fine-graded point scores in reading and maths is used for years prior to 2016, and the average of the scaled scores for reading and maths is used for 2016. Writing is excluded from the measure because it does not contribute meaningful differentiation between pupils over and above the reading and maths scores, due to the small number of teacher assessment categories.
» Attainment scores used (GCSE): In Impact Goal 2, the GCSE-only average grade for each pupil is used. This minimises changes due to the Wolf reforms by only including grades in actual GCSEs and not equivalent qualifications, while providing a wider basis than English and maths.

FEA Report Card 2016/17 43
Impact Goal 3
Impact Goal 3 is currently based on the Department for Education’s school exclusions data.11
Impact Goal 4
Impact Goal 4 is based on the Department for Education’s Destinations data, published at school level in underlying data files.16 These are matched with data from the National Pupil database defining schools serving low-income communities and schools serving high-income communities, as detailed above.
Impact Goal 5
Entry rates to higher education are provided by UCAS and are based on English 18 year-old pupils:
» Sources: For pupils attending state schools in England, administrative data sets record whether an individual is eligible for free school meals. Linking these pupil data sets (source: National Pupil Database and School Census, Department for Education) to the UCAS admissions data allows the calculation of entry rates by these categories recorded in the pupil data sets when the applicant was age 15.
» Data matching: A conservative linking method has been used, that requires a full match across a range of identifying details to English domiciled UCAS applicants. This necessarily makes the entry rate lower than the true value (for example, ambiguous matches are not used). The linking method, and differences in scope between the two data sources, introduces some uncertainty into these linked entry rates.
» Independent school pupils: Pupils in independent schools are typically missing FSM information irrespective of whether they are eligible or not. For the purposes of this analysis, all independent school pupils are assumed to not be in receipt of free school meals. This will not be accurate in every case, but is the most plausible assumption that can be made within the limitations of the data.

44 FEA Report Card 2016/17
Footnotes and References
1 The terms ‘disadvantaged’ or ‘children from low income families’ are defined by the pupil’s Free School Meals status.
2 www.primecommitment.org
1 As a result of changes to the Key Stage 2 assessments, it is not possible to measure changes in the gap before and after 2016 by looking at the percentages of children achieving the expected levels. New measures that are better at giving a reliable picture of changes in the gap have been introduced in this Report Card. More details can be found in the main body of the report and in the methodology appendix.
2 As a result of multiple reforms to GCSEs and equivalent qualifications, and to the official attainment measures calculated by the Department of Education, it is no longer possible to measure changes in the gap by looking at percentages of children achieving a threshold, such as five good GCSEs including English and maths. New measures have been introduced in this Report Card, and these are detailed in the main body of the report and in the methodology appendix.
3 For Impact Goal 3, ‘children from low-income families’ refers to those who were eligible for free school meals in the year in which they were excluded.
4 For Impact Goal 5, ‘children from low-income families’ refers to those who were eligible for free school meals at age 15.
5 This statistical method was introduced by the Department for Education in its ‘disadvantaged pupils attainment gap index’, which measures the gap in English and maths grades for disadvantaged pupils who are eligible for the Pupil Premium.
6 UNICEF (2007) Child poverty in perspective: An overview of child well-being in rich countries. UNICEF Innocenti Research Centre Report Card 7 C, Florence: UNICEF. https://www.unicefirc.org/publications/pdf/rc7_eng.pdf
7 UNICEF (2013) Child well-being in rich countries: a comparative overview. UNICEF Office of Research Report Card 11, Florence: UNICEF. https://www.unicefirc.org/publications/pdf/rc11_eng.pdf
8 OECD (2017) PISA 2015 Results (Volume III): Students’ well-being. Paris: OECD. http://www.oecd.org/edu/pisa-2015-results-volume-iii-9789264273856-en.htm
9 Gutman, L. et al. (2015) Children of the new century: Mental health findings from the Millennium Cohort Study. London: Centre for Mental Health. https://www.centreformentalhealth.org.uk/children-of-the-new-century
10 Those eligible for free school meals in the year of the exclusion.
11 Department for Education (2016a) Permanent and fixed-period exclusions in England: 2014 to 2015. SFR26/2016. London: DfE. https://www.gov.uk/government/statistics/permanent-and-fixed-period-exclusions-in-england-2014-to-2015
12 Department for Education (2016b) Special Educational Needs in England: January 2016. SFR29/2016, London: DfE. https://www.gov.uk/government/statistics/special-educational-needs-in-england-january-2016
13 Lessof, C. et al. (2016) Longitudinal Study of Young People in England cohort 2: health and wellbeing at wave 2. London: Department for Education. https://www.gov.uk/government/publications/longitudinal-study-of-young-people-in-england-cohort-2-wave-2
14 Pupils eligible for free school meals, living in deprived neighbourhoods, or with parents with low socio-economic status or low levels of education.
15 Ford, T. et al. (2008), in Cole, T. (2015) Mental Health Difficulties and Children at Risk of Exclusion from Schools in England: A review from an educational perspective of policy, practice and research, 1997 to 2015. Oxford: University of Oxford. http://www.education.ox.ac.uk/wordpress/wp-content/uploads/2015/02/MENTAL-HEALTH-AND-EXCLUSION-FINAL-DIGITAL-13-06-15.pdf
16 Coghill (2013), in Cole, T. (2015) Mental Health Difficulties and Children at Risk of Exclusion from Schools in England: A review from an educational perspective of policy, practice and research, 1997 to 2015. Oxford: University of Oxford. http://www.education.ox.ac.uk/wordpress/wp-content/uploads/2015/02/MENTAL-HEALTH-AND-EXCLUSION-FINAL-DIGITAL-13-06-15.pdf
17 Smith, R. et al. (2017) NFER Teacher Voice Omnibus. London: National Foundation for Educational Research. https://www.gov.uk/government/publications/teacher-voice-omnibus-may-to-july-2016-survey-dfe-questions
44 FEA Report Card 2016/17
FEA Report Card 2016/17 45
18 Goodman, A. et al. (2015) Social and emotional skills in childhood and their long-term effects on adult life: a review for the Early Intervention Foundation. London: UCL Institute of Education. http://www.eif.org.uk/wp-content/uploads/2015/03/EIF-Strand-1-Report-FINAL1.pdf
19 Weare, K. and Nind, M. (2011) ‘Mental health promotion and problem prevention in schools: what does the evidence say?’ Health Promotion International, 26(1), i29-69.
20 Gutman, L. and Schoon, I. (2013) The impact of non-cognitive skills on outcomes for young people: Literature review. London: Education Endowment Foundation. https://educationendowmentfoundation.org.uk/public/files/Publications/EEF_Lit_Review_Non-CognitiveSkills.pdf
21 Goswami, U. and Bryant, P. (2007) Children’s Cognitive Development and Learning: Interim Report. Cambridge Primary Review, Cambridge: University of Cambridge. http://www.specialpedagogy.info/modules/Module-1.1-Understanding-the-child-development-and-difficulties/C/downloads/m01p030c/primary_review_21a_report_cognitive_development_learning_071214.pdf
22 The source for the Impact Goal 4 measure is EPI analysis of the National Pupil Database and the following DfE statistical releases:
SFR19/2014: Destinations of key stage 4 and key stage 5 students, 2011/12 (experimental statistics) https://www.gov.uk/government/statistics/destinations-of-key-stage-4-and-key-stage-5-pupils-2011-to-2012
SFR01/2015: Destinations of key stage 4 and key stage 5 students, 2012/13 (experimental statistics) https://www.gov.uk/government/statistics/destinations-of-key-stage-4-and-key-stage-5-pupils-2012-to-2013
SFR05/2016: Destinations of key stage 4 and key stage 5 students in state-funded and independent institutions, England, 2013/14 https://www.gov.uk/government/statistics/destinations-of-ks4-and-ks5-pupils-2013-to-2014
SFR01/2017: Revised destinations of key stage 4 and key stage 5 students, England, 2014/15 https://www.gov.uk/government/statistics/destinations-of-ks4-and-ks5-pupils-2015-revised
23 Allen, R., Meenakshi, P. and Thomson, D. (2016) Social and ethnic inequalities in choice available and choices made at age 16. London: Social Mobility Commission. https://www.gov.uk/government/publications/social-and-ethnic-inequalities-in-post-16-choices
24 Business in the Community (2015) Destiny should not be determined by Demography: Building alignment between the classroom and the boardroom. London: Business in the Community. http://www.bitc.org.uk/our-resources/report/destiny-should-not-be-determined-demography
25 CBI (2016) THE RIGHT COMBINATION CBI/PEARSON EDUCATION AND SKILLS SURVEY 2016. London: Confederation of British Industry. http://www.cbi.org.uk/cbi-prod/assets/File/pdf/cbi-education-and-skills-survey2016.pdf
26 McKnight, A. (2015), Downward mobility, opportunity hoarding and the ‘glass floor’. London: Social Mobility and Child Poverty Commission https://www.gov.uk/government/uploads/system/uploads/attachment_data/file/447575/Downward_mobility_opportunity_hoarding_and_the_glass_floor.pdf
27 Millard, W., Menzies, L. and Baar, S. (2017), Enterprise Skills: Teachability, Measurability and Next Steps, LKMco & Enabling Enterprise.
28 Brown, J. (2016) NEET: Young People Not in Education, Employment or Training. London: House of Commons Library http://researchbriefings.parliament.uk/ResearchBriefing/Summary/SN06705#fullreport
29 UCAS (2016) End of Cycle Report 2016. Cheltenham: UCAS Analysis and Research. https://www.ucas.com/corporate/data-and-analysis/ucas-undergraduate-releases/ucas-undergraduate-analysis-reports/ucas-undergraduate-end-cycle-reports
30 See details of the changes at: http://epi.org.uk/analysis/key-stage-2-assessments-2016-look/ and discussion of the interim results at: http://epi.org.uk/analysis/key-stage-2-assessments-2016-interim-results-mean/
31 Wiliam, Dylan. (2010) ‘Standardized testing and school accountability’. Educational Psychologist, 45 (2). pp. 107-122.
32 Department for Education and Skills (2004), Statistics of Education: Variation in Pupil Progress 2003. Statistical Bulletin SB02/04, London: DfES.
FEA Report Card 2016/17 45

46 FEA Report Card 2016/17
The Fair Education Alliance Members & Supporters

FEA Report Card 2016/17 47

faireducation.org.uk © Copyright Fair Education Alliance 2016/17