report 1. documentation page de - fc 21 - 92mc29077 library/research/oil-gas/natural gas... ·...
TRANSCRIPT

ReportDocumentation Page
1. Report No.DE - FC 21 - 92MC29077
2. 3. Recipient's Accession No.
5. Report DateAugust 31, 2000
4. Title and Subtitle
Fracturing Fluid Characterization Facility6.
7. Author(s)The University of Oklahoma
8. Performing Organization Rept. No.
10. Project/Task/Work Unit No.9. Performing Organization Name and AddressThe University of OklahomaSarkeys Energy Center T301100 E Boyd StNorman, OK 73019
11. Contract (C) or Grant (G) No.DOE:DE FC21 92 MC29077
13. Type of Report & Period CoveredFinal Report09 30 92 – 03 31 00
12. Sponsoring Organization Name and AddressUS Dept of Energy - FETL3610 Collins Ferry RoadMorgantown, WV 26505
14.15. Supplementary NotesSeveral technical papers were prepared and presented at various Society of Petroleum Engineers Conferences and USDepartment of Energy Conferences. Aggressive efforts were also made to effectively transfer the past research results to theindustry
16. Abstract (limit 200 words)Hydraulic fracturing technology has been successfully applied for well stimulation of low and high permeability reservoirs for numerousyears. Treatment optimization and improved economics have always been the key to the success and it is more so when the reservoirsunder consideration are marginal. Fluids are widely used for the stimulation of wells. The Fracturing Fluid Characterization Facility(FFCF) has been established to provide the accurate prediction of the behavior of complex fracturing fluids under downhole conditions.The primary focus of the facility is to provide valuable insight into the various mechanisms that govern the flow of fracturing fluids andslurries through hydraulically created fractures.
During the time between September 30, 1992, and March 31, 2000, the research efforts were devoted to the areas of fluidrheology, proppant transport, proppant flowback, dynamic fluid loss, perforation pressure losses, and frictional pressurelosses. In this regard, a unique above-the-ground fracture simulator was designed and constructed at the FFCF, labeled“The High Pressure Simulator” (HPS).
The FFCF is now available to industry for characterizing and understanding the behavior of complex fluid systems. Tobetter reflect and encompass the broad spectrum of the petroleum industry, the FFCF now operates under a new name of“The Well Construction Technology Center” (WCTC).
This report documents the summary of the activities performed during 1992 – 2000 at the FFCF17. Document Analysis a. Description Oil and Gas Industry, Natural Gas Production, Hydraulic Fracturing, Reservoir Characterizationb. Identifiers/Open-Ended TermsHydraulic Fracturing, Proppant Transport, Proppant Flowback, Fluid Rheology, Fluid Leak-Off, Fluid characterization, Slurries, Non-Neutonian Fluidsc. COSATI Field/Group
19. Security Class(This Report)
21. No. of Pages18. Availability Statement
Release Unlimited 20. SecurityClass (ThisPage)
22. Price

ii
FRACTURING FLUID CHARACTERIZATION FACILITY
FINAL REPORT
September 30, 1992 - March 31, 2000
SUBMITTED BY
The University of OklahomaMewbourne School of Petroleum and Geological Engineering
Energy Center, T 301100 East Boyd
Norman, Oklahoma 73019-0628
for
UNITED STATES DEPARTMENT OF ENERGYFederal Energy Technology Center
3610 Collins Ferry RoadMorgantown, WV 26505
Cooperative Agreement No. DE-FC21-92MC29077DOE Manager: Anthony Zammerilli
August 2000

iii
DEPARTMENT OF ENERGY DISCLAIMER
This report was prepared by The University of Oklahoma (OU) as anaccount of work sponsored, in part, by U.S. Department of Energy (DOE) ,Financial Assistance Award DE-FC21-92MC29077. Such support does notconstitute an endorsement by DOE of the information contained in thisreport.
UNIVERSITY OF OKLHAOMA DISCLAIMER
"LEGAL NOTICE"
This report was prepared by The University of Oklahoma as an account ofwork sponsored by the U.S. Department of Energy (DOE). Neither DOEmembers of DOE, The Board of Regents of The University of Oklahoma,nor any person acting on behalf of the aforementioned;(a) makes any warranty or representation, express or implied, with respect
to the accuracy, completeness, or usefulness of the informationcontained in this report, or that the use of any information, apparatus,method, or process disclosed in this report may not infringe privatelyowned rights; or,
(b) assumes any liability with respect to the use of, or for damages resultingform the use of any information, apparatus, method, or processdisclosed in this report.
iv
CONTRIBUTORS
The following authors have contributed to the preparation of the FracturingFluid Characterization Facility (FFCF) Annual Report:
Hyun ChoNaval Goel
Sudhakar KhadeMax Mefford
Ameet RaichukarNaim SaddiqSubhash ShahYunxu Zhou
ACKNOWLEDGEMENTS
The FFCF Research Team at The University of Oklahoma wish to thank the U.S.Department of Energy for their continued support of this project.

v
TABLE OF CONTENTS
Executive Summary................................................................................................... xiv
Chapter 1 INTRODUCTION AND BACKGROUND....................................... 1-11.1 Summary................................................................................ 1-11.2 Contractor Proposal................................................................ 1-11.3 Contractor/Subcontractor Team Approach............................ 1-21.4 Gas Industry Benefits............................................................. 1-5
Chapter 2 HIGH PRESSURE FRACTURE SIMULATOR............................... 2-12.1 Introduction........................................................................... 2-12.2 Design of Fracture simulator................................................. 2-12.3 Design and Construction of High Pressure Simulator .......... 2-22.4 Verification of Testing and Acceptance................................ 2-4
Chapter 3 FFCF CAPABILITIES....................................................................... 3-13.1 Summary................................................................................ 3-13.2 FFCF Research Capabilities................................................... 3-13.3 Equipment and Facilities........................................................ 3-4
Chapter 4 INSTRUMENTATION ..................................................................... 4-14.1 Introduction............................................................................ 4-14.2 Vision System......................................................................... 4-14.3 Laser Doppler Velocimetry (LDV)........................................ 4-44.4 HPS Control System............................................................... 4-64.5 Differential Pressure Transducers .......................................... 4-64.6 Rheological Characterization (Instruments and Capabilities) 4-7
Chapter 5 DATA ACQUISITION...................................................................... 5-15.1 Introduction............................................................................ 5-15.2 Data Logger System............................................................... 5-15.3 Vision System......................................................................... 5-25.4 Laser Doppler Velocimetry (LDV) System........................... 5-7
Chapter 6 LABORATORY RHEOLOGY INSTRUMENTS ............................ 6-16.1 Introduction............................................................................ 6-16.2 Model 35 Fann Viscometer.................................................... 6-16.3 Nordman Rheometer.............................................................. 6-26.4 Bohlin Rheometer .................................................................. 6-46.5 Foam Flow Loop .................................................................... 6-76.6 Plexiglass Parallel Plate Slot.................................................. 6-9
Chapter 7 RESEARCH RESULTS AND IMPLICATIONS ............................. 7-17.1 Introduction............................................................................ 7-1
vi
7.2 Correlating Proppant Transport with Fluid Rheology............ 7-17.3 Proppant Transport................................................................. 7-207.4 Fluid Rheology....................................................................... 7-267.5 LDV Study ............................................................................. 7-337.6 Foam Fluid Rheology............................................................. 7-427.7 Heat Transfer.......................................................................... 7-497.8 Proppant Flowback................................................................. 7-527.9 Dynamic Fluid Loss............................................................... 7-567.10 Perforation Pressure Loss....................................................... 7-627.11 Tubular Friction Loss............................................................. 7-697.12 References .............................................................................. 7.817.13 Nomenclature ......................................................................... 7.83
Chapter 8 COILED TUBUING CONSORTIUM............................................... 8-18.1 Introduction............................................................................ 8-18.2 The Mission of Coiled Tubing Consortium............................ 8-18.3 Membership............................................................................ 8-18.4 Experimental Setup and Procedure ........................................ 8.18.5 Laboratory Rheology.............................................................. 8-38.6 Accomplishments of CTC – Phase I...................................... 8-48.7 Accomplishments of CTC – Phase II..................................... 8-78.8 Future Research Plans ............................................................ 8-10
Chapter 9 TECHNOLOGY DISSEMINATION................................................ 9-19.1 Introduction............................................................................. 9-19.2 Technology Dissemination...................................................... 9-1
Chapter 10 COMMERCIALIZATION OF FFCF................................................ 10-110.1 Introduction ........................................................................... 10-110.2 Formation of OU FFCF Commercia lization Committee ...... 10-110.3 Feasibility Study for the FFCF .............................................. 10-210.4 Name Change of the Facility ................................................. 10-210.5 Plans for Expansion and Acquisition of Equipment for
Extended Capabilities............................................................. 10-310.6 Client Testing ........................................................................ 10-310.7 Other Commercialization Activities ...................................... 10-4
Appendix A FINAL REPORT FROM MTS REGARDING THE FRACTURINGFLUID CHARACTERIZATION FACILITY ................................... A-1A.1 Overall Project Objective....................................................... A-1A.2 Summary of Work.................................................................. A-1A.3 Specific Objectives................................................................. A-1A.4 Work Performed..................................................................... A-1A.5 Delivery of the Prototype Hardware ...................................... A-3A.6 Low Pressure System............................................................. A-4

vii
Appendix B FINAL SUBCONTRACTOR REPORT FROM HALLIBURTONENERGY SERVICES........................................................................ B-1B.1 Overall Project Objective....................................................... B-1B.2 Scope Of Activities ................................................................ B-1B.3 Work Performed..................................................................... B-2

viii
LIST OF FIGURES
Figure 2.1 High Pressure Fracture Simulator.......................................... 2-3
Figure 2.2 Perforation and Platen Layout in the HPS ............................. 2-4
Figure 3.1 Coiled Tubing System ........................................................... 3-6
Figure 3.2 Rig Floor of the Drilling Rig Simulator................................. 3-7
Figure 3.3 Control Room for the Drilling Rig Simulator ........................ 3-8
Figure 3.4 Triplex Plunger Pump ............................................................ 3-9
Figure 3.5 Double Pipe Heat Exchanger ................................................. 3-10
Figure 3.6 Wellbore Simulator at a Deviated Angle of 45o .................... 3-11
Figure 4.1 An Array of LEDs and Fibers Installed on the HPS .............. 4-2
Figure 4.2 The 11x11 Fiber Bundle to Capture Fluid Flow Image Acrossthe Platen................................................................................ 4-3
Figure 4.3 Raw Fluid Flow Image Obtained with the Vision System..... 4-3
Figure 4.4 LDV Data Acquisition........................................................... 4-5
Figure 4.5 Equipment Setup for Foam Rheology Measurements............ 4-8
Figure 5.1 The Vision System................................................................. 5-3
Figure 5.2 Fiber Optic Outlets in the HPS............................................... 5-4
Figure 5.3 A Schematic of Data Acquisition System for Vision System 5-5
Figure 5.4 Raw Image of Slot Acquired by the Vision Systems............. 5-6
Figure 5.5 Algorithm Flow Chart to Process Raw Image ....................... 5-6
Figure 5.6 Processed Image of Figure 5.2 ............................................... 5-7
Figure 5.7 Velocity Profile for Flow of Linear HPG Solution through aGap of 0.25"........................................................................... 5-8
Figure 6.1 Nordman Rheometer.............................................................. 6-2
Figure 6.2 Dynamic Loading System Designed for the Nordman Rheometer .............................................................................. 6-3
Figure 6.3 Bohlin Rheometer .................................................................. 6-4
Figure 6.4 Schematic of High Pressure Cell............................................ 6-6
Figure 6.5 Modified HPC with Dynamic Sample Loading Capability.... 6-7
Figure 6.6 Foam Flow Loop ................................................................... 6-8
Figure 6.7 Equipment Setup for Foam Rheology Measurements ........... 6-9
Figure 7.2.1 A Schematic of the Equipment Setup for Large Scale Testing 7-2
Figure 7.2.2 Linear Viscoelastic Properties of Borate-Cross Linked

ix
35 lb/Mgal Guar pH 9.0 75 °F, Prepared at DifferentCrosslinker Concentrations…................................................ 7-3
Figure 7.2.3 Settling of 2 ppg Slurry in Borate-Crosslinked 35 lb/MgalGuar, pH 9.0 75 °F, Prepared at Different CrosslinkerConcentrations........................................................................ 7-4
Figure 7.2.4 Sand Concentration (ppg) in the HPS after 5 and 20 minsof 2 ppg Slurry Transport with Borate-Crosslinked35 lb/Mgal Guar pH 9.0 at 1.75 lb/Mgal, 75 °F ……............ 7-5
Figure 7.2.5 Sand Concentration (ppg) in the HPS after 5 and 20 minsof 2 ppg Slurry Transport with Borate-Crosslinked35 lb/Mgal Guar pH 9.0 at 6.0 lb/Mgal, 75 °F ..................... 7-6
Figure 7.2.6 Linear Viscoelastic Properties of Borate-Cross Linked35 lb/Mgal Guar pH 10.0, 75 °F, Prepared at DifferentCrosslinker Concentrations…................................................ 7-7
Figure 7.2.7 Settling of 2 ppg Slurry in Borate-Crosslinked 35 lb/MgalGuar pH 10.0, 75 °F, Prepared in Different CrosslinkerConcentrations........................................................................ 7-8
Figure 7.2.8 Sand Concentration (ppg) in the HPS after 5 and 15 minsof 2 ppg Slurry Transport with Borate-Crosslinked35 lb/Mgal Guar pH 10.0 at 0.5 lb/Mgal, 75 °F .................... 7-9
Figure 7.2.9 Linear Viscoelastic Properties of Borate-Cross Linked35 lb/Mgal Guar pH 11.0, 75°F, Prepared at DifferentCrosslinker Concentrations…................................................ 7-10
Figure 7.2.10 Sand Concentration (ppg) in the HPS after 5 and 20 minsof 2 ppg Slurry Transport with Borate-Crosslinked35 lb/Mgal Guar pH 11.0 at 0.45 lb/Mgal, 75 °F................... 7-11
Figure 7.2.11 Comparison of G’ And G Values in Linear 100 lb/MgalGuar and in a Borate-Crosslinked 35 lb/Mgal Guar GelsPrepared at Different pHs at 75°F.......................................... 7-12
Figure 7.2.12 Sand Concentration (ppg) in the HPS after 5 and 20 mins of2 ppg Slurry Transport with Linear 100 lb/Mgal Guar, 75 °F 7-13
Figure 7.2.13 Linear Viscoelastic Properties of Borate-Cross Linked40 lb/Mgal Guar, pH 11.5, Prepared at DifferentCrosslinker concentrations, 130 °F ........................................ 7-15
Figure 7.2.14 Sand Concentration (ppg) in the HPS after 5 and 20 minsof 2 ppg Slurry Transport with Borate-Crosslinked40 lb/Mgal Guar, pH 11.5 at 1.1 lb/Mgal, 130 °F ................. 7-16
Figure 7.2.15 Sand Concentration (ppg) in the HPS after 5 and 20 minsof 8 ppg Slurry Transport with Borate-Crosslinked35 lb/Mgal Guar, pH 9.0 at 5.0 lb/Mgal, 75 °F ..................... 7-17

x
Figure 7.2.16 Sand Concentration (ppg) in the HPS after 5 and 15 minsof 8 ppg Slurry Transport with Borate-Crosslinked35 lb/Mgal Guar, pH 10.0 at 0.6 lb/Mgal, 75 °F.................... 7-18
Figure 7.2.17 Comparison of Elastic Moduli of Gels with SatisfactoryProppant Transport................................................................. 7-19
Figure 7.3.1 (Top) A Typical Sequence of Fluid Injection(Bottom) Various Perforation Configurations along theHPS Height............................................................................. 7-21
Figure 7.3.2 Convective Downward Velocity of Encapsulated 6 ppgSlurry into 35 lb/Mgal Borate-Crosslinked at VariousFracture Widths...................................................................... 7-22
Figure 7.3.3 Proppant Concentration within Two Halves of EncapsulatedSlurry a) During Initial 400 Seconds b) In Final 250 secs... 7-22
Figure 7.3.4 Settling Rate as a Function of Shear Rate for 35 lb/MgalGuar Linear Gel...................................................................... 7-23
Figure 7.3.5 Proppant Settling as a Function of Shear Rate for 7.3 ppgSlurry of Borate-Crosslinked 35 lb/Mgal Guar Gel in0.375 in. Fracture Width........................................................ 7-24
Figure 7.3.6 Relationship Between Bed Erosion and Fluid Flow Ratefor 40 lb/Mgal HPG................................................................ 7-24
Figure 7.4.1 Rheology Characterization from Experiments Performed on Different days on Borate-Crosslinked 35 lb/Mgal GuarGel at 150 oF and No Shear Preconditioning ........................ 7-27
Figure 7.4.2 Rheology Data of Borate-Crosslinked 35 lb Guar/Mgalfor pH 9.0 at Various Temperatures and Shear Histories ...... 7-28
Figure 7.4.3 Rheology Data of Borate-Crosslinked 35 lb Guar/Mgalfor pH 10.0 at Various Temperatures and Shear Histories .... 7-28
Figure 7.4.4 Rheology Data of Borate-Crosslinked 35 lb Guar/Mgalfor pH 11.0 at Various Temperatures and Shear Histories .... 7-29
Figure 7.4.5 Apparent Viscosity at Various pHs and Temperaturesfor the Borate-Crosslinked 35 lb/Mgal Guar Gel at 65 sec-1
Shear Rate and 5 min Shear History at 1400 sec-1 ................. 7-29
Figure 7.4.6 Comparison of Correlation Calculated Viscosities withExperimentally Obtained Values of Borate-Crosslinked35 lb /Mgal Guar for pH 9.0................................................... 7-31
Figure 7.5.1 Velocity Profiling by LDV..................................................... 7.35
Figure 7.5.2 LDV Reading Locations......................................................... 7.35
Figure 7.5.3 Gap Size Distribution of Slot................................................. 7.37
Figure 7.5 4 Location E, 40 lb/Mgal HPG, q =4.08 gpm, n = 0.464.......... 7-37

xi
Figure 7.5.5 First Multirate Experiment Showing Plug Flow at 0.6 gpm.. 7-38
Figure 7.5.6 Second Multirate Experiment 40 lb/ Mgal Xanthan, n =0.33 7-39
Figure 7.5.7 Comparison Between the Two Flow Rates 1.30 and 1.05 gpm................................................................................................ 7-39
Figure 7.5.8 LDV Application for Proppant-Laden Fluid (1 ppg) at3.0 gpm................................................................................... 7-40
Figure 7.5.9 LDV Application for Proppant-Laden Fluid(2 ppg) at q = 3.20 gpm.......................................................... 7-41
Figure 7.6.1 Effects of Quality on Apparent Viscosity of 0.5% (wt.)Guar Foam Prepared Using 0.5 % (Vol.) Howcosuds ......... 7-44
Figure 7.6.2 Effect of Liquid Phase Composition on Viscosity of a60 % Quality Foam................................................................. 7-45
Figure 7.6.3 Effect of Foamer Concentration on Viscosity of 0.5 % (wt.)Guar Foam of 50 % Quality................................................... 7-45
Figure 7.6.4 Relative Consistency Index for 20 lb/ Mgal Xanthan Foam.. 7-46
Figure 7.6.5 Yield Stress as a Function of Quality for 20 lb/Mgal XanthanFoam....................................................................................... 7-47
Figure 7.6.6 Apparent Viscosity Comparison for 40 lb/ Mgal XanthanFoam and 40 lb / Mgal Guar Foam at 100 0F......................... 7-48
Figure 7.7.1 Heat Transfer Coefficients of 35 lb/Mgal Guar and HPGat Several Flow Rates............................................................. 7-50
Figure 7.7.2 Heat Transfer Coefficients of Borate-Crosslinked 35 lb/MgalGuar........................................................................................ 7-51
Figure 7.7.3 Heat Transfer Coefficients of Borate-Crosslinked 35 lb/Mgal Guar, pH 10.0......................................................................... 7-51
Figure 7.8.1 Proppant Flowback Initiation/ Pack Stability Tests throughFracture Gap-Widths of 0.16 and 0.40-in. ............................. 7-53
Figure 7.8.2 Percentage of 20/40 Mesh Sand Produced for 0.5 gpm inletWater Flow Rate through Sand Pack of 0.16 and 0.40 -in.Gap Width.............................................................................. 7-54
Figure 7.8.3 Proppant Distribution after 40 minutes of Flowing BackWater at a Rate of 0.5 gpm through a Fracture Width of0.16-in Maintained under a Closure Pressure of 500 psia) After 40 minutes................................................................. 7-54b) After 120 minutes .............................................................. 7-54
Figure 7.9.1 Dynamic Fluid-Loss Test with Borate-Crosslinked35 lb/Mgal Guar..................................................................... 7-59
Figure 7.9.2 Leak-Off Rate During Dynamic Fluid-Loss Tests withBorate-Crosslinked 35 lb/Mgal Guar ..................................... 7-59

xii
Figure 7.9.3 Dynamic Fluid-Loss Test with 60 lb/Mgal HPG+ 25 lb/MgalSi (Synthetic Rock) ................................................................ 7-60
Figure 7.9.4 Dynamic Fluid-Loss Test with Borate-Crosslinked35 lb/Mgal Guar..................................................................... 7-61
Figure 7.10.1 60 lb HPG + 20/40 Mesh Sand; 0.5-in. Perforation Diameter 7-65
Figure 7.10.2 60 lb HPG +10 ppg Sand; 0.5-in. Perforation Diameter ....... 7-66
Figure 7.10.3 60 lb HPG + 20/40 Mesh Sand .............................................. 7-66
Figure 7.10.4 Empirical Model Fit of Experimental Data............................ 7-68
Figure 7.10.5 Cross-section of the Perforation after the Test....................... 7-68
Figure 7.11.1 Friction Factor for Water Flowing in Straight Sectionsof Seamed and Seamless Tubing............................................ 7-71
Figure 7.11.2 Friction Factor for Water Flowing in CT and in aStraight Section of Seamed Tubing........................................ 7-72
Figure 7.11.3 Friction Factor for Linear 35 lb Guar/1000 gal Solution....... 7-73
Figure 7.11.4 Friction Factor for Linear HPG 40 lb/1000 gal Solution....... 7-74
Figure 7.11.5 Pressure Drop in Seamed and SeamlessTubing forBorate-Crosslinked 35 lb Guar/1000 Gal Gel, at pH 9.0and Flow Rate 60 gal/min....................................................... 7-75
Figure 7.11.6 Pressure Drop in Seamed and Seamless Tubing forBorate-Crosslinked 35 lb Guar/1000 gal Gel,at pH 10.0 and Flow Rate 60 gal/min..................................... 7-76
Figure 7.11.7 Pressure Drop in Seamed and SeamlessTubing forBorate-Crosslinked 35 lb Guar/1000 gal Gel, at pH 11.0and Flow Rate 60 gal/min....................................................... 7-76
Figure 7.11.8 Pressure Drop in CT for Borate-Crosslinked 35 lb /1000 galGuar Gel................................................................................. 7-77
Figure 7.11.9 Pressure Drop in Seamed and SeamlessTubing forBorate-Crosslinked 35 lb HPG/1000 gal Gel, at pH 9.0and Flow Rate 60 gal/min....................................................... 7-78
Figure 7.11.10 Pressure Drop in Seamed and Seamless Tubing forBorate-Crosslinked 35 lb HPG/1000 gal Gel, at pH 10.0and Flow Rate 60 gal/min....................................................... 7-78
Figure 7.11.11 Pressure Drop in Seamed and SeamlessTubing forBorate-Crosslinked 35 lb HPG/1000 gal Gel, at pH 11.0and Flow Rate 60 gal/min...................................................... 7-79
Figure 7.11.12 Pressure Drop in CT for Borate-Crosslinked35 lb HPG/1000 gal Gel......................................................... 7-80
Figure 7.11.12 Schematic of Coiled Tubing Test Facility.............................. 8-3

xiii
LIST OF TABLES
Table 5.1 Fluke Hydra System Specifications ....................................... 5-2
Table 7.3.1 Relationship Between Fluid Viscosity and Settling Velocity 7-23
Table 7.4.1 Empirical Constants for Equations 7.4.4 and 7.4.5................ 7-30
Table 7.4.2 Empirical Constants for Equation 7.4.1 ................................. 7-31
Table 7.4.3 Comparisons of Field and Laboratory Scale Characterizationof Borate-Crosslinked 35 lb/Mgal Guar Viscosity (cp @ 100 sec-1)at 150oF .................................................................................. 7-32
Table 7.5.1 The Theoretical/ Experimental Ratios at Various Locations . 7-36
Table 7.5.2 Location Experiments ............................................................ 7-36
Table 7.6.1 Test Matrix for Xanthan......................................................... 7-43
Table 7.6.2 A Typical Test Matrix for Guar Foam Rheology Study........ 7-43
Table 7.9.1 Comparison of HPS Data with Laboratory Data.................... 7-59
Table 7.11.1 Comparison of Pressure Losses of Borate-Crosslinked Guarand HPG................................................................................. 7-80
Table 8.1 Fluid Systems - Linear Gels................................................... 8-5
Table 8.2 Fluid Systems - Drilling Fluids .............................................. 8-5
Table 8.3 Formulations of M-I Fluids.................................................... 8-8
Table 8.4 Formulations of Baroid Fluids ............................................... 8-8

xiv
Executive Summary
This document is the Final Report from the University of Oklahoma (OU) to the UnitedStates Department of Energy (DOE) as part of the Contract No. DE-FC21-92MC29077.It briefly summarizes the findings of research and development work performed by OUover the contract period from January 1, 1991 through March 31, 2000.
On April 5,1990, Gas Research Institute’s (GRI) Natural Gas Supply Department issuedRFP No. 90-211-0367 entitled “Fracturing Fluid Characterization.” The purpose of thisRFP was to solicit proposals from various qualified industry organizations with theobjective of quantifying the behavior and effects of fracturing fluids and slurries, in thewellbore and in the fracture, during and after the hydraulic fracturing process. Followinga thorough review, GRI selected the proposal submitted by OU as the most qualifiedfrom the several proposals submitted by industry organizations and research entities.During 1992 the Department of Energy executed Cooperative Agreement No. DE-FC21-92MC29077 and became a project co-sponsor and continued to be a major contributor tothe program until the contract end on March 31, 2000.
During the contract period, based on consultation received from the Project AdvisoryGroup (PAG) and the Technical Advisory Group (TAG), DOE/GRI periodicallymodified the statement of work to steer the project toward its goals and objectives. Thestatement of work was also modified occasionally to reflect changes in overall projectdirection as determined by DOE/GRI and its advisory groups.
Each year the progress of the project was presented to TAG and PAG at the semi-annualmeetings. Furthermore, each year an Annual Report describing in detail the activitiesperformed with the research results and implications was also submitted to DOE/GRI.The GRI contract was fulfilled on September 30, 1998 and the Final Report wassubmitted. The continuation of the project beyond this time (i.e. from September 30,1998 through March 31, 2000) was made possible because of the DOE funds. This FinalReport provides the summary of all previous reports and describes the major activitiesand research results and implications. For more detailed information the readers arereferred to the published annual reports.
The major goals of the project were to develop a fracture simulator that provides anaccurate rheological characterization of hydraulic fracturing fluids under field conditionsand to provide a permanent facility that could be used by the industry for testingpurposes. The University of Oklahoma has successfully accomplished both of thesegoals. The “Fracturing Fluid Characterization Facility (FFCF)” was established withtotal commitment from OU. The primary objective of this facility is to provide the oiland gas industry with a comprehensive, research-based organization, whose mission is toprovide valuable insight into the various mechanisms that govern the flow of fracturingfluids and slurries through a hydraulically created fracture.

xv
In this regard, a unique above-the-ground fracture simulator was designed andconstructed at the FFCF, labeled “The High Pressure Simulator (HPS).” The HPS is avertical, variable-width, parallel plate flow apparatus capable of operating at hightemperatures (up to 250oF) and pressures (up to 1200 psi). The HPS is the mostadvanced fracture simulator currently available to the industry. A state-of-the-art fiberoptic-based “vision system” was developed for the HPS to facilitate the visualization andaccurate measurement of flow behavior of fracturing fluids with and without proppant.Some of its key experimental research areas include fracturing fluid characterization, wallslippage phenomena, dynamic fluid loss, perforation pressure loss, proppant convectionand encapsulation, and proppant flowback for a variety of fracturing fluids, slurries, andfoams. In order to duplicate actual field conditions, field methods and equipment formixing, pumping, and fluid preconditioning were developed. A state-of-the-artlaboratory where fracturing fluid characterization can be performed was also established.
Joint industry consortia, such as the Coiled Tubing Consortium, were established and atechnical program was developed to make the facility available to the industry in the formof third-party testing. Since 1996, the industry has utilized the FFCF testing facility toperform fluids-related research.
Specifically, this Final Report includes:
• Broad view of the project direction from initial issue of the RFP to project close• Design and development of High Pressure Fracture Simulator (HPS)• Fluid mixing and pumping equipment• Instrumentation• Data acquisition• Laboratory rheological instruments• Research results and implications• Coiled tubing consortium• Technology dissemination• Commercialization of FFCF
Some of the numerical simulators used today for simulating hydraulic fracturingtreatments have incorporated the data developed by the FFCF. The research anddevelopment work thus far accomplished at FFCF will not only serve as the foundationfor future research but has also provided the industry with valuable insight into some ofthe more fundamental aspects of fluid flow in a hydraulic fracture. FFCF hasinvestigated many of the fluid processes and visually demonstrated the impact on theoverall efficiency of a fracturing treatment. Because hydraulic fracturing is so widelyapplied, small incremental improvements have the potential to produce an enormousimpact on the overall economics of gas recovery.

1-1
Chapter 1 INTRODUCTION AND BACKGROUND
1.1 Summary
This chapter provides a broad view of the direction taken by the project from initial issueof the RFP (request for proposal) on April 5, 1990 to project close on March 31, 2000. Itdescribes the rationale used by the Gas Research Institute (GRI) to formulate the RFP andthe technological advancements expected from pursuit of the research effort outlined inthe RFP. It also describes actions taken by the primary contractor and sub-contractors inresponse to the statement of work defined by the U.S. Department of Energy (DOE) andGRI. Based on consultation received from Project Advisory Group (PAG) and TechnicalAdvisory Group (TAG), DOE/GRI periodically modified the statement of work to steerthe project toward its goals and objectives. The statement of work was also modifiedoccasionally to reflect changes in overall project direction as determined by DOE/GRIand their advisory groups.
1.2 Contractor Proposal
On April 5, 1990, GRI’s Natural Gas Supply Department issued RFP No. 90-211-0367entitled “Fracturing Fluid Characterization.” The purpose of this RFP was to solicitproposals from various qualified industry organizations with the objective of quantifyingthe behavior and effects of fracturing fluids and slurries, in the wellbore and in thefracture, during and after the hydraulic fracturing process. Operational control of thefracturing process was considered critical to the development of optimized fracturetreatments and lower completion costs.
In the RFP, GRI cited its experience with three Staged Field Experiments (SFE’s)as evidence that it is not possible to perform an accurately controlled fracturingexperiment, monitoring all processes involved, and obtain a unique interpretation offracture growth. Improving industry knowledge of fracturing fluid behavior wasconsidered to be a key factor in the effort to gain operational control of the fracturingprocess. Therefore, GRI issued RFP 90-211-0367 to sponsor the physical modeling offluid and slurry flow processes that occur during a hydraulic fracturing treatment. TheRFP recommended that an effort should be made to duplicate the actual scale of fieldequipment, and expected flow geometries to insure experimental observations can berelated directly to field operations.
The primary benefit to be derived from this GRI sponsored research was expectedto relate directly to a reduction in the cost of fracture treatments and increased reservoirdeliverability as the result of improved stimulation design and implementation. It wasGRI’s desire that the information, hardware, and analytical tools that evolve from thisresearch project would allow the industry to lower stimulation costs by reducing fluidvolumes, horsepower requirements, and fluid additive costs. These results could also leadto an improvement in fracturing treatment data interpretation and therefore allow betterestimates of fracture geometry and reservoir performance to be made.

1-2
Several proposals were received from various organizations and research entitiesby the May 25, 1990 deadline set by GRI. Following a thorough review, GRI selected theproposal submitted by the University of Oklahoma as being the most qualified based oncriteria contained in the RFP. The University of Oklahoma proposed approaching theoverall task with a multidisciplinary team supported by industry leading sub-contractors(MTS Systems Corporation, Minneapolis, Minnesota; Halliburton Services, Duncan,Oklahoma; RE/SPEC Inc., Rapid City, South Dakota). MTS Systems Corporation waschosen because of their expertise in the design and fabrication of servo-controlled testequipment and their expertise in the development of state-of-the-art test facilities.Halliburton Services was selected to support the facility because of their expertise infracturing fluid formulation and evaluation and their expertise in field-scale equipmentfor mixing and pumping hydraulic fracturing fluids. RE/SPEC Inc. was chosen to supportthe facility because of their expertise in rock mechanics testing and quality assurance.
The multidisciplinary team from the University of Oklahoma and their team ofsub-contractors proposed constructing a Fracturing Fluid Characterization Facility(FFCF) where large-scale physical models could be deployed and used for testing. Theyenvisioned that industry could use these large-scale physical models to validate numericalmodels if certain criteria were met. These criteria include equipment design that allowsaccurate control of boundary conditions, knowledge of material properties and behavior,and the development of sophisticated measurement techniques. If validation of numericalmodels became possible at the facility, it would be a major step towards the ultimate goalof attaining operational control of the fracturing process and hence, optimization ofstimulation treatments. To fulfill this vision, the contractor team proposed that afeasibility study be undertaken which includes the design and fabrication of a prototypefracture simulator. The goal of this feasibility study was to evaluate various alternatives,to delineate limitations, to access currently available technologies, and to ultimatelyprovide GRI with an improved cost estimate. Those desiring additional details concerningthe contractor proposal should refer to the original document submitted by the Universityof Oklahoma to GRI on May 21,1990.
1.3 Contractor/Subcontractor Team Approach
In the contract executed with The University of Oklahoma, Contract No. 5091-211-2114,GRI established January 1, 1991 as the effective start date for work on the project. TheUniversity of Oklahoma in concert with its subcontractors began the feasibility study thathad been planned for the first year. Four teams were established, respectively, to coverthe Mechanical, Rheological, Measurement/Control, and QA/QC/Environmental facets ofthe feasibility study. Each team provided input to formulation of the document entitled“Simulator Functional Requirements.” This enabling document allowed MTS to completethe design and begin construction of the prototype simulator prior to the end of the firstyear.
The inaugural meeting of the TAG occurred on June 3-4, 1991 in Chicago,Illinois. Mr. Steve Millett, Manager of Forecasting and Strategic Planning Studies atBattelle, was invited to conduct an exercise based on the nominal group technique. TheTAG was asked, “What do we need to know to improve the effectiveness of fracturing

1-3
fluids in hydraulic fracturing of tight sands gas wells in order to increase production fromthese wells at least 10% by the year 2001?” Mr. Millett further clarified the question bycommenting that the increase would be above that achievable with our current knowledgeof the performance of fracturing fluids. The group was allowed 15 minutes to developindividual responses to the question. Their ideas were recorded in an around-the-tableformat until there were no new ideas coming forth. The 39 issues raised were reduced to27 by eliminating redundancy and overlap between the topics. Each individual was thenrequested to select and rank the top eight issues from this list. Mr. Millett then tabulatedthe scores and listed the top five:
1. Identification of fluid properties that predict proppant transport, includingcharacterization of proppant transport and settlement
2. Change in fluid properties along the fracture, including the effects of fluid loss3. Slurry rheology, including characterization of fluid friction and behavior in the
wellbore4. Ways of reducing residual fracture conductivity damage5. Behavior of nonuniform slurry flow in complex channels, including characterization
of nonhomogeneous flow, velocity profiles (with possible fingering), and effects offracture tortuosity and roughness.
The TAG also addressed the issue of building a prototype simulator at this meeting. Theneed for a prototype simulator was based on the desire to test the mechanical design,facings, controls, instrumentation, safety, and other aspects of the design concept beforecommitting to the construction of a much larger simulator. The consensus of the TAGwas that a prototype should be built to verify design concepts and to address safetyissues. They also wanted prototype testing to provide meaningful data related tofracturing fluid properties when possible. These recommendations were presented to thePAG and approval for construction of a prototype was obtained. In this same time frame,the United States Department of Energy (DOE) executed Cooperative Agreement No.DE-FC21-92MC29077 and became a project co-sponsor and has continued to be a majorcontributor to the program.
During July 1992, the 37.5-ton prototype fracture simulator was installed in anaircraft hangar bay at 1928 Goddard Avenue on the North Campus of the University ofOklahoma. The hangar provided temporary housing for the simulator until the Universityconstructed a permanent facility during 1996. The prototype simulator was a vertical,variable width, parallel-plate flow cell that was 7 feet high and 9-1/3 feet long. Furtherdetails concerning the design and construction of this simulator are found in Chapter 2.Following installation, a series of verification tests were undertaken to evaluate theability of the simulator and associated instrumentation to perform according to design.However, the prototype simulator was quickly recognized by industry to be aconsiderable advancement in the technology available for evaluating fracturing fluids.Therefore, in addition to proof-of-concept testing for development of a large-scalesimulator, a research plan was developed to investigate fluid rheology, proppanttransport, and fluid loss with the prototype during 1993 and early 1994. The prototypeverification and research testing conducted during this time period gave an indication ofhow the project was going to advance technology in fluid characterization. This testing

1-4
supported some industry assumptions about fluid behavior while contradicting others.However, a major limitation of the prototype installation at this time was that it did nothave any type of fluid preconditioning capability. Knowledge gained from fabricationand operation of the prototype made it clear that a larger-scale version based on the samedesign concept could not be implemented within the budgetary constraints of the project.A large-scale, low-pressure simulator without fluid loss capability was also consideredand found to be outside funding limits for the project. As a consequence of thesefindings, the prototype simulator was re-designated the high-pressure simulator (HPS)and became the foundation for future research at the facility.
During 1994, project scope was redefined to concentrate on using the advancedcapabilities of the HPS to perform near-term research and development activities. Therevised plan included research in the four major areas of Rheology, Proppant Transport,Perforation Pressure Loss, and Dynamic Fluid loss which encompass all of the TAGpreferred topics with the exception of fracture conductivity measurements. In addition tothe five preferred topics, the industry based Technical Advisory Group (TAG) alsoprovided guidance during formulation of an R&D plan consisting of three phases. PhasesI (October 1, 1994 – March 31, 1996) and II (April 1,1996 – September 30, 1997) wereeach 18 months in duration while Phase III (October 1, 1997 – September 30, 1998) wasto extend for a period of 12 months. During the first phase of activity, a preconditioningloop was fabricated for simulating shear and temperature histories experienced by a fluidas it is injected down the wellbore and into the fracture. The fluid-preconditioning loop,low and high-pressure pumps, and other fluid mixing and handling equipment aredescribed more fully in Chapter 3. Other equipment and instrumentation needed toprovide a complete characterization of fracturing fluid behavior were also eitherfabricated or acquired during this time. Data acquisition hardware, software, andassociated instrumentation were a major consideration and the rationale for their selectionis described in Chapters 4 and 5. Acquisitions included a Nordman viscometer(rotational viscometer similar to the industry standard Model 50 Fann Viscometer) and aBohlin rheometer. These instruments were acquired to measure material properties suchas viscosity, normal forces, and oscillatory elastic response as a function of time,temperature, and pressure. Chapter 6 provides an in-depth discussion of theseviscometers and other rheological instrumentation. Initial tests performed during theR&D effort were designed to confirm the satisfactory operation of newly acquiredequipment and instrumentation. However, prior to the start of Phase II, the concept of a“Shared Vision” among the project sponsors was developed to guide future work on theproject. Using the Shared Vision concept, project activities were subdivided into thefollowing six categories:
1. Research and Development Program2. Innovative Testing3. Testing for Clients4. Industry Consortia5. Field Verification6. Technology Transfer

1-5
The GRI Natural Gas Supply Project Advisors at their November 1996 meetingexpressed concern about the project and the direction in which it was going. A majorconcern expressed by the TAG and PAG was the perception that the unique capabilitiesof the FFCF were not being completely utilized. The high pressure and temperaturefeatures of the HPS coupled with the vision system were noted to be important in view oftheir application to the potentially high-impact research area of proppant transport.Hence, in the revised Project Plan developed during early 1997, refinement of the visionsystem was moved to a very high priority. Development of the vision system and otherinstrumentation used by the facility to accomplish its mission are described in Chapter 4.The revised project plan was divided into the following areas:
1. Verification and Transfer of Past Research Results2. Instrumentation Status3. Research Focus4. Consortium Funded Research5. Testing for Clients6. Field Verification7. Technology Transfer
The Phase II of the revised project plan was successfully completed in March 1998. Thescope of Phase III activities were then revised to focus on the following activities:
1. Proppant Transport and Proppant Flowback Research2. Technology Transfer3. Commercialization
The above activities were totally funded by the U. S. Department of Energy and GRI wasstill involved technically. The project period for the revised Phase III was from April1998 through March 2000. The contract with GRI was fulfilled at the end of September1998 by submission of the final report to GRI. The activities conducted during the periodfrom September 1998 through March 2000 were solely from the DOE funds. The resultsobtained from the proppant transport and proppant flowback areas are included inChapter 7. The technology transfer activities and comments on furthercommercialization of the FFCF and plans for its future expansion as a center for WellConstruction Technology are documented in Chapters 9 and 10 respectively.
In addition to finalizing the planned research focus, the FFCF also successfullyestablished an industry funded consortium and completed several tests for industryclients. The Coiled Tubing Consortium is in its third year of operation with good industryparticipation.
1.4 Gas Industry Benefits
Details concerning the R&D results obtained during Phases I to III and their implicationsfor improved fracturing operations are covered in Chapter 7 of this report. Hydraulicfracturing is the key element of a strategy that is often applied during completion of gas

1-6
wells to obtain maximum rate of return on investment. Capabilities developed at theFFCF allow the complex chemical, physical, and fluid flow processes that occur duringhydraulic fracturing to be simulated for the first time on a scale comparable to that foundin field operations. Using these capabilities, the FFCF has experimentally investigatedmany of these processes to increase industry knowledge concerning how they impact theoverall efficiency of a fracturing treatment. Because hydraulic fracturing is so widelyapplied, small incremental improvements have the potential to produce an enormousimpact on the overall economics of gas recovery.

2-1
Chapter 2 HIGH PRESSURE FRACTURE SIMULATOR
2.1 Introduction
The major goals of the project were to design and develop a fracture simulator thatprovides an accurate rheological characterization of hydraulic fracturing fluids underfield conditions and to provide a permanent facility that could be used for testingpurposes. To accomplish these tasks, RFP No. 90-211-0367 entitled " Fracturing FluidCharacterization" (see Chapter 1 for further details) recommended that every effortshould be made to duplicate the scale of field mixing and pumping equipment whilepreparing and handling of test fluids and slurries. The proposal submitted in response tothe above referenced RFP envisioned essentially a full-scale simulation of all aspects ofthe fracturing process. Fracturing fluids with and without proppant would be mixed andblended in field equipment. A field scale high-pressure triplex pump would be used toinject fluids and/or slurries through substantial lengths of high-pressure tubing tosimulate the wellbore. Tubular and fracture dimensions were also to be duplicated to themaximum extent possible to insure experimental observations at the facility can bedirectly related to field conditions without the need for scale-up. Varying the injectionrate and length of tubing would approximate fluid shear history, which is an importantconsideration when evaluating crosslinked gels. Fluids and slurries exiting the wellboresimulator would be injected through perforations prior to entering a variable-widthfracture simulator. These perforations would be capable of being sized to differentdimensions and would be used to study erosion processes with slurries. A variable-widthslot, which would be as large as practical based on operational and budgetaryconsiderations, would be fabricated and used to investigate flow processes in a hydraulicfracture. Moreover, this chapter provides an overview of the evolution in design anddevelopment that occurred during fabrication of the fracture simulator, High PressureSimulator (HPS), which is currently being used by the FFCF.
2.2 Design of Fracture Simulator
Four teams were established during the feasibility study to address the Mechanical,Rheological, Measurement/Control, and QA/QC/Environmental aspects of the project.Each team provided input individually and collectively to the formulation of a documententitled “Simulator Functional Requirements.” Maximum operating pressure andtemperature, gap-width range, height, length, and other requirements for the simulatorwere based on industry experience and the practical limits posed by mechanical designconstraints. A fracture simulator approximately 100-ft long, 16-ft high, and having anadjustable gap width from 1/8 to 1 ¼-inch was recommended primarily for the purpose ofinvestigating proppant transport. Maximum operating pressure and temperature werespecified as 1200 psi and 250 0F, respectively. Using these specifications, MTS hasdeveloped a mechanical design concept based on having a fixed side and a movable sidethat would allow the simulator to have a variable gap width. The movable side would be

2-2
composed of a 7 by 43 array of hydraulically actuated platens. Each of the 28-inch squareplatens and the fixed side would be designed to accept a thin sheet of synthetic rock(facings) with permeability in the range of 0.01 to 0.1 md. The project teamrecommended that a prototype simulator be fabricated to test the mechanical design,facings, controls, instrumentation, safety, and other aspects of the design concept beforecommitting to the construction of the much larger simulator. Technical and ProjectAdvisory Groups (TAG and PAG) approved this recommendation and the design andconstruction of the prototype were well underway by the end of 1991.
2.3 Design and Construction of High Pressure Simulator
As discussed in section 2.2, the development of a fracture simulator started with thedesign and construction of a prototype. Originally, the high-pressure simulator wasdeveloped as a “prototype” simulator to eventually build a large-scale variable-widthsimulator capable of coupling slurry flow and fluid loss phenomena in a high temperatureand pressure environment . Experience gained during the construction and operation ofthe prototype in 1993 suggested that budgetary constraints would not allow the large-scale fracture simulator to be built based on the operating principles originally proposed.Consequently, the former prototype was re-designated as the High Pressure Simulator,which is a vertical, variable-width parallel plate flow cell capable of operating at elevatedtemperature and pressure. A comprehensive view of the HPS is shown in Fig. 2.1. The internal dimensionsof the slot are 7-ft (2.13 m) high and 9.3-ft (2.84 m) long and the fluid enters and exits theslot through perforation manifolds representative of a wellbore. The operational pressureand temperature limits of the HPS are 1200 psi and 250 0F respectively. Slot width can beadjusted dynamically over the range of 0 to 1.25 in. by a system of 12 hydraulicallyactuated platens. One wall of the narrow flow channel (slot) was formed by 12 separate,movable steel platens which are 28 by 28 inch square and are laid out in a 3 by 4 matrix.The opposite wall is a stationary, continuous 6-inch thick steel slab. The gap betweeneach movable platen and the stationary wall can be adjusted by means of a hydraulicactuator. Platen movement allows the gap width to be set to a selected value and is usedto compensate for deformation of the supporting structure under high pressure andtemperature. A 1-inch thick facing material covers each of the movable steel platens tocreate one wall of the simulated fracture. The opposite stationary wall is covered by amatching 3 by 4 matrix of facings that are also 1-inch thick and 28 by 28 inch square.These replaceable facings are used to simulate the rock surfaces of a hydraulic fracture.They can be prepared from either a synthetic resin-sand composite material or a naturalrock slab. In one application, instrumentation such as a fiber-optic vision system,temperature sensors, and a LDV viewing port were cast into an impermeable resin facingmaterial. By changing the facings, different properties, such as permeability and surfaceroughness, could be investigated for their effect on fluid loss, fluid flow, and proppanttransport. During fluid loss tests, a series of channels behind the permeable facingsprovide a route for filtrate to exit the apparatus to a measurement point.
The prototype design consisted of a 3 by 4 array of the same hydraulicallyactuated platens that would be used in the large-scale simulator. With this design

2-3
approach, critical mechanical components of the simulator would be evaluated full-scalerather than in some miniaturized form as the term prototype often conveys. There wasalso the additional thought that some benefit might be derived from having prototypecomponents interchangeable with the full-scale simulator. Other unique features of theHPS include the vision system for flow visualization of proppant-laden fluids and LaserDoppler Velocimeters (LDV) for accurate rheological characterization of various fluids.During July 1992, the 75,000-lb prototype simulator was installed in a remodeled aircrafthangar bay at 1928 Goddard Avenue on the North Campus of the University ofOklahoma.
Figure 2.1-High Pressure Fracture Simulator
Figure 2.2 shows the perforation and platen layout in the high Pressure Simulator.The inlet and exit manifolds (2.75 in. in diameter) are equipped with 22 equally spacedcylindrical openings. These openings are ¾-in. diameter, 3-in. long and spaced on 4-in.centers. The perforations whose configuration and size can be easily changed using aseries of blank and sized inserts. These inserts allow the openings to be either plugged orconverted to ¼-, 3/8-, or ½-in. diameters. A wide variety of perforation patterns and sizescan be simulated using these inserts. An access port, located on the backside of the inletmanifold, is provided for installation and removal of these inserts.

2-4
1 2 3
5 6 7
9 10 11
4
8
12
TOP
FLOW
0.504.00
8.0012.0016.0020.0024.0028.00
32.0036.0040.0044.0048.0052.00
56.0060.0064.0068.0072.00
76.0080.0083.50
Fiber
Facingretainerframe
"0"
"0"
112.00
84.00
3.00
2.40
3.002.40
.68
.68
Figure 2.2-Perforation and Platen Layout in the HPS
2.4 Verification of Testing and Acceptance
The simulator was subjected to a series of verification tests to insure its compliance withdesign specifications. A research plan was also developed for using the High PressureSimulator to conduct limited investigations of fluid characterization, proppant transport,proppant flowback, and dynamic fluid loss behavior of fracturing fluids both linear andcrosslinked. These investigations were conducted to provide useful data for the industryand to gain operating experience with the mechanical and instrumentation systemsplanned for the large-scale simulator. Fabrication of the prototype and the experiencegained during its operation in1993 indicated that a large-scale simulator built on thesesame principles would be too complex and costly. As a consequence, MTS developednew mechanical design concepts for a large-scale, low-pressure simulator (LPS) thatwould be simpler to operate and more economical to implement. The proposed simulatorwould have a variable width slot 15 ft high by 40 ft long and would be capable ofoperating at elevated temperatures and 300 psi. However the LPS was also found to beoutside the funding guidelines established for joint sponsorship of the project by DOEand GRI.
Therefore, since 1994 the prototype was designed as the high-pressure simulator(HPS), and it is being utilized to perform near-term research and development activitiesin various hydraulic fracturing areas rather than large-scale hardware development. TheHPS was moved to its current facility in August 1996 and has been continually improvedthrough mechanical, instrumentation, and software modifications.

3-1
Chapter 3 FFCF CAPABILITIES
3.1 Summary
This chapter discusses the capabilities of the Fracturing Fluid CharacterizationFacility (FFCF) at the University of Oklahoma. The FFCF provides oil and gas industrywith innovative technology to improve efficiency and economic viability of drilling,completion and production operations. Services provided and research areas of the FFCF(now called Well Construction Technology Center WCTC) fall into following six maincategories:
§ Fluid rheology and characterization applications using High Pressure Simulator§ Coiled tubing applications as industry joint project (Coiled Tubing Consortium -
CTC)§ Drilling simulation using field scale Drilling Rig Simulator§ Development of cooperative projects with Sandia National Laboratories§ Training courses for the petroleum industry (Network of Excellence in Training
NExT)§ Providing third-party tests
Each category of the FFCF activities is discussed in the following section indetail. These categories along with equipment and facilities describe the commitment ofthe FFCF to provide a world class research facility to the industry.
3.2 FFCF Research Capabilities
3.2.1 Fluid Rheology and Characterization ApplicationsThe High Pressure Simulator (HPS) and its associated field scale mixing, pumping andpreconditioning equipment as well as highly skilled personnel allows the WCTC toconcentrate on the following research areas:• Dynamic fluid loss• Perforation pressure loss• Proppant transport• Proppant flowback
The HPS replicates all conditions experienced by a fracturing fluid from itsformation to its leakage into a rock matrix. The HPS is a large, articulated, servo-controlled, parallel-plate flow cell designed to measure fluid properties at temperatures ashigh as 250oF and pressures up to 1200 psi. Also integral to the facility is auxiliaryequipment such as field apparatus for blending the fluid, mixing in the proppant andpumping the fluid through a simulated wellbore and the simulator's computerized dataacquisition and control system. The FFCF's HPS is the world's only above-groundfracture simulator for fracturing fluid characterization. The HPS allows FFCF to performunique research with field methods and equipment:• Simulation under operating conditions of up to 1200 psi and 250oF• Simulation with a dynamically variable gap width

3-2
• Dynamic leak off test• Fluid and proppant flow visualization• LDV measurements/point velocities and velocity profiles of the fluid
The preconditioning facility, consisting of different lengths of coiled tubing and relatedequipment provides a shear history simulation for the fluid and thus, brings its viscositycloser to fluid flowing under actual downhole conditions.
3.2.2 Coiled Tubing Applications
One of the hottest issues in the oil industry is the application of coiled tubing anddevelopment of its relevant technology. The applications of coiled tubing are explodedfrom conventional application to new applications such as wellbore cleanout, coiledtubing drilling, etc. In order to meet industry's need for development of basictechnologies, the FFCF teamed up with a number of industry service providers as aconsortium.
The FFCF with the consortium (CTC) focused on gathering frictional pressure lossdata for drilling, completion, and stimulation fluids; developing engineering and designcorrelations; and evaluating rheology fluids and foams as a function of shear rate andtemeprature. The FFCF performs the study of flow behavior of commonly used fluids incoiled tubing, which takes into account the effects of curvature and seam. The field scaleexperimental facilities, which are discussed in the next section, allow the FFCF tocurrently undergo the following research:• Drag reduction• Wellbore cleanout• Coiled tubing fracturing• Field data comparison/confirmation
3.2.3 Drilling Simulations
The FFCF has a Drilling Rig Simulator housed at the former BP-Amoco TulsaTechnology Center in Tulsa. This simulator was donated by BP-Amoco to the OU’sSchool of Petroleum and Geological Engineering in 1999. The field scale Drilling RigSimulator is composed of five major systems; weight-on-bit system, which can produce70,000 lbs, circulating system, rotary system, the back-pressure system and computersystem. The detailed specifications of the simulator are described in the next section. Theuse of the Drilling Rig Simulator allows FFCF to perform research to develop new bitdesign, quality control checks, and evaluate new tools and products. The Drilling RigSimulator is also used to perform high-quality and conclusive work to test and developvarious downhole tools and systems. These include:• Bit models: roller-cone, natural diamond, PDC• Anti-whirl drill and core bits• Hydraulic studies, bit balling characteristics• Mud effects: ROP enhancers, shale stabilizing agents, lubricants

3-3
• Downhole tools: reamers, shock subs, motors, casing and sidetrack mills, casingshoes, stabilizers, jet nozzles
• Tubulars: quality control• Pipe dope studies
3.2.4 Cooperative Project with Sandia National Laboratories
The FFCF is managed by the School of Petroleum and Geological Engineering at theUniversity of Oklahoma, which has a record of success in science and technologydevelopment for the exploration and production of oil and gas. By signing a MOU(Memorandum of Understanding) with the Sandia National Laboratories, which has beenDOE's leading laboratory for drilling technology for the past 20 years, the FFCF can getthe advantages of sharing a variety of technologies developed by Sandia NationalLaboratories. These include modeling and simulation using high-performance computers,advanced sensing and information systems, robotics, and micro-machine technology.
Advanced technology research and development work, which cover the widerange of topics related to well construction and advanced drilling, will be donecooperatively with some projects done at each institution.
3.2.5 Third-Party Tests
The FFCF has made significant progress in the area of third-party testing. Several thirdparty tests have been successfully performed in the areas of fluid rheology, proppanttransport and coiled tubing applications. The previous tests brought very encouragingresponse from the customers. The clients expressed their satisfaction with the servicesprovided by the FFCF.
Combining the resources available in the FFCF as well as other department at theUniversity of Oklahoma, the FFCF can offer a unique range of services to assist the oilindustry. The FFCF has in-depth knowledge, good experience in performing the variousranges of experimental work, unique facility and personnel who know how to design andcarry out the tests on behalf of clients. A brief listing of third-party tests available in theFFCF is presented below.• Fluid rheology (drilling, completion, foam, cross-linked slurry, etc.)• Proppant transport• Proppant flow back• Perforation pressure loss• Coiled tubing applications• Wellbore cleanout• Mathematical simulation• Drag reduction
3.2.6 Network of Excellence in Training (NExT)
Heriot-Watt University, Texas A&M University, the University of Oklahoma andSchlumberger established a Network of Excellence in Training (NExT). The NExT isdedicated to conduct training courses for the petroleum industry that combine academic

3-4
excellence with professional expertise. The objectives of the NExT program are to keepthe knowledge transferred up to date and fit-for-purpose, and to use technology tooptimize delivery and assessment methods.
NExT offers the petroleum industry a network of intellectual capital in research,expertise and practical application-delivering solutions through industry training andtechnology transfer relationships worldwide. Program features include a master's degreeprogram in addition to University certification for NExT courses and university credit forcounting education units. Course delivery methods will vary from traditional classroomwork at the universities and training centers to mentor-supported distance learning via on-line or CD-ROM self-study programs. NExT also designs the customized programs,providing on-site training at client locations worldwide.
The FFCF as a representative of the University of Oklahoma has specialresponsibilities for offering courses related to well construction, operation andpetrophysics. The role of the FFCF in NExT is that of a technology transfer provider tothe petroleum industry and provider of main training center of excellence for this project.
3.3 Equipment and Facilities
The research capabilities of the FFCF have been enhanced to a greater extent throughvarious improvements in combination of facilities newly augmented in the institute. Thischapter provides a detailed overview of equipment currently used for research activity,and testing capabilities available at the FFCF. This equipment and facilities fall into thefollowing seven categories:
• Rheology Measuring System• High Pressure Simulator• Coiled Tubing Facility• Drilling Rig Simulator• Fluid Supply and Preconditioning System• Data Acquisition and Control System• Additional Equipment
These classifications are discussed in detail in the following sections.
3.3.1 Rheology Measuring System
There are several fluid rheology-measuring instruments available at the facility. Theyinclude the HPS (field scale), two Model 35 Fann Viscometers, a Nordman Rheometerand a Bohlin Rheometer for characterizing the viscosity of the fluids. The laboratoryrheology data are necessary for quality control of the test fluid to insure reproduciblelarge scale testing data. The Nordman Rheometer is a fully automated high-temperature(500°F), high-pressure (1000 psi) rheometer. It is equipped with a quick-disconnectfitting on the bottom of the sample cup to provide dynamic filling to avoid any period ofno shear to the fluid. The Bohlin Controlled-Stress rheometer (CS-50) is also used toprovide the viscoelastic properties of the fluids under investigation. It can supply steady-

3-5
shear as well as oscillatory-shear data at elevated pressures and temperatures. It is alsocapable of providing the fluid’s normal stress measurement. The HPS can be utilized tomeasure the rheology of crosslinked fluids.
3.3.2 High Pressure Simulator
The workhorse of the FFCF is the high-pressure simulator (HPS) which is a vertical,variable-width parallel plate flow cell capable of operating at elevated temperature andpressure. The resin facings are smooth and impermeable, while the synthetic and naturalrock facings have more texture and are permeable. Examples of instrumentation on theimpermeable facings are fiber optics for vision system, sight glass for Laser DopplerVelocimetry (LDV), differential pressure tube, and thermocouple lead. The details aredescribed in Chapter 2.
3.3.2 Coiled Tubing Facility
The FFCF is equipped with coiled tubing system consisting of various spools of coiledtubing connected in series which allows to study different energy input levels on fluidproperties at various levels of shear. The shear history conditioning system is comprisedof 1500 ft.1-inch coiled tubing system, which allows usage of 500 ft., 1000 ft., or 1500 ft.tubing lengths. The second system is comprised of 5000 ft. of 1 1/2-inch coiled tubingsystem, which allows usage of 1000 ft., 2000 ft., 3000 ft., 4000 ft., or 5000 ft. tubinglengths. The third system is comprised of 3000 ft. of 2 3/8-inch coiled tubing system,which allows usage of 1000 ft., 2000 ft., or 3000 ft. tubing lengths.
Figure 3.1 shows the coiled tubing systems. These coiled tubing systems are usedfor fluid friction loss tests. There are two annular sections, one fully concentric and theother fully eccentric. The outside tubing is 3 ½” nominal and the inside tubing is 2 3/8”nominal. This equipment is utilized for CTC research.
3.3.4 Drilling Rig Simulator
The drilling simulator is composed of five major systems; weight-on-bit system,circulating system, rotary system, the back-pressure system and the computer system.The detailed specifications of the simulator are described in the following sub-section.
Weight-On-Bit (WOB) System. The WOB system is controlled with a large hydraulicram, which applies the WOB and also picks up the drillstring assembly. It is controlledby a servo valve and is, therefore, very precise. The maximum WOB that can beproduced is 70,000 lbs.
The WOB can be run in two modes: (1) in weight control mode the system isoperated to maintain a constant force on the load measuring sensor independent of the bitposition and (2) Position control mode maintains a set bit position independent of theforce applied to the bit.

3-6
Fig. 3.1 Coiled Tubing System
The Mud Pump System. The mud pump system provides the means of circulating themud from the mud tank through the plumbing system, bit, pressure control system, andback into the tank. The primary mud pump is a Halliburton HT-400 triplex cementingpump. It is powered by a 600 HP DC motor that is connected to the pump through a 2speed gear box. The gear box allows the pump to be directly connected to the pump inputshaft or to be geared down with a 2:1 gear ratio to provide a higher torque (pressure)capability. In high gear, the maximum flowrate available is 590 gpm at 1,500 psi. In lowgear, the flow rate is 300 gpm with a maximum pressure of 3,000 psi.
The secondary pump is a Dowell PG03 frac pump driven with an 850 HP GulfElectroequip DC motor. This motor is directly connected to the pump input shaft. It iscapable of pumping 190 gpm at 5,000 psi with the existing liner size. (The systempressure is currently limited to 3,000 psi due to the stand pipe and swivel pressureratings.)
Combining both pumps allows for a maximum pressure of 3,000 psi at 490 gpm,and a maximum flow rate of 780 gpm at 1,500 psi. The pump system is fed through acentrifugal charge pump to provide a positive pressure to prevent cavitation while drillingand to facilitate mud mixing.
The closed loop mud system is complete with a high-speed shale shaker, a 100 bblactive system, a 100 bbl storage tank and a 90 bbl mixing tank.
The Rotary System. The low speed rotary system is capable of rotating the drillstring inthe range of 30 to 215 rpm. A standard rotary table drives a square kelly. It is powered bya fixed displacement Sunstrand hydraulic motor. The motor is powered with a 400 HP

3-7
Sunstrand Series 27 variable displacement (9 piston) hydraulic pump. This pump isdriven by a 400 HP AC motor and is used to drive a constant displacement hydraulicmotor. A maximum torque of 6,500 ft-lbs. can be produced independent of the rotationalspeed. Figure 3.2 shows Rig floor of Drilling Rig Simulator located at the TulsaTechnology Center.
The high-speed rotary system is used for rotating the bit at speeds ranging from 300to 1,500 rpm. This system is powered by the same 400 HP pump and control system asthe low speed system. The hydraulic drive motor for this system is identical to the bitdrive shaft with no gear reduction. This provides a maximum torque capability of 1,300ft-lbs.
Fig. 3.2 Rig Floor of the Drilling Rig Simulator

3-8
The Back Pressure System. The back-pressure system is used to control the ambientpressure in the drilling vessel, which simulates hydrostatic head of the drilling fluid in awellbore. It is composed of a coarse filter, a fixed choke, and a variable choke to producethe desired pressure. The fluid flows through the filter to remove any material that islarge enough to plug the fixed choke and then flows through the variable choke system.The fixed choke unit contains carbide sliding plates and a diffuser. The objective of thisfixed choke system is to control the pressure within 400 psi of the desired value. Thevariable choke is an ABC valve, which can further adjust the pressure to the desiredvalue.
The Computer System. The rig can be operated in either a manual or computercontrolled mode. The manual control system is used to control the rig during set up of atest and for rig control during some specialized testing. Critical electronic sensors aremounted on the rig to measure approximately 30 associated drilling parameters. There are31 analog and 8 digital signals available. A current in-house PC software program is usedto monitor, collect and store the data from the lab test. Data is sent to a printer, an 8-penstrip chart recorder, a reel-to-reel tape drive for long-term storage, and a spectrumanalyzer to investigate frequencies of vibrations. This system will be updated soon.Control room for the Drilling Rig Simulator is shown in Fig. 3.3.
Fig. 3.3 Control Room for the Drilling Rig Simulator

3-9
3.3.5 Fluid Mixing and Preconditioning System
The FFCF Mixing and Pumping System is subdivided into two categories; namely, lowpressure equipment and high pressure equipment. The low-pressure pumping equipmentconsists of a Moyno pump (6P10) and a Deming centrifugal pump (5M). The upper limitof operation of the Moyno pump is approximately 140 gpm at 600 psi. The centrifugalpump serves to impart additional mechanical energy to the fluid in order to achievehigher flow rates. The eye of the centrifugal pump is also used as a point for the injectionof crosslinker for the preparation of crosslinked fluids and slurries. Fluid is stored in a1000 gal polyethylene tank, and a 200 gal ribbon blender along with a 55 gal stainlesssteel tank equipped with three-bladed Lightning mixer are available for batch mixingslurries.
The high-pressure equipment consists of a triplex plunger pump (Fig. 3.4) capableof achieving flow rates in excess of 200 gpm at 1200 psi. A Galigher centrifugal pump isused in tandem with the triplex pump to impart additional energy at higher flow rates andas an injection point for the crosslinker and/or additives. Two 50 bbl storage tanksprovided with agitators are used to prepare 100 bbls of test fluid with constant mixing.Sand is conveyed pneumatically (for preparation of slurries) to the storage tanks fromtwo 330 sack storage tanks. Two ISCO syringe pumps insure constant injection ofcrosslinker at the eye of the centrifugal pumps (both low and high pressure systems) atflow rates of up to 1500 ml/min. A disposal tank of 150 bbl capacity is available forstorage of the used test fluid.
Fig. 3.4 Triplex Plunger Pump

3-10
The fluid preconditioning system at the FFCF is designed to provide both shear as well asthermal preconditioning. Coiled tubing reels provide shear preconditioning of the fluidsrepresentative of the flow of fluids down the wellbore. Further, the coiled tubing reelsare also equipped with differential pressure transducers for quantification of shear effects.In order to provide thermal preconditioning, the FFCF is equipped with a low shear heatexchanger (Fig. 3.5) used in conjunction with the coiled tubing to simulate the effects oftemperature gradient existing down a wellbore. The double pipe heat exchanger consistsof a 2 inch tube (tube side) inside a 3 inch tube (shell side) with a total length of 500 feet.The heat exchanger is capable of heating crosslinked gels and slurries at 60 gpm up to250 °F using 300 °F water at 40 gpm on the shell side. The temperature effects on thefluid can be monitored by means of thermocouples placed along the length of the heatexchanger.
Fig. 3.5 Double Pipe Heat Exchanger

3-11
3.3.6 Data Acquisition and Control System
The Data Acquisition and Control system constitutes the Vision System, the LaserDoppler Velocimeters (LDV), Pressure, Temperature and Flow Measurements.
With the improved vision system it is possible to monitor and quantify theproppant concentration during proppant transport and proppant flow back experiments inthe HPS. For pressure, temperature and flow measurement a wireless fluke hydra systemis used which is capable of receiving 40 data instructions every five seconds andtransferring them to a PC where they can be saved for analysis. In order to illustrate theproppant transport and proppant flow back procedure and measurements, the details aredescribed in Chapter 5 Data Acquisition.
3.3.7 Additional Equipment
Equipment now ready for use not included in the above categories are the foam flowloop, the clear plastic wellbore cleanout test bench, and Laser Doppler Velocimetry(LDV) to measure and analyze fluid velocity profile.
The clear plastic wellbore cleanout model is a 18 ft long and 4 in. diameter clearplastic pipe with tubing attachment at each end and a 2 in. diameter plastic tubing inside(Fig. 3.6). It is mounted on a steel frame that can be adjusted to any angle fromhorizontal to vertical.
Fig. 3.6 Wellbore Simulator at a Deviated Angle of 45o

3-12
The foam flow loop consists of three tubing sizes, ¼”, 3/8”, and ½” with aHoneywell differential pressure transducer which is applied across a 10’ span of each ofthese, a Little Giant Triplex loading pump, an ISCO 500D pump and controller forcrosslinker injection, a Micromotion flow meter, a Sprague pump, a Penberthy flow cell,a static mixer, and heat tape and controller. This system is capable of 1000 psi and 250°F and is described in detail in Chapter 6.
Laser Doppler Velocimetry (LDV) does not suffer from the complicationsinherent in more typical methods of point-velocity measurement. The LDV is being usedto characterize rheological properties of the complex fluids used in the Petroleumindustry (fracturing gels, proppant-laden fluids etc). The LDV system is described indetail in Chapter 4 with results obtained using the system being presented in Chapter 7.

4-1
Chapter 4 INSTRUMENTATION
4.1 Introduction
Instruments are the most important part of an experimental set up and satisfactoryperformance of instruments is key to acquire quality data. The set up of FFCF is highlycompetitive and instruments are conFig.d with the set up as per demand at hand. In otherwords, each setup requires that the instruments be conFig.d for specific application of theFFCF. This means that each instrument is designed, developed, modified and mastered atthe facility itself.
There are several instruments available at the FFCF. These instruments includevision and laser doppler velocimetry (LDV) system devices, HPS control tools,differential pressure transducers, and fluid flow measuring apparatus. These instrumentsare described in the following sections.
4.2 Vision System
The vision system provides a means to view inside the steel-walled high pressuresimulator (HPS). To accomplish this task, a fiber optics lit vision system was usedinitially. Later on, the fiber light array was replaced with a light emitting diode source toprovide light inside the HPS. In the fiber optics system, an array of light guides was castinto the synthetic rock facings on both walls of the HPS. One wall contained fibers thatacted as light sources and other wall contained fibers that acted as light receivers. Bothsets of fibers were positionally matched across the slot gap. The light source fibers werepowered from outside the HPS through a piped setup.
The vision system works on the principle that the light generated on one wall isshadowed by the fluid flowing through the slot, and so an image is seen by the fibers onthe opposite wall. These receiver fibers can, then, transfer the image to a camera. With aset of nine cameras installed on the HPS, a complete picture of the flow behavior insidethe slot can be obtained. The fiber optics light source had many limitations that affectedthe performance of the vision system. These shortcomings arose due to many bendsintroduced into the fiber optic bundles. These bends increased the light attenuation in thetransmitting fibers and restricted the light intensity generated by the fiber source. Toovercome these shortcomings, a light emitting diode (LED) system replaced the fiber-source vision system.
The LED system enhances the light intensity inside the HPS and improves theillumination through the fluid; thus, it produces a more uniform image of the entire fluidflow in the slot. The better illumination is obtained due to larger light umbra producedby the LEDs than the fibers. In addition to the enhancements in the images, the new LEDarray provides cheaper light transmitting facing and utilizes a lower voltage to power theslot. This low voltage system decreases electric hazards associated with the operation ofthe HPS. The LED system uses a total of 121 discrete HP-2000 light emitting diodes oneach synthetic facing of the slot. The LEDs are installed prior to preparing the facing.First, the facing mold is wired with a bus into a grid to which the LEDs are soldered.

4-2
Next, the mold is filled with facing material around the LEDs. Once the facing is set, theLED leads are insulated to prevent electric shocks. With an array of 121 LEDs on eachfacing and nine facing on one wall, 1089 LEDs illuminate one face of the slot. EachLED is aligned with a receiving fiber giving a total of 1089 fibers to capture the flowimage on the opposite wall of the slot. This geometric array of LEDs and fibers is shownin Fig. 4.1.
1 2 3
5 6 7
9 10 11
4
8
12
TOP
FLOW
0.504.00
8.0012.0016.0020.0024.0028.00
32.0036.0040.0044.0048.0052.00
56.0060.0064.0068.0072.00
76.0080.0083.50
Fiber
Facingretainerframe
"0"
"0"
112.00
84.00
3.00
2.40
3.002.40
.68
.68
Fig. 4.1-An Array of LEDs and Fibers Installed on the HPS
The flow image captured on the fiber is to be conveyed to camera for display andprocessing. This task is accomplished by grouping the fibers. For each image-receivingfacing of the slot, 121 fibers are grouped together to form 11 by 11 square bundle offibers. This bundle, shown in Fig. 4.2, has one inch long sides and is constructed insimilar spatial order as the fiber in the facing. The bundle conveys the image from thefracture wall to a window outside the HPS. From the window, the image is captured witha black and white video camera. Thus, from the nine facings, nine video cameras acquirethe complete dynamic fluid image from the slot. An example of an image obtained fromthe vision system is shown in Fig. 4.3.

4-3
Facing11x11 Fiber bundle
Fig. 4.2-The 11x11 Fiber Bundle to Capture Fluid Flow Image across the Platen
Fig. 4.3-Raw Fluid Flow Image Obtained with the Vision System

4-4
4.3 Laser Doppler Velocimetry (LDV)
The following characteristics of LDV make it especially advantageous for difficult flowexperiments.
• It is non-invasive.• It is immune to temperature effects.• It is free from mechanical damage due to particulate abrasion.• It has rapid response to velocity changes.• It is ideal for fluid experiments which involve complex fluids like proppant-carrying
fluids, mixtures and special fluids etc.• Data can be acquired in real time• The laser light can be focused into a very small volume and therefore spatial
resolution obtained is far superior to any other technique.
The LDV system has been used for two types of slots:
1. High Pressure Simulator (HPS)2. Plexiglas Slot
LDV probes are mounted on the HPS at each of the nine platens. It looks at the fluidthrough a glass window tuned to the LDV wavelength. The LDV measuring system usesa semiconductor diode laser that operates at a wavelength of 780 nm. This diode laserprovides a compact measuring head and allows better penetration into the fluids. Themeasuring head contains the diode laser source whose output is collimated and then splitinto two equal intensity beams to provide dual beam LDV system. The beams are crossedby a focussing lens and are collected back after scattering from the measuring volume bya receiving lens. The receiving lens focuses the collected light beams onto an avalanchephotodiode (APD) which transmits a Doppler signal on beat frequency to a signalprocessor. The processor analyzes the doppler signal and generates the fluid velocityprofile.
Of the nine LDVs installed on the HPS, three have rotational and translationalcapabilities. These three stations can be moved easily to study velocity profiles at anylocation on the HPS. The nine-point velocities are used to spot-check flow uniformityand the three automated stations are used to provide flow cross-section at the spot-checkpoint. Thus, the LDVs provide detailed information on the flow profiles, which can becompared to the theoretical profiles.
In addition to understanding the velocity profile across the slot width, knowledgeof the fluid velocity in the near wall region is of great interest to rheologists. The near-wall velocity determines the velocity gradient, which is used to calculate nominal shearrate at the wall and thus, rheologically characterizes non-Newtonian fluids. Moreover,the near-wall velocity measurements are useful to investigate wall slippage and dragreduction characteristics of the fracturing fluids.

4-5
The LDV system available at the FFCF has the following specifications:
1. Focal length = 138.8mm2. Fringe Spacing = 2.2283 micron3. Peak Power = 650-780nm4. Half angle = 9.57 degrees5. Beam Spacing =50.0 mm6. Transnational and rotational motion available7. Single Head Probe with back-scattering mechanism
4.3.1 LDV Data Processing System and Software Setup
When particle passes through the measuring volume, the back scattering signal iscollected with a 2.50-inch diameter-collecting lens and the back-scattered light isconverted into electrical signal. This signal is then transmitted to the signal processor(Model TSI IFA-550), which is also called Intelligent Flow Analyzer.
Signal Processor(IFA-550)
Receiving Optics
Laser Probe
Optics EndView
FINDSoftware
Figure 4.4: LDV Data AcquisitionSystem
This Intelligent Flow Analyzer is connected to a personal computer via parallelcommunication port. A flow analysis software (called Flow Information Display orFIND) then gathers and presents the velocity data. The software has facilities forcalculating real time mean velocity and turbulent density values, along with datavalidation and histogram graphs of the velocity values obtained.

4-6
The data rate displayed by the (FIND) software is actually a measurement of thenumber of scattering particles passing through the measuring volume per second. Thehigher the data rate observed implies higher accuracy as greater number of particlevelocities are averaged in the measuring volume.
4.4 HPS Control System
The most important instrument at the FFCF is the high pressure simulator, so it isnecessary that the simulator is operated with state-of-the-art instruments.
The instruments on the HPS provide input to a five-mode control system thatallows smooth and remote location running of the simulator. The five modes and theirrespective instruments are described below.
1) Position control uses linear voltage displacement transducers (LVDTs) in eachactuator to measure the displacement of piston. This controller mode works when theHPS is opened or closed.
2) Slot width control uses LVDTs installed in the slot to maintain a parallel and constantgap width in the slot. This controller mode works only when the simulator is closed.
3) Slot pressure control uses a slot pressure transducer to adjust the slot width tocompensate for structural variation in the simulator. This mode requires that the HPSis closed and filled with fluid.
4) Compliance control uses two user-specified parameters to make the simulatorcompliant to the changing pressures in the slot. The first specified variable ispressure that allows the system to become compliant, and the second variable isposition movement per unit change in the pressure. This mode operates when theHPS is closed.
5) Actuator pressure control uses hydraulic oil in the actuators to apply constant pressureon the fluid or sand pack inside the HPS. This mode works only when the HPS isclosed.
4.5 Differential Pressure Transducers
Differential pressure is a very important parameter for the fluid characterization studies.The differential pressure when combined with slot gap width measurements determinesthe wall shear stress on the fluid. The shear stress along with nominal wall shear ratedescribes the rheological properties of the fracturing fluid in a fracture. In addition to therheological characterization studies, the differential pressure measurements are useful topredict friction pressure losses.

4-7
4.6 Rheological Characterization (Instruments and Capabilities)
4.6.1 Model 35 Fann Viscometer
Two Fann viscometers, one with a #1 spring and the other with a # 1/5 spring areavailable at FFCF to measure the rheological characteristics of fluids.
The fluid viscosities are calculated at several shear rates by varying the rotationalrates of the bob in the fluid. With these viscosities, rheograms are developed for the testfluids. The measured data are fit with appropriate rheological models to describe fluidbehavior and predict the fluid viscosities at the shear rates of interest to the industry.
The Fann viscometer is a very rugged and robust instrument. It is very helpful toprovide a quick check on the fluid behavior and to compare the fluid viscosities withother measuring devices. The Fann viscometer is frequently calibrated and serviced tomaintain its accuracy to measure the fluid viscosities.
A detailed description of the Fann viscometers is provided in chapter 6.
4.6.2 Bohlin Rheometer
Bohlin rheometer is a unique instrument available at the FFCF. This rheometer isdifferent from the Fann and Nordman viscometers. Unlike the two controlled rateviscometers, Bohlin rheometer is a controlled stress instrument in which a shear stress isapplied and resultant shear rate is measured. The Bohlin rheometer is capable of utilizingdifferent measuring geometries and measure viscosity as well as viscoelasticcharacteristics of the fluid, whereas the two viscometers only use concentric cylindergeometry and measure fluid viscosity only.
The Bohlin rheometer works with a unique drag cup motor that applies torque tothe fluid sample. This torque is transmitted through the measurement geometry to thefluid sample with the help of a frictionless air bearing. The applied torque inducesshearing into the sample and the resultant displacement is measured with a highlysensitive optical angular position transducer. The state-of-the-art instrumentation on theBohlin rheometer makes it a very accurate and versatile equipment.
The Bohlin rheometer is equipped with three measuring geometries: concentriccylinder, parallel plate, and cone and plate. The concentric cylinders are available in twobob diameters, 14 and 25 mm, and are respectively denoted as C14 and C25. The bobsare used in cups so that cup to bob radius ratios is similar at 1.1. The other twomeasuring devices, parallel plate and cone and plate, are different from the concentriccylinders because of their different geometric configurations. Both of these plates havesame fixed bottom plate of 60 mm diameter but a dissimilar upper rotating plate of 40mm diameter. The parallel plate has a flat upper rotating plate and is denoted by PP40.The cone/plate has a conical upper rotating plate with a cone angle of 4o and is denotedby CP4/40.
In addition to the above-described measuring devices, Bohlin rheometer isequipped with a visual cell and normal force measurement device. The visual cell is aC25 device with transparent bob and cup to conduct flow visualization, light scatteringand proppant transport studies. The normal force device is a cone and plate cell in whichthe lower plate is attached to a load measuring device. The normal cell has maximumaxial load capability of 1000 gm and maximum torque capacity of 1000 gm-cm.

4-8
The Bohlin rheometer has a separate temperature bath for fluid characterization atdifferent temperatures. This bath is capable of heating as well as cooling the fluidsamples with circulating oil. The bath is electronically attached to the rheometercomputer controls and is programmed for three temperature control modes: manual,constant and step. These modes provide very delicate control of the fluid temperatureduring the rheological characterization. In addition to the bath for controlling thetemperature, the fluid environment is maintained with a thermal enclosure, whichprevents evaporation of the fluid. The Bohlin rheometer is equipped with a special closedcell to measure the fluid rheology at very high temperatures and pressures. This cell isknown as high pressure cell (HPC) and is capable of rheology measurement upto 284 oFtemperature and 600 psi pressure.
4.6.3 Foam Flow Loop (Pipe Viscometer)
In addition to the rotational rheometers, FFCF has a pipe viscometer that consists of flowloops of different size pipes. This viscometer is designed to characterize several fluidsthat include liquids as well as foams under various pressure and temperature conditions.A schematic of equipment setup used to measure fluid viscosities with the flow loop isshown in Fig. 4.5.
SUM
P
20-gal Tank
3
P D I
10 ft
Triplex Pump
Choke
Mixer
Pressure Regulator
Nitrogen Tank
Sight Glass
Press. Sensor Micromotion®
Gear Pump
Back Press. Regulator
Back Press. Regulator
1/2” OD
1/4” OD
Diff. Press. Sensor
3/8” OD
H
P I
Inj. Port
Fig. 4.5-Equipment Setup for Foam Rheology Measurements

4-9
The flow loop comprises of three pipes of nominal diameters 0.25, 0.375, and 0.5 inch.The loop draws fluid from a 20 gallon tank with the help of triplex and centrifugalpumps. These pumps are variable speed devices that can provide different fluid flowrates through the pipes. The flow rate is measured with a Micromotion mass flow meter,which also measures the fluid density and temperature. The Micromotion measured fluidtemperature is fed to a temperature controller that regulates electric current supply toheating-tapes wrapped around the flow loop pipes. These tapes maintain fluidtemperature, which is a very crucial parameter in the rheological characterization of thefluid. The Micromotion also measures the fluid density from which foam quality iscalculated.
The fluid flow parameters provide nominal shear rates at the wall. The shearstress is calculated by measuring fluid pressure drop across various pipe diameters. Thepressure drop is measured with a differential pressure sensor installed across 10 ft sectionof the pipes.The flow loop is provided with a pressure transducer to measure fluid pressure, which isextremely important for characterization of the foam fluids. The fluid pressure iscontrolled with two backpressure regulators to maintain uniform pressure during therheology study. The flow loop also contains a sight glass for visual inspection of thecirculating fluid. The flow loop has additional provisions for introducing gaseous phaseand crosslinker into the liquid stream. The experimental data gathered from the flow loopis transmitted with a wireless logger to a data acquisition system where the data aredisplayed and stored into electronics files.

5-1
Chapter 5 DATA ACQUISITION
5.1 Introduction
An effort is being made at the WCTC to simulate field conditions at the laboratory level.These conditions allow realistic characterization; the large-scale environment, however,make the experiments very expensive. Thus, in order to minimize costs, it is imperativethat maximum information is acquired from a minimum number of tests. This requiresthat a very reliable data acquisition system be available at the WCTC. The system mustsatisfy bounded response time constraints to acquire real time data.
The data acquisition system is categorized as soft real time and hard real timesystem. The soft real time system means that system failure to meet response timeconstraints will degrade the performance of the data but will not destroy the experiment.An example of the soft system is graphical visualization of the data. The hard real timesystem, on the other hand, means that the system failure leads to complete failure of thedata acquisition system and to void the experiment. Thus, the hard real system failureresults in loss of money and in wastage of valuable time. The data acquisition system atthe FFCF complies with the hard real time categorization. The system has thecomputational power to support analysis, logging, and display of full real time data.The diverse operations performed at the facility require separate data acquisition systemsfor data logging, flow visualization studies and velocimetric measurements. The DataAcquisition and Control system constitutes the Vision System, the Laser DopplerVelocimeters (LDV), Pressure, Temperature and Flow Measurements.
These various systems are briefly described in the following sections. Thedescription also includes discussion on the processing tools used for effective display ofthe acquired data.
5.2 Data Logger System
Initially, a dual architecture was used for logging experimental data. In this system,Masscomp was used to acquire data and IBM RISC was used to perform data reduction,logging, control and display. The data was collected on three IBM personal computersthrough different software packages. The data was then transferred through three RS 232serial lines to an IBM RS/6000, which monitored each data through different softwareprograms. The programs received data, recorded time, and wrote data to file or savedthem on disks. This system performance, however, was unsatisfactory as threecomputers had different data acquisition rates making it impossible to synchronize thethree sets of measurements.
The poor performance of the dual architecture provided a case to establish a newdata acquisition system using Fluke Hydras. The new system improved the display andlogging of the data. The Hydra system is tied to a personal computer reducing the cost ofdata acquisition.
The Hydra system consists of two high speed Flukes which are capable ofmonitoring individual test parameters. The Hydras have very high common mode
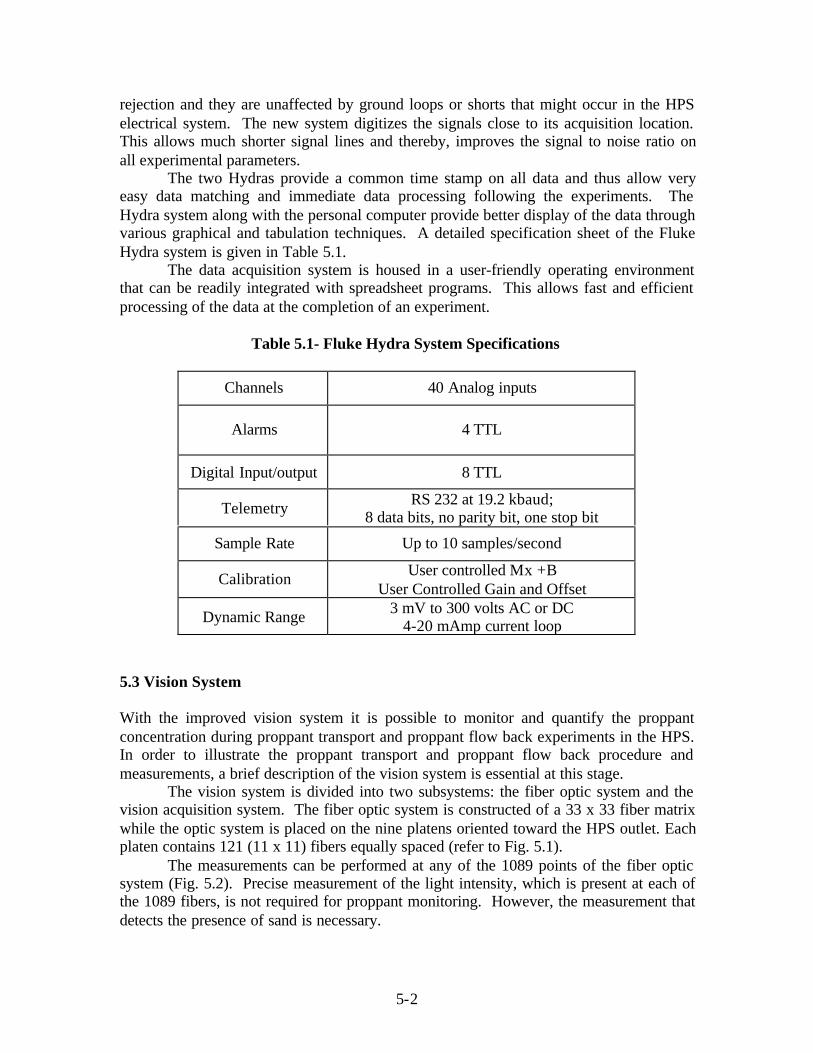
5-2
rejection and they are unaffected by ground loops or shorts that might occur in the HPSelectrical system. The new system digitizes the signals close to its acquisition location.This allows much shorter signal lines and thereby, improves the signal to noise ratio onall experimental parameters.
The two Hydras provide a common time stamp on all data and thus allow veryeasy data matching and immediate data processing following the experiments. TheHydra system along with the personal computer provide better display of the data throughvarious graphical and tabulation techniques. A detailed specification sheet of the FlukeHydra system is given in Table 5.1.
The data acquisition system is housed in a user-friendly operating environmentthat can be readily integrated with spreadsheet programs. This allows fast and efficientprocessing of the data at the completion of an experiment.
Table 5.1- Fluke Hydra System Specifications
Channels 40 Analog inputs
Alarms 4 TTL
Digital Input/output 8 TTL
Telemetry RS 232 at 19.2 kbaud;8 data bits, no parity bit, one stop bit
Sample Rate Up to 10 samples/second
Calibration User controlled Mx +BUser Controlled Gain and Offset
Dynamic Range 3 mV to 300 volts AC or DC4-20 mAmp current loop
5.3 Vision System
With the improved vision system it is possible to monitor and quantify the proppantconcentration during proppant transport and proppant flow back experiments in the HPS.In order to illustrate the proppant transport and proppant flow back procedure andmeasurements, a brief description of the vision system is essential at this stage.
The vision system is divided into two subsystems: the fiber optic system and thevision acquisition system. The fiber optic system is constructed of a 33 x 33 fiber matrixwhile the optic system is placed on the nine platens oriented toward the HPS outlet. Eachplaten contains 121 (11 x 11) fibers equally spaced (refer to Fig. 5.1).
The measurements can be performed at any of the 1089 points of the fiber opticsystem (Fig. 5.2). Precise measurement of the light intensity, which is present at each ofthe 1089 fibers, is not required for proppant monitoring. However, the measurement thatdetects the presence of sand is necessary.

5-3
Fig. 5.1 The Vision System

5-4
Fig. 5.2 Fiber Optic Outlets in the HPS
To accomplish the task of proppant monitoring, the raw videotape images acquiredduring a test are enhanced into fine images with the help of software developed withinthe facility.
The data acquisition system for the vision system comprises black and whitecharged coupled device (CCD) cameras, digital signal processing (DSP) frame grabber,enhanced display board (EDB), and frame accurate video recorders. These instruments

5-5
help to digitize, quantify, map, display, and store video data during experimentsperformed with the HPS. A schematic of the data acquisition system is shown in Fig. 5.3.
The slot image is acquired using nine cameras which output the images inNational Television System Committee (NTSC) video signals at a rate of 30 frames persecond. The video signals are driven by a nine channel gain controller device throughcables to the data acquisition room. The individual image from the nine cameras isincorporated into a composite image signal using a video multiplexer, which generates2.7 frames per second. The composite image is named as raw image and issimultaneously displayed on monitor and recorded on a Hi 8 mm video tape for futurereference. An example of the raw image generated from the slot is shown in Fig. 5.4.
9 ChannelVideoDriver
NTS
C
75 foot cables
9 CCD Cameras
VideoMultiplixer P5-200 PC
DSP Frame Grabber
EDB
Hi 8mm VCR
Hi 8mm VCRScan Converter
Mounted on the HPS In the data acquisition room
NTSC
SVGA
NTSC
Displays unprocessedimages
Displays realtime processed images
PCI Bus
statusbar
Fig. 5.3-A Schematic of Data Acquisition System for Vision System
The raw image is digitized by the DSP frame grabber and displayed by the EDB. TheDSP allows the system to process one image as it grabs another, and the EDB displaysthe processed image in real time. Both the DSP and EDB boards are hosted in a personalcomputer on the PCI bus.
The digitized image is processed to obtain light intensities which are thenconverted to sand concentration using models developed at the FFCF. The real timeprocessing of the image is performed with the help of a computer program written in C++and TMS 32C40 assembly language. The program flowchart is enclosed in Fig. 5.5. Theprogram generates base light intensity array, and processes and displays the fluid flowimages in real time.

5-6
Fig. 5.4-Raw Image of Slot Acquired by the Vision System
Initialize DSPFrame Grabber
and EDB
Upon a key stroke,digitize raw base
image(512x512)
Determine the(x,z) coordinates of
the 33x33 fibers
Compute the33x33 IO
(base lightintensity) matrix
Identify ( i,j ) of thefibers whose
IO = 0
Digitize a new rawimage
(512x512)
Using the ( x,z)coordinates,
compute the 33x33I matrix
Generate the33x33 g gray
matrix (processedimage)
Stop
Identify the dune fibers andassign 0 gray value in theirrespective locations in the
processed image
Compute platenproppant density Cusing equation (1)
and (3) or (5)
Expand the 33x33gray image into
(400x400) image usingbilinear interpolation
Display theprocessed
image(400x400)
Paste realtime statusbar besidesthe image
Quit
Replace them with Iacomputed by averaging
their corresponding 8neigboring IO
Yes
No
Fig. 5.5-Algorithm Flow Chart to Process Raw Image

5-7
The processed image is also available in NTSC format. It is displayed on a monitor andrecorded on Hi 8 mm video tape. The processed image is shown in Fig. 5.6.
Fig. 5.6-Processed Image of Fig. 5.2
5.4 Laser Doppler Velocimetry (LDV) System
The data acquisition system for the LDV system were evaluated and reevaluated toimprove its accuracy and effectiveness in the velocimetric measurements. Based on theseevaluations, a number of improvements were made in the LDV system. These changesincluded installation of a new software called Flow Information Display (FINDTM),updating the methodology used to locate fracture wall at the beginning of the test, andutilization of sensitive filtering methods to decrease the signal to noise ratio.
FIND provides detailed data analysis and storage, automated probe traversing anddisplay of results. The new methodology comprises of locating the far-wall with theLDV and then, systematically traversing the gap width to obtain a velocity profile. Thefar-wall is located by monitoring and observing noise in the signal with an oscilloscope.
The velocity data is acquired with the probe in a horizontal position to measurehorizontal velocity. The probe is then rotated to an angle of 45o above and below thehorizontal position. The velocity measured in the rotated position is resolved into verticaland horizontal components. The horizontal component is called indirect measurements.It is compared with the velocity measured directly with the probe in the horizontal

5-8
position. This comparison provides a good check on the velocities measured with theLDV system.
A comparison between the velocities measured directly and indirectly is shown inFig. 5.7 for a HPG polymer solution flowing through a 0.25" slot gap. The figure showsexcellent agreement between the two sets of measurements.
0.000
0.050
0.100
0.150
0.200
0.250
0.300
0.350
0.400
0.450
0.500
0.0000 0.0032 0.0064
y (m)
U (
m/s
)
U Udir Uindir
Fig. 5.7-Velocity Profile for Flow of Linear HPG solution through a Gap of 0.25"

6-1
Chapter 6 LABORATORY RHEOLOGY INSTRUMENTS
6.1 Introduction
Rheological characterization of a fluid is extremely important to understand theirbehavior during drilling and completion of a well. With the known characteristics, thefluid can be optimized and designed before their use in the reservoir.
The fluid characterization is best performed with viscometers, which are simpledevices that provide the flexibility to study the fluid behavior under several shear rates,flow geometries, and pressure-temperature conditions. When the viscometricmeasurements are combined with a field-representative sample preparation and loadingmethod, the fluid characterization resembles the real reservoir environment.
FFCF has several rheological instruments, which include rotational, pipe and slotviscometers. These instruments are described in the following section. The descriptionprovides the instruments dimensions, operation principles and capabilities. It alsodiscusses the modifications made in these instruments to enhance their capabilities forspecific fluid applications. Some instruments were bought from the manufacturers andmodified; others were designed and developed at the FFCF itself.
6.2 Model 35 Fann Viscometer
Fann viscometer is a rotational type instrument that works as a controlled strain device.It uses concentric cylinder geometry to measure the fluid properties.
The viscometer comprises of an outer cylinder, known as rotor, and an innercylinder, called a bob. The annular space between the two cylinders contains the fluid tobe characterized. The rotor is driven at a predetermined rotational rate in the fluidsample; the cylinder rotation induces movement in the fluid, and exerts viscous drag onthe inner bob. The drag on the bob is balanced by a helically wound spring and is read asdeflection on a calibrated dial available on the viscometer. From the rotational rate anddial reading, shear rate and shear stress are calculated. These values are, then, used todetermine apparent viscosity of the fluid.
The rotor has an inner radius of 1.8415 cm and bob has an outer radius of 1.7245cm. The bob has a length of 3.8 cm and it provides a very large surface area for accuratemeasurements of fluid drag. The sensitivity of the instrument is further improved byusing two separate springs No. 1 and 1/5th. The number 1/5th spring is very useful formeasuring viscosities of thin fluids.
The fluid viscosities are calculated at several shear rates by varying the rotationalrates of the rotor in the fluid. With these viscosities, rheograms are developed for the testfluids. The measured data are fit with appropriate rheological model to describe fluidbehavior and to predict the fluid viscosities at the shear rates of interest to the industry.
The Fann viscometer is a very rugged and robust instrument. It is very helpful toprovide a quick check on the fluid behavior and to compare the fluid viscosities withother measuring devices. The Fann viscometer is frequently calibrated and serviced tomaintain its accuracy to measure the fluid viscosities.

6-2
6.3 Nordman Rheometer
Like the Fann viscometer, Nordman rheometer is also a controlled rate instrument withconcentric cylinder geometry. Here also, the shear rate is applied on the cup through therotor motion and the viscous drag is measured on the bob. Unlike Fann, Nordmanviscometer has a closed rotating sleeve as the sample cup. Nordman rheometer is themost widely used instrument to characterize crosslinked fracturing fluids.
The Nordman rheometer has more features than those in Fann 35 viscometer. Therheometer is completely computerized and is capable of measuring fluid properties upto1000 psig pressure and 500oF temperature. The instrument can heat the fluid sample withan external oil bath while simultaneously measuring the fluid viscosities. The instrumentalso has provision to apply pressure on the fluid sample and to offset any increase in fluidvapor pressure at higher temperatures. A photograph of the Nordman rheometer is shownin Figure 6.1.
Figure 6.1- Nordman Rheometer

6-3
The Nordman rheometer is capable of measuring the fluid viscosities with different sizebobs. The rheometer, available at the FFCF, has three bobs: B1, B2x and B5x. The B1bob has an outer radius of 1.7245 cm and is 7.62 cm high, the B2x has an outer radius of1.2308 cm and is 8.529 cm high, and the B5x has an outer radius of 1.5987 cm and is9.19 cm high. The rotating cup is similar for the three bobs, and is of 1.8415 cm innerradius.
The Nordman rheometer is programmed to perform several types of test. Theprogram allows to perform standard as well as specific tests like API, custom, one-rateand calibration tests. The API and one rate tests are designed from API recommendedstandard procedures to evaluate fluid viscosities, whereas, the custom test is designed bythe FFCF laboratory requirements. The calibration test is performed to evaluate theperformance of the viscometer with the help of standard oils; in this test, the oil viscosityis programmed into the Nordman software, and the instrument adjusts the rheometerparameters to the calibration oil specifications.
The fluid samples are loaded into the Nordman rheometer by pouring the sampleinto the measuring cup. In addition to the manual loading, the sample can be transferredinto the cup using a snap-on coupling assembly available at the bottom of the cup. Thisarrangement permits simultaneous loading and shearing of the fluid. The bottom-loadingprovision is very helpful for the characterization of time-dependent drilling and fracturingfluids. Because of the significance of this method, a dynamic loading system wasdesigned to enhance the rheometer capability for online measurements of the fluidviscosities. A schematic of the designed experimental set up is shown in Figure 6.2.
Nordman Rheometer
Syringe Pump
Differential PressureMeasurement Device
Coiled tubing20 ft Long, 0.19” inches ID
Hig
h P
ress
ure
Sim
ulat
or~2
00 p
si B
ack
Pre
ssur
e
Flush Line
HL
Figure 6.2- Dynamic Loading System Designed for the Nordman Rheometer

6-4
Figure 6.2 shows that the dynamic loading system as attached to the High PressureSimulator (HPS), from where the fluid sample is drawn. A three-way valve is used toisolate the loading system from the HPS. The fluid is withdrawn from the HPS into a 20ft long coiled tubing. The amount of fluid drawn into the coiled tubing depends on thevolumetric capacity of the bob-cup geometry used in the measurement. Once a sufficientvolume of the sample is drawn into the tubing, the three-way valve is adjusted to divertthe fluid from the tubing to the rheometer. The fluid flow rate is carefully controlled sothat the sample is subjected to identical shear rate in HPS, coiled tubing and therheometer. The dynamic loading system has been successfully used to characterize andto generate reproducible rheology data for crosslinked fracturing fluids.
6.4 Bohlin Rheometer
Bohlin rheometer is a unique instrument available at the FFCF. This rheometer isdifferent from the Fann and Nordman viscometers. Unlike the two controlled rateviscometers, Bohlin rheometer is a controlled stress instrument in which a shear stress isapplied and resultant shear rate is measured. The Bohlin rheometer is capable of utilizingdifferent measuring geometries and measuring viscosity as well as viscoelasticcharacteristics of the fluid, whereas the two viscometers only use concentric cylindergeometry and measure fluid viscosity only. A photograph of the Bohlin rheometer isshown in Figure 6.3.
Figure 6.3- Bohlin Rheometer

6-5
The Bohlin rheometer works with a unique drag cup motor that applies torque tothe fluid sample. This torque is transmitted through the measurement geometry to thefluid sample with the help of a frictionless air bearing. The applied torque inducesshearing into the sample and the resultant displacement is measured with a highlysensitive optical angular position transducer. The state-of-the-art instrumentation on theBohlin rheometer makes it a very accurate and versatile equipment.
The Bohlin rheometer is equipped with three measuring geometries: concentriccylinder, parallel plate, and cone and plate. The concentric cylinders are available in twobob diameters, 14 and 25 mm, and are respectively denoted as C14 and C25. The bobsare used in cups so that cup to bob radius ratios is similar at 1.1. The other twomeasuring devices, parallel plate and cone and plate, are different from the concentriccylinders because of their different geometric configurations. Both of these plates havesame fixed bottom plate of 60 mm diameter but a dissimilar upper rotating plate of 40mm diameter. The parallel plate has a flat upper rotating plate and is denoted by PP40.The cone/plate has a conical upper rotating plate with a cone angle of 4o and is denotedby CP4/40.In addition to the above-described measuring devices, Bohlin rheometer is equipped witha visual cell and normal force measurement device. The visual cell is a C25 device withtransparent bob and cup to conduct flow visualization, light scattering and proppanttransport studies. The normal force device is a cone and plate cell in which the lowerplate is attached to a load measuring device. The normal cell has maximum axial loadcapability of 1000 gm and maximum torque capacity of 1000 gm-cm.
The Bohlin rheometer has a separate temperature bath for fluid characterization atdifferent temperatures. This bath is capable of heating as well as cooling the fluidsamples with circulating oil. The bath is electronically attached to the rheometercomputer controls and is programmed for three temperature control modes: manual,constant and step. These modes provide very delicate control of the fluid temperatureduring the rheological characterization. In addition to the bath for controlling thetemperature, the fluid environment is maintained with a thermal enclosure, whichprevents evaporation of the fluid.
The Bohlin rheometer is equipped with a special closed cell to measure the fluidrheology at very high temperatures and pressures. This cell is known as high pressurecell (HPC) and is capable of rheology measurement upto 284 oF temperature and 600 psipressure.
The HPC is made up of two receptacles to fit the rheometer socket, hold fluidsample and apply torque on the fluid. The HPC is also a concentric cylinder geometry inwhich the torque applied by the motor is magnetically transferred from an outer couplingto an inner rotor bob. The bob, then, apply the desired shear on the fluid. The HPC canbe filled by either pouring the fluid into the open cell or by injecting the sample through aside valve in the closed cell. A schematic of the HPC is shown in Figure 6.4.
The HPC was supplied separately as a specially designed geometry. It had someinherent operational drawbacks as it had no provision to directly measure fluidtemperature; a thermocouple installed in the oil bath is used to monitor and maintain thetest fluid temperature. This indirect measurement caused the rheometer to make rheologymeasurements on the fluid sample which was not representative of the test conditions.The second shortcoming of the HPC is due to manual loading of the fluid sample. While
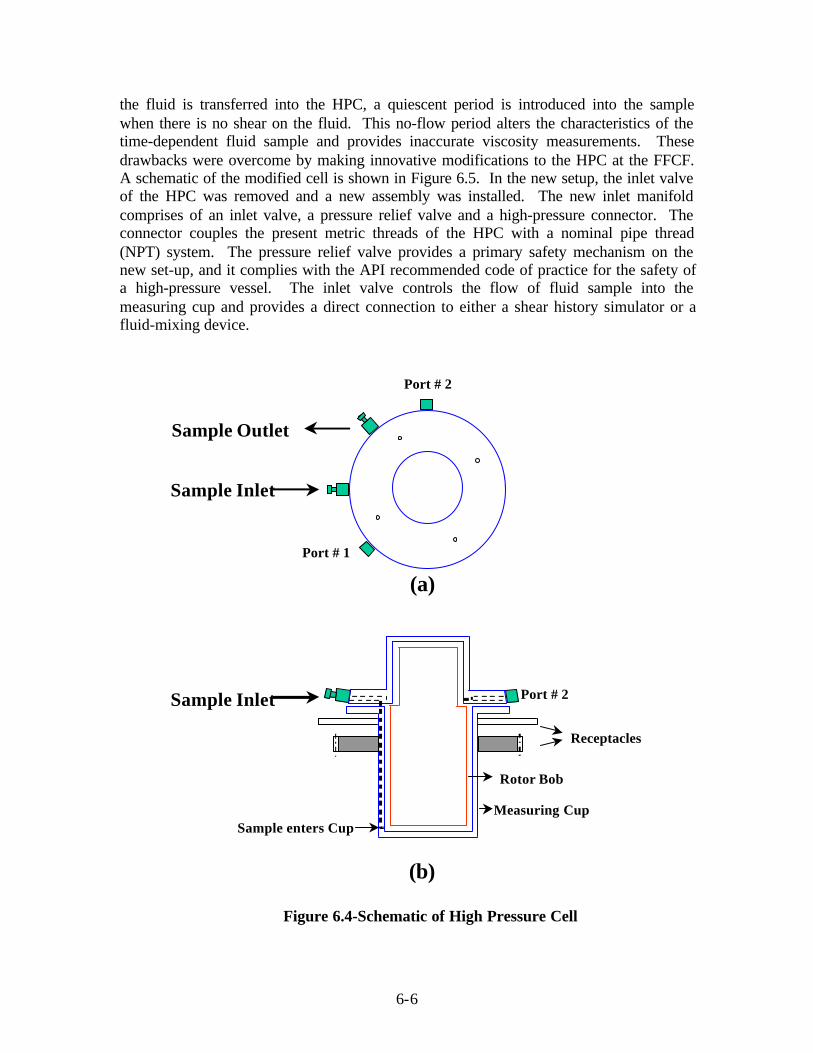
6-6
the fluid is transferred into the HPC, a quiescent period is introduced into the samplewhen there is no shear on the fluid. This no-flow period alters the characteristics of thetime-dependent fluid sample and provides inaccurate viscosity measurements. Thesedrawbacks were overcome by making innovative modifications to the HPC at the FFCF.A schematic of the modified cell is shown in Figure 6.5. In the new setup, the inlet valveof the HPC was removed and a new assembly was installed. The new inlet manifoldcomprises of an inlet valve, a pressure relief valve and a high-pressure connector. Theconnector couples the present metric threads of the HPC with a nominal pipe thread(NPT) system. The pressure relief valve provides a primary safety mechanism on thenew set-up, and it complies with the API recommended code of practice for the safety ofa high-pressure vessel. The inlet valve controls the flow of fluid sample into themeasuring cup and provides a direct connection to either a shear history simulator or afluid-mixing device.
Sample Inlet
Sample Outlet
Port # 2
Port # 1
(a)
Port # 2
Measuring Cup
Sample Inlet
Rotor Bob
Receptacles
Sample enters Cup
(b)
Figure 6.4-Schematic of High Pressure Cell

6-7
Sample Inlet
Sample Outlet
to Thermocouple
Port # 1(a)
1 32
4 1 Inlet valve2 Safety Valve3 Coupling4 Thermocouple
Measuring Cup
Sample Inlet
Rotor Bob
Receptacles
Sample enters Cup
41 3
(b)
Figure 6.5-Modified HPC with Dynamic Sample Loading Capability
The new setup also avoids the problems associated with the fluid temperature. Now, thetemperature can be measured with an external thermocouple installed in a port of theHPC. The thermocouple tip goes all the way to the fluid sample and monitors actualfluid temperature during the rheology measurements. The new inlet valve setup,thermocouple and the HPC were hydraulically tested to an operating pressure of 400 psigat ambient temperature.
The new setup provides a unique dynamic loading capability to the HPC. Itmaintains a fluid continuum for the rheological characterization of the fracturing fluids.This setup always maintains shearing conditions on a crosslinked fluid and thus, iteliminates any quiescent period prior to the viscometric measurements, and allows moreaccurate fluid characterization. Moreover, the new setup allows fluid circulation throughthe HPC; this ensures that sufficient quantity of fluid is sampled in the viscometerwithout measuring the quantity. Hence, the new setup can also be used as an onlinedevice to monitor fluid properties while performing an actual hydraulic fracturingtreatment.
6.5 Foam Flow Loop
In addition to the rotational rheometers, FFCF has a pipe viscometer that consists of flowloops of different size pipes. This viscometer is designed to characterize several fluids

6-8
that include liquids as well as foams under various pressure and temperature conditions.A photograph of the foam flow loop is shown in Figure 6.6, and a schematic ofequipment setup used to measure fluid viscosities with the flow loop is shown in Figure6.7.
Figure 6.6-Foam Flow Loop
The flow loop comprises of three pipes of nominal diameters 0.25, 0.375, and 0.5 inch.The loop draws fluid from a 20 gallon tank with the help of triplex and centrifugalpumps. These pumps are variable speed devices that can provide different fluid flowrates through the pipes. The flow rate is measured with a Micromotion mass flow meter,which also measures the fluid density and temperature. The Micromotion measured fluidtemperature is fed to a temperature controller that regulates electric current supply toheating-tapes wrapped around the flow loop pipes. These tapes maintain fluidtemperature, which is a very crucial parameter in the rheological characterization of thefluid. The Micromotion also measures the fluid density from which foam quality iscalculated.
The fluid flow parameters provide nominal shear rates at the wall. The shearstress is calculated by measuring fluid pressure drop across various pipe diameters. Thepressure drop is measured with a differential pressure sensor installed across 10 ft sectionof the pipes.

6-9
The flow loop is provided with a pressure transducer to measure fluid pressure,which is extremely important for characterization of the foam fluids. The fluid pressureis controlled with two backpressure regulators to maintain uniform pressure during therheology study. The flow loop also contains a sight glass for visual inspection of thecirculating fluid. The flow loop has additional provisions for introducing gaseous phaseand crosslinkers into the liquid stream.
The experimental data gathered from the flow loop is transmitted with a wirelesslogger to a data acquisition system where the data are displayed and stored into electronicfiles.
SUM
P
20-gal Tank
3
PDI
10 ft
Triplex Pump
Choke
Mixer
Pressure Regulator
Nitrogen Tank
Sight Glass
Press. Sensor Micromotion®
Gear Pump
Back Press. Regulator
Back Press. Regulator
1/2” OD
1/4” OD
Diff. Press. Sensor
3/8” OD
H
P I
Inj. Port
Figure 6.7-Equipment Setup for Foam Rheology Measurements
6.6 Plexiglass Parallel Plate Slot
As a fracture is represented by parallel plate, slot provides a better geometry tocharacterize fracturing fluids than either pipe or rotational viscometer. Therefore, a
6-10
mobile plexiglass parallel plate slot is available at the FFCF to measure fluid viscosity.The slot is 1 ft high and 4 ft long and is set for single gap width of 0.25 inch. The slotcontains two ports in the inlet and outlet section to simulate perforations. The slot ismade from plexiglass sheets to make visual observations during the rheologicalcharacterization.
In addition to the viscosity measurements, the slot has been used to captureimages and observe particle movement in a fracture. The slot has also been used tocalibrate Laser Doppler Velocimetry, cameras and vision system installed on the HighPressure Simulator. The slot has been used to determine length where entrance effectsare significant in parallel plate geometry, and to study jet entry effects and penetrationlengths where turbulent effects cease and uniform flow begin. These studies were veryhelpful to design the HPS as no data were available for the fluid flow through parallelplate device.

7-1
Chapter 7 RESEARCH RESULTS AND IMPLICATIONS
7.1 Introduction
During the lifetime of the FFCF project, the research efforts were focused on eightdifferent aspects of the hydraulic fracturing stimulation. These research areas includedproppant transport, fluid rheology, heat transfer, proppant flowback, foam fluid rheology,dynamic fluid loss, perforation pressure loss and tubular friction loss. These researchareas are briefly described in the present chapter.
The chapter is subdivided in several sections. Each section contains theobjectives of the individual research area, a brief introduction or significance of thestudy, the procedure used to perform experimental investigation, and the discussions ofthe major results obtained for the respective research. In addition to the above mentionedsections, two sections are included at the end to list the references and nomenclaturesused in the chapter.
7.2 Correlating Proppant Transport with Fluid Rheology
Objective: The objective of this study is to better understand the correlation between acrosslinked gel rheology and its proppant transport capabilities, and to identify arheological property to predict proppant transport through a fracture.
Introduction: The guar-based fracturing fluids are viscoelastic fluids and arecharacterized by both elastic and viscous components. Among these two parameters,fluid viscosity is more extensively evaluated and is being used to describe fracturing fluidbehavior.1-2 However, the viscosity does not correlate well with proppant transport in afracture. Hannah and Harrington,3 and Clark and Quadir4 found that the experimentallyobserved settling velocities in an uncrosslinked or a crosslinked fluid are very differentfrom the values calculated with viscosity-based correlations. Because of thesedifferences, Power approached the proppant settling problem from a gel point criterion.5
He correlated sand settling under static conditions with the fluid gel point, which isdescribed with a maximum in the loss modulus of crosslinked fluids.6,7 Similarly,Acharya,8 de Kruijf et al.,9 and Jin and Penney10 studied fluid elasticity or storagemodulus to understand particle suspension in fractures. de Kruijf et al. even proposed anelastic modulus criterion for predicting proppant transport in a fracture, which wassupported only with sand settling studies carried out in static fluid conditions. None ofthese studies confirmed its results under slurry flow conditions.5-10 Because fluidviscosity does not describe proppant settling, and fluid elasticity has not been confirmedwith large scale testing, there is a great need to better correlate proppant transportcapabilities with crosslinked guar gel rheology.
Procedure: A guar concentration of 35 lb/Mgal was used to understand the correlationbetween the proppant transport and fluid rheology. This concentration was selectedbecause of its wide use in the fracturing treatments. The guar solution pH was adjusted

7-2
to 9, 10, and 11 respectively with sodium hydroxide and muriatic acid. These pH-adjusted solutions were then crosslinked at different crosslinker quantities of a borate-crosslinking solution. The crosslinker concentration was varied from nil to values wherethe borate-crosslinked gels exhibit phase separation. The formulated fluids were theanalyzed in the laboratory for their viscoelastic properties and for their sand suspensioncapacities. From the laboratory characterization results, a crosslinker concentration wasselected at each pH to prepare borate-crosslinked guar gel to further evaluate it for itsproppant transport capabilities using two large size slot models, which simulate flow offluids through fracture. A schematic of the large scale testing is shown in Figure 7.2.1.
DP
MASS FLOWMETER
Disposal Tank
CENTRIFUGAL PUMP(GALIGHER)
50bbls.
50bbls.
FLUID MIXING AND STORAGE TANKS
TR
IPLE
X P
UM
P
CO
ILED
-TU
BIN
G R
EE
LS
2000 ft
1000 ft
GP
T
DP
ST
RA
IGH
T S
EA
ME
D T
UB
ING
HPS SLOT FLOW APPARATUS
Clear Slot
Sump
MAGNETIC FLOWMETER
ISCO Pump
DP
VERTICAL DOUBLE PIPEHEAT EXCHANGER
T
T
T
Figure 7.2.1A Schematic of the Equipment Set-Up for Large Scale Testing
Results:Borate-Crosslinked 35 lb/Mgal Guar pH 9First the pH of the guar solution was adjusted to 9. The solution was then crosslinkedwith crosslinker quantities from 0 to 15 lb/Mgal.
The viscoelastic data of the borate-crosslinked guar gel at pH 9 is shown in Fig.7.2.2. The figure shows an increase in elastic and viscous moduli with an increase in thecrosslinker concentrations. This is because with an increase in the crosslinkerconcentration, the borate ions concentration increases, which increases the number ofcrosslinked sites formed in the polymer. As a result, higher G’ and G” values areobserved in the gels prepared at higher crosslinker concentrations.
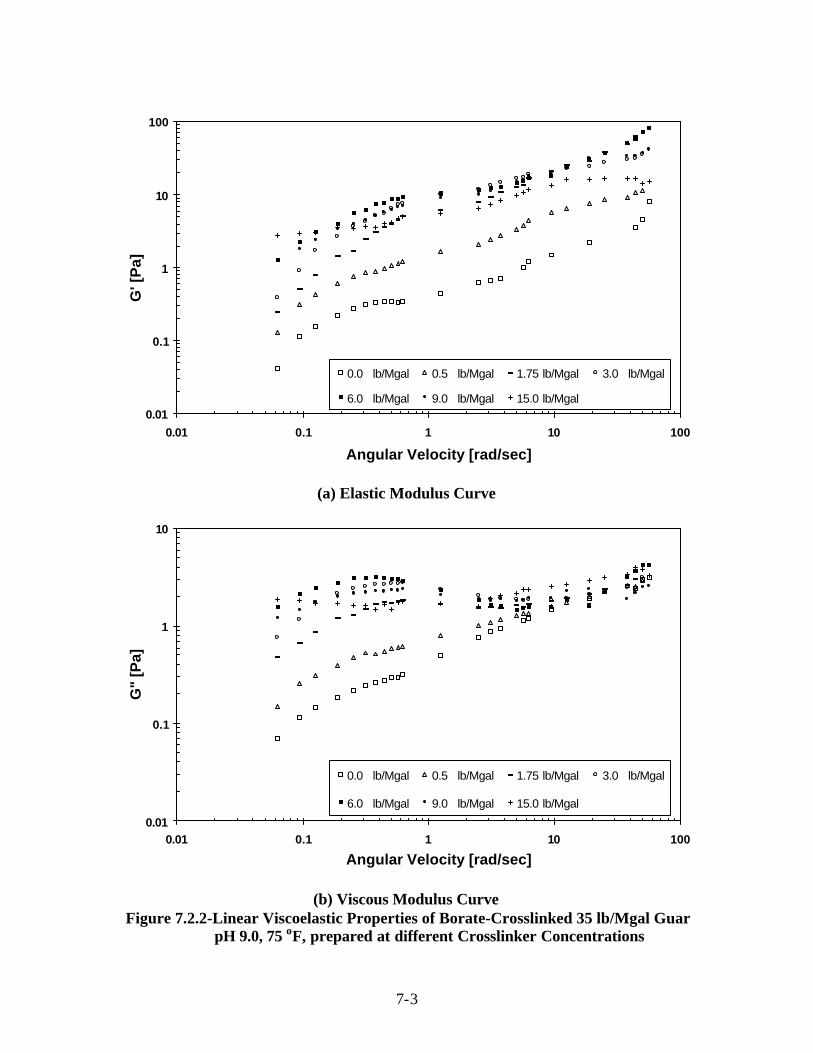
7-3
0.01
0.1
1
10
100
0.01 0.1 1 10 100
Angular Velocity [rad/sec]
G' [
Pa]
0.0 lb/Mgal 0.5 lb/Mgal 1.75 lb/Mgal 3.0 lb/Mgal
6.0 lb/Mgal 9.0 lb/Mgal 15.0 lb/Mgal
(a) Elastic Modulus Curve
0.01
0.1
1
10
0.01 0.1 1 10 100
Angular Velocity [rad/sec]
G"
[Pa]
0.0 lb/Mgal 0.5 lb/Mgal 1.75 lb/Mgal 3.0 lb/Mgal
6.0 lb/Mgal 9.0 lb/Mgal 15.0 lb/Mgal
(b) Viscous Modulus CurveFigure 7.2.2-Linear Viscoelastic Properties of Borate-Crosslinked 35 lb/Mgal Guar
pH 9.0, 75 oF, prepared at different Crosslinker Concentrations
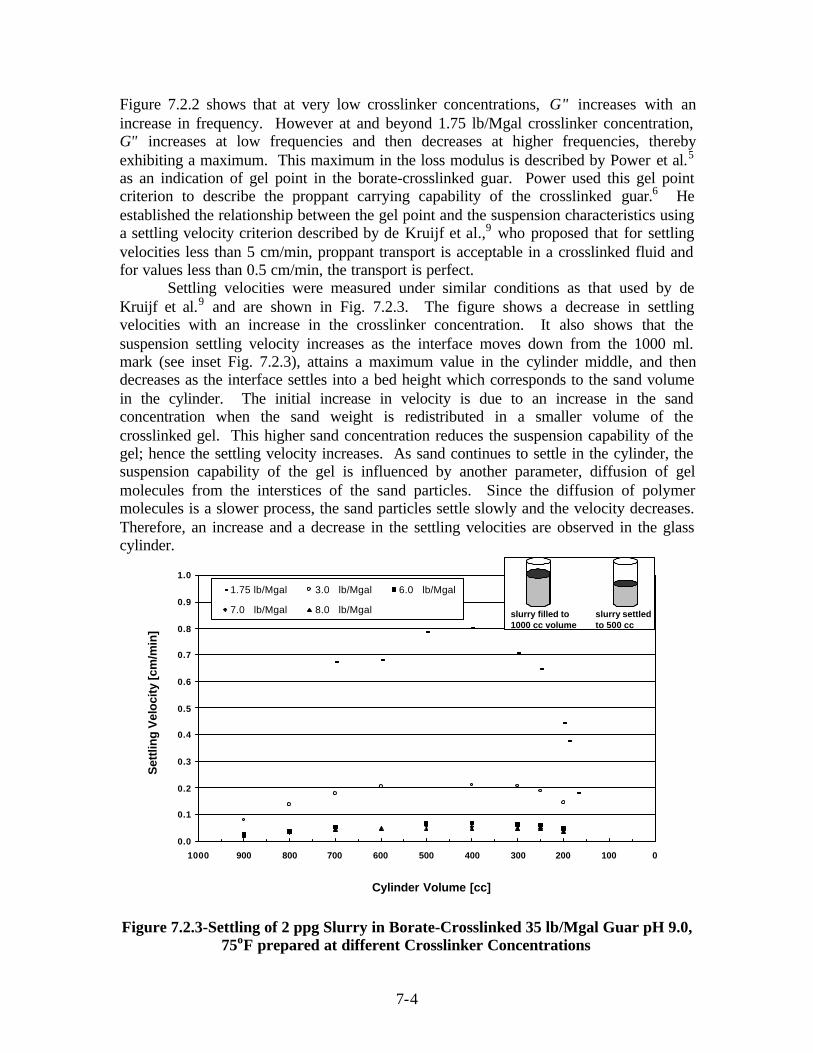
7-4
Figure 7.2.2 shows that at very low crosslinker concentrations, G" increases with anincrease in frequency. However at and beyond 1.75 lb/Mgal crosslinker concentration,G" increases at low frequencies and then decreases at higher frequencies, therebyexhibiting a maximum. This maximum in the loss modulus is described by Power et al.5
as an indication of gel point in the borate-crosslinked guar. Power used this gel pointcriterion to describe the proppant carrying capability of the crosslinked guar.6 Heestablished the relationship between the gel point and the suspension characteristics usinga settling velocity criterion described by de Kruijf et al.,9 who proposed that for settlingvelocities less than 5 cm/min, proppant transport is acceptable in a crosslinked fluid andfor values less than 0.5 cm/min, the transport is perfect.
Settling velocities were measured under similar conditions as that used by deKruijf et al.9 and are shown in Fig. 7.2.3. The figure shows a decrease in settlingvelocities with an increase in the crosslinker concentration. It also shows that thesuspension settling velocity increases as the interface moves down from the 1000 ml.mark (see inset Fig. 7.2.3), attains a maximum value in the cylinder middle, and thendecreases as the interface settles into a bed height which corresponds to the sand volumein the cylinder. The initial increase in velocity is due to an increase in the sandconcentration when the sand weight is redistributed in a smaller volume of thecrosslinked gel. This higher sand concentration reduces the suspension capability of thegel; hence the settling velocity increases. As sand continues to settle in the cylinder, thesuspension capability of the gel is influenced by another parameter, diffusion of gelmolecules from the interstices of the sand particles. Since the diffusion of polymermolecules is a slower process, the sand particles settle slowly and the velocity decreases.Therefore, an increase and a decrease in the settling velocities are observed in the glasscylinder.
0.0
0.1
0.2
0.3
0.4
0.5
0.6
0.7
0.8
0.9
1.0
01002003004005006007008009001000
Cylinder Volume [cc]
Set
tling
Vel
ocity
[cm
/min
]
1.75 lb/Mgal 3.0 lb/Mgal 6.0 lb/Mgal
7.0 lb/Mgal 8.0 lb/Mgal slurry filled to 1000 cc volume
slurry settledto 500 cc
Figure 7.2.3-Settling of 2 ppg Slurry in Borate-Crosslinked 35 lb/Mgal Guar pH 9.0,75oF prepared at different Crosslinker Concentrations

7-5
Figure 7.2.3 shows that the suspension settling velocity in the borate crosslinked gelprepared with 1.75 lb/Mgal is in the range of values described by de Kruijf et al.9 to beacceptable for proppant transport in a fracture. Furthermore, this concentration satisfiesthe gel point criteria of Power et al.,5 as it has a maximum in the loss modulus curve ofFigure 7.2.2. Thus, the borate-crosslinked guar pH 9 prepared with 1.75 lb/Mgalcrosslinker concentration satisfies the Power6 and de Kruijf et al.9 criteria and shouldexhibit acceptable proppant transport in a fracture. Hence, this gel was further evaluatedin the slot models for its sand transport behavior.
The sand distribution in the HPS is shown in Fig. 7.2.4 when a 2 ppg slurry in theborate-crosslinked guar prepared with 1.75 lb/Mgal crosslinker is pumped through theslot model. The figure shows the image as a 33 by 33 matrix which corresponds to thenumber of fibers placed along the length and height of the HPS. The sand concentrationis described as a combined image captured by all fibers. Figure 7.2.4 describes only twoframes of the captured image, which are obtained after 5 and 20 min. of slurry flowthrough the HPS.
5 10 15 20 25 30
Frames Along the HPS Length
5
1 0
1 5
2 0
2 5
3 0
Fra
mes
Alo
ng
the
HP
S H
eigh
t
0
2
4
6
8
10
12
5 mins
5 10 15 20 25 30
Frames Along the HPS Length
5
1 0
1 5
2 0
2 5
3 0
Fra
mes
Alo
ng
the
HP
S H
eigh
t
20 mins
Figure 7.2.4-Sand Concentration (ppg) in the HPS after 5 and 20 mins of2 ppg Slurry Transport with Borate-Crosslinked 35 lb/Mgal Guar pH 9.0 at
1.75 lb/Mgal, 75oF
Figure 7.2.4 shows that the gel would not be very good at suspending and transportingsand because of very high sand concentrations in the bottom-half of the HPS and verylow sand concentrations at the top. Clearly, the sand particles settled during slurry flowthrough the HPS. The sand accumulation at the bottom means that the sand flowing outof the HPS has a lower concentration than 2 ppg. Hence there would be insufficient sandavailable in a real fracture, especially since a real fracture is much longer than this slotmodel. Now, if the proppant distribution is insufficient in the entire fracture, theproductivity of the fracture will be inadequate and the stimulation treatment would beunsuccessful. This observation is made despite the fact that this gel satisfied both the gelpoint and the settling velocity criteria. Hence, these slot tests indicate that these twocriteria are insufficient to describe the proppant transport capability of borate-guar gels.

7-6
The sand transport capability of the borate-crosslinked guar gel might beimproved if a higher crosslinker concentration is used because the suspension settlingvelocities are lower in gels with higher crosslinker concentrations. Possibly, the highercrosslinker would also improve the gel capability to transport proppant through thefracture. Therefore a higher crosslinker concentration of 6 lb/Mgal was selected, and thenew gel was evaluated in the slot model. At this concentration, the proppant distributionis shown in Fig. 7.2.5 after 5 and 20 min. of slurry flow through the HPS. This figureshows a large improvement in the suspension capability of the gel because the sandconcentration is uniform in the slot, and there is no settled bed in the HPS bottom. Thefigure does show some clusters of higher sand concentration, a phenomenon that isfrequently observed in crosslinked guar. These clusters, however, are suspended in thegel and would be easily carried away with the gel through the fracture. Thus, the 6lb/Mgal crosslinked gel would keep the proppant suspended in the fracture and wouldimprove the productivity of the stimulated formation.
5 10 15 20 25 30
Frames Along the HPS Length
5
1 0
1 5
2 0
2 5
3 0
Fram
es A
long
the
HP
S H
eigh
t
0
2
4
6
8
10
12
5 mins
5 10 15 20 25 30
Frames Along the HPS Length
5
1 0
1 5
2 0
2 5
3 0
Fram
es A
long
the
HP
S H
eigh
t
20 mins
Figure 7.2.5-Sand Concentration (ppg) in the HPS after 5 and 20 mins of 2 ppg Slurry Transport with Borate-Crosslinked 35 lb/Mgal Guar pH 9.0 at
6.0 lb/Mgal, 75oF
The satisfactory proppant transport seen in Figure 7.2.5 indicates that a higher crosslinkdensity is required to perform a satisfactory stimulation treatment with borate-crosslinkedguar gel than either the Power6 or de Kruijf9 criterion predicts. The question remainswhat is the proper viscoelastic property to correlate to the proppant transport behavior.
Borate-crosslinked 35 lb/Mgal Guar pH 10Figure 7.2.6 shows the viscoelastic properties data, and Fig. 7.2.7 describes the settlingvelocity in the borate-crosslinked guar prepared at pH 10 with different crosslinkerconcentrations.

7-7
0.1
1
10
100
0.01 0.1 1 10 100
Angular Velocity [rad/sec]
G' [
Pa]
0.0 lb/Mgal 0.2 lb/Mgal 0.5 lb/Mgal
1.0 lb/Mgal 1.75 lb/Mgal 5.0 lb/Mgal
(a) Elastic Modulus Curve
0.1
1
10
0.01 0.1 1 10 100
Angular Velocity [rad/sec]
G"
[Pa]
0.0 lb/Mgal 0.2 lb/Mgal 0.5 lb/Mgal
1.0 lb/Mgal 1.75 lb/Mgal 5.0 lb/Mgal
(b) Viscous Modulus Curve
Figure 7.2.6-Linear Viscoelastic Properties of Borate-Crosslinked 35 lb/Mgal GuarpH 10.0, 75 oF, prepared at different Crosslinker Concentrations

7-8
0.0
0.1
0.2
0.3
0.4
0.5
0.6
0.7
0.8
0.9
1.0
01002003004005006007008009001000
Cylinder Volume [cc]
Set
tling
Vel
ocity
[cm
/min
]0.2 lb/Mgal
0.5 lb/Mgal
1.0 lb/Mgal
1.5 lb/Mgal
Figure 7.2.7-Settling of 2 ppg Slurry in Borate-Crosslinked 35 lb/Mgal Guar pH10.0, 75 oF prepared in different Crosslinker Concentrations
Figure 7.2.7 shows a decrease in settling velocities of 2 ppg slurry, and Fig. 7.2.6 showsan increase in the G' and G" values with an increase in the crosslinker concentration.These changes are similar to that seen in the gel prepared at pH 9, and are again due to anincrease in the number of crosslinked sites formed in guar at higher crosslinkerconcentrations. Hence as the borate ions crosslink the polymer chains to establish anetwork structure, the gels display higher elastic and viscous moduli, and better proppantsuspension capabilities.
The laboratory characterization of the different fluids prepared at pH 10 iscompared to that obtained with the crosslinked guar gel prepared at pH 9 with 6 lb/Mgalcrosslinker. The comparison shows that the pH 10 gel prepared with a 0.5 lb/Mgalcrosslinker concentration has similar static settling velocities as those observed in the pH9 gel. These two formulations also have similar G' values at lower frequencies, but havedissimilar G" values. Hence, there might be satisfactory proppant transport in the pH 10gel prepared with 0.5 lb/Mgal. To confirm this hypothesis, this gel was evaluated in theslot models for its proppant transport capabilities.
Figure 7.2.8 shows the proppant distribution in the borate-crosslinked pH 10 guarprepared at 0.5 lb/Mgal crosslinker after 5 and 15 min of 2 ppg slurry flow through theHPS. The figure shows high sand concentration in the HPS bottom after 5 min of slurryflow, but this concentration shows little height dependence after 15 min. Some high sandconcentration clusters are found, but these are suspended and would maintain highpermeability in the fracture. Thus, the pH 10 gel prepared with 0.5 lb/Mgal crosslinkerwould satisfactorily transport sand through the fracture.

7-9
5 10 15 20 25 30
Frames Along the HPS Length
5
10
15
20
25
30Fr
ames
Alo
ng th
e H
PS H
eigh
t
0
2
4
6
8
10
12
5 mins
5 10 15 20 25 30
Frames Along the HPS Length
5
10
15
20
25
30
Fram
es A
long
the
HPS
Hei
ght
15 mins
Figure 7.2.8-Sand Concentration (ppg) in the HPS after 5 and 15 mins of2 ppg Slurry Transport with Borate-Crosslinked 35 lb/Mgal Guar pH 10.0 at
0.5 lb/Mgal, 75oF
Borate-crosslinked 35 lb/Mgal Guar pH 11A crosslinker concentration of 0.5 lb/Mgal was used to prepare crosslinked gel at pH 11.This gel was then evaluated with a different approach as the gel was tested in the clearslot first for its proppant transport behavior. The test showed that the pH 11 gel preparedwith 0.5 lb/Mgal. exhibited satisfactory slurry transport, as there was good sanddistribution throughout the slot without any settled bed. Then during the test, thecrosslinker concentration was lowered to 0.45 lb/Mgal. and the proppant transportbehavior was again observed in the clear slot. At this concentration too, the slurry wassatisfactorily transported through the slot. The crosslinker concentration was then furtherlowered to 0.40 lb/Mgal and the gel was again evaluated in the clear slot. At thisconcentration however, the proppant particles began to separate from the gel, and startedsettling to the bottom of the slot thereby showing a diminishing capability of the 0.40lb/Mgal gel to successfully transport proppant through the slot. This test approachshowed that the crosslinker concentration of 0.45 lb/Mgal. provided a minimumcrosslinker concentration above which the pH 11 gel exhibited acceptable proppanttransport.
The viscoelastic data of the gel prepared at 0.45 lb/Mgal and at other crosslinkerconcentrations are shown in Figure 7.2.9. The viscoelastic behavior of the pH 11 gels aresimilar to that of the gels prepared at pH 9 and 10. The figure shows as the crosslinkerconcentration is increased, the elastic and viscous moduli increase showing an increasingcrosslinking of the guar polymer at higher crosslinker quantity. It also shows that at acrosslinker concentration of 3 lb/Mgal, the elastic moduli are independent of thefrequency. At this concentration, the gel exhibited a phase separation when the gel waskept static for 24 hrs. Harris2 has described this phase separation as over-crosslinking orsyneresis in the borate-crosslinked gel. Similar phase separation was observed in pH 10gel at 5 lb/Mgal and in pH 9 gel at 9 lb/Mgal crosslinker concentrations.

7-10
0.01
0.1
1
10
100
0.01 0.1 1 10 100
Angular Velocity [rad/sec]
G' [
Pa]
0.0 lb/Mgal 0.2 lb/Mgal 0.45 lb/Mgal
1.0 lb/Mgal 1.75 lb/Mgal 3.0 lb/Mgal
(a) Elastic Modulus Curve
0.01
0.1
1
10
0.01 0.1 1 10 100
Angular Velocity [rad/sec]
G"
[Pa]
0.0 lb/Mgal 0.2 lb/Mgal 0.45 lb/Mgal
1.0 lb/Mgal 1.75 lb/Mgal 3.0 lb/Mgal
(b) Viscous Modulus Curve
Figure 7.2.9-Linear Viscoelastic Properties of Borate-Crosslinked 35 lb/Mgal GuarpH 11.0, 75 oF, prepared at different Crosslinker Concentrations
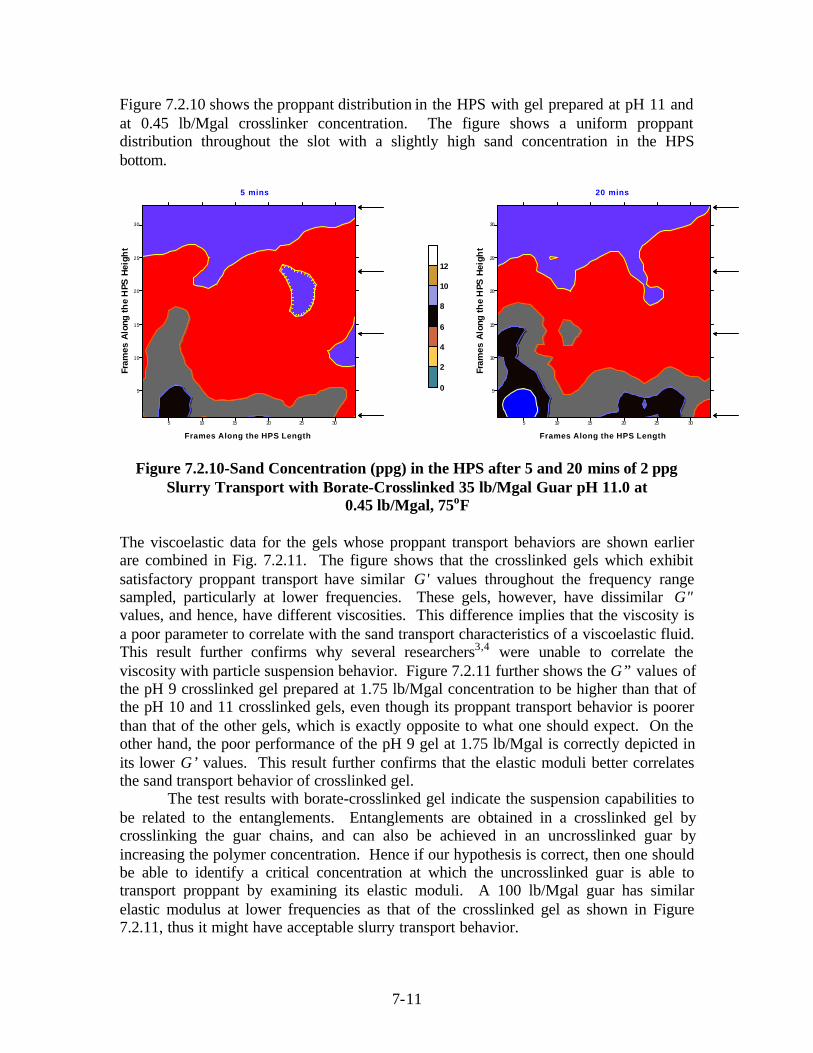
7-11
Figure 7.2.10 shows the proppant distribution in the HPS with gel prepared at pH 11 andat 0.45 lb/Mgal crosslinker concentration. The figure shows a uniform proppantdistribution throughout the slot with a slightly high sand concentration in the HPSbottom.
5 10 15 20 25 30
Frames Along the HPS Length
5
10
15
20
25
30
Fram
es A
long
the
HPS
Hei
ght
0
2
4
6
8
10
12
5 mins
5 10 15 20 25 30
Frames Along the HPS Length
5
10
15
20
25
30
Fram
es A
long
the
HPS
Hei
ght
20 mins
Figure 7.2.10-Sand Concentration (ppg) in the HPS after 5 and 20 mins of 2 ppgSlurry Transport with Borate-Crosslinked 35 lb/Mgal Guar pH 11.0 at
0.45 lb/Mgal, 75oF
The viscoelastic data for the gels whose proppant transport behaviors are shown earlierare combined in Fig. 7.2.11. The figure shows that the crosslinked gels which exhibitsatisfactory proppant transport have similar G' values throughout the frequency rangesampled, particularly at lower frequencies. These gels, however, have dissimilar G"values, and hence, have different viscosities. This difference implies that the viscosity isa poor parameter to correlate with the sand transport characteristics of a viscoelastic fluid.This result further confirms why several researchers3,4 were unable to correlate theviscosity with particle suspension behavior. Figure 7.2.11 further shows the G” values ofthe pH 9 crosslinked gel prepared at 1.75 lb/Mgal concentration to be higher than that ofthe pH 10 and 11 crosslinked gels, even though its proppant transport behavior is poorerthan that of the other gels, which is exactly opposite to what one should expect. On theother hand, the poor performance of the pH 9 gel at 1.75 lb/Mgal is correctly depicted inits lower G’ values. This result further confirms that the elastic moduli better correlatesthe sand transport behavior of crosslinked gel.
The test results with borate-crosslinked gel indicate the suspension capabilities tobe related to the entanglements. Entanglements are obtained in a crosslinked gel bycrosslinking the guar chains, and can also be achieved in an uncrosslinked guar byincreasing the polymer concentration. Hence if our hypothesis is correct, then one shouldbe able to identify a critical concentration at which the uncrosslinked guar is able totransport proppant by examining its elastic moduli. A 100 lb/Mgal guar has similarelastic modulus at lower frequencies as that of the crosslinked gel as shown in Figure7.2.11, thus it might have acceptable slurry transport behavior.

7-12
0.1
1
10
100
0.01 0.1 1 10 100
Angular Velocity [rad/sec]
G' [
Pa]
Linear 100 lb/Mgal guar
Crosslinked 35 lb/Mgal guar (pH 9.0- 6.0lb/Mgal)
Crosslinked 35 lb/Mgal Guar (pH10.0- 0.5lb/Mgal)
Crosslinked 35 lb/Mgal Guar (pH11.0- 0.45lb/Mgal)
Crosslinked 35 lb/Mgal guar (pH 9.0- 1.75lb/Mgal)
(a) Elastic Modulus Curve
0.1
1
10
100
0.01 0.1 1 10 100
Angular Velocity [rad/sec]
G"
[Pa]
Linear 100 lb/Mgal guar
Crosslinked 35 lb/Mgal Guar (pH 9.0- 6.0lb/Mgal)
Crosslinked 35 lb/Mgal Guar (pH10.0- 0.5lb/Mgal)
Crosslinked 35 lb/Mgal Guar (pH11.0- 0.45lb/Mgal)
Crosslinked 35 lb/Mgal Guar (pH 9.0-1.75lb/Mgal)
(b) Viscous Modulus Curve
Figure 7.2.11-Comparison of G' and G" values in Linear 100 lb/Mgal Guar and inBorate-Crosslinked 35 lb/Mgal guar gels prepared at Different pHs at 75 oF
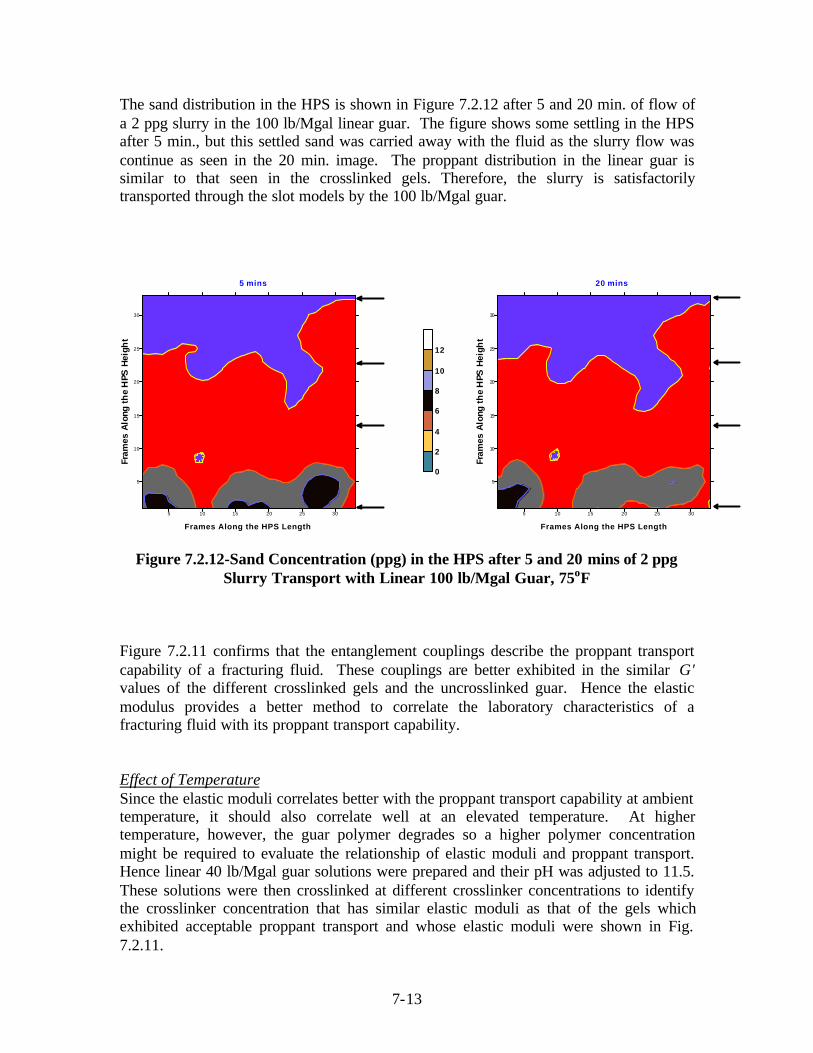
7-13
The sand distribution in the HPS is shown in Figure 7.2.12 after 5 and 20 min. of flow ofa 2 ppg slurry in the 100 lb/Mgal linear guar. The figure shows some settling in the HPSafter 5 min., but this settled sand was carried away with the fluid as the slurry flow wascontinue as seen in the 20 min. image. The proppant distribution in the linear guar issimilar to that seen in the crosslinked gels. Therefore, the slurry is satisfactorilytransported through the slot models by the 100 lb/Mgal guar.
5 10 15 20 25 30
Frames Along the HPS Length
5
10
15
20
25
30
Fram
es A
long
the
HPS
Hei
ght
0
2
4
6
8
10
12
5 mins
5 10 15 20 25 30
Frames Along the HPS Length
5
10
15
20
25
30
Fram
es A
long
the
HPS
Hei
ght
20 mins
Figure 7.2.12-Sand Concentration (ppg) in the HPS after 5 and 20 mins of 2 ppgSlurry Transport with Linear 100 lb/Mgal Guar, 75oF
Figure 7.2.11 confirms that the entanglement couplings describe the proppant transportcapability of a fracturing fluid. These couplings are better exhibited in the similar G'values of the different crosslinked gels and the uncrosslinked guar. Hence the elasticmodulus provides a better method to correlate the laboratory characteristics of afracturing fluid with its proppant transport capability.
Effect of TemperatureSince the elastic moduli correlates better with the proppant transport capability at ambienttemperature, it should also correlate well at an elevated temperature. At highertemperature, however, the guar polymer degrades so a higher polymer concentrationmight be required to evaluate the relationship of elastic moduli and proppant transport.Hence linear 40 lb/Mgal guar solutions were prepared and their pH was adjusted to 11.5.These solutions were then crosslinked at different crosslinker concentrations to identifythe crosslinker concentration that has similar elastic moduli as that of the gels whichexhibited acceptable proppant transport and whose elastic moduli were shown in Fig.7.2.11.

7-14
Figure 7.2.13 describes the viscoelastic properties of the borate-crosslinked 40 lb/Mgalguar gel prepared at pH 11.5. The figure shows an increase in elastic and viscous moduliwith an increase in the crosslinker concentration. This viscoelastic behavior at 130oF issimilar to that seen earlier in the samples analyzed at ambient temperature. From Figure7.2.13, the elastic moduli of the different gels were compared with that of the gels inFigure 7.2.11. This comparison showed that the moduli of the pH 11.5 gel prepared at 1lb/Mgal is slightly lower and that at 1.25 lb/Mgal is slightly higher than that of the gelswith acceptable proppant transport. Therefore, the crosslinker range from 1.0 to 1.25lb/Mgal needs to be further evaluated in the large scale test facility for identifying thecritical crosslinker concentration above which the proppant transport behavior would besatisfactory.
Borate-crosslinked 40 lb/Mgal guar gel at pH 11.5 was first evaluated in the clearslot where the crosslinker concentrations were varied from 1.25 to 1.0 lb/Mgal usingISCO pump (Fig. 7.2.1) and proppant distribution was observed. At 1.25 lb/Mgalconcentration, the proppant were easily transported through the slot with no particlesettling in the slot; as a result, the crosslinker rate was reduced from 1.25 to 1.1 lb/Mgal.At this lower rate also, the proppant distribution was uniform throughout the slot. As thecrosslinker rate was further reduced to 1.0 lb/Mgal, the slurry flow showed non-uniformity across the slot height with slower moving slurry near the top and bottomboundaries than in the middle section of the slot height. This slow moving slurryindicates that the proppant transport capacity of the fluid had begun to decrease at 1.0lb/Mgal. Therefore, the crosslinker concentration of 1.1 lb/Mgal is a critical value abovewhich the proppant transport would be acceptable in a fracture.
A 2 ppg slurry was then prepared in 40 lb/Mgal guar gel crosslinked with 1.1lb/Mgal concentration, and was pumped through the HPS. The proppant distribution inthe HPS for this gel is shown in Figure 7.2.14. The figure shows that the sandconcentration is uniform throughout the HPS with few high sand concentration regions.These regions being suspended in the slurry were transported with the slurry flow as seenin the image in Fig. 7.2.14 at 20 min. Thus, this formulation would perform satisfactorilyin the fracture. The acceptable proppant transport through the slot, and a goodcomparison of elastic moduli of the gel prepared with 1.1 lb/Mgal crosslinker at 130 oFwith that of the gels at ambient temperature further confirms the correlation of elasticmoduli with proppant transport through a fracture.

7-15
0.001
0.01
0.1
1
10
100
0.01 0.1 1 10 100
Angular Velocity [rad/sec]
G' [
Pa]
0.0 lb/Mgal 0.5 lb/Mgal 0.75 lb/Mgal
1.0 lb/Mgal 1.1 lb/Mgal 1.25 lb/Mgal
2.0 lb/Mgal
(a) Elastic Modulus Curve
0.01
0.1
1
10
0.01 0.1 1 10 100
Angular Velocity [rad/sec]
G"
[Pa]
0.0 lb/Mgal 0.5 lb/Mgal 0.75 lb/Mgal1.0 lb/Mgal 1.1 lb/Mgal 1.25 lb/Mgal2.0 lb/Mgal
(b) Viscous Modulus Curve
Figure 7.2.13-Linear Viscoelastic Properties of Borate-Crosslinked 40 lb/Mgal GuarpH 11.5, prepared at different Crosslinker Concentrations, 130oF

7-16
5 10 15 20 25 30
Frames Along the HPS Length
5
10
15
20
25
30
Fram
es
Alo
ng
the
HP
S H
eig
ht
0
2
4
6
8
10
12
5 mins
5 10 15 20 25 30
Frames Along the HPS Length
5
10
15
20
25
30
Fram
es
Alo
ng
the
HP
S H
eig
ht
20 mins
Figure 7.2.14-Sand Concentration (ppg) in the HPS after 5 and 20 mins of 2 ppgSlurry Transport with Borate-Crosslinked 40 lb/Mgal Guar pH 11.5 at 1.1 lb/Mgal,
130oF
Effect of Sand Concentration:Most fracturing treatments are performed at sand concentration varying from 2 to 10 ppg,so the fracturing fluid must be designed to transport higher concentration sand slurries.Hence the relationship between fluid rheology and its sand transport capability, which isdeveloped from 2 ppg slurry only, should be validated with concentrated slurries. Thus, ahigh sand concentration of 8 ppg was selected to prepare slurries in borate-crosslinkedgels at pH 9 and 10. These slurries were then studied for their proppant transportbehavior in the clear slot and the HPS.
The borate-crosslinked gel was first prepared at pH 9 and crosslinked with 6lb/Mgal concentration because this gel could satisfactorily transport 2 ppg slurry throughthe slots. This gel was then slurried to 8 ppg sand concentration, and its proppanttransport behavior observed in the clear slot. The gel again exhibited an acceptableperformance as there was no slow moving slurry in the bottom of the clear slot. Becauseof this satisfactory performance, the crosslinker concentration was reduced to 4 lb/Mgalto identify the critical crosslinker concentration with satisfactory proppant transport in theslot. At this crosslinker concentration, the proppant particle layers began to separatefrom the fluid and when the crosslinker concentration was further reduced to 3.5 lb/Mgal,the sand began to separate from the gel and settle to the bottom of the clear slot. Thisdiminishing capability of these concentrations to transport proppant depicts theirunsatisfactory performance to carry 8 ppg slurry. Therefore, the crosslinkerconcentration was increased to 5 lb/Mgal and slurry transport through the clear slotobserved. This gel exhibited satisfactory proppant distribution throughout the clear slotshowing the minimum crosslinker concentration of this formulation is 5 lb/Mgal for it tosuccessfully transporting sand particles in fracture. Hence at this crosslinkerconcentration, a 8 ppg slurry was pumped through the HPS and the sand distributionobtained as shown in Figure 7.2.15. The figure shows that the sand concentration isuniform across the slot with values in a range from 8 to 12 ppg.

7-17
5 10 15 20 25 30
Frames Along the HPS Length
5
10
15
20
25
30Fr
ames
Alo
ng th
e H
PS H
eigh
t
0
4
8
12
16
20
24
5 mins
5 10 15 20 25 30
Frames Along the HPS Length
5
10
15
20
25
30
Fram
es A
long
the
HPS
Hei
ght
20 mins
Figure 7.2.15-Sand Concentration (ppg) in the HPS after 5 and 20 mins of 8 ppgSlurry Transport with Borate-Crosslinked 35 lb/Mgal Guar pH 9.0 at 5.0 lb/Mgal,
75oF
A similar 8 ppg slurry was prepared in another borate-crosslinked 35 lb/Mgal guar gel ata pH of 10. Since a crosslinker concentration of 0.5 lb/Mgal could satisfactorily transport2 ppg slurry through the slots, it might also transport 8 ppg slurry through the slot. Thisgel at 0.5 lb/Mgal gel though transported the 8 ppg slurry without forming any settledsand bed in the slot, the slurry flow was non-uniform across the slot height. The slurryflow was slower at the bottom section of the slot. The slower flow region indicates thatthis gel has difficulty in keeping the sand under suspension. Thus, this gel with 0.5lb/Mgal concentration is not capable of transporting high concentration sand slurry.Therefore, the crosslinker concentration was increased to 0.55 lb/Mgal and slurrytransport through the clear slot was again observed. At the higher crosslinker, the slurryflow was still non-uniform with slower moving slurry in the slot bottom. At thisconcentration however, the regions occupied by the slowly flowing slurry were less thanthat in the gel prepared at 0.5 lb/Mgal. Therefore, the proppant transport behavior of thegel was improved when the crosslinker concentration was increased from 0.5 to 0.55lb/Mgal, but it could still improve further. Thus, the crosslinker concentration wasincreased to 0.6 lb/Mgal and slurry transport observed through the clear slot. At 0.6lb/Mgal concentration, the slurry transport was uniform throughout the slot indicatingthat this concentration can satisfactorily transport proppant through a fracture. This gelwas then pumped through the HPS to obtain a digital image of the sand distribution in theslot model.
The proppant distribution in the HPS is shown in Figure 7.2.16 for the 8 ppgslurry transported by borate-crosslinked guar gel at pH 10. The figure shows an identicalsand distribution as that seen in Figure 7.2.15 for pH 9 gel.
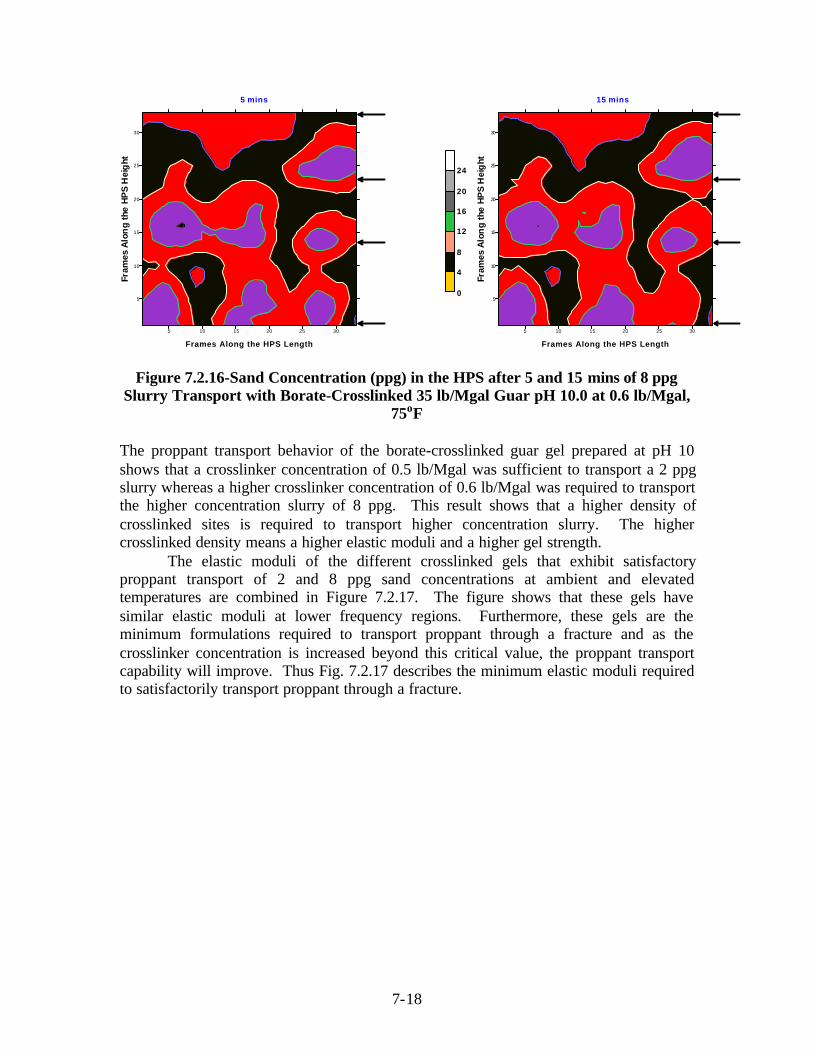
7-18
5 10 15 20 25 30
Frames Along the HPS Length
5
10
15
20
25
30Fr
ames
Alo
ng
the
HP
S H
eig
ht
0
4
8
12
16
20
24
5 mins
5 10 15 20 25 30
Frames Along the HPS Length
5
10
15
20
25
30
Fram
es A
lon
g th
e H
PS
Hei
ght
15 mins
Figure 7.2.16-Sand Concentration (ppg) in the HPS after 5 and 15 mins of 8 ppgSlurry Transport with Borate-Crosslinked 35 lb/Mgal Guar pH 10.0 at 0.6 lb/Mgal,
75oF
The proppant transport behavior of the borate-crosslinked guar gel prepared at pH 10shows that a crosslinker concentration of 0.5 lb/Mgal was sufficient to transport a 2 ppgslurry whereas a higher crosslinker concentration of 0.6 lb/Mgal was required to transportthe higher concentration slurry of 8 ppg. This result shows that a higher density ofcrosslinked sites is required to transport higher concentration slurry. The highercrosslinked density means a higher elastic moduli and a higher gel strength.
The elastic moduli of the different crosslinked gels that exhibit satisfactoryproppant transport of 2 and 8 ppg sand concentrations at ambient and elevatedtemperatures are combined in Figure 7.2.17. The figure shows that these gels havesimilar elastic moduli at lower frequency regions. Furthermore, these gels are theminimum formulations required to transport proppant through a fracture and as thecrosslinker concentration is increased beyond this critical value, the proppant transportcapability will improve. Thus Fig. 7.2.17 describes the minimum elastic moduli requiredto satisfactorily transport proppant through a fracture.

7-19
0.1
1
10
100
1000
0.01 0.1 1 10 100
Angular Velocity [rad/sec]
G' [
Pa]
Linear 100 lb/Mgal Guar 75F
Borate-Crosslinked 35 lb/Mgal Guar pH 9.0- 5.0 ml/lt 75F
Borate-Crosslinked 35 lb/Mgal Guar pH 10.0- 0.6 ml/lt 75F
Borate-Crosslinked 35 lb/Mgal Guar pH 11.0- 0.5 ml/lt 75F
Borate-Crosslinked 40 lb/Mgal Guar pH 11.5- 1.1 ml/lt 130F
Figure 7.2.17-Comparison of Elastic Moduli of Gels with Satisfactory ProppantTransport
Implications of the Research Results:1. The borate-crosslinked guar gel prepared at pH 9 and 1.75 lb/Mgal crosslinker
concentration satisfies the gel point criteria of Power et al.5,6 as there is a maximum inloss modulus for this concentration. This gel also satisfies the de Kruijf et al.9 criteriafor marginally acceptable proppant transport, yet Figure 7.2.4 shows that this gel doesnot exhibit satisfactory proppant transport through a slot model. Hence, theevaluation of these criteria with proppant transport tests imply that the two criteriaavailable in the literature are insufficient to describe the proppant transport capabilityof borate-crosslinked guar gels.
2. Figure 7.2.11 shows that the crosslinked gels which exhibit satisfactory proppanttransport have similar G' values throughout the frequency range sampled, particularlyat lower frequencies. These gels, however, have dissimilar G" values, and hence,have different viscosities. This difference implies that the viscosity is a poorparameter to correlate with the sand transport characteristics of a viscoelastic fluid.This result further confirms why several researchers3,4 were unable to correlate theviscosity with particle suspension behavior. The figure further shows the G” valuesof the pH 9 crosslinked gel prepared at 1.75 lb/Mgal concentration to be higher thanthat of the pH 10 and 11 crosslinked gels, even though its proppant transport behavioris poorer than that of the other gels, which is exactly opposite to what one shouldexpect. On the other hand, the poor performance of the pH 9 gel at 1.75 lb/Mgal is

7-20
correctly depicted in its lower G’ values. This result further confirms that the elasticmoduli better correlates the sand transport behavior of crosslinked gel.
3. de Kruijf et al.9 proposed a minimum elastic modulus of 2 Pa at 5 rad/sec to design afluid that shows marginally acceptable proppant suspension. All samples shown inFig. 7.2.17 satisfy this criterion and yet all do not exhibit acceptable proppanttransport, again showing the need for a better minimum-criterion for fracturing fluiddesign. The figure shows that the gels with satisfactory transport have similar elasticmoduli in a frequency range from 0.06 to 5 rad/sec. Thus, the elastic moduli of thegels shown in Fig. 7.2.17 describe the minimum moduli to design a fracturing fluidhaving satisfactory slurry transport characteristics. Hence if the minimum elasticmoduli values of the crosslinked guar gels vary from approximately 1 Pa at 0.1 to 10Pa at 1.0 rad/sec, then the fluid would exhibit satisfactory performance in a fracturingtreatment.
4. The results show that the minimum crosslinker concentration for satisfactoryproppant transport is a function of the sand concentration. Thus, if the slurryconcentration is increased from 2 to 8 ppg, the crosslinker concentration should alsobe increased to improve the gel strength to successfully transport proppant throughthe fracture.
7.3 Proppant Transport
Objective: The purpose of the proppant transport study was three-fold: (1) to investigatefactors that influence convection and encapsulation in fracturing applications, (2) toevaluate static and dynamic settling characteristics of proppants in fracturing slurries and(3) to study the fluids capability to remove fluidized layer and erode settled bed.
Introduction: Hydraulic fracturing treatment is performed to create a conductive path inthe reservoir so that the well productivity is increased. The improvements in wellperformance depends largely on how well the proppant is transported down the wellboreand how long the proppants remain suspended in the fracturing fluid before they settledown in the fracture. A better suspension provides better placement of the proppants infront of the perforations and thus, a better fracturing stimulation.
Procedure: The proppant transport study was performed on the high pressure simulatorin which fiber optics based vision system was used for the flow visualization. Theencapsulation study comprised of setting the fracture to a gap width, filling the slot withwater, linear gel or borate-crosslinked guar, and injecting borate-crosslinked guar slurryinto the various fluids of different viscosities.
The static and dynamic characteristics were evaluated by setting the fracture to agap width and observing settling in the shear preconditioned fracturing slurries understationary and fluid flow conditions.

7-21
The proppant bed erosion study was performed by maintaining the simulator to requiredgap widths, setting different perforation configurations and pumping several fracturingfluids in a sequential pattern. A typical injection sequence through the differentperforation configurations is depicted in Figure 7.3.1.
A detailed description of the procedure used to perform this study and resultsobtained can be found in the Annual Reports submitted to Gas Research Institute (GRI)11-
13 and in the technical papers presented at the Society of Petroleum Engineers (SPE)Conferences.14-17
Wat
er
Lin
ear S
lurr
y
BX
L S
lurr
y
BX
L
Lin
ear G
el
Wat
er
7 ft
Figure 7.3.1- ( Top) A Typical Sequence of Fluid Injection(Bottom) Various Perforation Configurations along the HPS Height
Results: The comprehensive investigations on encapsulation and convection showed thatthe encapsulation dominates particle settling in low viscous medium, but an increase inviscosity of the lower medium can prevent the encapsulation. Thus, there exists anoptimum fluid viscosity that overrides density effects to form encapsulated slurry.
This influence of the viscosity is further highlighted from the reduction in settlingtime of the encapsulated slurry when the polymer concentration is decreased from 35 to25 lb guar in 1000 gal of solution. In addition to the influence of the viscosity andpolymer concentration, convective downward motion of the encapsulated slurry is relatedto fracture gap width. This effect is shown in Figure 7.3.2, which describes anexponential relationship between the convective downward motion and fracture gapwidth.
The study further identified that there is settling within the encapsulated slurry asshown in Figure 7.3.3, which shows the proppant concentrations in the slot in an initialperiod and a final phase of the experiment. The figure shows that initially, there is higherconcentration in an upper portion of the cluster; but at later times, the concentration inlower portion is increased due to settling of the proppants within the cluster.
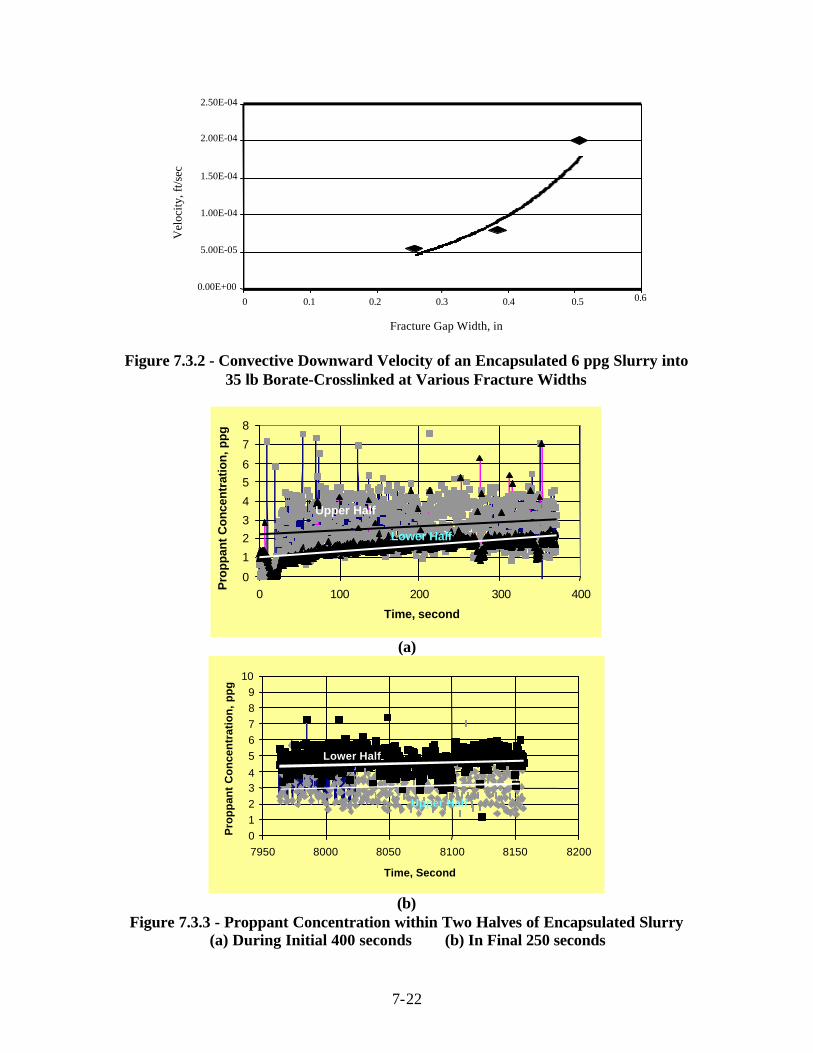
7-22
0.00E+00
5.00E-05
1.00E-04
1.50E-04
2.00E-04
2.50E-04
0 0.1 0.2 0.3 0.4 0.5 0.6
Vel
ocity
, ft/s
ec
Fracture Gap Width, in
Figure 7.3.2 - Convective Downward Velocity of an Encapsulated 6 ppg Slurry into35 lb Borate-Crosslinked at Various Fracture Widths
0
1
2
3
4
5
6
7
8
0 100 200 300 400
Time, second
Pro
ppan
t C
once
ntra
tion,
ppg
Upper Half
Lower Half
(a)
0
1
2
34
5
6
7
8
9
10
7950 8000 8050 8100 8150 8200
Time, Second
Pro
ppan
t C
once
ntra
tion
, ppg
Lower Half
Upper Half
(b)Figure 7.3.3 - Proppant Concentration within Two Halves of Encapsulated Slurry
(a) During Initial 400 seconds (b) In Final 250 seconds

7-23
The static settling experiments showed a non-linear relationship between settling velocityand fluid viscosity of the fracturing fluids. A four fold increase in the fluid viscositycaused only one and half fold decrease in the settling velocity in linear HPG solutions,and a hundred fold increase resulted in almost 1000 times decrease in the settling velocityin crosslinked gels. This relationship is described in Table 7.3.1.
Fracturing Fluid Fluid Viscosity (cp)at 5 sec-1
Settling Velocity(cm/min)
Linear 40 lb/Mgal HPG 300 225
Linear 60 lb/Mgal HPG 1200 150
Borate-crosslinked 35 lb/Mgal Guar,pH 9.0 30,000 0.3
Table 7.3.1 - Relationship between Fluid Viscosity and Settling Velocity
The dynamic settling experiments showed that settling velocity increases as the shear rateis increased in a fracture because of a decrease in fluid viscosity with increase in theshear rate. The settling rates at various shear rates are shown in Figure 7.3.4 for a linear35 lb/Mgal guar solution. For a crosslinked gel, on the other hand, rate of increment insand concentration decreases with an increase in the shear rate. This effect of shear rateis shown in Figure 7.3.5 for a borate-crosslinked 35 lb/Mgal guar gel.
Figure 7.3.4- Settling Rate as a Function of Shear Rate for 35 lb/Mgal Guar LinearGel

7-24
Figure 7.3.5- Proppant Settling as a Function of Shear Rate for a 7.3 ppg Slurryof Borate-Crosslinked 35 lb/Mgal Guar Gel in 0.375 in. Fracture Width
The bed erosion studies showed that the borate-crosslinked gel was able to removeparticles from top of a compacted bed and transport them further down the fracture. Thelinear HPG gels, however, was able to remove upper layers only and was not capable oferoding the remaining compacted bed. Moreover, the linear gels exhibited a non-linearrelationship between rate of erosion and fluid flush rate as shown in Figure 7.3.6.
In addition to the fluid effect, the bed erosion was affected by the perforationconfiguration used in the slot. The study showed that there exists a critical configurationin between the lower and middle perforations, which influences the fracturing fluidability to transport proppant and erode the compacted bed.
0
0.2
0.4
0.6
0.8
1
1.2
1.4
1.6
0 10 20 30 40 50 60 70
Flow Rate, gpm
Bed
Hei
gh
t E
rosi
on
, in
.
Figure 7.3.6-Relationship between Bed Erosion and Fluid Flow Rate for 40 lb/Mgal HPG

7-25
Implications of the Research Results:1. Convection is a density driven phenomenon and in low viscosity medium it
dominates proppant settling; hence, an optimum fluid viscosity exists that overridesthe influence of the density to form convection.15
Based on their study on Karo syrup and mineral oil, Cleary and Fonseca18
concluded that the convection dominates proppant settling in a fracturing treatment.Their conclusion is however not supported in the results obtained at the FFCF whereguar based linear and crosslinked-fracturing fluids are investigated in the HPS. TheFFCF study shows that an increase in fluid viscosity, beyond an optimum value,overrides the density effects and thus prevents convective downward motion of theslurry and inhibits encapsulation. This result implies that when the high viscosityfracturing fluids are used in a well stimulation the convective phenomenon isunimportant.
2. Polymer concentration is a major factor that influences the convective downwardmotion of the slurry.15
Clark19 proposed a dimensionless model to identify whether the convection willbe a controlling factor when a particular fracturing fluid is used. His model, however,does not include the effects of polymer concentration, which are shown to beimportant in the research results obtained at the FFCF. Therefore, the proposedmodel needs to be further evaluated to include a parameter that can more accuratelydescribe the polymer concentration effects.
3. The FFCF study shows that crosslinked gel bed height erosion was eight times morethan that by linear gel. Also, there is a threshold distance between the lowerperforation and fracture bottom that greatly influences the ability of a fracturing fluidto transport or settle proppant, and to resuspend and erode the compacted bed.16
The purpose of a stimulation treatment is to increase the well productivity bycreating a uniform distribution of proppant pack in a fracture. To accomplish thisobjective, a fracturing fluid is required which can suspend and transport proppant in afracture, and lift any settled proppant and transport them further into the fracture.These characteristics are exhibited in crosslinked fluids that were evaluated in theproppant transport study performed at the FFCF. The results show that the highviscosity crosslinked fluids not only have good proppant suspension capability, as isknown to the industry, but also have better bed erosional and resuspension capacity.These two features give crosslinked guar fluids ideal characteristics to distributeproppant throughout the fracture.
4. The static settling experiments show that there is a non-linear relationship betweenthe decrease in the settling velocity and increase in the fluid viscosity.17 The dynamicsettling experiments show that the settling rate increases when the fracture shear rateincreases.17
The non-linear relationship between the fluid viscosity and proppant settlingimplies that the viscosity is not sufficient to explain proppant suspension in afracturing fluid and hence to predict proppant transport in the fracture. Hence,

7-26
industry should examine parameters other than the viscosity to better understandproppant carrying capabilities of the fracturing fluid.
7.4 Fluid Rheology
Objective: The purpose of the fluid rheology research was two-fold: (1) to evaluatefracturing fluid characteristics under various conditions of pH, shear history andtemperature, and (2) to compare fluid behavior in laboratory and field scalecharacterization.
Introduction: Estimation of the fluid characteristics is crucial for success of a hydraulicfracturing treatment. A successful treatment means a wide fracture and a uniformdistribution of proppant. These conditions can be created with proper selection andaccurate characterization of the fracturing fluid. The impact of the fluids for the successof a fracturing treatment is exhibited in several case histories.
The knowledge of fluid characteristics is also important for computer simulationsof the fracturing treatments, friction pressure loss estimations for the tubular flow andproppant transport evaluations in the fracture. Thus, the fluid behavior prediction isessential before performing stimulation in the field and during the fracturing treatments.
Procedure: The fluid rheology study comprised of preparing linear gel at different pHs,crosslinking it with boron chemicals, pre-conditioning the crosslinked gel throughdifferent shear histories, heating the gel and characterizing the fluid in the high pressuresimulator. This study was performed at three fluid pHs (9, 10, and 11), four temperatures(ambient, 120, 150, 185 oF), and four shear pre-conditioning lengths (0, 1000, 3000, 5000ft).
The comparison study was performed by simulating field scale fracturingoperations in the FFCF and in the laboratories of three service companies test facilities.These companies volunteered to participate in a joint effort to understand fracturing fluidbehavior. Both the FFCF and laboratories used identical chemicals, water, and fluidformulation procedure.
A detailed description of the procedure used to perform this study and resultsobtained from the study can be found in annual reports submitted to GRI11-13 andtechnical papers presented in SPE conferences.20-21
Results: Prior to performing rheological characterization of fracturing fluids,measurements were made to confirm the accuracy and reproducibility of viscositiesmeasured with the HPS slot. The result of this reproducibility test performed over sevendays is shown in Figure 7.4.1. The figure shows that there is excellent agreement amongmeasurements made on different days, verifying the reproducibility of the slot data forcharacterization of highly labile borate-crosslinked gels. These tests provide greatconfidence in the FFCF testing procedure and its capability to characterize fracturingfluids. Similar procedures were used in subsequent studies whose results are describedbelow.

7-27
The results of the rheological characterization of borate-crosslinked guar are plotted inFigures 7.4.2 through 7.4.4 for three fluid pHs and at different shear histories and varioustemperatures. The figures show that the borate-crosslinked gel exhibit shear thinning aswell as shear thickening behavior in the fracture shear rate range from 20 to 250 sec-1.The figures also show that the fluid exhibit a shear history insensitive behavior for certainformulations. This shear history independent behavior is shown at 85, 150 and 185 oF forthe borate crosslinked 35 lb/Mgal guar prepared respectively at pH 9.0, 10.0 and 11.0.Therefore, this characterization provides optimum fluid formulations for the hydraulicfracturing treatment. Moreover, the different optimized fluids have similar maximumviscosities as shown in Figure 7.4.5.
100
1000
10000
10 100 1000
Nominal Wall Shear Rate [sec-1]
App
aren
t Vis
cosi
ty [c
p]
Day 1
Day 2
Day 3
Day 4
Day 5
Day 6
Day 7
Avg. Slot Data
Figure 7.4.1-Rheology Characterization from Experiments Performed on Differentdays on Borate-Crosslinked 35 lb/Mgal Guar gel at 150oF and no Shear
Preconditioning

7-28
1000
10000
100000
10 100 1000
Shear Rate [sec-1]
4788
0 * S
hear
Str
ess
[psf
]
No pre-shear/85 F1000 ft/85 F3000 ft/85 F5000 ft/85 FNo pre-shear/120 F1000 ft/120 F3000 ft/120 F5000 ft/120 FNo pre-shear/150 F1000 ft/150 F3000 ft/150 F5000 ft/150 F
Figure 7.4.2-Rheology Data of Borate-Crosslinked 35 lb Guar/Mgal for pH 9.0 atVarious Temperatures and Shear Histories
1000
10000
100000
10 100 1000
Shear Rate [sec-1]
4788
0 *
Sh
ear
Str
ess
[psf
]
No pre-shear/85 F
1000 ft/85 F3000 ft/85 F
5000 ft/85 FNo pre-shear/120 F
1000 ft/120 F3000 ft/120 F
5000 ft/120 FNo pre-shear/150 F
1000 ft/150 F3000 ft/150 F
5000 ft/150 F
Figure 7.4.3-Rheology Data of Borate-Crosslinked 35 lb Guar/Mgal for pH 10.0 atVarious Temperatures and Shear Histories

7-29
1000
10000
100000
10 100 1000
shear rate [sec-1]
4788
0 *
She
ar S
tres
s [p
sf]
No pre-shear/120 F
1000 ft/120 F
3000 ft/120 F
5000 ft/120 F
No pre-shear/150 F
1000 ft/150 F
3000 ft/150 F
5000 ft/150 F
No pre-shear/185 F
1000 ft/185 F
3000 ft/185 F
5000 ft/185 F
Figure 7.4.4-Rheology Data of Borate-Crosslinked 35 lb Guar/Mgal for pH 11.0 atVarious Temperatures and Shear Histories
10
100
1000
10000
85 120 150 185
Temperature [oF]
App
aren
t Vis
cosi
ty [c
p]
pH = 9.0 pH = 10.0 pH = 11.0
Figure 7.4.5-Apparent Viscosity at Various pHs and Temperatures for the Borate-crosslinked 35 lb/Mgal Guar gel at 65 sec-1 shear rate and 5 min shear history at
1400 sec-1

7-30
The above gathered rheology data was used to develop a unique empirical correlation thatrelates nominal shear rate with apparent viscosity of borate-crosslinked 35 lb/Mgal guaras a function of wellbore shear preconditioning, reservoir temperature, and fracturingfluid pH. This correlation relates reduced apparent viscosities, µr, with reduced shear
rates, .
rγ as follows
Blog*Ar
.
rr
.
)(*K += γγµ ......................................... (7.4.1)where,
appT
Tr a
bηµ = ……………………….……………..…. (7.4.2)
and .
Tr
.a γγ = .................................................................... (7.4.3)
In eqns. 7.4.2 and 7.4.3, aT and bT are horizontal and vertical shift factors. These factorsincorporate effect of temperature and shear history in the correlation as follows
Snc1
1
)TTc(
)TT(calog
3o2
o1T +
×−+−−
= ……………..…......... (7.4.4)
andSnd1
1
)TTd(
)TT(dblog
3o2
o1T +
×−+−−
= ............................ (7.4.5)
In eqns. 7.4.4 and 7.4.5, Sn, is a dimensionless number called shearing number and itdescribes the shear preconditioning of the fluid in terms of energy required to pump fluidthrough the coiled tubing. The shearing number depends on fluid flow rate, Q, coiledtubing diameter, D, and pressure drop across the different lengths of tubing, ∆P, and fluiddensity, ρ, as
3
4
Q'
D)pQ(Sn
ρ∆= ......................................................... (7.4.6)
In eqns. 7.4.1 through 7.4.6, various constants were determined with the experimentaldata gathered at the FFCF. These constants are given in Tables 7.4.1 and 7.4.2 below.
pH c1 c2 (oF) c3 ESS1 d1 d2 (oF) d3 ESS2
9 1.5 96.84 -0.00028 0.03622 -0.0689 -58.6 0.008 0.3463
10 -0.047 83.31 -0.0003 0.872 -0.434 -22 -0.00043 4.53
11 -0.036 74.50 0.0017 1.04 -1.047 -65.27 -0.000436 104
Table 7.4.1-Empirical Constants for Equations 7.4.4 and 7.4.5

7-31
pH A B K R2
9 -0.6484 1.2405 671 0.92
10 -0.2994 0.4297 1275 0.888
11 0.2661 0.3662 1476 0.946
Table 7.4.2-Empirical Constants for Equation 7.4.1
The empirical equations are used to compare correlation calculated viscosities with theexperimentally obtained values. This comparison is shown in Figure 7.4.6 for the fluidprepared at pH 9. The figure shows good agreement between the two values. Similaragreement was observed for other two fluid pHs 10 and 11.
Even though there is good agreement between empirical and experimental values,the correlation has some limitations. As the developed equations are empirical in nature,it must be used within the range of experimental measurements from which the rheologydata is derived. These conditions are mentioned earlier in the procedure of the section7.4.
100
1000
10000
1 10 100 1000
Reduced Shear Rate [sec-1]
Red
uce
d V
isco
sity
[cp
]
Shifted Data
Empirical Eqns.Calculated
Figure 7.4.6-Comparison of Correlation Calculated Viscosities with ExperimentallyObtained Values of Borate-Crosslinked 35 lb Guar/Mgal for pH 9.0

7-32
In addition to providing an empirical correlation for the fracturing fluids, the rheologicalcharacterization performed at the FFCF was compared with the laboratory measurementsmade at three service companies. This comparison is shown in Table 7.4.3. The tableshows that laboratory measured viscosities are closer to that of the fluid subjected to zeroshear history in the FFCF field scale fracture simulator. The laboratory viscosities,however, are very much different from values obtained for fluid subjected to shearconditioning representative of the wellbore.
FFCF Slot Company A Company B Company CFFCF
Laboratory
Shear History Slot R1B5 R1B1 R1B5 R1B5x R1B5x R1B5x
No Shearing 689 588 553 1037 655 913 706
3000 ft 532 - - - - - -
Table 7.4.3-Comparisons of Field and Laboratory Scale Characterization of Borate-Crosslinked 35 lb/Mgal guar viscosity (cp @ 100 sec-1) at 150 oF
Implications of the Research Results:1. The master curves provide fluid viscosity over a wide range of fracture shear rates
without actually measuring the data over the entire range. Thus, the curves provide aunique approach to save time and to reduce costs of the rheology measurements.
The master curves developed in this study will also help to address thequestion as to whether a fluid has sufficient viscosity after it is pumped through thewellbore, or what fluid formulation provides the required viscosity in the fracture.Often the industry compares the laboratory-measured rheology with viscosity-shearrate criteria developed by them through their experience from the numerousfracturing treatments. A similar comparison can be made between the industry-developed criteria and the master curve-calculated viscosities of several formulations.This comparison can tell which fluid formulation satisfies the criterion so that properfluid formulation can be selected for a particular fracturing treatment. Thus, severalfluid formulations can be evaluated with the help of the master curves.
For example in a fracturing treatment, the tubing diameter and length areknown from the well configuration; the friction pressure drop in the tubing is alsoreadily available and so is the reservoir temperature. This information can be used tocalculate shift factors from the empirical equations and to determine the fluidviscosities using the master curves provided in this paper. Moreover, the developedempirical correlation can be incorporated into fracturing software to readily andreliably calculate fluid viscosity in the fracture.
2. The comparison of the fluid rheological characterization between the laboratory andfield scale measurements at the FFCF showed that the viscometers provide viscosity

7-33
values closer to those measured with the HPS under the no pre-shear condition. Theresults, however, also showed that the viscometer values differ considerably from theHPS viscosities measured after shear conditioning through 3000 ft length of thecoiled tubing.21 This result implies that the crosslinked fluid may exhibit ideal fluidproperties under laboratory conditions, but under actual field conditions its behaviormay be completely different.20 Hence the borate crosslinked fluid rheology must bedetermined under conditions that closely simulate pumping environment through thewellbore and therefore, the laboratory characterization must incorporate shear historysimulations prior to the viscometric measurements.
Sometimes, however, it is difficult to incorporate shear history simulation inthe laboratory measurements, an inexpensive alternate method could be to use theempirical correlation developed at the FFCF22 as this correlation incorporates theeffect of shear history on the viscosity. For example in a fracturing treatment, thewellbore tubing diameter and length are known from the well configuration; thefriction pressure drop in the tubing is also readily available and so is the reservoirtemperature. This information can be used to calculate shift factors from theempirical equations and to determine fluid viscosities using the master curvesprovided in the study. The viscosities calculated using the correlation would thusinclude tubing shear history and would more accurately correspond to the fluidbehavior in a fracture.
7.5 LDV Study
Objectives: The objective of the study is (1) to explore the potential and capabilities ofthe assembled slot flow loop for measuring point velocities and thus velocity profiles ofthe fluids of interest, (2) to observe plug flow phenomena and experimentally determinecorresponding threshold flowrates, and (3) to determine experimental velocity profiles ofproppant-laden fluids and comparison with a theoretically developed velocity profiles.
Introduction: In the recent past, the application of LDV systems upon slot experimentshas yielded a great deal of information regarding the valuable parameters related tofracturing fluids. The LDV systems have shown great promise for the slot/fracturesimulation experiments and the advantages include:
• Flow type determination, that is, whether the flow in fracture is uniform and laminaror turbulent.
• Velocity profile determination. This provides fracturing fluid rheologist a better ideaabout the condition of the fracturing fluid at various points in the flow due to entranceeffects and/or settling of concentrations.
• Realistic modeling / simulations of fractures and flow situations.• Proppant-settling phenomena investigation (in both dynamic and static flow
situations) over a variety of fluid and proppant concentrations.• Velocity profile determination for drilling and completion fluids.

7-34
Even though LDV has proved itself a valuable technique for fluid applications, it doeshave a major drawback. This major drawback lies in its high sensitivity to small detailsrelated to both procedural and experimental setup. However, it should be noted that mostof the burden for LDV accuracy falls upon the experimenter who must construct a preciseexperimental setup and follow a detailed procedure with full attention to all theprecautions.
Since LDV application upon fluid systems is relatively new and requiressophisticated electronic tools, there have been only a few studies conducted, and the dataor information gathered is not enough to explore the full potential and application ofLDV systems. The work at hand is an attempt to explore the potential and capabilities ofan LDV based slot system for important design parameters related to fractures andfracturing fluids.
Procedure: In simple terms, the integrated translational motion scale was used to movethe LDV probe (inwards and outwards), and the total gap is traversed by measuring pointvelocities at incremental distances across the slot gap. The gap can be traversed by eithertraversing the gap from the front wall to the back wall (i.e. front traversing) or the otherway round (i.e. back traversing). In either case it is crucial to coincide the two laserbeams perfectly, otherwise, the point velocities measured would not represent the actuallocation. Typically, an error in beam coincidence is indicated in terms of horizontal shiftof experimental profile with respect to the theoretical velocity profile. Similarly, if theflow rate is not measured correctly, the experimental velocity profile shows lateral shiftwith respect to the theoretical velocity profile. Fig. 7.5.1 shows graphical representationof the procedure used for point velocity determination.
Results:
1. Location Experiments
A series of experiments was performed at different locations on the slot, namely A, B, C,D, and E, using the various concentration of 40 lbm/Mgal HPG fluid (Fig. 7.5.2). Usingthe correlation for the entrance length of non-Newtonian fluids in turbulent flow, anentrance length of 7.0 inch was calculated. Since all the selected locations were two ormore feet beyond the entrance, it was thus established that the LDV measurements atthese locations would not be affected by the entrance effects.
Experimental velocity profile acquired at point 'A' for 40 lbm/Mgal HPG showedan average correction factor (Correction Factor = Theoretical/ Experimental) of 1.30when compared to the theoretically developed velocity profile. Similarly, experimentalvelocity profiles were acquired at locations B, C and D for the same fluid and thecorrection factors thus obtained at these locations are presented in Table 7.5.1.

7-35
Top View (Point Velocity Determination)
Plexiglas plate
Plexiglas plate
VelocityProfile Point Velocity Reading
LDV Probe
Translational motion ofLDV probe whiletraversing the gap
C D E
B A
3 "
9.5
"
4"
12"
4"
1 f t 1 f t 1 f t 1 f t
6.5
"
Flow
4"
Figure 7.5.2-LDV Reading Locations
Figure 7.5.1-Velocity Profiling by LDV

7-36
Table 7.5.1 - The Theoretical/Experimental ratios at Various Locations
Location Theo./Exp.A 1.28B 1.45C 1.33D 1.37E 1.00
Different concentrations of HPG were tested at location E to cover wider range of “n”.The results showed good agreement between the theoretical and experimental velocityprofiles. A Newtonian fluid (corn syrup) was also tried at location E to confirm whetherthe above-mentioned agreement is valid for other fluid models.
An interesting phenomenon observed during location experiments is the variedgap size at different locations. The gap size at E is 10.0 mm and at locations A, B, C, andD it is between 8.0-9.0 mm. This is a unique application in which LDV was used todetermine actual gap size distribution of the slot. In order to measure the gap sizes atother locations, two holes were drilled into the midsection near the inlet, and gap size wasmanually measured to be 11.6 mm. The slot, thus have a highly variable size distribution.Figure 7.3.3 shows the gap size distribution of the slot. Table 7.5.2 shows the test matrixof the location experiments performed during this study.
Table: 7.5.2 - Location Experiments
no. Fluid lb/Mgal n K (eq.cp) NRe q (gpm) Vel-ft/sec1 Guar-HPG 40 0.41 1200 13.7 3.84 0.292 Guar-HPG 40 0.42 1300 10.4 3.46 0.263 Guar-HPG 40 0.43 1300 9.9 3.40 0.254 Guar-HPG 40 0.42 1300 9.0 3.17 0.245 Guar-HPG 40 0.46 1300 11.5 4.08 0.306 Guar-HPG 60 0.33 3201 5.0 2.72 0.207 Guar-HPG 70 0.30 3460 3.4 2.80 0.218 Guar-HPG 80 0.15 19065 1.0 1.75 0.139 Corn Syrup x 0.99 x 9.0 2.28 0.17
Note: ' x ' implies data were not acquired.
By trial and error, an area was established which when used in the theoretical velocityprofile equations all the profiles matched at all the locations. The results obtained atlocation E for 40 lbm/Mgal HPG is shown in Fig. 7.5.4.

7-37
Location E,10.0 mm
C,D8.0-9.0 mm
A,B8.0-9.0 mm
4.0"
2.50
"1.
50"
4.0"
12"
TopPlate
6.35mm
6.35mm
BasePlate
Figure 7.5.3 -Gap Size Distribution of Slot
0
0.05
0.1
0.15
0.2
0.25
0.3
0.35
0.4
0 1 2 3 4 5 6 7 8 9 10gap, ( mm)
velo
city
, ( m
/s)
Theoretical
Experimental
Figure 7.5.4 - Location E, 40 lbm/Mgal HPG, q = 4.08 gpm, n = 0.464

7-38
2. Multirate Experiments
Multirate experiments were conducted to investigate the so-called “plug flow”phenomenon, which is observed when the flow rate does not generate enough shear stressto exceed the yield stress of the flowing fluid. The velocity profile of the fluid havingcomplete plug is totally flat and there is no significant curvature in the otherwiseparabolic shape.
First multi-rate experiment was conducted with 40 lbm/Mgal Xanthan fluid at theflow rates of 3.17, 2.28, 1.60, and 0.60 gpm. When the data were analyzed and velocityprofiles were plotted, complete plug flow was observed to be started at some flow ratebetween 1.60 gpm and 0.60 gpm (Fig. 7.5.5).
It can be seen in Fig. 7.5.5 that the shape of the velocity profiles changed from thehighest flow rate to lowest flow rate, that is, the size of top plateau or the plug region isdecreasing with the increasing flow rates.
0
0.02
0.04
0.06
0.08
0.1
0.12
0 1 2 3 4 5 6 7 8 9 10 11gap, (mm)
velo
city
, (m
/s)
q = 3 . 1 7 g p mq = 2 . 2 8 g p mq = 1 . 6 0 g p mq = 0 . 6 0 g p m
Figure 7.5.5- First Multirate Experiment Showing Plug Flow at 0.6 gpm
A second multirate experiment (3.0, 1.30 and 1.05 gpm) was performed with the identicalfluid (40 lbm/Mgal Xanthan), focussing on the lower flow rate range to determine theflow rate at which the fluid starts flowing with a complete plug flow. The analysis of thesecond multirate experiment exhibited complete plug flow at the flow rate of 1.05 gpm asshown in Fig. 7.5.6.
There seems to be insignificant difference between the two profiles (Fig. 7.5.6)obtained at 1.30 gpm and 1.05 gpm. However, when the velocity profiles for 1.30 gpmand 1.05 gpm were plotted on a separate chart, the plug phenomenon at the lower flowrate 1.05 gpm seemed to be more pronounced (Fig. 7.5.7).

7-39
0
0.02
0.04
0.06
0.08
0.1
0.12
0 1 2 3 4 5 6 7 8 9 10 11 12gap, (mm)
velo
city
, (m
/sec
) q =1.05 gpm
q =1.30 gpm
q = 3.0 gpm
Figure 7.5.6 - Second Multirate Experiment 40 lbm/Mgal Xanthan, n=0.33
0.026
0.027
0.0280.029
0.03
0.031
0.0320.033
0.0340.035
0.036
0 1 2 3 4 5 6 7 8 9 10 11 12gap, (mm)
velo
city
, (m
/sec
)
Velocity at q = 1.05gpm
Velocity at q =1.30 gpm
Figure 7.5.7 - Comparison Between the Two Flow Rates 1.30 and 1.05 gpm
Thus, LDV technique was successfully used to experimentally establish a threshold flowrate at which the fluid just started flowing with a complete plug. Knowing this thresholdflow rate is an important parameter as it could be used for:

7-40
• Determining the highest flow rate that can be afforded to keep the fluid in the plugflow condition so that the fluid can efficiently carry or transport cuttings with itsflow.
• Designing the fluids for special applications like cementing and fluid displacements.• Planning the flow rates schedule for different petroleum engineering operations
involving fluids.
3. Experiment with Proppant-Laden Fluid
The LDV-based system was also applied upon proppant-laden fluids to test itsapplicability to complex fluids. These experiments were intended to address the fluidsthat are rheologically too complex to be explained by any available rheological model.
The initial experimental plan was to increase the proppant concentration from 1 ppg tohigher concentrations systematically and measure the velocity profiles at eachconcentration. When 1ppg experiment (1 lbm of 20/40-mesh sand per 1 gal 50 lbm/MgalXanthan) was carried out at the flow rate of 3.0 gpm, high settling rate was observed. Thepump pressure could not be increased further because the slot had already started leaking.Though the leak was not intense it indicated that the joints and connections are notdesigned for higher flow rates.
The velocity profile of first proppant concentration (1 pound 20/40 mesh sand per 1 galof 50 lbm/Mgal Xanthan) at flow rate of 3.0 gpm was completed successfully and isshown in Fig. 7.5.8. The pump pressure (rpm) was increased in an attempt to slow downthe settling and 2-ppg experiment was run immediately, but the increased rpm did nothelp and settling continued until the experiment had to be stopped. However about 65 %of the gap was still covered as plotted in Fig. 7.5.9.
0
0.02
0.04
0.06
0.08
0.1
0.12
0 1 2 3 4 5 6 7 8 9 10 11 12gap, (mm)
velo
city
, (m
/s)
Figure 7.5.8 - LDV Application for Proppant-Laden Fluid (1 ppg) at 3.0 gpm

7-41
Currently, the flow loop system has plastic pipes and flexible hose connections, which isa very weak setup for this kind of proppant-laden fluid experiments. Technicallyspeaking, the system has worked successfully with the proppant-laden fluids but thelimitation imposed was the pressure rating of the slot which forbade the necessary higherflow rates required to prevent settling in the slot gap. The solution to this problem,however, does not call for major changes in the setup. Metal plate reinforcement on theslot structure and rigid pipe connections may be used as a viable solution to this problem.
0
0.02
0.04
0.06
0.08
0.1
0.12
0 1 2 3 4 5 6 7 8 9 10 11 12gap, (mm)
velo
city
, (m
/s)
Experimental Data (2-ppg) at 3.20 gpm
Extrapolated Points
Figure 7.5.9 - LDV Application for Proppant-Laden Fluid (2 ppg) at q =3.20 gpm
Thus, following conclusions could be drawn from the study. During this LDV work, theshape of the slot gap size was identified to be an oval rather than a rectangle. Multirateexperiments with Xanthan (a yield fluid) helped determine a threshold flow rate at whichthe phenomenon of plug flow begins. The setup was applied upon the proppant-ladenfluids and experimental velocity profile was acquired for 1-ppg sand concentration. Theexisting setup was found to be unsuitable (because of its low pressure rating) for thehigher proppant concentrations.
Implications of the Results: The current experimental work offers many possibilities forfuture adventures in the LDV applications upon slot experiments. For example, thefollowing applications may be realized using this type of experimental setup.
1. The LDV technique could be applied to identify the actual gap size distributions (orgap uniformity) in the transparent or semi-transparent flow loops.

7-42
2. Entrance length may be easily determined for any fluid by measuring the velocityprofiles along the length of plexiglas slot. One may also replace slot with theplexiglas pipe to determine the entrance length of a pipe. Since LDV can be used toindicate the entrance effects, so it could be used to design "adjustments" to the inletand exit of the slot to improve flow uniformity. For example, one may measureentrance length after incorporating certain design adjustments and reach a design atwhich the entrance length is minimum.
3. Uniformity of velocity profile of a proppant-laden fluid is a qualitative indicator ofsuccessful design because such a fluid can deliver proppant deeper into the formationwhile fracturing. Manipulating the parameters related to either the proppant or gel canimprove velocity profiles and hence can help design the best proppant-gelcombination for the fracturing job.
7.6 Foam Fluid Rheology
Objective: The objective of the Foam Fluid study was to determine the effects of foamquality, temperature, and gelling agent concentration on foam viscosity and developempirical correlations to predict foam viscosity as a function of foam quality andtemperature.
Introduction: The use of foamed fluids in the petroleum industry has been widelyrecognized. Foams have been in use for applications such as a fracturing, stimulation,completion, and drilling due to their very unique properties. The properties are - highviscosity, low liquid content, low fluid loss, high carrying capacity, low hydrostatic head,low pressure loss due to friction, quick fluid recovery and good clean up performance,low formation damage, and no reduction of fracture conductivity due to fluid ingredients.When foam reaches the pit or tank it can be broken rapidly, so only the liquidscomprising the foam solution and contaminants must be handled. Inspite of theirimportance, relatively little has been studied about foams. This task is made even moredifficult because of the presence of the gas phase whose properties change withtemperature and pressure.
Procedure: The foam loop at the WCTC was used for the rheological characterization offoam fluids. A brief description of this flow loop and a schematic is provided in Chapter4. For this investigation, the liquid phase was prepared by mixing powderedxanthan/Guar and water. Then a foaming agent was added and mixed. The liquid phasewas then mixed with a gas phase (nitrogen). Different gelling agent concentrations 20,30, and 40 lb/Mgal of water were used. A 0.5% (vol.) of the foaming agent concentrationwas used for all the tests carried out. This is the recommended concentration for the testconditions used, as previously found at WCTC. For Xanthan foam, a ½ inch outsidediameter (0.43 in ID) pipe was used for all the tests. In case of Guar, two pipe sizes- 1/2and 3/8 in were used. Experiments were carried out at ambient temperature as well as attemperatures ranging from 75 to 200°F.

7-43
An average absolute pressure of 1000 psia was used for all the tests. This level ofabsolute pressure allowed the assumption that foam quality is constant and homogeneousinside the loop. Although this is not absolutely true, this assumption is necessary for dataanalysis purposes and does not lead to significant errors given the shortness of the loop.The test matrix for Xanthan foam is shown in Table 7.6.1.Table 7.6.2 shows that a total of two aqueous foams and four gelled foams were tested.The foams were generated with nitrogen as the gas phase and Howcosuds or SodiumDodecyl Sulfate (SDS) as the foaming agent. The liquid phase was either water or guarpolymer solutions. All tests were performed at 1000 psi and ambient temperatureconditions.
Table 7.6.1: Test Matrix for Xanthan
Temperature (oF)No.
Gel
(lb/Mgal) 75 100 125 150 175 200
1 20 lb Xanthan x 'x x x x x
2 30 lb Xanthan x 'x x x x x
3 40 lb Xanthan x x x x x x
4 40 lb PHPA x - - - x -
Table 7.6.2 Typical Test Matrix for Guar Foam Rheology Study
Test Number Foam Type Liquid Phase Foaming Agent
Test 1 Aqueous Water 0.5% (vol.) Howcosuds
Test 2 Aqueous Water 1.0% (vol.) Howcosuds
Test 3 Gelled 0.5% (wt.) Guar 0.5% (vol.) Howcosuds
Test 4 Gelled 0.5% (wt.) Guar 0.25% (wt.) S.D.S.
Test 5 Gelled 1.0% (wt.) Guar 0.5% (wt.) S.D.S.
Test 6 Gelled 0.5% (wt.) Guar 0.125% (wt.) S.D.S.
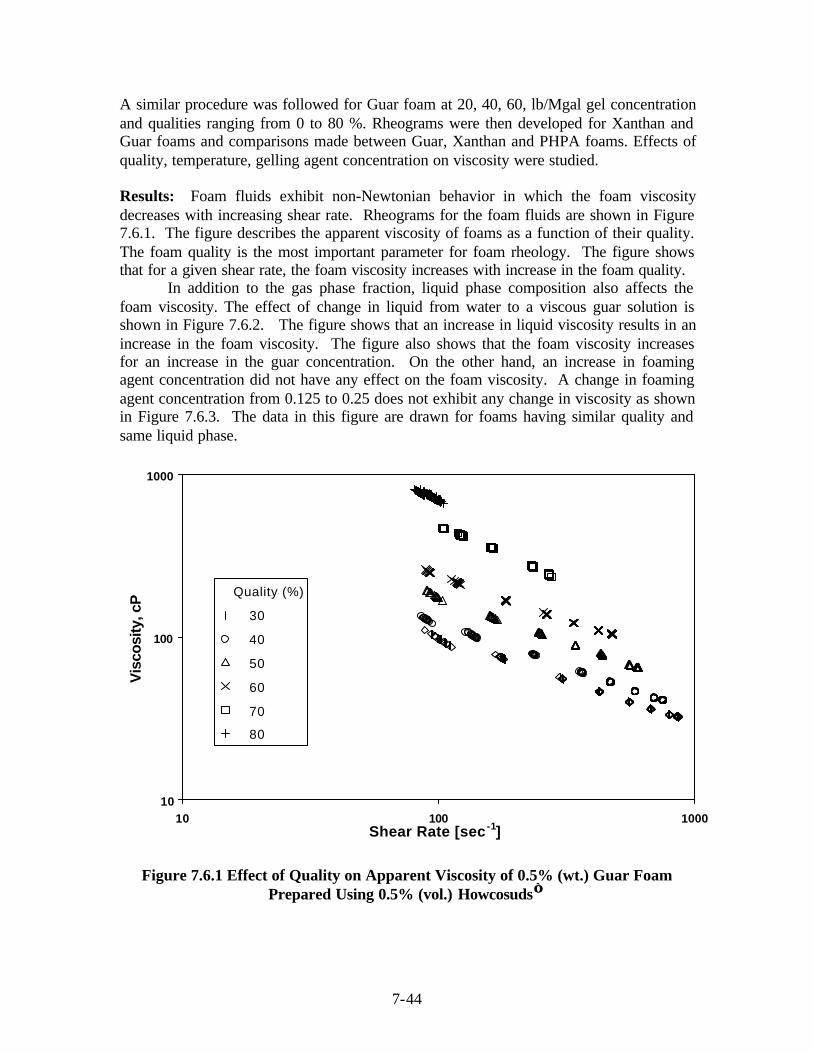
7-44
A similar procedure was followed for Guar foam at 20, 40, 60, lb/Mgal gel concentrationand qualities ranging from 0 to 80 %. Rheograms were then developed for Xanthan andGuar foams and comparisons made between Guar, Xanthan and PHPA foams. Effects ofquality, temperature, gelling agent concentration on viscosity were studied.
Results: Foam fluids exhibit non-Newtonian behavior in which the foam viscositydecreases with increasing shear rate. Rheograms for the foam fluids are shown in Figure7.6.1. The figure describes the apparent viscosity of foams as a function of their quality.The foam quality is the most important parameter for foam rheology. The figure showsthat for a given shear rate, the foam viscosity increases with increase in the foam quality.
In addition to the gas phase fraction, liquid phase composition also affects thefoam viscosity. The effect of change in liquid from water to a viscous guar solution isshown in Figure 7.6.2. The figure shows that an increase in liquid viscosity results in anincrease in the foam viscosity. The figure also shows that the foam viscosity increasesfor an increase in the guar concentration. On the other hand, an increase in foamingagent concentration did not have any effect on the foam viscosity. A change in foamingagent concentration from 0.125 to 0.25 does not exhibit any change in viscosity as shownin Figure 7.6.3. The data in this figure are drawn for foams having similar quality andsame liquid phase.
10
100
1000
10 100 1000Shear Rate [sec -1]
Vis
cosi
ty, c
P Quality (%)
30
40
50
60
70
80
Figure 7.6.1 Effect of Quality on Apparent Viscosity of 0.5% (wt.) Guar FoamPrepared Using 0.5% (vol.) Howcosuds
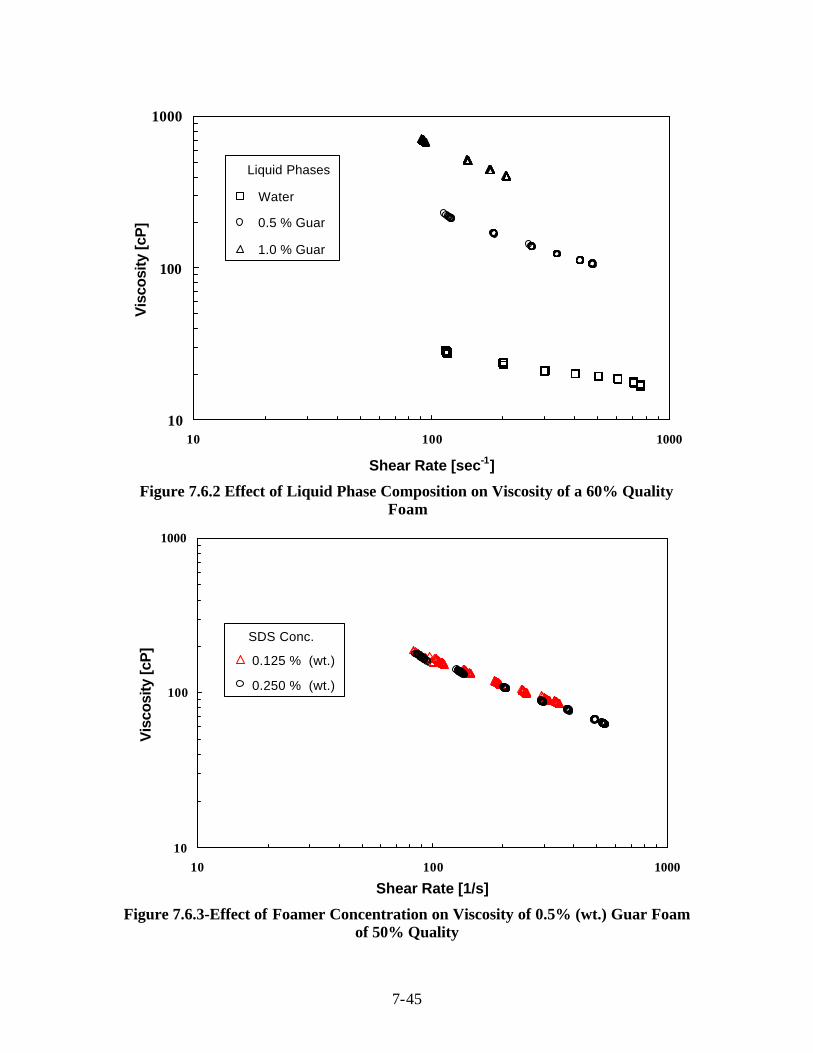
7-45
10
100
1000
10 100 1000
Shear Rate [sec-1]
Vis
cosi
ty [c
P]
Liquid Phases
Water
0.5 % Guar
1.0 % Guar
Figure 7.6.2 Effect of Liquid Phase Composition on Viscosity of a 60% QualityFoam
10
100
1000
10 100 1000
Shear Rate [1/s]
Vis
cosi
ty [c
P]
SDS Conc.
0.125 % (wt.)
0.250 % (wt.)
Figure 7.6.3-Effect of Foamer Concentration on Viscosity of 0.5% (wt.) Guar Foamof 50% Quality

7-46
Correlations such as the one shown in Fig. 7.6.4 and 7.6.5 were developed for Xanthanfoam
Using the model parameters from this study, apparent viscosity was calculated ata shear rate of 511 s-1 using Eq. 7.6.1. By dividing the flow behavior index of the foamwith the flow behavior index at 75 oF, a value close to 1 was obtained. For subsequentanalysis, the flow behavior index for the foam was taken as that of the gel and with thepreviously calculated viscosity, the foam consistency index was calculated.
By dividing the foam consistency index with that of the liquid gel, a relative valuewas obtained. Figures 7.6.4 and 7.6.5 show the relationship of the relative consistencyindex and yield stress as a function of quality at different temperatures. The relativeconsistency index and the yield stress increased gradually at low qualities, then roseexponentially as the quality increased beyond 60%. The data was a bit scattered at 80%quality for the high temperature experiments. The following correlations were obtained.
)Q813.2Q556.1(e
LKFK
2aa +
= ................................. (7.6.1)
aQ5.3e013.0o =τ ..................................................... (7.6.2)
0
5
10
15
20
25
0 10 20 30 40 50 60 70 80 90
Quality (%)
KF
oam
/KLi
quid
75 °F100 °F125 °F150 °F175 °F200 °FTrendline
Figure 7.6.4-Relative Consistency Index for 20 lb/Mgal Xanthan Foam

7-47
0.0
0.1
0.2
0.3
0.4
0.5
0 20 40 60 80 100
Quality (%)
Yie
ld S
tres
s, to
(lbf
/ft2 )
75 °F100 °F125 °F150 °F175 °F200 °FTrendline
Figure 7.6.5-Yield Stress as a Function of Quality for 20 lb/Mgal Xanthan Foam
Similar correlations were developed for Guar foam. The ratio of the foam consistencyindex to the liquid phase flow consistency index can be approximated by the followingequations for 20 lb/Mgal and 40 lb/Mgal guar gels respectively,
( )2aa Q1224.4Q5168.0e
LKfK += ................................ (7.6.3)
( )2aa Q9396.2Q01182.0e
LKfK += .............................. (7.6.4)
Trends similar to those in Xanthan were observed in case of Guar. A comparison wasmade between Xanthan, Guar and PHPA foam. As an illustration, a comparison betweenXanthan and Guar foams is shown in Fig 7.6.6.

7-48
Fig. 7.6.6. Apparent Viscosity Comparison for 40 lb/Mgal Xanthan Foam and 40 lb/Mgal Guar Foam at 100 oF
10
100
1000
10 100 1000
Shear Rate (1/s)
Ap
par
ent
Vis
cosi
ty (
cP)
0% Xanthan Foam0% Guar Foam60% Xanthan Foam60% Guar Foam70% Xanthan Foam70% Guar Foam
Figure 7.6 Apparent Viscosity Comparison for 40 lb/Mgal XanthanFoam and 40 lb/Mgal Guar at 100 0F
Implications of the Research Results:
1. The foam viscosity increases with an increase in the foam quality. This result impliesthat a higher fraction of gas in the foam can be used to generate a viscous fluid. Ashigh viscosity is useful to successfully transport proppant in a fracture, the higherquality foams are better choice to perform a fracturing treatment and stimulate a well.Similarly high viscosity is required to transport wellbore cuttings during a drillingoperation; thus the higher quality foam is a better choice for a drilling fluid.
The higher quality foam contains a lower fraction of the liquid in the foam. Itmeans that a smaller amount of liquid will leak off into the formation when highquality foams are used in either a drilling operation or a fracturing treatment. Thelow leak off implies that the damage to the surrounding formation is minimal, andtherefore the cost for remedial treatment is low.
The low liquid content in the foam also reduces the damage to a proppant in afracture. Hence fracture conductivity is maintained high when stimulation treatmentsare performed with foam based fracturing fluid.
2. The foam viscosity increases with an increase in the liquid polymer concentration.Moreover the polymers have higher viscosity and exhibit lower friction loss than thatof water. Therefore, polymers enhance the capabilities of foams. This result impliesthat polymer-based foams have more advantages over aqueous foams, and theyprovide an economical method to perform a stimulation treatment or a drillingoperation.
Figure 7.6.6 Apparent Viscosity Comparison for 40 lb/Mgal XanthanFoam and 40 lb/Mgal Guar Foam at 100 0F

7-49
3. Comparison of xanthan, guar, HPG, and PHPA foams show that each system has itsown properties (constants used in the correlations), although the general behavior ofthe rheograms is basically the same.
7.7 Heat Transfer
Objective: The purpose of the heat transfer study was to understand heat transfercharacteristics of the fracturing fluids and generate heat transfer coefficients of the linear,crosslinked and sand-laden fracturing fluids.
Introduction: Temperature of the fracturing fluids changes from ambient conditions onthe surface in tanks to reservoir temperature in the subsurface in fracture. This change intemperature causes change in fluid characteristics, which affects the fluid performance ina treatment. The change in characteristics depends on the capability of the fluid to absorbheat, which is a function of the heat transfer coefficient of the fluid.
Very few studies are reported in the literature that evaluate heat transfer data ofthe fracturing fluid. Due to lack of the accurate data, fracturing simulators substitute heattransfer coefficient of water for the fracturing fluids. These numbers, however, are anorder of magnitude different from that of the real fluids. Therefore, erroneous estimatesare made of the fluid characteristics and as a result, fracturing treatments are improperlydesigned.
A 500 ft long double pipe heat exchanger, available at the FFCF, was used togenerate valuable heat transfer data of several fracturing fluids.23-24
Procedure: The test procedure comprised of pumping fracturing fluids through innerpipe of the double pipe heat exchanger and heating fluid with hot water flowing in theannulus. The fluid was preconditioned through various lengths of the coiled tubing sothat effects of shear history are included in the heat transfer study. The heat transfercoefficients were determined by measuring fluid temperature at four points along thelength of the heat exchanger. The coefficients were measured for several fluids. Thesefluids included water, linear guar and HPG solutions, borate-crosslinked guar gels andcrosslinked guar slurry.
Results: The overall heat transfer coefficient of the water is 200 Btu/hr oF ft2. The heattransfer coefficients of the linear guar and HPG, however, are less than that of the water.These coefficients increase with increase in fluid flow rate through the heat exchanger asshown in Figure 7.7.1. The figure shows that there is not much difference in thecoefficients of the guar and HPG polymer solutions.
The fluid rheology study, in the previous section, showed that the fluid behaviorof the borate-crosslinked guar is a strong function of shear history, fluid pH andtemperature. Therefore, the heat transfer characteristics of these fluids must also bedependent on the same parameters. This is confirmed from the evaluation of the heattransfer coefficients of these fluids as shown in Figure 7.7.2. The figure is drawn for arelative coefficient which is the ratio of heat transfer coefficient of the fracturing fluid to

7-50
that of the water. The figure shows that the fluid prepared at pH 9 has the highest heattransfer coefficient and its value decreases with an increase in the shear history throughthe coiled tubing. The figure also shows that the heat transfer coefficient of thecrosslinked gel is less than one half of the water value. Similarly, the heat transfercoefficient of the sand-laden crosslinked fluid is less than that of the water as shown inFigure 7.7.3. But this slurry coefficient is much closer to the water value than that of theclean fluid. The figure shows that the coefficient of the sand slurry is more than that ofthe clean fluid.
30
40
50
60
70
80
90
20 30 40 50 60 70 80 90 100 110
Flow Rate [gpm]
U tu
be [
Btu
/hr/o F
/ft2 ]
Guar HPG
Figure 7.7.1-Heat Transfer Coefficients of 35 lb/Mgal Guar and HPG at SeveralFlow Rates
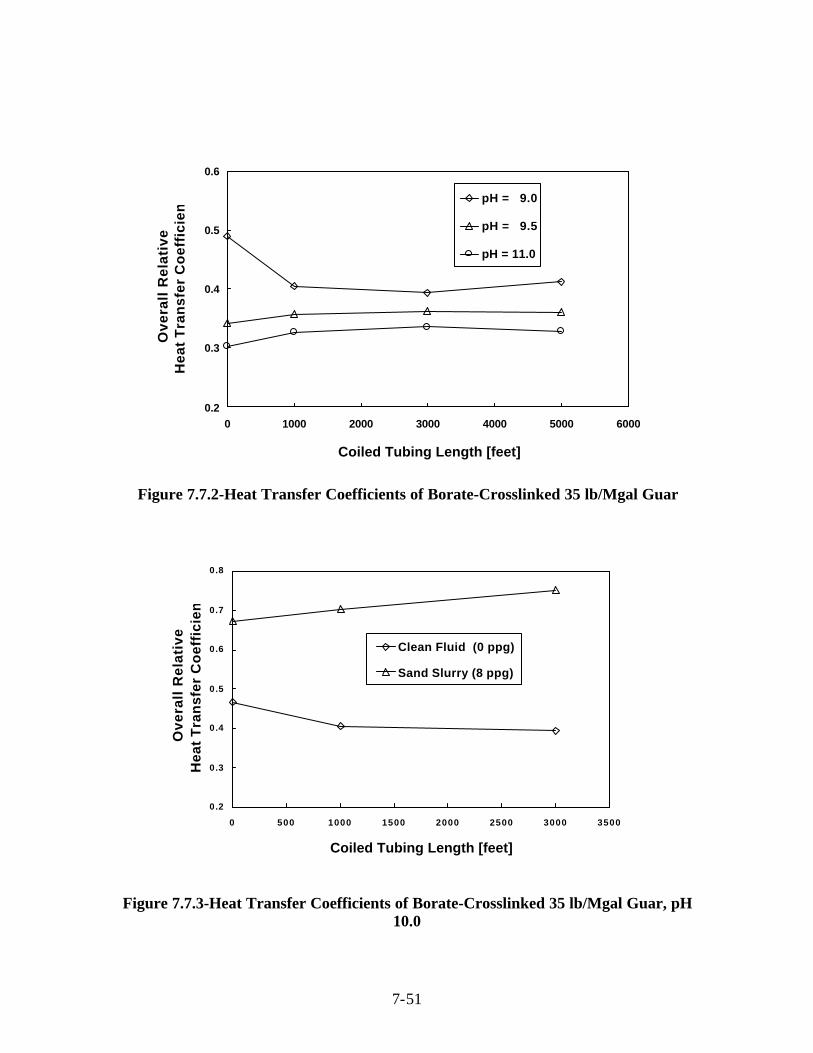
7-51
0.2
0.3
0.4
0.5
0.6
0 1000 2000 3000 4000 5000 6000
Coiled Tubing Length [feet]
Ove
rall
Rel
ativ
e H
eat
Tra
nsf
er C
oef
fici
ent pH = 9.0
pH = 9.5
pH = 11.0
Figure 7.7.2-Heat Transfer Coefficients of Borate-Crosslinked 35 lb/Mgal Guar
0.2
0.3
0.4
0.5
0.6
0.7
0.8
0 500 1000 1500 2000 2500 3000 3500
Coiled Tubing Length [feet]
Ove
rall
Rel
ativ
e H
eat
Tra
nsf
er C
oef
fici
ent
Clean Fluid (0 ppg)
Sand Slurry (8 ppg)
Figure 7.7.3-Heat Transfer Coefficients of Borate-Crosslinked 35 lb/Mgal Guar, pH10.0

7-52
Implications of the Research Results:1. The heat transfer coefficients of the linear guar and HPG solutions, and crosslinked
gels are lower than that of the water.24 The lower coefficient means that the heattransfer characteristics of fracturing fluids are poorer than that of water. Thereforethese fluids will heat up at slower rate when they are pumped through the fracture andthey will attain reservoir temperatures at longer times than if water is pumped throughthe fracture. The slower heat up rate means that the fracturing fluids will retain theircharacteristic viscosities in the fracture for a longer period before the reservoirconditions begin to affect the fluid behavior at higher temperatures. This prolongedstability of the fluid suggests that the fracturing fluids may perform better under realdownhole conditions than what is predicted from the current industry practice ofsubstituting the heat transfer coefficient of water for the fracturing fluids.
2. On the other hand, the heat transfer coefficient of the guar slurry is similar to that ofthe water.21 This similarity means that the heat transfer characteristics of thefracturing slurry can be satisfactorily estimated from that for the water. Therefore,the current practice of predicting the slurry heat transfer characteristics with water canbe successfully continued without compromising the fluid performance under realconditions.
7.8 Proppant Flowback
Objective: The purpose of the proppant flowback study was to determine minimumcleanup rate before proppant flowback begins and evaluate the effects of variousfracturing and reservoir parameters on the critical flow rates.
Introduction: After a fracturing treatment, reservoir is flowed back to remove anyfracturing fluid left in the proppant pack and thus, cleanup the fracture. The flowback isperformed by opening well through surface chokes, whose size is slowly increased so thatmost of the fluid is recovered and well begins to flow reservoir fluids at a stimulated rate.A controlled flowback is important to recover the maximum quantity of fracturingpolymer in minimum time and without any flowback of proppants. Any flowback of theproppant is undesirable because sand removed from the propped area reduces totalpropped height and fracture length, causing a loss in fracture conductivity. Therefore, thepresent study was performed to identify flow rates that will allow proppant-free fracturecleanup.
Procedure: The proppant flowback rates were evaluated in the slot, which provides aunique 9400 inch2 of the fracture wall area. The fluid was pumped into the slot set to afracture gap width and filled with sand. The sand pack was subjected to an orthogonalapplied pressure to simulate closure stress on the fracture. The flowback tests were

7-53
performed at two fracture gap widths, 0.16 and 0.40 inch, two proppant size, 20/40 and12/20 mesh sand, and four closure stresses, 0, 200, 500 and 1000 psi.
A detailed description of the procedure used to perform this study can be foundin GRI annual reports12,13 and SPE technical paper.25
Results: The results of the investigation showed that stability of the proppant pack is astrong function of the reservoir and fracturing parameters. The minimum flow rates forinitiation of proppant flowback are shown in Figure 7.8.1. It shows that the packdestabilizes at lower water flowback rates as the closure stress is increased from zero to1000 psi. On the other hand, the pack produces proppant at higher flow rates as the sandsize is increased. The pack, however, destabilizes at lower water flowback rates whenthe fracture gap width is increased.
The increase in the closure stress also results in increase in the cumulativeproppant production. This effect is shown in Figure 7.8.2 on a proppant pack preparedwith a 20/40 mesh sand. The figure shows that up to 40 minutes of flowback, the totalsand production is maximum for 1000 psi closure and 0.4 inch gap width. It also showsthat in just 120 mins, 30% of the packed sand is produced. The proppant distributions inthe fracture after 40 and 120 mins of flowback are shown in Figure 7.8.3. The figuredisplays digitized images of the tests recorded on the video. It describes sand free areasinside white ovals.
0
0.2
0.4
0.6
0.8
1
1.2
1.4
0 200 500 1000
Closure Pressure [psi]
Min
imum
Out
let W
ater
Flow
Rat
e [g
pm]
20/40 mesh (0.16") 20/40 mesh (0.40")
12/20 mesh (0.16") 12/20 mesh (0.40")
Figure 7.8.1- Proppant Flowback Initiation/ Pack Stability Tests through FractureGap Widths of 0.16 and 0.40 inch

7-54
0%
10%
20%
30%
0 20 40 60 80 100 120
Time [min]
San
d P
rod
uce
d a
s a
% o
f In
itia
l San
d-
In-P
lace
1000 psi (0.4") 1000 psi (0.16")
500 psi (0.4") 500 psi (0.16")
200 psi (0.4") 200 psi (0.16")
Figure 7.8.2Percentage of 20/40 mesh Sand Produced for 0.5 gpm Inlet WaterFlow Rate through Sand Pack of 0.16 and 0.40 inch Gap Widths
Figure 7.8.3(a) Proppant Distribution after 40 minutes of Flowing Back Water ata Rate of 0.5 gpm through a Fracture Width of 0.16" Maintained under a Closure
Pressure of 500 psi

7-55
Figure 7.8.3(b)Proppant Distribution after 120 minutes of Flowing Back Water ata Rate of 0.5 gpm through a Fracture Width of 0.16" Maintained under a Closure of
500 psi
Implications of the Research Results:1. The results show that the critical flowrate is a function of proppant size, fracture
width and closure stress. This means that the stability of the propped fracture isstrongly dependent on the stimulation parameters and reservoir conditions.
The FFCF study shows that there is a critical flow rate beyond which thesand will be produced from the propped fracture; below this rate, there isnegligible sand production.25 This result disproves Stein's26 conclusion that theunconsolidated sand would flowback at any flow rate.
2. The FFCF results show that the critical flow rate decreases when the closure stressis increased. This result is a unique observation made in the proppant flowbackstudy at the FFCF as the relationship between the flowrate and closure stress wasnot considered in previous studies.
Since the closure stress affects the pack stability, there are practicalimplications of the results. It implies that if a low closure is maintained duringflowback operation, the fracture cleanup can be performed at higher rates thanthose being currently used in the industry. Higher rates mean that the fracturecleanup time can be reduced and costs for flowback operation can be decreased.
3. The results show that the critical flow rate decreases as the ratio of the gap width(w) to particle diameter (dp) is increased from 3.2 to 16.0, and the relationship

7-56
between the pack stability and w/dp ratio is dependent on the closure pressure.This result implies that the proppant pack could be stable at higher w/dp ratios thanthe three to six range values if the closure pressure is low. This may be a possiblereason why there is no proppant flowback observed in field when the fracturewidths are more than those predicted by the six times the proppant diameter.
Previous numerical and experimental investigations of the flowbackphenomena concluded that a proppant pack is stable when the range of the ratio ofthe fracture width to proppant diameter is between the values from three to six.27-29
But these studies did not observe that these ratios are dependent on the cleanupflow rates; on the other hand, the FFCF results25 show that the proppant flowbackcan occur within the recommended ratios, albeit at higher fluid rates as comparedto the rates for the higher ratios.
4. The FFCF study shows that upto 30% of the sand placed in a fracture can beproduced in just two hour. This result has great implications on the wellproductivity. When this result is compared to the stimulation ratios obtained atdifferent percentages of the filled fracture, it is observed that the well productivitydecreased from 10.5 in a fully propped fracture to only 1.2 in the 70% filledfracture.30 This huge decrease in the stimulation ratio means that all potentialbenefits of the hydraulic fracturing treatment can be lost due to proppant flowbackfrom a fracture.
7.9 Dynamic Fluid Loss
Objective: Dynamic fluid loss experiments were performed to achieve the followingobjectives: (1) to compare large surface area experiments performed in the HPS withthose obtained in the laboratory, (2) to explore mechanistic differences between fluid lossbehavior of polymer solutions and crosslinked gels, (3) to investigate and documentdifferences between gel fluid loss behavior on low and high permeability media, and (4)to investigate dynamic fluid loss behavior on natural fractures.
Introduction: Quantifying the rate at which fluid is lost to permeable fracture faces isimportant for the design and execution of successful hydraulic fracturing treatments.Fluid lost to the porous rock matrix during a treatment increases the overall fluid volumeneeded to achieve specific fracture dimensions. Fluid efficiency has been used as ameasure of fluid loss control and is defined as the ratio of fracture volume to fluidvolume pumped. Based on this definition it is easy to demonstrate that an increase influid efficiency from 50 to 90% will decrease the fluid volume needed to create a specificfracture geometry by over 40%. Therefore, the potential benefit that can be derived froma greater understanding of fluid loss control mechanisms is significant.
Procedure: Prior to performing a dynamic fluid-loss test, the facing permeability towater was determined. The HPS slot was pressurized to approximately 200 psi with
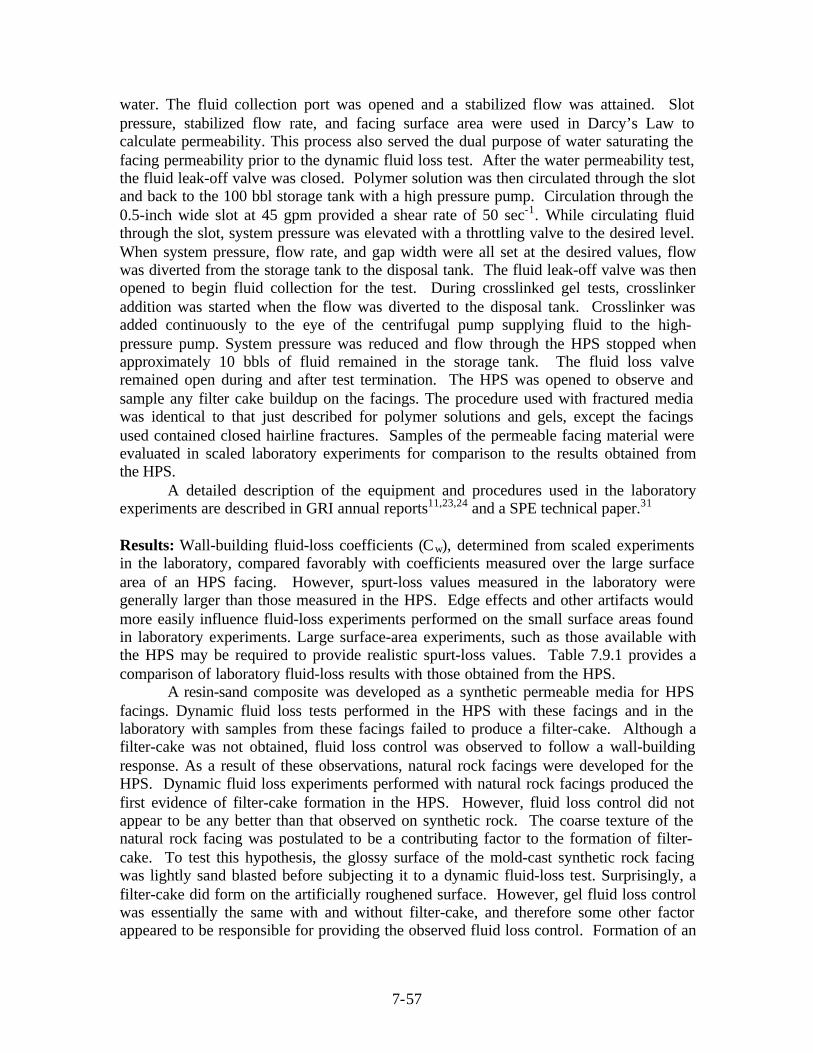
7-57
water. The fluid collection port was opened and a stabilized flow was attained. Slotpressure, stabilized flow rate, and facing surface area were used in Darcy’s Law tocalculate permeability. This process also served the dual purpose of water saturating thefacing permeability prior to the dynamic fluid loss test. After the water permeability test,the fluid leak-off valve was closed. Polymer solution was then circulated through the slotand back to the 100 bbl storage tank with a high pressure pump. Circulation through the0.5-inch wide slot at 45 gpm provided a shear rate of 50 sec-1. While circulating fluidthrough the slot, system pressure was elevated with a throttling valve to the desired level.When system pressure, flow rate, and gap width were all set at the desired values, flowwas diverted from the storage tank to the disposal tank. The fluid leak-off valve was thenopened to begin fluid collection for the test. During crosslinked gel tests, crosslinkeraddition was started when the flow was diverted to the disposal tank. Crosslinker wasadded continuously to the eye of the centrifugal pump supplying fluid to the high-pressure pump. System pressure was reduced and flow through the HPS stopped whenapproximately 10 bbls of fluid remained in the storage tank. The fluid loss valveremained open during and after test termination. The HPS was opened to observe andsample any filter cake buildup on the facings. The procedure used with fractured mediawas identical to that just described for polymer solutions and gels, except the facingsused contained closed hairline fractures. Samples of the permeable facing material wereevaluated in scaled laboratory experiments for comparison to the results obtained fromthe HPS.
A detailed description of the equipment and procedures used in the laboratoryexperiments are described in GRI annual reports11,23,24 and a SPE technical paper.31
Results: Wall-building fluid-loss coefficients (Cw), determined from scaled experimentsin the laboratory, compared favorably with coefficients measured over the large surfacearea of an HPS facing. However, spurt-loss values measured in the laboratory weregenerally larger than those measured in the HPS. Edge effects and other artifacts wouldmore easily influence fluid-loss experiments performed on the small surface areas foundin laboratory experiments. Large surface-area experiments, such as those available withthe HPS may be required to provide realistic spurt-loss values. Table 7.9.1 provides acomparison of laboratory fluid-loss results with those obtained from the HPS.
A resin-sand composite was developed as a synthetic permeable media for HPSfacings. Dynamic fluid loss tests performed in the HPS with these facings and in thelaboratory with samples from these facings failed to produce a filter-cake. Although afilter-cake was not obtained, fluid loss control was observed to follow a wall-buildingresponse. As a result of these observations, natural rock facings were developed for theHPS. Dynamic fluid loss experiments performed with natural rock facings produced thefirst evidence of filter-cake formation in the HPS. However, fluid loss control did notappear to be any better than that observed on synthetic rock. The coarse texture of thenatural rock facing was postulated to be a contributing factor to the formation of filter-cake. To test this hypothesis, the glossy surface of the mold-cast synthetic rock facingwas lightly sand blasted before subjecting it to a dynamic fluid-loss test. Surprisingly, afilter-cake did form on the artificially roughened surface. However, gel fluid loss controlwas essentially the same with and without filter-cake, and therefore some other factorappeared to be responsible for providing the observed fluid loss control. Formation of an
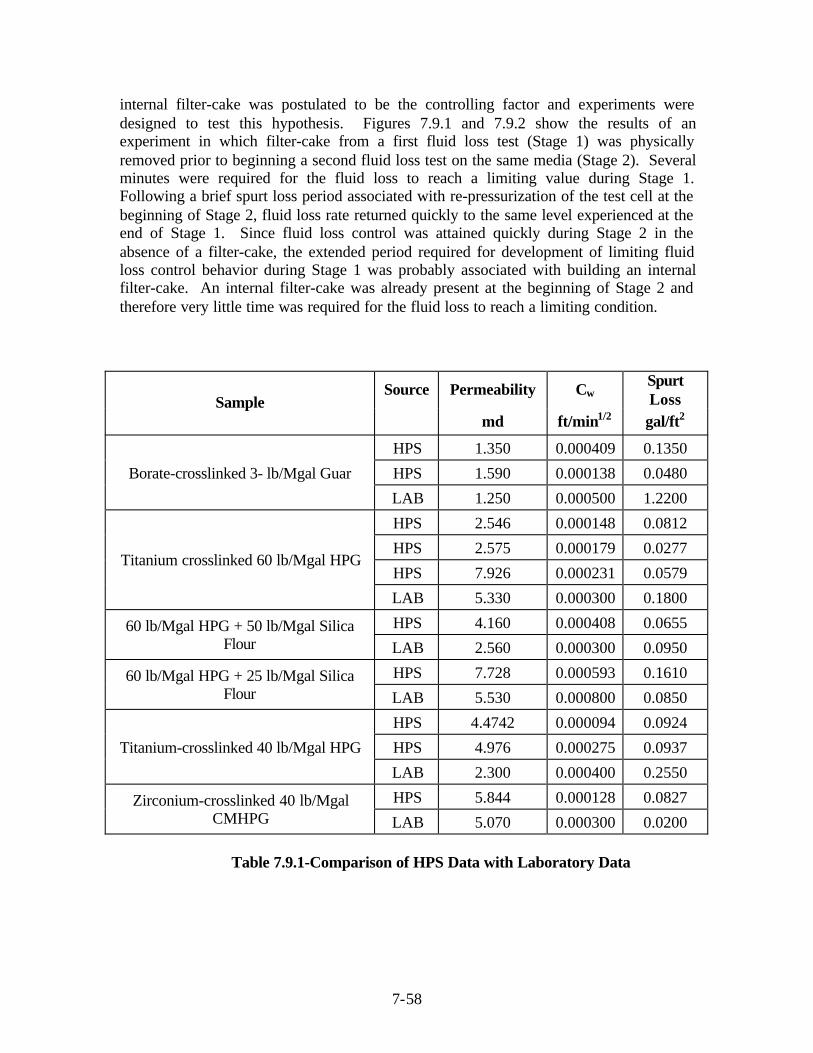
7-58
internal filter-cake was postulated to be the controlling factor and experiments weredesigned to test this hypothesis. Figures 7.9.1 and 7.9.2 show the results of anexperiment in which filter-cake from a first fluid loss test (Stage 1) was physicallyremoved prior to beginning a second fluid loss test on the same media (Stage 2). Severalminutes were required for the fluid loss to reach a limiting value during Stage 1.Following a brief spurt loss period associated with re-pressurization of the test cell at thebeginning of Stage 2, fluid loss rate returned quickly to the same level experienced at theend of Stage 1. Since fluid loss control was attained quickly during Stage 2 in theabsence of a filter-cake, the extended period required for development of limiting fluidloss control behavior during Stage 1 was probably associated with building an internalfilter-cake. An internal filter-cake was already present at the beginning of Stage 2 andtherefore very little time was required for the fluid loss to reach a limiting condition.
Source Permeability CwSpurtLossSample
md ft/min1/2 gal/ft2
HPS 1.350 0.000409 0.1350
HPS 1.590 0.000138 0.0480Borate-crosslinked 3- lb/Mgal Guar
LAB 1.250 0.000500 1.2200
HPS 2.546 0.000148 0.0812
HPS 2.575 0.000179 0.0277
HPS 7.926 0.000231 0.0579Titanium crosslinked 60 lb/Mgal HPG
LAB 5.330 0.000300 0.1800
HPS 4.160 0.000408 0.065560 lb/Mgal HPG + 50 lb/Mgal SilicaFlour LAB 2.560 0.000300 0.0950
HPS 7.728 0.000593 0.161060 lb/Mgal HPG + 25 lb/Mgal SilicaFlour LAB 5.530 0.000800 0.0850
HPS 4.4742 0.000094 0.0924
HPS 4.976 0.000275 0.0937Titanium-crosslinked 40 lb/Mgal HPG
LAB 2.300 0.000400 0.2550
HPS 5.844 0.000128 0.0827Zirconium-crosslinked 40 lb/MgalCMHPG LAB 5.070 0.000300 0.0200
Table 7.9.1-Comparison of HPS Data with Laboratory Data

7-59
0
1000
2000
3000
4000
5000
6000
7000
0 50 100 150 200
Time [minute]
Leak
off
[ml] Leak Off Data
Square Root Time Fit
Synthetic Rock Permeability = 2.8 mdCw = 0.00451 ft/min0.5
Spurt Loss = 0.00407 gal/ft2
Synthetic Rock Permeability = 2.8 md
Cw = 0.00081 ft/min0.5
Spurt Loss = 0.003 gal/ft2
Stage 1 Stage 2
Figure 7.9.1-Dynamic Fluid-Loss Test with Borate-Crosslinked 35 lb/Mgal Guar
0
20
40
60
80
100
0 20 40 60 80 100 120 140 160 180
Time [minute]
Leak
off
rat
e [m
l/min
]
Leak Off Data
Synthetic Rock Permeability = 2.8 md
Cw = 0.00451 ft/min0.5
Spurt Loss = 0.00407 gal/ft2
Synthetic Rock Permeability = 2.8 md
Cw = 0.00081 ft/min0.5
Spurt Loss = 0.003 gal/ft2
Stage 1 Stage 2
Figure 7.9.2-Leakoff Rate during Dynamic Fluid-loss Tests withBorate-Crosslinked 35 lb/Mgal Guar

7-60
In high-permeability media, crosslinked gels follow square-root-time behavior for anextended time period. However, in low-permeability media, gel fluid loss deviates fromsquare-root-of-time behavior at some point and reaches limiting or linear behavior. Thepoint at which deviation from square-root-of-time behavior occurs decreases as thepermeability decreases. Polymer solutions generally follow square-root-of-time behavioron all but very low permeability media. Therefore, crosslinked gels are typically moreefficient than polymer solutions at early times because they control spurt loss better.However, at longer times, polymer solutions become more efficient because theycontinue to follow square-root-of-time behavior while gels develop linear or limitingfluid-loss behavior. This behavior is illustrated by the fluid loss behavior showngraphically in Figs.7.9.3 and 7.9.4 for a polymer solution and gel respectively. At theend of the 80-minute test period, both show a cumulative fluid loss of approximately3000 ml and therefore both exhibit the same fluid efficiency at this point in time.However, the polymer solution leak-off rate has diminished to 8 ml/min and coulddecrease even more if the cumulative fluid-loss volume continues to follow a square-root-of-time relationship. In contrast, the crosslinked gel leak-off rate continues at the limitingrate of 30 ml/min, which was established approximately 20 minutes into the test. Basedon these leak-off rates, the polymer solution will become more efficient than the gelbeyond 80 minutes. Therefore, fluid loss efficiency provided by a polymer solution maybecome substantially better than a gel when injection times are long. Under thesecircumstances, a polymer solution may be selected as the treating fluid because less fluidvolume would be required. Another obvious application of these findings would be toimplement a two-fluid treatment schedule. A crosslinked gel would be used during thepad to open the fracture and control spurt-loss and would be followed by a polymersolution to control fluid loss and transport proppant.
0
500
1000
1500
2000
2500
3000
3500
0 10 20 30 40 50 60 70 80 90
Time [min]
Leak
-off
vol
ume
[ml]
Leak Off DataSquare Root Time Fit
Synthetic Rock Permeability = 9.70 md
Cw = 0.000585 ft/min0.5
Spurt Loss = 0.1169 gal/ft2
Figure 7.9.3-Dynamic Fluid-Loss Test with 60 lb/Mgal HPG + 25 lb/Mgal Si(Synthetic Rock)

7-61
Neither the viscosity of a crosslinked gel nor filter-cake formation was sufficient tocontrol leak-off through naturally fractured media. Solids in combination with a viscousgel were needed to control the leak-off through naturally fractured Berea sandstone. Itwas necessary to optimize both particle size and concentration to control leak-off throughthis media.
0
500
1000
1500
2000
2500
3000
3500
0 10 20 30 40 50 60 70 80
Time [min]
Leak
-off
Vol
ume
[ml]
Leak Off DataSquare Root Time Fit
Synthetic Rock Permeability = 6.90 md
Cw = 0.00098 ft/min0.5
Spurt Loss = 0.008526 gal/ft2
Figure 7.9.4-Dynamic Fluid-Loss Test with Borate-Crosslinked 35 lb/Mgal Guar
Implications of the Research Results:1. Spurt loss values measured in the laboratory cell were generally larger than those
measured using the HPS at the FFCF.31 This result implies that the use ofuncorrected spurt-loss values obtained from conventional laboratory testing couldlead to over-design of fracturing treatments in terms of fluid volume requirements. Inthe case of large differences in spurt-loss values, several thousand gallons offracturing fluid could potentially be pumped unnecessarily. With the recognition ofthis problem, the industry should develop a method for correcting spurt-loss valuesobtained from conventional testing. Large surface-area experiments, such as thoseavailable with the HPS, will be required to provide the spurt-loss values needed fordevelopment of such corrections.
2. The gel fluid loss control was essentially the same with and without filter-cake asinternal filter-cake was the controlling factor. These results are considered to beevidence that a filter-cake is not a requirement for fluid loss control in all instances.The primary fluid loss control mechanism with crosslinked gels appears to be pore-plugging. The major implication of these findings is the discovery that the industryhas been too focused on filter-cake formation and its contribution to fluid loss control.A paradigm shift is needed to allow the industry to focus on the concept of pore-plugging or an "internal filter-cake" as a source of fluid loss control.

7-62
3. Neither the viscosity of a crosslinked gel nor filter cake formation was sufficient tocontrol leak-off through naturally fractured media. Solids in combination with aviscous gel were needed to control the leak-off through naturally fractured Bereasandstone. The implication of these findings is that a gel containing a broad spectrumof particle sizes will be needed to control fluid loss to natural fractures. In theabsence of experience with a particular naturally fractured formation, mixtures of100 mesh sand and silica flour should be incorporated into a gelled prepad or padfluid to control leak-off.
7.10 Perforation Pressure Loss
Objective: Perforation pressure loss data were to be acquired with various fluids andslurries using the simulated wellbore/fracture entry available on the HPS. Theseperforation pressure loss data were to be analyzed and correlations developed to describethis important property of fracturing fluids and slurries. An additional objective was todevelop a correlation that describes the dynamic change in the coefficient of dischargeproduced by slurry erosion.
Introduction: An accurate estimate of perforation pressure loss is needed whenperforming a limited entry treatment, treating near the maximum allowable surfacepressure, and when attempting to perform either real-time or post-treatment fracturingpressure analysis. Limited entry is a method for simultaneously treating multiple zoneshaving different fracture gradients. Application of this technique requires a prioriestimates of perforation pressure loss to determine the number of perforations needed ineach zone. However, perforation pressure loss is a dynamic property that changescontinually as the result of erosion produced by abrasive sand slurries. Predicting thedynamic change in discharge coefficient caused by erosion is crucial to achieving thedesired zonal injection profiles and hence to the success of a limited entry treatment. Anaccurate determination of perforation pressure loss also is essential for reliable treatingpressure analysis. A large perforation pressure loss that is not anticipated during atreatment may lead to erroneous conclusions about fracture growth when analyzing real-time pressure data. Calculated bottom-hole treating pressures must also be corrected forperforation pressure loss effects to provide a reliable estimate of fracture geometry fromhistory-match analysis.
Procedure: The experimental procedure for each fluid type differs depending on thefactors investigated. For most clean polymer solutions, the low-pressure equipment setup(described in Chapter 3) was used. When testing crosslinked gels, the high-pressureequipment (described in Chapter 3) was used to investigate the effect of shear history onperforation pressure loss. For sand slurries, experiments were conducted using low-pressure equipment to investigate factors effecting the perforation pressure loss in theabsence of erosion. Investigation of erosion effects, on the other hand, was carried outwith the high-pressure equipment because large volumes of slurry are needed. Thefollowing sections discuss in detail the procedure used with each fluid type.

7-63
Polymer Solutions. Approximately 1000 gallons of polymer solution was mixed andcirculated through the HPS using stainless steel perforations of sizes 0.25″, 0.375″, and0.5″. Each test used two perforations of the same size installed on 16″ spacing.Perforation pressure loss data were acquired at several different flow rates with adifferential pressure transducer. The test procedure was repeated for each perforationsize.
Crosslinked Gels. Approximately 100 bbls of polymer solution were prepared in amixing tank and then fed to the high-pressure triplex pump using a centrifugal pump.The clean fluid was circulated through the HPS until a steady flow rate of 60 gpm wasattained. Directing the polymer solution in a single pass, crosslinker was added at thesuction of the centrifugal pump using two computer-controlled metering pumps. Thecrosslinking gel was pumped into the HPS through two stainless steel perforations of thesame size. Perforation sizes of either 0.25″, 0.375″, or 0.5″ were installed on 16″ spacingin each test. Perforation pressure loss data were acquired at various flow rates so that thedifferential pressure across the perforations remained less than 500 psi. Bypassing aportion of the flow around the HPS provided variable flow rates through the slot. Byfollowing this procedure, the crosslinking rate was kept constant and uniform rheologicalproperties for the crosslinked fluid were achieved.
To investigate the effect of shear history, the discharge of the triplex pump wasdiverted through the desired coiled tubing length, without interruption to the flow, byproperly placed valves. The sheared fluid exited from the coiled tubing into the HPS.Perforation pressure loss data were acquired at various flow rates so that the differentialpressure across perforations remained less than 100 psi. Variable flow rates through theslot are attained by bypassing a portion of the flow around the HPS as before. Once againthis procedure insured uniform rheological properties for the crosslinked fluid.
Sand Slurries. The low-pressure equipment was used to investigate the influence ofperforation size, proppant size, and proppant concentration on perforation pressure loss inthe absence of erosion. Approximately 200 gallons of polymer solution were mixed withvarious amounts of 20/40-mesh sand to prepare slurries with sand concentrations of 0to10 ppg. Four perforations, of the same size (0.375″ or 0.5″), were installed in the HPSon 8″ spacing. Differential pressure was measured as a function of flow rate for eachperforation size. The same procedure was followed with slurries prepared by mixingpolymer solution with 12/20-mesh sand. Flow rates in these tests were minimized toavoid erosion effects.
The investigation of erosion required the high flow rates and large slurry volumesthat could only be supplied by the high-pressure equipment. Sand slurries were preparedin the mixing tank at the desired concentration and pumped into the HPS through two0.375″ steel-cement composite perforations on 16″ spacing. The pressure drop across theperforations was measured as a function of time at two different flow rates (2 and 3bbl/min) using a differential pressure transducer.
Results: Currently, the industry is using a sharp-edged orifice equation to estimate thepressure drop across the perforation. This equation includes a kinetic energy correctionfactor, commonly known as the “coefficient of discharge,” which is used in calculating

7-64
the perforation pressure loss (psi) as follows:2
N'Q
2dC4
perfd
2369.0perfp
=
ρ∆ ...................................... (7.10.1)
Although the coefficient of discharge depends on fluid type and restriction (orifice) size,it is common practice to assume a fixed value for all fluids and perforation sizes.However, recent studies have shown that the coefficient of discharge can varysignificantly with fluid viscosity and perforation size.21,22 Thus, a rough estimate for thecoefficient of discharge can introduce a serious error in the predicted perforation pressureloss. For instance, an error of 10 % in the coefficient of discharge will result in a 25%error in the predicted pressure loss across the perforations. Correlations have beendeveloped to provide reliable estimates of the coefficient of discharge for polymersolutions and for both transition metal (titanium) and borate crosslinked gels. Thefollowing coefficient-of-discharge correlations have been developed:
HPG Solutions:
886.02r ,
4.0d2.2
e1dC1.0
a
perf
=
−
−= µ ................ (7.10.2)
Titanium-Crosslinked HPG Gels:
962.02r ,
6.0
)d (
76.1
e1dC25.0
perfa =
⋅
−
−= µ..... (7.10.3)
Borate-Crosslinked HPG Gels:
6.0d79.3
e1dC25.0
a
32.0perf
−
−= µ .................................. (7.10.4)
Eqs. 7.10.2 to 7.10.4 can be used in conjunction with Eq. 7.10.1 to calculate the pressureloss across perforations with the specified fluids. In addition, the correlation developedwith HPG polymer solutions has also been shown to be applicable to guar gum solutions.The borate-crosslinked gel correlation applies to formulations prepared at optimum pH.Under these conditions, the coefficient-of-discharge varies little with shear history. InEqs. 7.10.2 to 7.10.4 the discharge coefficient is correlated with apparent viscosity (cP)of the polymer solution at 511 sec-1 shear rate and perforation diameter (in.). Theapparent viscosity µa , (511 sec-1) of the linear polymer solution is defined as:

7-65
)1n()511(k47880a−××=µ ................................... (7.10.5)
In addition to being influenced by carrier fluid viscosity and perforation diameter, thecoefficient-of-discharge for sand slurries is also influenced by proppant concentration andsize. Experiments show that perforation pressure loss increases with increased sandconcentration (Figure 7.10.1) while the coefficient-of-discharge decreases. This behaviorbecomes less significant as sand size increases. Moreover, pressure loss for 20/40 meshsand slurries is higher than 12/20 mesh sand slurries (Figure 7.10.2). This difference inperforation pressure loss between the two sand size slurries is due to the fact that a 12/20mesh sand slurry is less viscous than a 20/40 mesh sand slurry at the same concentration.Figure 7.28 shows the discharge coefficient plotted versus cumulative mass of sandpumped at two different rates. After an initial rapid rise, the discharge coefficient at bothpump rates was observed to increase monotonically with increasing quantity of sandpumped. The composite perforations did not have any significant weight reduction andthe only evidence of erosion during these tests was a rounding of the entrance. Figure7.10.3 also shows that a larger discharge coefficient was obtained at the higher injectionrate. This implies that the dynamic change in the discharge coefficient caused by erosionis a function of pump rate as well as the cumulative mass of sand pumped. The dynamicchange in discharge coefficient is therefore a function of cumulative kinetic energypassing through a perforation. Since slurry kinetic energy is proportional to density, thedynamic change in discharge coefficient is also expected to vary with sand concentration.To estimate perforation pressure loss for slurries, a relationship must be developed whichdescribes the dynamic change in discharge coefficient as a function of pump rate, sandconcentration, and cumulative mass of sand pumped.
0
5
10
15
20
25
30
35
40
0 50 100 150 200 250 300 350 400 450
(Flow Rate per Perf)2 [gpm]2
Per
fora
tio
n P
ress
ure
Lo
ss [
psi
]
0 6 10
Cd0.690.680.58
Sand Conc. (ppg)
Figure 7.10.1-60 lb HPG + 20/40 Mesh Sand; 0.5 in. Perforation Diameter
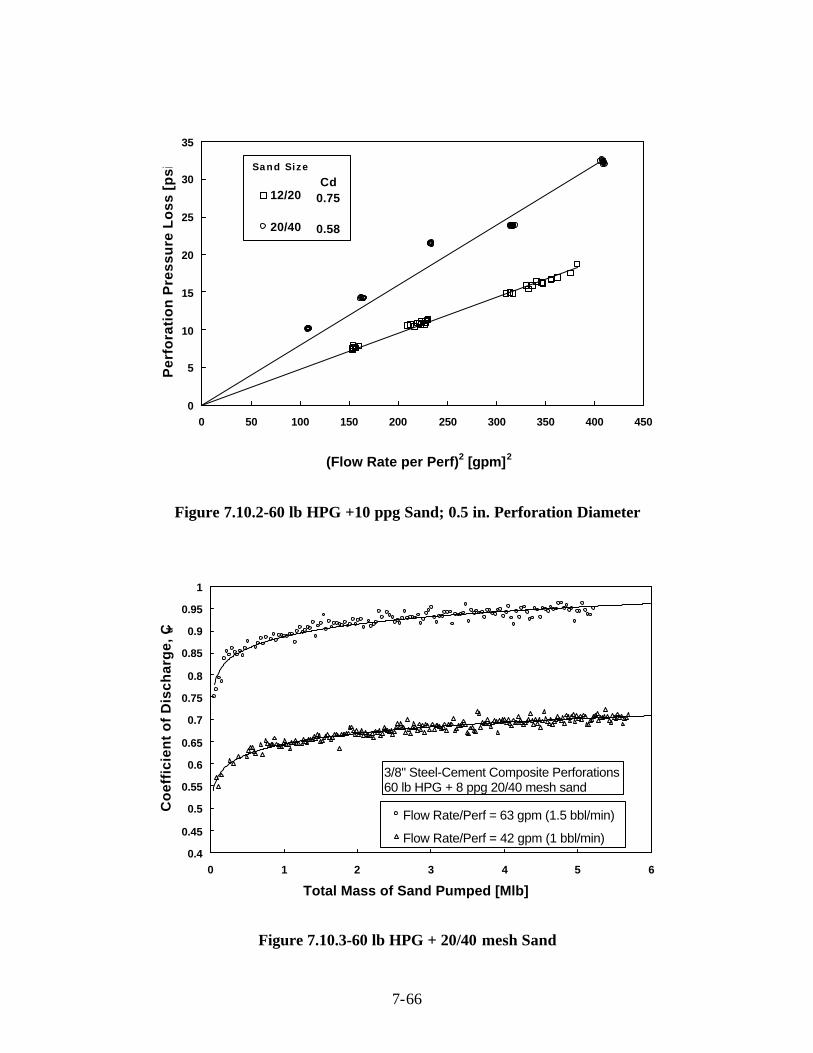
7-66
0
5
10
15
20
25
30
35
0 50 100 150 200 250 300 350 400 450
(Flow Rate per Perf)2 [gpm]2
Per
fora
tio
n P
ress
ure
Lo
ss [
psi
]
12/20
20/40
Sand Size
Cd0.75
0.58
Figure 7.10.2-60 lb HPG +10 ppg Sand; 0.5 in. Perforation Diameter
0.4
0.45
0.5
0.55
0.6
0.65
0.7
0.75
0.8
0.85
0.9
0.95
1
0 1 2 3 4 5 6
Total Mass of Sand Pumped [Mlb]
Co
effi
cien
t o
f D
isch
arg
e, C d
Flow Rate/Perf = 63 gpm (1.5 bbl/min)
Flow Rate/Perf = 42 gpm (1 bbl/min)
3/8" Steel-Cement Composite Perforations60 lb HPG + 8 ppg 20/40 mesh sand
Figure 7.10.3-60 lb HPG + 20/40 mesh Sand
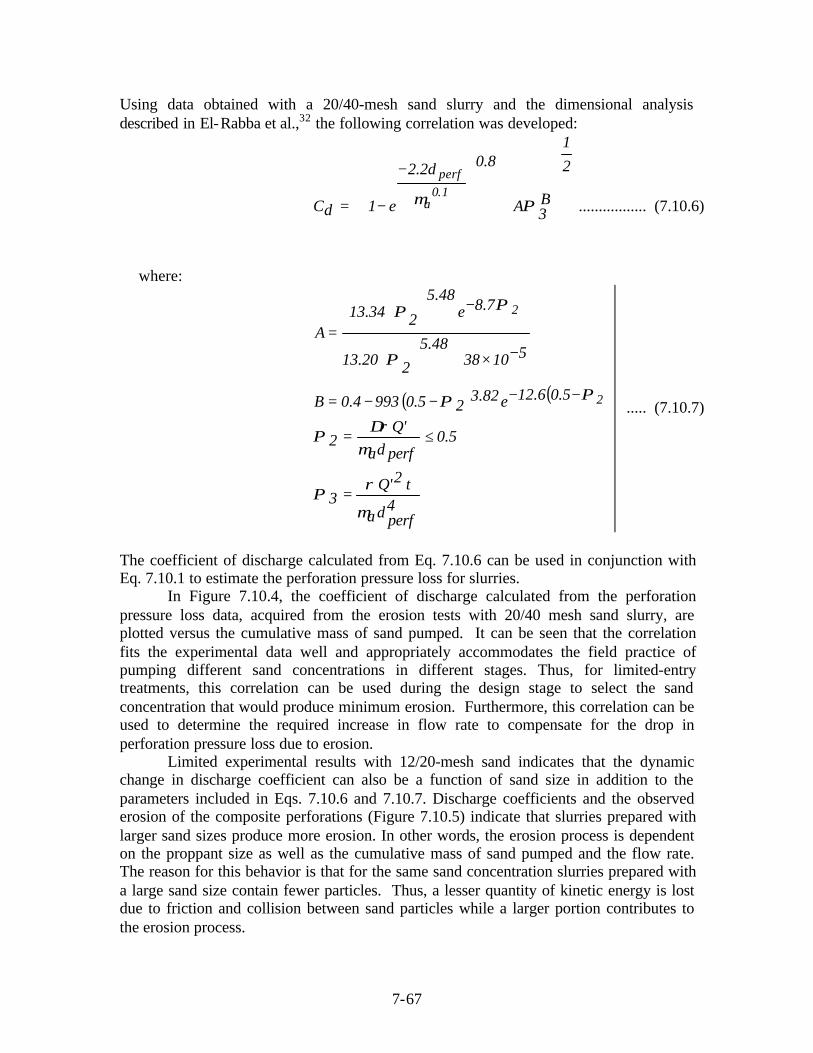
7-67
Using data obtained with a 20/40-mesh sand slurry and the dimensional analysisdescribed in El-Rabba et al.,32 the following correlation was developed:
2
1
B3A
8.0d2.2
e1dC1.0
a
perf
+
−
−= Πµ ................. (7.10.6)
where:
( ) ( )
4perfda
t2'Q 3
5.0perfda
'Q 2
5.06.12e82.325.0 9934.0B
5103848.5
220.13
7.8e48.5
234.13A
2
2
µ
ρΠ
µρ∆Π
ΠΠ
Π
ΠΠ
=
≤=
−−−−=
−×+
−
=
..... (7.10.7)
The coefficient of discharge calculated from Eq. 7.10.6 can be used in conjunction withEq. 7.10.1 to estimate the perforation pressure loss for slurries.
In Figure 7.10.4, the coefficient of discharge calculated from the perforationpressure loss data, acquired from the erosion tests with 20/40 mesh sand slurry, areplotted versus the cumulative mass of sand pumped. It can be seen that the correlationfits the experimental data well and appropriately accommodates the field practice ofpumping different sand concentrations in different stages. Thus, for limited-entrytreatments, this correlation can be used during the design stage to select the sandconcentration that would produce minimum erosion. Furthermore, this correlation can beused to determine the required increase in flow rate to compensate for the drop inperforation pressure loss due to erosion.
Limited experimental results with 12/20-mesh sand indicates that the dynamicchange in discharge coefficient can also be a function of sand size in addition to theparameters included in Eqs. 7.10.6 and 7.10.7. Discharge coefficients and the observederosion of the composite perforations (Figure 7.10.5) indicate that slurries prepared withlarger sand sizes produce more erosion. In other words, the erosion process is dependenton the proppant size as well as the cumulative mass of sand pumped and the flow rate.The reason for this behavior is that for the same sand concentration slurries prepared witha large sand size contain fewer particles. Thus, a lesser quantity of kinetic energy is lostdue to friction and collision between sand particles while a larger portion contributes tothe erosion process.
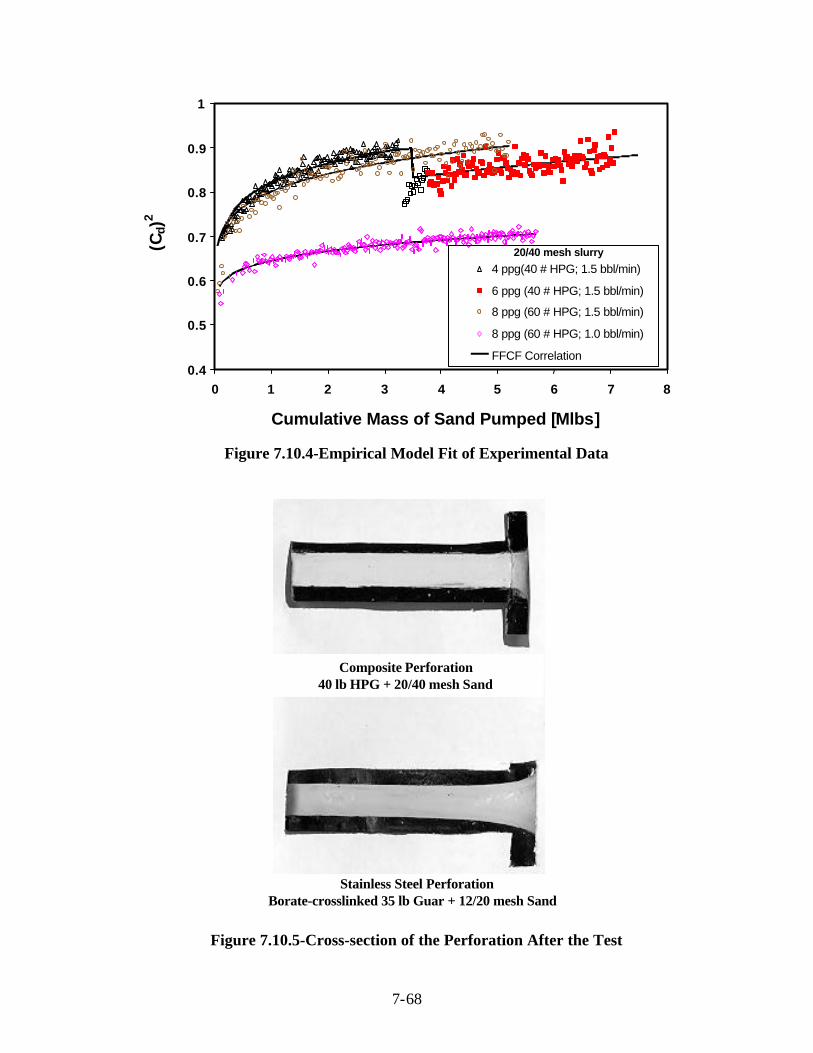
7-68
20/40 mesh slurry
0.4
0.5
0.6
0.7
0.8
0.9
1
0 1 2 3 4 5 6 7 8
Cumulative Mass of Sand Pumped [Mlbs]
(Cd)
2
4 ppg(40 # HPG; 1.5 bbl/min)
6 ppg (40 # HPG; 1.5 bbl/min)
8 ppg (60 # HPG; 1.5 bbl/min)
8 ppg (60 # HPG; 1.0 bbl/min)
FFCF Correlation
Figure 7.10.4-Empirical Model Fit of Experimental Data
Stainless Steel PerforationBorate-crosslinked 35 lb Guar + 12/20 mesh Sand
Composite Perforation40 lb HPG + 20/40 mesh Sand
Figure 7.10.5-Cross-section of the Perforation After the Test

7-69
Presently, this correlation does not account for slurries of different proppant size. Yet, theeffect of proppant size on perforation pressure loss for slurries can be significant. Thedimensional analysis approach used to develop these correlations can be extended toincorporate the effect of proppant size. In addition, the correlation presented in this studyis for linear polymer solution slurries only. Crosslinked gel slurries may behavedifferently from linear polymer solution slurries because of differences in viscous forcesexerted on the sand particles. Particles in crosslinked gel slurries might migrate towardsthe center of the flow stream because of the viscoelastic nature of these fluids, and thus,the erosional effects may be reduced. Further experiments are needed to investigate theseeffects.
Nonetheless, the developed correlations should prove to be useful for the designof many currently used fracturing treatments that utilize the fluids tested in this study.
7.11 Tubular Friction Loss
Objective: Tubular pressure loss and flow rate data were to be collected and correlated toprovide a method for estimating the frictional pressure loss of turbulent, non-Newtonianflows in coiled tubing. Frictional pressure loss in coiled tubing was to be determined forfluids such as water, guar gum solutions, hydroxypropyl guar (HPG) solutions, andborate-crosslinked gels. The influence of coiled tubing curvature and seam on the frictionloss of these fluids was also to be investigated.
Introduction: Since coiled tubing is gaining in popularity for a number of applications inthe petroleum industry, it is important that an accurate means of predicting friction lossbe made available. Flow through coiled tubing is uniquely different from that in straightpipe because of the secondary flow pattern induced by the imbalance between the forcesacting across the radius of the pipe. This secondary flow pattern is composed of counter-rotating vortices commonly called Dean vortices. The effect of this secondary flowpattern is to increase the frictional pressure loss above that which would be produced instraight pipe. Turbulent flow of Newtonian fluids in curved pipe has been the subject ofnumerous prior investigations, while similar investigations with non-Newtonian fluidshave been scarce. The goal of the current investigation is to provide additionalknowledge on turbulent flow of non-Newtonian fluids in curved pipe.
Procedure: The equipment used for this investigation consisted of one 1000-ft and two2000-ft coiled tubing reels that can be arranged to provide lengths of 1000 ft, 2000 ft,3000 ft, 4000 ft, and 5000 ft, respectively. Furthermore, the coiled tubing reels could bebypassed altogether if desired. In this way, test fluids could be sheared for variouslengths of time, at a desired nominal shear rate. The nominal shear rate selected forcrosslinked fluid testing was 1400 sec-1 at 60 gpm. The residence time at this shear rateis approximately 1 minute per 1000 ft of coiled tubing. The system also includes straightsections of seamed and seamless tubing with the same nominal diameter (1 1/2 in.)located downstream of the coiled tubing reels. The inside diameter of the seamlesstubing and the hydraulic diameter of the seamed tubing were determined (fromvolumetric measurements) to be approximately 1.1817 in. and 1.1752 in., respectively.
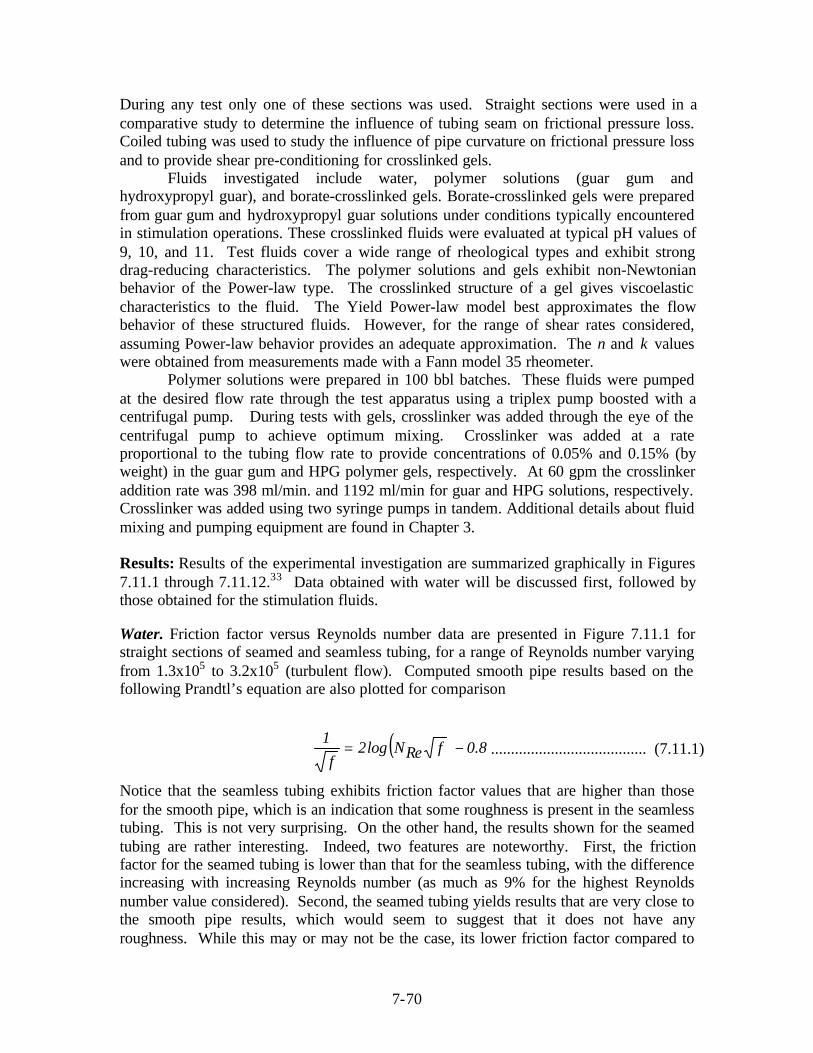
7-70
During any test only one of these sections was used. Straight sections were used in acomparative study to determine the influence of tubing seam on frictional pressure loss.Coiled tubing was used to study the influence of pipe curvature on frictional pressure lossand to provide shear pre-conditioning for crosslinked gels.
Fluids investigated include water, polymer solutions (guar gum andhydroxypropyl guar), and borate-crosslinked gels. Borate-crosslinked gels were preparedfrom guar gum and hydroxypropyl guar solutions under conditions typically encounteredin stimulation operations. These crosslinked fluids were evaluated at typical pH values of9, 10, and 11. Test fluids cover a wide range of rheological types and exhibit strongdrag-reducing characteristics. The polymer solutions and gels exhibit non-Newtonianbehavior of the Power-law type. The crosslinked structure of a gel gives viscoelasticcharacteristics to the fluid. The Yield Power-law model best approximates the flowbehavior of these structured fluids. However, for the range of shear rates considered,assuming Power-law behavior provides an adequate approximation. The n and k valueswere obtained from measurements made with a Fann model 35 rheometer.
Polymer solutions were prepared in 100 bbl batches. These fluids were pumpedat the desired flow rate through the test apparatus using a triplex pump boosted with acentrifugal pump. During tests with gels, crosslinker was added through the eye of thecentrifugal pump to achieve optimum mixing. Crosslinker was added at a rateproportional to the tubing flow rate to provide concentrations of 0.05% and 0.15% (byweight) in the guar gum and HPG polymer gels, respectively. At 60 gpm the crosslinkeraddition rate was 398 ml/min. and 1192 ml/min for guar and HPG solutions, respectively.Crosslinker was added using two syringe pumps in tandem. Additional details about fluidmixing and pumping equipment are found in Chapter 3.
Results: Results of the experimental investigation are summarized graphically in Figures7.11.1 through 7.11.12.33 Data obtained with water will be discussed first, followed bythose obtained for the stimulation fluids.
Water. Friction factor versus Reynolds number data are presented in Figure 7.11.1 forstraight sections of seamed and seamless tubing, for a range of Reynolds number varyingfrom 1.3x10⁵ to 3.2x10⁵ (turbulent flow). Computed smooth pipe results based on thefollowing Prandtl’s equation are also plotted for comparison
( ) 8.0fReNlog2f
1−= ....................................... (7.11.1)
Notice that the seamless tubing exhibits friction factor values that are higher than thosefor the smooth pipe, which is an indication that some roughness is present in the seamlesstubing. This is not very surprising. On the other hand, the results shown for the seamedtubing are rather interesting. Indeed, two features are noteworthy. First, the frictionfactor for the seamed tubing is lower than that for the seamless tubing, with the differenceincreasing with increasing Reynolds number (as much as 9% for the highest Reynoldsnumber value considered). Second, the seamed tubing yields results that are very close tothe smooth pipe results, which would seem to suggest that it does not have anyroughness. While this may or may not be the case, its lower friction factor compared to

7-71
that of the seamless tubing is more likely due to the presence of the seam. Indeed,instead of acting as an added roughness, the seam alters the turbulence spectrum bydamping the high turbulence frequencies and thus, causing a decrease in the turbulentfrictional pressure drop. The seam and the roughness have opposing effects on thefriction factor. This in turn suggests that some roughness must be present in the seamedtubing used in this study. Otherwise, the friction factor values would be lower than thoseof a smooth pipe. These experimental results suggest that friction factor for seamedtubing relates to that of the seamless tubing by an expression of the form:
seamlessf049.0ReN667.1seamedf
−= . ................ (7.11.2)
0.001
0.01
100000 1000000Reynolds Number
Fric
tion
Fact
or
Seamless Tubing
Seamed Tubing
Smooth Pipe
Figure 7.11.1-Friction Factor for Water Flowing in Straight Sections of Seamed andSeamless Tubing
The effect of tubing curvature on the frictional pressure loss of water is illustrated inFigure 7.11.2 which compares coiled tubing results to results from a straight section ofseamed tubing. This comparison indicates that coiled tubing curvature has a significanteffect on frictional pressure loss. Friction loss for coiled tubing is much higher than forseamed tubing. The relative increase in friction factor, due to curvature, increases withincreasing Reynolds number, from 31% to 44% as shown in Figure 7.11.2. Relationshipsbetween frictional pressure loss in coiled tubing and straight pipe sections were derivedand are of the form:

7-72
seamedf068.0Re
N6.0CTfG
= ................................. (7.11.3)
and
seamlessf019.0Re
N017.1CTfG
= ........................... (7.11.4)
0.001
0.01
10000 100000 1000000Reynolds Number
Fric
tion
Fact
or
Straight Section
1000 ft Coiled Tubing
2000 ft Coiled Tubing
Smooth Pipe
Figure 7.11.2-Friction Factor for Water Flowing in CT and in a straight Sectionof Seamed Tubing
Results obtained for 1000-ft and 2000-ft lengths of coiled tubing, as shown in Figure7.11.2, suggest that the number of turns on the reel has no effect on the frictional pressureloss. However, the reader should be cautioned that the average reel diameters for the1000-ft and the 2000-ft coils are not significantly different, resulting in approximately thesame value for the ratio of tubing ID to reel diameter.
35 lb Guar Gum/Mgal Polymer Solution. Results obtained for a 35 lb guar/Mgalpolymer solution (n = 0.53, k = 0.0112 psf secn) are presented graphically in Figure7.11.3. Laminar and smooth pipe flow results are also plotted for comparison. It can beobserved that friction factor values for the polymer solution are much lower than thoseobtained with water. In the range of Reynolds number considered, drag reductionvarying from 29% to 78% is obtained with the polymer solution. As expected, curvatureof the coiled tubing has a significant effect on frictional pressure loss. Indeed, it can beobserved that friction factor values with coiled tubing are higher than with straightsections. Interestingly, unlike water, tubing seam does not seem to have an effect on the

7-73
friction factor of this polymer solution. Since, as stated earlier, the seam tends tosuppress the high turbulence frequencies. These results suggest that, for the drag-reducing fluid under investigation, the turbulence spectrum is composed mainly of low -turbulence frequencies, on which the tubing seam has no effect. Examination of theexperimental data suggest that coiled tubing friction factor is related to straight pipefriction factor by the following relationship:
SPf015.0Re
N747.0CTfG
= ..................................... (7.11.5)
0.0001
0.001
0.01
0.1
1
100 1000 10000 100000
Generalized Reynolds Number
Fric
tion
Fact
or
Seamless Tubing
Seamed Tubing
Coiled Tubing
Smooth Pipe
Laminar Flow
Figure 7.11.3-Friction Factor for Linear 35 lb guar/1000 gal Solution
40 lb HPG/Mgal Polymer Solution. Figure 7.11.4 summarizes results obtained for a 40lb HPG/Mgal polymer solution (n = 0.42, k = 0.034 psf secn). Again, the sameobservations made earlier for the guar gum solution can also be made for the HPGsolution. It is noteworthy that these results indicate that HPG has better drag-reducingproperties than the guar gum solution. However, this could be due to the higherconcentration of HPG (40 lb/Mgal) as compared to the previous case involving guar.Again, as for the case with guar, the following equation relating coiled tubing frictionfactor to that in straight pipe was derived based on the experimental results:
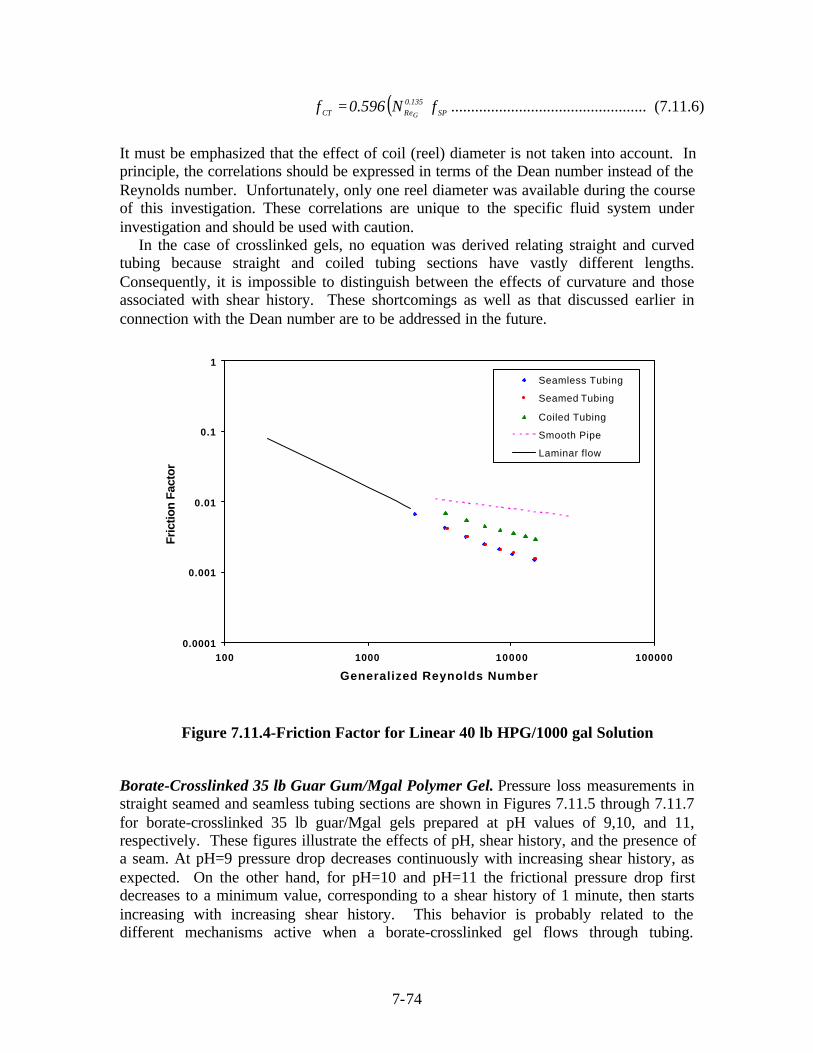
7-74
( ) SP135.0
ReCT fN596.0fG
= ................................................. (7.11.6)
It must be emphasized that the effect of coil (reel) diameter is not taken into account. Inprinciple, the correlations should be expressed in terms of the Dean number instead of theReynolds number. Unfortunately, only one reel diameter was available during the courseof this investigation. These correlations are unique to the specific fluid system underinvestigation and should be used with caution.
In the case of crosslinked gels, no equation was derived relating straight and curvedtubing because straight and coiled tubing sections have vastly different lengths.Consequently, it is impossible to distinguish between the effects of curvature and thoseassociated with shear history. These shortcomings as well as that discussed earlier inconnection with the Dean number are to be addressed in the future.
0.0001
0.001
0.01
0.1
1
100 1000 10000 100000
Generalized Reynolds Number
Fric
tion
Fact
or
Seamless Tubing
Seamed Tubing
Coiled Tubing
Smooth Pipe
Laminar flow
Figure 7.11.4-Friction Factor for Linear 40 lb HPG/1000 gal Solution
Borate-Crosslinked 35 lb Guar Gum/Mgal Polymer Gel. Pressure loss measurements instraight seamed and seamless tubing sections are shown in Figures 7.11.5 through 7.11.7for borate-crosslinked 35 lb guar/Mgal gels prepared at pH values of 9,10, and 11,respectively. These figures illustrate the effects of pH, shear history, and the presence ofa seam. At pH=9 pressure drop decreases continuously with increasing shear history, asexpected. On the other hand, for pH=10 and pH=11 the frictional pressure drop firstdecreases to a minimum value, corresponding to a shear history of 1 minute, then startsincreasing with increasing shear history. This behavior is probably related to thedifferent mechanisms active when a borate-crosslinked gel flows through tubing.

7-75
Crosslink bonds form initially, break as the result of shearing, and then reform through aprocess of rehealing. All of these mechanisms are active and dependent on flowingconditions such as temperature and shear rate. The continual decrease in pressure losswith increased shear history at pH=9 can be hypothesized to be the result of crosslinkbonds being destroyed more rapidly than they can reheal. This results in a decrease in theviscosity of the fluid and thus, in the pressure drop. This same behavior is observed atpH=10 and pH=11 for shear histories less than or equal to 1 minute. However, for longershear histories the combined rate of new crosslinked bond formation and the rehealing ofbroken bonds becomes higher than the rate at which the crosslinked bonds are destroyedby shearing. This results in the presence of a local minimum in the viscosity versus shearhistory curve and, thus, in the pressure drop versus shear history curve. Interestingly, theeffect of the seam on the pressure drop is significant only for pH=9 and short shearhistories.
0
0.1
0.2
0.3
0.4
0.5
0 1 3 5
Shear History [min.], @ 1400 S-1
Pre
ssur
e D
rop
[psi
/ft]
Seamed Seamless
Figure 7.11.5-Pressure Drop in Seamed and Seamless Tubing for Borate-Crosslinked 35 lb guar/1000 gal gel, at pH 9.0 and Flow Rate 60 gal/min

7-76
0
0.05
0.1
0.15
0.2
0.25
0.3
0.35
0 1 3 5
Shear History [min.], @ 1400 S-1
Pre
ssur
e D
rop
[psi
/ft]
Seamed Seamless
Figure 7.11.6-Pressure Drop in Seamed and Seamless Tubing for Borate-Crosslinked 35 lb guar/1000 gal gel, at pH 10.0 and Flow Rate 60 gal/min
0
0.05
0.1
0.15
0.2
0.25
0.3
0.35
0 1 3 5
Shear History [min.], @ 1400 S-1
Pre
ssur
e D
rop
[psi
/ft]
Seamed Seamless
Figure 7.11.7-Pressure Drop in Seamed and Seamless Tubing for Borate-Crosslinked 35 lb guar/1000 gal gel, at pH 11.0 and Flow Rate 60 gal/min

7-77
The effect of pH and coiled tubing length on pressure loss is illustrated graphically inFigure 7.11.8. As expected, crosslinking increases the pressure gradient. Moreover,increasing the pH results in lower values for the pressure gradient. The change inpressure gradient with length of tubing at constant pH is insignificant. At first this mayseem inconsistent with the earlier claim regarding the effect of shear history on thepressure drop in straight tubing sections. However, while the use of the term shearhistory may be descriptive for a short straight section located at the exit of thepreconditioning loop, it is not as meaningful in the case of fluid flowing in a long sectionof coiled tubing. Fluid exiting a long section of coiled tubing has experienced themaximum degree of preconditioning while fluid just entering the coil has experienced theleast. Thus, measurements taken across a long section of coiled tubing are not specific toa particular shear history, but represent a broad spectrum of shear histories.
0
100
200
300
400
500
600
700
800
900
1000
0 1000 2000 3000 4000 5000
Coiled Tubing Length [ft]
Pre
ssur
e D
rop
[psi
/100
0ft]
pH 9
pH 9.5
pH 10
pH 11
Linear 35 lb Guar/Mgal Solution
Figure 7.11.8-Pressure Drop in CT for Borate-Crosslinked 35 lb guar/1000gal Gel
Borate-Crosslinked 35 lb HPG/Mgal Gel. Pressure loss measurements in straight seamedand seamless tubing sections are shown in Figures 7.11.9 through 7.11.11 for borate-crosslinked 35 lb HPG/Mgal gels prepared at pH values of 9,10, and 11, respectively.These figures illustrate the effects of pH, shear history, and the presence of a seam.Unlike the results for borate-crosslinked guar, the pressure drop in the straight tubingsections is a decreasing function of shear history for all pH values considered. Theseresults suggest that the rate at which crosslinked bonds are destroyed by shearing ishigher than the rate at which new bonds are being formed. The viscosity of the fluid andthus, the pressure drop, is a decreasing function of shear history. Interestingly, as withborate-crosslinked guar, the tubing seam seems to decrease the pressure drop only atpH=9 and in the absence of shear history for the current case.
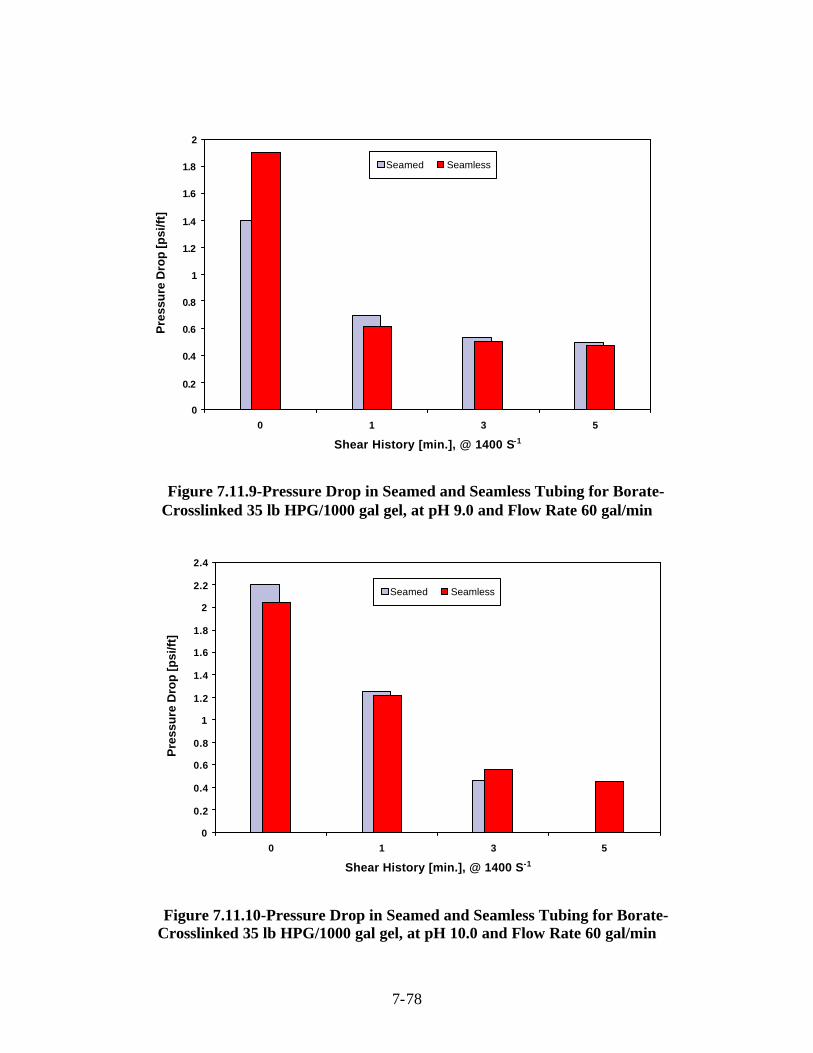
7-78
0
0.2
0.4
0.6
0.8
1
1.2
1.4
1.6
1.8
2
0 1 3 5
Shear History [min.], @ 1400 S-1
Pre
ssur
e D
rop
[psi
/ft]
Seamed Seamless
Figure 7.11.9-Pressure Drop in Seamed and Seamless Tubing for Borate-Crosslinked 35 lb HPG/1000 gal gel, at pH 9.0 and Flow Rate 60 gal/min
0
0.2
0.4
0.6
0.8
1
1.2
1.4
1.6
1.8
2
2.2
2.4
0 1 3 5
Shear History [min.], @ 1400 S-1
Pre
ssur
e D
rop
[psi
/ft]
Seamed Seamless
Figure 7.11.10-Pressure Drop in Seamed and Seamless Tubing for Borate-Crosslinked 35 lb HPG/1000 gal gel, at pH 10.0 and Flow Rate 60 gal/min

7-79
0
0.2
0.4
0.6
0.8
1
1.2
1.4
1.6
1.8
0 1 3 5
Shear History [min.], @ 1400 S-1
Pre
ssur
e D
rop
[psi
/ft]
Seamless Seamed
Figure 7.11.11-Pressure Drop in Seamed and Seamless Tubing for Borate-Crosslinked 35 lb HPG/1000 gal gel, at pH 11.0 and Flow Rate 60 gal/min
Pressure drop results measured in coiled tubing of various lengths are shown in Figure7.11.12. Unlike for borate-crosslinked guar, the dependence of the pressure gradient onthe length of coiled tubing across which it is measured is strikingly strong. The pressuregradient first decreases sharply and then seems to approach a limiting asymptote.However, this could actually be a local minimum in the curve of pressure drop versuscoiled tubing length. Observations made earlier with borate-crosslinked guar certainlytend to support this claim, which can only be verified with additional coiled tubinglength.
Frictional pressure loss measurements with borate-crosslinked 35 lb guar/Mgal and 35lb HPG/Mgal gels are compared in Table 7.11.1 for injection through 1000-ft and 3000-ftlengths of coiled tubing at 60 gpm (1400 sec-1). Two observations can be made. First,HPG pressure losses are significantly higher than those for guar at all pH values and forall coiled tubing lengths. Second, the pressure drop is lower for flow through 3000 ft ofcoiled tubing with both gels and at all pH values. The longer shearing time in the 3000-ftcoil tends to partially destroy the crosslink network responsible for the higher frictionalpressure losses observed in the 1000-ft coil.

7-80
0
500
1000
1500
2000
2500
0 1000 2000 3000
Coiled Tubing Length [ft]
Pre
ssur
e D
rop
[psi
/100
0 ft
]
pH 9
pH 10
pH 11
Figure 7.11.12-Pressure Drop in CT for Borate-Crosslinked 35 lb HPG/1000gal Gel
Pressure Drop(psi/1000 ft)
CT Length(ft) pH
Borate-Crosslinked35 lb Guar/1000 gal
Borate-Crosslinked35 lb HPG/1000 gal
Difference(%)
9.0 626 1668 166
10.0 484 2206 3561000
11.0 453 1861 311
9.0 623 1113 79
10.0 475 1407 1963000
11.0 439 1403 220
Table 7.11.1-Comparison of Pressure Losses of Borate-Crosslinked Guar andHPG

7-81
7.12 References
1. Gidley, J.L., Holditch, S.A., Nierode, D.E., and Veatch, R.W.: Recent Advances inHydraulic Fracturing, SPE Monograph Vol. 12, (1989).
2. Harris, P.C.: “Chemistry and Rheology of Borate-Crosslinked Fluids at Temperaturesto 300oF,” JPT (March 1993) 264-269.
3. Hannah, R.R., and Harrington, L.J.: "Measurement of Dynamic Proppant Fall Ratesin Fracturing Gels Using a Concentric Cylinder Tester," JPT (May 1981) 909-913.
4. Clark, P.E., and Quadir, J.A.: "Proppant Transport in Hydraulic Fractures: A CriticalReview of Particle Settling Velocity Equations," paper SPE 9866 presented at the1981 SPE/DOE Low Permeability Symposium, Denver, Colorado, 27-29 May.
5. Power, D.J., Rodd, A.B., Paterson, L., and Boger, D.V.: "Gel Transition Studies onNonideal Polymer Networks using Small Amplitude Oscillatory Rheometry," J.Rheol. (1998) 42, No. 5, 1021-1037.
6. Power, D.J.: "Rheological Characterization of Hydraulic Fracturing Fluids," Ph.D.Dissertation, University of Melbourne, 1997.
7. Winter, H.H., and Chambon, F.: "Analysis of Linear Viscoelasticity of a CrosslinkingPolymer at the Gel Point," J. Rheol. (1986) 30, No. 2, 367-382.
8. Acharya, A.: “Viscoelasticity of Crosslinked Fracturing Fluids and ProppantTransport,” paper SPE 15937 presented at the 1986 SPE Eastern Regional Meeting,Columbus, Ohio, 12-14 November.
9. de Kruijf, A.S., Roodhart, L.P., and Davies, D.R.: "Relation Between Chemistry andFlow Mechanics of Borate-Crosslinked Fracturing Fluids," SPEPF (August 1993) 8,No. 3, 165-170.
10. Jin, L., and Penny, G.S.: "Dimensionless Methods for the Study of Particle Settling inNon-Newtonian Fluids," JPT (March 1995) 223-228.
11. "Fracturing Fluid Characterization Facility (FFCF)," Annual Report, GRI-97/0050,December 1996.
12. "Fracturing Fluid Characterization Facility (FFCF)," Annual Report, GRI-98/0235,December 1997.
13. "Fracturing Fluid Characterization Facility (FFCF)," Annual Report, GRI-99/0128,December 1998.
14. Hejjo, H., Fagan, J. E., and Shah, S. N.: "Flow Visualization Technique forInvestigation of Hydraulic Fracturing," paper SPE 38579 presented at the 1997 SPEAnnual technical Conference and Exhibition, San Antonio, Oct. 5-8.
15. Shah, S. N., and Asadi, M.: "Convection/Encapsulation in Hydraulic Fracturing,"paper SPE 39961 presented at the 1998 SPE Rocky Mountain Regional/LowPermeability Reservoirs Symposium and Exhibition, Denver, Apr. 5-8.
16. Shah, S. N., and Asadi, M., and Lord, D. L.: "Proppant Transport Characterization ofHydraulic Fracturing Fluids using a High Pressure Simulator Integrated with a FiberOptic/LED Vision System," paper SPE 49040 presented at the 1998 SPE AnnualTechnical Conference and Exhibition, New Orleans, Sept. 27-30.
17. Asadi, M., Shah, S. N., and Lord, D. L.: "Static/Dynamic Settling of Proppant inNon-Newtonian Hydraulic Fracturing Fluids," paper SPE 52217 presented at the 1999SPE Mid-Continent Operations Symposium, Ok City, Mar. 28-31.
18. Cleary, M. P., and Fonseca, A.: "Proppant Convection and Encapsulation in

7-82
Hydraulic Fracturing: Practical Implications of Computer and LaboratorySimulations," paper SPE 24825 presented at the 1992 SPE Annual TechnicalConference and Exhibition, Washington D.C., Oct. 4-7.
19. Clark, P. E., and Zhu, Q.: "Convective Transport of Propping Agents DuringHydraulic Fracturing," paper SPE 37358 presented at the 1996 SPE Eastern RegionalMeeting, Columbus, Oct. 23-25.
20. Shah, S. N., Lord, D. L., and Rao, B. N.: "Borate-Crosslinked Fluid Rheology UnderVarious pH, Temperature, and Shear History Conditions," paper SPE 37487presented at the 1997 SPE Production Operations Symposium, Oklahoma City, 9-11March.
21. Goel, Naval, Willingham, J. D., Shah, S. N., and Lord, D. L.: "A Comparative Studyof Borate-Crosslinked Gel Rheology Using Laboratory and Field Scale FracturingSimulations," paper SPE 38618 presented at the 1997 SPE Annual TechnicalConference and Exhibition, San Antonio, 5-8 October.
22. Goel, Naval, Shah, S. N., and Asadi, M.: "A New Empirical Correlation to PredictApparent Viscosity of Borate-Crosslinked Guar Gel in Hydraulic Fractures," paperSPE 39816 presented at the 1998 SPE Permian Basin Oil and Gas RecoveryConference, Midland, 25-27 March.
23. "Fracturing Fluid Characterization Facility (FFCF)," Annual Report, GRI-95/0091,December 1994.
24. "Fracturing Fluid Characterization Facility (FFCF)," Annual Report, GRI-96/0145,December 1995.
25. Goel, Naval, and Shah, S. N.: "Experimental Investigation of Proppant FlowbackPhenomena Using a Large Scale Fracturing Simulator," paper SPE 56880 presentedat the 1999 SPE Annual Technical Conference and Exhibition, Houston, 3-6 October.
26. Stein, N.: "Calculate Drawdown that will Cause Sand Production," World Oil (Apr.1988) 48-49.
27. Romero, J., and Feraud, J. P.: "Stability of Proppant Pack Reinforced with Fiber forProppant Flowback Control," paper SPE 31093 presented at the 1996 SPE FormationDamage Control Symposium, Lafayette, Feb. 14-15.
28. Milton-Tayler, D., Stephenson, C., and Asgian, M. I.: "Factors Affecting the Stabilityof Proppant in Propped Fractures: Results of a Laboratory Study," paper SPE 24821presented at the 1992 SPE Annual Technical Conference and Exhibition, WashingtonD.C., Oct. 4-7.
29. Asgian, M. I., Cundall, P. A., and Brady, B. H. G.: "The Mechanical Stability ofPropped Hydraulic Fractures: A Numerical Study," paper SPE 28510 presented at the1994 SPE Annual Technical Conference and Exhibition, New Orleans, Sept. 25-28.
30. Raymond, L. R., and Binder, Jr., G. G.: "Productivity of Wells in Vertically FracturedDamaged Formations," JPT (Jan. 1967) 120-130.
31. Lord, D. L., Vinod, P. S., Shah, S. N., and Bishop, M. L.: "An Investigation of FluidLeakoff Phenomena by Use of a High-Pressure Simulator," SPEPF (Nov. 1998) 250.
32. El-Rabba, A. M., Shah, S. N., and Lord, D. L.: "New Perforation Pressure-LossCorrelations for Limited-Entry Fracturing Treatments," SPEPF 14(1) (Feb. 1999) 63.
33. Azouz, I., Shah, S. N., Vinod, P. S.: "Experimental Investigation of FrictionalPressure Losses in Coiled Tubing," SPEPF (May 1998) 91.

7-83
7.13 Nomenclature
A = constant aT = horizontal shift factor, dimensionless
aTcalculated = calculated horizontal shift factor, dimensionlessB = constant
bT = vertical shift factor, dimensionless bTcalculated = calculated vertical shift factor, dimensionless
C = constantc1, d1 = constants, dimensionlessc2, d2 = constants, T, oK/oFc3, d3 = constants, dimensionless
Cd = perforation coefficient of discharge, dimensionlessd = diameter of coiled tubing, L, in.D = diameter of coiled tubing, L, m
dperf = initial perforation diameter, L, in. ESS1 = error terms, dimensionless, 2
TT1 )aa(ESSicalculatedi
−= Σ
ESS2 = error terms, dimensionless, 2TT2 )bb(ESS
icalculatedi−= Σ
f = friction factor, dimensionlessfCT = friction factor for flow in coiled tubing, dimensionless
fseamed = friction factor for flow in seamed tube , dimensionlessfseamless = friction factor for flow in seamless tube, dimensionless
fstraight pipe = friction factor for flow in straight pipe, dimensionlessG' = Elastic ModulusG" = Viscous Modulus
k = consistency index, dimensionless, M/LT2-n, psf secn
KF = consistency index for foamKL = consistency index for liquid
l = length between pressure ports, L, ftN = number of perforations, dimensionlessn = power law index, dimensionless
NRe = Reynolds number, dimensionlessNReG = Generalized Reynolds number, dimensionless
q = volumetric flow rateQ = volumetric flow rate, L3/t, m3/secQ' = flow rate, L3/T, bbl/minQa = foam qualitySn = shearing number, dimensionlessT = temperature, T, oK/oFt = total pumping time, T, min.
To = reference temperature, T, oK/oFπ = dimensionless numbersρ = fluid density, M/L3, lb/galρ' = density, m/L3, kg/m3
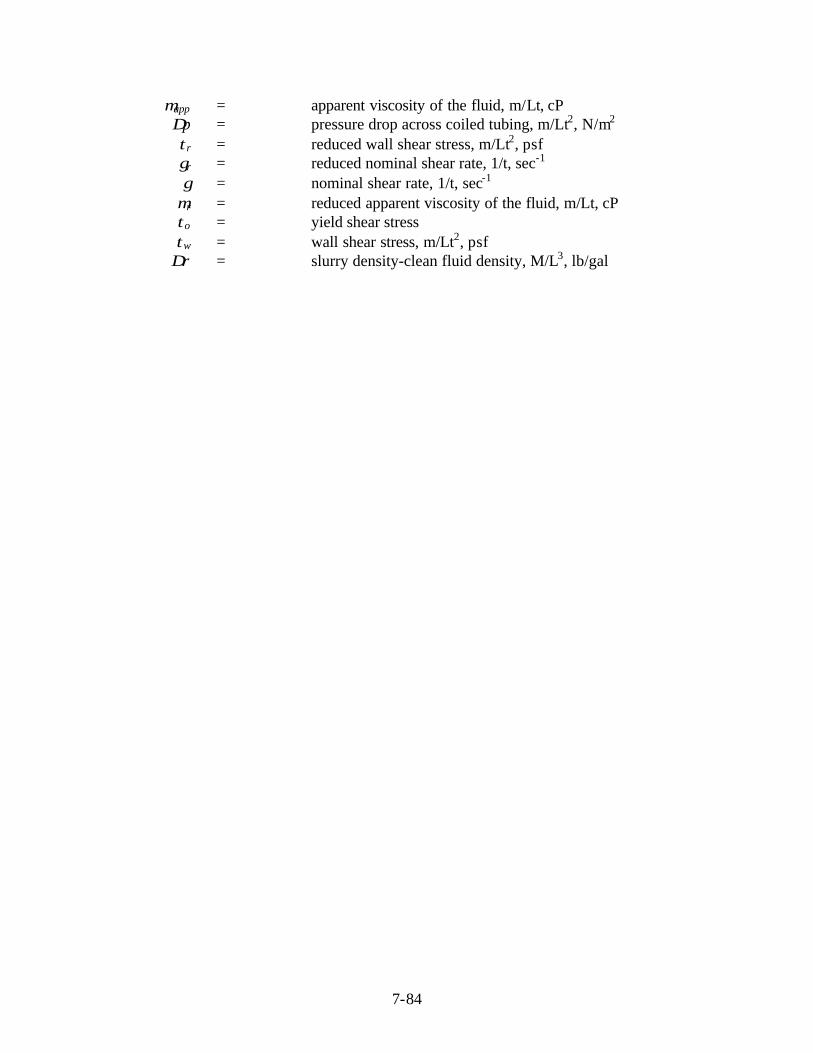
7-84
µapp = apparent viscosity of the fluid, m/Lt, cP∆p = pressure drop across coiled tubing, m/Lt2, N/m2
τr = reduced wall shear stress, m/Lt2, psfγr = reduced nominal shear rate, 1/t, sec-1
γ = nominal shear rate, 1/t, sec-1
µr = reduced apparent viscosity of the fluid, m/Lt, cPτo = yield shear stressτw = wall shear stress, m/Lt2, psf∆ρ = slurry density-clean fluid density, M/L3, lb/gal

8-1
Chapter 8 COILED TUBING CONSORTIUM
8.1 Introduction
Coiled Tubing (CT) has gained increased importance in the petroleum industry and therehas been interest expressed in the characterization of fluids in reeled tubing. Therefore,the Coiled Tubing Consortium (CTC) was established in July 1997 for the purpose ofinvestigating the flow phenomena of drilling and completion fluids in coiled tubing.Since its establishment, the CTC has successfully accomplished all its goals of the firststage of research. Now, the CTC has entered the second stage of research with expandedresearch areas. This chapter briefly presents the CTC research capabilities andaccomplishments.
8.2 The Mission of Coiled Tubing Consortium
Phase I: The Mission of the Coiled Tubing Consortium is to develop a database andcorrelations for determining the frictional losses and rheology of non-Newtonian fluidsand foams representing popular drilling, completion, and stimulation fluids pumpedthrough reeled and straight portions of coiled tubing strings as well as concentric andeccentric annuli.Phase II: The research objective of the second phase of the Coiled Tubing Consortiumis to investigate the coiled tubing hydraulics for drilling, wellbore cleanout/cuttingsremoval, and stimulation employing drilling, completion, and stimulation fluids.
8.3 Membership
The present members of the CTC includes the companies listed below:
• BJ SERVICES• BP AMOCO• BAKER• DOWELL-SCHLUMBERGER• HALLIBURTON-BAROID• KELCO• QUALITY TUBING• SONATRACH• PHILLIPS PETROLEUM
8.4 Experimental Setup and Procedure
Figure 8.1 shows the experimental apparatus used in this study. Two 50 bbl tanks areused for fluid mixing and storage and a Galigher centrifugal pump is used to feed a
8-2
Triplex plunger pump. There are seven reels of coiled tubing segments: one 1000 ft reeland one 2000 ft reel of 2 3/8 in. nominal tubing, one 1000 ft reel and two 2000 ft reels of1 1/2 in. nominal tubing and one 500 ft reel and one 1000 ft reel of 1 in. nominal tubing.Each of the tubing sizes is accompanied by two straightened sections of coiled tubing ofthe same size, 30 ft in length where differential pressure is measured across 20 ft of thelength. Two 30-ft annular test strings with 2 3/8-in. pipe inside 3 1/2 in. with differentialpressure measurements across 20 ft are also used. One annular test string is concentricwhile the other is eccentric. Honeywell differential pressure transducers are used for themeasurement of differential pressure across the straightened segments, the annular teststrings and the reeled tubing strings. A Micromotion flow meter is used to record theflow rate, temperature and density of the fluids under investigation.
The procedure followed in testing involved proper fluid preparation as the variousfluids studied required specific mixing procedures for each one. The first tubing sizeused for each test was the 2 3/8-in. tubing. The fluid was first pumped through both reelsfollowed by the longest reel alone and lastly the shortest reel alone. After the fluid wasprepared, water was pumped through the system as a system calibration check to insureaccuracy during operation. The fluid was then pumped through the system, and when thesystem was filled, it was closed in for recirculation of the fluid. The fluid was pumped atvarious flow rates up to either the maximum flow rate available from the Triplex, orreaching the maximum system pressure of 5000 psi. This same sequence of events wasfollowed for the 1 1/2 in. coiled tubing and the 1-in. coiled tubing as well.
Fluid mixing tank samples were taken before the test was run followed by on-linesampling during circulation before each segment of the test followed by a final sample atthe end of the test. In this way, any changes in fluid viscosity due to heating ordegradation were taken into account.
The data of interest gathered from the data acquisition system include:• Flow rates• Differential pressures over coiled tubing segments,• Differential pressures over straight tubing sections• Differential pressures over annular tubing sections.• Fluid density• Fluid temperatures at various locations along the flow loop
These data items have been used as the basis for the frictional loss analysis. Fluidsamples taken from the on-line sampling port were used for rheological evaluation byboth a model 35 Fann viscometer and a Bohlin viscometer. The Bohlin viscometerprovides measurements at elevated temperature.
The data gathered from the flow tests and viscometer measurements were firstcleaned to get rid of noises and outliers. Then, the relationship between friction factor andgeneralized Reynolds number was examined. Previous friction factor correlations weretried to see their ability of predicting the friction loss in coiled tubing for the fluidsinvestigated. Finally, new correlations were developed for coiled tubing as well asstraight tubing.

8-3
8.5 Laboratory Rheology
The objective of laboratory study is to understand the flow behavior of fluids undervarious shear rate and temperature conditions. Knowledge of fluid rheology is essential toestimate the frictional pressure losses in pipes. Generally, drilling and completion fluidsare not Newtonian fluids, i.e., their viscosities are not constant, but changing with shearrate.
CTC Equipment Layout
CENTRIFUGAL PUMP(GALIGHER)
FLUID MIXING AND STORAGE TANKS
50bbls.
50bbls.
TRIPLEXPUMP
Feed Line
DP
DP
1” CT
1000ft
DP
500ft
DP 2000ft
1.5” CT
DP
DP 1000ft
DP2000
ft
2-3/8” CT
DP
DP 1000ft
DP 2000ft
MicroM
otion®
30’, 2-3/8” in 3-1/2” eccentric (DP across 20 feet)
30’, 2-3/8” in 3-1/2” concentric (DP across 20 feet)
Disposal
Tank
T GP
T GP
T = Temperature
GP = Gauge Pressure
DP = Differential Pressure
Figure 8.1 Schematic of Coiled Tubing Test Facility
Therefore, more complex rheological models are needed to characterize these fluids. TheCTC laboratory rheology study involves testing the rheological properties with bothmodel 35 Fann viscometer and Bohlin viscometer.
Test with Model 35 Fann Viscometer
The model 35 Fann viscometer is essentially a concentric cylinder rotary viscometer. Themain elements of the viscometer include an outer cup and an inner cylinder or bob. Theouter cup rotates concentrically around the bob which is suspended from a torsion wire.A dial affixed to the wire and a fixed pointer enable the angle through which the wire has

8-4
turned to be measured. The fluid sample in the narrow gap between the bob and cupundergoes shear when the cup rotates. The shear stress (τw) can be estimated from thedial reading and a conversion factor for a given spring number. The shear rate ( wγ& ) canbe calculated from the RPM (revolutions per minute) of the cup and a conversion factorwhich depends on the instrument dimensions. Proper rheological models and theirparameters can then be established based on the rheograms of shear stress versus shearrate. There are six RPMs with model 35 Fann viscometer: 3, 6, 100, 200, 300, and 600which correspond to a shear rate range of 5 to 1021 sec-1. And only tests at ambienttemperatures can be run with Fann viscometer. For higher temperature test, we need touse Bohlin viscometer.
Tests with Bohlin Rheometer
Bohlin CS50 rheometer is essentially a controlled stress, rotary viscometer. Its test cellhas more geometries: bob and cup, cone and plate, and parallel plates, etc. Moreimportantly, the High Pressure Cell (HPC) enables measurements at elevatedtemperatures. The test control and data recording are computerized. The results of shearstress and shear rate as well as viscosities are given in a format of data file. The data canthen be analyzed to rheologically characterize the fluid. During this study, the shear raterange is 0.01 to 800 sec-1. The temperature range is 75 to 250 °F. It is found that most ofthe fluids investigated can be described by power law model in the range of shear ratethat would most probably be encountered in practical applications. The correlationsbetween power law parameters and temperature were also developed.
8.6 Accomplishments of CTC - Phase I
By May 1999, the CTC had accomplished successfully all its goals set by the CTCmembers. All the research results had been reported to the member companies on theCTC annual meeting, May 27, 1999, Houston, TX and other semi-annual and annualmeetings. The following is a brief summary of the first stage accomplishments.
8.6.1 Experimental Work
The experimental work of the CTC in the first phase includes two parts: coiled tubingflow loop tests and laboratory rheology tests. Test procedures have been discussedpreviously. According to the test matrix agreed upon by the CTC members, extensiveflow tests and laboratory rheology tests were conducted. The fluid systems investigatedare shown in the following tables:

8-5
Table 8.1 Fluid Systems – Linear gels
Type Concentration Temperature Range
HEC 10, 20, 40 lb/Mgal 75 – 250 °F
Xanthan 10, 20, 40 lb/Mgal 75 – 250 °F
PHPA 20, 40 lb/Mgal 75 – 250 °F
Guar 20, 30, 40 lb/Mgal 75 – 250 °F
FoamsWater (40-80% quality)20, 30, 40 lb/Mgal Guar(30-80% quality)
75 °F100 – 175 °F
Table 8.2 Fluid Systems-Drilling Fluids
Type Additives8 lb/bbl Bentonite + Fresh Water 1 lb/bbl MMH8 lb/bbl Bentonite + Fresh Water 1 lb/bbl Starch2 lb/bbl Xanthan + Fresh Water 1 /lb/bbl Starch1 lb/bbl Xanthan + Fresh Water 3% vol. Rev Dust
In each experiment, the fluid was prepared according to the formulation and preparationinstructions of that fluid. Then, the fluid was pumped through the largest tubing loop, i.e.,the 2-3/8” CT loop at various flow rates. Differential pressures across various CTsegments, straight sections as well as annular sections were gathered. Other data such asfluid density and temperature were also recorded. After the test on 2-3/8” tubing wasfinished, the flow was switched to 1-1/2” tubing and 1” tubing loops. Similar data weregathered for 1-1/2” and 1” tubing loop.
The fluid sample taken from the on-line sampling port was split into two parts:one part was tested using model 35 Fann viscometer, the other part was tested usingBohlin viscometer. The test results with Fann viscometer helped in fluid quality controlas well as providing rheological parameters at ambient temperature. When the fluidsample was tested on Bohlin viscometer, the temperature was set at 75, 100, 125, 150,175, 200, 225, and 250 °F. At each temperature, the shear rate was varied from 0.01 to800 sec-1. The shear sequence (shear sweep) was set as shearing from low shear rate tohigh shear rate. After finishing the sweeps at each temperature, the system was heated upto a higher temperature and shear sweep was repeated until the test at the finaltemperature was finished.

8-6
8.6.2 Data Analysis and Development of New Correlations
During the data analysis of each test, the raw data recorded by the data acquisition systemwas first cleaned to delete the transitional data, noises, and any outliers. GeneralizedReynolds number and friction factor were calculated from flow rate, various pressuredrops, tubing geometry, and viscosities from Fann viscometer. Correlations fromliterature, such as Mccann and Islas [1], Mashelkar and Devarajan[2], and Screenivasanand Strykowski[3] were tried to compare with the experimental data. For straight tubingdata, correlations from literature were also investigated. These included Shah[4], Drew[5],and Dodge and Metzner[6] correlations. Based on these comparisons, new correlationswere developed for both reeled coiled tubing and straightened coiled tubing respectively.For polymer solutions, the Fanning friction factor as a function of Reynolds numbercould be described by the following general equation:
cgReN
baf += ....................................................... (8.1)
where f =Fanning friction factorNReg = generalized Reynolds numbera, b, c = constants which are correlated with the tubing diameter, the curvature
ratio (the ratio of tubing diameter to reel diameter) as well as apparent viscosity
For drilling mud, data analysis indicated that a relationship between the friction factorand Reynolds number as:
2gRe
2
N
baf += ......................................................... (8.2)
where a, b are correlated with tubing diameter and curvature ratio of the coiled tubingreel.
The analysis of laboratory rheology data indicated that most of the fluids investigated canbe characterized by power law model over wide ranges of shear rate and at varioustemperatures except for the very low and very high shear rate regions where theyexhibited upper and lower Newtonian regions. The power law parameters of each fluid atvarious polymer concentrations and various temperatures were calculated. It was foundthat these parameters could be correlated well with temperature. Correlations of powerlaw parameters as function of temperature were thus developed.
8.6.3 Deliverables
• Correlations to determine frictional losses in CT, straight sections of CT, as well asconcentric and eccentric annuli for linear gels and drilling fluids
• Comparison of experimental data from CT, straight sections of CT, as well asconcentric and eccentric annuli with literature
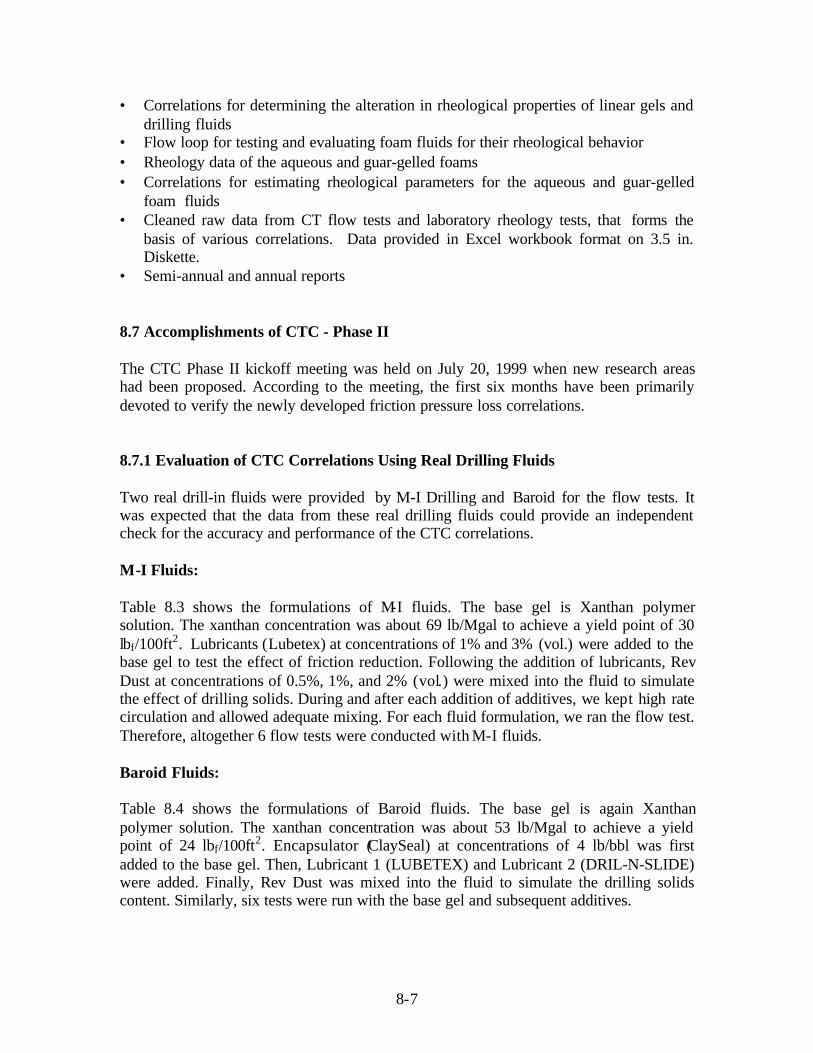
8-7
• Correlations for determining the alteration in rheological properties of linear gels anddrilling fluids
• Flow loop for testing and evaluating foam fluids for their rheological behavior• Rheology data of the aqueous and guar-gelled foams• Correlations for estimating rheological parameters for the aqueous and guar-gelled
foam fluids• Cleaned raw data from CT flow tests and laboratory rheology tests, that forms the
basis of various correlations. Data provided in Excel workbook format on 3.5 in.Diskette.
• Semi-annual and annual reports
8.7 Accomplishments of CTC - Phase II
The CTC Phase II kickoff meeting was held on July 20, 1999 when new research areashad been proposed. According to the meeting, the first six months have been primarilydevoted to verify the newly developed friction pressure loss correlations.
8.7.1 Evaluation of CTC Correlations Using Real Drilling Fluids
Two real drill-in fluids were provided by M-I Drilling and Baroid for the flow tests. Itwas expected that the data from these real drilling fluids could provide an independentcheck for the accuracy and performance of the CTC correlations.
M-I Fluids:
Table 8.3 shows the formulations of M-I fluids. The base gel is Xanthan polymersolution. The xanthan concentration was about 69 lb/Mgal to achieve a yield point of 30lbf/100ft2. Lubricants (Lubetex) at concentrations of 1% and 3% (vol.) were added to thebase gel to test the effect of friction reduction. Following the addition of lubricants, RevDust at concentrations of 0.5%, 1%, and 2% (vol.) were mixed into the fluid to simulatethe effect of drilling solids. During and after each addition of additives, we kept high ratecirculation and allowed adequate mixing. For each fluid formulation, we ran the flow test.Therefore, altogether 6 flow tests were conducted with M-I fluids.
Baroid Fluids:
Table 8.4 shows the formulations of Baroid fluids. The base gel is again Xanthanpolymer solution. The xanthan concentration was about 53 lb/Mgal to achieve a yieldpoint of 24 lbf/100ft2. Encapsulator (ClaySeal) at concentrations of 4 lb/bbl was firstadded to the base gel. Then, Lubricant 1 (LUBETEX) and Lubricant 2 (DRIL-N-SLIDE)were added. Finally, Rev Dust was mixed into the fluid to simulate the drilling solidscontent. Similarly, six tests were run with the base gel and subsequent additives.

8-8
No. Formulation Legend
1 Base Gel: Xanthan (YP: 30 lbf/100ft2) MI 1
2 Xanthan + 1% Lubricant MI 2
3 Xanthan + 3% Lubricant MI 3
4 Xanthan + 3% Lubricant + 0.5% RevDust MI 4
5 Xanthan + 3% Lubricant + 1% RevDust MI 5
6 Xanthan + 3% Lubricant + 2% RevDust MI 6
Table 8.3 Formulations of M-I Fluid
No. Formulation Legend
1 Base Gel: Xanthan (YP: 24 lbf/100ft2) B 1
2 Xanthan + 4 lb/bbl Encapsulator B 2
3 Xanthan + 4 lb/bbl Encapsulator +1.5% Lubricant 1 B 3
4 Xanthan + 4 lb/bbl Encapsulator +1.5% Lubricant 1 +0.5% Lubricant 2 B 4
5 Xanthan + 4 lb/bbl Encapsulator +1.5% Lubricant 1 +0.5% Lubricant 2 + 12 lb/bbl RevDust B 5
6 Xanthan + 4 lb/bbl Encapsulator +1.5%Lubricant 1 +0.5%Lubricant 2 + 18 lb/bbl RevDust B 6
Table 8.4 Formulations of Baroid Fluids
Test Procedure
The 1-1/2” coiled tubing flow loop was used for all the tests. Before flowing base gel intoflow loop, water was flushed through the system to ensure the flow loop was cleaned.Then, the base gel was pumped at various rates, and data were collected. Before and afterthe flow test of each fluid, fluid samples were collected and their rheological propertieswere measured using model 35 Fann viscometer. The flow rates were: 30, 40, 50, 60, 80,100, 120, 140 gpm, and up to the highest rate possible. Upon completing each test, thefluid was circulated at high rate and additive was mixed into the system. Fluid was

8-9
circulated until the additive was uniformly dispersed and well-mixed. The flow test wasthen conducted. The above procedure was repeated for all the additives.
New flow data were gathered using the WCTC CT test facility. Meanwhile,rheological data were gathered using Bohlin and Fann model 35 viscometers. The dataanalysis of the friction loss data and rheological data have been completed. The analysisresults showed that the friction loss correlations developed by the WCTC couldadequately predict the friction pressure losses for the real drilling fluids. The test data anddata analysis results have been reported to the CTC member companies.
Results and Discussions
a) The experimental results of friction factor as a function of Reynolds number werecompared with the predictions by the CTC correlations developed previously. It wasfound that the CTC correlation for coiled tubing predicts the friction factor of the basegels quite well for both M-I and Baroid fluids. Even better agreement was obtained athigh Reynolds numbers.
b) At low Reynolds numbers, the correlation overestimates the friction factor. But, thebiggest deviation is less than 11% for M-I base gel and Baroid base gel.
c) For both M-I and Baroid fluids, as the fluids became more complex (due to additionof lubricants and solids), the correlation is not working as well. Since the CTCcorrelation was developed based on data of clean fluids, some deviation from theexperimental values is not surprising. In fact, even for the complex formulations, thebiggest deviation is still less than 18% for M-I fluids and 23% for Baroid fluids. Asmore data for such complex fluids are gathered, the correlation can then be modifiedaccordingly.
d) The Effect of Lubricants on Friction Pressure. As indicated in Tables 8.3 and 8.4, inboth M-I and Baroid fluids, lubricants were added to reduce fiction pressure. Resultsshowed that as 1% and 3% (vol.) lubricants were added to the M-I base gel, thefriction pressure was reduced significantly. Similarly, as the encapsulator, 1.5%lubricant, and 0.5% lubricant were added sequentially to the Baroid base gel, frictionpressure was also reduced.
e) Effect of Drilling Solids on Friction Pressure. In order to study the effect of drillingsolids on the flow resistance of drilling fluids in tubulars, Rev Dust was added to thedrilling fluids to simulate the drilling solids. Experimental results showed that at lowconcentrations of Rev Dust (such as 0.5% and 1%), the increase in friction pressuredue to drilling solids is not significant, especially after lubricants were added. But, athigh Rev dust concentration (2%), the increase of friction pressure became important.
8.7.2 Enhancement of Coiled Tubing Test Facility
In order to meet the growing interest and requirements from the CTC member companies,efforts have been made to enhance the capabilities of the coiled tubing test facility. Theseefforts involve purchasing, construction, and installation of additional equipments.• One reel of 2-3/8” CT and one reel of 1-1/2” CT, each having length of 200 ft, were
obtained to build the longer straight test sections.

8-10
• One new reel of 1-3/4” CT, single-wrapped on 72” core and one new reel of 2-3/8”CT, single-wrapped on a 72” core were also obtained. The purpose of obtaining thesenew reels is to provide more necessary data on the effect of CT diameter andcurvature ratio.
8.7.3 Research Report and Publications
• A semi-annual research report was completed and sent to the CTC members. Thisreport includes all the flow test data and laboratory rheology data, experiment details,and results of data interpretation and analysis.
• Based on the CTC work and with the permission of the CTC members, three paperswere published in SPE meetings and two more papers have been submitted forpublication.
• Three master theses were completed based on part of the CTC research project.
8.8 Future Research Plans
8.8.1 Research Plan for the Next Six months
At the July 20, 1999 CTC meeting in Norman, OK, the CTC members agreed upon thefollowing research areas for the second half of the first year of Phase II research plan.First, construct a loop with longer straight tubing section and conduct flow tests on thesestraight sections. The objective is to acquire more accurate data and to evaluate thestraight tubing friction loss correlations. The second task is to install two new CT reelsand build four annular sections. The aim of constructing these additional components isto study the effect of CT geometry (tubing diameter and tubing diameter to reel diameterratio) and annulus geometry (equivalent diameters and eccentricity) on the friction loss.Two new CT reels and four annular sections will be constructed and installed. The thirdtask that was proposed at the last meeting is to evaluate the CTC correlations using thefield Pressure While Drilling (PWD) data. Some PWD data have already been obtained.In the next six months, further efforts will be made to acquire all necessary PWD dataand then the analysis of these data will be completed.
8.8.2 Research Topics for the Second Year of CTC Phase II
• Drag Reduction of Solids-Laden Fluids: the aim is to gather friction loss data ofsolids-laden fluids in CT and straight sections and to develop correlations to predictfriction loss values for solids-laden drilling fluids.
• Wellbore Cleanout : wellbore cleanout constitutes the majority of the CT operations(>60% CT activities). Experimental study will include solids transport in vertical,inclined, and horizontal annulus when employing CT for cleanout jobs. Meanwhile,mathematical models and computer programs will be established to simulate thecomplete wellbore cleanout process. The programs will help to improve the design ofsolids cleanout operations.

8-11
• Foam Friction Pressure Loss: The objectives include: a) to gather experimental dataof foam fluid rheology and friction losses and b) to develop empirical correlations topredict friction pressure losses of foam fluids and empirical correlations to predictfoam fluid rheology
• CT Fracturing: to gather experimental data of frictional losses of fracturing fluids incoiled tubing, straight tubing, and annuli, and develop correlations for CT fracturingapplications.
• Field Data Comparison/Confirmation of the CTC correlations• Others: Some CTC members also expressed interests in the following research areas:Ø friction loss study for e-line/CT annulusØ Performance evaluation of mud motorsØ Friction loss study of tapered stringsØ Friction loss study of hydraulic line/CT annulusØ Composite coiled tubing
Nomenclature
a, b, c = empirical constants in Eq. (8.1) and Eq. (8.2)f = Fanning friction factorNReg = generalized Reynolds numberτw = shear stress at wall
wγ& = shear rate at wall
References
1. McCann, R.C. and Islas, C.G.: “Frictional Pressure Loss During Turbulent Flow inCoiled Tubing,” paper SPE 36345, presented at the SPE/ICoTA North AmericanCoiled Tubing Roundtable, Montgomery, TX, Feb. 26-28, 1996.
2. Mashelkar, R.A. and Devarajan, G.V.: “Secondary Flow of Non-Newtonian Fluids:part III – Turbulent Flow of Visco-Inelastic Fluids in Coiled Tubes,” Trans. Inst.Chem. Engrs., Vol. 55, 1977, pp29-37.
3. Screenivasan, K.R. and Strykowski, P.J.: “Stabilization Effect in Flow ThroughHelically Coiled Pipes,” Experiments in Fluids, Vol. 1, 1983, pp31-36.
4. Shah, S. N.: “Correlations Predict Friction pressures of Fracturing Gels,” Oil and GasJournal, January 16, 1984, pp.92-98.
5. Drew, T.B., Koo, E.C. and McAdams, W.H.: “The Friction factors for Clean RoundPipes,” Trans. AIChE, Vol. 28, 56, 1932.
6. Dodge, D. and Metzner, A.: “Turbulent Flow of Non-Newtonian System,” AIChEJournal Vol. 5 (1959), 189.

9-1
Chapter 9 TECHNOLOGY DISSEMINATION
9.1 Introduction
The purpose of technology dissemination is to translate the research results at the FFCFinto practical nuggets of information that will directly benefit the industry. As often thecase, the current level of technical knowledge with the service companies and operatorsdoes not translate to the field. One of the main reasons for this technology gap betweenthe research and field personnel is the limitations in scaling down the field conditions tothe laboratory. The FFCF simulates to the maximum degree practical, all conditionsexperienced by a fracturing fluid from its simple condition on the surface to harshenvironment while flowing down the wellbore, through perforations, its injection into thefracture, and leakage into the rock matrix. Since this hurdle has been overcome in thetechnology transfer chain, the impediments to the technology adoption are shifted toproviding the results in an end-user-understandable form.
Promotional tours and advertising of this research initiative were targeted to thetechnical service departments of the producers and service companies. The FFCFutilized the resources of the Department of Energy (DOE), Gas Research Institute (GRI),the Sarkeys Energy Center, and the School of Petroleum and Geological Engineering atthe University of Oklahoma (OU) in spreading the word about the facility. The campaignincluded the exhibition of a prototype of the High Pressure Simulator (HPS) in the boothsof OU and GRI at various trade shows, distributing publications and brochures detailingthe capabilities and services available.
In this chapter, Technology Dissemination activities conducted at the FFCF areprovided in some detail. These efforts include, technical papers and publications, tradeshows, Masters theses and Doctoral dissertations, articles in trade journals, FFCF WEBsite and industry in-house presentations. These efforts have also resulted in third-partytesting, establishment of a Proppant Flowback Consortium and a Coiled TubingConsortium. These activities are provided in greater detail in the following sections.
9.2 Technology Dissemination
Following are the approaches taken by the FFCF to effectively disseminating the researchfindings to the industry:
1. Technical publications/presentations2. Master thesis and Doctoral dissertations3. Brochures4. Technical Articles5. Reports6. Patents7. Benefits to the industry8. Other means of transferring research findings

9-2
9.2.1 Technical Publications/Presentations
A plan was developed to publish and present the FFCF research findings in the form ofextended abstracts, technical papers, and technical presentations at various conferences.Following is a list of papers prepared and presented by the FFCF team.
♦ “A Model for Flow in the Fractured Porous Media Based on Cellular-automation,” A.Rodriquez, D. Lin and J. C. Roegiers, Proceedings of the ISRM InternationalSymposium EUROROCK ‘93.
♦ “A Low Deborah Number Model for a Viscoelastic Flow Driven Along a Channel bySuction at Porous Walls,” D. Lin and R. Evans, American Society of MechanicalEngineering 1993 Winter Annual Meeting, New Orleans.
♦ “A Study of Squeezing Flow in Fracture Channel,” D. Lin and J. C. Roegiers,Proceedings of the 34th U.S. Symposium on Rock Mechanics, 1993.
♦ “Application of Advanced Computational Technology to Fracturing FluidCharacterization Facility,” D. Lin and J. C. Roegiers, Proceedings of InternationalSymposium on Computer Methods in Rock Mechanics (ISCMRM ‘93).
♦ “The Use of Laser Doppler Velocimetry (LDV) for the Measurement of FracturingFluid Flow in the FFCF Simulator,” R. B. Mears, J. J. Sluss, Jr., J. E. Fagan and R. K.Menon, SPE 26619, 68th Annual Technical Conference and Exhibition of the Societyof Petroleum Engineers, Houston, TX, October 3-6, 1993.
♦ “Description of a Large, High-Pressure Slot flow Apparatus for CharacterizingFracturing Fluids,” R. G. Rein, Jr., D. L. Lord, and S. N. Shah, SPE 26524, 68thAnnual Technical Conference and Exhibition of the Society of Petroleum Engineers,Houston, TX, October 3-6, 1993.
♦ “Fracturing Fluid Characterization Facility,” R. D. Evans, Fuels TechnologyContractors Review Meeting, Morgantown, WV, November 16-18, 1993.
♦ “Simulation of Non-Newtonian Inelastic Two-dimensional Slot Flow,” J. C. Roegiersand D. Lin, SPE 27014, SPE III Latin America and Caribbean Petroleum EngineeringConference, Buenos Aires, Argentina, April 27-29, 1994.
♦ “Analysis of Leakoff in Laminar Flow Through a Porous Fracture Channel,” J. C.Roegiers and D. Lin, SPE 27008, SPE III Latin America and Caribbean PetroleumEngineering Conference, Buenos Aires, Argentina, April 27-29, 1994.
♦ “Chebyshev Spectral Collocation Method for Leakoff in Hydraulic Fracturing,” S.Marisela, D. Lin and J. C. Roegiers, Eighth International Conference on ComputerMethods and Advances in Geomechanics, West Virginia, 1994.

9-3
♦ “Poisson Bracket Formulation for Proppant Transport in Hydraulic Fracturing,” D.Lin, J. C. Roegiers, and A. A. Rodriguez, Eighth International Conference onComputer Methods and Advances in Geomechanics, West Virginia, 1994.
♦ “Shearing Motion of Dense Proppant Material in Hydraulic Fracturing,” D. Lin and J.C. Roegiers, 1st NARMS, The University of Texas at Austin, (ed. P. P. Nelson & S.E. Laubach), pp. 201-208, June 1994.
♦ “Fuzzy Logic Controls Pressure in Fracturing Fluid Characterization Facility,” V. P.Rivera and L.M. Farabee, SPE 28239, 1994 SPE Petroleum Computer Conference,Dallas, TX, July 31-August 3.
♦ “Study of Perforation Friction Pressure Employing a Large-Scale Fracturing FlowSimulator,” D. L. Lord, S. N. Shah, R. G. Rein, Jr., J. T. Lawson, III, SPE 28508,1994 SPE Annual Technical Conference and Exhibition, New Orleans, LA,September 25-28.
♦ "Study of Perforation Friction Pressure Employing a Large-Scale Fracturing FlowSimulator," D. L. Lord, S. N. Shah, R. G. Rein, Jr., J. T. Lawson, III, SPE Paper No.28508, "Peer Reviewed"
♦ “Tests Confirm Operational Status of a Large-Slot Flow Apparatus for CharacterizingFracturing Fluids,” S. N. Shah and D. L. Lord, SPE 29499, Production OperationsSymposium, Oklahoma City, OK, April 2-4, 1995.
♦ “Fracturing Fluid Characterization Facility (FFCF): Recent Advances,” S. N. Shah,Natural Gas RD&D Contractors Review Meeting, Baton Rouge, LA, April 4-6, 1995.
♦ “An Investigation of Fluid Leakoff Phenomena Employing a High-PressureSimulator,” D. L. Lord, P. S. Vinod, S. N. Shah, and M. L. Bishop, SPE 30496, 1995SPE Annual Technical Conference and Exhibition, Dallas, TX, October 22-25.
♦ “The Determination of Dynamic Proppant Concentration Field in Slot Flow in theFFCF,” R. Beason and J. Fagan, SPE 30515, 1995 SPE Annual Technical Conferenceand Exhibition, Dallas, TX, October 22-25.
♦ “New Insights on Hydraulic Fracturing from the Fracturing Fluid CharacterizationFacility,” L. R. Brand, S. N. Shah, and D. L. Lord, 1995 International Gas ResearchConference, Cannes, France, November 6-9.
♦ “Discussion of Experimental and Numerical Modeling of Convective ProppantTransport,” by F. Civan, S.N. Shah, and P.S. Vinod, JPT, vol. 47, No. 11, November1995.

9-4
♦ “Experimental Investigation of Heat Transfer Characteristics of Guar-Based PolymerSolutions and Gels,” Paper 26K, I. Azouz, P. S. Vinod, S. N. Shah, T. Lear, and D. L.Lord, 1996 AIChE National Heat Transfer Conference, Houston, TX, August 3-6.
♦ “Experimental Investigation of Frictional Pressure Losses in Coiled Tubing,” I.Azouz, S. N. Shah, P. S. Vinod, and D. L. Lord, SPE 37328, 1996 SPE EasternRegional Meeting, Columbus, OH, October 23-25.
♦ “Rheological Characterization of Hydraulic Fracturing Fluids Using a Large, HighPressure Slot Flow Apparatus,” N. Goel, B. N. Rao, R. Subramanian, S. N. Shah, andD. L. Lord, Society of Rheology, Houston, TX, February 16-20, 1997.
♦ “Borate-Crosslinked Fluid Rheology Under Various pH, Temperature and ShearHistory Conditions,” S. N. Shah, D. L. Lord, and B. N. Rao, SPE 37487, 1997 SPEProduction Operations Symposium, Oklahoma City, OK, March 9-11.
♦ “Impairment of Producibility Due to Fracturing Fluid Leakoff in Oil Reservoirs,” B.Gadiyar, A. Gupta, and S.N. Shah, SPE 37491, 1997 SPE Production OperationsSymposium, Oklahoma City, OK, March 9-11.
♦ “Fracturing Fluid Characterization: State-of-the-art Facility and AdvancedTechnology,” S. N. Shah and M. Asadi, DOE’s Natural Gas Conference, Houston,TX, March 24-27, 1997.
♦ “New Perforation Pressure Loss Correlations for Fracturing Fluids and Slurries,” A.M. ElRabaa, S. N. Shah, and D.L. Lord, SPE 38373, 1997 SPE Rocky MountainRegional Meeting, Casper, WY, May 18-21.
♦ “Effects of Coiled Tubing Shear History on the Rheological and Hydraulic Propertiesof Fracturing Fluids,” S. N. Shah and R. Subramanian, SPE 38421, 2nd NorthAmerican Coiled Tubing Roundtable, Montgomery, TX, April 1-3, 1997.
♦ “Dimensionless Correlations for Predicting the Filtration of Fracturing Fluids fromFracture Faces,” A. Gupta, B. R. Gadiyar, and S. N. Shah, American Filtration andSeparations Society Summer Technical Conference and Expo, Lafayette, LA, July15-16, 1997.
♦ “Characterization of Polymer Solutions and Crosslinked Gels at DownholeConditions Using an Advanced High Pressure Simulator,” S. N. Shah and M. Asadi,3rd International Conference on Reservoir Conformance Profile Control, Water & GasShut Off, Houston, TX, August 6-8, 1997.
♦ "An Investigation of Fluid Leakoff Phenomena Employing a High-Pressure Simulator,"D. L. Lord, P. S. Vinod, S. N. Shah, and M. L. Bishop, SPE Production & Facilities,November 1998.

9-5
♦ "A New Empirical Correlation to Predict Apparent Viscosity of Borate-CrosslinkedGuar Gel in Hydraulic Fractures," N. Goel, M. Asadi, and S. N. Shah, SPE Paper No.39816, Proceedings of the 1998 SPE Permian Basin Oil and Gas Recovery Conference,Midland, TX.
♦ "Convection/Encapsulation in Hydraulic Fracturing," M. Asadi, and S. N. Shah, SPEPaper No. 39961, Proceedings of the 1998 SPE Rocky Mountain Regional/Low-Permeability Reservoirs Symposium and Exhibition, Denver, CO.
♦ "Proppant Transport Characterization of Hydraulic Fracturing Fluids using a HighPressure Simulator Integrated with a Fiber Optic/LED Vision System," S. N. Shah, M.Asadi, and D. L. Lord, SPE Paper No. 49040, Proceedings of the 1998 SPE AnnualTechnical Conference and Exhibition, New Orleans, LA
♦ "Experimental Investigation of Frictional Pressure Losses in Coiled Tubing," I. A.Azouz, P. S. Vinod, D. L. Lord, and S. N. Shah, SPE Production & Facilities, May1998.
♦ "Advances in Hydraulic Fracturing Fluid Characterization using a Field Scale HighPressure Simulator," A. Berkat A., and S. N. Shah, Proceedings of 3rd JourneesScientifiques Et Techniques, Alger, Algeria.
♦ El-Rabba, A.M., Shah, S.N., and Lord, D.L.: "New Perforation Pressure-LossCorrelations for Limited-Entry Fracturing Treatments," SPE Production andFacilities, 14(1) (February 1999) 63.
♦ Asadi, M., Shah, S.N., and Lord, D.L.: "Static/Dynamic Settling of Proppant in Non-Newtonian Hydraulic Fracturing Fluids" paper SPE 52217 presented at the 1999 SPEMid-Continent Operations Symposium, March 28-31.
♦ Goel, N. and Shah, S.N.: "Experimental Investigation of Proppant Flowback PhenomenaUsing a Large Scale Fracturing Simulator" paper SPE 56880 presented at the 1999 SPEAnnual Technical Conference and Exhibition, Houston, October 4-6.
♦ Goel, N. and Shah, S.N.: "Experimental Investigation of Proppant Flowback Phenomenausing a Large Scale Fracturing Simulator" Highlighted in JPT (March 2000) 32.
♦ Bonilla, L.F. and Shah, S.N.: "Experimental Investigation on the Rheology of Foams"paper SPE 59752 presented at the 2000 SPE/CERI Gas Technology Symposium,Calgary, April 3-5.
♦ Medjani, B. and Shah, S.N.: "A New Approach for Predicting Frictional Pressure Lossesof Non-Newtonian Fluids in Coiled Tubing" paper SPE 60319 presented at the 2000SPE Rocky Mountain Regional/Low Permeability Reservoirs Symposium, Denver,March 12-15.

9-6
♦ Willingham, J.D. and Shah, S.N.: "Friction Pressures of Newtonian and Non-NewtonianFluids in Straight and Reeled Coiled Tubing" paper SPE 60719 presented at the 2000SPE/ICoTA Coiled Tubing Roundtable, Houston, April 5-6.
♦ Silva, M.A. and Shah, S.N.: " Friction Pressure Correlations of Newtonian and Non-Newtonian Fluids Through Concentric and Eccentric Annuli" paper SPE 60720presented at the 2000 SPE/ICoTA Coiled Tubing Roundtable, Houston, April 5-6.
♦ Goel, N., Shah, S.N., and Asadi, M.: "New Empirical Correlation to Predict ApparentViscosity of Borate-Crosslinked Guar Gel in Hydraulic Fractures," SPE Production andFacilities, (May 2000) 90.
♦ Cho, H. and Shah, S.N.: "A Three-Layer Modeling for Cuttings Transport in CoiledTubing Horizontal Drilling," paper SPE 63269 presented at the 2000 SPE AnnualTechnical Conference and Exhibition, Dallas, October 1-4.
♦ Cho, H. and Shah, S.N.: "A Three-Segment Hydraulic Model for Cuttings Transport inHorizontal and Deviated Well," paper SPE 65488 presented at the 2000 SPE/CIMInternational Conference on Horizontal Well Technology, Calgary, November 6-8.
9.2.2 MS Theses and Ph.D. Dissertations
A number of graduate students from the University of Oklahoma were involved inconducting research in various areas of hydraulic fracturing at the FFCF. As a result, anumber of Masters theses and Doctoral dissertations have been completed. The researchfindings were transferred to both industry and university communities by one of themeans of transformation described in previous sections. In addition, a copy of publishedtheses/dissertations was available through the University of Oklahoma Libraries. Listedbelow is a complete list of Graduate students that have taken part in this project and havewritten or working on their Thesis/Dissertation.
Completed:
Al El Rabaa – Masters, 1997
Brian Mears - Masters, 1993
Chee (Thomas) Liu - Masters, 1993
Doug Lonsinger - Masters, 1994
Farooq Tareen – Masters, 1999
Hazem Hejjo - Masters, 1993
Hazem Hejjo – Ph.D., 1999
John Hassell - Masters, 1992
John Lawson - Masters, 1994
John Zhao - Ph.D., 1994
K.A. Jaganatha - Masters, 1993
K.D. Thakore - Masters, 1992
Kevin Bjornen - Masters, 1994
Kok Tan - Masters, 1993
Linda Guan - Masters, 1993
Luis Bonilla – Masters, 1999
Mahadev A. – Masters, 1998
Moises Silva – Masters, 1999

9-7
Ronnie Beason - Masters, 1992
Sonja Lear - Masters, 1994
Tommy Lear - Masters, 1996
Tony Howl - Masters, 1995
Victor Abyad - Masters, 1993
Abu Sani – Masters, 1999
Brahim Medjani – Masters, 1999
Ridha Ouezzani – Masters, 1999
Naeem Saddiqui - Masters, 2000
Ivan Gil - Masters, 2000
Sonja Wilkinson - Ph.D., 2000
Stewart Mills - Masters, 1999
In Process:
Brian Mears - Ph.D.
Naval Goel - Ph.D.
Hyun Cho- Ph.D.
Ameet Raichur- Masters
Ramaswami Subramanian - Ph.D.
Ronnie Beason - Ph.D.
Yunxu Zhou – Ph.D.
Sudhakar Khade - Masters
9.2.3 Technical Brochures
A number of brochures were published for the FFCF. These were published jointlybetween GRI, DOE and the University of Oklahoma during the course of the project.Listed below is a list of the Technical Brochures that were published for Industry use.
♦ GRI Tech Profile, “New Facility Aids in Fracture Fluid Study.”
♦ GRI Fact Sheet, “Fracturing Fluid Characterization Facility (FFCF).”
♦ DOE Office of Fossil Natural Gas Research Energy Project Facts, “The FracturingFluid Characterization Facility at the University of Oklahoma.”
♦ The University of Oklahoma Fracturing Fluid Characterization Facility, “FFCF andIts Capabilities.”
♦ The University of Oklahoma Fracturing Fluid Characterization Facility, “FFCFPerforation Pressure Loss Correlation.”
9.2.4 Technical Articles
A number of technical articles were also published in an attempt to disseminate the newtechnology generated by the project. Listed below are the articles published.
♦ “OU Researcher Looking to Free Gas Resources,” The Sunday Oklahoman, October6, 1991, p. 1-C.

9-8
♦ “Concept and Objectives of the Fracturing Fluid Characterization Facility (FFCF),”GRI In Focus - Tight Gas Sands, vol. 7, no. 3, December 1991.
♦ “The Fracturing Fluids Characterization Facility,” ISRM News Journal, by Robert G.Rein, Jr., vol. 2, no. 1, p. 7 (and cover photo), Spring 1994.
♦ “Fracturing Fluid Characterization Facility (FFCF) Improves Design and Control ofFracturing Treatments, GRI Wellsight, vol. 2, no. 3, p. 3, September 1994.
♦ “Research Facility Gets New Leader, New Look,” The University of OklahomaSarkeys Energy Center News, vol. 2, no.1, Fall 1994.
♦ “Fracturing Fluid Characterization Facility,” GRI Natural Gas Supply ProductReference Guide, p. 19, Spring 1995.
♦ “FFCF - A Benchmark for Characterizing Fracturing Fluids,” GRID, vol. 19, no. 2,Summer 1996.
♦ “Fracturing Fluids and Their Impact are Focus of Test Facility and GRI ShortCourse,” GRI Wellsight, vol. 4, no. 3, September 1996.
♦ “Frac simulator available for industry applications,” Oil and Gas Journal, vol. 95, no.29, July 21, 1997.
♦ "Well Construction Technology Center, University of Oklahoma," Reel Reporter, vol.5, no. 1, March 2000.
9.2.5 GRI Topical, Internal Reports and Technical Summaries
Listed below are a list of Internal Reports, Topical Reports and GRI TechnicalSummaries published during the duration of DOE’s participation in the FFCF project.
♦ “Evaluative Report of Three Schematic Alternatives for the Fracturing FluidCharacterization Facility,” by Mark Caldwell.
♦ “An Architectural Program for the Fracturing Fluid Characterization Facility,” byEren Erdener.
♦ Internal Report 91-01, “Gas Research Institute Fracturing Fluid CharacterizationFacility Conceptual Plan,” compiled by J. C. Roegiers, February 1991.
♦ Internal Report 91-02, “Feasibility of Using Geosynthetics as a Facing Material in theFFCF Simulator,” compiled by D. J. Cruickshank, May 1991.
9-9
♦ Internal Report 91-03, “Review of Hele-Shaw Models and Their Applications,” by D.J. Cruickshank, August 1991.
♦ Internal Report 91-04, “Preliminary Facility Program for the FFCF,” by ErenErdener, May 1991.
♦ Internal Report 91-05, “Critical Review of Rheological Models Applicable toDescription of Hydraulic Fracturing Fluids,” by S. N. Shah, May 1991.
♦ Internal Report 91-06, “Oklahoma University Fracturing Fluid CharacterizationFacility (FFCF) Simulator Functional Requirements,” by Fred Tsuchiya, May 20,1991.
♦ Internal Report 91-07, “FFCF Project Data Acquisition and Control SystemSelection,” compiled by J. E. Fagan, May 1991.
♦ Internal Report 91-08, “Some Remarks on Numerical Simulation of Non-NewtonianFlow,” by D. Lin, March 30, 1991.
♦ Internal Report 91-09, “Important Capabilities of the Planned Fracturing FluidsCharacterization Facility,” by D. L. Lord and R. Rein, June 1991.
♦ Internal Report 91-10, “Need and Description for the FFCF Prototype,” by D. Ballew,J. Bushey, and K. Mellegard, June 1991.
♦ Internal Report 91-11, “Approach to Uncertainty Analyses for FFCF Test Results,”compiled by K. Mellegard, September 27, 1991.
♦ GRI Topical Report November 1991, “Gas Research Institute Fracturing FluidCharacterization Facility Conceptual Plan,” GRI-91/0349, prepared by the Universityof Oklahoma, November 1991.
♦ GRI Topical Report January 1990-December 1991, “Rheology of Fracturing FluidSlurries,” by R. K. Prud’homme, GRI-93/0444, January 1992.
♦ GRI Topical Report January 1991-November 1991, “Fracturing FluidCharacterization Facility Simulator Functional Requirements,” GRI-91/0348,prepared by the University of Oklahoma, March 1992.
♦ “Strength and Stability Analyses of Retaining Structure Models for the FracturingFluid Characterization Facility (FFCF),” by K. D. Thakore and A. G. Striz, May1992.
♦ GRI Topical Report, “Review of Technical Issues Pertaining to the Fracturing FluidCharacterization Facility (FFCF), GRI-91/0350, October 1992.

9-10
♦ Topical Report RSI-0450, “Heat-Transfer Simulations of the Fracturing FluidCharacterization Facility Prototype,” by J. D. Osnes, October 1992.
♦ “Annual Report for August 1991-July 1992 Fracturing Fluid Characterization Facility(FFCF),” GRI-93/0134, December 1992.
♦ Internal Report 92-03, “An Experimental Investigation of Jet Penetration into a Slot,”by J. T. Lawson and R. G. Rein, Jr., December 1992.
♦ Internal Report 93-02, “Rheology of HPG Solutions According to Giesekus’s Model(Linear and nonlinear viscoelastic behavior),” by A. L. Diek, March 1993.
♦ FFCF Quality Assurance Procedures (Draft), April 27, 1993.
♦ Business Plan for the Fracturing Fluid Characterization Facility (FFCF), prepared bythe University of Oklahoma, October 1, 1993.
♦ Topical Report RSI-0483, “Probabilistic Uncertainty Analyses for Fracturing FluidQuantities Using Approximate Methods: High-Pressure Fracture Simulator (HPFS),”by T. W. Pfeifle, October 1993.
♦ “Annual Report for January 1993-December 1993 Fracturing Fluid CharacterizationFacility (FFCF),” GRI-94/0065, December 1993.
♦ “Research and Development Plan for the Fracturing Fluid Characterization Facility(FFCF),” prepared by the University of Oklahoma, May 1994.
♦ GRI Topical Report, “Functional Capabilities of the High Pressure Simulator forFracturing Fluid Characterization,” by P. S. Vinod, GRI-94/0438, December 1994.
♦ “Annual Report for January 1994-December 1994 Fracturing Fluid CharacterizationFacility (FFCF),” GRI-95/0091, December 1994.
♦ “Annual Report for January 1995-December 1995 Fracturing Fluid CharacterizationFacility (FFCF),” GRI 96/0145.
♦ GRI Technical Summary “New Correlations for Perforation Pressure Loss” by TheUniversity of Oklahoma, GRI-96/0208, October 1996.
♦ “Annual Report for January 1996-December 1996 Fracturing Fluid CharacterizationFacility (FFCF),” GRI –97/0050.
♦ “Annual Report for January 1997-December 1997 Fracturing Fluid CharacterizationFacility (FFCF),” GRI –98/0235.

9-11
♦ “Annual Report for January 1998-December 1998 Fracturing Fluid CharacterizationFacility (FFCF),” GRI –99/0128.
♦ “Annual Report for January 1999-December 1999 Fracturing Fluid CharacterizationFacility (FFCF),” GRI-00/.
♦ “Final Report for January 1991-September 1998 Fracturing Fluid CharacterizationFacility (FFCF),” GRI –99/0126.
9.2.6 Patents
Listed below are the patents awarded for the unique research accomplished at theFracturing Fluid Characterization Facility (FFCF). Below is the abstract for the patentsissued and a description of how each pertains to the original abstract.
A system for characterizing the pressure, temperature, movement andflow patterns of a fluid under high pressure within a test cell. The testcell is lined internally with adjustable rock facings. Pressure ismeasured within the cell using a device employing pressure-distortableoptical fibers. Fluid velocity, flow direction, and filter-cake buildupare measured with laser Doppler velocimetry. The flow pattern of thefluid is viewed using corresponding arrays of transmitting andreceiving optical fibers. Temperature of the fluid is estimated using acombination of thermal sensors. The pressure, velocity, viewing andtemperature systems are integral to the rock facings of the test cell.
1. U.S. Patent Number 5,249,864 issued October 5, 1993, “System for CharacterizingTemperature of Fluids,” John E. Fagan and Ronnie B. Beason.
System for characterizing temperature of Fluids
2. U.S. Patent Number 5,271,675 issued December 21, 1993, “System for CharacterizingPressure, Movement, Temperature and Flow Pattern of Fluids,” John E. Fagan; JamesJ. Sluss, Jr.; John W. Hassell; R. Brian Mears; Ronnie B. Beason; Sonja R. Wilkinson;Tommy Lear; Kok S. Tan.
System for characterizing pressure, movement, temperature and flowpatterns of fluids
3. U.S. Patent Number 5,272,333 issued December 21, 1993, “System for CharacterizingPressure, Movement, and Temperature of Fluids,” John E. Fagan; James J. Sluss, Jr.;

9-12
John W. Hassell; R. Brian Mears; Ronnie B. Beason; Sonja R. Wilkinson; TommyLear.
System for characterizing pressure, movement, and temperature of fluids 4. U.S. Patent Number 5,324,956 issued June 28, 1994, “System for Characterizing
Movement and Temperature of Fluids,” John E. Fagan; James J. Sluss, Jr.; John W.Hassell; R. Brian Mears; Ronnie B. Beason.
System for characterizing movement and temperature of fluids
5. U.S. Patent Number 5,326,969 issued July 5, 1994, “System for Characterizing Flow
Pattern and Pressure of a Fluid,” John E. Fagan; James J. Sluss, Jr.; John W. Hassell;R. Brian Mears; Ronnie B. Beason; Sonja R. Wilkinson; Tommy Lear; Kok S. Tan.
System for characterizing flow pattern and pressure of a fluid
6. U.S. Patent Number 5,488,224 issued January 30, 1996, “System for CharacterizingFlow Pattern, Pressure and Movement of a Fluid,” John E. Fagan; James J. Sluss, Jr.;John W. Hassell; R. Brian Mears; Ronnie B. Beason; Sonja R. Wilkinson; TommyLear; Kok S. Tan.
System for characterizing flow pattern, pressure and movement of a fluid 9.2.7 Benefits to the Industry The following section describes the benefits that the industry has gained from the workthat was performed at the Fracturing Fluid Characterization Facility in the areas ofproppant transport, heat transfer, proppant flowback, rheology and perforation pressureloss. These implications are discussed in further detail in the previous sections.
Proppant Transport
♦ Convection is a density driven phenomenon and in low viscosity medium itdominates proppant settling; hence, an optimum fluid viscosity exists that overridesthe influence of the density to form convection. This result implies that when thehigh viscosity fracturing fluids are used in a well stimulation the convectivephenomenon is unimportant.
♦ The FFCF study shows that crosslinked gel bed height erosion was eight times morethan that by linear gel. The results show that the high viscosity crosslinked fluids notonly have good proppant suspension capability, as is known to the industry, but alsohave better bed erosional and resuspension capacity. These two features givecrosslinked guar fluids ideal characteristics to distribute proppant throughout thefracture.

9-13
♦ Static settling experiments show that there is a non-linear relationship between thedecrease in the settling and increase in the fluid viscosity. Hence, industry shouldexamine parameters other than the viscosity to better understand proppant carryingcapabilities of the fracturing fluid.
Heat Transfer
♦ The heat transfer coefficients of the linear guar and HPG solutions, and crosslinkedgels are lower than that of water. This suggest that the fracturing fluids may performbetter under real downhole conditions than what is predicted from the current industrypractice of substituting the heat transfer coefficient of water for the fracturing fluids.On the other hand, the heat transfer coefficient of the guar slurry is similar to that ofthe water. Therefore, the current practice of predicting the slurry heat transfercharacteristics with water can be successfully continued without compromising thefluid performance under real conditions.
Proppant Flowback
♦ Results show that the critical flowrate is a function of proppant size, fracture widthand closure stress. This means that the stability of the propped fracture is stronglydependent on the stimulation parameters and reservoir conditions. The significanceof these results show that a huge decrease in stimulation ratio means that all potentialbenefits of the hydraulic fracturing treatment can be lost due to proppant flowbackproduced from the fracturing treatment.
Foam Rheology
♦ Foam viscosity increases with an increase in the foam quality. This implies that ahigher fraction of gas in the foam can be used to generate a viscous fluid. The lowliquid content in the foam reduces the damage to a proppant in the fracture. Hence,fracture conductivity is maintained when stimulation treatments are performed withfoam based fracturing fluid.
Dynamic Fluid Loss ♦ Spurt loss values measured in the laboratory cell were generally larger than those
measured using the HPS at the FFCF. In the case of large differences in spurt lossvalues, several thousand gallons of fracturing fluid could potentially be pumpedunnecessarily. Large surface-area experiments, such as those available with the HPS,will be required to provide the spurt loss values needed for development of suchcorrections.
♦ Filter-cake is not a requirement for fluid loss control in all instances. The primaryfluid loss control mechanism with crosslinked gels appears to be pore-plugging. A

9-14
paradigm shift is needed to allow the industry to focus on the concept of pore-plugging or an “internal filter-cake” as a source of fluid loss control.
♦ Neither the viscosity of a crosslinked gel nor filter cake formation was sufficient tocontrol leak-off through naturally fractured media. In the absence of experience witha particular naturally fractured formation, mixtures of 100 mesh sand and silica flourshould be incorporated into a gelled prepad or pad fluid to control leak-off.
Fluid Rheology♦ The rheology study provided a unique empirical correlation that relates the nominal
shear rate with the apparent viscosity of borate-crosslinked guar fluid. The industrycan use the correlation to simultaneously evaluate several fluid formulations andselect optimum formulation for a given fracturing treatment, thereby, saving time andreducing costs for rheologically characterizing fluids.
Perforation Pressure Loss
♦ A new perforation pressure loss correlation was developed which accounted for therheological characterics of fracturing fluids. The developed correlation will providesignificant benefits by improving the design of limited entry treatments and infracturing pressure analysis. The correlation was developed in such a way that madeit easily incorporated into hydraulic fracturing simulators such as Frac Pro and otherscommonly used by the industry.
9.2.8 Other Means of Disseminating Technology
The following section describes the other methods of transferring technology that wasused by the FFCF team.
1. Industry In-House Presentations2. Trade Shows3. FFCF WEB site4. Annual Reports
Industry in-house presentations have played a large role in Technology Transfer. Thesemi-annual and annual meetings for the Coiled Tubing Consortium (CTC) resulted inhaving several companies’ personnel visit our facility. This resulted in several third-party tests being conducted during 1998 and 1999.
Another way of disseminating research results and our capabilities is throughIndustry Trade Shows. Our philosophy is that the more personal contacts that can bemade the better our research results and capabilities can be utilized. We also attend theCoiled Tubing Roundtable annually which, has been very productive as far asunderstanding industry needs in this area, recruiting new members to the Coiled TubingConsortium, and also utilization of the facility for further research.

9-15
Annual Reports have been submitted to GRI & DOE from 1991-1998. All of theResearch activities have been documented in these reports. GRI & DOE and TheUniversity of Oklahoma have all of the published reports on file for industry reference.
In September 1997, the FFCF staff met with Schafer and Associates regardingestablishing a FFCF WEB site on the Internet. Consequently, a contract to design a WEBsite was awarded. In March of 1998 the WEB site was made fully operational and is nowproviding the industry the latest research findings, activities and consortium news. Ourstaff is currently maintaining the WEB page at the FFCF. The FFCF name has sincebeen changed to Well Construction Technology Center (WCTC) and so the World WideWeb address is www.ou.edu/wctc.

10-1
Chapter 10 COMMERCIALIZATION OF FFCF
10.1 Introduction
The Fracturing Fluid Characterization Facility (FFCF) has been in existence since 1991.It was established with funding from Gas Research Institute (GRI), U.S. Department ofEnergy (DOE), University of Oklahoma (OU), and co-funding from Halliburton EnergyServices, MTS Systems Corporation, and RE/SPEC, Inc. The objective of the facilitywas to provide the oil and gas industry with a better understanding of the behavior offracturing fluids and their proppant transport capabilities under downhole conditions.
The objectives and goals set forth to date for the research and development planhave been accomplished and results are well documented in the FFCF Annual Reportssubmitted to GRI and DOE. As a natural extension of the original FFCF research project,a joint-industry consortia, Coiled Tubing Consortium Consortium has been establishedthrough the Completion Engineering Association, CEA-93. Furthermore, aggressiveefforts have been made to acquire client testing projects and other government grants.
The FFCF is now available to industry for characterizing and understanding thebehavior of complex fluid systems. It is the desire of the University to have this facilityself-sustained by the year 2000. Therefore, a comprehensive feasibility study of theFFCF was required in which the University assessed the current status and determined ifit is feasible for the FFCF to be a self-sufficient research entity by the year 2000.
This chapter outlines different steps taken by OU to make the FFCF self-sufficientby the year 2000.
10.2 Formation of OU FFCF Commercialization Committee
The University of Oklahoma formed a commercialization committee and consideredconducting a feasibility study for the FFCF. The committee and feasibility study isdiscussed in the following sections.
Prior to initiating the commercialization process, the very first step was to form acommittee at the University of Oklahoma. A committee was formed and it consisted ofthe Vice President, Research and Administration, Dean, College of Engineering,Director, School of Petroleum & Geological Engineering, and Director, Fracturing FluidCharacterization Facility. The committee headed by the FFCF Director was responsiblefor developing and directing the commercialization activities of the FFCF. The FFCFcommercialization committee was also responsible for developing and executing amarket search in order to determine the necessary path towards commercialization. Thismarket search was to be performed within the oil and gas industry as well as otherindustries outside the petroleum industry that might utilize the capabilities of the FFCF.Furthermore, the OU FFCF committee was also charged with the development of acommercialization strategy based on the results of the market search.

10-2
10.3 Feasibility Study for the FFCF
The commercialization committee developed a “Scope of Work” (SOW) for thefeasibility study of the FFCF as a University research unit. The SOW for the feasibilitystudy included an inventory of existing resources, assessment of current FFCF resources,analysis of commercial markets open to FFCF, and recommendations for the future of theFFCF.
The committee identified the following three competent and well recognizedconsultants to conduct the feasibility study. These consultants are:
Mr. P. R. (Bob) Sprehe – Performance Engineered Drilling Systems, Inc.Mr. A. Richard Sinclair – Well Stimulation, Inc.Ms. Aneta S. Newton – Phoenix Processes, Inc.
These consultants were selected based on their diverse educational background andexperience, OU would benefit the most if these consultants were asked to conduct studiesin different markets. In order to identify additional consultants the committee had alsocontacted Mr. Brian Gahan, FFCF Project Manager, GRI and Mr. Bill Lawson, DOE.The committee was to recommend the number of consultants to be used once theadditional names became available. As soon as the decision of a team of consultants hadbeen made, the budget for the feasibility study was to be prepared.
At this point, OU was anticipating significant changes in its administration. TheCollege of Engineering was naming a new Dean and the School of Petroleum &Geological Engineering (PGE) was naming a new Director. Therefore, the decision ofthe feasibility study was deferred until both appointments were finalized. Once, both theDean of College of Engineering and the Director of PGE were appointed, the decisionwas made not to hire external consultants to do the feasibility study as described in theSOW but, instead, develop the commercialization strategies within OU. It was decided toincrease the market share for FFCF by staying within the oil and gas industry andexpanding the capabilities to include other areas besides stimulation and coiled tubingand not actively pursuing other industries.
10.4 Name Change of the Facility
As the research and technology transfer efforts of the Fracturing Fluid CharacterizationFacility have expanded into other areas of the petroleum industry, the FFCF was renamedWell Construction Technology Center (WCTC) to encompass the broad spectrum of thepetroleum industry. With this change, the FFCF Project becomes part of the WellConstruction Technology Center. Similarly, the current joint-industry Coiled TubingConsortium becomes part of the WCTC. Similarly, there will be additional projectswithin the WCTC dealing with other areas. For the purpose of commercialization it isimperative that WCTC expands the capabilities in other oil and gas industry related areas,e.g. drilling, completions, and production.

10-3
10.5 Plans for Expansion and Acquisition of Equipment for Extended Capabilities
It is the plan of WCTC to expand its present capacity so that the facility can provide thenecessary research and engineering services. Plans have been made to acquire additionalequipment for extended capabilities of mixing and pumping various types of fluids usedfor stimulation and drilling operations. Furthermore, to expand the capacity into thedrilling area, the acquisition of the BP/Amoco Catoosa Facility was seriously considered.After careful analysis it was determined by WCTC that it was not in the best interest ofthe University at the present time.
Recently, BP/Amoco has donated the drilling rig and fluid mechanics laboratoryin Bldg. 4 of Amoco facility in Tulsa to WCTC. This facility will be utilized for testingbits and to conduct drilling related research. Furthermore, the University of Oklahomarecently signed a Memorandum of Understanding (MOU) with Sandia NationalLaboratories to perform joint research projects to help increase oil, gas, and geothermalenergy production.
10.6 Client Testing
The FFCF has been actively seeking innovative ways to make the industry aware of thecapabilities of this unique facility. The staff of the FFCF tries to keep themselves in tuneto the immediate and future needs of the petroleum industry. We try to accomplish thisby attending trade shows, personal contacts, industry presentations and keeping ourselvesabreast of any proposals that we could submit to different agencies. In this time of downsizing and mergers in the petroleum industry, we look upon this as an opportunity toabsorb some of the research needs of the industry. As internal R&D personnel is at a alltime low, facilities like the FFCF will play a critical role in continuing the neededresearch through industry J.I.P.'s or propriety projects.
Tests Performed. Several tests for clients have been performed in the areas of fluidrheology, coiled tubing applications and foam fluid rheology. A brief listing of thesetests is presented below.
• Fluid Rheology and Proppant Transport− Petroleum Research and Consulting Services, Tulsa, Oklahoma− Halliburton Energy Services, Duncan, Oklahoma− Dowell Schlumberger, Sugarland, Texas− Mobil Exploration and Production, Dallas, Texas
• Fluid Rheology− Baker Hughes INTEQ, Houston, Texas− Halliburton Energy Services, Duncan, Oklahoma− Dowell Schlumberger, Sugarland, Texas− Mobil Exploration and Production, Dallas, Texas− Applied Geodynamics, Steamboat Springs, Colorado

10-4
• Coiled Tubing Applications− Baker Hughes INTEQ, Houston, Texas− Mobil Exploration and Production, Dallas, Texas
• Foam Fluid Rheology− Applied Geodynamics, Steamboat Springs, Colorado− Halliburton Energy Services, Duncan, Oklahoma
These tests brought very encouraging response from the customers. The clientsexpressed their satisfaction with the services provided by the facility. As a result, moreclient-testing is anticipated in the future.
Proposals Submitted. In addition to the above-mentioned tests, proposals are submittedto various agencies in order that we may capitalize upon our unique capabilities.
• Plugging Abandoned Wells− Submitted to Oklahoma Center for the Advancement of Science and Technology
(OCAST)• Foam Fluid Rheology
− Submitted to National Science Foundation, jointly with applied Geodynamics,Steamboat Springs, Colorado
• Drilling− Performance Engineering Drilling Systems, Covington, Louisiana
• Perforating− Hi Tech Fluids, Boerne, Texas
• Crosslinked Slurry Rheology− Pre-application to the U.S. Department of Energy
10.6.1 Future Efforts
Present tests and proposals have not been limited to the petroleum industry. It should benoted that the facility has performed tests for the mining industry as part of an SBIRproposal in 1998. Also, in 1999 we have submitted another joint SBIR proposal withApplied Geodynamics in Steamboat Springs, Colorado. This research will be used forExtra-Terrestrial excavation for a future NASA project.
Even though the research capabilities of the FFCF are centered around thepetroleum industry, we must continually seek out other avenues for opportunities tobenefit our clients and ourselves.
10.7 Other Commercialization Activities
As part of FFCF commercialization, several other activities were also performed.Technical presentations were made to several companies at their locations and duringtheir visits at the FFCF. An update on the Proppant Flowback Consortium (PFC) andCoiled Tubing Consortium (CTC) were presented at the annual meeting of the

10-5
Completion Engineers Association and the CTC members. To disseminate theknowledge gained, technical papers were presented at the annual and regional Society ofPetroleum Engineers conferences. To increase the visibility within and outside the oiland gas industry, the FFCF World Wide Web Internet site was developed and madeavailable.

A-1
Appendix AFINAL REPORT FROM MTS REGARDING THE FRACTURING
FLUID CHARACTERIZATION FACILITY
A.1 Overall Project Objective
MTS Systems Corporation is known as a supplier of high performance systems fortesting and manufacturing. As part of the Fracturing Fluid Characterization Facility(FFCF) Project team, MTS was charged with supplying the mechanical and electronichardware which allows fracturing fluid researchers to understand the dynamics offracturing fluids and proppants in a large scale, controlled laboratory environment.As a first step in meeting the long term goal of a large scale test system, MTS worked onthe definition, design, fabrication, checkout, testing, and delivery of the PrototypeHardware.In the long term, a Full Scale System was preliminarily designed on the experiencegained from the Prototype Hardware, though no hardware was built.
A.2 Summary of Work
1. Work performed involved the development of the Functional Requirements for thePrototype Hardware, initiation of the Conceptual Design, support of the Project atContractor, TAG, and PAG meetings.
2. The major accomplishment was the development of the Functional Requirements,design, assembly, test, and installation of the Prototype Hardware.
3. The major conclusion was developing a consensus between the contractors, OU, GRI,and the advisory groups that the Functional Requirements reflected the overall goalsof the Prototype Hardware.
4. Definition and design of a full scale Low Pressure Simulator.
A.3 Specific Objectives
The specific objective was to deliver the Prototype Hardware to Oklahoma Universitywithin the established budget. Overall, MTS achieved this through delivery of thePrototype Hardware to the FFCF Laboratory in July 1992. The budget was also met atthe delivery date.
A.4 Work Performed
1. MTS supported the FFCF Program Simulator Team (OU, MTS, Halliburton,RE/SPEC). The MTS developed simulator encompassed the servo-controlled platensfor simulated crack motion. Key areas where MTS interacted with other ProgramTeam members included:
A-2
a) Halliburton – Fracturing fluid handling and interface of the MTS hardware topumping equipment.
b) RE/SPEC – Operational procedures, task planning, and test techniques.c) OU – Interface of MTS hardware to sensors, data acquisition, simulated rock,
laboratory, and host controller. Analysis of fracturing fluid rheology and its effect onsimulator design. Structural analysis of the simulator.
2. MTS planned the following overall design tasks:a) Develop (and finalize) Functional Requirementsb) Develop Conceptual Designc) Finalize Detail Designd) Procure and Fabricate Partse) Assemble and Test Prototype at MTSf) Install at FFCF, Oklahoma University
This work was executed in parallel with the activities by the other project teams.Interaction with them was identified as a critical component to an effective Prototypedesign.3. The first year deliverable was planned as a Prototype System to help determine and
evaluate the Full-Scale Simulator design issues. The Prototype was sized atapproximately, 10 ft high, 11 ft long, and 10 ft in width. The size of the simulatedcrack was approximately 18 times greater in square footage than the previouslyenvisioned Prototype (January 1991).
4. MTS supported the interfacing of the Prototype simulator hardware (MTS suppliedMechanical and Electrical Hardware) with the Oklahoma University and Halliburtonsupplied hardware. (OU – simulated rock, sensors for measurement of fluidcharacteristics, data acquisition, and user interface; Halliburton – fracturing fluidpumping and conditioning hardware).
5. MTS supported the installation and interfacing of the MTS supplied hardware withthe other subsystems in the FFCF. It was planned that MTS would have a mechanicalengineer, electrical engineer, and a checkout technician on site to support theinstallation and interfacing tasks.
6. MTS supported RE/SPEC in the development and analysis of activity plans forsystems testing and scientific investigation of fracturing fluid mechanics, as well asthe development of facility plans and operational techniques for the OU – FFCFLaboratory.
7. MTS supported FFCF researchers (OU, Halliburton, RE/SPEC) during thedevelopment of experiments for fracture fluid testing. Technical assistance in theaspects of the MTS supplied Prototype system was proposed. Training of the FFCFresearchers in the operation of the Mechanical and Electrical hardware was planned.
8. MTS provided modifications, enhancements, or repairs to the Prototype as required oras requested by OU. It was anticipated that fieldwork performed after installation anddiscussions with FFCF researchers would result in the installation of these changes atthe FFCF. MTS proposed a mechanical engineer, electrical engineer, and a checkouttechnician be made available to support the installation and interfacing Tasks.
9. MTS provided project management for the control of the project efforts at MTS. Thisincluded monthly reports, cost control, materials control, and other support asrequired by OU.

A-3
10. MTS supported OU in the development of cost estimates, project plans, proposals,and technical analyses of the Full Scale Simulator. Develop functional requirementsfor the Full Scale Simulator. Develop specifications for the Full Scale Simulator.
11. MTS attended FFCF Project, Technical Advisory, and Project Advisory Meetings asrequired.
In general, MTS completed all activities discussed above. Some work is continuing assupport to the installed Prototype Hardware. Additional comments are given below.
1. MTS continues to interact with OU, Halliburton, and RE/SPEC as required.2. The Prototype Hardware was delivered and installed in July 1992. The final size of
the Prototype had increased the scope of the design effort in the following task areas:• Larger size of the mechanical system requiring more structural design.• Increased temperature resulting in a more complex seal design.• Increased number of control channels (from 4 to 12) increasing cross coupling
complexity in the controller and software development.• Evolution of the sensor system with the fiber optics integrated in the facings
requiring more detailed design interaction between MTS and OU. Also theaddition of high-pressure windows for the LDV system.
• Overall size of the Prototype increased the number of parts and volume ofhardware to build it.
4. MTS continues to support the installation and interfacing of the MTS suppliedhardware with the other subsystems in the FFCF.
5. MTS has trained OU researchers in the operation of the Mechanical and Electricalhardware as planned.
6. Repair of the actuators and modifications to the software were made in September1992.
7. MTS gathered information on the Full Scale Functional Requirements to support OUin the development of cost estimates, project plans, proposals, and technical analysesof the Full Scale Simulator. Specifications for the Full Scale Simulator.Specifications for the Full Scale Simulator were generated.
8. MTS provided mechanical support during the facility move to its current location.9. MTS sent a new application controller program, which featured an additional control
mode.10. MTS sent an Apple / Macintosh utility to investigate the Macintosh operating system
the year 2000 readiness.
A.5 Delivery of the Prototype Hardware
In addition to the on time and on budget delivery of the Prototype Hardware, a significantachievement was the development of the square seals for the platen system.

A-4
A.6 Low Pressure System
MTS used the information gathered from the design and development of the PrototypeHardware to design the Low Pressure System (LPS). MTS focused efforts toward thefollowing activities:1. Develop the functional requirements and mechanical / hydraulic design
specifications for the much larger LPS.2. Develop a plan for securing qualified vendors to fabricate the major mechanical
components of the LPS.
The goal of the LPS was to provide a laboratory-based system to study fracturing fluidsin a large scale, Low Pressure physical model. Three key phenomena's to be studied werefluid behavior, fluid leakoff, and proppant transport.Considerable effort was expended in developing the functional requirements for the LPSsince the design included a much larger apparatus. The Low Pressure System was neverconstructed based on many financial and commercial issues.

B-1
Appendix BFINAL SUBCONTRACTOR REPORT FROM
HALLIBURTON ENERGY SERVICES
B.1 Overall Project Objective
Halliburton Energy Services (HES) is known worldwide as a leading supplier of oilfieldproducts and services. For this reason, HES (then known as Halliburton Services) wasselected to participate as a member of the Fracturing Fluid Characterization Facility(FFCF) Project team. HES was awarded Subcontract No.1991-12 by the University ofOklahoma to delineate its project responsibilities. HES was charged with providingconsultation services, chemicals and materials for formulating fluids, and equipment forfluid mixing, pumping, and conditioning. These services, materials and equipment wereto be provided in support of a large-scale test facility dedicated to quantifying thebehavior of fracturing fluids and slurries under conditions approximating those found infield operations.
As an initial step in meeting the long-term objectives of the project, HES workedwith the University of Oklahoma (OU) and the other subcontractors to prepare thesuccessful bid submitted to GRI. HES collaborated with OU and the subcontractors todevelop the Functional Requirements for the high-pressure fracture simulator (HPS) andto define measurements needed to characterize the behavior of fracturing fluids.
Since project inception, HES has provided assistance to help the FFCF become afacility that is recognized world wide as a center of excellence for fluid propertycharacterization.
B.2 Scope of Activities
HES provided valuable insight concerning industry practices during formulation of thebid proposal and during the project feasibility study conducted in the first year.
HES worked with other project team members (MTS, OU, and RE/SPEC) todevelop the Functional Requirements for the high-pressure fracture simulator (HPS).Laboratory assistance was provided during formulation and evaluation of simulatedfracture surfaces (facings) to be used in the HPS.
Fluid mixing, handling, and pumping equipment were made available to thefacility through a lease agreement. A high-pressure throttling valve and a heat exchangerfor fluid preconditioning were made available to the facility through an amortizedpurchase plan. These latter equipment items were custom designed for use at the facility.
Chemicals and proppant for fluid and slurry formulation were made available tothe facility at cost. Equipment maintenance and other supplies (hoses, connectors, etc.)were also made available to the facility at cost.
Engineering and operations personnel were provided on a cost sharing basis toassist with the execution of testing designed to meet the requirements set forth in thevarious verification and research plans.
Engineering assistance with the analysis of data was also provided until thefacility could become fully staffed.

B-2
HES played a major role in technology transfer by assisting with preparation andpresentation of technical papers, preparation of technical bulletins, contributions toannual reports to GRI, preparation and presentation of short course materials, and thepreparation and presentation of research results to Technical and Project AdvisoryGroups.
B.3 Work Performed
Activities tabulated in this section are not to be construed as an exhaustive list of thework performed by Halliburton Energy Services (HES). Activity descriptions that followsimply show the depth to which HES was involved and committed to the success of thisproject. As of September 30, 1998, HES had provided $1,278,650.00 in co-funding tothe project.
HES worked with other project team members to develop the FunctionalRequirements for the prototype simulator and other proposed successor simulators. Sincesuccessor simulators were not fabricated, the prototype was placed in service as the HighPressure Simulator (HPS). Industry thoughts and ideas concerning fracture geometrywere conveyed to the team during the development of a simulator design. Guidance wasprovided concerning any compromises that would be required. Pressure, temperature,and other design considerations were also addressed using the experience base offered byHES.
HES worked with RE/SPEC, OU Environmental Safety Services, Oklahoma StateDepartment of Health, and the City of Norman to gain approval for the disposal ofeffluent from broken crosslinked fracturing fluids and slurries into the sanitary sewersystem.
During the project feasibility study, a critical review of rheological models beingused in the petroleum industry was undertaken by the rheology team composed ofmembers from OU and HES. As expected, the power-law model was found to be themost widely used for fluids without yield stress. The three-parameter Ellis model wasused to some extent for these same fluids when attempting to cover a wide shear raterange. For fluids exhibiting a yield stress, the two-parameter Bingham plastic model andthree-parameter Herschel-Bulkley model were both used frequently by the industry.
Mathematical expressions were developed which permit calculation of theuncertainty in derived rheological parameters such as shear rate, shear stress, andapparent viscosity. These expressions permit sensitivity studies to be performed todetermine the accuracy needed in measurement of flow rate, pressure loss, and fracturewidth.
Polyethylene glycol (Polyol or Carbowax 8000) and corn syrup solutions wereevaluated in HES Duncan to determine which would be the most suitable as a Newtoniancalibration fluid for the HPS. Corn syrup solutions were selected because they providedthe highest viscosity at 180 F without creating handling and disposal problems at ambientconditions.
A feasibility study was made to determine the possibility of investigating foamedfracturing fluids at the facility. Using phase diagrams, CO2 foams created under field likeconditions were shown to undergo an approximate six-fold expansion while being heated

B-3
to 250 F at simulator operating pressures. The resulting low-density CO2 foam would notbe representative of those being applied in the field. Expansion of N2 foams was shown tobe less severe, but their evaluation would still be limited to the 1200 psi working pressureof the HPS.
Assistance was provided with definition and selection of instrumentation(pressure transducers, temperature probes, flow meters, and densiometers) for thecharacterization of fracturing fluid and slurry behavior in the HPS. Additionally,guidance was provided during the selection of laboratory rheometers for the bench topcharacterization of fluid behavior.
LDV (Laser Doppler Velocimetry) technology was evaluated in Duncan at theRheology Lab using a transparent slot model. A caliper was modified to measure theactual width during testing. Fluids and slurries evaluated were a 40 lb/Mgal guarsolution, 40 lb/Mgal crosslinked gel, and a 40 lb/Mgal crosslinked gel slurry containingvarious sand concentrations up to 10 lb/gal. A core wafer was also set in place on oneside of the slot to evaluate the possibility of filter-cake thickness measurement with theLDV.
An extensive effort was made with assistance from HES to determine the viabilityof cement facings for use in the HPS. Fluid loss experiments performed in Duncan withcore wafers uncovered a problem with the bonding of fiber optics to the cement matrix.It was necessary to bond fiber optics within the facings to have a functional visionsystem. Application of a resin coating to the embedded fibers was found to be a solutionto this problem. Cement facings were found to possess an extremely low and time-dependent permeability and were therefore abandoned in favor of a resin-sand compositematerial. At a later time, assistance was also provided in locating a source of natural rockfor use as facing material in fluid loss tests.
A quartz pressure transducer and operating software were leased to OU on ashort-term basis. This device was used as a pressure reference during the development ofa fiber optic pressure transducer. A test fixture for mounting and evaluating the devicewas also developed and supplied to the team by HES.
Pilot-plant scale equipment were leased to the facility for fluid/slurry mixing,handling and pumping during low-pressure testing. Field-scale fluid/slurry mixing,handling, and pumping equipment were renovated and leased to the facility for high-pressure testing. On May 1, 1999, previously leased equipment were donated to theUniversity.
Experiments were performed in Duncan to determine if neutron particles could beused to detect the presence of sand and borate-crosslinked gel filter cake sandwichedbetween two 5-inch thick steel slabs. The technique appeared to be feasible, but wouldrequire a much stronger neutron source to minimize the exposure time required.
A throttling valve was designed and fabricated for use as either a flow splitter or abackpressure regulator. Valve operation and slurry erosion resistance were evaluated byHalliburton in Duncan prior to delivery to the facility. The valve has been used routinelyto maintain 1000 psi pressure within the HPS slot during dynamic fluid loss tests.
A flow system was developed for measuring the simultaneous fluid leak-off frommultiple facings. Flow meters in this system were selected based on the expectation thatthe filtrate would be low viscosity. Unfortunately, during the first evaluation of this

B-4
apparatus, the filtrate was very viscous and plugged the flow meters. The apparatusremains available if another attempt is made to address fluid loss on this scale.
Dynamic fluid loss in the HPS was modeled to determine if it would be possibleto detect an increase in polymer concentration over the length of the HPS. Modelingbased on steady-state behavior indicated that a significant build-up in polymerconcentration should be observed with a 40 lb/Mgal polymer solution flowing at 10 sec-1
through a ¼-inch gap width.Dynamic fluid loss experiments were performed in the laboratory using samples
of the HPS facing material. Fluid loss parameters obtained from these small surface areasamples were compared to those obtained from the large surface area facings found in theHPS. Wall-building coefficients from the HES laboratory experiments were found to besimilar to those determined using the HPS facings. However, spurt-loss values from thelaboratory experiments were found to be generally larger.
HES worked with its coiled tubing supplier, Quality Tubing Inc., to obtain adonation of 5000-ft of 1 ½-inch tubing for the facility. The tubing was supplied on two2000-ft reels and one 1000-ft reel. The tubing serves as a wellbore simulator andprovides shear history conditioning for fluids and slurries evaluated in the HPS.
A vertical, concentric-pipe, heat exchanger was fabricated and evaluated inDuncan prior to moving it to the test facility on the OU North Campus. The heatexchanger serves as a formation simulator that elevates the temperature of test fluids andslurries prior to their evaluation in the HPS. Heat transfer properties of fracturing fluidsand slurries have also been investigated using data collected during operation of theexchanger.
Recommendations were made concerning a method for converting the visionsystem to a device for determining the spatial proppant concentration profile in the HPS.The instrumentation team subsequently adopted these recommendations and a method fordetermining proppant concentration was developed based on digital image processing.
A proposal was made for using variations in platen hydraulic pressure as a meansfor determining the normal stress exerted by viscoelastic crosslinked fracturing gels. Itwas proposed that these measurements could and should be collaborated with the normalstress measuring capabilities of the Bohlin rheometer.
HES engineering and operations personnel were directly responsible for thedesign and execution of literally hundreds of tests performed at the facility during its firstfew years of operation. However, with increased staffing and training, the facility hasgradually become self-sufficient and currently requires very little, if any, direct assistancefrom HES.
HES personnel participated in the preparation and presentation of an industryshort course entitled “Impact of Fracturing Fluids on Stimulation Design.” This shortcourse was co-sponsored by GRI and OIPA and had 84 participants.
HES authors have collaborated in the preparation and /or presentation of 14technical papers and/or publications on behalf of the FFCF. HES personnel participatedroutinely in the preparation and presentation of research results to TAG and PAGAdvisory Groups. HES has routinely contributed to Monthly and Annual Reports toGRI. HES has also made a substantial contribution to the Final Project Report to GRI.