renewables integration in india 2021
TRANSCRIPT

Renewables Integration in India

The IEA examines the full spectrum of energy issues including oil, gas and coal supply and demand, renewable energy technologies, electricity markets, energy efficiency, access to energy, demand side management and much more. Through its work, the IEA advocates policies that will enhance the reliability, affordability and sustainability of energy in its 30 member countries, 8 association countries and beyond.
Please note that this publication is subject to specific restrictions that limit its use and distribution. The terms and conditions are available online at www.iea.org/t&c/
This publication and any map included herein are without prejudice to the status of or sovereignty over any territory, to the delimitation of international frontiers and boundaries and to the name of any territory, city or area.
International Energy Agency Website: www.iea.org
IEA member countries:
Australia Austria BelgiumCanadaCzech Republic DenmarkEstoniaFinland France Germany Greece HungaryIreland ItalyJapanKorea Luxembourg Mexico Netherlands New Zealand NorwayPoland Portugal Slovak Republic Spain Sweden Switzerland Turkey United Kingdom United States
The European Commission also participates in the work of the IEA
IEA association countries:
BrazilChinaIndiaIndonesiaMoroccoSingaporeSouth AfricaThailand
INTERNATIONAL ENERGYAGENCY

PAGE | 3
National Institution for Transforming India The National Institution for Transforming India, also called NITI Aayog, was formed via a resolution of the Union Cabinet on January 1, 2015. NITI Aayog is the premier policy ‘Think Tank’ of the Government of India, providing both directional and policy inputs. While designing strategic and long term policies and programmes for the Government of India, NITI Aayog also provides relevant technical advice to the Centre and States.
At the core of NITI Aayog’s creation are two hubs –Team India Hub and the Knowledge and Innovation Hub. The Team India Hub leads the engagement of states with the Central government, while the Knowledge and Innovation Hub builds NITI’s think-tank capabilities. These hubs reflect the two key tasks of the Aayog. NITI Aayog is also developing itself as a State of the Art Resource Centre, with the necessary resources, knowledge and skills, that will enable it to act with speed, promote research and innovation, provide strategic policy vision for the government, and deal with contingent issues.
More information about the NITI Aayog can be found at: http://niti.gov.in.
Renewables Integration in India 2021 Abstract
PAGE | 4
Abstract
This report suggests ways for India to maximise the amount and value of solar and wind power in its electricity system. It addresses demand-side flexibility, power plant flexibility, storage (pumped-storage hydro and batteries) and grid flexibility, as well as policy, market and regulatory solutions for the short to medium term. It adds to existing research by focusing on renewable integration in individual states, rather than at the national level, as the power system flexibility challenges, solutions and priorities are different in each state. The report presents findings from consultations with national and regional stakeholders and the results of parallel in-depth analysis, including two newly developed, detailed power sector production cost models developed at the IEA to illustrate flexibility challenges and solutions specific to the India context – the five-region India Regional Power System Model and the Gujarat State Power System Model.
Renewables Integration in India 2021 Foreword
PAGE | 5
Foreword India has made remarkable progress in recent years bringing energy services to its citizens. In less than two decades, 900 million people have gained access to electricity – including 100 million in 2018 alone – and the country’s energy demand has more than doubled over the same period. But India’s per capita electricity consumption is still only one-third of the global average.
Such steep growth in energy demand inevitably poses challenges for this diverse and dynamic nation, particularly to establishing the policy and market conditions to provide secure, affordable and clean energy for all its people. To facilitate these goals, the International Energy Agency (IEA) has developed a close working relationship with the National Institution for Transforming India (NITI Aayog). Together, they have produced a series of reports and held workshops to support India in its quest to provide much-needed energy to its economy and people while minimising the associated environmental impacts.
Renewables Integration in India 2021 is the latest result of our collaboration with NITI Aayog. This report suggests ways for India to securely maximise the amount and value of solar and wind power in its electricity system. The Government of India plans to increase renewable electricity capacity to 175 GW by 2022 and to 450 GW by 2030, but even faster growth will be needed in the following decades to meet ongoing growth in demand and reach climate targets. The Renewables Integration report explores pathways for bringing greater flexibility to the entire electricity system. It also suggests policy, market and regulatory measures to incentivise renewables and ease their integration into the energy system.
This joint project with NITI Aayog drew on the IEA’s expertise in modelling to focus on renewable power in individual Indian states, rather than at the national level, since the challenges, solutions and priorities differ across the country. Some Indian states already derive a larger share of power from renewable sources than some entire countries, although a number of states are facing challenges in smoothly integrating the variable electricity output.
Because of its size and the dynamism of its economy, India has a key role to play in the world’s transition to a clean energy future. India faces unique challenges to meet the demands of its citizens, and I’m hopeful that our work with NITI Aayog can help guide the way towards a successful expansion of renewables in India’s energy mix.
Dr. Fatih Birol
Executive Director
International Energy Agency
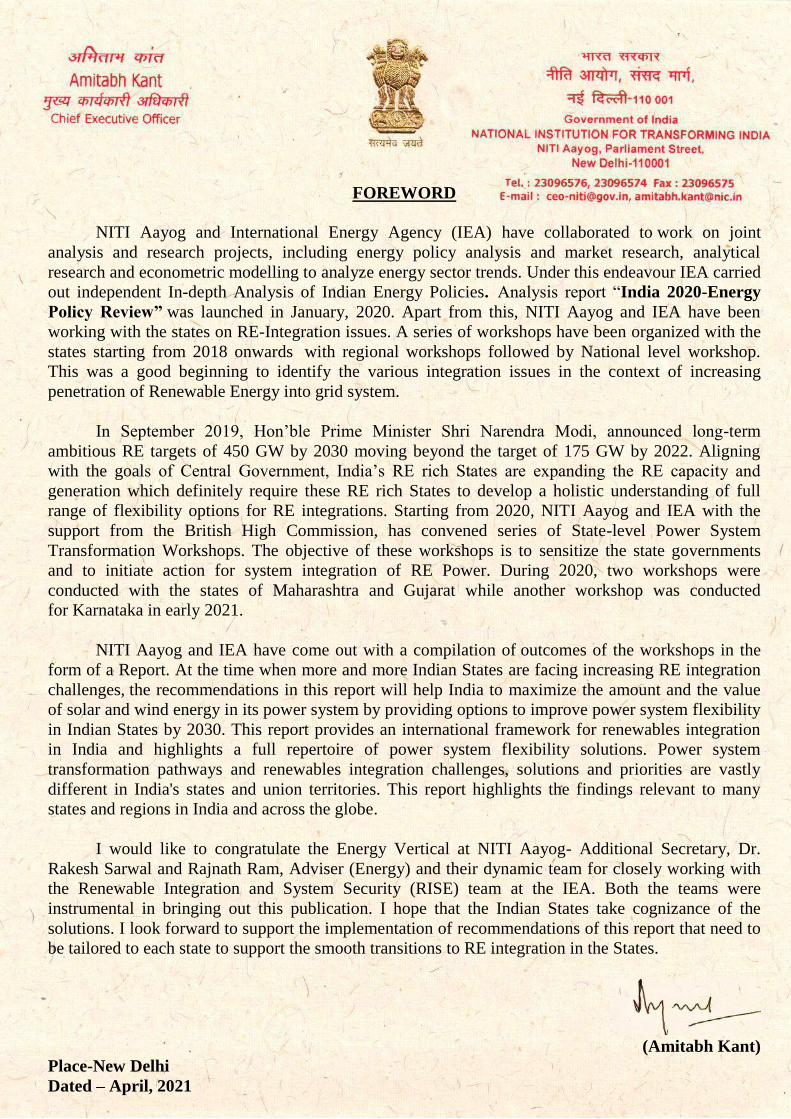
FOREWORD
NITI Aayog and International Energy Agency (IEA) have collaborated to work on joint
analysis and research projects, including energy policy analysis and market research, analytical
research and econometric modelling to analyze energy sector trends. Under this endeavour IEA carried
out independent In-depth Analysis of Indian Energy Policies. Analysis report “India 2020-Energy
Policy Review” was launched in January, 2020. Apart from this, NITI Aayog and IEA have been
working with the states on RE-Integration issues. A series of workshops have been organized with the
states starting from 2018 onwards with regional workshops followed by National level workshop.
This was a good beginning to identify the various integration issues in the context of increasing
penetration of Renewable Energy into grid system.
In September 2019, Hon’ble Prime Minister Shri Narendra Modi, announced long-term
ambitious RE targets of 450 GW by 2030 moving beyond the target of 175 GW by 2022. Aligning
with the goals of Central Government, India’s RE rich States are expanding the RE capacity and
generation which definitely require these RE rich States to develop a holistic understanding of full
range of flexibility options for RE integrations. Starting from 2020, NITI Aayog and IEA with the
support from the British High Commission, has convened series of State-level Power System
Transformation Workshops. The objective of these workshops is to sensitize the state governments
and to initiate action for system integration of RE Power. During 2020, two workshops were
conducted with the states of Maharashtra and Gujarat while another workshop was conducted
for Karnataka in early 2021.
NITI Aayog and IEA have come out with a compilation of outcomes of the workshops in the
form of a Report. At the time when more and more Indian States are facing increasing RE integration
challenges, the recommendations in this report will help India to maximize the amount and the value
of solar and wind energy in its power system by providing options to improve power system flexibility
in Indian States by 2030. This report provides an international framework for renewables integration
in India and highlights a full repertoire of power system flexibility solutions. Power system
transformation pathways and renewables integration challenges, solutions and priorities are vastly
different in India's states and union territories. This report highlights the findings relevant to many
states and regions in India and across the globe.
I would like to congratulate the Energy Vertical at NITI Aayog- Additional Secretary, Dr.
Rakesh Sarwal and Rajnath Ram, Adviser (Energy) and their dynamic team for closely working with
the Renewable Integration and System Security (RISE) team at the IEA. Both the teams were
instrumental in bringing out this publication. I hope that the Indian States take cognizance of the
solutions. I look forward to support the implementation of recommendations of this report that need to
be tailored to each state to support the smooth transitions to RE integration in the States.
(Amitabh Kant)
Place-New Delhi
Dated – April, 2021
Renewables Integration in India 2021 Acknowledgements, contributors and credits
PAGE | 7
Acknowledgements, contributors and credits
The analysis for this report began in 2018, and draws upon IEA team visits to India for a series of Power System Transformation Workshops between 2018 and 2020, and virtual workshops in 2020 and 2021, organised in association with NITI Aayog. In New Delhi, Chennai, Pune, Kolkata, Mumbai and Gujarat, the IEA team met with government officials, state regulators, industry associations, and stakeholders in the public and private sectors as well as other organisations and interest groups, all of which helped the team identify the challenges facing the power sector. The IEA and NITI Aayog are grateful for the hospitality, high-quality presentations, co-operation and assistance of more than 250 people throughout the analysis, workshops and visits. Thanks to their engagement, openness and willingness to share information, the Power System Transformation Workshops were informative, productive and enjoyable.
The IEA’s gratitude goes to NITI Aayog, specifically Dr Rakesh Sarwal (Additional Secretary), Mr Rajnath Ram (Adviser – Energy) and Mr Manoj Kumar Upadhyay (Deputy Adviser). Our appreciation extends to our workshop partners who facilitated the individual workshops:
• For the Maharashtra workshop, the Prayas Energy Group led by Mr Ashwin Gambhir and Mr Srihari Dukkipati.
• For the Gujarat workshop and power sector modelling, the Centre for Energy Regulation (IIT Kanpur) led by Dr Anoop Singh.
• For the Karnataka workshop, the Center for Study of Science, Technology and Policy (CSTEP) led by Mr Abhishek Nath.
The following officials have shown immense leadership and co-operation throughout the process of the workshops and in reviewing the analysis:
• Mr Arun K. Mishra (Director, National Smart Grid Mission), Mr S. R. Narasimhan (Director, System Operation, POSOCO) and Mr Soonee Sushil Kumar (Advisor, POSOCO).
• From the Government of Maharashtra, Mr Dinesh Waghmare (Principal Secretary – Energy Department, Chairman and Managing Director, MSETCL), Mr Subhash Dumbare (Director General, MEDA), Ms Shaila A. (former Chairman and Managing Director, Mahagenco), Mr Prashant Badgeri (Deputy Secretary, Energy Department), Mr Abhijit Deshpande (Secretary, MERC), Mr Satish Chavan

Renewables Integration in India 2021 Acknowledgements, contributors and credits
PAGE | 8
(Director – Commercial, MSEDCL) and Mr Manoj Pise (General Manager, Coordination).
• From the Government of Gujarat, Ms Sailaja Vacchrajani (General Manager IPP and RE, GUVNL), Mr B. N. Trivedi (Chief Engineer Project, GETCO), Mr A. B. Rathod (Additional Chief Engineer, Gujarat SLDC), Mr Dipak H Patel (Deputy Engineer, STU, GETCO), Mr J. J. Gandhi (Chief Engineer, PGVCL) and Mr Anand Kumar (Chairman, GERC).
• From the Government of Karnataka, Mr Kapil Mohan (former Additional Chief Secretary, Energy Department), Dr N. Manjula (Managing Director, KPTCL), Ms G. Sheela (former General Manager – DSM, BESCOM) and Mr P. Krishnamurthy (Chief General Manager – Operations, BESCOM).
Mr Tarun Khanna of the Hertie School made a significant contribution in setting up the Gujarat State Power System Model, as well as providing analysis on agricultural demand shifting. The analysis also benefited from the contribution of Mr Thomas Spencer of The Energy and Resources Institute (TERI), Dr Nikit Abhyankar of the Lawrence Berkeley National Laboratory (LBNL) and Dr Gabrielle Kuiper. The analysis, workshops and report benefited from the co-ordination and financial contribution of the UK Government Foreign, Commonwealth and Development Office, British High Commission. The report was prepared under the oversight of the IEA Acting Head of Renewables Integration and Secure Electricity (RISE), Dr Alejandro Hernandez. The Clean Energy Programme management, analysis and report drafting was led by Ms Szilvia Doczi (lead author), the power system modelling was led by Dr Zoe Hungerford (lead author), and significant work has been carried out by Ms Astha Gupta, Mr Kartik Veerakumar, Mr Ramit Debnath and Ms Anna Kalista. Government relations were co-ordinated by the India Programme Manager, Ms Nicole Thomas, with the invaluable assistance of Ms Astha Gupta, who supported the analysis, workshop and drafting of the report as the IEA’s India consultant in New Delhi.
The report benefitted from expert review and suggestions from Ms Sailaja Vachhrajani (GUVNL), Mr Dipak H. Patel (GETCO), Mr A. B. Rathod (SLDC), Mr B. A. Gandhi (GSECL), Mr Ashwin Gambhir (Prayas), Dr Anoop Singh (CER, IIT Kanpur), Mr Abhishek Nath (CSTEP), Mr Milind Ravindranath (CSTEP), Mr Harikrishna K. V. (CSTEP), Mr Christopher Westling (CPUC), Ms Erica Petrofsky (CPUC), Mr Akhilesh Magal (GERMI), Mr Abhinav Goyal (World Bank), Dr Vaibhav Chaturvedi (CEEW), Ms Poulami Choudhury and Ms Reshmi Ranjith (BHC), Mr Reji Kumar and Ms Reena Suri (India Smart Grid Forum), Mr Joerg Gaebler (GIZ), Mr Ramaswamy K. V. (Ampacimon), Mr Tarun Khanna (Hertie School), Ms Ruth Ku and Dr Nikit Abhyankar (US FRI), Mr David Palchak (NREL), Mr Sunil Kumar Sharma (GIZ), Mr Edmund Andrew (Arup), Dr Emanuele Taibi (International Renewable Energy Agency), Mr Deepak Krishnan and Mr Tirthankar

Renewables Integration in India 2021 Acknowledgements, contributors and credits
PAGE | 9
Mandal (World Resources Institute), and from the IEA: Mr Keisuke Sadamori, Mr Laszlo Varro, Mr Simon Mueller (former IEA), Dr Peerapat Vithayascrichareon, Dr Jacques Warichet, Mr Craig Hart, Ms Randi Kristiansen, Ms Vida Rozite, Mr Enrique Gutierrez, Dr Peter Zeniewski, Ms Insa Handschuch, Dr Stefan Lorenczik and Mr Brent Wanner.
The authors would also like to thank Ms Elspeth Thomson and Mr Justin French-Brooks for skilfully editing the manuscript and the IEA Communication and Digital Office, in particular Ms Astrid Dumond, Ms Therese Walsh and Ms Isabelle Nonain-Semelin, for their assistance.

Renewables Integration in India 2021 Table of contents
PAGE | 10
Table of contents Executive summary ................................................................................................................ 12
India’s energy demand is growing rapidly ............................................................................ 12
High renewables increasingly challenge the power system ................................................. 12
Indian states should leverage all potential sources of power system flexibility to maximise the value of solar and wind ................................................................................................... 14
Policy and tariff reforms can tap into demand response potential ....................................... 14
Rooftop solar systems need to be monitored and managed ................................................ 15
New regulatory and policy frameworks can activate more flexibility from storage and power plants ..................................................................................................................................... 16
Inter-state trading still faces barriers; changes to wholesale markets and power purchase agreements can remove key barriers ................................................................................... 17
Flexibility reduces curtailment, and lower curtailment means reduced system operating costs and lower CO2 emissions ............................................................................................ 18
India’s clean electricity path ................................................................................................. 20 Historical progress towards India's ambition to integrate 450 GW of renewables by 2030 . 20
Variable renewables become dominant across all major pathways..................................... 20
Integrating renewables in India will require action at both the central and state level ......... 22
India’s states are at the forefront of RE Integration globally ................................................ 23
The global IEA framework for understanding renewables integration challenges ............... 25
Power sector modelling provides system-specific insights................................................... 28
Renewables integration challenges ..................................................................................... 30
India’s states face many local RE integration challenges .................................................... 30
How high shares of solar and wind challenge the status quo .............................................. 33
Flexibility lowers curtailment, and lower curtailment comes with reduced system operating costs and lower CO2 emissions ............................................................................................ 35
Curtailment and investments ................................................................................................ 37
Renewables integration solutions ........................................................................................ 40
Power system flexibility now and in 2030 ............................................................................. 40
Demand-side flexibility becomes a top priority ..................................................................... 41
Power plant flexibility remains a largely untapped potential for states today ....................... 60
Batteries and pumped storage hydro can improve system flexibility but regulatory framework is missing ............................................................................................................ 62
System strength and inertia may need attention in some states before 2030 ..................... 65
Inter-state trading still faces technical and economic barriers ............................................. 69
Renewables Integration in India 2021 Table of contents
PAGE | 11
Policy recommendations ....................................................................................................... 79
Curtailment ............................................................................................................................ 79
Demand response ................................................................................................................. 80
Rooftop solar ......................................................................................................................... 80
Tariff reforms and introduction of time-of-use tariffs ............................................................. 81
Energy storage ...................................................................................................................... 81
Flexibility of coal plants ......................................................................................................... 82
Inter-state trade and wholesale market reforms ................................................................... 82
Recognising environmental concerns with flexibility ............................................................ 83
System strength and inertia .................................................................................................. 83
Annex: Power system modelling and methodology .......................................................... 84
References .............................................................................................................................. 87
Abbreviations and acronyms ................................................................................................ 90
Units of measure .................................................................................................................... 90

Renewables Integration in India 2021 Executive summary
PAGE | 12
Executive summary
India’s demand for energy is growing rapidly
India is the third largest energy-consuming country in the world. It has become one of the largest sources of energy demand growth globally and has made significant progress towards its universal electrification target for residential users, with 100 million people gaining access in 2018 alone. Per capita electricity consumption across the 28 Indian states and eight union territories is still around a third of the world average, and is expected to continue increasing despite the government’s intention to pursue strong energy efficiency standards, including LED lighting, efficient cooling and building standards. Total Indian electricity demand has begun to expand again following a significant decline in 2020 due to Covid-19. The pandemic has affected the financial viability of the electricity distribution companies (DISCOMs), which were already struggling with mounting debts and a liquidity crunch.
India faces three principal challenges: (1) how to expand reliable energy access and use while maintaining affordability for consumers and financial stability for the DISCOMs; (2) how, at the same time, to integrate increasing shares of renewable energy in a secure and reliable manner; and (3) how to reduce emissions to achieve ambitious social and climate objectives while meeting economic goals.
Growing renewables increasingly challenge the power system
Renewable energy penetration is highly variable by state in India. The share of solar and wind in India’s ten renewables-rich states (Tamil Nadu, Karnataka, Gujarat, Rajasthan, Andhra Pradesh, Maharashtra, Madhya Pradesh, Telangana, Punjab and Kerala) is significantly higher than the national average of 8.2%. Solar and wind account for around 29% of annual electricity generation in Karnataka, 20% in Rajasthan, 18% in Tamil Nadu and 14% in Gujarat (financial year [FY] 2020/21). India’s renewables-rich states already have a higher share of variable renewable energy (VRE) than most countries internationally. As a result, many states are already facing system integration challenges.

Renewables Integration in India 2021 Executive summary
PAGE | 13
Countries and regions in phases of renewables integration, 2019
IEA. All rights reserved.
* 2018 values. Sources: IEA, Renewables 2020; IITK Energy Analytics Lab.
Furthermore, in the coming decade the Indian power system is due to undergo an even more profound transformation. The government plans to increase renewable generating capacity from 175 GW in 2022 to 450 GW in 2030. Some state leaders have expressed concern that they will face excess VRE generation and the need to: (1) export significantly more power to other states; (2) allow renewables to displace some coal power plants locally; or (3) curtail more solar and wind to ensure system security. Recent trends underlying the main renewables integration challenges include the increasing variability of hourly demand, increasing ramping requirements due to the impact of solar on net demand, short-term frequency variations and local voltage issues.
While the Power System Operation Corporation (POSOCO), a wholly owned public sector undertaking under the Ministry of Power, highlighted that national-level inertia has declined slightly from the 2014 level at certain times, India does not yet face system inertia challenges. However, with future increases in solar and wind power, the renewables-rich states will experience periods when wind and solar make up the majority of generation, and it will then become imperative to monitor local system strength and inertia requirements. The report covers important international experience in managing systems with declining inertia levels.
0%
10%
20%
30%
40%
50%
60%
% V
RE
in a
nnua
l ele
ctric
ity g
ener
atio
n
Phase 1 - No relevant impact on system Phase 2 - Minor to moderate impact on system operation
Phase 3 - VRE determines the operation pattern of the system Phase 4 - VRE makes up almost all generation in some periods

Renewables Integration in India 2021 Executive summary
PAGE | 14
Indian states should leverage all potential sources of power system flexibility to maximise the value of solar and wind
This report highlights potential sources of power system flexibility in renewables-rich Indian states, including demand-side flexibility, power plant flexibility, storage (pumped-storage hydro and batteries) and grid flexibility, as well as policy, market and regulatory solutions that can be implemented in the short to medium term until 2030. The optimal mix of flexibility resources needs to be determined for each state, taking into account the regional and national context. For example, there are trade-offs between investing in batteries, pumped-storage hydro, demand response and coal power plants that depend upon the existing generation and demand profiles of each system. This report fills a gap in the international literature by focusing on renewables integration in individual states, rather than at the national level in India. It builds on the ongoing power sector stakeholder engagement that the IEA and NITI Aayog have been leading since 2018, including the outcomes of a series of workshops in recent years – one national, four regional and three state level – and the related in-depth analysis. The report also draws on two detailed production cost models developed by the IEA to illustrate flexibility challenges and solutions: a five-region India Regional Power System Model and a Gujarat State Power System Model. Power system flexibility challenges, solutions and priorities are very different in each state. This report highlights the findings applicable to multiple states in India, and potentially across the globe.
Policy and tariff reforms can tap into demand response potential
Power system transformation in India will be supported by the transformation of electricity demand from passive consumption to more proactive participation by demand sectors. Agricultural users already play an important role in balancing power supply and demand through involuntary irrigation load shifting, and the IEA analysis foresees more active participation from the agricultural sector, buildings (including cooling) and industry by 2030.
The existing agricultural demand shift from high to low demand hours already provides a significant source of low-cost power system flexibility in India, and has assisted some states in reaching high levels of solar and wind penetration without major system events. This shift has been largely enabled by the availability and use of existing distribution networks dedicated to agricultural users in certain states, which allow the system operator to control irrigation loads without impacting other grid users. Looking ahead, transitioning from involuntary

Renewables Integration in India 2021 Executive summary
PAGE | 15
agricultural demand shift to proactive agricultural demand response (e.g. active response to a price signal) can be one of the most cost-effective solutions to improve power system flexibility, although its use must be balanced against the potential impact on the water stress of each region.
Impact of agricultural demand shift on total demand and solar generation absorption
IEA. All rights reserved.
Notes: PSH = pumped-storage hydro; PV = photovoltaic. Sources: IEA, Gujarat State Power System Model and analysis based on Khanna (2021).
Time-of-day (or time-of-use) tariffs for industry are offered in most states as the basis of the existing industrial demand response incentive. In the medium to longer term, a shift towards time-of-use tariffs as the default option is recommended, following the rollout of advanced metering infrastructure, for the activation of demand response potential from buildings and transport (such as cooling and electric vehicle [EV] smart charging). On the residential side, shifting towards advanced digital metering, automation and smart home appliances is a prerequisite, whilst ensuring cybersecurity and avoiding proprietary standards that could limit interoperability and consumer choice.
Rooftop solar systems need to be monitored and managed
State system operators and DISCOMs are concerned about the rise of rooftop solar systems, due to their impact on DISCOM financial stability (from revenue loss), distribution system issues (from reactive power, voltage impacts and reverse power flows) and demand forecast uncertainty. This report highlights international experiences, illustrating how these can become system-friendly
0
5
10
15
20
25
30
35
29 Apr00:00
29 Apr12:00
30 Apr00:00
30 Apr12:00
01 May00:00
01 May12:00
02 May00:00
02 May12:00
Generation/load (GW)Limited flexibility 2030
Nuclear Coal Gas Hydro PSH
Wind Solar PV VRE curtailment Energy purchase Load
0
5
10
15
20
25
30
35
29 Apr00:00
29 Apr12:00
30 Apr00:00
30 Apr12:00
01 May00:00
01 May12:00
02 May00:00
02 May12:00
Agricultural shift 2030
Renewables Integration in India 2021 Executive summary
PAGE | 16
assets and support the low-voltage network with voltage stability and reactive power. To improve the visibility of rooftop solar assets in India, connection codes need to stipulate the registration of individual systems, with state- and national-level registers of these assets. The rooftop solar database should first be built in states. Later, a national-level standardised interface and data model can bring more efficiency and transparency. Requiring all rooftop solar customers to be on time-of-use tariffs can help mitigate the revenue loss suffered by DISCOMs while also balancing the shift in costs between consumers with rooftop solar and consumers without it. Regularly revisiting time-of-use timeslots will be required as rooftop solar additions and demand response reshape the state demand curves.
New regulatory and policy frameworks can activate more flexibility from storage and power plants
Most states are concerned about the future role of existing coal-fired power plants. Coal plants are expected to operate less as renewable technologies supply more generation, which leads to reduced revenues. At the same time, to operate flexibly and meet stricter emissions standards, some coal plants may also require further investment. Such investment needs to be weighed against investment in flexibility sources in other parts of the system (storage, demand and grids) and emission reduction targets. Government officials are also concerned that historical dependence on long-term power procurement contracts as the tool for ensuring capacity adequacy creates an economic burden by locking in long-term fixed capacity payments to coal power plants.
In the Stated Policies Scenario (STEPS) of the IEA World Energy Outlook (WEO), coal capacity in the Indian power system will increase to 269 GW by 2030 compared to 235 GW in 2019. The analytical results of the IEA India Regional Power System Model show that the use of coal power plants in India will change dramatically by 2030. Use will shift from typically steady baseload operation to frequent operation near minimum and maximum output levels. Coal plants in some states have the potential to better support the integration of high shares of VRE with increased flexibility, such as faster ramp rates, lower technical minimum levels and shorter start-up times. Additional flexibility, however, requires new investment and new compensation designs for these power plants. In contrast to the current tariff structures focused on capacity and energy payments, emphasis should be placed on tariff and market-based compensation for flexibility.

Renewables Integration in India 2021 Executive summary
PAGE | 17
Retrofitting hydropower plants to allow operation in pumped-storage mode seems to be the preferred storage solution in many states in India. However, batteries are also likely to play an important role in India. Analysis by the Lawrence Berkeley National Laboratory suggests that battery storage coupled with solar farms can be a more cost-effective solution than pumped-storage hydro retrofits for morning peaks or evening ramps requiring a storage duration of less than six hours. The optimal sizing and location of battery storage will differ by region and requires detailed studies in each state.
Changes to wholesale markets and power purchase agreements can remove barriers to interstate trade
The current regulatory and market frameworks present significant gaps and barriers for power system flexibility resources, including demand response, batteries, pumped-storage hydro and power plant flexibility. Comprehensively reviewing and removing the wholesale and retail market barriers to new technologies and creating an equal playing field for all resources is an important ongoing task not only in India, but worldwide.
India’s wholesale power trade achieved important milestones in 2020, with improved trading across Indian states and the introduction of real-time markets and green markets. Since 2020 the real-time market has filled an important gap by providing corrections on an hour ahead timeframe for variable and uncertain generation such as solar and wind. The newly established green market enables clients such as the DISCOMs to fulfil the states’ renewable purchase obligations through market purchases.
Analysis based on the IEA India Regional Power System Model suggests that additional power trading across states is an effective renewables integration solution that could reduce curtailment by around 2.5% in the STEPS in 2030. However, significant barriers remain to reach this potential. These include: (1) the lack of transmission capacity available for interstate trade; (2) the low level of liquidity in wholesale markets; and (3) the inflexible existing contractual structures, namely long-term physical purchase power agreements (PPAs) between the DISCOMs and generators (also contributing to the low liquidity).
States will need to weigh the costs and benefits of potential new transmission investment against the costs and benefits of other flexibility options. In India existing long-term physical PPAs represent about 90-95% of total generation. The current practice of using these PPAs to meet resource adequacy requirements may not be the most cost-effective tool for achieving resource adequacy. Existing
Renewables Integration in India 2021 Executive summary
PAGE | 18
PPAs also pose a barrier to improved power system flexibility from both interstate trade and power plant flexibility. Thus, states could consider creating alternative resource adequacy mechanisms and using financial PPAs. In the longer term, a sophisticated financial market for power sector products could be introduced in India.
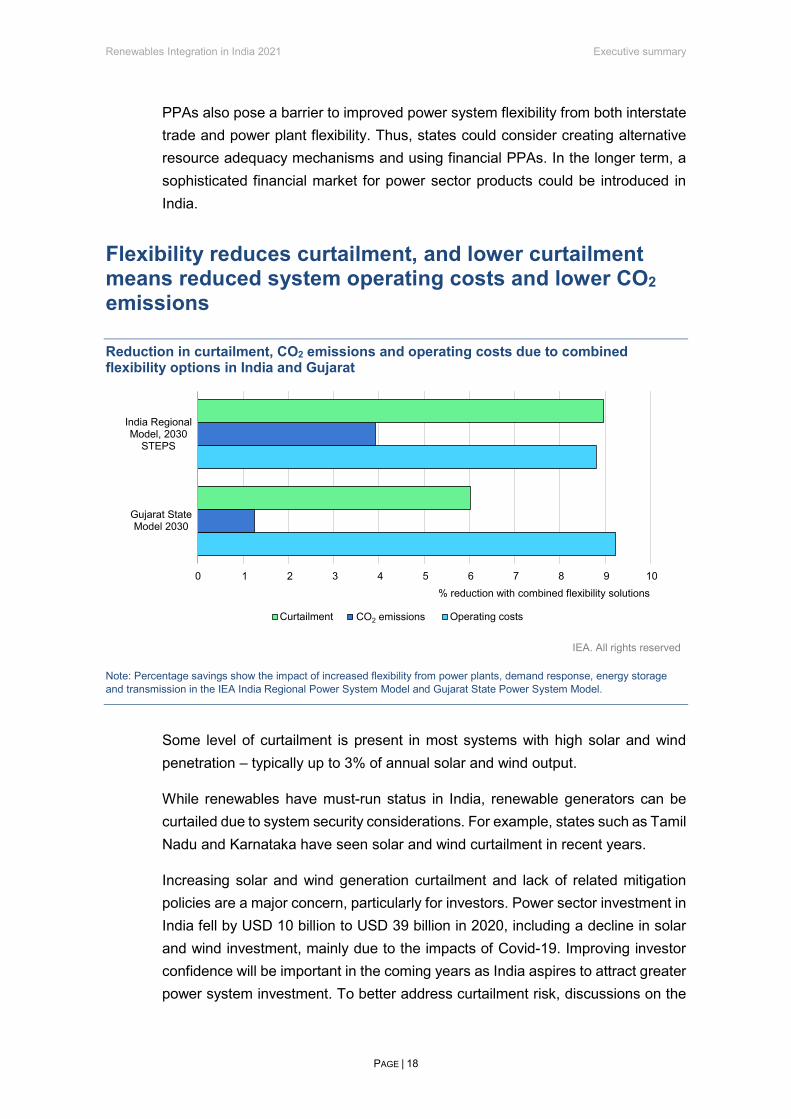
Flexibility reduces curtailment, and lower curtailment means reduced system operating costs and lower CO2 emissions
Reduction in curtailment, CO2 emissions and operating costs due to combined flexibility options in India and Gujarat
IEA. All rights reserved
Note: Percentage savings show the impact of increased flexibility from power plants, demand response, energy storage and transmission in the IEA India Regional Power System Model and Gujarat State Power System Model.
Some level of curtailment is present in most systems with high solar and wind penetration – typically up to 3% of annual solar and wind output.
While renewables have must-run status in India, renewable generators can be curtailed due to system security considerations. For example, states such as Tamil Nadu and Karnataka have seen solar and wind curtailment in recent years.
Increasing solar and wind generation curtailment and lack of related mitigation policies are a major concern, particularly for investors. Power sector investment in India fell by USD 10 billion to USD 39 billion in 2020, including a decline in solar and wind investment, mainly due to the impacts of Covid-19. Improving investor confidence will be important in the coming years as India aspires to attract greater power system investment. To better address curtailment risk, discussions on the
0 1 2 3 4 5 6 7 8 9 10
Gujarat StateModel 2030
India RegionalModel, 2030
STEPS
% reduction with combined flexibility solutions
Curtailment Operating costsCO2 emissions

Renewables Integration in India 2021 Executive summary
PAGE | 19
future of the must-run status of solar and wind must continue. Formulating practical contractual structures and policies related to compensation for curtailment will be critical.
Increasing power system flexibility enables the integration of higher shares of solar and wind generation. As a result, for a given amount of solar and wind capacity, a larger share of renewables can be utilised. This is illustrated in the two models presented in this report. Lower curtailment also brings about the benefits of reduced system operating costs and lower CO2 emissions.

Renewables Integration in India 2021 Renewables integration challenges
PAGE | 20
India’s clean electricity path
Historical progress towards India's ambition to integrate 450 GW of renewables by 2030
This publication provides an international framework for renewables integration in India and highlights potential power system flexibility solutions for Indian power sector stakeholders. It builds on stakeholder engagement led by the IEA and NITI Aayog since 2018, the outcomes of the past national, regional and state-level workshops and the related in-depth analysis. It highlights the findings relevant to many states and regions in India and across the globe.
The country’s power development started with small, isolated power systems. Over the years, these were interconnected to form state-wide grids. In the 1980s the government of India grouped the states into five power regions. The five regional grids today – the Northern, Western, Eastern, Southern and North-eastern – have gradually been connected to form one synchronous interconnection covering the entire country. In 2014 India’s system became the world’s largest operating synchronous grid. Since 2011 the National Green Energy Corridor programme has actively supported the buildout of transmission network infrastructure dedicated to renewables.
Integrating higher shares of VRE, such as wind and solar PV, in power systems is essential to decarbonise the power sector while continuing to meet the growing demand for energy. Thanks to sharply falling costs and supportive policies, solar and wind deployment has expanded dramatically in recent years. India is on the path towards achieving 175 GW of renewables by 2022 and has announced an ambition to reach 450 GW by 2030.
Variable renewables become dominant across all major pathways
The increase in renewable capacity will shift India’s power system from the dominance of coal to renewables. The IEA World Energy Outlook 2020 scenarios look at possible pathways for India to 2030 and 2040. The STEPS shows a pathway based on India’s current policies and announced policy intentions geared to meeting the country’s nationally determined contribution under the Paris Agreement. The Sustainable Development Scenario (SDS) includes additional technical potential for more sustainable development, with a lower share of coal

Renewables Integration in India 2021 Renewables integration challenges
PAGE | 21
and higher shares of solar and wind. In the STEPS, solar and wind reach 344 GW and overtake coal capacity of 269 GW in 2030. The WEO shows over 620 GW of solar and 219 GW of wind capacity in the STEPS, and over 720 GW of solar and 309 GW of wind in the SDS, by 2040. In both scenarios, coal capacity increases up to 2030 and then declines. In the STEPS, coal is at 260 GW by 2040, while in the SDS it is only at 144 GW.
The power supply transformation will significantly alter India’s CO2 emissions and climate targets. CO2 emissions from the energy sector increased from 0.9 Gt CO2 in 2000 to 2.5 Gt CO2 in 2019, in line with the increase in energy demand triggered by strong population growth and industrial development. Over this time period, coal capacity expanded from 63 GW to 265 GW, but the power sector's CO2 intensity declined by 11% to 725 g CO2/kWh. In the STEPS, the CO2 intensity of electricity further falls to 336 g CO2/kWh by 2040, the level of the OECD's average intensity in 2019. The decline is much steeper in the SDS, reaching 319 g CO2/kWh by 2030 and 59 g CO2/kWh by 2040.
The evolution of India's electricity capacity mix in the Stated Policies Scenario and the Sustainable Development Scenario, 2000-2040
IEA. All rights reserved. Source: IEA India Energy Outlook 2021.
There are many possible pathways for India to achieve its renewable targets, but all possible future pathways have one thing in common: high proportions of solar and wind. This in turn creates the need for greater power system flexibility.
Both the STEPS and SDS significantly extend India’s existing power system flexibility. Beyond grid and demand-side flexibility, the supply-side power system flexibility in the WEO scenarios is provided by a combination of batteries (increasing from minimal capacity in 2019 to 34 GW in the STEPS by 2030), hydropower plants
0
250
500
750
1 000
1 250
1 500
1 750
2 000
2000 2010 2020 2030 2040
Inst
alle
d ca
paci
ty (G
W)
STEPS
Coal Nuclear Hydro including PSH Gas Oil Other renewables Wind Solar PV
0
250
500
750
1 000
1 250
1 500
1 750
2000 2010 2020 2030 2040
SDS

Renewables Integration in India 2021 Renewables integration challenges
PAGE | 22
(increasing from 49 GW in 2019 to 76 GW in the STEPS by 2030) some of which is reservoir and pumped-storage, and natural gas (increasing from 28 GW in 2019 to 30 GW by 2030). The optimal combination of these supply-side flexibility options needs further in-depth analysis and depends on whether policy makers would like to optimise for system operating costs and end-user prices, or prefer to take into account emission impacts and other wider social and economic factors. The balance of solar and wind also has implications for power system flexibility needs, with systems relying on solar requiring storage during the day.
Integrating renewables in India will require action at both the central and state level
A large number of government bodies are associated with the Indian power sector, with operational responsibilities entrusted to system operators at various levels. Together, these entities form a very large and complex framework for the power sector. To date, most of the focus in the international literature and IEA analysis has been on renewables integration challenges at the national level. However, the states face several specific challenges. Around 30% of power generation is owned by state governments and 25% by the central government. The remaining 45% is privately owned and delivers electricity to state or privately owned DISCOMs. State institutions, such as state regulators, have complete control over the regulation of state transmission, distribution and retail, as well as electricity tariff setting.
National and state-level players in the Indian electricity sector
IEA. All rights reserved. Note: IPP = independent power producer. Source: IEA, India 2020 Energy Policy Review.

Renewables Integration in India 2021 Renewables integration challenges
PAGE | 23
India’s states are at the forefront of renewables integration globally
The renewables integration challenges, solutions and priorities vary greatly among India's 28 states and eight union territories. The majority of India’s renewable capacity additions take the form of solar and wind, and they will continue to be largely concentrated in the country’s ten most renewables-rich states: Tamil Nadu, Gujarat, Karnataka, Rajasthan, Andhra Pradesh, Maharashtra, Madhya Pradesh, Telangana, Punjab and Kerala. Historically, capacity additions have been dominated by wind, but projects in the pipeline include more solar than wind.
Solar and wind capacity in India's renewables-rich states, February 2021
IEA. All rights reserved. Source: MNRE renewables data.
By the end of February 2021 Tamil Nadu had the highest level of solar and wind capacity (13.8 GW), followed by Gujarat (12.4 GW), Karnataka (12.3 GW), and Rajasthan (9.8 GW).
A good indicator of the degree of challenge in each state is the share of solar and wind in total power generation. In 2021 the ten renewables-rich states represented almost 97% of India's power generation from solar and wind. The annual energy share of solar and wind in these states was significantly higher than the national average of 8.2%. In 2020-21 it was highest in Karnataka (29%), followed by Rajasthan (20%), Tamil Nadu (18%), Andhra Pradesh (16%), and Gujarat (14%). These states already have higher shares of VRE than most countries internationally, and are already facing system integration challenges. With ambitious renewables expansion targets, they will expect to face further challenges in the future.
0
2
4
6
8
10
12
14
16
Inst
alle
d ca
paci
ty (G
W)
Solar
Wind

Renewables Integration in India 2021 Renewables integration challenges
PAGE | 24
Solar and wind as a share of total annual generation in India's renewables-rich states, FY 2020/21
IEA. All rights reserved.
Note: FY = fiscal year Source: Based on CEA renewables data.
This report’s state-level analysis draws on examples from the three states of Maharashtra, Gujarat and Karnataka, because they have large renewable capacity and are among the most advanced in their power sector development. They have significant renewables potential, robust deployment targets and financially stable DISCOMs with Grade A financial credit ratings.
These three states also play an important role in India's economy. Maharashtra has the highest GDP, contributing over 13% of India’s total GDP, while Karnataka accounts for 8% and Gujarat for 8%. Maharashtra has the second highest population in India with over 120 million residents, after Uttar Pradesh with over 199 million. The three states of Maharashtra, Gujarat and Karnataka together represent 18% of India's population.
Maharashtra faces one of the steepest renewables deployment curves in all of India. It has the sixth largest solar and wind capacity installed in the country (over 7 GW) and the most ambitious rooftop solar target, nearly 5 GW by 2022.
Gujarat and Karnataka are facing renewables integration challenges sooner than many other states. Gujarat has the third largest solar and wind capacity (over 12 GW) across the country, and its 2030 targets include over 44 GW of solar and wind capacity to satisfy the state’s power requirements, along with an additional 20 GW to be constructed in the state and contracted to other states. Gujarat also has a state-wide commitment to stop the commissioning of new coal-fired projects
0%
5%
10%
15%
20%
25%
30%
Shar
e of
ann
ual e
nerg
y (%
)
Solar
Wind

Renewables Integration in India 2021 Renewables integration challenges
PAGE | 25
from 2022. These ambitions would increase its annual share of the country’s total solar and wind generation to almost 40% by 2030, from around 15% today.
Karnataka currently has the highest annual share of solar and wind generation in India and the third highest solar and wind capacity (12.3 GW). It is a good example of a state that has benefited from agricultural demand response while facing emergency curtailment of its must-run solar and wind resources since 2019.
The IEA has a global framework for understanding renewables integration challenges
This report highlights insights for India reflecting international experiences of integrating high shares of VRE, particularly from Ireland, the United Kingdom, Germany, the United States, California and Australia. These insights could be considered in and adapted to the Indian context, help some states leapfrog common integration challenges, and assist the system transformation process in other Indian states and the country as a whole.
While the focus of this report is on wind and solar generation technologies, it also takes into account the impact of other renewables, namely hydro and bioenergy, noting that these normally assist the system integration of renewables, as they are often dispatchable forms of power generation.
The IEA system integration of renewables framework has six phases, with suggestions on how integration can be successfully managed in each phase. Various phase-specific challenges can be identified in the deployment of VRE, and decision makers can use this framework to prioritise different measures to support the flexibility of their system. The IEA has previously described these phases in detail, and also provided recent examples and insights.
Most countries, globally, are in Phases 1 and 2 of system integration of renewables, and as such experience minor system integration challenges. India as a whole and Maharashtra are in Phase 2 alongside the United States, China and Mexico. Portugal, Germany, Spain, the United Kingdom, Italy and the Indian states of Karnataka, Rajasthan, Tamil Nadu, Gujarat and Telangana are in Phase 3, and are already facing challenges related to integrating high shares of VRE. In Phase 3, VRE determines the operating pattern of the power system. Karnataka, Tamil Nadu and Rajasthan are fast approaching Phase 4. Very few countries and regions globally have entered Phase 4; they include Denmark, Ireland and South Australia. These countries/regions and the Indian states of Karnataka and Tamil

Renewables Integration in India 2021 Renewables integration challenges
PAGE | 26
Nadu are at the forefront of global integration experiences and already see periods (minutes, hours or days) when solar and wind constitute almost all of the power generation.
Phases of system integration of renewables
IEA. All rights reserved. Source: IEA, Status of Power System Transformation 2019.
Countries and regions in phases of renewables integration, 2019
IEA. All rights reserved. * 2018 values. Sources: IEA, Renewables 2020; IITK Energy Analytics Lab.
The flexibility of a power system refers to the extent to which the system can modify electricity production or consumption in response to variability, expected or unforeseen, while ensuring system security. Flexibility can therefore refer to the capability to change power supply or demand in the system as a whole or in a particular unit. Flexibility can be provided at different timescales, from
0%
10%
20%
30%
40%
50%
60%
% V
RE
in a
nnua
l ele
ctric
ity g
ener
atio
n
Phase 1 - No relevant impact on system Phase 2 - Minor to moderate impact on system operation
Phase 3 - VRE determines the operation pattern of the system Phase 4 - VRE makes up almost all generation in some periods
Renewables Integration in India 2021 Renewables integration challenges
PAGE | 27
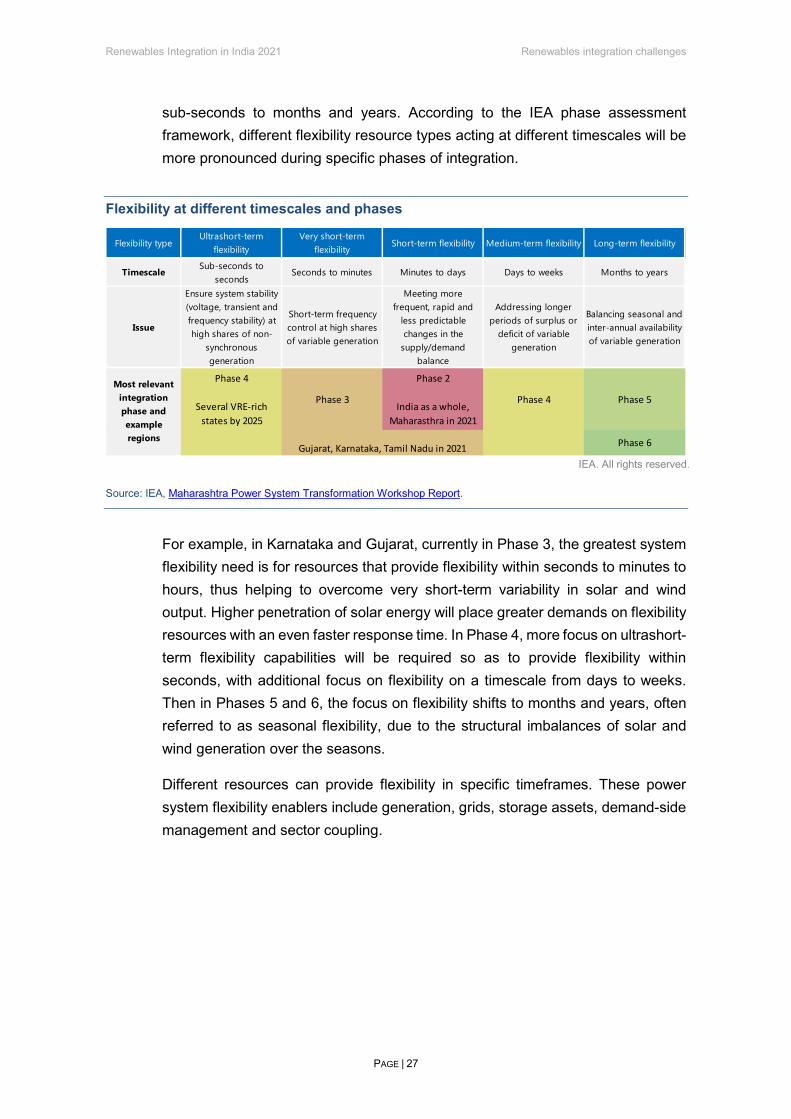
sub-seconds to months and years. According to the IEA phase assessment framework, different flexibility resource types acting at different timescales will be more pronounced during specific phases of integration.
Flexibility at different timescales and phases
IEA. All rights reserved.
Source: IEA, Maharashtra Power System Transformation Workshop Report.
For example, in Karnataka and Gujarat, currently in Phase 3, the greatest system flexibility need is for resources that provide flexibility within seconds to minutes to hours, thus helping to overcome very short-term variability in solar and wind output. Higher penetration of solar energy will place greater demands on flexibility resources with an even faster response time. In Phase 4, more focus on ultrashort-term flexibility capabilities will be required so as to provide flexibility within seconds, with additional focus on flexibility on a timescale from days to weeks. Then in Phases 5 and 6, the focus on flexibility shifts to months and years, often referred to as seasonal flexibility, due to the structural imbalances of solar and wind generation over the seasons.
Different resources can provide flexibility in specific timeframes. These power system flexibility enablers include generation, grids, storage assets, demand-side management and sector coupling.
Flexibility typeUltrashort-term
flexibilityVery short-term
flexibilityShort-term flexibility Medium-term flexibility Long-term flexibility
TimescaleSub-seconds to
secondsSeconds to minutes Minutes to days Days to weeks Months to years
Issue
Ensure system stability (voltage, transient and frequency stability) at high shares of non-
synchronous generation
Short-term frequency control at high shares of variable generation
Meeting more frequent, rapid and
less predictable changes in the
supply/demand balance
Addressing longer periods of surplus or
deficit of variable generation
Balancing seasonal and inter-annual availability of variable generation
Phase 4
Several VRE-rich states by 2025
Phase 3
Phase 2
India as a whole, Maharasthra in 2021
Phase 4 Phase 5
Phase 6
Most relevant integration phase and example regions
Gujarat, Karnataka, Tamil Nadu in 2021

Renewables Integration in India 2021 Renewables integration challenges
PAGE | 28
Technical flexibility resources for different timescales
Flexibility timescale Flexibility resource
Ultra-short term
(sub-seconds to seconds)
Very short term (seconds to
minutes)
Short term (minutes to
hours)
Medium term (hours to days)
Long term (days to months)
Very long term (months to
years)
State-of-the-art VRE
Controller to enable synthetic inertia; very fast
frequency response
Synthetic inertial response; AGC
Downward/ upward
reserves; AGC; ED of plants
including VRE
ED tools; UC tools; VRE forecasting
systems
UC tools; VRE forecasting
systems
VRE forecasting systems; power system planning
tools
Demand-side resources
Power electronics to
enable demand response
Demand-side options
including electric water heaters, EV chargers, large water pumps and
electric heaters; variable-speed electric loads
Air conditioners with cold
storage and heat pumps;
most equipment listed under
very-short-term flexibility
Smart meters for time-
dependent retail pricing
Demand forecasting equipment
Demand forecasting equipment;
power-to-gas
Storage
Supercapacitor; flywheels;
battery storage; PSH modern
variable speed units
Battery storage Battery storage; CAES; PSH PSH PSH
PSH; hydrogen production; ammonia or
other power-to-gas/liquid
Conventional plants
Mechanical inertia;
generation shedding schemes
Speed droop control; AGC
Cycling; ramping; AGC
Cycling; quick-start; medium-
start
Changes in power plant operation
criteria
Retrofit plants; flexible power
plants; keeping existing
generators as reserve
Grid infrastructure
Synchronous condensers and
other FACTS devices
SPS; network protection relays
Interaregional power transfers;
cross-border transmission
lines
Internodal power transfers;
cross-border transmission
lines
Control and communication
systems to enable dynamic
transmission line ratings; WAM; HV
components such as SVC
Transmission lines or
transmission reinforcement
Notes: AGC = automatic generation control; CAES = compressed air energy storage; ED = economic dispatch; FACTS = flexible alternative current transmission system; HV = high voltage; PSH = pumped storage hydro; SPS = special protection schemes; speed droop control = the sensitivity of governor response to frequency changes; SVC = static VAR compensator; UC = unit commitment; WAM = wide area monitoring system. Source: IEA, Status of Power System Transformation 2018.
Power sector modelling provides system-specific insights
To evaluate the impact of increasing renewables and the role of flexibility solutions in India, the IEA has developed two new detailed power system models for this report. The first model, the India Regional Power System Model (hereafter, India Regional Model), is an update of the IEA five-region national model of India for the STEPS in 2030, building on past IEA hourly modelling of India. The second model, the Gujarat State Power System Model (hereafter, Gujarat State Model), is a DISCOM-level model of Gujarat State, developed by the IEA in collaboration

Renewables Integration in India 2021 Renewables integration challenges
PAGE | 29
with CER, IIT Kanpur to evaluate the impact of diverse flexibility options on the Gujarat power system. It is described in more detail in the Gujarat Power System Transformation Workshop Report. The Gujarat State Model is the first state-level hourly model undertaken by the IEA, recognising the need for subnational modelling to capture the highly state-specific power system context in India.
Each model includes a number of scenarios to illustrate the impact of different flexibility options, as well as a downside case where additional flexibility does not materialise, to provide a reference point. The two models and the full set of scenarios analysed are described in more detail in the annex. This report provides results from both models to illustrate the renewables integration challenges and solutions at both the national and state levels.
Renewables Integration in India 2021 Renewables integration challenges
PAGE | 30
Renewables integration challenges
India’s states face many local renewables integration challenges
The IEA and NITI Aayog have collaborated with a wide range of state-level stakeholders, in particular in Maharashtra, Gujarat and Karnataka, to identify, collate and prioritise the following list of renewables integration challenges that affect Indian states. The stakeholders agreed that the states face significant challenges in reaching the country’s national 2030 renewables targets. While some of these challenges are already the daily reality for certain states, other states expect to face them according to their level of VRE penetration.
The most important technical challenges relevant to many Indian states in the short to medium term are the following:
• Transmission challenges include new bottlenecks inside states and limited capacity available across states (interstate transmission lines) as solar and wind sites tend to be concentrated in certain regions within states and also in certain states within India.
• Many states lack real-time solar and wind generation data, and the accuracy of solar and wind forecasts must improve. Regulations often allow for forecast errors of +-15%, which for Karnataka may lead to more than 1 000 MW renewable generation deviation at certain times. To address these issues, India has 11 Renewable Energy Management Centres (co-located with load dispatch centres) managing a cumulative solar and wind power capacity of 60 GW+ and sharing data among state, regional and national grid operation centres. There is a lack of reliable long-term demand projections and forecasts at the state level.
• Increasing peak demand is being driven by new demand sources such as air conditioners and EVs.
• Ramping requirements are increasing, and for existing coal generation plants at the state level there is a lack of flexibility and standard operating procedures.
• The current and future curtailment of solar and wind is both a challenge and a solution for managing the system in emergency situations. While solar and wind have must-run status in most states, this can be secondary to the priority given to hydropower or coal generators in some states at certain times.
• Concerns regarding distributed energy resources, such as rooftop solar and EVs, include local voltage issues, reverse flows, lack of visibility of existing and new installations, and challenges with forecasting.
Renewables Integration in India 2021 Renewables integration challenges
PAGE | 31
• Other technical challenges include declining system strength, increasing fluctuations in frequency and voltage levels in certain regions, and the slight decline of inertia in India in recent years at certain times (illustrated by POSOCO in the dedicated section).
• There is a lack of co-ordination among state-level transmission planners and central planning agencies such as the Power Grid Corporation of India. A unified planning model across the country is also absent. As a step towards addressing this, as part of the 19th Electricity Power Survey of India mid-term review report, the Central Electricity Authority (CEA) adopted an econometric forecasting model for the first time to project long-term electricity demand scenarios from 2018 to 2036. The model accounts for economic, demographic and weather variables, and enables better informed decisions in relation to new investments.
In most cases, these technical challenges have numerous policy, market and regulatory implications as well. Emerging policy, market and regulatory challenges and implications include the following:
• There is an absence of market signals for power system flexibility, and a lack of ancillary services regulations, products and markets in states. National-level ancillary services regulations – that India’s Central Electricity Regulatory Commission introduced in 2016 in the form of automatic generation control pilots – are not applicable within the states. The current national regulatory framework for ancillary services is primarily targeted at enhancing the reserve margin, while the framework currently excludes the role of fast response technologies.
• There is a lack of remuneration for solar and wind curtailment, which can affect investor confidence.
• There is a lack of grid codes to ensure VRE plants support system security, e.g. frequency support.
• There is no remuneration for coal power plants in the event that investment in increased flexibility is required by the state.
• The priority given to coal power plants (at technical minimums) reduces the system operators’ ability to balance the system with lower-carbon sources in some states at certain times.
• There is a lack of regulatory frameworks to allow adequate remuneration of demand response and storage technologies such as batteries.
• The long-term contracts for conventional power plants create a long-term economic burden and other challenges due to their requirement for capacity payments (referred to as a fixed cost in Indian tariff determination) alongside the energy payments (referred to as variable costs).
• There is low liquidity in the short-term wholesale markets.
• The increasing transmission system investments translate into increasing transmission charges, but are only partially compensated by lower generation costs due to the aforementioned constraints on coal plants.

Renewables Integration in India 2021 Renewables integration challenges
PAGE | 32
• Renewables integration affects the financial stability (costs and revenue streams) of the DISCOMs, which need to pay the fixed charges of coal plants bound by long-term PPAs even when using solar and wind, while also being bound by national renewable purchase obligations.
• There is increasing pressure on end-user electricity tariffs from the abovementioned increase in transmission charges, level of DISCOM risk, long-term PPAs and market inefficiencies.
Recent trends behind the main renewables integration challenges today include the increasing variability of hourly demand, which for the whole of India increased from ±8 GW in 2008 to +14 GW and -10 GW in 2018. In 2020 the increasing variability of hourly demand in the Western Region, which includes several renewables-rich states, increased from ±3 GW in 2008 to +6 GW and -4 GW by 2020.
Increasing demand variation in the Western Region, 2008-2020
IEA. All rights reserved Source: POSOCO, Western Load Dispatch Centre.
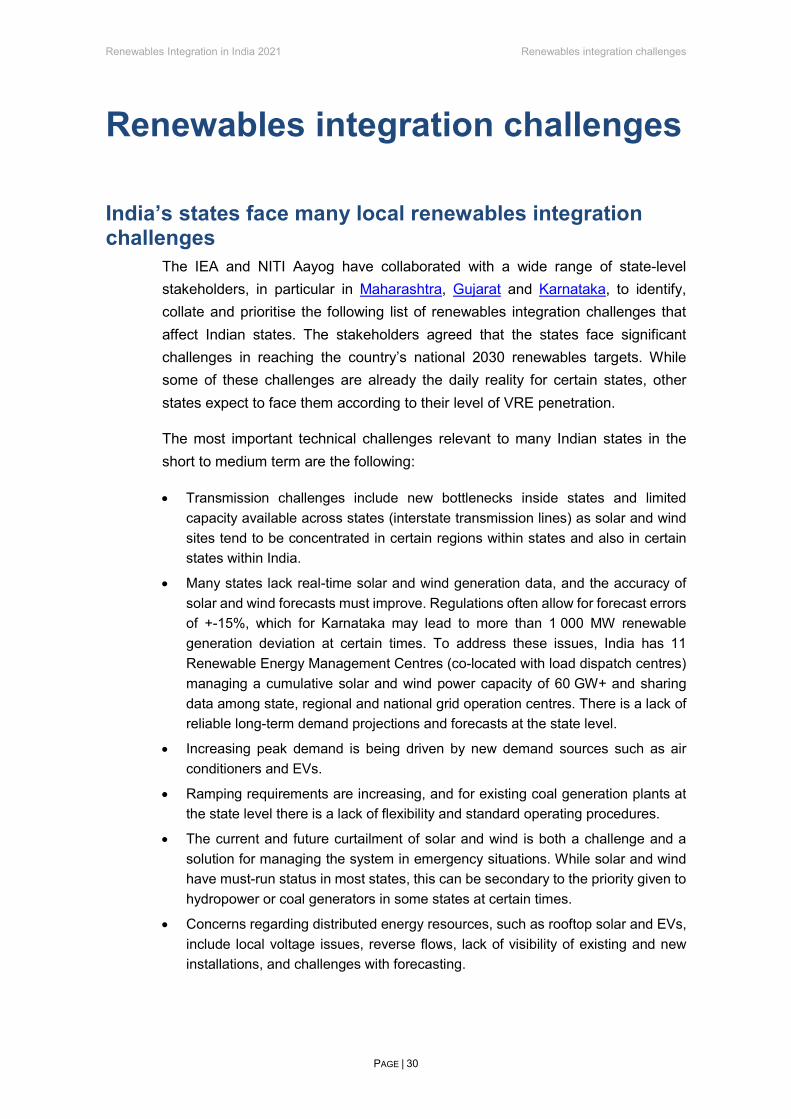
Ramping needs have increased significantly with the addition of substantial solar capacity in recent years. On a typical day in India conventional generation needs to back down in the morning between 8:00 and 12:00, followed by an increasingly steep ramp-up between 14:00 and 19:00.
Renewables Integration in India 2021 Renewables integration challenges
PAGE | 33
Increasing ramping needs driven by the impact of solar power on net demand
IEA. All rights reserved Source: POSOCO, Western Load Dispatch Centre.
How high shares of solar and wind challenge the status quo
What does the inherent variability of wind and solar PV power generation mean in practice and how will this change from today to 2030? A very high share of solar and wind at any point in time (within a day, an hour or minute) can pose system integration challenges. The variability of solar and wind generation tends to be higher at finer time resolutions and when concentrated geographically. For example, the variability in daily output of solar generation is much less than the hour-to-hour variability, and the aggregated solar and wind generation for the whole of India is more consistent than the output of a single plant, a tendency referred to as geographic smoothing. While the annual share of solar and wind energy for the whole of India was only 8.2% in 2021, the local solar and wind energy contribution in renewables-rich states was much higher than this both annually and at certain points in time. This is a result of both diversity in the generation mix between the states and the averaging effects across time and geography.

Renewables Integration in India 2021 Renewables integration challenges
PAGE | 34
While annual solar and wind shares in the renewables rich states are currently still at or below 30%, when we examine them with more granularity on a daily basis, the highest daily share of solar and wind in FY 2019/20 was already close to 70% in both Tamil Nadu (73%) and Karnataka (69%). The daily maximum solar and wind share also masks higher hourly solar and wind generation peaks. Hourly solar and wind generation data is not currently available for most Indian states. It would be a valuable addition to existing national-level data sources in the future.
Daily maximum annual solar and annual wind generation in Indian states, FY 2019/20
IEA. All rights reserved.
Note: FY = fiscal year Sources: Based on data from CEA and IITK’s Energy Analytics Lab.
Looking ahead, the share of solar and wind power in India as a whole on an annual basis is projected to reach 24% by 2030 in the STEPS and 39% in the SDS. Based on current Gujarat government targets, the annual share of solar and wind would reach around 37% in the state by 2030.
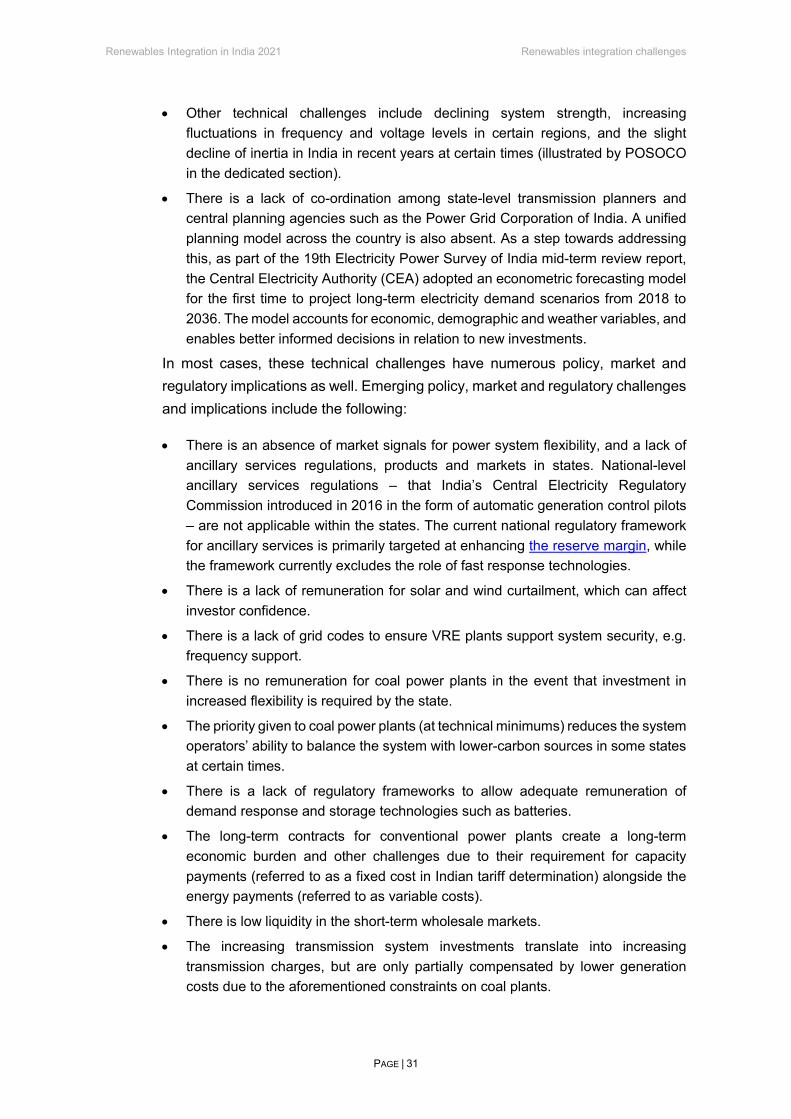
This transformation is even more pronounced when looking at the hourly maximum solar and wind generation before accounting for curtailment. While the highest contribution of solar and wind to meeting hourly demand in Gujarat in 2019 was 39% (at 13:00 on 14 July), this is expected to rise to as high as 80% in 2022, and according to the IEA Gujarat State Model it could reach up to 160% of demand during some hours by 2030. On a national level in the IEA India Regional Model, the country could see available generation from solar and wind reaching more than 90% of underlying demand during numerous hours a year in 2030. Solar and
0%
20%
40%
60%
80%
100%
Annual solar energy
Annual wind energy
Daily maximum observedVRE share
Renewables Integration in India 2021 Renewables integration challenges
PAGE | 35
wind generation levels beyond 100% of demand can be curtailed or achieved through strong interstate interconnections.
Hourly share of uncurtailed solar and wind generation as a percentage of demand in Gujarat versus India in the Stated Policies Scenario
IEA. All rights reserved. Source: IEA, India Energy Outlook 2021.
Renewables-rich states such as Gujarat are already coping with higher hourly shares than the rest of India, and are now facing integration challenges that will emerge more widely in the future.
Flexibility lowers curtailment, and lower curtailment comes with reduced system operating costs and lower CO2 emissions
In most countries with a high proportion of solar and wind generation, some level of curtailment is present. China sustained high levels of dispatched-down VRE from 2011 to 2017 (7-20%), reaching an absolute historical high of almost 50 TWh in 2016. By 2019 the share of solar and wind curtailment had dropped to less than 4%, mainly due to new interprovincial transmission capacity, changes to dispatch rules and improved market operations. Even though dispatched-down VRE electricity overall increased in absolute terms in the United States, Germany and Italy between 2017 and 2020, the share of wind and solar PV curtailment remained stable at 1-3%, which means that most systems have been able to evolve to accommodate increasing VRE generation as capacity expanded. In contrast, record curtailment levels were reached in California in 2020, with the system operator (CAISO) curtailing over 318 GWh in April (7% of VRE output). This was 67% more than in 2019 and was a result of falling demand for electricity (an 8% decline) caused by Covid-19 and newly added solar and wind capacity.
5
15
25
0 50 100 150
Und
erly
ing
dem
and
(GW
)
VRE share of demand (%)
2019
2030
50
100
150
200
250
300
350
0 50 100 150
Gujarat India

Renewables Integration in India 2021 Renewables integration challenges
PAGE | 36
Curtailment started to become a major challenge in a few Indian states between 2013 and 2019, and there is increasing concern among policy makers and investors about the increasing trend for curtailment of solar and wind towards 2030. At the same time, transparent data on the amount of curtailment (e.g. the percentage of annual generation) and reasons for it are not publicly available. The IEA India Regional Model indicates that flexibility options become critical for minimising curtailment by 2030. In the limited flexibility case we see 9% of VRE generation curtailed at the national level, in contrast to only 0.4% curtailment in the flexible case.
The state of Karnataka has been facing increasing solar and wind curtailment since 2019. Renewable generation enjoys must-run status in India as defined in the Indian Electricity Grid Codes and under various state codes, where its curtailment is allowed only for grid security and not for commercial reasons. In 2019 and 2020 there were days when the state load dispatch centre (SLDC) in Karnataka announced the need to curtail between 10% and 25% of both wind and solar generation in the interests of grid security during the middle of the day in the months of June, July, August and September. Analysis by the Center for Study of Science, Technology and Policy (CSTEP) indicates that VRE curtailment could increase further by 2030.
The IEA Gujarat State Model shows that states with less solar and wind can face similar challenges in the medium term, to 2030. For example, the model found that the Gujarat system had zero curtailment of VRE generation in 2020, and curtailment is expected to remain negligible in 2022. However, by 2030, in a case with no increase in flexibility, curtailment would increase to around 7% of annual solar and wind generation. This indicates the need for greater power system flexibility where the renewables share increases, to ensure cost-effective use of VRE.
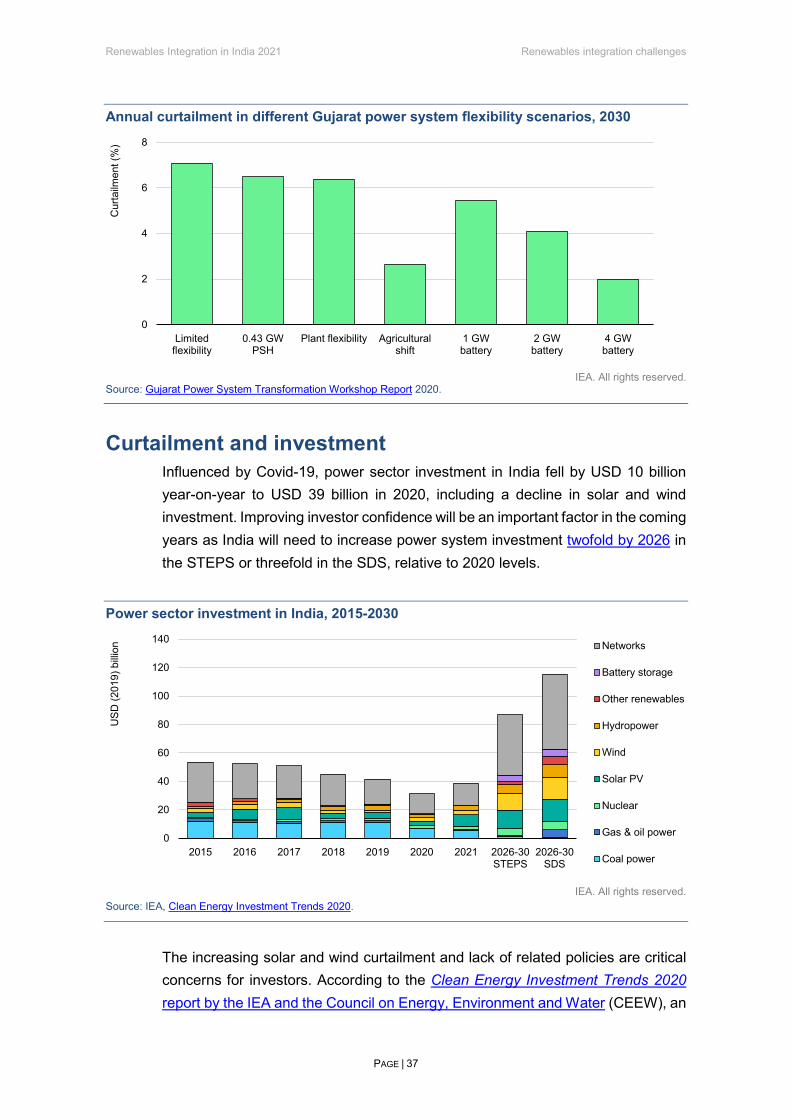
IEA analysis of the impact of power system flexibility solutions on Gujarat's curtailment levels by 2030 shows that the most effective flexibility solutions for the state are agricultural demand response (resulting in a low annual curtailment of just over 2%) and battery storage (with the lowest 2% annual curtailment with a 4 GW battery). Power plant flexibility (with over 6% annual curtailment in 2030) and the planned pumped-storage hydro (also with over 6% annual curtailment) have much lower impacts on curtailment, reducing it by less than 1% compared to the limited flexibility scenario. At the same time, all of these flexibility options result in operating cost savings, compared to the limited flexibility scenario. For example, in the 4 GW battery scenario, variable operating costs including the cost of market purchase are around 7% lower than in the inflexible case.
Renewables Integration in India 2021 Renewables integration challenges
PAGE | 37
Annual curtailment in different Gujarat power system flexibility scenarios, 2030
IEA. All rights reserved.
Source: Gujarat Power System Transformation Workshop Report 2020.
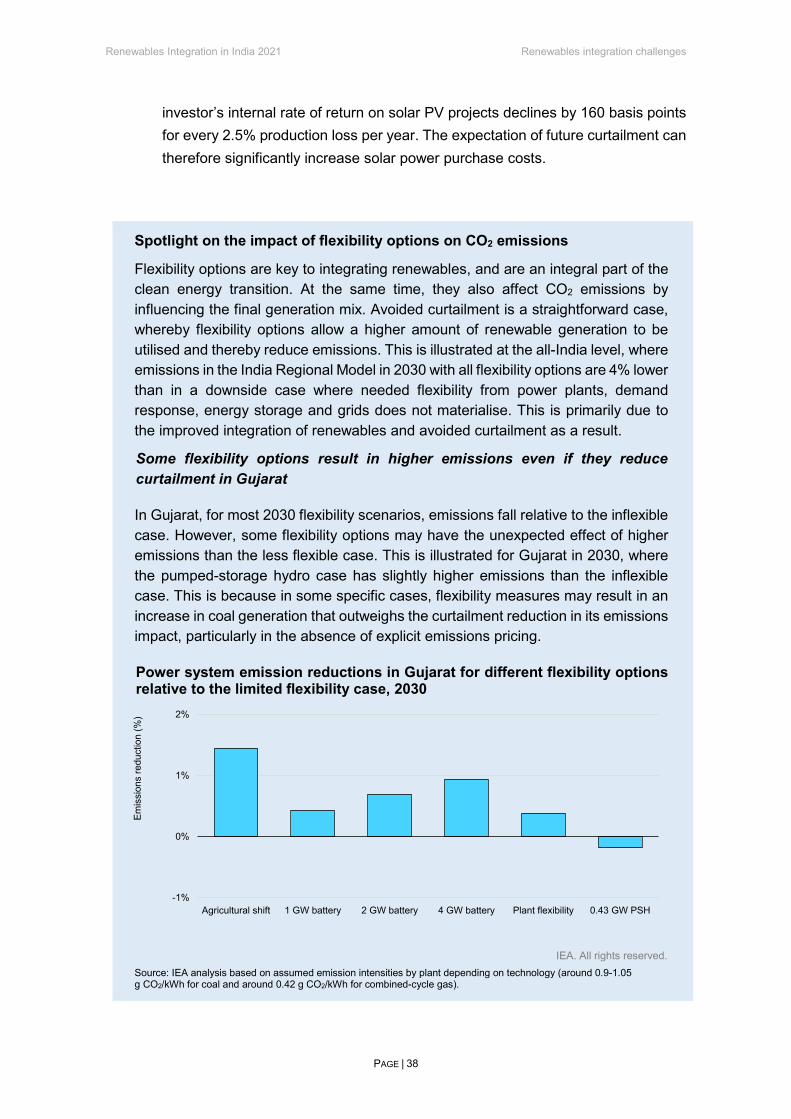
Curtailment and investment
Influenced by Covid-19, power sector investment in India fell by USD 10 billion year-on-year to USD 39 billion in 2020, including a decline in solar and wind investment. Improving investor confidence will be an important factor in the coming years as India will need to increase power system investment twofold by 2026 in the STEPS or threefold in the SDS, relative to 2020 levels.
Power sector investment in India, 2015-2030
IEA. All rights reserved.
Source: IEA, Clean Energy Investment Trends 2020.
The increasing solar and wind curtailment and lack of related policies are critical concerns for investors. According to the Clean Energy Investment Trends 2020 report by the IEA and the Council on Energy, Environment and Water (CEEW), an
0
2
4
6
8
Limitedflexibility
0.43 GWPSH
Plant flexibility Agriculturalshift
1 GWbattery
2 GWbattery
4 GWbattery
Cur
tailm
ent (
%)
0
20
40
60
80
100
120
140
2015 2016 2017 2018 2019 2020 2021 2026-30STEPS
2026-30SDS
USD
(201
9) b
illion Networks
Battery storage
Other renewables
Hydropower
Wind
Solar PV
Nuclear
Gas & oil power
Coal power
Renewables Integration in India 2021 Renewables integration challenges
PAGE | 38
investor’s internal rate of return on solar PV projects declines by 160 basis points for every 2.5% production loss per year. The expectation of future curtailment can therefore significantly increase solar power purchase costs.
Spotlight on the impact of flexibility options on CO2 emissions
Flexibility options are key to integrating renewables, and are an integral part of the clean energy transition. At the same time, they also affect CO2 emissions by influencing the final generation mix. Avoided curtailment is a straightforward case, whereby flexibility options allow a higher amount of renewable generation to be utilised and thereby reduce emissions. This is illustrated at the all-India level, where emissions in the India Regional Model in 2030 with all flexibility options are 4% lower than in a downside case where needed flexibility from power plants, demand response, energy storage and grids does not materialise. This is primarily due to the improved integration of renewables and avoided curtailment as a result.
Some flexibility options result in higher emissions even if they reduce curtailment in Gujarat
In Gujarat, for most 2030 flexibility scenarios, emissions fall relative to the inflexible case. However, some flexibility options may have the unexpected effect of higher emissions than the less flexible case. This is illustrated for Gujarat in 2030, where the pumped-storage hydro case has slightly higher emissions than the inflexible case. This is because in some specific cases, flexibility measures may result in an increase in coal generation that outweighs the curtailment reduction in its emissions impact, particularly in the absence of explicit emissions pricing.
Power system emission reductions in Gujarat for different flexibility options relative to the limited flexibility case, 2030
IEA. All rights reserved. Source: IEA analysis based on assumed emission intensities by plant depending on technology (around 0.9-1.05 g CO2/kWh for coal and around 0.42 g CO2/kWh for combined-cycle gas).
-1%
0%
1%
2%
Agricultural shift 1 GW battery 2 GW battery 4 GW battery Plant flexibility 0.43 GW PSH
Emis
sion
s re
duct
ion
(%)
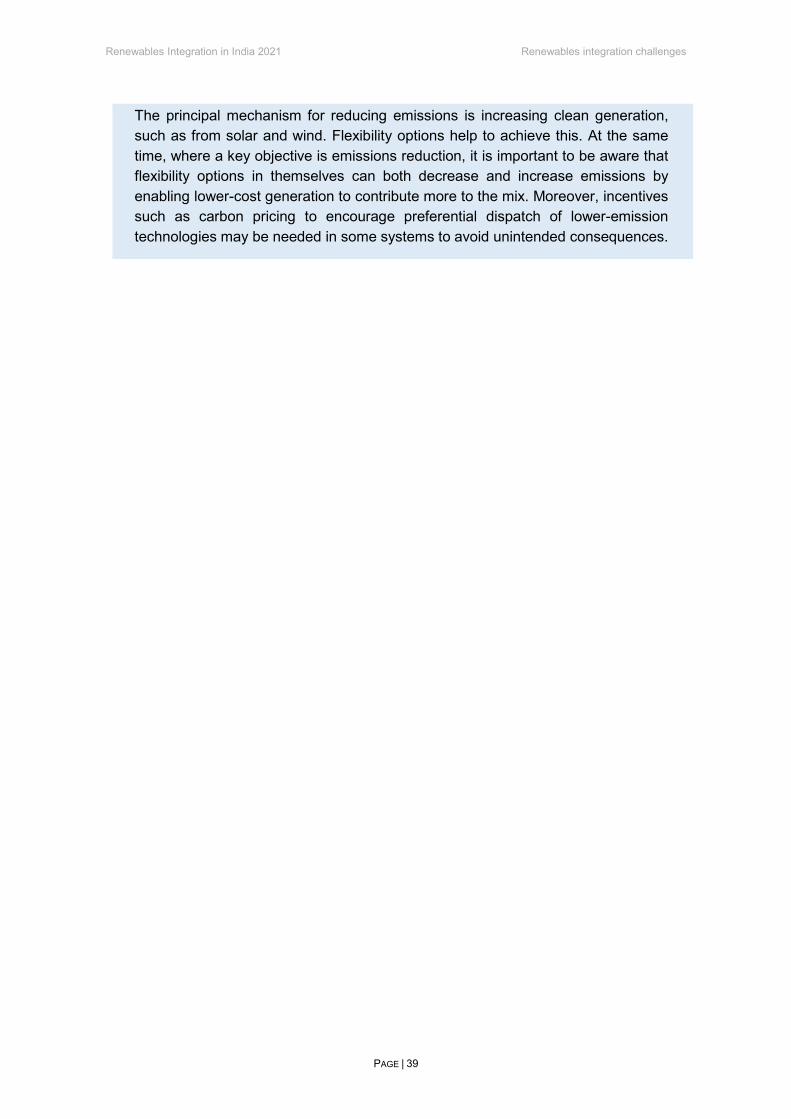
Renewables Integration in India 2021 Renewables integration challenges
PAGE | 39
The principal mechanism for reducing emissions is increasing clean generation, such as from solar and wind. Flexibility options help to achieve this. At the same time, where a key objective is emissions reduction, it is important to be aware that flexibility options in themselves can both decrease and increase emissions by enabling lower-cost generation to contribute more to the mix. Moreover, incentives such as carbon pricing to encourage preferential dispatch of lower-emission technologies may be needed in some systems to avoid unintended consequences.

Renewables Integration in India 2021 Renewables integration solutions
PAGE | 40
Renewables integration solutions
Power system flexibility now and in 2030 Extensive progress is being made by numerous national and state-level institutions in addressing the challenges of renewables integration in India. A detailed overview of ongoing policy, market and regulatory work is provided in the IEA India 2020 Energy Policy Review.
As India transitions to higher levels of renewable generation, improving system flexibility while ensuring electricity security and reliability would require services from a more diverse range of technologies on both the demand and supply sides. In 2019 the majority of India’s energy, peak capacity and ramping flexibility was provided by coal generation, with a significant contribution also coming from hydropower plants. These resources will continue to have an important but declining role in the next decade as solar, wind, batteries and demand-side resources play an increasing role in contributing to peak capacity management and power system flexibility.
Energy and service contributions of different technologies to maintain electricity security in Gujarat, 2019 vs 2030
IEA. All rights reserved.
Notes: Storage includes batteries and pumped-storage hydropower. For calculated contributions, stability is based on provision of operating reserves, although it should be noted that reserves are only one aspect relevant to stability, and detailed technical studies are required to capture all components. Ramping is calculated from the contribution to the top 100 hourly ramps, peak capacity is based on contribution to the top 100 hours and energy is the annual energy contribution. The measures aim to give an illustration of the diverse aspects of electricity security, but do not encompass all the components or potential technology contributions that can be relevant. Source: Analysis based on IEA, Gujarat State Model.
0% 20% 40% 60% 80% 100%
Thermal Hydro Nuclear Variable renewables Other renewables Storage Demand response
0% 20% 40% 60% 80% 100%
Stability
Rampingflexibility
Energy
2019 2030
Peak capacity/ adequacy
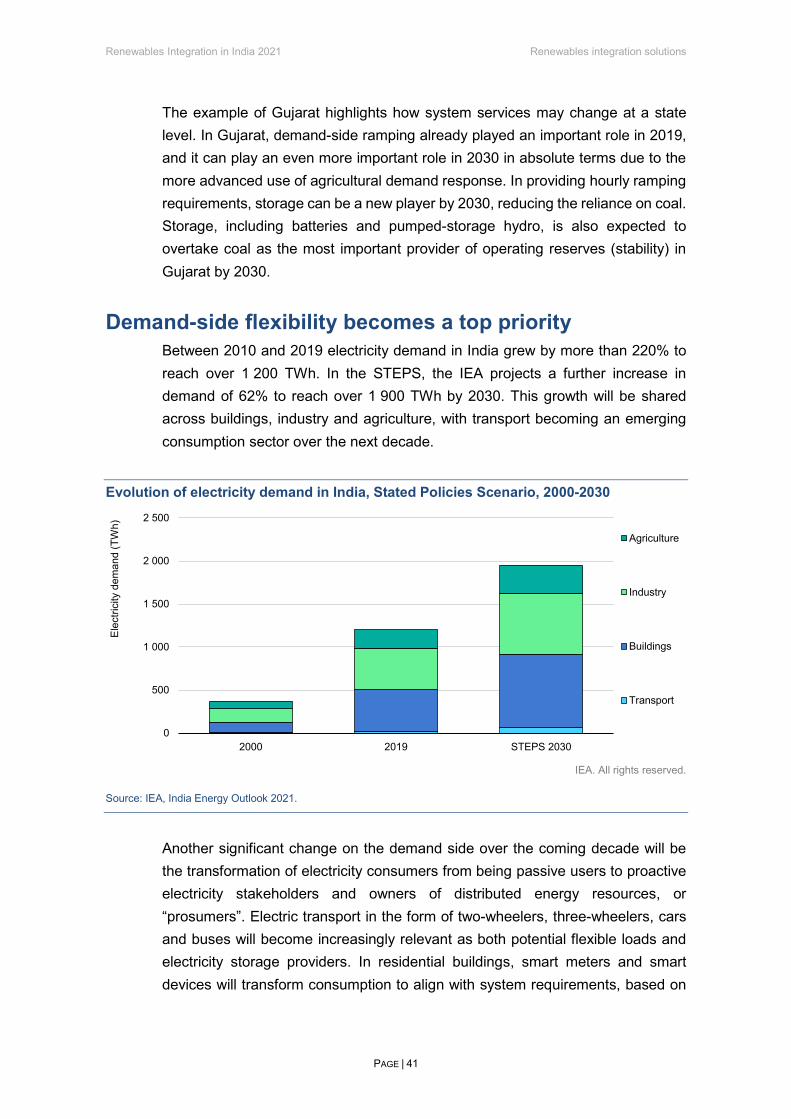
Renewables Integration in India 2021 Renewables integration solutions
PAGE | 41
The example of Gujarat highlights how system services may change at a state level. In Gujarat, demand-side ramping already played an important role in 2019, and it can play an even more important role in 2030 in absolute terms due to the more advanced use of agricultural demand response. In providing hourly ramping requirements, storage can be a new player by 2030, reducing the reliance on coal. Storage, including batteries and pumped-storage hydro, is also expected to overtake coal as the most important provider of operating reserves (stability) in Gujarat by 2030.
Demand-side flexibility becomes a top priority Between 2010 and 2019 electricity demand in India grew by more than 220% to reach over 1 200 TWh. In the STEPS, the IEA projects a further increase in demand of 62% to reach over 1 900 TWh by 2030. This growth will be shared across buildings, industry and agriculture, with transport becoming an emerging consumption sector over the next decade.
Evolution of electricity demand in India, Stated Policies Scenario, 2000-2030
IEA. All rights reserved.
Source: IEA, India Energy Outlook 2021.
Another significant change on the demand side over the coming decade will be the transformation of electricity consumers from being passive users to proactive electricity stakeholders and owners of distributed energy resources, or “prosumers”. Electric transport in the form of two-wheelers, three-wheelers, cars and buses will become increasingly relevant as both potential flexible loads and electricity storage providers. In residential buildings, smart meters and smart devices will transform consumption to align with system requirements, based on
0
500
1 000
1 500
2 000
2 500
2000 2019 STEPS 2030
Elec
trici
ty d
eman
d (T
Wh)
Agriculture
Industry
Buildings
Transport
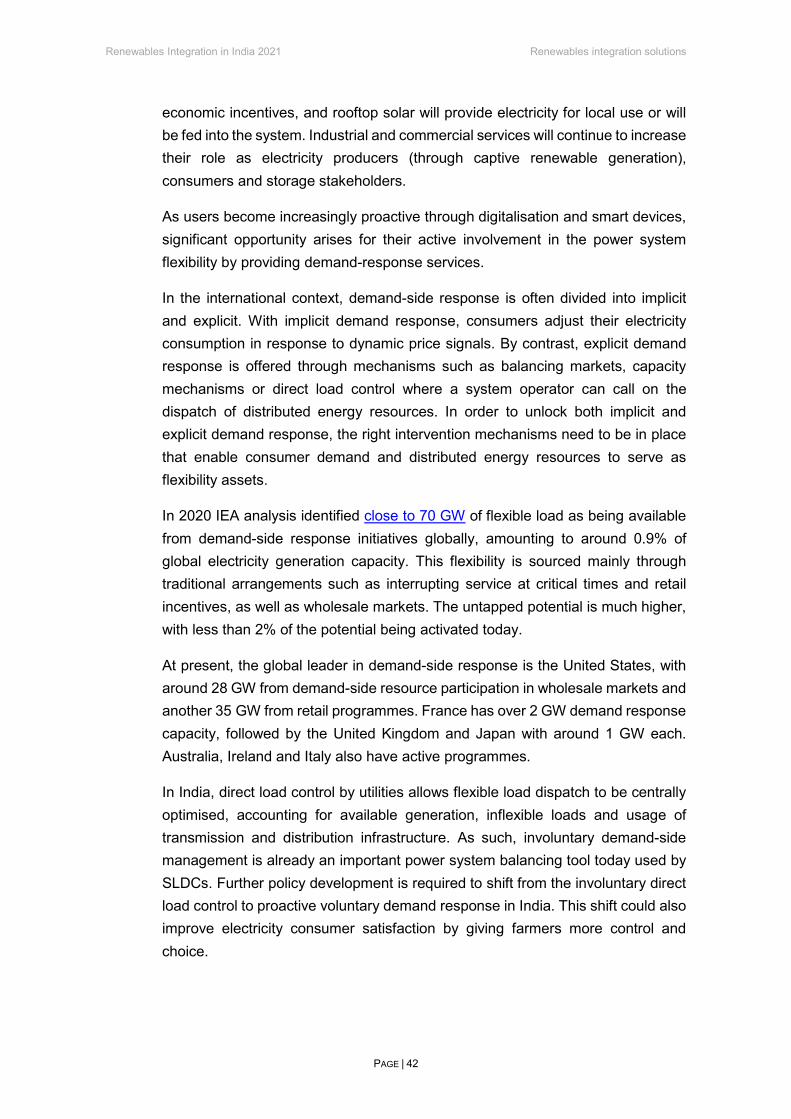
Renewables Integration in India 2021 Renewables integration solutions
PAGE | 42
economic incentives, and rooftop solar will provide electricity for local use or will be fed into the system. Industrial and commercial services will continue to increase their role as electricity producers (through captive renewable generation), consumers and storage stakeholders.
As users become increasingly proactive through digitalisation and smart devices, significant opportunity arises for their active involvement in the power system flexibility by providing demand-response services.
In the international context, demand-side response is often divided into implicit and explicit. With implicit demand response, consumers adjust their electricity consumption in response to dynamic price signals. By contrast, explicit demand response is offered through mechanisms such as balancing markets, capacity mechanisms or direct load control where a system operator can call on the dispatch of distributed energy resources. In order to unlock both implicit and explicit demand response, the right intervention mechanisms need to be in place that enable consumer demand and distributed energy resources to serve as flexibility assets.
In 2020 IEA analysis identified close to 70 GW of flexible load as being available from demand-side response initiatives globally, amounting to around 0.9% of global electricity generation capacity. This flexibility is sourced mainly through traditional arrangements such as interrupting service at critical times and retail incentives, as well as wholesale markets. The untapped potential is much higher, with less than 2% of the potential being activated today.
At present, the global leader in demand-side response is the United States, with around 28 GW from demand-side resource participation in wholesale markets and another 35 GW from retail programmes. France has over 2 GW demand response capacity, followed by the United Kingdom and Japan with around 1 GW each. Australia, Ireland and Italy also have active programmes.
In India, direct load control by utilities allows flexible load dispatch to be centrally optimised, accounting for available generation, inflexible loads and usage of transmission and distribution infrastructure. As such, involuntary demand-side management is already an important power system balancing tool today used by SLDCs. Further policy development is required to shift from the involuntary direct load control to proactive voluntary demand response in India. This shift could also improve electricity consumer satisfaction by giving farmers more control and choice.

Renewables Integration in India 2021 Renewables integration solutions
PAGE | 43
The agricultural sector is the most cost-effective source of demand response
Agricultural demand response is a significant power system flexibility opportunity for India and other emerging, developing and developed economies, because it can be the lowest cost way to align a significant amount of demand with solar peak hours.
In 2019 agricultural demand made up 18% of India’s electricity consumption. Irrigation in India today is almost entirely reliant on electric and diesel pumps. Of the nearly 30 million irrigation pumps in use throughout the country, about 71% run on grid electricity, only around 1 % are solar and the remainder are powered by diesel. Policy is focused on transitioning from diesel pumps to solar and grid-connected pumps across India.
The government of India has introduced the PM-KUSUM (Pradhan Mantri Kisan Urja Suraksha evam Utthan Mahabhiyan) scheme to support farmers in the installation of 2 million standalone solar-powered agricultural pumps, as well as converting 1.5 million grid-connected pumps to solar power. Enabling demand response under the scheme requires real-time communication between all metering units connected to the solar pumps and a central software platform for data acquisition and management. Gujarat became the first state in 2020 to develop the Solar Energy Data Management (SEDM) platform (within the UK-funded Power Sector Reform Programme) to help it monitor solar pump assets in real time using digital technologies like the internet of things. The Ministry of New and Renewable Energy (MNRE) now plans to expand SEDM to 13 more states.
Agriculture’s share of total electricity demand (2015), and solar and wind as a proportion of total generation (2018) in selected Indian states
IEA. All rights reserved.
Note: Bubble size is based on total electricity demand of each state (2015) Source: Reproduced with permission of Khanna (2021).
Uttar Pradesh
Haryana
Punjab
Madhya Pradesh
Maharashtra
Gujarat
Rajasthan
Tamil Nadu
Andhra Pradesh
0%
5%
10%
15%
20%
25%
30%
35%
40%
45%
0% 2% 4% 6% 8% 10% 12% 14% 16% 18% 20%
Agric
ultu
re
Wind and solar

Renewables Integration in India 2021 Renewables integration solutions
PAGE | 44
In large Indian states, agricultural pumping constitutes up to 38% of total annual electricity consumption, the highest being 38% in Rajasthan, 36% in Madhya Pradesh and 33% in Karnataka, followed by 25% in Maharashtra and 22% in Gujarat (as of 2015) (Khanna, 2021). These states are also the frontrunners in wind and solar development in the country.
India has significant potential to improve agricultural load flexibility alongside increasing solar and wind penetration. An important technical enabler of this is the availability and use of dedicated agricultural feeder systems. These feeder systems allow system operators and the DISCOMs to directly control (turn on and off) agricultural users without affecting other user types. In 2020 numerous states had 100% dedicated agricultural power distribution networks: Gujarat, Maharashtra, Karnataka, Andhra Pradesh, Madhya Pradesh, Punjab and Bihar. In Rajasthan and certain other states, some but not all agricultural users had dedicated power distribution networks. This means that the potential for more sophisticated agricultural demand response in India extends to many renewables-rich states.
Agricultural demand response already plays an important role in balancing the power systems of Karnataka and Gujarat. The IEA Gujarat State Model (with agricultural demand response based on analysis by Khanna [2021]) shows that flexibility from agricultural demand response in Gujarat is central to cost-effective integration of increased solar generation by 2030. By that year agricultural demand shifts significantly, reducing the renewables integration challenges and curtailment levels in Gujarat to below 3% from 7% (compared to the inflexible case where demand is managed according to today’s scheduling practices).
In Gujarat, agricultural load represents around 20% of total demand and has been growing by 5% to 7% annually. The supply of electricity to agriculture is heavily subsidised in Gujarat, as it is in most Indian states. To limit the subsidies and prevent their misuse, electricity for agricultural pumping is heavily controlled by the state-owned electricity utilities. This is enabled by a unique system of segregated electricity feeders (parallel power distribution network) for agricultural supply and household supply in rural areas, which allow complete control of agricultural supply without interrupting supply to non-agricultural consumers.
As such, agricultural demand is already an important source of power system flexibility in Gujarat, with agricultural pumping loads scheduled in eight-hour durations and concentrated overnight. This has the combined benefit of ensuring that agricultural pumping minimally coincides with peak demand, while also
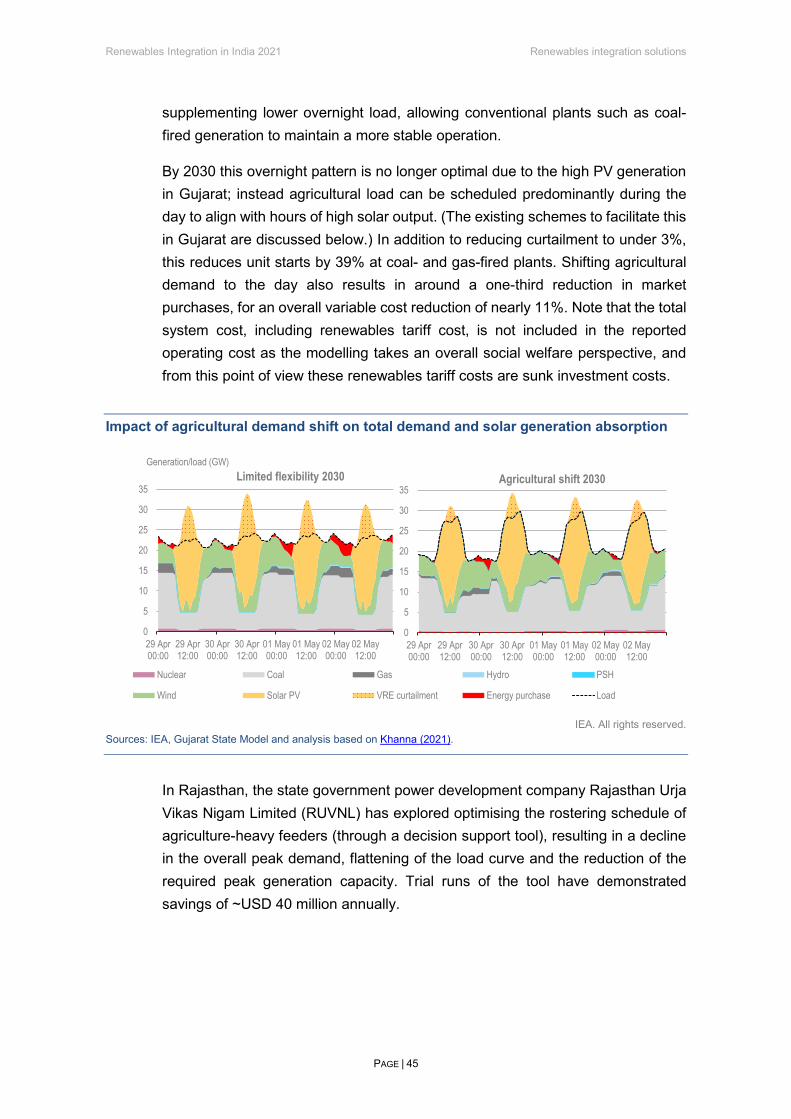
Renewables Integration in India 2021 Renewables integration solutions
PAGE | 45
supplementing lower overnight load, allowing conventional plants such as coal-fired generation to maintain a more stable operation.
By 2030 this overnight pattern is no longer optimal due to the high PV generation in Gujarat; instead agricultural load can be scheduled predominantly during the day to align with hours of high solar output. (The existing schemes to facilitate this in Gujarat are discussed below.) In addition to reducing curtailment to under 3%, this reduces unit starts by 39% at coal- and gas-fired plants. Shifting agricultural demand to the day also results in around a one-third reduction in market purchases, for an overall variable cost reduction of nearly 11%. Note that the total system cost, including renewables tariff cost, is not included in the reported operating cost as the modelling takes an overall social welfare perspective, and from this point of view these renewables tariff costs are sunk investment costs.
Impact of agricultural demand shift on total demand and solar generation absorption
IEA. All rights reserved.
Sources: IEA, Gujarat State Model and analysis based on Khanna (2021).
In Rajasthan, the state government power development company Rajasthan Urja Vikas Nigam Limited (RUVNL) has explored optimising the rostering schedule of agriculture-heavy feeders (through a decision support tool), resulting in a decline in the overall peak demand, flattening of the load curve and the reduction of the required peak generation capacity. Trial runs of the tool have demonstrated savings of ~USD 40 million annually.
0
5
10
15
20
25
30
35
29 Apr00:00
29 Apr12:00
30 Apr00:00
30 Apr12:00
01 May00:00
01 May12:00
02 May00:00
02 May12:00
Generation/load (GW)Limited flexibility 2030
Nuclear Coal Gas Hydro PSH
Wind Solar PV VRE curtailment Energy purchase Load
0
5
10
15
20
25
30
35
29 Apr00:00
29 Apr12:00
30 Apr00:00
30 Apr12:00
01 May00:00
01 May12:00
02 May00:00
02 May12:00
Agricultural shift 2030
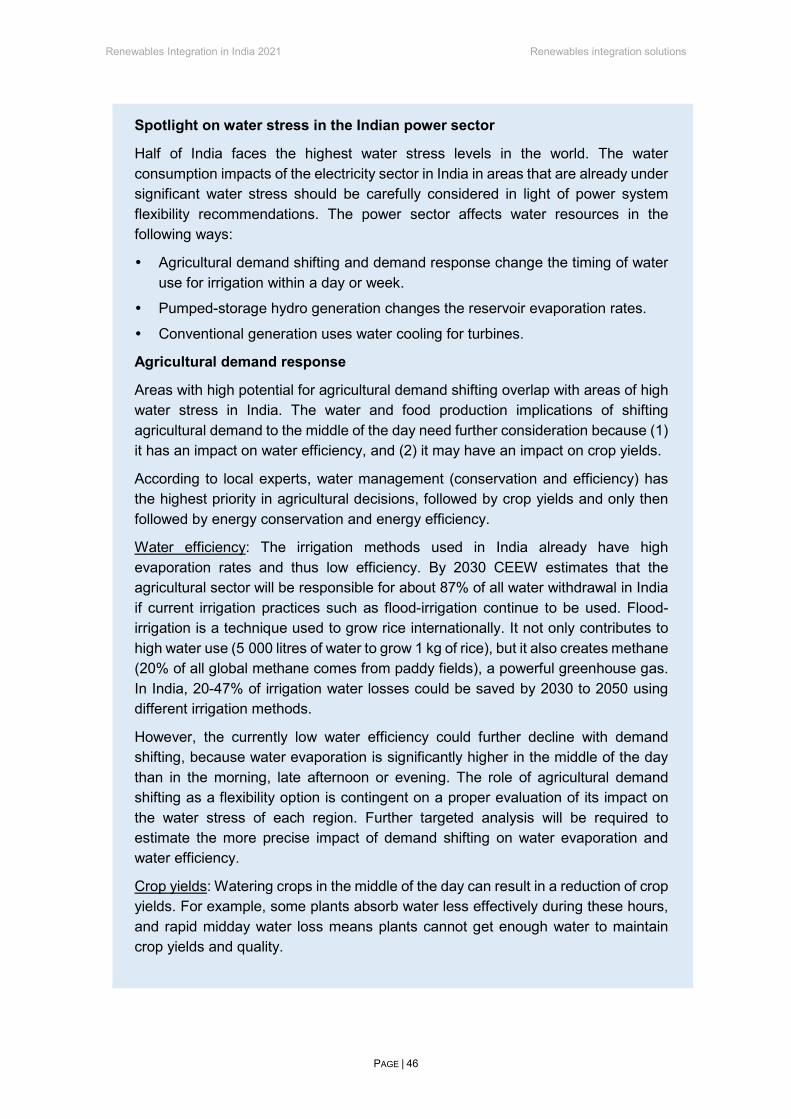
Renewables Integration in India 2021 Renewables integration solutions
PAGE | 46
Spotlight on water stress in the Indian power sector
Half of India faces the highest water stress levels in the world. The water consumption impacts of the electricity sector in India in areas that are already under significant water stress should be carefully considered in light of power system flexibility recommendations. The power sector affects water resources in the following ways:
Agricultural demand shifting and demand response change the timing of water use for irrigation within a day or week.
Pumped-storage hydro generation changes the reservoir evaporation rates.
Conventional generation uses water cooling for turbines.
Agricultural demand response
Areas with high potential for agricultural demand shifting overlap with areas of high water stress in India. The water and food production implications of shifting agricultural demand to the middle of the day need further consideration because (1) it has an impact on water efficiency, and (2) it may have an impact on crop yields.
According to local experts, water management (conservation and efficiency) has the highest priority in agricultural decisions, followed by crop yields and only then followed by energy conservation and energy efficiency.
Water efficiency: The irrigation methods used in India already have high evaporation rates and thus low efficiency. By 2030 CEEW estimates that the agricultural sector will be responsible for about 87% of all water withdrawal in India if current irrigation practices such as flood-irrigation continue to be used. Flood-irrigation is a technique used to grow rice internationally. It not only contributes to high water use (5 000 litres of water to grow 1 kg of rice), but it also creates methane (20% of all global methane comes from paddy fields), a powerful greenhouse gas. In India, 20-47% of irrigation water losses could be saved by 2030 to 2050 using different irrigation methods.
However, the currently low water efficiency could further decline with demand shifting, because water evaporation is significantly higher in the middle of the day than in the morning, late afternoon or evening. The role of agricultural demand shifting as a flexibility option is contingent on a proper evaluation of its impact on the water stress of each region. Further targeted analysis will be required to estimate the more precise impact of demand shifting on water evaporation and water efficiency.
Crop yields: Watering crops in the middle of the day can result in a reduction of crop yields. For example, some plants absorb water less effectively during these hours, and rapid midday water loss means plants cannot get enough water to maintain crop yields and quality.
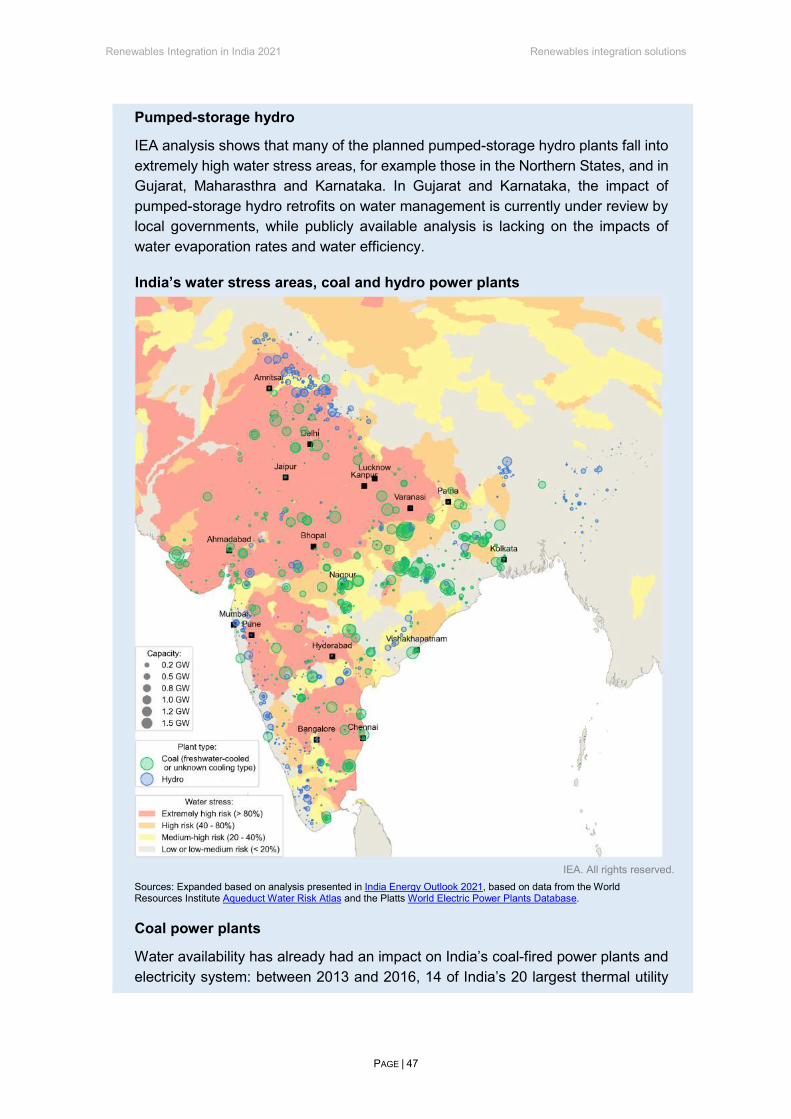
Renewables Integration in India 2021 Renewables integration solutions
PAGE | 47
Pumped-storage hydro
IEA analysis shows that many of the planned pumped-storage hydro plants fall into extremely high water stress areas, for example those in the Northern States, and in Gujarat, Maharasthra and Karnataka. In Gujarat and Karnataka, the impact of pumped-storage hydro retrofits on water management is currently under review by local governments, while publicly available analysis is lacking on the impacts of water evaporation rates and water efficiency.
India’s water stress areas, coal and hydro power plants
IEA. All rights reserved.
Sources: Expanded based on analysis presented in India Energy Outlook 2021, based on data from the World Resources Institute Aqueduct Water Risk Atlas and the Platts World Electric Power Plants Database.
Coal power plants
Water availability has already had an impact on India’s coal-fired power plants and electricity system: between 2013 and 2016, 14 of India’s 20 largest thermal utility

Renewables Integration in India 2021 Renewables integration solutions
PAGE | 48
companies experienced one or more shutdowns due to water shortages. Additionally, droughts and water shortages caused India to lose 14 TWh of thermal power generation in 2016. IEA analysis published in India Energy Outlook 2021, which mapped existing and under-construction capacity against water stress, found that almost half of India’s existing coal-fired plants are in areas experiencing high water stress, and up to 90% rely on freshwater for cooling.
The connections between electricity and water issues can also affect the power sector through extreme weather events. Heatwaves, flooding and drought can change the availability of water resources necessary for the effective use of power system flexibility resources: agricultural demand response, pumped-storage hydro and conventional power plants. Improvements in water management practices may also, therefore, result in a more flexible, secure and resilient power sector.
Cooling demand could become more flexible Cooling is expected to be the largest source of residential demand growth in the next two decades, with air conditioner stock expected to climb from 30 million today to 670 million in the STEPS in 2040. The large rise in cooling demand is expected to increase the sectoral share of building demand from 41% of India’s electricity consumption in 2019 to 48% in 2040. With rising urban temperatures and per capita incomes, the growth in ownership of air conditioners is expected to be led over the coming decades by middle- and low-income households in urban India.
This highlights the importance of energy-efficient cooling in line with the India Cooling Action Plan, launched in 2019, which calls for a 25-40% reduction by 2037/38. Furthermore, cooling demand response has the potential to mitigate the impact of higher cooling demand on generation and grid requirements, and at the same time can become a source of power system flexibility.
The most straightforward option for demand response from cooling relies on the thermal inertia of buildings, allowing limited time shifting of cooling loads without significant impacts on the consumer experience and requiring some form of communication with and control of air-conditioning devices. To illustrate this, allowing around 40% of air-conditioning load in the STEPS in India in 2030 to be shifted within a one-hour time frame saves close to 1% of total system operating costs. Further state-level analysis is needed to estimate the costs and benefits of cooling demand response for each state.
Going further, it is also possible to achieve a much greater degree of flexibility in cooling load with explicit cold storage, for example using chilled water or ice. This can provide flexibility comparable to batteries, but at a cheaper cost where it can be applied to suitable cooling loads. Cold storage is particularly applicable to

Renewables Integration in India 2021 Renewables integration solutions
PAGE | 49
district cooling systems, which are cost-effective in specific conditions such as high-density urban areas with appropriate environmental factors such as availability of water for cooling. In India, district cooling has so far seen limited development and there is still a need to develop viable business models for the Indian context.
To benefit from cooling demand response, policy makers need to remove the main obstacles to its development. Greater policy focus is required for the deployment of advanced metering infrastructure and targeted economic incentives (such as tariffs, financing and rebates) for commercial and residential consumers.
Spotlight on cooling demand in slums: The case of Mumbai, India
Globally, close to 630 million people living in urban slums are now at risk from lack of access to cooling, including adequate refrigeration, air conditioning and fans, as heatwaves become more prevalent due to climate change. A further 2.2 billion lower-middle-income population are at the risk of an “inefficiency trap”, as they can afford to buy only cheaper and less energy efficient air conditioners, which not only push up their electricity bills, but also raise global space cooling demand.
The Pradhan Mantri Awas Yojana (PMAY), a federal affordable housing programme, aims by 2030 to house 30 million people currently living in slums. In 2017 approximately 8% of Indian households in the upper- and upper-middle-income segments had an air conditioner. The Indian Cooling Action Plan aims to increase air conditioner ownership to 21% of households by 2028 and to 40% by 2038. Policy-driven cooling provision for low-income households aims to provide thermal comfort for all, reduce cooling load and increase energy savings in the long term. It stresses strategies such as energy-efficient building envelopes, cool roofs, decentralised renewables-based energy systems and localised heat action plans (Bardhan et al., 2020).

Renewables Integration in India 2021 Renewables integration solutions
PAGE | 50
Slum rehabilitation creates an affordable housing project in Mumbai
Source: Image by R. Debnath, 2020.
The rise of cooling energy demand in low-income households is most apparent in Mumbai’s slum eradication efforts. Over the last 30 years Mumbai has undergone rapid expansion. It has seen a programme to rehabilitate slum areas by moving residents to new high-rise buildings, called slum rehabilitation housing. Typical cooling device ownership in the slum, on a per-household basis, is estimated at 0.18 refrigerators, 0.65 ceiling fans and 0.00 air conditioners. When households move into the slum rehabilitation housing, their ownership of cooling appliances increases. In this case the per-household ownership of refrigerators increased to 0.62 units, ceiling fans to 1.01 units and the ownership of air conditioners to 0.05 units. This leads to a significant increase in each household’s electricity demand for cooling. It also shows that the household energy bills of India’s poorest city dwellers are likely to rise as India continues to rehabilitate its slums.
Cooling appliance ownership in Mumbai’s slum rehabilitation housing
IEA. All rights reserved.
Source: Debnath, Bardhan and Sunikka-Blank (2019).
0.00
0.20
0.40
0.60
0.80
1.00
1.20
Refrigerator Air conditioner Ceiling fan
Num
ber o
f app
lianc
es p
er h
ouse
hold
Slums Slum rehabilitation housing

Renewables Integration in India 2021 Renewables integration solutions
PAGE | 51
Rooftop solar systems need to be monitored and managed Rooftop solar and solar pumps can act as proactive demand-side resources that are capable of both meeting electricity demand behind the meter and feeding additional power into local distribution networks. However, state system operators and DISCOMs are concerned about the rise of rooftop solar systems due to their impact on distribution systems and demand forecast uncertainty.
The installed capacity of rooftop solar is increasing in India’s states. According to the MNRE, India had a total installed capacity of 4.3 GW of rooftop solar as of February 2021. At the same time Bridge Point data suggest that nearly 6.8 GW of rooftop solar had been installed in India by December 2020. The difference between these two sources includes the large amount of unregistered behind-the-meter installations with reverse flow relays that are not included in the DISCOM databases. More than 70% of the installed capacity comes from industrial and commercial consumers, while the residential sector represents over 16% and the public sector around 12%.
At the state level, Gujarat is the leader in rooftop solar deployment with nearly 1 GW of installed capacity, followed by Maharashtra (647 MW excluding the unregistered behind- the-meter installations), Rajasthan (419 MW) and Tamil Nadu (313 MW). Nine additional states had over 100 MW of installations, including Haryana, Uttar Pradesh, Karnataka and Delhi. The growth of rooftop solar in the leading states has been driven by net metering policies (with a number of policy changes ongoing in 2021).
Installed capacity of rooftop solar PV in selected Indian states, February 2021
IEA. All rights reserved.
Source: MNRE renewables data.
0
500
1 000
Inst
alle
d ca
paci
ty (M
W)

Renewables Integration in India 2021 Renewables integration solutions
PAGE | 52
India has a target of 40 GW of rooftop solar by 2022. Looking at the state-level targets by 2022, a further increase in rooftop solar is envisaged in many renewables-rich states, with the greatest ambitions in Maharashtra with a target of over 4 GW, followed by Tamil Nadu (also over 4 GW), Gujarat (over 3 GW), Karnataka and Rajasthan.
The IEA Gujarat State Model assumes that Gujarat will reach its rooftop target of over 6 GW by 2030. With this increase, the impact at the distribution level becomes much more significant, with implications for demand forecasting, demand variation and local grid management. According to the Gujarat SLDC, there is currently a lack of visibility of distributed solar resources for both distribution and transmission companies. A large number of behind-the-meter rooftop solar systems are not registered or included in the DISCOM databases. Moreover, rooftop solar generation is at present not being monitored in real time, although the DISCOM takes into account rooftop generation as part of the demand forecast submitted to the SLDC, similar to captive generation. In the future, this lack of visibility could lead to significant uncertainties in net demand forecasts and high rooftop solar shares could pose local distribution network issues, including reverse flows and voltage challenges.
Possible impact of rooftop solar on Gujarat’s daily demand at different times of year, 2030
IEA. All rights reserved.
Source: IEA analysis based on rooftop solar targets from the Gujarat government and simulated generation profiles.
The experience of the world’s rooftop solar frontrunners provides useful insights for Indian states. The capacity of rooftop solar installations in Belgium, Germany and Australia is forecast to grow significantly, reaching over 20% of total capacity
0
5
10
15
20
25
30
0 2 4 6 8 10 12 14 16 18 20 22
Load
(GW
)
Time of day (hours)
April day
Original load Load minus rooftop solar
0
5
10
15
20
25
30
0 2 4 6 8 10 12 14 16 18 20 22
August day
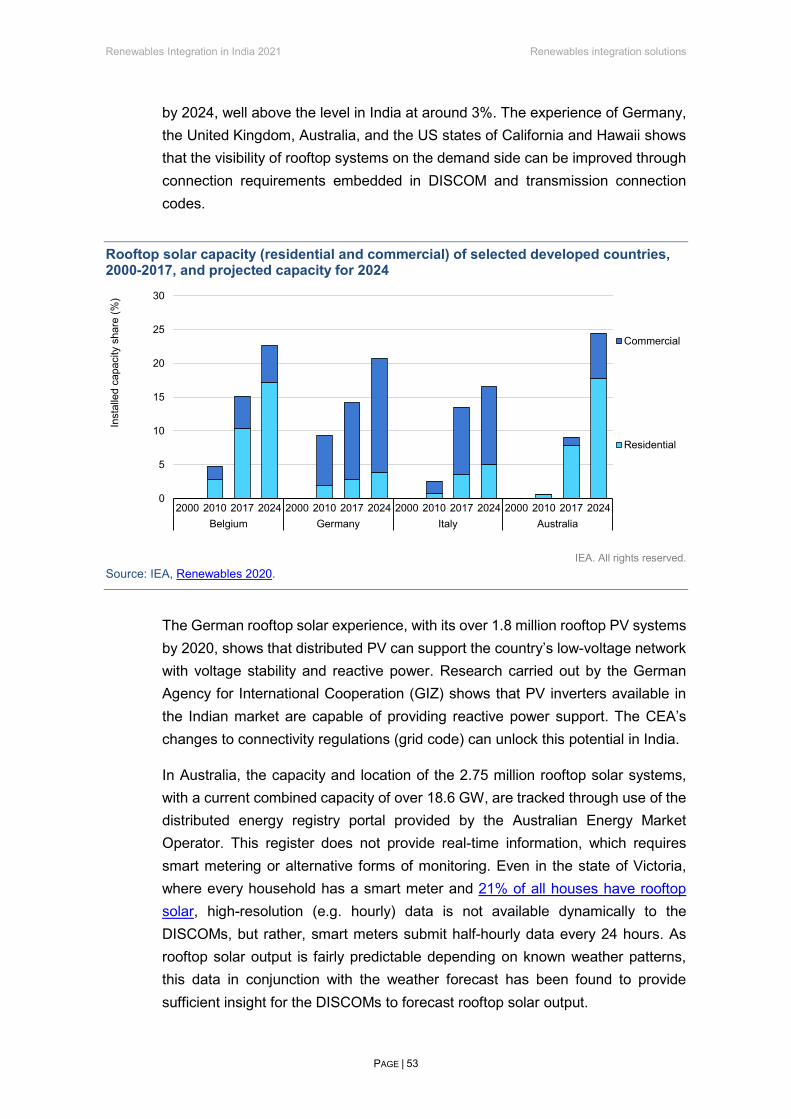
Renewables Integration in India 2021 Renewables integration solutions
PAGE | 53
by 2024, well above the level in India at around 3%. The experience of Germany, the United Kingdom, Australia, and the US states of California and Hawaii shows that the visibility of rooftop systems on the demand side can be improved through connection requirements embedded in DISCOM and transmission connection codes.
Rooftop solar capacity (residential and commercial) of selected developed countries, 2000-2017, and projected capacity for 2024
IEA. All rights reserved. Source: IEA, Renewables 2020.
The German rooftop solar experience, with its over 1.8 million rooftop PV systems by 2020, shows that distributed PV can support the country’s low-voltage network with voltage stability and reactive power. Research carried out by the German Agency for International Cooperation (GIZ) shows that PV inverters available in the Indian market are capable of providing reactive power support. The CEA’s changes to connectivity regulations (grid code) can unlock this potential in India.
In Australia, the capacity and location of the 2.75 million rooftop solar systems, with a current combined capacity of over 18.6 GW, are tracked through use of the distributed energy registry portal provided by the Australian Energy Market Operator. This register does not provide real-time information, which requires smart metering or alternative forms of monitoring. Even in the state of Victoria, where every household has a smart meter and 21% of all houses have rooftop solar, high-resolution (e.g. hourly) data is not available dynamically to the DISCOMs, but rather, smart meters submit half-hourly data every 24 hours. As rooftop solar output is fairly predictable depending on known weather patterns, this data in conjunction with the weather forecast has been found to provide sufficient insight for the DISCOMs to forecast rooftop solar output.
0
5
10
15
20
25
30
2000 2010 2017 2024 2000 2010 2017 2024 2000 2010 2017 2024 2000 2010 2017 2024Belgium Germany Italy Australia
Inst
alle
d ca
paci
ty s
hare
(%)
Commercial
Residential
Renewables Integration in India 2021 Renewables integration solutions
PAGE | 54
The main rooftop solar challenges observed in Australia include local network congestion at specific times and points in the network, high local voltage levels (over 102% of nominal voltage) and reverse flows to the distribution system during the day when demand is low. Distribution networks have been experiencing more reverse flows since PV has become cheaper and houses are installing larger systems, with the average size of newly installed systems recently reaching 9 kW. One of the solutions is a software-based approach called dynamic operating envelopes, which is being piloted by DISCOMs. This allows the export limit to the distribution system to be varied according to how much can be accommodated at specific times. National rollout and development of the detailed rules and regulations are currently ongoing. In Australia, rooftop solar currently receives a fixed (non-dynamic) feed-in tariff in most cases. But moving to five-minute settlement on wholesale markets in the future will also provide opportunities for behind-the-meter resources to be rewarded for supporting the system in real time.
In view of these international examples, Indian states could consider actions to improve the visibility of rooftop solar as a first step. State regulators could appoint an entity to develop a distributed solar registry platform available to state DISCOMs, with registration of solar pump and rooftop solar systems to be included in (new and amended) connection requirements. The registry data would ideally be publicly available in an anonymous format and data should also be made available to the SLDC by the DISCOMs. In parallel, the DISCOMs would require consumers to register new installations of distributed solar equipment on the abovementioned platform. The DISCOMs can also develop a roadmap for distributed solar forecasting and assess the technical requirements and potential policies to support more rooftop solar uptake, such as time-of-use tariffs (discussed in the following section) and real-time monitoring included in the Centre for Energy Regulation proposal.
Time-of-use tariffs to drive demand-side flexibility Electricity pricing and tariff design in India have been significantly influenced by the government’s objective to provide universal access to electricity. Affordability of electricity has been another core objective behind the current tariff design.
Hence, average household electricity prices in India in 2019 were lower than the OECD average in nominal terms. However, when adjusting for purchasing power, which better accounts for spending on electricity as a share of Indian household income, household prices are amongst the highest in the world. This is despite the fact that India – like other emerging and developing economies – has higher end-

Renewables Integration in India 2021 Renewables integration solutions
PAGE | 55
user prices for more energy-intensive industrial consumers in order to cross-subsidise the lower tariffs paid by low-income residential and agricultural users.
Industrial electricity prices in India at USD 99/MWh are significantly higher than residential prices at USD 69/MWh (on a nominal basis). The relatively high industrial prices drive large numbers of industrial users in India to procure electricity from generators directly (open-access contracts) instead of through the DISCOMs. Open-access prices are on average 20-30% lower than utility prices. Alternatively, industrial users may also invest in their own generation. Captive generation in India represents over 10% of all electricity generation in the country.
Prices also vary, not just between end users, but also across states. Electricity tariff setting in India is under state jurisdiction. State electricity regulatory commissions set tariffs based on state regulations and state objectives. Consumers in some states pay five times more for their electricity than their counterparts in neighbouring states. For example, Maharashtra, home to India's financial and business centre, Mumbai, has the highest commercial (INR 12.7/kWh) and household (INR 6.8/kWh) electricity prices of all Indian states. Agricultural use is generally unmetered, resulting in very low revenue collection rates for the DISCOMs, and low water and energy efficiency for the agricultural users.
Electricity prices in Indian states, 2019
IEA. All rights reserved.
Sources: IEA analysis based on Power Finance Corporation data, calculated from each state’s DISCOM revenue per kWh for each category of consumer.
In the future, electricity prices and tariff design could become one of the most important tools to enable more demand-side flexibility in India. Electricity tariff design and tariff options may need revision with the increasing share of
0
2
4
6
8
10
12
14
Agricultural Domestic Industrial Commercial
INR
/KW
h

Renewables Integration in India 2021 Renewables integration solutions
PAGE | 56
renewables as the timing of different consumers’ use of the system will become critical, especially at times when solar generation is high. Tariff changes can shift significant user volume from low solar times to high solar times and therefore save system-level costs, which in turn leads to greater affordability.
Currently time-of-use (TOU) tariffs are implemented by most states in India and are applicable to large industrial and commercial consumers. In some states these are referred to as time-of-day tariffs. Depending on the state, the surcharge for consumption in peak hours varies from 10% to 20% compared to rebates/concessions that vary from 15% to 25% in off-peak hours. Reflected in TOU tariffs, some states have two peak periods (a morning and an evening peak), such as Gujarat and Maharashtra, while other states have one peak period per day, such as Karnataka.
TOU tariffs are a critical policy requirement for tapping into flexibility from industry, buildings (including cooling demand), water heating demand and other household electricity uses, and EV smart charging. Additionally, tariff reforms can help move from the current practice of agricultural demand shifting, where agricultural users play a passive role, to proactive agricultural demand response, where farmers respond to a price signal and benefit financially from providing flexibility. Similarly, demand response from cooling loads and EVs would critically depend on the price incentives given to consumers.
International examples of how tariff systems can better align solar generation with peak demand are the TOU tariff policies implemented in California, Denmark and the United Kingdom.
The California Public Utilities Commission (CPUC) TOU tariff is a rate plan in which rates vary according to the time of day, season and day type (weekday, weekend or holiday). Higher rates are charged during the peak demand hours and lower rates during off-peak (low) demand hours. Rates are also typically higher in the summer months than in the winter. This rate structure provides price signals to energy users to shift energy use from peak hours to off-peak hours. The chart below illustrates the California TOU tariff design. Red indicates high price periods, yellow indicates moderate price periods and green indicates low price periods. TOU pricing encourages the most efficient use of the system and can reduce the overall costs for both the utility and customers. Prices are predetermined for each time period. Prices do not adjust according to day-to-day changes on the wholesale electricity market.

Renewables Integration in India 2021 Renewables integration solutions
PAGE | 57
Illustration of the California TOU tariff design
Weekday Weekend Early morning Midday Afternoon/Evening Overnight
Source: CPUC.
By 2020 all commercial, industrial and agricultural customers in California were already required to be on a TOU plan. The plan is also mandatory for any consumer with a rooftop solar system, including residential consumers. It has been available as a choice for more than 10 years for other residential users as well, but very few residential consumers actually switched to use these rates. As required by the regulator, the state’s three investor-owned utilities started to shift their 22.5 million residential consumers to default TOU rates in 2020, making the TOU rate the default rate for everyone as opposed to an opt-in option. This is important because residential electricity users are known to be sticky and passive users, and as such most users remain on the default rates because they simply prefer to avoid the administrative process of switching to another rate. During the pilots, the Californian utilities demonstrated that for every 10% increase in the ratio between the peak and off-peak TOU rates, peak demand decreased in a range of 6.5-11%.
The exact rules on TOU tariffs and metering together also determine the value allocation across the rooftop solar owners, non-rooftop consumers and the utilities. For example, since 2016 all rooftop solar customers of regulated utilities in California are required to be on TOU rates. This allows the utility to mitigate its revenue loss by shifting the TOU peak period. In California TOU peak periods have shifted from 11:00-18:00 to 16:00-21:00 as rooftop solar deployment and demand response have reshaped the demand curve.
As the bill savings of a rooftop consumer will be equal to the revenue loss of the utility, TOU rates reallocate the costs and benefits between utilities and rooftop users. The TOU tariff will typically result in higher rates in the evenings in California between 16:00 and 21:00. (when solar generation is lower), thus compensating utilities for providing energy during peak hours to rooftop solar consumers. At the same time, the rooftop solar owners tend to overproduce in the middle of the day when the feed-in rate falls into the lower rate category.
Many Indian DISCOMs are already in a weak financial position and expressing concern about the further loss of revenues from, and increased cost of integrating,
Renewables Integration in India 2021 Renewables integration solutions
PAGE | 58
rooftop solar. The example of California shows that mandating TOU rates for all rooftop solar customers also helps mitigate some of the utility’s revenue loss.
Requiring all rooftop solar customers to be on TOU tariffs can help mitigate the revenue loss of DISCOMs while also balancing the cost shift between rooftop solar customers and non-rooftop customers. Regularly revising the TOU timeslots will be required as rooftop solar additions and demand response reshape the state load curves.
In other markets, such as Denmark since the end of 2020, retail customers have been able to pay according to their hourly consumption and the hourly price, such that the day-to-day and hour-to-hour changes in the wholesale electricity market are reflected in the end-user tariff. This requires a certain level of detail in metering capabilities. However, before hourly meters were installed, customers with a consumption of over 100 000 kWh/year were required to settle according to the hourly price. In this way larger customers were exposed to the hourly variation in the wholesale electricity market.
The United Kingdom’s journey towards TOU tariffs has been gradual and underpinned by consumer awareness and engagement programmes. The success of static TOU tariffs in the United Kingdom encouraged rollout of dynamic TOU tariffs. This had been largely possible due to consumer acceptance of these programmes, and presents a case for applicability in the Indian context as well.
In India, tariff reforms could include expanding TOU pricing to more customers, including residential users, adjusting peak tariff slots (as seen in a Maharashtra Prayas proposal) and switching more users (including residential and rooftop users) to default time-dependent tariffs.
India has yet to undertake a systematic pilot to discover the impact of TOU prices on peak load. Some of the main enablers for developing advanced metering infrastructure for TOU tariff implementation include pilot demonstrations, institutional strengthening, innovative business models, and consumer awareness and engagement programmes.
Digitalisation and smart tools are prerequisites for TOU tariffs and thus for demand response
The international examples in the previous chapter were made possible by widespread digitalisation and the use of residential smart meters in those countries. Additionally, smart meters need to be coupled with other digital tools
Renewables Integration in India 2021 Renewables integration solutions
PAGE | 59
such as displays, notification systems or systems providing automation to allow demand response.
Smart meter deployment in India is still limited. As of March 2021, 2.3 million smart meters had been installed, deployment for 7.6 million is ongoing, and another 1 million are in the pipeline, according to the National Smart Grid Mission. The more widespread rollout of advanced metering, coupled with the results of ongoing studies, can create a foundation for the introduction of TOU tariffs in some Indian states. For example, a study by the India Smart Grid Forum (ISGF) is currently looking at TOU reform prerequisites in Gujarat in collaboration with the state regulator. This study identified advanced metering infrastructure, energy management software and smart switches and devices as minimum technical requirements for Gujarat. Furthermore, it emphasised the need for regulatory change, the importance of keeping consumers informed, and the need to respond to consumer requests for an explanation of the benefits of the tariff, including the exact impacts of new tariff types on bills.
Under the UK-supported Power Sector Reform Programme in India, the National Smart Grid Mission has developed the Smart Grid Readiness – Self Assessment Tool, which provides a common framework to help utilities better understand the smart grid modernisation journey and to prepare them for this transition by assessing gaps, including in regulations for TOU tariffs.
An international example of a comprehensive digitalisation policy is the UK’s Smart Systems and Flexibility Plan. It is designed to remove barriers to participation in demand-side response by large consumers, and enable smaller consumers (e.g. domestic) to participate in demand-side response at scale in due course. Key actions include the rollout of smart meters and the move towards market-wide half-hourly settlement, together providing a framework for the increased provision of smart tariffs.
Consumer protection is a core consideration as the United Kingdom transitions to a smart energy system. The government intends to set regulatory requirements for certain smart appliances that are suitable for flexible consumer use, e.g. fridges and washing machines, to support their uptake and to guard against potential risks, including those relating to data privacy and cybersecurity. In tandem, the UK government is working with the British Standards Institution to support the development of technical standards for energy smart appliances, including EV charging points and domestic demand-side response, via public consultation. The UK government is also exploring what innovation may be needed to engage and

Renewables Integration in India 2021 Renewables integration solutions
PAGE | 60
protect vulnerable and low-income consumers in a smart energy system. This would similarly be important for India in the longer run.
Power plant flexibility potential remains largely untapped for states today
Most states are concerned about the future role of existing coal power plants. On the one hand, with the country’s ambitions to supply more generation from renewable technologies, coal plants are expected to operate less, which leads to reduced revenues. And on the other hand, in order to operate flexibly and meet stricter emissions standards, many existing plants also require further investment. Such investment needs to be weighed against investment in flexibility in other parts of the system and in light of emission reduction targets. Government officials express concern that historical dependence on long-term coal power procurement contracts, as the tool for ensuring capacity adequacy, creates an economic burden by locking in long-term fixed capacity payments for coal power plants.
In the STEPS of the World Energy Outlook, India’s power system in 2030 is projected to have 269 GW of coal capacity, higher than the 235 GW capacity in 2019.
In certain states, power plant flexibility will become increasingly important with the growing deployment of solar and wind. For coal-fired power plants, flexibility includes faster start-up times, higher ramp rates, lower minimum stable levels, and shorter minimum up and down times, as well as the ability for warm and hot starts. Lower minimum stable levels are important for allowing power plants to keep operating while accommodating high VRE output in certain hours, particularly for solar generation in the middle of the day.
India has national-level coal-fired power plant flexibility directions that apply to centrally operated power plants, while state-operated power plants have their own flexibility objectives. Considering that most scheduling is under the control of SLDCs for balancing state-level demand with supply, it is important to assess and set flexibility requirements at the state level on a plant-by-plant basis. For example, Gujarat's state-owned generation company, GSECL, targets faster start-up rates and higher ramp rates (1% and 3% of plant capacity per minute respectively), and has introduced pilots to test the feasibility of 55% technical operating minimums for older plants and 40% for newer ones. These pilots go well beyond the current operating minimums of 75% for older and 50-65% for newer coal-fired power plants in Gujarat.

Renewables Integration in India 2021 Renewables integration solutions
PAGE | 61
The IEA Gujarat State Model and India Regional Model show that the use of coal-fired power plants in India will change dramatically by 2030. While the capacity factor of coal-fired plants at the national level remains almost unchanged from 55% in 2019 to 57% in the STEPS in 2030, this small change masks a much greater change in operating patterns, with much more frequent ramping and a wider range of whole-fleet output levels. Use will shift from baseload operation to more frequent or deeper cycling. This change in operating patterns is seen at the all-India level, and will be intensified in renewables-rich states such as Gujarat. At the same time, the use of gas-fired power plants in Gujarat is expected to change by 2030, with their capacity factors increasing. Gas-fired power plants are expected to contribute to the flexibility of the system by helping to meet evening and night-time demand, and running at low output or shutting down during periods of high renewable output in the daytime. Gas-fired plants also help to meet seasonal flexibility needs, with evening output increasing during the highest net load periods in September and October.
Coal fleet-level generation duration curves for Gujarat and India, 2019 and 2030
IEA. All rights reserved.
Source: Based on IEA Gujarat and India Regional Model.
The IEA Gujarat analysis shows that the impact of increased power plant flexibility by 2030 is a relatively modest reduction in curtailment (from 7.0% to 6.4%) and a reduction in variable operating costs of 1.2%. In some states and for certain plants, this additional operational flexibility will require investment and the redesign of compensation for these power plants, with more focus on compensation for flexibility compared with the current dual tariff solutions (fixed and variable compensation). In Gujarat the state regulator, GERC, is introducing a new tariff
0%
20%
40%
60%
80%
100%
0 2 000 4 000 6 000 8 000
% o
f max
imum
flee
t out
put
Highest to lowest fleet output hours in the year2019 2030
Gujarat
0%
20%
40%
60%
80%
100%
0 2 000 4 000 6 000 8 000
India

Renewables Integration in India 2021 Renewables integration solutions
PAGE | 62
system to compensate for the financial impact of ramping up and down at conventional plants.
In Maharashtra the state regulator, MERC, in its recent new Grid Code has provided a compensation mechanism for this flexibility. Andhra Pradesh is another example, where the Andhra Pradesh Power Generation Development Company Limited (APPDCL) has created standard operating procedures for increasing flexibility of coal-fired power plants in the state, including regulations on technical operating minimums for plants, efficient market designs, and economic incentives (tariff structuring) sponsored by the UK under the Power Sector Reforms Programme.
In the longer term, state-level ancillary service regulations and markets, combined with improved spot market participation, could help to remunerate flexible plant operations on a competitive basis with other flexible resources such as demand-side response, storage and grid flexibility.
Batteries and pumped-storage hydro can improve system flexibility, but a regulatory framework is missing
Hydropower currently provides significant power system flexibility in many renewables-rich states, including Karnataka, Maharashtra and Tamil Nadu. In the future, energy storage, such as the combination of batteries and pumped-storage hydro, may increasingly provide flexibility for integrating renewables. Storage is particularly relevant in India for allowing high solar output during the day to be stored for later use to meet evening demand.
In the IEA national analysis for the STEPS in 2030, 76 GW of hydropower, including pumped-storage hydro, reservoir hydro and run-of-river with pondage, provides critical flexibility to meet multi-hour ramps from sunlight hours into the evening when solar generation falls off rapidly. Batteries also become an important source of energy storage, accounting for 34 GW capacity. This helps absorb solar generation during the day and meet peaking requirements in the evenings.

Renewables Integration in India 2021 Renewables integration solutions
PAGE | 63
Dispatch of generation and storage during high and low net load periods for India in the Stated Policies Scenario, 2030
IEA. All rights reserved.
Source: IEA, India Regional Model.
At the state level, Karnataka and Gujarat are actively considering retrofitting their existing hydro plants to operate in pumped-storage mode to help with the integration of renewables in their systems. In Karnataka, the retrofit is foreseen for a 2 000 MW hydro plant, while in Gujarat the retrofit is foreseen to restore pumping to the 242 MW Kadana plant and add 1 200 MW of pumping capability to the Sardar Sarovar hydro plant.
To evaluate the impact of pumped-storage hydro on a system with otherwise limited flexibility resources, IEA analysis includes a scenario requested by the Gujarat government to reflect their investment plans at the Kadana hydro power station (242 MW) and the Sardar Sarovar power station (16% of 1 200 MW allocated to Gujarat, thus 192 MW capacity modelled). In this case, curtailment is reduced by 0.5%, market purchases by 4% and variable operating costs by 1% compared with the limited flexibility case.
Another scenario requested by the Gujarat government shows that the addition of a 4 GW, four-hour duration battery reduced curtailment to 2%. Market purchases were around one-quarter less and variable operating costs were reduced by around 7%, including the cost of market purchases. This larger impact is mainly due to the larger battery size and higher efficiency of the battery relative to the pumped-storage plants (81% round-trip efficiency for batteries relative to 60% efficiency for Kadana and 75% for Sardar Sarovar).
For short-duration power system flexibility needs, battery storage co-located with solar generation is a more cost-effective solution than a pumped-storage hydro
0 50
100 150 200 250 300 350 400
27 Jan00:00
27 Jan12:00
28 Jan00:00
28 Jan12:00
29 Jan00:00
29 Jan12:00
Gene
ratio
n/loa
d (GW
)
Minimum net load period
Nuclear Geothermal Bioenergy CoalGas Hydro (including PSH) Wind BatterySolar VRE curtailment Load Load without charging
0 50
100 150 200 250 300 350 400
22 Jun00:00
22 Jun12:00
23 Jun00:00
23 Jun12:00
24 Jun00:00
24 Jun12:00
Maximum net load period

Renewables Integration in India 2021 Renewables integration solutions
PAGE | 64
retrofit. The US Flexible Resources Initiative analysis completed by the Lawrence Berkeley National Laboratory (LBNL) shows that for up to 8 to 10 hours per day of storage, battery storage co-located with solar generation is more cost effective than pumped-storage hydro (retrofit of existing hydro plants) in Indian states. This is partly because battery systems are energy-constrained systems (increasing the energy [MWh] of a battery is more expensive than increasing its capacity [MW]), while pumped-storage hydro systems are capacity-constrained systems (increasing capacity is expensive while increasing energy [MWh] is cheap by increasing the depth of water in the dam). As such pumped-storage hydro is normally built for a storage duration of over eight hours. The LBNL analysis also showed that by 2030, four to six hours of energy storage is cost-effective for diurnal balancing. The study found that the levelised cost of electricity of solar co-located battery storage was around INR 3.5/kWh in 2025 when 30% of average daily solar PV output is stored in the battery.
Levelised cost of storage – pumped-storage hydro and battery storage, 2025
IEA. All rights reserved.
Note: Very low storage durations for pumped-storage hydropower given by the dotted line are illustrative only, as PSH projects typically offer around eight hours storage or higher. Source: Reproduced with permission from Abhyankar, Deorah and Phadke et al, 2021 (forthcoming).
Most Indian states currently have no regulatory framework for battery storage. However, states are stepping up to fill this gap; for example the Karnataka government and regulator are currently considering the creation of a market for battery storage. Analysis by the US National Renewable Energy Laboratory (NREL) of India’s policy and regulatory readiness concludes that key policy barriers include the lack of provision for storage in energy policies and masterplans, and the lack of targeted support for early storage adopters. On the regulatory side, some current regulations explicitly restrict storage from providing
0
10
20
30
40
50
60
0.5 1.5 2.5 3.5 4.5 5.5 6.5 7.5 8.5 9.5 10.5 11.5
Leve
lised
cos
t ofs
tora
ge (I
NR
/kW
h)
Hours of storage
Pumped hydro (addition to existing hydro project) Battery storage (co-located with solar PV)

Renewables Integration in India 2021 Renewables integration solutions
PAGE | 65
services or earning revenue. This presents a barrier to maximising the returns from storage investments.
The development of a regulatory and remuneration framework for energy storage (with specific details added for batteries and pumped-storage hydro) is needed to capture its full value, including avoiding inefficient thermal investments, capturing energy arbitrage opportunities from shifting energy demand within a day or week, and providing ancillary services for managing the system ramps.
The strategy of the UK regulator, the Office of Gas and Electricity Markets (Ofgem), for a modernised, smart and flexible power system now includes significant clarity, transparency and guidance for the role of storage, although storage was initially excluded from the UK government’s Smart Systems and Flexibility Plan published in 2017. India, too, needs to define energy storage in a well-thought-out policy framework (for example, the Electricity Act) in order to expand deployment of storage systems in the country. Similar to the approach in the United Kingdom, the definition should acknowledge its flexible nature and applications, and its categorisation should be as either generation or transmission/distribution assets. As a result of ongoing market opportunities for batteries, the United Kingdom, with over 800 MW, is the market leader for battery storage deployment in Europe, followed by Germany with over 500 MW. Battery investors in the United Kingdom actively participate in day-ahead, intraday and imbalance markets. Additionally, they access revenues from ancillary services markets and capacity markets, and from time-of-use rates when storage is placed behind the meter. Revenue gains are also made by avoiding network charges. The conclusion and recommendation for Indian states is to start with a battery policy that can provide a long-term (over four years) revenue stream for the first battery investors and then move towards providing revenues from shorter-term services/products in the markets.
System strength and inertia may need attention in some states before 2030
Today, the stability of large, interconnected power systems is based on the generator rotors of conventional power plants rotating together at the same frequency, set nominally at 50 Hertz in Europe as well as in most of Asia, including India, and in Africa.
These rotating machines stabilise the system by contributing to inertia and short-circuit power. This contribution is called “system strength”. When the system faces a disturbance, these machines instantaneously help smooth frequency deviations
Renewables Integration in India 2021 Renewables integration solutions
PAGE | 66
by releasing some of the kinetic energy stored in the rotating mass of the rotor before slower mechanisms take over to stabilise and restore the frequency (such as the governor). In addition, they are able to generate their own voltage waveform and also synchronise independently from other electricity sources: they are naturally “grid-forming”. Rotating machines are a historical cornerstone of power system stability.
With higher shares of non-synchronous generation sources like wind and solar PV, such rotating machines would become less available. As opposed to conventional generators, wind farms and PV panels are connected to the network through power converters. Converter-based technologies do not directly contribute to system inertia, and those mostly deployed to date do not provide full system strength. Present converter technologies are also “grid-following”, as they are not able to generate their own voltage waveform and are dependent on the frequency signal given by other sources, such as conventional generation, to run properly. Future power systems will host many more converter-based connections via EV charging, grid-scale battery storage, high-voltage direct current connections and others. Low inertia or system strength is mainly a concern for the remaining synchronous generators, which become more prone to outage following system faults and contingencies.
According to POSOCO, between 2014 and 2018 system-level inertia dropped slightly at certain moments in time, when renewables were especially high. At the national level, inertia is not expected to decline significantly by 2030 because the increase in solar and wind will also come with an increase of thermal generation (in the STEPS). However some high VRE states may already face declining localised inertia by 2030. The IEA Gujarat State Model shows significantly declining inertia in Gujarat’s contracted capacity between 2019 and 2030, in line with the increases in solar and wind, with the estimated minimum level dropping to around one-fifth of the estimate for 2019. At the same time, power system inertia at the all-India level is maintained in the STEPS due to load growth and new conventional generation entering the system alongside the growth in VRE. Further analysis will be required to estimate India’s level of inertia in the SDS, where thermal generation shows a declining trend.
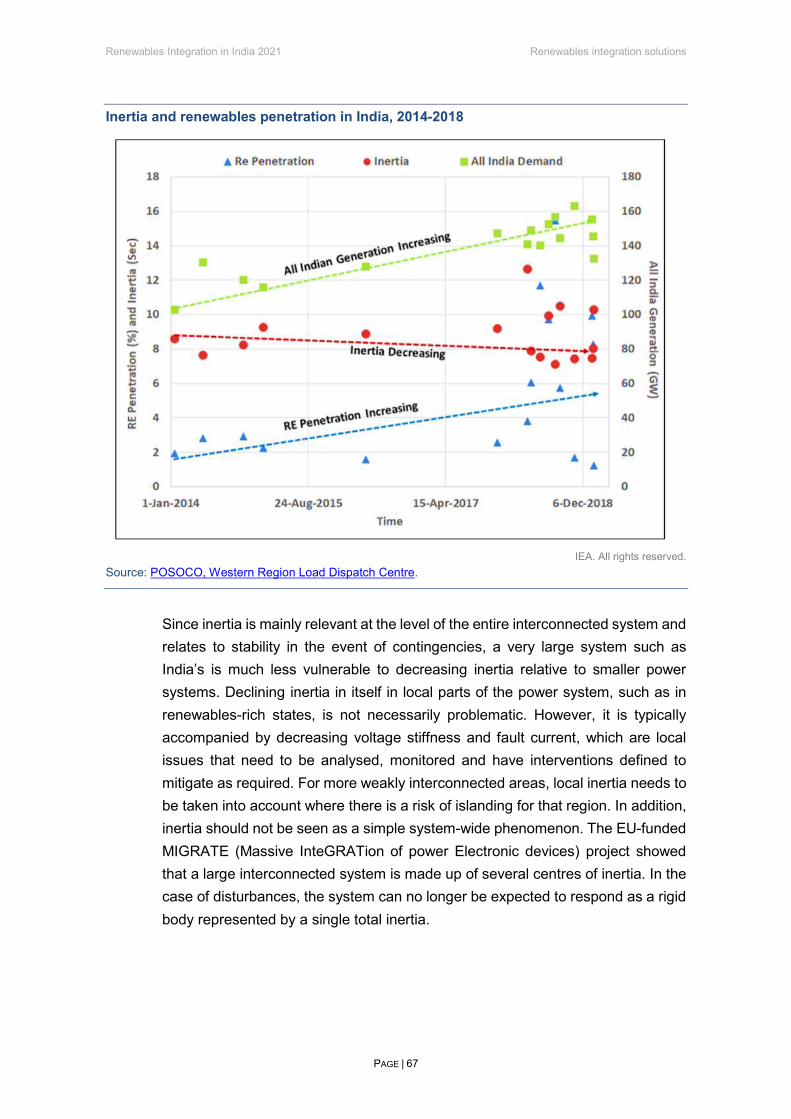
Renewables Integration in India 2021 Renewables integration solutions
PAGE | 67
Inertia and renewables penetration in India, 2014-2018
IEA. All rights reserved.
Source: POSOCO, Western Region Load Dispatch Centre.
Since inertia is mainly relevant at the level of the entire interconnected system and relates to stability in the event of contingencies, a very large system such as India’s is much less vulnerable to decreasing inertia relative to smaller power systems. Declining inertia in itself in local parts of the power system, such as in renewables-rich states, is not necessarily problematic. However, it is typically accompanied by decreasing voltage stiffness and fault current, which are local issues that need to be analysed, monitored and have interventions defined to mitigate as required. For more weakly interconnected areas, local inertia needs to be taken into account where there is a risk of islanding for that region. In addition, inertia should not be seen as a simple system-wide phenomenon. The EU-funded MIGRATE (Massive InteGRATion of power Electronic devices) project showed that a large interconnected system is made up of several centres of inertia. In the case of disturbances, the system can no longer be expected to respond as a rigid body represented by a single total inertia.
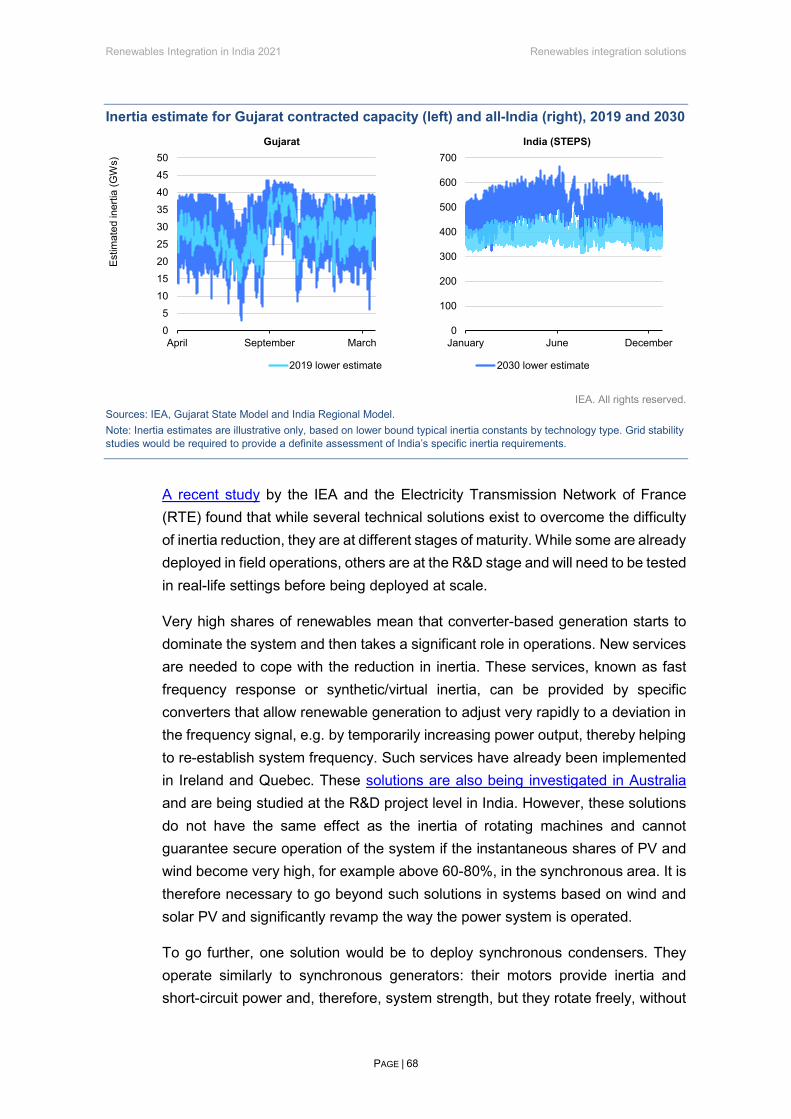
Renewables Integration in India 2021 Renewables integration solutions
PAGE | 68
Inertia estimate for Gujarat contracted capacity (left) and all-India (right), 2019 and 2030
IEA. All rights reserved. Sources: IEA, Gujarat State Model and India Regional Model. Note: Inertia estimates are illustrative only, based on lower bound typical inertia constants by technology type. Grid stability studies would be required to provide a definite assessment of India’s specific inertia requirements.
A recent study by the IEA and the Electricity Transmission Network of France (RTE) found that while several technical solutions exist to overcome the difficulty of inertia reduction, they are at different stages of maturity. While some are already deployed in field operations, others are at the R&D stage and will need to be tested in real-life settings before being deployed at scale.
Very high shares of renewables mean that converter-based generation starts to dominate the system and then takes a significant role in operations. New services are needed to cope with the reduction in inertia. These services, known as fast frequency response or synthetic/virtual inertia, can be provided by specific converters that allow renewable generation to adjust very rapidly to a deviation in the frequency signal, e.g. by temporarily increasing power output, thereby helping to re-establish system frequency. Such services have already been implemented in Ireland and Quebec. These solutions are also being investigated in Australia and are being studied at the R&D project level in India. However, these solutions do not have the same effect as the inertia of rotating machines and cannot guarantee secure operation of the system if the instantaneous shares of PV and wind become very high, for example above 60-80%, in the synchronous area. It is therefore necessary to go beyond such solutions in systems based on wind and solar PV and significantly revamp the way the power system is operated.
To go further, one solution would be to deploy synchronous condensers. They operate similarly to synchronous generators: their motors provide inertia and short-circuit power and, therefore, system strength, but they rotate freely, without
0
5
10
15
20
25
30
35
40
45
50
April September March
Estim
ated
iner
tia (G
Ws)
2019 lower estimate
Gujarat
0
100
200
300
400
500
600
700
January June December
2030 lower estimate
India (STEPS)

Renewables Integration in India 2021 Renewables integration solutions
PAGE | 69
producing electrical power. Synchronous condensers are a well-known and proven technology, historically used to maintain voltage in specific areas. They have been used in France, and more recently, also in Denmark and South Australia and have proven effective at ensuring system stability. While this solution has been proven in specific situations, a generalised rollout in the context of large-scale system strength has yet to be evaluated. The associated costs of deployment are low on an individual basis, but they must be taken into account with other system costs in a thorough economic evaluation of scenarios with high shares of renewable production. Some types of hydropower generators are also able to operate in synchronous condenser mode.
Another possibility would be to develop grid-forming controls for converters that give wind and solar power plants the ability to generate their own voltage wave. This solution has been successfully tested in the laboratory (for example, in MIGRATE) and on microgrids, but not yet at the scale of larger power systems, where other complications could arise. Full-scale experiments are planned in Europe in the coming years to validate this concept.
Interstate trading still faces technical and economic barriers
India has made significant progress over the past decade in wholesale power market design. From a market design perspective, three broad areas are relevant to establishing a robust wholesale power market:
• Faster: Liquid trading close to real time reduces the impact of forecast errors and allows better management of variability. Addressing this point, India introduced real-time power trade in 2020.
• Broader: Remunerating all relevant system services ensures that assets have an incentive to provide these services to the power system. Addressing this point, India introduced national-level ancillary services regulations in 2016, while state-level regulations are yet to be designed and implemented. The introduction of green markets in 2020 is another example.
• Bigger: Larger market areas help smooth variability and increase the pool of flexibility resources.
It is a strength of the Indian power sector that the power market has been established since 2003, when it began operations based on physical energy transactions. The technical integration of the whole country into a single synchronous system in 2014 opened new opportunities for more efficient operation of the system across a wider geographic area, which is conducive to the cost-effective integration of low-carbon sources.

Renewables Integration in India 2021 Renewables integration solutions
PAGE | 70
Further improvement in interstate trading is a cost-effective solution for the integration of higher shares of solar and wind for each Indian state because it helps smooth variability across larger areas and provides access to low-cost generation in other states. In the IEA five-region India Regional Model, flows between regions increase more than 40% by 2030 in the STEPS from 2019 levels (allowing for similar limitations on transfer capability to those seen today). 2030 sees increasing flows from the Eastern Region towards the Northern and Southern Regions. Trade between states is also expected to increase significantly. Transmission transfer capability limitations also become a driver of renewables curtailment by 2030, resulting in around 3% curtailment in contrast to less than 0.5% if the infrastructure is able to be fully utilised.
There are still significant barriers hindering a large increase in interstate trade. These include: (1) the lack of transmission capacity available for interstate trade; (2) the low level of liquidity in wholesale markets; and (3) the inflexible existing contractual structures, namely long-term physical PPAs between the DISCOMs and generators (which contribute to low liquidity).

Renewables Integration in India 2021 Renewables integration solutions
PAGE | 71
Total annual transmission flows between regions in the STEPS, and generation share by region, 2030
IEA. All rights reserved. Source: Analysis based on IEA, India Regional Model
Interstate transmission is an enabler of more power trade and thus power system flexibility
The country as a whole and the states already have significant transmission reinforcement plans to support the integration of renewables and benefit from balancing solar and wind over a larger geographical area. The main concern of electricity stakeholders is that delivery of transmission infrastructure takes longer than the delivery of solar and wind projects. There is therefore a risk of structural delay in harnessing new transmission infrastructure.
Additionally, the low availability of transmission infrastructure crossing state boundaries is also of concern. States would also benefit from improving the
NorthernRegion
NortheasternRegion
WesternRegion
EasternRegion
SouthernRegion
15.68
5.0
4.5
19.7
8.243.512.159.5
31.5
37.04.4
5.035.624.1
Transmission flows (TWh)
Key
0
50
100
Largehydro
Coal andgas
VRE Nuclear/other
Gen
erat
ion
shar
e (%
)

Renewables Integration in India 2021 Renewables integration solutions
PAGE | 72
co-ordination of scheduling and dispatch with neighbouring states for better access to least-cost generation.
CSTEP’s Southern Region transmission study highlights the need for additional transmission infrastructure to be made available for interstate trade, which would help accommodate regional renewables by 2030 (with the assumption of no additional power system flexibility improvements, beyond transmission).
CSTEP conducted a transmission planning study to understand the impact of renewables addition to the Southern Region grid in 2022 and 2030. To meet 2030 demand without additional thermal capacity (beyond existing plans), 34 GW of solar and 18 GW of wind were added to the electrical model of the Southern Region, bringing their total capacity to 60 GW and 48 GW, respectively. The study found that the power generated at critical instants in 2030 could be well in excess of regional demand, making it necessary to upgrade interregional transmission corridors to handle the export of power up to 50 GW. It also found a significant need for intraregional transmission upgrades, primarily at 220 kV renewables injection points and transmission lines, beyond existing upgrade plans.
The results of this type of transmission study should be assessed together with studies that assess alternative power system flexibility resources, such as demand-side response, storage, and power plant flexibility.
Additionally, synchronous connections with Bangladesh and Nepal, in addition to those that already exist with Bhutan, would enlarge the geographical footprint for balancing.
Wholesale power market reforms enable greater system flexibility
Wholesale power markets provide power system flexibility by enabling the balancing of supply and demand through economic dispatch. The newly established green markets in India also provide a trading platform for clean electricity, and newly established real-time markets provide an opportunity to trade solar and wind to compensate for their variability close to real time – one hour ahead – thus enabling participants to manage variability.
The international experience highlighted in this section shows that specific market and regulatory innovations are required to access the flexibility from many new and innovative power sector assets and solutions, such as solar, wind, demand-side response, storage and batteries.
Renewables Integration in India 2021 Renewables integration solutions
PAGE | 73
To grant these new participants equal access to compensation for flexibility, authorities need to review and possibly reform the current state regulations and market rules. The first step for state regulators is to identify the barriers to competition that these new technologies face. More specifically, storage (including batteries) faces barriers to enter and compete in the current regulatory setup. For example, state rules need to specify if battery investors are eligible for fixed-cost payments in a similar way to thermal assets. At the same time, the development of new ancillary services and an ancillary services market provides an opportunity to consider all technologies, new and established, from the outset.
Additionally, state grid codes can be reviewed and updated to specify system-friendly connection and flexibility requirements for new solar and wind projects, including distributed solar (rooftop and pumps).
Comprehensively reviewing and removing the (wholesale and retail) market barriers to new technologies is an important ongoing task worldwide. For example, the United Kingdom is revising its balancing services and capacity markets in parallel processes. Australia has made interim accommodations and proposed rule changes for utility-scale batteries while consulting on its post-2025 market design. The Canadian province of Ontario is identifying obstacles to fair competition within its current markets for energy storage resources and is proposing mitigation strategies through an advisory group. France’s energy regulator has also started reviewing the technical rules of the capacity mechanism from the perspective of battery storage resources. The EU’s Electricity Market Design legislation mandates competitive procurement of flexibility services and fair rules for network access and charging, but whether it could more broadly reduce barriers to energy storage depends on how the legislation is implemented by its members.
Comprehensive market reform is also taking place in the United States. The US Federal Energy Regulatory Commission (FERC), which regulates the wholesale electricity markets and high-voltage transmission system, has issued a ruling to review its market rules and remove unnecessary barriers to energy storage participation. This ruling opens the door to all types of energy storage resources sited anywhere on the power system participating in energy, capacity and ancillary services markets. Ideally, these markets would drive technological innovation, but current electricity market rules are largely tailored to legacy power plants, which can inhibit progress. Historically, market rules have been tailored to the operating parameters of traditional power plants such as large hydropower and gas peaker
Renewables Integration in India 2021 Renewables integration solutions
PAGE | 74
plants, not smaller storage technologies. For example, some grid operators in the United States imposed minimum size requirements of up to 1 MW, which excludes smaller batteries.
The FERC’s ruling also invites storage resources located on the distribution system (potentially behind the meter) to participate in the wholesale electricity markets. Again, therein lies the main controversy. While FERC can open the gates to its wholesale electricity markets and the high-voltage transmission system, states and other local authorities regulate the distribution system (a dichotomy formalised in the 1935 US Federal Power Act). States and other local entities have therefore challenged the FERC rule.
The tension between federal and state authorities is a common theme with newer, smaller resources like demand response, storage and distributed energy that could provide services to both the transmission and distribution systems. Similar issues arise in other two-tiered jurisdictions in Australia, Canada, the European Union and India.
Wholesale power market reforms improve liquidity Wholesale power exchanges in India have improved greatly since their introduction in 2008 and have become the most significant in the South Asian region. Most of the short-term traded electricity volume (over 95%) is traded on the India Energy Exchange (IEX) as of 2020.
India’s wholesale markets have been historically criticised for their lack of liquidity and products. Liquidity is still low, but there is an improvement in product availability.
In India the sale of power typically happens in three timeframes. Firstly, long-term arrangements include contracts of over seven years’ duration and cover power generators entering into PPAs with a DISCOM or state government to sell power for a fixed period of time as per the tariff determined by the regulator, or discovered through competitive bidding. The purpose of these long-term contracts is to ensure that new generation capacity will be built. In India, the states and DISCOMs use these contracts to ensure resource adequacy in the long term because they do not have alternative resource adequacy arrangements.
Secondly, medium-term arrangements – typically between one- and five-year durations – cover generators selling power based on competitive bidding through an Indian marketplace portal for DISCOMs and generators. The size of this market is negligible in India.

Renewables Integration in India 2021 Renewables integration solutions
PAGE | 75
Thirdly, short-term markets for contracts below one year cover bilateral, multilateral or exchange-traded contracts between buyer and seller. The two power exchanges in India include the IEX and Power Exchange India Limited (PXIL). The short-term markets in India account for around 10-11% of the market volume.
In 2020 the pandemic and the related decline in demand had a significant positive impact on the volume of electricity wholesale trade on power exchanges in India. Wholesale prices were approximately 20% to 29% lower than the previous year at INR 2.7/kWh on average in September and closer to INR 2.5/kWh between March and September (in the range of INR 2-4/kWh). The traded volume increased compared to the previous year; this increase was around 44% in September 2020 for all market segments – for example, the day-ahead market, term-ahead market, real-time market and green term-ahead market. The increase in volume was driven by multiple factors: utilities preferred short-term trade as opposed to business-as-usual 3- to 9-month contracts in light of unforeseeable demand patterns. Additionally, utilities offered the unserved volume resulting from lower electricity demand for sale in the market. Finally, driven by lower prices, some utilities replaced their contracted generation with cheaper market purchases. Day-ahead market volume was typically around 180 000 MWh per day in 2020.
Real-time power markets were launched in June 2020 in India. The IEX has witnessed this market becoming a success and filling an important gap by providing real-time trade (two 15-minute blocks an hour ahead) for intermittent and variable generation such as solar and wind. The price volatility of the real-time market has been greater than that of the day-ahead market, but on average, prices are typically lower, at INR 2.36/kWh. Real-time market volume was typically around 20 000 MWh/day. The principal users of real-time markets include more than 50 DISCOM buyers, over 200 industrial buyers and more than 20 generation companies, while sellers included nearly 40 DISCOMs, over 140 thermal plants and nearly 30 hydropower plants.
The green market was launched in August 2020 at the IEX, where green electricity has been trading at a premium (compared to the regular day-ahead market) in a range of INR 3-3.8/kWh for clients looking to fulfil their renewables purchase obligations through market purchases. Green market trading volume is currently averaging around 10 000 MWh per day.
The new market products are meant to fill the gaps in the Indian wholesale market design and contribute to improvements in product variety and market liquidity.
Renewables Integration in India 2021 Renewables integration solutions
PAGE | 76
PPA flexibility can improve system flexibility by separating the financial from the physical
Long-term PPAs represent about 90-95% of the electricity market in India. As a result, India is highly dependent on PPAs that cover physical delivery of energy and capacity. Physical PPAs in India are widely seen as a key reason for low liquidity in short-term markets and they also pose a barrier to improved power system flexibility (both from trade and from conventional power plants). In order to integrate VRE, short-term flexibility is key and physical PPAs can be a major barrier to utilising technical flexibility already present in the system.
The DISCOMs tend to use the physical PPAs to secure the long-term resources needed to meet projected peak demand due to the lack of dedicated resource adequacy mechanisms in the states. However, based on international experience, linking the physical PPAs to resource adequacy may not be the most cost-effective tool for achieving resource adequacy, thus states could consider creating alternative resource adequacy mechanisms.
The reasoning behind using physical PPAs is that they ensure the bankability of projects, which can then obtain financing. However, PPAs do not need to be physical to ensure financing; they can also be financial. In other markets around the world we also see PPAs as a key enabler of project bankability, but in markets such as Europe or the United States, these PPAs are often financial. The counterparts of these types of contracts can be anything from traders to utilities, to corporate entities. Within the European context, generation can have two separate contracts: a financial contract ensuring budget stability, and a physical contract ensuring the sale of the physical power in the short-term markets. In this way the daily optimal dispatch is ensured via the physical contract, while the long-term financial viability is ensured via the financial PPA. Currently in India the fact that financial stability is not separated from daily physical scheduling is a barrier to system flexibility and the integration of VRE. Financial PPAs ensure the budget stability of projects without interfering in the day-to-day physical scheduling of assets. In this way, assets can still be activated according to the merit order and have budget stability.
An alternative to a system of bilaterally negotiated contracts is to create a financial market with exchange-traded financial products that can be used for budget stability on both the consumption and production sides. For a financial market to be successful, a good reference price needs to be established and buyers (DISCOMs) need an investment-grade credit rating. In lieu of a good credit rating, collateral can be used when trading financial products; however, collateral is a

Renewables Integration in India 2021 Renewables integration solutions
PAGE | 77
relatively expensive option, and might be difficult for financially stressed DISCOMs to post. It is important to note that the financial stability of the DISCOMs is a barrier for all PPAs, whether they are physical or financial in nature, but within financial contracts the collateral or credit agreements can be more formalised since there is no physical production behind the contact.
As mentioned, the reference price is an important feature for well-functioning financial markets. The reference price in the European financial markets is the day-ahead price, which is sufficient since the price formation of the day-ahead price in Europe is stable and liquid. There is currently no stable reference price in India, which means that bilateral financial PPAs might be the better option to allow short-term flexibility via participation in the short-term markets for the generation assets, at least until liquidity in the short-term markets has improved.
In the longer term, a sophisticated financial power market could be introduced in India. Currently there is no financial power market, but during several events in which the IEA has participated, stakeholders have mentioned their ambition to launch a financial market. Most financial power markets have both exchange-traded products and over-the-counter products. The list below shows some of the financial products that are used internationally to ensure the financial stability of generation assets as well as consumption portfolios. These products are used by utilities, generators and consumers alike.
The reason for considering financial instruments in India is to ensure that the long-term budget stability of generation assets does not affect short-term scheduling. If the existence of physical PPAs changes the merit order, the efficiency of the power system is compromised and that limits the flexibility and ability of the system to integrate renewables. A tool to ensure that this does not happen is a system of financial contracts coupled with agreements to sell the physical generation on the short-term markets.

Renewables Integration in India 2021 Renewables integration solutions
PAGE | 78
Overview of international electricity contract types
Type of
power contract Description Example
Forward Bilateral or exchange-traded contract for fixed amount of power; can be either physical or financial
PPA, typically for baseload technologies or used for hedging structured products such as swaps
Swap Fixed-price forward bilateral contract Contract for difference, fixed-price PPA with volume flexibility
Tolling agreement Bilateral agreement where the off-taker acts as the market scheduler for a power plant
Asset owner is paid a fixed rate to toll the asset to a second party who then has the production and price risk of the asset
Future
Standardised exchange-traded contract for future delivery; typically never delivered – a financial settlement-only contract
Typically same types of application as a forward
Option
Bilateral contract that gives the off-taker the option to buy or sell power, or earn revenues from a generator; they can be financial or physical
Heat rate call option, revenue put option; collar option that provides a floor and a ceiling for earnings from an asset; renewable assets can also use weather derivatives to secure volumetric risk
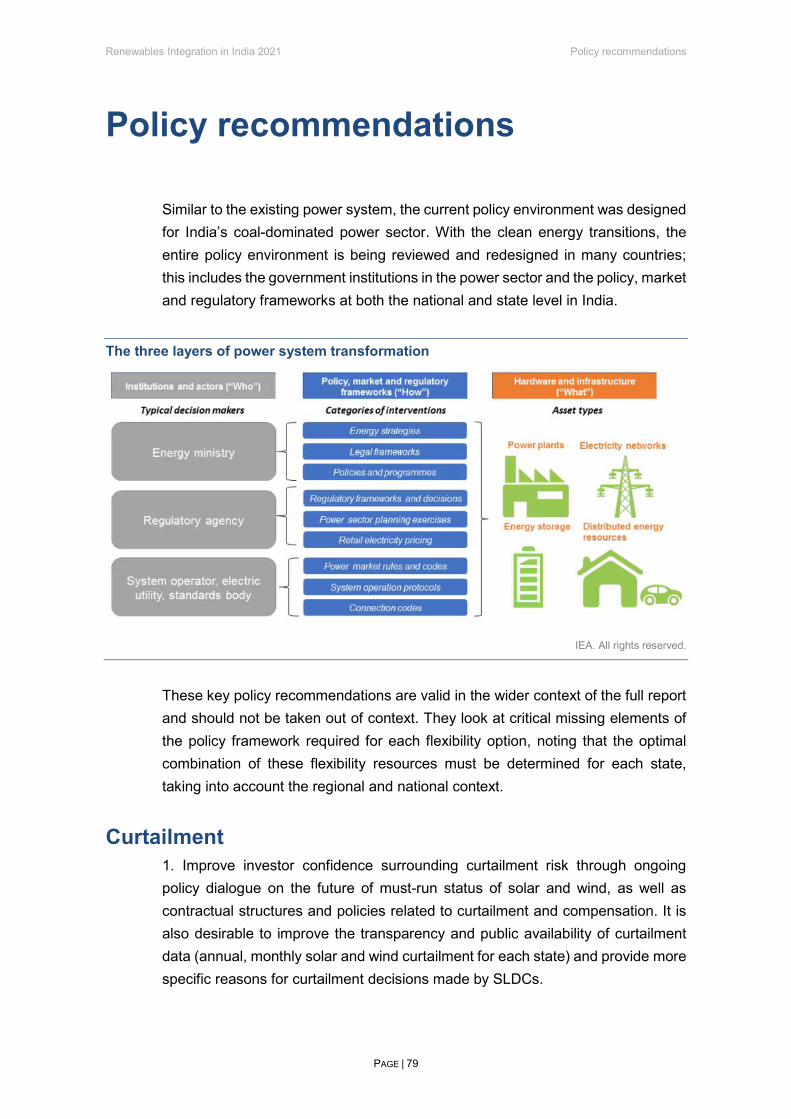
Renewables Integration in India 2021 Policy recommendations
PAGE | 79
Policy recommendations
Similar to the existing power system, the current policy environment was designed for India’s coal-dominated power sector. With the clean energy transitions, the entire policy environment is being reviewed and redesigned in many countries; this includes the government institutions in the power sector and the policy, market and regulatory frameworks at both the national and state level in India.
The three layers of power system transformation
IEA. All rights reserved.
These key policy recommendations are valid in the wider context of the full report and should not be taken out of context. They look at critical missing elements of the policy framework required for each flexibility option, noting that the optimal combination of these flexibility resources must be determined for each state, taking into account the regional and national context.
Curtailment 1. Improve investor confidence surrounding curtailment risk through ongoing policy dialogue on the future of must-run status of solar and wind, as well as contractual structures and policies related to curtailment and compensation. It is also desirable to improve the transparency and public availability of curtailment data (annual, monthly solar and wind curtailment for each state) and provide more specific reasons for curtailment decisions made by SLDCs.

Renewables Integration in India 2021 Policy recommendations
PAGE | 80
Demand response 2. Build a regulatory framework and pricing mechanisms to enable the shift towards more proactive participation by demand sectors than their existing passive consumption.
Making load curve data per DISCOM and per consumer type for each state transparent and public would help private and public sector players calculate the return on investment in demand-response programmes and assess their optimal tariff choices.
Accelerating the rollout of advanced metering infrastructure is a prerequisite for demand response. Smart meters need to be coupled with other digital tools such as displays, notification systems and systems providing automation to provide demand response. In the residential sector, a shift towards advanced digital metering and smart home appliances is a prerequisite for the use of TOU tariffs and demand response.
Shifting all users, including residential users, to default TOU tariffs is recommended in the longer term, particularly consumers with rooftop solar, EVs and smart charging in buildings.
To enhance cooling demand response, alongside deployment of advanced metering infrastructure, the government could provide targeted economic incentives for commercial and residential consumers, allowing limited time shifting of cooling loads without significant impacts on the consumer experience. It could also support provision of some form of communication and control for air-conditioning devices, and develop viable business models for district cooling in the Indian context.
To strengthen agricultural demand response, the availability and use of dedicated agricultural feeder systems to shift agricultural demand to solar generation hours in renewables-rich states could be extended.
Rooftop solar 3. Improve the visibility of rooftop solar assets in India. Based on international examples, the Indian states can consider options to improve the visibility of rooftop solar systems.
• State regulators could appoint an entity to develop a distributed solar registry platform available to state DISCOMs, with registration of solar pump and rooftop solar systems to be included in (new and amended) connection requirements. The registry data would ideally be publicly available in an anonymous format and data

Renewables Integration in India 2021 Policy recommendations
PAGE | 81
should also be made available by the DISCOMs to the SLDC. In parallel, the DISCOMs would require consumers to register new installations of distributed solar equipment on the above-mentioned platform.
• DISCOMs can also develop a roadmap for distributed solar forecasting and assess the technical requirements and potential policies to support more rooftop solar uptake, such as TOU tariffs (included in the following section).
• Adding reactive power and voltage control capabilities to connection requirements embedded in the DISCOM and transmission connection codes can help rooftop solar become a system-friendly resource.
• Consideration could be given to the application of export limits to the distribution system (to be varied depending on how much can be accommodated at specific times) through a software-based approach called dynamic operating envelopes. This is a solution to prevent reverse flows in distribution networks due to increasing shares of grid-connected rooftop solar PV.
Tariff reforms and introduction of TOU tariffs 4. Implement tariff reforms, focusing on the revision of electricity tariff design and tariff options as one of the most important future tools to enable more demand-side flexibility in India. This would shift significant user volume from times of low solar output to times of high solar output and thus save system-level costs that could lead to greater affordability. Consider including tariff reforms that expand TOU pricing to more customers, adjusting the peak tariff slots and switching more users to default time-dependent tariffs.
5. The installation of smart meters coupled with other digital tools to provide demand response could create a foundation for the introduction of TOU tariffs in Indian states. Key enablers for TOU implementation include institutional strengthening, innovative business models, and consumer awareness and engagement programmes.
Energy storage 6. Develop a regulatory and remuneration framework for energy storage with specific reference to battery storage and pumped-storage hydro to capture their full value. National and state policies should include a definition of energy storage, including its size, technical capabilities, flexible nature and applications, and its categorisation as a generation, transmission and/or distribution asset, as has been done in the United Kingdom. Policy and regulatory barriers for batteries and pumped-storage hydro should be removed to ensure that they can take advantage of energy arbitrage opportunities from shifting energy demand within a day or week, and contribute to ancillary services for managing system ramps.
Renewables Integration in India 2021 Policy recommendations
PAGE | 82
Flexibility of coal plants 7. Develop state-level assessments to determine if coal power plant flexibility is a preferred (most cost-effective and least polluting) solution in the specific state. Develop state criteria to select the coal power plants best positioned for flexibility investment. Develop state regulatory mechanisms to encourage new investment in selected coal power plants and redesign compensation for flexible coal power plants. Further, coal power plant investment needs to be weighed against investment in flexibility sources from other parts of the system (storage, demand response and grids).
8. In the longer term, state agencies will need to play an important role in assessing and setting flexibility requirements at the state level on a plant-by-plant basis to balance state-level demand and supply. State-level ancillary services regulations and markets, combined with improved spot market participation, would help remunerate flexible plant operation on a competitive basis with other flexible resources such as demand-side response, storage and grid flexibility.
Interstate trade and wholesale market reforms 9. Strengthening the power trade across states could reduce the curtailment of renewables and provide access to low-cost generation in other states. This requires neighbouring states to improve the co-ordination of their scheduling and dispatch. There is also a need to weigh the costs and benefits of potential new transmission investments against the costs and benefits of other flexibility options for cost-optimal end results. States where solar and wind generation levels are expected to go beyond 100% of demand (in numerous hours a year by 2030) are recommended to build strong interstate interconnections.
10. Support regional and interstate transmission studies (such as that of the CSTEP). Such studies should then be assessed alongside those that address alternative power system flexibility resources, such as demand-side response, storage and power plant flexibility options.
11. Conduct national-level assessment of the costs and benefits of investments to promote synchronous connections with Bangladesh and Nepal, in addition to those already existing for Bhutan, to enlarge the geographical footprint for balancing.
12. State and central governments need to review and possibly reform the current state regulation and national market rules to give new participants equal access to compensation for providing flexibility. Identification of barriers to competition for

Renewables Integration in India 2021 Policy recommendations
PAGE | 83
new technologies (such as batteries) can be the first step for the state regulators. The development of new ancillary services and an ancillary services market would provide an opportunity to consider all new technologies from the start. Additionally, state grid codes can be reviewed and updated to ensure system-friendly connection and flexibility requirements are in place for new solar and wind projects, including distributed solar (rooftop and pumps).
13. The current practice of relying on physical PPAs for resource adequacy may not be the most cost-effective tool for achieving resource adequacy. Thus, the states could consider creating alternative resource adequacy mechanisms and encouraging the use of financial PPAs. In the longer term, a sophisticated financial market for power sector products could be introduced in India.
Recognising environmental concerns with flexibility 14. If the objective is emission reductions, the government should be aware that flexibility options in themselves can both decrease emissions and increase them, for example by enabling lower-cost coal generation to contribute more to the mix. Incentives for emission reductions and for preferential dispatch of lower-emission technologies may be needed in some systems to avoid unintended consequences.
15. Co-ordination across the states’ water, energy and power departments may need further emphasis going forward. State governments should support the improvement of water management practices and also support targeted analysis that estimates the impact of agricultural demand-shifting and pumped-storage hydro retrofits on water evaporation and water efficiency. The improvement of water management practices should also result in a more flexible, secure and resilient power sector by ensuring water availability for agricultural demand response, pumped-storage hydro and conventional power plants in periods of high water stress, such as during heatwaves, flooding or droughts.
System strength and inertia 16. With the future increase in solar and wind, the renewables-rich states will experience periods when wind and solar represent the majority of generation, which may affect system stability. It will be important that states monitor local system strength and inertia requirements.
Renewables Integration in India 2021 Annex
PAGE | 84
Annex: Power system modelling and methodology
India Regional Power System Model and Gujarat State Power System Model
To provide a deeper analysis of the impact of increasing renewables and the role of flexibility in India, the IEA has developed two power system models: the India Regional Model and the Gujarat State Model. Both models undertake a techno-economic analysis using a production cost modelling approach, with a focus on the operational aspects for a one-year “snapshot” of 2030, in addition to 2019 as the reference year. Both models are hourly, and enrich the IEA’s power sector modelling by including interregional transmission as well as detailed operating characteristics such as operating costs, plant technical minimum operating levels, minimum up and down times, start-up times and ramp rates. It is important to note that an hourly time resolution does not fully capture aspects such as plant-level ramp rate restrictions, and that metrics such as renewables curtailment may be underestimated relative to a more detailed time resolution.
For both models, emissions have been calculated according to estimated fuel characteristics and plant efficiencies. Although the two models are not directly linked, the emissions from power imports in the Gujarat State Model are estimated using hourly emissions intensity from the India Regional Model, and hourly import volumes.
IEA India Regional Model
To allow for a more detailed analysis of flexibility needs, this model includes a representation of the five regions controlled by the regional load dispatch centres and the interregional transmission connections, which are based on CEA plans and account for transfer capability limitations reported by POSOCO. Production profiles for renewables were represented, along with operating costs and characteristics for thermal technologies. Hourly simulations were based on unit commitment and economic dispatch.
For the India Regional Model, three 2030 scenarios were included in addition to the 2019 base year:
The STEPS case includes a full range of flexibility solutions (trade between regions, demand-side response, batteries and power plant flexibility).
The transmission downside case includes transmission transfer capability limitations in 2030.
The combined low flexibility case, in addition to transfer capability limitations, excludes flexibility from power plants, demand response and batteries.

Renewables Integration in India 2021 Annex
PAGE | 85
Load profiles for the India Regional Model were based on detailed analysis from the World Energy Outlook STEPS scenario to provide hourly electricity demand curves. Annual electricity demand projections for each end use by sector relied on national macro indicators such as population dynamics and economic growth, integrating the latest policies. The potential for demand-side response by end use was developed based on the projected demand in each region. Power generation capacity expansion in India was determined on the basis of current and proposed policies and the value-adjusted levelised cost of electricity. Projected capacity for existing and new technologies was made available for dispatch. The capacity expansion is aligned with India’s nationally determined contribution and the Paris Agreement.
IEA Gujarat State Model
The Gujarat State Model is based on a state-level demand forecast and historical hourly demand provided by CER, IIT Kanpur. Agricultural demand response is based on the analysis by Khanna. While further demand response measures are important to analyse, these were beyond the scope of the project, in part due to challenges of readily accessing detailed end-use data. The generation capacities were based on Gujarat government targets, taking into account the announced objective to add no new coal capacity.
The model takes a “contracted capacity” approach so that only capacity contracted by Gujarat is represented, including out-of-state capacity (i.e. central plants allocated to Gujarat). As a result, a large amount of planned renewables capacity in Gujarat that is intended to be contracted to other states (20 GW in the Kutch hybrid park) is not included in the model. It is worth noting that this capacity, depending on how it is integrated into the grid locally in Gujarat, could potentially further increase the integration challenges beyond the results presented in this report.
The Gujarat State Model is separated into four main regions based on the DISCOM areas in Gujarat, in addition to one separate node for the renewables-rich Kutch region, two nodes for the cities of Surat and Ahmedabad, and external nodes in Haryana, Rajasthan, Maharashtra and Madhya Pradesh for out-of-state plants contracted to Gujarat. Transmission between regions is based on 400 kV and above lines that already exist. No transmission expansion was included in the state model as the constraints between the DISCOMs were not found to be a driver of integration challenges or increased costs in the scenarios studied. The flexibility options included and their sizing were based on consultation with the Gujarat government and other stakeholders. While the Gujarat model is not integrated into an all-India model, energy imports are allowed in from the external nodes within the limits of the transmission constraints.
In addition to the base scenario for FY 2018/19, eight different scenarios are presented here for FY 2029/30. The reference scenario is a limited flexibility case
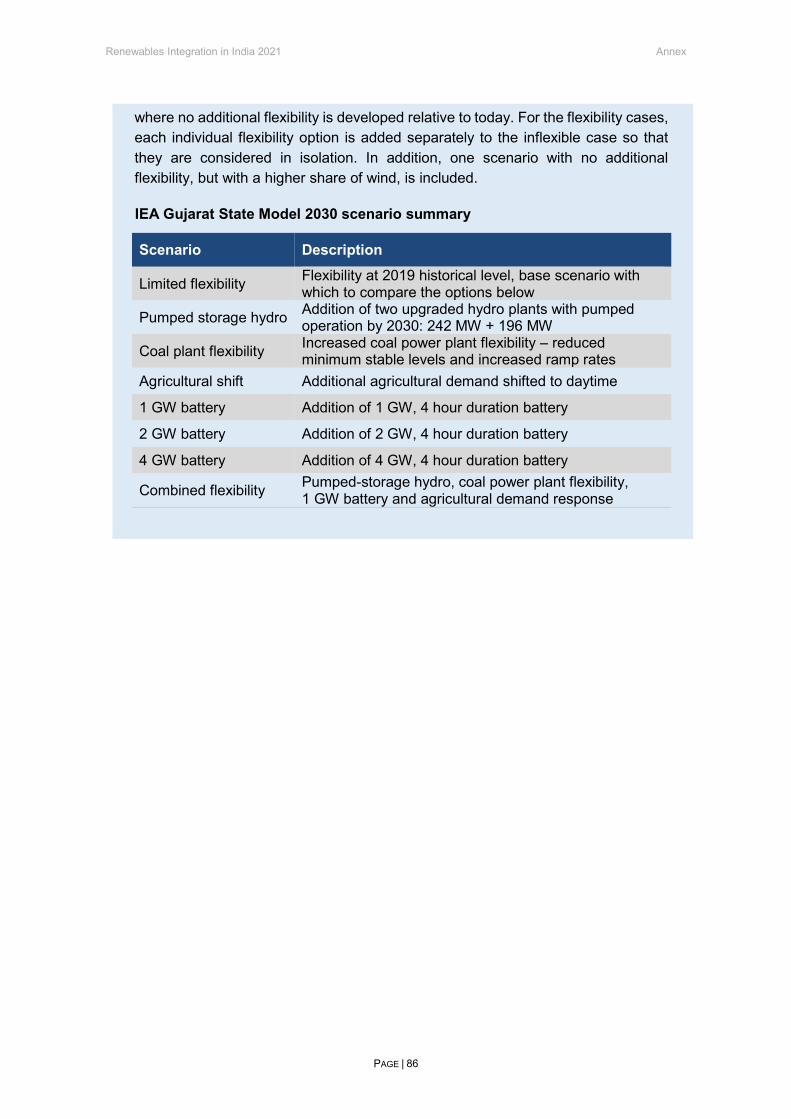
Renewables Integration in India 2021 Annex
PAGE | 86
where no additional flexibility is developed relative to today. For the flexibility cases, each individual flexibility option is added separately to the inflexible case so that they are considered in isolation. In addition, one scenario with no additional flexibility, but with a higher share of wind, is included.
IEA Gujarat State Model 2030 scenario summary
Scenario Description
Limited flexibility Flexibility at 2019 historical level, base scenario with which to compare the options below
Pumped storage hydro Addition of two upgraded hydro plants with pumped operation by 2030: 242 MW + 196 MW
Coal plant flexibility Increased coal power plant flexibility – reduced minimum stable levels and increased ramp rates
Agricultural shift Additional agricultural demand shifted to daytime
1 GW battery Addition of 1 GW, 4 hour duration battery
2 GW battery Addition of 2 GW, 4 hour duration battery
4 GW battery Addition of 4 GW, 4 hour duration battery
Combined flexibility Pumped-storage hydro, coal power plant flexibility, 1 GW battery and agricultural demand response
Renewables Integration in India 2021 Abbreviations, acronyms and units of measure
PAGE | 87
References
Abhyankar, Nikit, Shruti Deorah and Amol Phadke (forthcoming), Assessing the Least Cost Resource Mix for the Indian Power Sector in 2030, Lawrence Berkeley National Laboratory.
AEMC (Australian Energy Market Commission) (2021), Fast Frequency Response Market Ancillary Service Rule Change Request, https://www.aemc.gov.au/rule-changes/fast-frequency-response-market-ancillary-service.
APPDCL (Andhra Pradesh Power Development Company Limited) (2020), Expression of Interest for Identifying Agencies for Study and Implementation of the Flexibility operation of 2x800 MW, SDSTPS, https://apgenco.gov.in/asset/docs/file1/3110.pdf.
APVI (Australian Photovoltaic Institute), Mapping Australian Photovoltaic Installations, https://pv-map.apvi.org.au/historical.
Bardhan, R. et al. (2020), “REST framework: A modelling approach towards cooling energy stress mitigation plans for future cities in warming Global South”, Sustainable Cities and Society, Vol. 61, p. 102315. https://doi.org/10.1016/j.scs.2020.102315.
CEA (Central Electricity Authority) (2021a), Monthly Renewable Energy Generation Report, https://cea.nic.in/renewable-generation-report/?lang=en.
CEA (2021b), Executive Summary on Power Sector February 2021, https://cea.nic.in/executive-summary-report/?lang=en.
CEA (2019), Long-Term Electricity Demand Forecasting, https://cea.nic.in/old/reports/others/planning/pslf/Long_Term_Electricity_Demand_Forecasting_Report.pdf.
CEEW (Council on Energy, Environment and Water) (2020), Reallocating Water for India’s Growth, https://www.ceew.in/publications/reallocating-water-india%E2%80%99s-growth.
CEEW (2019), Wholesale Power Market in India, https://cef.ceew.in/masterclass/explains/wholesale-power-market-in-india.
CER, IITK (Centre for Energy Regulation, Indian Institute of Technology Kanpur) (2020), Regulatory Insights, https://cer.iitk.ac.in/newsletters/regulatory_insights/Volume02_Issue04.pdf.
CER, IITK (2019), Tariff Principles and Design, https://cer.iitk.ac.in/assets/downloads/FoR_CBP12/Day_1/Distribution_Tariff_and_TOD_Tariff_11_Feb_2019.pdf.
CPUC (California Public Utilities Commission) (2021), What Are TOU Rates?, https://www.cpuc.ca.gov/general.aspx?id=12194.
CSTEP (Center for Study of Science, Technology and Policy) (2020), Grid Impact for High RE Scenarios in Southern India, https://cstep.in/publications-details.php?id=1424.
Debnath, R., R. Bardhan and M. Sunikka-Blank (2019), “How does slum rehabilitation influence appliance ownership? A structural model of non-income drivers”, Energy Policy, Vol. 132, pp. 418-428. https://doi.org/10.1016/j.enpol.2019.06.005.

Renewables Integration in India 2021 Abbreviations, acronyms and units of measure
PAGE | 88
Hydro Tasmania (2016), Managing a High Penetration of Renewables – A Tasmanian Case Study, https://www.aemo.com.au/Media-Centre/~/-/media/B47810C12E25473CB81968D5D4218F78.ashx.
IEA (International Energy Agency) (2021a), India Energy Outlook 2021, https://www.iea.org/reports/india-energy-outlook-2021.
IEA (2021b), Karnataka Power System Transformation Workshop, https://www.iea.org/events/power-system-transformation-workshop-3-state-of-karnataka.
IEA (2020a), Renewables 2020, https://www.iea.org/reports/renewables-2020.
IEA (2020b), Maharashtra Power System Transformation Workshop Report, https://www.iea.org/events/power-system-transformation-workshop-1-state-of-maharashtra.
IEA (2020c), World Energy Outlook 2020, https://www.iea.org/reports/world-energy-outlook-2020.
IEA (2020d), India 2020 Energy Policy Review, https://www.iea.org/reports/india-2020.
IEA (2020e), Gujarat Power System Transformation Workshop, https://www.iea.org/events/power-system-transformation-workshop-2-state-of-gujarat.
IEA (2020f), World Energy Investment 2020, IEA, Paris, https://www.iea.org/reports/world-energy-investment-2020.
IEA (2020g), Demand Response, https://www.iea.org/reports/demand-response#tracking-progress.
IEA (2019a), US Regulatory Innovation to Boost Power System Flexibility and Prepare for Ramp Up of Wind And Solar, https://www.iea.org/commentaries/us-regulatory-innovation-to-boost-power-system-flexibility-and-prepare-for-ramp-up-of-wind-and-solar.
IEA (2019b), Status of Power System Transformation 2019: Power System Flexibility, https://www.iea.org/reports/status-of-power-system-transformation-2019.
IEA (2018a), System Integration of Renewables – An update on Best Practice, https://www.iea.org/reports/system-integration-of-renewables.
IEA (2018b), Status of Power System Transformation 2018 – Advanced Power Plant Flexibility, https://www.iea.org/reports/status-of-power-system-transformation-2018.
IEA (2018c), World Energy Outlook 2018, https://www.iea.org/reports/world-energy-outlook-2018.
IEA (2018d), The Future of Cooling, https://www.iea.org/reports/the-future-of-cooling.
IEA and RTE (2021), Conditions and Requirements for the Technical Feasibility of a Power System with a High Share of Renewables in France towards 2050, https://www.iea.org/reports/conditions-and-requirements-for-the-technical-feasibility-of-a-power-system-with-a-high-share-of-renewables-in-france-towards-2050.
IITK (Indian Institute of Technology Kanpur) (2021), Energy Analytics Lab, https://eal.iitk.ac.in/.
Renewables Integration in India 2021 Abbreviations, acronyms and units of measure
PAGE | 89
Kachhawa, S., S. Kumar and M. Singh (2019), “Decoding India’s residential building stock characteristics to enable effective energy efficiency policies and programs”, ECEEE Summer Study Proceedings, https://www.eceee.org/library/conference_proceedings/eceee_Summer_Studies/2019/7-make-buildings-policies-great-again/decoding-indias-residential-building-stock-characteristics-to-enable-effective-energy-efficiency-policies-and-programs/.
Karnataka State Load Dispatch Centre (2020), RE Curtailment, http://kptclsldc.com/recurtail.aspx
Khanna, T. (2021), “Optimizing agricultural demand response for reducing costs of renewable energy integration in India”, Working Paper, http://hdl.handle.net/10419/228611.
MNRE (Ministry of New and Renewable Energy) (2021), Physical Progress, https://mnre.gov.in/the-ministry/physical-progress.
MNRE (2020), Annual Report 2019-20, https://mnre.gov.in/knowledge-center/publication.
MOP, GoI (Ministry of Power, Government of India) (2021), UDAY Feeder Separation, https://www.uday.gov.in/national_parameter_dashboard.php?id=8.
NREL (2020), Policy and Regulatory Readiness for Utility-Scale Energy Storage: India, https://www.nrel.gov/international/india-policy-regulatory-readiness.html.
NSGM, GoI (National Smart Grid Mission, Government of India) (2021), Smart Meters Installed in India, https://www.nsgm.gov.in/en/content/sm-stats.
NSGM, GoI (2020), Smart Grid Readiness Self Assessment Tool, https://www.nsgm.gov.in/sites/default/files/SGR-SAT-Flyer-WUS-2020.pdf.
Partha Das et al. (2020), “Flexibility requirement for large-scale renewable energy integration in Indian power system: Technology, policy and modeling options”, Energy Strategy Reviews, Vol. 29, p. 100482, https://www.sciencedirect.com/science/article/pii/S2211467X20300353.
PFC (Power Finance Corporation Ltd.) (2019), Performance Report of State Power Utilities, https://pfcindia.com/Home/VS/29.
Platts (2020), World Electric Power Plants Database, https://www.spglobal.com/platts/pt/products-services/electric-power/world-electric-power-plants-database.
POSOCO WRLDC (Power System Operation Corporation, Western Region Load Dispatch Centre) (2020), Role of Grid Network flexibility in Western Region and National Context, https://www.iea.org/events/power-system-transformation-workshop-1-state-of-maharashtra.
Prayas Energy Group (2020), Submission from Prayas Energy Group, https://www.prayaspune.org/peg/publications/item/448-maharashtra-discom-msedcl-s-tariff-petition-for-the-fy21-to-fy25-and-true-up-for-fy18-to-20-comments-and-suggestions.html.
PSR Program (2021), Facilitating Remote Monitoring of Solar Pumps, https://www.psrindia.com/Upload/Resource/Brochures/Document/Kusum%20Portal20210215105848256.pdf.
WRI (World Resources Institute) (2021), Aqueduct Water Risk Atlas, https://www.wri.org/aqueduct/.
WRI (2018), Parched Power: Water Demands, Risks, and Opportunities for India’s Power Sector, https://www.wri.org/publication/parched-power.

Renewables Integration in India 2021 Abbreviations, acronyms and units of measure
PAGE | 90
Abbreviations and acronyms APPDCL Andhra Pradesh Power Generation Development Company Limited ASEAN Association of Southeast Asia Nations CEA Central Electricity Authority CEEW Council on Energy, Environment and Water CO2 carbon dioxide CPUC California Public Utilities Commission CSTEP Center for Study of Science, Technology and Policy DISCOM distribution company EV electric vehicle FERC Federal Energy Regulatory Commission FY financial year GDP gross domestic product IEA International Energy Agency IEX India Energy Exchange ISGF India Smart Grid Forum LBNL Lawrence Berkeley National Laboratory MIGRATE Massive InteGRATion of power Electronic devices MNRE Ministry of New and Renewable Energy NITI Aayog National Institution for Transforming India NREL National Renewable Energy Laboratory POSOCO Power System Operation Corporation Limited, India PPA power purchase agreement PSH pumped-storage hydro PV photovoltaic PXIL Power Exchange India Limited RUVNL Rajasthan Urja Vikas Nigam Limited SDS Sustainable Development Scenario SEDM Solar Energy Data Management SLDC state load dispatch centre STEPS Stated Policies Scenario TOU time-of-use VRE variable renewable energy WEO World Energy Outlook
Units of measure g CO2 gram of carbon dioxide g CO2/kWh grams of carbon dioxide per kilowatt hour Gt CO2 gigatonne of carbon dioxide Gt CO2/yr gigatonnes of carbon dioxide per year GW gigawatt GWh gigawatt hour GWs gigawatt second

Renewables Integration in India 2021 Abbreviations, acronyms and units of measure
PAGE | 91
INR Indian rupee kg kilogramme kV kilovolt kW kilowatt kWh kilowatt hour MW megawatt MWh megawatt hour TWh terawatt hour

Copyright © 2021: International Energy Agency (IEA) and NITI Aayog
This report is the result of a collaborative effort between the International Energy Agency (IEA) and NITI Aayog.
This report reflects the views of the IEA Secretariat and NITI Aayog but does not necessarily reflect those of the IEA’s individual Member countries. The report does not constitute professional advice on any specific issue or situation. NITI Aayog and the IEA make no representation or warranty, express or implied, in respect of the report’s contents (including its completeness or accuracy) and shall not be responsible for any use of, or reliance on, the report. For further information, please contact: [email protected] and [email protected]
Rights and Permissions
This work is available under the Creative Commons Attribution-NonCommercial- 3.0 IGO licence (CC BY-NC 3.0 IGO) https://creativecommons.org/licenses/by-nc/3.0/igo/ . You are free to copy and redistribute the material and to adapt, remix, transform, and build upon the material provided the use is for non-commercial purposes, under the following conditions:
Attribution: Please cite the work as follows : International Energy Agency (IEA) /NITI Aayog, 2021. All rights reserved.
Third-party content: The OECD/IEA and NITI Aayog do not necessarily own each component of the content contained within the work. Therefore, neither the OECD, the IEA, nor NITI Aayog warrant that the use of any third-party owned individual component or part contained in the work will not infringe on the rights of those third parties. The risk of claims resulting from such infringement rests solely with you. If you wish to re-use a component of the work, it is your responsibility to determine whether permission is needed for that re-use and to obtain permission from the copyright owner. Examples of components can include, but are not limited to, tables, figures, or images.
Translations—If you create a translation of this work, please add the following disclaimer along with the attribution: This is an unofficial translation of the work from the English language. The translation was not created by the IEA or NITI Aayog, which take no responsibility for the accuracy or completeness of this translation.
Adaptations—If you create an adaptation of this work, please add the following disclaimer along with the attribution: This is an adaptation of an original work by IEA, and NITI Aayog. Views and opinions expressed in the adaptation are the sole responsibility of the author or authors of the adaptation and do not necessarily reflect the views or policy of the IEA Secretariat, IEA Member countries or NITI Aayog.
Any queries on rights and licenses, including subsidiary rights, except as indicated below, should be addressed to: [email protected].
This publication and any map included herein are without prejudice to the status of or sovereignty over any territory, to the delimitation of international frontiers and boundaries and to the name of any territory, city or area.
Typeset in France by IEA – June 2021 Cover design: IEA Photo credits: © Shutterstock
