renewable electricity use by the u.s. information and ... · communication technology ... industry...
TRANSCRIPT

NREL is a national laboratory of the U.S. Department of Energy Office of Energy Efficiency & Renewable Energy Operated by the Alliance for Sustainable Energy, LLC This report is available at no cost from the National Renewable Energy Laboratory (NREL) at www.nrel.gov/publications.
Contract No. DE-AC36-08GO28308
Renewable Electricity Use by the U.S. Information and Communication Technology (ICT) Industry John Miller, Lori Bird, Jenny Heeter, and Bethany Gorham National Renewable Energy Laboratory
Technical Report NREL/TP-6A20-64011 July 2015

NREL is a national laboratory of the U.S. Department of Energy Office of Energy Efficiency & Renewable Energy Operated by the Alliance for Sustainable Energy, LLC This report is available at no cost from the National Renewable Energy Laboratory (NREL) at www.nrel.gov/publications.
Contract No. DE-AC36-08GO28308
National Renewable Energy Laboratory 15013 Denver West Parkway Golden, CO 80401 303-275-3000 • www.nrel.gov
Renewable Electricity Use by the U.S. Information and Communication Technology (ICT) Industry John Miller, Lori Bird, Jenny Heeter and Bethany Gorham National Renewable Energy Laboratory
Prepared under Task No. 2940.2400
Technical Report NREL/TP-6A20-64011 July 2015

NOTICE
This report was prepared as an account of work sponsored by an agency of the United States government. Neither the United States government nor any agency thereof, nor any of their employees, makes any warranty, express or implied, or assumes any legal liability or responsibility for the accuracy, completeness, or usefulness of any information, apparatus, product, or process disclosed, or represents that its use would not infringe privately owned rights. Reference herein to any specific commercial product, process, or service by trade name, trademark, manufacturer, or otherwise does not necessarily constitute or imply its endorsement, recommendation, or favoring by the United States government or any agency thereof. The views and opinions of authors expressed herein do not necessarily state or reflect those of the United States government or any agency thereof.
This report is available at no cost from the National Renewable Energy Laboratory (NREL) at www.nrel.gov/publications.
Available electronically at SciTech Connect http:/www.osti.gov/scitech
Available for a processing fee to U.S. Department of Energy and its contractors, in paper, from:
U.S. Department of Energy Office of Scientific and Technical Information P.O. Box 62 Oak Ridge, TN 37831-0062 OSTI http://www.osti.gov Phone: 865.576.8401 Fax: 865.576.5728 Email: [email protected]
Available for sale to the public, in paper, from:
U.S. Department of Commerce National Technical Information Service 5301 Shawnee Road Alexandria, VA 22312 NTIS http://www.ntis.gov Phone: 800.553.6847 or 703.605.6000 Fax: 703.605.6900 Email: [email protected]
Cover Photos by Dennis Schroeder: (left to right) NREL 26173, NREL 18302, NREL 19758, NREL 29642, NREL 19795.
NREL prints on paper that contains recycled content.
iii
This report is available at no cost from the National Renewable Energy Laboratory (NREL) at www.nrel.gov/publications.
Acknowledgements The authors thank Stuart Macmillan of the National Renewable Energy Laboratory (NREL) for his leadership of this project and thank Doug Arent (JISEA/NREL) for support of this work. For their consultation on the information and communication technology sector, the authors would like to thank Sekita Grant, Aditi Mohapatra, and Ryan Schuchard, Business for Social Responsibility; Paul Dickinson, CDP Worldwide; Andrew Smith and Darrel Stickler, Cisco Systems, Inc.; John Pflueger, Dell; James Critchfield and Mollie Lemon, Environmental Protection Agency; Bill Weihl, Facebook; Gary Demasi and Joyce Dickerson, Google; Gary Cook, Greenpeace; Chandrakant Patel, Hewlett-Packard; Jay Dietrich, IBM; Melissa Gray, Rackspace; Mathew Loving, Schneider Electric.
Finally, for their thoughtful review of the document, the authors thank Frederick Freeman, Apple; Aniruddha Deodhar, Autodesk; Ryan Schuchard, Business for Social Responsibility; John Pflueger, Dell; Anthony Amato, Eastern Research Group; James Critchfield, Environmental Protection Agency; Bill Weihl, Facebook; David Pomerantz, Greenpeace; Jenna Goodward, Microsoft; Lily Donge, Rocky Mountain Institute; Jonathan Koomey, Stanford University; Priya Barua, World Resources Institute; and Doug Arent, Austin Brown, Jaquelin Cochran, Jeff Logan, Stuart Macmillan and David Mooney of NREL.

iv
This report is available at no cost from the National Renewable Energy Laboratory (NREL) at www.nrel.gov/publications.
List of Acronyms BSR Business for Social Responsibility BRC Business Renewable Center C-FACT Corporate Finance Approach to Climate Stabilizing Targets CAGR compound annual growth rate CDP Carbon Disclosure Project Worldwide CPAE customer premises access equipment CRT cathode ray tube EIA U.S. Energy Information Administration EPA U.S. Environmental Protection Agency GHG greenhouse gas GPP Green Power Partnership IBM International Business Machines Corporation ICT information and communication technology IP Internet protocol LCD liquid crystal display MWh megawatt-hour NRDC Natural Resources Defense Council NREL National Renewable Energy Laboratory PPA power purchase agreement PV photovoltaics RE renewable energy REC renewable energy certificate WRI World Resources Institute WWF World Wildlife Foundation

v
This report is available at no cost from the National Renewable Energy Laboratory (NREL) at www.nrel.gov/publications.
Executive Summary The information and communication technology (ICT) sector continues to witness rapid growth and uptake of ICT equipment and services at both the national and global levels. The electricity consumption associated with this expansion is substantial, although recent adoptions of cloud-computing services, co-location data centers, and other less energy-intensive equipment and operations have likely reduced the rate of growth in this sector.
With opportunities to reduce costs and address both corporate- and client-based social and environmental goals, an increasing number of ICT companies are becoming active managers in reducing their electricity use. Some of these reduction options include deploying less ICT infrastructure and increasing reliance on ITC services. Another opportunity involves using more efficient processes and equipment in ICT operations. A third option involves powering ICT equipment and services with clean/low-carbon electricity sourced from resources such as renewables. The ICT industry has expressed growing interest in the clean/low-carbon electricity option, but has acknowledged that barriers remain in place for many ICT companies in terms of how to navigate and finance the renewable procurement process. As it stands, information regarding renewable energy purchases by the ICT sector, as well as current and anticipated electricity consumption in the sector, has been incomplete or unavailable.
This paper seeks to fill those gaps by examining trends in renewable electricity use by the ICT industry. Our analysis examines renewable electricity use by 113 ICT companies in the United States using data from the U.S. Environmental Protection Agency’s (EPA’s) Green Power Partnership and the Carbon Disclosure Project Worldwide (CDP). The 113 ICT companies examined collectively consumed more than 59 million MWh of electricity in 2014, which represents 1.5% of the total U.S. electricity consumption. Of the 59 million MWh, 14% (8.3 million MWh) was sourced from voluntary renewable electricity. Companies are using a mix of power purchase agreements (PPAs), on-site generation, utility green power products, and renewable energy certificates (RECs).
The potential demand for renewable electricity by the ICT sector could grow substantially as financial and social incentives encourage a larger share of ICT companies to purchase renewable electricity and prompt companies already purchasing to increase their commitments. The potential for expanded renewable deployment will be driven by a combination of 1) underlying electricity growth rates by ICT companies, and 2) the extent to which ICT companies currently not procuring renewables begin to take action, especially companies without a customer-facing business (e.g. co-location providers).
By 2020, the group of 113 companies in our sample could procure 18.5 million MWh to more than 37 million MWh of renewable electricity, representing 31% and 48% renewable electricity use on an industry average basis, respectively, depending on the increase in renewable percentages and underlying growth in electricity consumption. Our High Case scenario represents electricity growth rates of 4% annually with potential average renewable procurement of 48%. Our Low Case represents flat electricity growth with potential average

vi
This report is available at no cost from the National Renewable Energy Laboratory (NREL) at www.nrel.gov/publications.
renewable procurement of 31%.1 Companies outside of our scope of 113 reporting companies may also begin purchasing renewables, which would contribute to larger renewable use by the ICT sector.
As more and more ICT companies publicly report their environmental and energy performance metrics and goals, a greater understanding of the industry’s overall impact on U.S. and global electricity consumption is being revealed. Given the scale of electricity use by ICT companies, renewable electricity procurement across all levels of the industry could be a significant market driver for renewable development in the United States.
This paper is intended to aggregate existing ICT industry data and research to provide an initial look at electricity use, current and future renewable electricity acquisition, as well as serve as a benchmark for future growth and trends in ICT industry renewable electricity consumption.
1 Our renewable procurement scenarios incorporate existing purchasing levels and corporate goals (e.g. 100% renewable by 2020).

vii
This report is available at no cost from the National Renewable Energy Laboratory (NREL) at www.nrel.gov/publications.
Table of Contents 1 Introduction ........................................................................................................................................... 1 2 Current ICT Sector Electricity Consumption and Historic Growth ................................................. 2
2.1 ICT Electricity Consumption by Source ....................................................................................... 3 2.1.1 Data Centers ..................................................................................................................... 3 2.1.2 Telecommunications ........................................................................................................ 4 2.1.3 End-Use Devices .............................................................................................................. 5
3 ICT Industry Renewable Electricity Use ............................................................................................. 6 3.1 Renewable Electricity Procurement Methods ............................................................................... 6
3.1.1 ICT Industry Renewable Procurement Types .................................................................. 7 3.2 ICT Industry Reported Data .......................................................................................................... 9
3.2.1 ICT Electricity Consumption and Renewable Electricity Use Data ................................ 9 3.2.2 CDP Data ....................................................................................................................... 10 3.2.3 EPA’s Green Power Partnership Data ............................................................................ 11
3.3 ICT Renewable Electricity and Carbon Goals ............................................................................ 14 3.3.1 Company Case Studies ................................................................................................... 15
4 Future Renewable Electricity Use Potential .................................................................................... 17 5 Summary and Conclusions ............................................................................................................... 19 Appendix A. ICT Company Case Studies ............................................................................................... 26
Apple .................................................................................................................................................... 26 Autodesk ............................................................................................................................................... 26 Cisco Systems ....................................................................................................................................... 27 Dell ..................................................................................................................................................... 27 eBay ..................................................................................................................................................... 28 Facebook .............................................................................................................................................. 28 Google .................................................................................................................................................. 29 Intel ..................................................................................................................................................... 30 Microsoft .............................................................................................................................................. 30
Appendix B. ICT Company Renewable Electricity Use ......................................................................... 31

1
This report is available at no cost from the National Renewable Energy Laboratory (NREL) at www.nrel.gov/publications.
1 Introduction As consumers increasingly rely on the Internet, online services, and rapid communications, the electricity use required by information, communication, and technology (ICT) companies will remain substantial. The ICT sector is already a large user of electricity, with data centers alone representing 2.4% of total 2013 U.S. electricity consumption (NRDC 2014; EIA 2014). Future electricity use will depend on the growth of ICT and how efficient these companies become at delivering ICT services.
While there will certainly be increases in data use and Internet traffic, the extent to which ICT electricity consumption increases will depend on how quickly companies will increase their efficiency. Global mobile data, largely driven by increasing Internet access via smartphones and mobile video streaming, increased approximately 69% in 2014 (Greenpeace 2015). Cisco Systems, Inc. recently forecast that from 2014 to 2019, the compound annual growth rate (CAGR) of global Internet protocol (IP) traffic will be approximately 23% (Cisco Systems, Inc. 2015).
A number of large ICT companies are making substantial commitments to reduce their electricity consumption and to invest in clean and renewable electricity sources, often as part of a broader strategy to reduce corporate greenhouse gas (GHG) emissions. In some cases, these commitments are substantial and, in fact, several leading companies have committed to procuring 100% of their electricity from renewable electricity sources. In an effort to achieve these targets, many ICT companies, including Amazon, Apple, Autodesk, Google, and Microsoft, have recently announced large investments in wind and solar electricity projects. Some of these companies plan to procure renewable electricity by signing long-term power purchase agreements (PPAs), which will further support the deployment of renewable electricity in the United States.
This paper examines the trends in renewable electricity procurement by the ICT sector, how it compares to other sectors, and potential future growth. Throughout the paper, we focus primarily on subsectors of the ICT industry under direct control by companies (e.g., data center or telecommunication network electricity consumption), with minimal reference to subsectors that are subject to company influence (e.g., electricity consumed through the use of electronic devices).
In Section 2, we examine electricity consumption and growth rates in the ICT industry both in the United States and globally, as well as the major sources of electricity consumption in the sector. In Section 3, we explore current renewable electricity commitments by ICT companies, including goals for procuring renewables to meet all or a portion of their electricity usage, and the types of investments, such as installations of on-site systems or contracts with large-scale renewable electricity projects. Finally in Section 4, we explore the magnitude of potential growth in renewable electricity procurement from the ICT sector under several scenarios of electricity consumption growth and the potential for expanded purchase commitments. Appendix A contains case studies of nine companies that are implementing innovative strategies to incorporate renewable electricity into their electricity portfolios.
2
This report is available at no cost from the National Renewable Energy Laboratory (NREL) at www.nrel.gov/publications.
2 Current ICT Sector Electricity Consumption and Historic Growth
This section explores available data on electricity consumption across the ICT sector in the United States and globally to provide an indication of the overall magnitude of consumption, trends, and factors driving growth. Comparing estimates of electricity consumption by the ICT industry is challenging because of differences in how subsectors have been characterized across various studies.
Comprehensive data for electricity consumption by the U.S. ICT industry are not available, although U.S. data center electricity usage was estimated to be 78 million MWh in 2010 (2% of total U.S. electricity demand) and 91 million MWh in 2013 (2.4% of total U.S. electricity demand) (Koomey 2011; NRDC 2014).
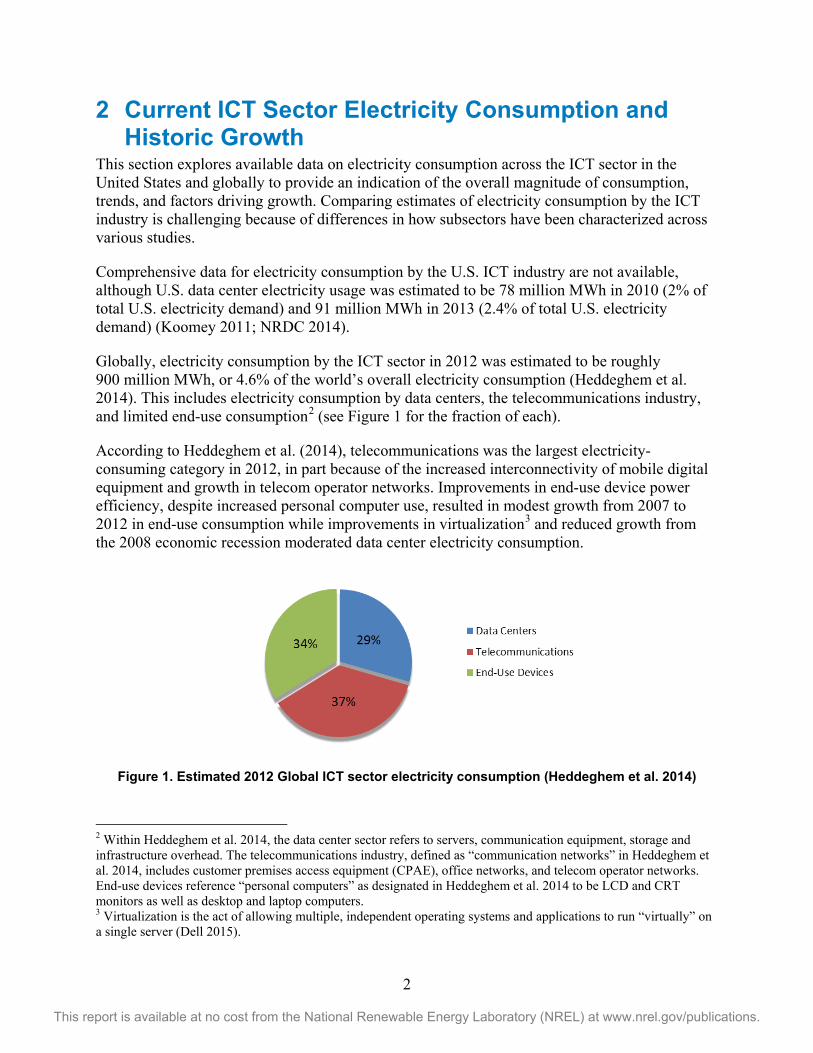
Globally, electricity consumption by the ICT sector in 2012 was estimated to be roughly 900 million MWh, or 4.6% of the world’s overall electricity consumption (Heddeghem et al. 2014). This includes electricity consumption by data centers, the telecommunications industry, and limited end-use consumption2 (see Figure 1 for the fraction of each).
According to Heddeghem et al. (2014), telecommunications was the largest electricity-consuming category in 2012, in part because of the increased interconnectivity of mobile digital equipment and growth in telecom operator networks. Improvements in end-use device power efficiency, despite increased personal computer use, resulted in modest growth from 2007 to 2012 in end-use consumption while improvements in virtualization3 and reduced growth from the 2008 economic recession moderated data center electricity consumption.
Figure 1. Estimated 2012 Global ICT sector electricity consumption (Heddeghem et al. 2014)
2 Within Heddeghem et al. 2014, the data center sector refers to servers, communication equipment, storage and infrastructure overhead. The telecommunications industry, defined as “communication networks” in Heddeghem et al. 2014, includes customer premises access equipment (CPAE), office networks, and telecom operator networks. End-use devices reference “personal computers” as designated in Heddeghem et al. 2014 to be LCD and CRT monitors as well as desktop and laptop computers. 3 Virtualization is the act of allowing multiple, independent operating systems and applications to run “virtually” on a single server (Dell 2015).

3
This report is available at no cost from the National Renewable Energy Laboratory (NREL) at www.nrel.gov/publications.
Growth in electricity consumption for the ICT sector has substantially outpaced growth in total electricity consumption in prior years, though most recent data shows a slowdown in growth. Compared to a total global electricity consumption growth rate of 3% during 2007–2012, communication networks have increased electricity consumption by 10.4% annually, while electricity use from personal computers and data centers has grown by at least 4% annually. As a result of this recent growth in telecommunications, personal computer, and data center electricity consumption, these sectors are estimated to have accounted for 1.7%, 1.6%, and 1.4%, respectively, of the total worldwide electricity consumption in 2012 (Heddeghem et al. 2014). More recently, growth in global installed server base has slowed to around 4% (Thibodeau 2015).
2.1 ICT Electricity Consumption by Source 2.1.1 Data Centers In 2013, annual U.S. data center electricity use was approximately 91 million MWh, according to NRDC (2014), which aligns with earlier estimates by Koomey (2011) for 2000, 2005, and 2010. Table 1 presents estimates of U.S. and global data center electricity consumption and growth rates for 2000–2012.
Relative to the overall U.S. electricity consumption during these years, data center electricity use represents a growing share of U.S. total electricity consumption, climbing from 0.82% in 2000 to 2.00% in 2010 (Koomey 2011). The diminished compound annual growth rate (CAGR) from 2005 to 2010 (6.8%), relative to that of 2000 to 2005 (14.7%), reflects the effects of the 2008 economic recession as well as the decrease in servers installed due to increased virtualization (Koomey 2011).

4
This report is available at no cost from the National Renewable Energy Laboratory (NREL) at www.nrel.gov/publications.
Table 1. U.S. and Global Estimates of Data Center Electricity Use and Growth
U.S. 2000a 2005a 2007b 2010a 2012b
U.S. Electricity Consumption (Million MWh) 3,421 3,661
3,884
U.S. Data Center Electricity Use (Million MWh) 28.2 56
77.7
Data Center as Fraction of U.S. Electricity Consumption 0.82% 1.53%
2.00%
Compound Annual Growth Rate (CAGR)
(2000-2005)
(2005-2010)
14.7%
6.8%
GLOBAL 2000a 2005a 2007b 2010a 2012b
Global Electricity Consumption (Million MWh) 13,238 15,747 17,042c 18,118 19,718c
Global Data Center Electricity Use (Million MWh) 70.8 152.5 216 235.5 268
Data Center as Fraction of Global Electricity Consumption 0.53% 0.97% 1.27% 1.30% 1.36%
Compound Annual Growth Rate (CAGR)
(2000-2005)
(2005-2010)
(2007-2012)
16.6%
9.1% 4.4% a Column data sourced from Koomey 2011 b Column data sourced from Heddeghem et al. 2014 c Global electricity consumption values estimated using Figure 5 of Heddeghem et al. 2014
On a global level, data center electricity use grew at a CAGR of 16.6% from 2000 to 2005 and 9.1% from 2005 to 2010, relative to global electricity consumption. Much of the domestic and global growth witnessed during this period has been attributed by Koomey (2011) to the increasing reliance on digital data and expansion in Internet usage for digital records and application conversions, e-commerce, music and video downloads, and social networking. Additional work by Heddeghem et al. (2014) estimated global data center annual electricity consumption for 2007 and 2012 to be 216 million MWh and 268 million MWh, respectively, indicating a 4.4% CAGR.
2.1.2 Telecommunications For telecommunications, only global estimates of electricity consumption have been identified. Heddeghem et al. (2014) estimated global electricity usage by communication networks by separating out components attributable to telecom operator networks, office networks, and customer premises access equipment (CPAE). The study estimated that global communication networks consumed approximately 200 million MWh in 2007 and 330 million MWh in 2012, representing a CAGR of 10.4%. In both years, telecom operator networks contributed the most to electricity consumption, followed by CPAE and office networks components.

5
This report is available at no cost from the National Renewable Energy Laboratory (NREL) at www.nrel.gov/publications.
2.1.3 End-Use Devices Electricity consumption has also been estimated for end-use devices, which may include televisions, personal computers, mobile phones, printers, copiers, and tablets (Pickavet et al. 2008; Dutta and Bilbao-Osorio 2012). Heddeghem et al. (2014) considered only personal computers within households and offices along with monitors used to support those systems due to the availability and reliability of data for these items. The calculations of worldwide personal computer electricity use resulted in estimates of 238.9 million MWh in 2007 and 307.1 million MWh in 2012, which represented a CAGR of 5.3% from 2006 to 2012. Desktop personal computers were found to have the largest electricity usage per item over the same time period. The remaining devices, cathode ray tube monitors, liquid crystal display (LCD) monitors, and laptop computers, expressed comparable values around 2010, with electricity use from 2006 to 2012 increasing for laptops and LCD monitors while decreasing for cathode ray tube monitors.

6
This report is available at no cost from the National Renewable Energy Laboratory (NREL) at www.nrel.gov/publications.
3 ICT Industry Renewable Electricity Use A growing number of ICT companies are pursuing renewable electricity supply and energy efficiency measures to minimize the impact of their electricity demand. For example, renewable electricity use by ICT companies participating in the U.S. Environmental Protection Agency’s (EPA’s) Green Power Partnership (GPP) has grown from 0.5 million MWh in 2007 to 7.7 million MWh in 2014. This recent growth is in part due to the increasing number of companies pursuing renewables on behalf of carbon reduction goals and/or renewable electricity procurement commitments. Improvements in tracking and reporting these renewable electricity objectives through both internal and external resources help to illuminate achievements and opportunities across the ICT sector.
In this section, we discuss the various methods companies use to obtain renewable electricity as well as the commitments and goals that are driving procurement. We also examine the electricity and renewable purchasing data being reported by ICT companies to evaluate trends within the industry, including a number of case studies.
3.1 Renewable Electricity Procurement Methods Companies are purchasing renewables through a variety of methods, including on-site generation, power purchase agreements (PPAs), utility and competitive suppliers, and unbundled renewable energy certificates (RECs). In this section, and throughout the report, we report renewable procurement through all methods, with explanations of these various methods provided below:
• On-site renewable generation – The installation of a renewable generator(s) located at an organization’s facility(s). These systems can vary in terms of the type of renewable resource(s) utilized, as well as whether or not the generation and RECs are purchased by the organization hosting the renewable generator or the generation and/or RECs are sold to a third party (DOE 2010).
• Power purchase agreement (PPA) – PPAs are contracts entered into by a power producer, or provider, and a private entity, or purchaser, to sell renewable electricity from on- or off-site installations. In some cases, the purchase provides space to the provider to install a system from which the purchaser then purchases electricity from at a pre-determined price for the duration of the contract term. The provider benefits by selling electricity for a fixed period of time, whereas the purchasers receive power at a fixed price for the same period (NREL 2012). PPAs also enable corporate purchasers to support off-site renewable facilities. A few states do not allow for purchase power agreements, whereas in other states, some utilities have proposed new tariffs for large utility customers to purchase renewable electricity from a specific facility in the utility service territory, instead of negotiating a PPA directly (Heeter 2014).
• Unbundled RECs – RECs underpin every transaction that leads to an environmental claim (see Text Box 1). A REC is created with every megawatt-hour produced by renewable generators and serves as the basis for all renewable electricity claims. “Bundled” RECs are those RECs for which both the electricity generated and the environmental attributes associated with that generation are sold together. “Unbundled”

7
This report is available at no cost from the National Renewable Energy Laboratory (NREL) at www.nrel.gov/publications.
RECs contain only the environmental attributes of renewable electricity generation, with the electricity being sold separately (Heeter 2014).
• Utility green pricing – Programs provided by utilities in traditionally regulated electricity markets that provide customers with the option to purchase some type of green power product directly from a retail electricity provider (Heeter 2014).
• Competitive green power – Within competitive or restructured electricity markets, electricity customers often have the opportunity to purchase electricity generated from renewable sources by switching to an alternative electricity supplier that offers green power or, in some instances, remaining with a default electricity supplier that provides this option (Heeter 2014).
In addition to the renewable electricity procurement methods noted above, some ICT companies are participating in the Corporate Renewables Partnership (see Text Box 2) to advocate for new renewable purchasing options.
3.1.1 ICT Industry Renewable Procurement Types The ICT industry as a whole relies primarily on voluntary unbundled RECs to meet their renewable targets; 77% of ICT company purchases in the GPP are for unbundled RECs. CDP-reporting ICT companies used U.S. RECs to supply 61% of their global renewable electricity use. Depending on the technology type, project size, and/or financing sources, RECs may serve as an important revenue stream that can help bridge the gap between project development costs and revenue available from electricity sales.
Major ICT companies are beginning to purchase renewable electricity through long-term PPAs to support new renewable generators that may be located in the same region as their major loads. Recently, a few ICT companies signed long-term PPAs for renewable electricity. These long-term agreements enable project developers to finance new projects by providing a stable revenue stream. Having a project with a REC revenue source may also attract outside investment due to the project’s increased profitability (Holt et al. 2011).4
4 Additional information on long-term purchasing (either on-site or through PPAs) is available on EPA’s GPP Long-term Contracts Partner List. See: http://epa.gov/greenpower/toplists/index.htm.
Text Box 1: RECs and Renewable Claims The Federal Trade Commission’s Green Guides provide guidance to companies to help them avoid making misleading environmental claims. The Green Guides specify that making a claim such as “this product is made with wind power” is deceptive if the company does not own the RECs associated with that wind power. RECs are also a vital part of GHG inventories and carbon disclosure. The GHG Protocol’s Corporate Standard Scope 2 Guidance requires REC ownership to quantify the market-based reporting. The Protocol is policy neutral, but notes that companies can have an impact by: contracting directly with new projects, working with electricity suppliers to develop new projects, establishing “eligibility criteria” for corporate procurement, or by providing incremental funding or donations (WRI 2015).

8
This report is available at no cost from the National Renewable Energy Laboratory (NREL) at www.nrel.gov/publications.
Recently, a number of ICT companies signed long-term PPAs for renewable energy. In July 2014, Microsoft announced it would purchase 175 MW from the Pilot Hill Wind Project in Illinois as part of a 20-year PPA to power its Chicago data center (Microsoft Corporation 2014). Yahoo! Inc. agreed to purchase 23 MW from a 48-MW wind farm in Kansas through a 15-year PPA to offset its Great Plains region data center power consumption (Trabish 2014). Cisco announced in June 2015 that it would purchase electricity from a 20-MW solar facility near its San Jose, California headquarters as part of a 20-year PPA (Cisco 2015b). Additional companies such as Amazon Web Services, Apple, Facebook, and Google have also signed on to long-term PPAs to serve a variety of operational needs.
Renewable electricity purchase types differ by company, and in some cases are a function of the state markets in which the company operates, the in-house capabilities of electricity procurement officers, and the extent to which the company is customer-facing, among other variables. For example, large customer-facing companies such as Apple, Dell, Facebook, Google, and others have established purchasing principles that prioritize renewable electricity resources that provide “additionality”5. However, smaller business-to-business ICT companies are just beginning to focus on supplying their businesses with renewable electricity. Some ICT companies initially meet their renewable and/or carbon goals through the purchase of unbundled RECs, but as they develop more expertise, become interested in other procurement types.
5 The term additionality refers to whether an action is additional to what would have otherwise occurred under a business-as-usual scenario (Bird and Sumner 2011).
Text Box 2: Corporate Renewables Partnership Leading NGOs have formed the Corporate Renewables Partnership, which facilitates corporate renewable purchases and coordinates three separate initiatives.
• Business for Social Responsibility’s (BSR's) Future of Internet Power initiative aims to power the Internet with 100% renewable energy. The initiative works with the largest and most influential Internet companies to increase the priority for renewables when siting and selecting outsourced data center service providers (“co-los”), and to create new models for shared investment in renewable energy in the Internet’s supply chain. As of June 2015, members included Adobe, eBay, Etsy, Facebook, HP, LinkedIn, Salesforce, and Symantec. Future of Internet Power was founded in the fall of 2012.
• Rocky Mountain Institute’s Business Renewable Center (BRC) is a membership-based organization addressing transactional barriers to renewable procurement. In the near-term, the BRC is focused on exploring innovative aggregation models, supply chain engagement, and developing a portal of project profiles. The BRC membership is broader than just ICT companies, and includes eBay, Facebook, HP, Sprint and Salesforce.
• World Wildlife Fund (WWF) and the World Resources Institute (WRI) have created the Corporate Renewable Energy Buyers’ Principles, which outline six principles that corporations are looking for to procure more renewable energy (greater choice in procurement options; more access to cost-competitive options; long term, fixed-price contracts; access to new projects that reduce emissions beyond business as usual; streamlined third-party financing; and increasing purchasing options in collaboration with utilities and regulators). The Buyers’ Principles have 34 signatories, up from 12 signatories less than one year ago. Fourteen of the signatories are ICT companies. WWF and WRI are facilitating collaboration between the signatories, utilities, energy suppliers, and utility regulators to increase the ability of corporations to buy renewable energy.

9
This report is available at no cost from the National Renewable Energy Laboratory (NREL) at www.nrel.gov/publications.
3.2 ICT Industry Reported Data 3.2.1 ICT Electricity Consumption and Renewable Electricity Use Data There are no comprehensive estimates of electricity and renewable electricity use available for the ICT sector because companies are not required to report their electricity consumption or renewable electricity use to any government agency. However, a number of companies are choosing to voluntarily disclose electricity information through internal annual reports or website interfaces or through reporting to organizations such as the GPP, CDP, and the Global Reporting Initiative. In the following sections, we examine these data to better understand renewable electricity procurement activity and trends in the ICT sector.
A total of 113 ICT companies reported electricity information to CDP and/or GPP in 2014.6 Total U.S. electricity consumption for these companies was 59.2 million MWh in 2014 while the total U.S. voluntary renewable electricity use reported was 8.3 million MWh. In terms of total U.S. electricity use, these ICT companies accounted for 1.5% of total electricity consumption in 2014.7 Data are presented here for those companies that report to CDP and/or GPP, which represent the bulk of ICT companies procuring renewable electricity. However, we acknowledge that the list is not comprehensive. In particular, we note that data center service providers (co-location providers or “co-los”) are largely excluded from this sample.
Across ICT companies, renewable electricity use was found to vary greatly, with 27 companies procuring 100% or more of their electricity use through renewables, while 35 companies reported no use of renewable electricity. Table 2 provides a closer look at the top 30 U.S. companies applying renewable electricity to their overall electricity consumption. Appendix B shows a comprehensive table of renewable electricity consumption for all 113 ICT companies that report their electricity use.
6 EPA Green Power Partners report their energy use information on a rolling-basis throughout the year. Each Partner is required to report to EPA once a year. A Partner’s reporting period must span a 12-month time frame, but they may choose the time frame (i.e., calendar-year, fiscal-year, other 12-month period). The data reported here as “2014” encompasses the information EPA had on record for ICT Partners as of December 31, 2014. In some instances, available data may reference information prior to 2014. 7 Based on EIA (2015) reported total end use electricity consumption of 3,862 million MWh in 2014.

10
This report is available at no cost from the National Renewable Energy Laboratory (NREL) at www.nrel.gov/publications.
Table 2. Top 30 Reported Renewable Electricity Use ICT Companies (MWh) (2013/2014)
Sources: CDP; EPA-GPP Note: Data are reported for the most recently available year. In some cases, data reported in 2014 is for 2013 procurement. Some companies also report on a fiscal year rather than calendar year basis. 3.2.2 CDP Data Reports sourced from CDP for 70 ICT companies provide a considerable amount of electricity consumption and emissions data. We estimate that the ICT companies that reported to CDP,
Company Name % Renewable Energy of Total Electricity Use
Intel Corporation 3,061,547 100%Microsoft Corporation 1,363,235 50%Google Inc. 879,153 38%Apple Inc. 491,000 83%Cisco 425,153 40%Hewlett-Packard 280,560 14%Dell Inc. 225,238 45%Sprint 176,005 6%Texas Insruments Incorporated 138,210 11%EMC Corp 113,000 16%International Business Machines 105,952 4%Adobe Systems 98,697 234%Yahoo Inc. 98,280 16%Verizon Communications 89,000 1%Sony Corporation of America 88,329 37%SAP America 86,000 100%Datapipe, Inc 75,190 100%Applied Materials 75,000 34%Motorola Mobility 62,260 100%Advanced Micro Devices, Inc. 54,089 50%Motorola Solutions 49,000 31%Rackspace US Inc. 46,461 17%Nokia Group 41,200 59%1&1 Internet, Inc. / Kansas Data Center 22,000 100%Workday 19,600 100%Salesforce 15,187 18%Pitney Bowes 13,043 13%Freescale Semiconductor 12,996 3%Lenovo 12,621 94%Advantest 12,013 83%TOTAL 8,230,019
Total Renewable Energy Use (MWh)

11
This report is available at no cost from the National Renewable Energy Laboratory (NREL) at www.nrel.gov/publications.
which represented 10 separate ICT industry sectors, used 57 million MWh in the United States in 2014.8 We derived this value by distinguishing variations in how data were reported by each entity, how electricity and renewable electricity were allocated between U.S. and global company resources, and the need to apply adjustment factors to derive electricity use from some data sets. This value represents a preliminary attempt at capturing a larger share of the ICT industry’s reported electricity consumption.
Of the CDP-estimated 57 million MWh of electricity used by ICT companies, 90% (approximately 52 million MWh) is data explicitly recorded in annual electricity measurements attributable to a company’s U.S. operations. The remaining 10% of electricity information was calculated and included in the industry total based on Scope 2 carbon emissions,9 which are linked directly to electricity purchased and sourced from U.S. electric grids. This calculation method was used for seven companies providing emissions data, only when disclosing electricity information from U.S. consumption. These calculations were included in cumulative industry totals using U.S. emissions as a proportion of respective company’s global scope 2 figures.
3.2.3 EPA’s Green Power Partnership Data The number of ICT companies participating in the GPP and the size of their renewable purchases has growing substantially in recent years. Electricity consumption by ICT companies participating in the GPP increased by 213% from 2007 to 2014. During that same time period, the amount of reported renewable electricity use increased by more than 2,000% (EPA 2015). In 2014, the 68 ICT companies that were part of EPA’s GPP consumed 17.6 million MWh of electricity in 2014, of which 44% was renewable electricity. Participation in the GPP is up from 17 ICT companies in 2007 and39 in 2009, to 68 in 2014. A portion of this increase can likely be attributed to increased organizational reporting of environmental and sustainability initiatives (KPMG Advisory N.V. and Global Reporting Initiative 2013).
Of the total 17.6 million MWh of electricity consumption reported by ICT companies participating in the GPP, 7.8 million MWh (44%) was sourced from renewable electricity in 2014. This amount represents a decrease from 2013 data in large part because of annual fluctuations in consumption and in reporting by partners (EPA 2015). Additionally, 7.8 million MWh likely underestimates the amount of renewables procured because a number of leading companies do not participate in GPP.
The ICT industry is the largest sector participating in the GPP, based on megawatt-hours of renewable electricity use. In 2014, the ICT industry accounted for nearly 30% of GPP renewable use (“Tech and Telecom” on Figure 2).
8 This value was calculated by referencing industry sector reports sourced from CDP in 2014. 9 Scope 2 calculations adhere to The Greenhouse Gas Protocol: A Corporate Accounting and Reporting Standard as the primary method for reporting emissions. This method applies a carbon equivalent factor, multiplied per megawatt-hour of Scope 2 electricity purchased and consumed in the United States, varying based on geographic carbon intensity of U.S. energy grid power sources. Because Scope 2 is a direct correlate of purchased electricity, the seven companies included in our data that only specified U.S. electricity use in terms of Scope 2 emissions, were assigned megawatt-hour equivalents based on the U.S. proportion of Scope 2 to global Scope 2, and multiplied to reported global electricity consumption.

12
This report is available at no cost from the National Renewable Energy Laboratory (NREL) at www.nrel.gov/publications.
Figure 2. Renewable electricity use by sector with EPA’s GPP in 2014
Source: Derived from Critchfield (2015)
Table 3 shows 14 ICT companies that have reported their electricity consumption and renewable electricity use to the GPP in 2007, 2009, and 2014.

13
This report is available at no cost from the National Renewable Energy Laboratory (NREL) at www.nrel.gov/publications.
Table 3. Electricity and Renewable Electricity Use Reported to the GPP in 2007, 2009, and 2014
YEAR 2007 2009 2014
Company REa Use (GWh)
Electricity Use (GWh)
RE Use (GWh)
RE Use Growth ('07-'09)
Electricity Use (GWh)
Electricity Use
Growth ('07-'14)
RE Use
(GWh)
RE Use Growth ('09-'14)
% RE of Total
Electricity Use
Electricity
Use (GWh)
Electricity Use
Growth ('09-'14)
Cisco Systems, Inc. 131 586 401 206% 876 49% 485 21% 44% 1,103 26% Applied Materials, Inc. 19 433 35 78% 223 -49% 67 95% 31% 218 -2% SAP America 18 25 20 7% 25 0% 86 335% 100% 86 250% Samsung Electronics Co., Ltd. 12 272 24 100% 571 110% 55 131% 6% 924 62% Tokyo Electron / Austin, TX Facilities 8 8 5 -35% 5 -35% 1 -86% 34% 2 -59% Oracle Corporation / Austin Facility 5 74 5 0% 91 22% 5 0% 5% 102 12% Pitney Bowes 5 47 4 -23% 100 112% 13 239% 13% 98 -2% Epson Portland Inc. 0.83 8 1 56% 8 -4% 4 243% 62% 7 -10% XMission Internet 0.66 3 4 462% 4 10% 4 1% 100% 4 1% Xilinx / San Jose Campus 0.62 21 0.62 0% 21 0% 1 128% 7% 20 0% Green House Data 0.30 0.30 0.30 0% 0.30 0% 5 1400% 100% 5 1400% Affordable Internet Services Online 0.02 0.02 0.03 14% 0.03 3% 0.03 0% 100% 0.03 0% Invisible Gold, LLC 0.02 0.01 0.02 0% 0.01 0% 0.01 -50% 100% 0.01 0% Sandwich.Net LLC 0.01 0.01 0.01 -22% 0.01 -24% 0.02 127% 166% 0.01 41% TOTAL 202 1,477 500 1,923 727 2,568 a “RE” is Renewable Electricity Source: EPA (2015) Note: Data may differ slightly from Table 2 due to the inclusion of more recent CDP data in Table 2.

14
This report is available at no cost from the National Renewable Energy Laboratory (NREL) at www.nrel.gov/publications.
Across these 14 ICT companies, electricity use increased by just over 30% by 2009 and 74% by 2014 relative to the 2007 reported values. During this same period, renewable electricity use increased by nearly 148% by 2009 and more than 260% by 2014 from those values reported for 2007, with 6 of the 14 companies having 100% or more of their electricity use accounted for by renewable electricity. For 2007, 2009, and 2014, renewable electricity use increased to approximately 14%, 26%, and 28%, respectively, of the overall amount of electricity consumed by these companies in each of those years. Again, these gains may likely be attributable to increases in organizational initiatives and improved reporting over time.
According to historic data from the GPP, the ICT industry’s consumption of renewable electricity has increased substantially since 2001, with a CAGR of 18% from 2011 through 2015. (see Figure 3). For many of these partners, their internal capabilities improve over time as they learn to navigate the procurement process across a portfolio of buildings/corporate footprints.
Figure 3. Green power use by ICT companies in the GPP (2001–2015)
Source: EPA (2015)
3.3 ICT Renewable Electricity and Carbon Goals A number of ICT companies have established goals for procuring renewable electricity and/or reducing carbon emissions; in fact, specific renewable electricity goals are often subsumed under broader carbon reduction goals. We identified 20 leading ICT companies that have renewable electricity goals, which range in size from 8% to 100% renewable electricity use, with an average of approximately 64%. Two companies have established goals defined in terms of the additional megawatts of renewable electricity to be procured. While some of these goals have specific target dates associated with them, many are long-term goals with no specific attainment date specified.
0
1,000,000
2,000,000
3,000,000
4,000,000
5,000,000
6,000,000
7,000,000
8,000,000
9,000,000
2001 2002 2003 2004 2005 2006 2007 2008 2009 2010 2011 2012 2013 2014 2015
Gre
en P
ower
Use
(MW
h/ye
ar)

15
This report is available at no cost from the National Renewable Energy Laboratory (NREL) at www.nrel.gov/publications.
Table 4 provides information on renewable electricity and carbon reduction goals identified among 15 of the leading ICT organizations. As the table indicates, a handful of ICT companies have established goals to procure renewable electricity for 100% of their electricity demand.
Table 4. Renewable Electricity and Carbon Reduction Goals for Leading ICT Organizations
Sources: CDP, company sustainability reports Of the 68 companies examined, 29 reported having carbon reduction goals. These targets range from a 5% reduction in emissions to complete carbon neutrality. For many companies, a range of goals are stated for specific areas of operation such as facilities, product lines, or emission type, making it difficult to ascertain an overall average carbon reduction goal. The range of years reported by which carbon reduction goals are to be attained varied from 2013 outward to 2050, with 2018 being the average target year for those companies seeking to achieve carbon reduction goals.
While outside the scope of this analysis, many of the reporting companies established goals related to improvements in energy efficiency, recycling, waste reduction, and water usage, in addition to indicating renewable electricity and carbon reduction goals.
3.3.1 Company Case Studies Companies are applying a variety of approaches to procure renewable electricity to meet their own internal corporate commitments. Case studies that compare renewable electricity procurement strategies across some of the leading ICT companies are provided in Appendix A, based on data derived from CDP reports. An excerpt from each of these case studies is provided below to highlight innovative activities by these companies.
Company Name
Renewable Energy Goals
Renewable Energy Goal Year Carbon Reduction Goals Carbon Reduction
Goal YearAmazon 100% Long-Term None Specified None SpecifiedApple 100% Long-Term None Specified None SpecifiedCisco 25% Annual Goal: 2013-2017a 40% FY17Dell 50% 2020 50% 2020
eBay 8% 2015 10% reduction in carbon per transaction in 2013
2013
Facebook 100% Long-Term None Specified None SpecifiedGoogle 100% Long-Term Carbon Neutral Ongoing
IBMb None Specified None Specified Third-Generation GHG Goals Upcoming
Upcoming
Intel None Specified None Specified 10% reduction per chip in GHG direct emissions
2020
Microsoft 100% 2014 Carbon Neutral 2014
Rackspace100%
(5% increase annually until goal attained (35% in 2013))
2026 (Based on 5% annual increase from 35% in 2013) None Specified None Specified
Sprint 10% 2017 20% 2017Twitter None Specified None Specified None Specified None Specified
Vmware Not Applicable Not Applicable 40% 2050Yahoo! None Specified None Specified None Specified None Specified
aCisco is seeking to source 25% of it electricity usage annually from renewable energy from 2013 to 2017.bInformation is specific to IBM's Austin, TX; Costa Mesa, CA; and Foster City, CA facilities.

16
This report is available at no cost from the National Renewable Energy Laboratory (NREL) at www.nrel.gov/publications.
Apple Apple has focused its renewable procurement on on-site generation. In 2014, Apple was the second-largest user of on-site renewable electricity participating in the GPP (EPA 2014).
Autodesk Autodesk created the Corporate Finance Approach to Climate Stabilizing Targets (C-FACTS), which is an open source tool that encourages companies to reduce their GHG emissions through investments that are proportional to their financial circumstances and take into account scientific and climate policy stabilization targets (CDP 2014b).
Cisco Systems Cisco designates energy managers who are responsible for establishing priorities of efficiency and/or carbon reduction and setting and meeting annual targets accordingly. Over the last decade Cisco has increased its transparency with regard to its carbon footprint (CDP 2014c).
Dell Dell has integrated environmental responsibility into its long-term business strategies using a number of approaches that include aggressively focusing on operational efficiency improvement opportunities while maximizing green power purchases for manufacturing and facilities. It also partners with customers and suppliers in energy conservation and climate initiatives and engages in performing global GHG accounting and providing corporate disclosure statements (CDP 2014d).
eBay eBay’s “The Future of Internet Power” group promotes best practices to help develop a platform for other ICT companies, utilities, and policymakers to initiate low-carbon power sourcing at data centers in the United States (CDP 2014e).
Google To execute its long-term strategy, Google created a subsidiary, Google Energy, which buys electricity from utility-scale renewable facilities.
Additionally, Google has taken strides to test and grow on-site renewable energy projects, generating non-grid connected electricity from small-scale landfill gas and solar photovoltaic (PV) renewable projects (CDP 2014f).

17
This report is available at no cost from the National Renewable Energy Laboratory (NREL) at www.nrel.gov/publications.
4 Future Renewable Electricity Use Potential To examine the potential for renewable electricity use by the ICT sector in the United States, we need to understand how much electricity use the sector may be responsible for in the future. This is problematic because the industry is rapidly transforming and few forecasts of ICT electricity use exist in the literature. Existing forecasts tend to focus on the global ICT sector and/or are out-of-date, capturing higher growth rates that occurred during the industry boom of the mid-2000s. Since then, there has been an increased focus on data center efficiency and a transformation from in-house data centers to cloud facilities.
However, the rate at which industry will migrate to cloud facilities is unknown, though the potential electricity savings are large. Large efficiencies are gained when companies switch to cloud computing.10 Masanet et al. (2013b) found that there is technical potential for cloud-based services11 to reduce electricity consumption of U.S. businesses by 87%, with the reductions being driven by a shift away from inefficient data centers. Cloud computing is more efficient than using in-house data centers for a number of reasons; for example, cloud facilities can diversify and aggregate their load, which allows for increased equipment utilization (Koomey 2011).
Because of the uncertainty in future electricity use projections, we developed scenarios of future renewable electricity use for only the 113 companies that reported to the GPP or CDP. We vary two key inputs: total electricity consumption and renewable electricity use.
Given the large potential for transition to more efficient cloud computing, our Low Case assumes zero annual electricity growth. In our High Case, we assume 4% annual electricity growth. This is consistent with recent increases in the installed server base estimated by IDC (Thibodeau 2015).
For renewable electricity use, we treat companies that already purchase renewables differently from those who do not. For the Low Case, we assume a minimum of 25% renewable electricity for those companies already purchasing renewables and a minimum of 10% for those companies not already purchasing renewables. If a company was using more than the minimum in 2014 or has a target to use more than the minimum by 2020, that value was used instead.
For the High Case, we assume a minimum of 50% renewable electricity for companies already purchasing renewables and a minimum of 25% for those companies not already purchasing renewables. If a company was using more than the minimum in 2014 or has a target to use more than the minimum by 2020, that value was used instead.
10 “Cloud computing” is defined as an emerging IT development, deployment and delivery model, enabling real-time delivery of products, services and solutions over the Internet (i.e., enabling cloud services) (IDC 2008). 11 “Cloud services” is in the study includes email, productivity software, and customer relationship management software.

18
This report is available at no cost from the National Renewable Energy Laboratory (NREL) at www.nrel.gov/publications.
Table 5. Scenario Assumptions for ICT Company Renewable Procurement
Scenario Annual growth in electricity consumption
Renewable electricity use in 2020
By companies purchasing renewables in 2014
By companies not purchasing renewables in 2014
High Case 4% Greater of 50%, company target, or current renewable procurement
Greater of 25% or company target
Low Case 0% Greater of 25%, company target, or current renewable procurement
Greater of 10%, or company target
The scenarios result in renewable electricity use in 2020 ranging from 18.5 million MWh to more than 37 million MWh (Figure 6). Importantly, because a number of companies in our sample currently use more than 25% or 50% renewable electricity, or have goals to that effect, the ICT percentage of renewable electricity used in the 2020 scenarios ranges from 31% to 48%.
Figure 6. Scenarios of Future RE Use by 113 ICT Companies
The ICT companies examined here represent a share of total ICT electricity use. The scenarios presented here represent the potential for companies that currently report to EPA or CDP, although many companies currently do not report to these entities. In particular, the data set lacks reporting from co-location providers.
-
5
10
15
20
25
30
35
40
Existing Low Case High Case
2014 2020
Mill
ion
MW
h

19
This report is available at no cost from the National Renewable Energy Laboratory (NREL) at www.nrel.gov/publications.
5 Summary and Conclusions The ICT sector has been a leading user of renewable electricity in recent years relative to other industry sectors (EPA 2015). The ICT industry is already a significant user of electricity nationally, with data centers alone responsible for about 2% of total electricity consumption. Looking forward, increased adoption of ICT products and services are expected to require additional electricity use, although recent observations by Koomey and other regarding the transition to more energy-efficient operations and cloud-based services suggest that the rate of growth for electricity consumption is uncertain. Leading companies in the ICT sector have made commitments to procure a portion or all of that electricity in the form of renewables. As a result, the ICT industry is poised to provide an important market for renewables in the coming years.
While data on the size of the overall electricity consumption by the U.S. ICT sector are incomplete, NRDC estimates suggest U.S. data center usage was approximately 91 million MWh in 2013. No comprehensive estimate of renewable purchases exists, but data from 113 ICT companies show renewable electricity purchases of 8.3 million MWh in 2014 (out of total reported electricity consumption of more than 59 million MWh). While the 113 companies represent only a subsection of the entire industry, the estimate likely provides a good representation of current renewable procurement levels in the sector, as many of the companies most active in renewable procurement participate in EPA’s GPP program and in reporting to CDP.
To provide perspective on the potential renewable electricity purchasing, we developed simple scenarios based on expected consumption growth rates and expanded adoption of renewable electricity goals. By 2020, this group of 113 companies could procure 18.5 million MWh to more than 37 million MWh of renewable electricity, representing 31% and 48% renewable electricity use, respectively. Our estimates are limited by the amount of data available on ICT industry electricity consumption.
Efforts to further address procurement barriers and technical challenges for renewables integration by ICT companies could facilitate substantial further adoption of renewables, given the magnitude of electricity consumption and growth expected in the sector. While many companies have been innovative in procuring renewables, and even more have renewable and/or carbon reduction targets, some ICT companies have not yet taken action. Sharing of innovations, successes, and best practices by the leading companies in the ICT sector and other industries could help expand the adoption of renewables, particularly as renewable generation sources become increasingly cost-competitive. Additionally, improved reporting tools and information could provide a timely and consistent snapshots of electricity use and renewable energy procurement for the sector as it continues to evolve at a rapid pace.

20
This report is available at no cost from the National Renewable Energy Laboratory (NREL) at www.nrel.gov/publications.
References Apple, Inc. (2012). Facilities Report. 2012 Environmental Update. Accessed January 1, 2015: https://www.apple.com/au/environment/pdf/Apple_Facilities_Report _2012.pdf
Apple, Inc. (2014). Environmental Responsibility Report. 2014 Progress Report, Covering FY2013. Accessed January 1, 2015: https://www.apple.com/ environment/pdf/Apple_Environmental_Responsibility_Report_2014.pdf
Apple, Inc. (2015a). “Environmental Responsibility.” Accessed June 12, 2015: http://www.apple.com/environment/.
Apple, Inc. (2015b). “Apple to Invest €1.7 Billion in New European Data Centres.” Apple Press Info. Accessed July 7, 2015: https://www.apple.com/pr/library/2015/02/23Apple-to-Invest-1-7-Billion-in-New-European-Data-Centres.html.
Autodesk. (2015). Sustainability in action: From epic challenges to integrated solutions. Progress Report FY2015. Accessed June 12, 2015: http://static-dc.autodesk.net/content/dam/autodesk/www/sustainability/docs/pdf/sustainability_report_2015_FINAL.pdf.
Bird, L.; Sumner, J. (2011). Using Renewable Energy purchases to Achieve Institutional Carbon Goals: A Review of Current Practices and Considerations. NREL/TP-6A20-49938. Golden, CO: National Renewable Energy Laboratory. Accessed July 7, 2015: http://apps3.eere.energy.gov/greenpower/pdfs/49938.pdf.
Carbon Disclosure Project (CDP). (2013a). Investor Information Request – Dell, Inc. 2013 Climate Change Response. Approved by Bruno Sarda, Director Sustainability Operations, Dell, Inc. Accessed January 1, 2015: https://www.cdp.net/en-US/Results/Pages/responses.aspx
Carbon Disclosure Project (CDP). (2013b). Investor Information Request – Google, Inc. 2013 Climate Change Response. Approved by Rick Needham, Director of Energy and Sustainability, Google, Inc. Accessed January 1, 2015: https://www.cdp.net/en-US/Results/Pages/responses.aspx
Carbon Disclosure Project (CDP). (2013c). Investor Information Request – Intel, Corporation. 2013 Climate Change Response. Approved by Tim Higgs, Environmental Engineer,, Intel Corporation, Inc. Accessed January 1, 2015: https://www.cdp.net/en-US/Results/Pages/responses.aspx
Carbon Disclosure Project (CDP). (2013d). Investor Information Request – Microsoft, Corporation. 2013 Climate Change Response. Approved by Rob Bernard, Chief Environmental Strategist, Microsoft Corporation. Accessed January 1, 2015:https://www.cdp.net/en-US/Results/Pages/responses.aspx

21
This report is available at no cost from the National Renewable Energy Laboratory (NREL) at www.nrel.gov/publications.
Carbon Disclosure Project (CDP). (2014a). Investor Information Request – Apple Inc. 2014 Climate Change Response. Approved by Lisa Jackson, Vice President of Environmental Initiatives, Apple Inc. Accessed January 1, 2015: https://www.cdp.net/en-US/Results/Pages/responses.aspx
Carbon Disclosure Project (CDP). (2014b). Investor Information Request – Autodesk Inc. 2014 Climate Change Response. Approved by Ben Thompson, Sustainability Business Program Manager, Autodesk, Inc. Accessed January 1, 2015: https://www.cdp.net/en-US/Results/Pages/responses.aspx
Carbon Disclosure Project (CDP). (2014c). Investor Information Request – Cisco Systems, Inc. 2014 Climate Change Response. Approved by Daryl Stickler, Executive Director Sustainable Business Practices, Cisco Systems, Inc. Accessed January 1, 2015: https://www.cdp.net/en-US/Results/Pages/responses.aspx
Carbon Disclosure Project (CDP). (2014d). Investor Information Request – Dell, Inc. 2014 Climate Change Response. Approved by Bruno Sarda, Director Sustainability Operations, Dell, Inc. Accessed January 1, 2015: https://www.cdp.net/en-US/Results/Pages/responses.aspx
Carbon Disclosure Project (CDP). (2014e). Investor Information Request – Ebay, Inc. 2014 Climate Change Response. Approved by Alan Marks, Senior Vice President Brand and Social Innovation, Ebay, Inc. Accessed January 1, 2015: https://www.cdp.net/en-US/Results/Pages/responses.aspx
Carbon Disclosure Project (CDP). (2014f). Investor Information Request – Google, Inc. 2014 Climate Change Response. Approved by Joseph Kava, Vice President Data Center Operations, Google, Inc. Accessed January 1, 2015: https://www.cdp.net/en-US/Results/Pages/responses.aspx
Carbon Disclosure Project (CDP). (2014g). Investor Information Request – Intel, Corporation. 2014 Climate Change Response. Approved by Tim Higgs, Environmental Engineer, Intel Corporation, Inc. Accessed January 1, 2015: https://www.cdp.net/en-US/Results/Pages/responses.aspx
Carbon Disclosure Project (CDP). (2014h). Investor Information Request – Microsoft, Corporation. 2014 Climate Change Response. Approved by Rob Bernard, Chief Environmental Strategist, Microsoft Corporation. Accessed January 1, 2015: https://www.cdp.net/en-US/Results/Pages/responses.aspx
Carbon Disclosure Project (CDP). (forthcoming). Apple Inc. Information referenced by Apple, Inc. (via Frederick Freeman) to Heeter, J., National Renewable Energy Laboratory. Apple, Inc. Cupertino, CA.
Cisco Systems, Inc. (2015). Cisco Visual Networking Index: Forecast and Methodology, 2014-2019. White Paper. San Jose, CA Cisco Systems, Inc. Accessed June 12, 2015: https://www.cisco.com/c/en/us/solutions/collateral/service-provider/ip-ngn-ip-next-generation-network/white_paper_c11-481360.pdf.

22
This report is available at no cost from the National Renewable Energy Laboratory (NREL) at www.nrel.gov/publications.
Cisco Systems, Inc. (2015b). “NRG Renewable to Develop 20MW Solar Energy Facility for Cisco.” Press Release: June 23, 2015. Princeton, NJ. Accessed July 7, 2015. http://newsroom.cisco.com/release/1666280/NRG-Renew-to-Develop-20MW-Solar-Energy-Facility-for-Cis_1.
Critchfield, J. (January 2015). “State of the Voluntary Green Power Market.” Presented at Environmental Protection Agency Green Power Partnership Webinar, Jan. 27, 2015. Accessed February 20, 2015: http://epa.gov/greenpower/documents/events/webinar_20150127_ critchfield.pdf.
DOE. (2010). Guide to Purchasing Green Power. DOE/EE-0307. Washington, DC: U.S. Department of Energy (DOE). Accessed July 7, 2015: http://www.epa.gov/greenpower/documents/purchasing_guide_for_web.pdf.
Dutta, S.; Bilbao-Osorio, B. (2012). The Global Information Technology Report 2012: Living in a Hyperconnected World. Insight Report. Geneva, Switzerland: World Economic Forum, 2012. Accessed February 11, 2015: http://www3.weforum.org/docs/Global_IT_Report_2012.pdf.
Ebay, Inc. (2013). Social Innovation 2013 Annual Update. Enabling Greener Commerce. Accessed January 1, 2015: http://www.ebayinc.com/sites/all/themes/ ebayinc/images/si/SI_2013_Annual_Update.pdf
U.S. Energy Information Administration (EIA). (2015). Monthly Energy Review, Chapter 7. Accessed July 2, 2015: http://www.eia.gov/totalenergy/data/monthly/pdf/sec7.pdf.
EIA. (2014). Annual Energy Outlook 2014 with projections to 2040. DOE/EIA-0383(2014). Washington, DC: U.S. Energy Information Administration (EIA). Accessed February 18, 2015: http://www.eia.gov/forecasts/AEO/pdf/0383%282014%29.pdf.
EIA. (December 2013). Analysis and Representation of Miscellaneous Electric Loads in NEMS. Accessed April 21, 2015: http://www.eia.gov/analysis/studies/demand/miscelectric/pdf/miscelectric.pdf.
U.S. Environmental Protection Agency (EPA). (2014). Green Power Partnership Partner List. Washington, DC: EPA Accessed December 8, 2014: http://www.epa.gov/greenpower/ partners/index.htm.
U.S. Environmental Protection Agency (EPA). (Feb. 20, 2015). Email provided by ERG (via Anthony Amato) to Heeter, J., National Renewable Energy Laboratory. Eastern Research Group, Lexington, VA.
Facebook. (2013a). Carbon & Energy Impact Report 2013. Accessed June 8, 2015: https://www.facebook.com/green/app_439663542812831.
Facebook. (2013b). Our Carbon Footprint for 2013. Accessed June 8, 2015: https://www.facebook.com/notes/green-on-facebook/our-carbon-footprint-for-2013/888969404451650.

23
This report is available at no cost from the National Renewable Energy Laboratory (NREL) at www.nrel.gov/publications.
“Finance.” (2014). Google Inc. Accessed July 1, 2014: https://www.google.com/finance.
Global e-Sustainability Initiative (GeSI). (2012). GeSI SMARTer 2020: The Role of ICT in Driving a Sustainable Future. Accessed April 2015: http://gesi.org/assets/js/lib/tinymce/jscripts/tiny _mce/plugins/ajaxfilemanager/uploaded/SMART er%202020%20- %20The%20Role%20of%20ICT%20in%20Driving%20a%20Sustainable %20Future%20- %20December%202012._2.pdf.
Google. (2013). Google’s Green PPAs: What, How, and Why. Revision 3. Accessed April 21, 2015: http://static.googleusercontent.com/external_content/untrusted_dlcp/cfz.cc/en/us/green /pdfs/renewable-energy.pdf.
Google. (2015). Google green: Using green power at Google. Accessed July 7, 2015: http://www.google.com/green/energy/.
Goossens, E. (2015). “Facebook Doubles Renewable-Energy Target to 50% by End of 2018.” Bloomberg Business: July 7, 2015. Accessed July 8, 2015: http://www.bloomberg.com/news/articles/2015-07-07/facebook-doubles-renewable-energy-target-to-50-by-end-of-2018.
Greenpeace. (2015). Clicking Clean: A Guide to Building the Green Internet. 2015 Update. Washington, D.C. Accessed June 12, 2015: http://www.greenpeace.org/usa/Global/usa/planet3/PDFs/2015ClickingClean.pdf.
Heddeghem, W.V.; Lambert, S.; Lannoo, B.; Colle, D.; Pickavet, M.; Demeester, P. (2014). “Trends in Worldwide ICT Electricity Consumption From 2007 to 2012.” Computer Communications. Department of Information Technology of Ghent University. (50); pp. 64–76. Accessed January 23, 2015: http://www.sciencedirect.com/science/article/pii/ S0140366414000619.
Heeter, J.; Belyeu, K.; Kuskova-Burns, K. (2014). Status and Trends in the U.S. Voluntary Green Power Market (2013 Data). NREL/TP-6A20-63052. Golden, CO: National Renewable Energy Laboratory. Accessed February 5, 2015: http://www.nrel.gov/docs/fy15osti/63052.pdf.
Heeter, J. (June 12, 2015). Email from Freeman, F. of Apple, Inc., Cupertino, California.
Holt, E.; Sumner, J.; Bird, L. (2011). The Role of Renewable Energy Certificates in Developing New Renewable Energy Projects. NREL/TP-6A20-51904. Golden, CO: National Renewable Energy Laboratory. Accessed July 7, 2015: http://www.nrel.gov/docs/fy11osti/51904.pdf.
IDC. (2014). White Paper: The Cost of Retaining Aging IT Infrastructure. Accessed July 8, 2015: http://www.lenovoserverhub.co.uk/Media/whiteppaers/whitepaper-idc-246755.pdf.
Intel Corporation (2014, May) 2013 Corporate Responsibility Report. Caring For Our Planet: Climate Change and Energy Efficiency. Accessed January 1, 2015: http://csrreportbuilder.intel.com/PDFFiles/CSR_2013_Full-Report.pdf
24
This report is available at no cost from the National Renewable Energy Laboratory (NREL) at www.nrel.gov/publications.
Koomey, J. (2011). Four reasons why cloud computing is more efficient. Blog post: “Jonathan G. Koomey, Ph.D.”. July 24, 2011. Accessed July 6, 2015: http://www.koomey.com/post/8014999803.Koomey, J. (2011). Growth in Data Center Electricity Use 2005 to 2010. Oakland, CA: Analytics Press. Accessed January 2014: http://www.analyticspress.com/datacenters.html.
KPMG Advisory N.V., Global Reporting Initiative, Unit for Corporate Governance in Africa. (2013). Carrots and Sticks: Sustainability Reporting Policies Worldwide – Today’s Best Practice, Tomorrow’s Trends. Accessed February 16, 2015: https://www.globalreporting.org/ resourcelibrary/Carrots-and-Sticks.pdf.
Masanet, E.; Shehabi, A.; and Koomey, J. (2013a). Characteristics of low-carbon data centres. Nature Climate Change 3, 627-630. doi:10.1038/nclimate1786.
Masanet, E.; Shehabi, A.; Ramakrishnan, L.; Liang, J.; Ma, X.; Walker, B.; Hendrix, V.; Mantha, P. (2013b). The Energy Efficiency Potential of Cloud-Based Software: A U.S. Case Study. Lawrence Berkeley National Laboratory, Berkeley, California. Accessed July 6, 2015: http://crd.lbl.gov/assets/pubs_presos/ACS/cloud_efficiency_study.pdf.
Microsoft Corporation (2014). “Microsoft announces 175-megawatt wind farm deal, broadens renewable energy commitment.” The Fire Hose: July 15, 2014. Accessed July 7, 2015: http://blogs.microsoft.com/firehose/2014/07/15/microsoft-announces-175-megawatt-wind-farm-deal-broadens-renewable-energy-commitment/.
Microsoft, Corporation (2013, December). The Microsoft Carbon Fee: Theory and Practice. The Why, What, and how of Microsoft’s Efforts to Drive Cultural Change. Written by Tamara “TJ” DiCaprio, Microsoft Corporation. Accessed January 1, 2015: https://www.google.com/url?sa=t&rct=j&q=&esrc=s&source=web&cd=2&ved=0CCgQFjAB&url=http%3A%2F%2Fdownload.microsoft.com%2Fdownload%2F2%2F3%2FC%2F23C9C89B-664B-4D1D-BD7B-C0724E52A568%2FMicrosoft%2520Carbon%2520Fee%2520Guide.pdf&ei=-2hbVcDNDo6CyQT7zIL4Cg&usg=AFQjCNH_lHZTZpu3GboM4vGFqwjTLf9AHw&bvm=bv.93564037,d.b2w
Natural Resources Defense Council. (2014). Data Center Efficiency Assessment: Scaling Up Energy Efficiency Across the Data Center Industry: Evaluating Key Drivers and Barriers. Issue Paper: 14-08-A. New York, NY: Natural Resources Defense Council. Accessed February 6, 2015: http://www.nrdc.org/energy/files/data-center-efficiency-assessment-IP.pdf.
“Climate Neutral Research Campuses: Power Purchase Agreements.” (2012). National Renewable Energy Laboratory (NREL). Accessed July 7, 2015: http://www.nrel.gov/tech_deployment/climate_neutral/power_purchase_agreements.html.
25
This report is available at no cost from the National Renewable Energy Laboratory (NREL) at www.nrel.gov/publications.
Pickavet, M.; Vereecken, W.; Demeyer, S.; Audenaert, P.; Vermeulen, B.; Develder, C.; Colle, D.; Dhoedt, B.; Demeester, P. (2008). “Worldwide Energy Needs for ICT: the Rise of Power-Aware Networking.” Prepared for the 2nd International Symposium on Advanced Networks and Telecommunication Systems (ANTS'08), December 15–17, 2008. Bombay, India: 3 pp. Accessed February 13, 2015: http://ieeexplore.ieee.org/stamp/stamp.jsp?tp=&arnumber=4937762.
“Reports and Data.” (2015). CDP Worldwide. Accessed December 1, 2014: https://www.cdp.net/results.asp.
The Green Grid. (2012). PUETM: A Comprehensive Examination of the Metric. White Paper #49. Accessed June 8, 2015: http://www.thegreengrid.org/~/media/ WhitePapers/WP49-PUE%20A %20Comprehensive%20Examination%20 of%20the%20Metric_v6.pdf?lang=en
Thibodeau, P. (2015). “Fully 30% of physical servers are using energy while doing nothing.” Computerworld: June 19, 2015. Accessed July 15, 2015: http://www.computerworld.com/article/2937408/data-center/1-in-3-data-center-servers-is-a-zombie.html.
Trabish, H. (2014). “Yahoo buys into Kansas wind farm.” Utility Dive: October 16, 2014. Accessed July 7, 2015: http://www.utilitydive.com/news/yahoo-buys-into-kansas-wind-farm/322253/.
“Virtualization.” (2015). Dell. Accessed July 1, 2015: http://www.dell.com/learn/us/en/555/sb360/cat-intro-virtualization-new
World Resources Institute. (2015). “GHG Protocol Scope 2 Guidance: An amendment to the GHG Protocol Corporate Standard.” Accessed July 7, 2015: http://ghgprotocol.org/files/ghgp/Scope%202%20Guidance_Final.pdf.

26
This report is available at no cost from the National Renewable Energy Laboratory (NREL) at www.nrel.gov/publications.
Appendix A. ICT Company Case Studies As indicated in section 3.2, many ICT companies have made efforts to procure renewable electricity. The approach to corporate renewable procurement is, in part, a product of many distinct factors, such as a company’s operations, resources, and culture. This section highlights the innovative actions of 8 ICT companies to procure renewable electricity.
Apple Apple, Inc.’s renewable goal is to power 100% of its operations with renewable electricity. In Apple’s fiscal year 2014, it generated or procured 678,000 MWh of renewable electricity for its U.S. operations (CDP forthcoming), which was a 38% increase from the previous year. This quantity of renewable electricity met 100% of the electricity use at its U.S. corporate offices, retail stores, and data centers (Apple 2015a) and included 148,000 MWh of on-site generation (Heeter 2013). Apple also procured 282,000 MWh of renewable electricity for its supplier-operated facility in Mesa, Arizona during its fiscal year 2014. It recently announced its plans to construct data centers in County Galway, Ireland and Denmark’s central Jutland that will both be run entirely on renewable electricity for which additional renewable electricity projects will be built to provide power in the future (Apple 2015b). Apple’s renewable electricity strategy is based on corporate-wide commitments toward environmental stewardship. Apple’s procurement strategy differs from other leading ICT green power users in that it accounts for operational electricity demand when making new project decisions and investments. In near-equal proportions, its electric load is divided amongst data centers, retail stores, and corporate facilities (Apple 2012). Each operational area has unique power-sourcing characteristics and needs, which are taken into account when growing and allocating Apple’s portfolio of renewable electricity investments (CDP 2014a).
Apple uses an internally developed renewable electricity policy for making investment decisions, which mandates displacement, additionality and accountability as critical outcomes for screening potential projects. This policy also applies extensive criteria when making determinations across procurement types, which first seeks out those investments that would have the most direct renewable electricity impact. In order of preference, Apple initially looks for opportunities to develop on-site generation from company-owned projects, before seeking local, direct-access grid purchases, which are then followed by making purchases of unbundled RECs (CDP 2014a). In 2014, Apple was the second-largest on-site renewable electricity generator of any company participating in the GPP (EPA 2014).
Autodesk In 2013, Autodesk procured 8,638 MWh of renewable electricity, which accounted for more than 50% of its electricity usage (EPA 2014). In 2014, 40% of Autodesk’s global electricity consumption was sourced from renewable electricity, with on-site generation taking place at its facilities in California and New Hampshire. Autodesk announced in early 2015 its long-term commitment to procuring 100% renewable electricity for its worldwide operations.
While Autodesk is a relatively small electricity-consuming company within the ICT industry, the products it develops are used to create energy-saving devices for buildings throughout the world. Autodesk supports this by integrating energy-reduction components into its products to enable

27
This report is available at no cost from the National Renewable Energy Laboratory (NREL) at www.nrel.gov/publications.
large electricity-consuming clients to adopt sound-reduction strategies. Autodesk created Corporate Finance Approach to Climate Stabilizing Targets (C-FACT), which is an open source tool that encourages companies to reduce their GHG emissions through investments that are a proportion of their financial circumstances and that take into account scientific and climate policy stabilization targets. In pursuing its own GHG-reduction measures, Autodesk has been procuring renewables, which has helped to expand the overall size of its green investments (CDP 2014b).
Cisco Systems Cisco Systems (Cisco) established the goal of powering 25% of its operations through renewable electricity each year. Cisco surpassed its goal in 2013, procuring 425,153 MWh, which was equivalent to 40% of its electricity use (CDP 2014c).
Cisco primarily manufactures and sells end-use devices, which account for the largest sector of electricity use in the ICT industry, representing 60% of the industry’s total emissions in 2011 (Smarter2020). Cisco has focused on improving the energy efficiency of its manufacturing processes and of its end-use devices, which leads to reductions of GHG under the company’s control and by its consumers.
Cisco’s procurement strategy is broken down into four channels of renewable electricity use: (1) U.S.-purchased RECs; (2) green power contracts with U.S. utilities; (3) on-site solar; and (4) European renewable electricity tracking instruments (CDP 2014c).
Due to Cisco’s abatement potential in improved efficiency being substantially greater than its renewable electricity procurement, it has made manufacturing and end-use efficiency a top priority (CDP 2014c). Despite this, Cisco ranks ninth on the EPA’s list of top Fortune 500 Green Power Users and was one of the earliest ICT renewable electricity adopters with green purchases dating back to 2005 (EPA 2014).
Over the last decade, Cisco has increased its transparency with regard to its carbon footprint analysis by working to accurately account for Scope 3 emissions from its end-use devices. Cisco’s commitment to a long-term, low-carbon future has been recognized by CDP as the #1 ICT Climate Leader in voluntary reporting and #5 within their Global 500 Climate Change Report (CDP 2014c).
Dell Dell established a target of meeting 50% of its electricity needs from renewable electricity by 2020. In 2013, Dell procured 225,238 MWh of renewable electricity (CDP 2014d), which was 40% more than in 2012 (CDP 2013a). Dell attributed 45% of its U.S. electricity needs to renewable electricity resources as of 2013, representing 90% of its 2020 goal (CDP 2014d).
In 2007, Dell committed to becoming carbon neutral. After an extensive carbon footprint analysis, Dell determined that its carbon neutrality goal was unrealistic for the company in the foreseeable future, which resulted in Dell lowering its reduction goal. The carbon footprint analysis evaluated Dell’s ongoing annual carbon-reduction strategies and progress, which helped Dell re-establish its reduction goals to lower levels. Dell has integrated environmental responsibility into its long-term business strategies using a number of approaches that include

28
This report is available at no cost from the National Renewable Energy Laboratory (NREL) at www.nrel.gov/publications.
aggressively focusing on operational efficiency improvement opportunities while maximizing green power purchases for manufacturing and facilities. It also partners with customers and suppliers in energy conservation, and climate initiatives, and engages in performing global GHG accounting and providing corporate disclosure statements. Being a large manufacturing company, Dell has engaged with suppliers up and down its supply stream to procure verified carbon emissions data that it then applies to its own carbon footprint calculations. In this way, Dell has been able to create a comprehensive overview of product lifecycle impacts that are embedded within its supply chain and manufacturing processes. It also recognizes emission offset opportunities only if they are guaranteed to be environmentally additional, verifiable, permanent, and enforceable. In terms of renewable electricity, Dell employs a multi-variable process that targets new projects that are based on their non-monetary payback potential. An example of this approach would be the reduction in infrastructure disruption when energy is sourced from renewable resources (CDP 2014d).
eBay eBay established a goal of attaining 8% of its electricity needs from cleaner energy resources by 2013. In 2013, the company used 10,196 MWh of renewable electricity, which increased its renewable electricity use by 93% from the previous year (eBay 2013). Since 2013, eBay has achieved 2.5% of its 8% overall goal (CDP 2014e).
eBay utilizes multiple channels when procuring its renewable electricity power sources. It invests in grid-connected projects that it owns, where generated renewable power is used to create and retire credit instruments, which are credited as green power use. Another is through its Global Foundation Services, which is an internal, collaborative team dedicated to assessing risk/opportunities when exploring new data center siting options and clean energy resources. The Global Foundation Services team is credited with helping establish eBay’s newest data center in Utah, which is the first commercial data center that is powered with 100% on-site fuel cell electricity generation (CDP 2014e).
A large part of eBay’s electricity strategy is to work cohesively with like-minded electricity practitioners in the ICT industry, which is reflected in its founding member role of the Business for Social Responsibility’s working group, The Future of Internet Power. The Future of Internet Power group promotes best practices to develop a platform for other ICT companies, utilities, and policymakers to initiate low-carbon power sourcing at data centers in the United States (CDP 2014e).
Facebook In 2011, Facebook made a commitment to power 100% of its operations with renewable electricity. Facebook’s approach to renewable electricity goal setting integrates both near- and long-term targets into its procurement strategy, with a near-term goal of 25% renewable electricity in 2015.
In 2013, Facebook’s global electricity use was 822,000 MWh, 14% of which was from clean and renewable resources, including its data center in Lulea, Sweden (which runs entirely on hydro power) and Altoona, Iowa (which operates entirely on wind power) (Facebook 2013a). Facebook notes that it is on course to meet its 25% goal for 2015 (Facebook 2013b). In July 2015, it

29
This report is available at no cost from the National Renewable Energy Laboratory (NREL) at www.nrel.gov/publications.
announced its plans to build a data center in Fort Worth, Texas that will run entirely on renewable energy sourced from a 200 MW wind farm located less than 100 miles from the data center (Bloomberg 2015). These plans were made in addition to announcing its short-term goal of running 50% of its operations with renewables by 2018 (Goossens 2015).
In addition to procuring renewable electricity for its facilities, Facebook has been heavily engaged in supporting NGO efforts to address policy and transactional barriers to corporate renewable purchasing. Facebook was a founding member of both the Corporate Renewable Energy Buyers’ Principles and the Business for Social Responsibility’s (BSR's) Future of Internet Power initiative (see Text Box 1) and currently serves as an advisor to the Rocky Mountain Institute’s Business Renewable Center (BRC).
Facebook has also transitioned from using managed facilities to wholly-owned and operated facilities, which allows the company to more directly impact its energy strategy, on both renewable electricity and energy efficiency fronts. In 2013, this shift in data center management strategy allowed Facebook to launch real-time public dashboards at its newest facilities in Prineville, Oregon and Forest City, North Carolina, which track and share electricity efficiency information.
On the energy efficiency front, Facebook has achieved a substantial improvement in the power usage effectiveness (PUE)12 (i.e. ratio of total energy used by facility to energy delivered to facility equipment) at its data centers, reporting an average PUE in 2013 of 1.09 (Facebook 2013a). In March 2011, Facebook started the Open Compute Project: a collaborative initiative with other high-impact Cloud companies to open source data center and server designs in an effort to help other data center operators become as energy lean and efficient as possible.
Google Google’s long-term renewable electricity goal is to attain 100% of its operational needs through the procurement of renewable electricity. In 2013, Google saw a 16% increase in its renewable electricity use from 2012, having procured 879,153 MWh of renewable electricity (CDP 2013b). Since 2007, the company has attained 38% of its 100% renewable electricity goal through the investment of approximately $1.5 billion (CDP 2014f).
Google's renewable electricity strategy applies a two-fold investment approach that is centered on emerging renewable electricity technologies and creating renewable portfolio diversity. There are two standards that must be met before renewable electricity investments are made: (1) purchases should be additional, meaning they should add to the renewables in the electricity mix and not replace existing electricity resources and (2) they should have the highest possible positive impact on the industry. The second standard has directed Google away from the practice of purchasing unbundled RECs to making preferred direct investments or PPAs (Google 2013).
12 Power usage effectiveness (PUE) is defined as the ratio of total facilities energy used by a facility relative to the amount of energy delivered to that facility’s equipment (The Green Grid 2012). PUE values can range from 1.0 to infinity, with a value of 1.0 representing 100% efficiency and all increasing values representing diminishing efficiency levels.

30
This report is available at no cost from the National Renewable Energy Laboratory (NREL) at www.nrel.gov/publications.
Google also focuses on purchasing renewable electricity from facilities located near its data centers (Google 2015).
Google was an early adopter within the ICT in purchasing renewable electricity from utility-scale projects. To execute its long-term electricity strategy, Google created a subsidiary, Google Energy, which to purchase electricity from utility-scale renewable facilities. A team of full-time renewable energy professionals who source, review, and execute various investment opportunities leads this subsidiary. Additionally, Google has taken strides to test and grow on-site renewable electricity projects, generating non-grid connected electricity from small-scale landfill gas and solar PV renewable projects (CDP 2014f).
Intel By 2020, Intel is seeking to be 100% powered by renewable electricity. In 2013, the company used 3,061,547 MWh of renewable electricity (CDP 2014g), which represented a 9% increase from 2012 levels and accounted for 100% of the company’s electricity needs (CDP 2013c).
Intel was the first major ICT company to conduct environmental reporting, beginning in 1994. Today, it is known for its environmental transparency and accountability and views environmental impacts as an opportunity to use technology to enable improved electricity and resource management. Intel uses a multi-tiered monitoring system to benchmark environmental performance against annual emissions reduction and energy efficiency goals (Intel 2014). Although the company is one of the largest emitters of GHG emissions, it is the single largest purchaser of green power in the United States. An extensive carbon accounting process helps direct renewable electricity procurements so that they align an investment’s scale with its proportional environmental impact to its operations. Intel also makes investments to help embed energy efficiency components into its products, as it acknowledges the scale of Scope 3 emissions it supports through its products and their device end use. The company works closely with suppliers to promote increased efficiency and reduced emissions across the supply chain. In this way, Intel is continually building more efficiency directly into the products it manufactures, which helps to reduce the amount of electricity consumed during a product’s end use (CDP 2014g).
Microsoft Microsoft’s renewable electricity goal is to power 100% of its company through the use of renewable electricity. In 2013, the company procured 1,363,235 MWh of renewable electricity (CDP 2014h), which represented an 18% increase from 2012 (CDP 2013d). To date, the company is using 62% renewable electricity (CDP 2014h).
In 2012, Microsoft made a commitment to be a carbon neutral company, which transformed its procurement strategy for renewable electricity. Since this announcement, Microsoft has embedded carbon neutrality into all levels of its organization by utilizing an internal carbon tax, which is charged to individual business units based on the amount of proportional electricity and GHG emissions contributed by each individual unit’s operations. The carbon tax has spurred investments in renewable electricity as well as energy efficiency (Microsoft 2013).

31
This report is available at no cost from the National Renewable Energy Laboratory (NREL) at www.nrel.gov/publications.
Appendix B. ICT Company Renewable Electricity Use Table B-1. Renewable Electricity Use by ICT Companies (2013/2014)
Note: Data are reported for the most recently available year. In some cases, data reported in 2014 are for 2013 procurement. Some companies also report on a fiscal year rather than calendar year basis.
Company NameTotal RE Use
(MWh)% RE of Total
Electricity Use Company NameTotal RE Use
(MWh)% RE of Total
Electricity Use1&1 Internet, Inc. / Kansas Data Center 22,000 100% iPage 1,660 200%Actiontec Electronics - 0% Itron, Inc. - 0%Adobe Systems 98,697 234% Jabil Circuit, Inc. - 0%Advanced Micro Devices, Inc. 54,089 50% JDS Uniphase Corp. - 0%Advantest 12,013 83% Joliware 16 300%Affordable Internet Services Online 25 100% Juniper Networks - 0%Agilent 1,057 1% Kognito 18 100%Akamai Technologies 4,000 3% Lenovo 12,621 94%Altera Corp. - 0% LG Electronics 2,286 11%Altova 125 122% Madison Computer Works, Inc. 99 113%Amgen, Inc. - 0% Maine.Info 4 114%Apple Inc. 491,000 83% Marvell Technology Group - 0%Applied Materials 75,000 34% MasterCard Incorporated - 0%AT&T Services, Inc./Austin, TX Facilities 2,760 - Microchip Technology - 0%Autodesk, Inc. 8,638 51% Micron Technology Inc. - 0%Automatic Data Processing Inc. - 0% Microsoft Corporation 1,363,235 50%Aviat Networks, Inc. / Santa Clara Headquarters 2,378 91% Molex Incorporated - 0%Bel Fus - 0% Motorola Mobility 62,260 100%Benchmark Electronics, Inc. / Londonderry Operations 200 10% Motorola Solutions 49,000 31%Broadcom Corporation - 0% Nokia Group 41,200 59%Broadridge Financial Solutions - 0% Noyes Fiber Systems, LLC 33 20%BT US & Canada / El Segundo 1,000 14% NVIDIA Corp. - 0%CA Technologies 6,852 12% Oracle Corporation 5,400 1%Canvas Host, LLC 241 100% Other World Computing 1,106 139%CenturyLink - 0% Pitney Bowes 13,043 13%Cisco 425,153 40% QUALCOMM Inc. - 0%Cognizant Technology Solutions - 0% Rackspace US Inc. 46,461 17%Community IT Innovators 30 100% Salesforce 15,187 18%Compuware Corp. - 0% Sandwich.Net LLC 18 166%Corning Inc. 2,340 0% SAP America 86,000 100%Datapipe, Inc 75,190 100% Sharp Microelectronics of the Americas 1,932 24%Dell Inc. 225,238 45% Soho Network Services 29 545%Eastman Kodak Company - 0% Sony Corporation of America 88,329 37%EasyStreet Online Services, Inc. 5,637 50% Spansion Inc. - 0%eBay Inc. 10,196 3% Sprint 176,005 6%EMC Corp 113,000 16% Squarespace, Inc. 550 55%EnCrisp, LLC 3 20% SunGard - 0%Endurance International Group 5,459 200% Symantec Corporation - 0%Epson Portland Inc. 4,443 62% Syniverse - 0%FatCow Web Hosting 1,449 200% Teradata Corp. - 0%Fairchild Semiconductor - 0% Teradyme - 0%First Solar 2,530 2% Texas Insruments Incorporated 138,210 11%Flextronics International - 0% TIBCO Software Inc. / Palo Alto Facilities 1,320 19%Freescale Semiconductor 12,996 3% Tokyo Electron 6,475 0%GN Netcom / Nashua Operations 180 20% Troy & Banks, Inc. 23 70%Google Inc. 879,153 38% Unisys Corp. - 0%GrayHair Software, Inc. 211 100% Varsity Technologies 14 20%Green Geeks, LLC 1,845 1008% Verizon Communications 89,000 1%Green House Data 4,500 100% Visa 6,154 5%Harman International Industries - 0% Votenet Solutions, Inc. 163 100%Hewlett-Packard 280,560 14% Workday 19,600 100%iCIMS 300 57% Xerox Corporation 35,830 -Intel Corporation 3,061,547 100% Xilinx / San Jose Campus 1,404 7%International Business Machines 105,952 4% XMission Internet 3,763 100%International Rectifier - 0% Yahoo Inc. 98,280 16%Intuit Inc. 120 0% YellowPagesGoesGreen.org 14 56%Invisible Gold, LLC 8 100% TOTAL 8,364,856