removal of nutrients from stormwater using ccps · removal of nutrients from stormwater using ccps...
TRANSCRIPT

Removal of Nutrients from Stormwater Using CCPs
Robert J. Waldrop1 , Mike Beck2, W. Lee Daniels2, Matt Eick2, Rory Maguire2 and Joe Hunt2, and Bobby Joyner2. 1Full Circle Solutions, Inc., 35 North Main Street, Suite A, Jasper, Georgia 30143. 2Virginia Tech Dept. of Crop & Soil Env. Sciences, 2Appian Consulting Engineers, 154 Roundabout Court, Rocky Mount, North Carolina 27804; KEYWORDS: CCPs, coal combustion products, coal ash, flyash, stormwater runoff, nutrients, nitrogen, phosphorus, water quality ABSTRACT Stormwater runoff from both urban and rural areas contains a significant amount of nutrients such as phosphorus and nitrogen. These nutrients contribute to the growth of algae and therefore degrade the quality of surface waters by reducing available oxygen. As a result, state environmental agencies have directed their attention to nutrient concentrations in stormwater runoff by requiring phosphorus and nitrogen removal. However, for the most part, the types of systems being utilized to deal with phosphorus and nitrogen in stormwater runoff have been inefficient and expensive to build and maintain. Many such systems only remove 25% to 50% of the nitrogen and phosphorus in the stormwater runoff. There is a need for an efficient filtering system that is relatively inexpensive, easy to maintain, and which will remove substantial concentrations of phosphorus and nitrogen. This paper will discuss the problem of stormwater runoff and the use of coal combustion products (CCPs) in an efficient filtration system. Appian Engineers and Full Circle Solutions, Inc. are developing a patented process using CCPs as the filtration media. Column sorption studies designed and performed by Virginia Tech documented the capacity of various CCPs to significantly retain nutrient elements and organics from simulated waste water. The CCPs were effective in removing ammonium-N, ortho-P, and an organic C compound (oxalate) from simulated urban stormwater. We will explore the environmental benefits of expanded CCP utilization in association with this process. INTRODUCTION Government surface water discharge regulations have long recognized the dangers of discharging wastewater with significant concentrations of phosphorus and nitrogen. Most states have stringent requirements mandating that phosphorus and nitrogen concentrations in effluents discharged from wastewater treatment plants be extremely low. These regulations, of course, apply to municipal, county and regional wastewater treatment plants. However, the risks associated with nitrogen and phosphorus concentrations in wastewater discharges are not confined to conventional wastewater
2009 World of Coal Ash (WOCA) Conference - May 4-7, 2009 in Lexington, KY, USA htp://www.flyash.info/

treatment processes conducted by wastewater treatment plants. Stormwater runoff may also contain significant amounts of phosphorus, nitrogen, and other pollutants. Many states and government entities are therefore beginning to direct attention to reducing the phosphorus and nitrogen concentrations in stormwater runoff. In some locations, local governments have issued guidelines requiring that strictly limit phosphorus and nitrogen in stormwater runoff coming from any new industrial, commercial or residential development. New regulations require the installation of best management practices, including engineered structures in an effort to reduce nutrient loadings from stormwater runoff. However, for the most part, the types of structures and systems being utilized have been inefficient and expensive to build and maintain. Many such systems and processes only remove approximately 25% to 50% of the total nitrogen and phosphorus in the stormwater runoff. There is a need for an efficient filtering system that is relatively inexpensive, easy to maintain, and which will remove substantial concentrations of phosphorus, nitrogen, and other pollutants from stormwater runoff and other types of wastewater, such as domestic wastewater. Appian Engineers and Full Circle Solutions, Inc. are developing a patented process using CCPs as the filtration media for stormwater nutrient removal. Column sorption studies designed and performed by Virginia Tech documented the capacity of various CCPs to significantly retain nutrient elements and organics from simulated waste water. The study was conducted in four phases. Phase I - Baseline Ash Characterization Phase II - Removal of Salts
Phase III - Column Leaching and Sorption Phase IV – Desorption and Ksat
The work done in each phase is discussed in the following sections. A summary of the most important findings of all four phases follows. ASH MATERIALS Three different coal ashes were used in this study. The first ash, labeled Hopewell, is a coarser textured, black material. This is a flyash from a stoker boiler unit which keeps separate its fly and bottom ashes. When wet, this ash exhibited an oily sheen on the surface. The two other ash materials tested were fine-textured, one of which is gray, the other being dark black. These ashes were derived from a typical utility ponded flyash with a pulverized coal boiler. They were processed by a carbon separation system developed by the North Carolina State University Minerals Research Laboratory and the Land of the Sky Regional Council Waste Reduction Partners. The gray, fine-textured material labeled Medium-Carbon is the fraction of the flyash with an LOI range of 16 percent to 65 percent. The dark-black, fine-textured material, labeled High-Carbon is the fraction of the flyash with an LOI above 70 percent.

SAMPLE PREPARATION The ashes arrived in three separate 5-gallon plastic buckets. To prevent preferential settling within their containers, the ashes were placed in a rotating mixer and sub-samples of each were subsequently placed into quart size plastic Ziploc bags. The Hopewell sample was passed through a 2 mm sieve after mixing had taken place and before it was used for any of the experiments. PHASE I - BASELINE ASH CHARACTERIZATION Specific Methods
All three ashes were analyzed by the following methods:
1. Saturated paste pH and Electrical Conductance (EC) (Rhoades, 1982) 2. Hot CaCl2 extractable B (Bingham, 1982) 3. Total elemental analysis, method 3050 (U.S. EPA, 1992a) 4. Sequential extraction procedure (Tessier et al., 1979) 5. Toxicity Characteristic Leaching Procedure (TCLP) (U.S. EPA, 1992b) 6. Mehlich-1 extraction (Mehlich, 1953) 7. Saturated hydraulic conductivity (Ksat) (Klute and Dirksen, 1982).
Furthermore, we added a test to determine the potential liming capacity of the ashes. The results of this test are given as percent (%) of calcium carbonate equivalent (CCE).
Results and Discussion
While all three fly ash materials contained an appreciable amount of soluble salts (as measured by the electrical conductance, EC), these are in the lower range for fly ashes. A value of 4.0 ds/m (or mmhos/cm) is generally considered to be the cutoff for salt sensitive plants in a whole soil saturated paste extract. The Hopewell ash contained a greater concentration of dissolved salts compared to both the High and Medium Carbon ashes (Table 1). The relatively low pH values, 4.9 to 5.5, are not a concern because of the modest buffering capacity that is provided by the calcareous material included in the ashes. The ashes have a liming capacity (CCE) equivalent to 2.5 to 6.1% of CaCO3 (limestone).
The extraction of the ashes with an established soil test procedure (Mehlich-1) did not provide any evidence of potential micronutrient toxicity as extractable levels were in the low range for the Virginia Tech Extension Soil Test Lab calibrations for row crops. Boron, which is often present in fly ashes in high concentrations, was evident only at low relative concentrations, both in the Mehlich-1 extract and in the hot CaCl2 extraction method specifically designed for B.

Table 1. Basic Chemical Properties and Plant Available Nutrients by Mehlich-1 Extraction.
Sat. Paste Extr. Extr.* CCE** Mehlich-1 Extract. Nutrients (mg kg-1)
Ash EC (dS m-1) pH B % P K Ca Cu B Hopewell 4.0 5.49 1.4 6.2 34 114 440 12.4 2.4 High Carbon 0.6 5.23 0.9 3.1 17 25 187 1.3 0.7 Medium Carbon
1.3 4.88 0.3 2.5 18 36 465 0.3 1.3
* Hot CaCl2 extractable boron, mg kg-1. ** Calcium Carbonate Equivalent: the liming capacity of the material with respect to CaCO3. Table 2 presents data from the EPA Toxicity Characteristic Leachate Procedure (TCLP) which is designed to estimate certain elements and compounds that could be released at potentially toxic concentrations in a moderately acidic soil environment. All observed concentrations were well below EPA critical levels. For both the Hopewell and the Medium Carbon ash, the concentrations were very low or below detection limits. Only the High Carbon ash indicated any appreciable extractability of As (TCLP) which reflects the higher total concentration of arsenic (As) in this ash. Table 2 also presents the total analysis data for selected elements of interest. With the exception of total As in the High C ash, the total values are all relatively low for materials such as these.
It is also important to point out that the analyses reported here were all performed on raw unwashed ash samples. These materials will be pre-washed to remove bulk salts (primarily sulfates) before utilization in a field environment and are extensively leached in our Phase III columns before nutrients are applied.
Overall, the data from these three fly ash materials indicate that these materials are relatively “clean” with respect to elements of concern and their respective leachability, particularly in environments with moderate to neutral pH as would be expected in the target stormwater runoff environment.
Table 2.Toxicity Characteristic Leaching Procedure (TCLP) results and Total Elemental Analysis (USEPA 3050) of three ash samples utilized study.
TCLP (mg kg-1) Total Elemental Analysis (mg kg-1)
Ash As Cd Cr Se As Cr Cd Cu Se Zn Hopewell 0.032 <.006 0.006 0.045 46 198 <1 72 36 42 High Carbon 0.217 <.006 0.008 0.206 133 61 <1 36 15 25 Medium Carbon
<0.017 <.006 0.006 0.035 53 50 <1 38 29 26
We also analyzed the saturated hydraulic conductivity (permeability) of the ash materials, and that effort was essential for setting up the Phase III leaching column work that is currently underway. Table 3 presents those data for pure ashes as received and

for mixtures of each ash with glass beads at a ratio of 1:1 (v:v). Blending the ash materials with glass beads increased the saturated conductance to a limited extent for two of the ashes. The Hopewell ash, because of its coarser nature, has a very rapid and relatively unrestricted conductivity, similar to sand. The finer textured Medium and High Carbon ashes have significantly lower conductivity, similar to those of sandy clay. One obvious implication of these data is that permeability of the ashes will obviously need to be evaluated and manipulated in field application to ensure that stormwater will be able to pass through the “filter pack” of materials at an appropriate rate.
Table 3. Saturated hydraulic conductivity of pure ashes and 50:50 ash:glass bead mixtures.
Glass
beads Hopewell High Carbon Medium Carbon
Ash:Beads 0 : 100 100 : 0 50 : 50 100 : 0 50 : 50 100 : 0 50 : 50 ------------------------------------------ cm/sec ----------------------------------
Ksat 1.53E-02 3.30E-03 7.43E-03 9.59E-04 9.22E-04 2.28E-04 2.05E-04
The three ashes also differ significantly in their bulk density. The bulk density of the Hopewell and Medium Carbon ashes are 1.07 and 1.19 g cm-3, respectively, but only 0.47 g cm-3 for the High Carbon ash. The data presented to this point present the data on a weight basis, generally as mg kg-1. However, for the intended use of the ashes, these data need to also be considered on volumetric basis. This is particularly important with respect to their sorption capacities. Table 4 presents the sorption capacities on a per volume basis. Where as there were major differences particularly in the P sorption capacity, normalizing the data based on bulk density shows that the ashes do not differ as significantly as when reported by mass. This was an important input for the design of the column adsorption/leaching study and will be considered in the subsequent interpretation of the data and how they apply to applications in the field.
Table 4. Nutrient adsorption maxima of three fly ashes expressed on volumetric basis.
Material O-phosphate Nitrate Ammonium
mg/L mg/L mg/L Medium Carbon 57.0 11.9 43.0 High Carbon 56.4 0.9 16.4 Hopewell 65.7 27.8 48.1
PHASE II - REMOVAL OF SALTS It was understood that these ash materials would need to be “pre-washed” to remove bulk salts (particularly sulfates) before they could be utilized in their intended field setting. Therefore, the amount of water needed to wash out soluble salts from the ashes was determined by leaching aliquots of doubly deionized (DDI-18.2MΩ.cm) water through ash in Buchner funnels under vacuum. Three replicates of each ash were
placed in 7 cm diameter Buchner funnels with an approximate volume of 33 cm3 of ash per funnel. The mass of each ash used was recorded. The ash was placed on top of Whatman #42 filter paper. A thin layer of glass beads was placed on top of the ash to minimize disturbance of the surface during addition of the DDI water. Fifty ml aliquots of DDI water were added to each sample and vacuumed filtered into high density polycarbonate (HDPC) bottles. Electrical conductivity (EC) and pH were measured and recorded after each aliquot was leached. The bottles were then stored, at 4° C for further analysis. Aliquots of water were added until the EC reached a steady value. The collected leachates were later filtered through a 0.22 μm filter membrane and analyzed for ortho-phosphate, nitrate, and ammonium. In preparation for the adsorption isotherms, about 2 kg of each ash was washed free of salts. This was accomplished by adding the ash to a large 24 cm diameter Buchner funnel on top of grade 1 filter paper. The ash was leached with twice the volume of DDI water that was determined from the above leaching procedure in order to adequately remove soluble salts and nutrients form the ashes. After leaching, the ash was transferred to a metal drying pan and dried overnight in a 105° C oven. The ash was then placed in large polypropylene bags for storage. Adsorption Isotherms Approximately 25 grams of ash were transferred into 250 ml HDPC centrifuge bottles. The ash was hydrated with 120 ml DDI water and shaken at 180 rpm overnight. After hydrating, pH was measured and recorded. The suspension was brought to a final volume of 150 ml minus the volume of nutrient stock solution to be added. Nutrient solutions were added from 200 parts per million (ppm) stock solutions made of reagent grade monobasic potassium phosphate, potassium nitrate, and ammonium chloride salts. The isotherms were run in duplicate over a range of concentrations from 0 ppm (blanks) to 40 ppm for each nutrient. The treatments were allowed to equilibrate for 24 hours on a shaker at 180 rpm. This equilibration time was determined from previous kinetic adsorption experiments. After the equilibration period, pH was measured and 10 ml aliquots of each suspension were passed through a 0.22 μm filter membrane into 15 ml high density polyethylene (HDPE) test tubes and stored at 4° C until analysis. All nutrients were analyzed using a Dionics high-pressure ion chromatograph. Results of Salt Removal All fly ash materials contained an appreciable amount of soluble salts. The Hopewell ash contained a greater concentration of dissolved salts compared to both the High and Low Carbon ashes (Fig. 1). These salts were rapidly leached from the fly ash and EC values were below 100 μS m-1 after leaching with 150 ml DDI water. Thus it took approximately a 5:1 V:V (water:ash) ratio to elute the salts to this level. The initial pH

values for the fly ash were 4.8. 5.1, and 5.6 for the Medium Carbon, High Carbon and Hopewell ashes, respectively. These pH values increased approximately 0.50 pH units after leaching with 300 mls of DDI. The leaching effluent was also analyzed for ammonium, nitrate, and ortho-phosphate to account for any residual nutrients that would influence the adsorption results. Ammonium was found in all ashes at values greater than 1 ppm while only trace quantities of ortho-phosphate and nitrate were found (< 0.10 and < 0.05 ppm for nitrate and orthophosphate, respectively; see Fig. 2). Eluted ammonium concentrations ranged from approximately 1.23 ppm for the Medium Carbon ash to 22.50 ppm for the Hopewell ash. Based on these results, blanks were run for all adsorption experiments and these values were subtracted from the adsorption isotherms.
Figure 1. Electrical Conductivity values as a function of leaching volume.

Figure 2a. Nutrient concentration (P) as a function of leaching volume.
Figure 2b. Nutrient concentration (nitrate-N) as a function of leaching volume.

Figure 2c. Nutrient concentration (ammonium-N) as a function of leaching volume. Adsorption Kinetics A separate adsorption experiment at the highest initial nutrient concentration (40 ppm) was conducted to examine adsorption kinetics over the 24-hour equilibration time. Adsorption of all nutrients increased over time and reached a steady state after approximately 15 hours (Fig. 3). The slow rate of adsorption is likely due to diffusion of the nutrients to potential adsorption sites on/in the amorphous fly ash matrix. Based on the kinetic data, all batch adsorption isotherms were run for a period of 24 hours.

Figure 3. Adsorption of ortho-phosphate on fly ash materials as a function of time. Adsorption Isotherms Adsorption of ortho-phosphate, nitrate-N, and ammonium-N were examined as a function of initial nutrient concentration. Results were applied to the Langmuir adsorption equation (Eq 1) and linear form of the Langmuir adsorption equation (Eq. 2) to calculate the maximum quantity of nutrients the fly ashes could adsorb over the concentration range investigated. q = kCb/(1 + kC) Eq. 1 C/q = 1/kb + C/b Eq. 2 where q is the quantity adsorbed (mg/Kg), C is the equilibrium or final adsorptive concentration (mg/L), k is a constant related to binding strength, and b is the adsorption maxima (mg/Kg). Ortho-phosphate Ortho-P adsorption on the fly ash materials is shown in Figure 4. All materials adsorbed significant quantities of ortho-phosphate. Adsorption maxima ranged from 47.9 mg/Kg for the Medium Carbon material to 120 mg/Kg for the High Carbon material (Table 5).

Figure 4. Ortho-P adsorption as a function of equilibrium adsorptive concentration. Table 5. Nutrient adsorption maxima determined from Eq. 2 and associated coefficients of determination (R2)
Material O-phosphate Nitrate Ammonium R2 mg/Kg mg/Kg mg/Kg
Medium Carbon 47.9 0.96 Medium Carbon 10* N/A Medium Carbon 36.1 0.79 High Carbon 120 0.99 High Carbon 1.88 0.99 High Carbon 35* N/A Hopewell 61.4 0.99 Hopewell 26 0.98 Hopewell 45* N/A *Estimated for Eq. 1
Nitrate-N Nitrate-N adsorption is shown in Figure 5. All fly ash materials adsorbed relatively little nitrate-N. Adsorption maxima ranged from 1.88 mg/Kg for the High Carbon ash to 26 mg/Kg for the Hopewell ash (Table 5). Nitrate-N adsorption on the Hopewell and High Carbon ashes was described well by the linear form of the Langmuir equation while significant deviation was observed for the Medium Carbon ash (R2 0.17). Hence, the adsorption maximum was estimated from Figure 5. Nitrate-N adsorption increased

as solution concentration increased for all ashes except the Medium Carbon. The data point for the highest solution concentration for the Medium Carbon ash is not shown in Figure 5. This is due to negative adsorption that may have been caused by analytical error associated with dilution.
Figure 5. Nitrate-N adsorption as a function of equilibrium adsorptive concentration. Ammonium-N Ammonium-N adsorption is shown in Figure 6. Relatively little ammonium-N adsorption was observed at low solution concentrations. However, as the ammonium-N solution concentration increased to 40 ppm significant adsorption was observed. Adsorption maxima ranged from 35 to 45 mg/Kg (Table 5). Only ammonium-N adsorption on the Medium Carbon ashes was described well by the linear form of the Langmuir equation, while significant deviation (non-linear) was observed for the other two ash materials.

Figure 6. Ammonium-N adsorption as a function of equilibrium adsorptive concentration. Discussion Adsorption was observed for all nutrients on all fly ash materials. Ortho-P adsorbed to the greatest extent followed by ammonium-N and then nitrate-N. Adsorption kinetics were relatively slow compared to other known soil mineral surfaces with adsorption reaching a steady state after approximately 15 hours. No clear trend was observed for nutrient adsorption on the various ash materials. All ashes adsorbed similar quantities of ammonium-N while the High Carbon ash adsorbed the greatest mass of ortho-P and the Hopewell ash adsorbed the greatest mass of nitrate-N. A thorough surface characterization of the fly ash materials would be necessary before one could accurately explain these differences in adsorption behavior. However, based on common minerals found in fly ashes and the measured pH of the suspensions it is likely that the ortho-P and nitrate-N are adsorbing to variable charge surfaces such as amorphous Fe/Al-oxyhydroxides while ammonium-N is adsorbing to permanently charged surfaces such as amorphous silicates or combustion resistant mineral fragments. Ortho-P forms strong covalent bonds (inner-sphere complexes) with oxyhydroxide surfaces while nitrate-N and ammonium-N are adsorbed electrostatically (outer-sphere complexes; see Fig. 7). The total quantity of ortho-P and ammonium-N adsorbed are most likely related to the quantity of variable and permanently charged surfaces present

in the fly ash materials. It is likely that the Medium Carbon ash has the greatest quantity of Fe/Al oxyhydroxides while all ash materials have a relatively similar amount of permanently charged minerals (i.e. silicates).
Figure 7. Inner vs. outer-sphere adsorption at the mineral water interface. In the case of ammonium-N, little adsorption was observed at low initial solution concentrations and adsorption did not significantly increase until the solution concentration reached 40 ppm. Since all experiments were conducted in DDI water, this may be related to a compression of the electrical double layer at higher concentrations increasing ammonium adsorption on permanently charged sites. Similar to ammonium, nitrate-N is electrostatically (outer-sphere) adsorbed to mineral surfaces. However, most mineral surfaces have a net negative charge at circumneutral pH values and thus repel nitrate. Variable charge surfaces such as Fe/Al-oxyhydroxides can exhibit positive charge, hence adsorbing anions, but this does not become significant until pH values drop to 5.0 (depending on the mineral). The greatest amount of nitrate-N was adsorbed on the Hopewell ash that had an initial experimental pH of around 5.0, which was almost 0.50 pH units less than the other ashes. This may explain the difference observed for nitrate adsorption on the Hopewell and Medium Carbon ashes,

but it is unclear why the High Carbon ash adsorbed little nitrate-N comparatively. The high orthophosphate adsorption on this ash was attributed to higher quantities of Fe/Al oxyhydroxides. If this is the case, then similar to the High Carbon ash, one should see significant nitrate adsorption. Other reactions may be occurring during the adsorption experiments and additional studies are necessary to explain the observed discrepancies. PHASE III - COLUMN LEACHING AND SORPTION The focus of this portion of the project was on the column leaching trial conducted to study the sorption of contaminants in simulated urban/suburban runoff and the elution of potential contaminants from the ash itself. Carleton et al. (2000) reported nutrient concentrations from 33 urban runoff events, with total P concentrations ranging from 0.005 to 0.43 mg P/L, and almost half being soluble P. The TKN levels in that study ranged from 0.35 to 2.24 mg N/L. Brezonik and Stadelmann (2002) summarized 15 studies that incorporated 68 watersheds and reported median total P concentrations of 0.41 mg P/L of which 0.15 mg P/L was dissolved P, and median TKN of 1.85 mg N/L of which 0.44 mg N/L was nitrate + nitrite-N. Based on these reports, we developed one simulated runoff solution that contained 0.15 mg P/L, 0.5 mg NO3-N/L, 0.5 NH4-N/L, and 10 mg/L oxalate-C (oxalic acid), and a second solution with twice these concentrations. The first half of the column experiment consisted of washing/leaching the ashes in preparation for the waste adsorption experiment, with simultaneous determination of release of nutrients and potential contaminants into those washes. This work was followed by dosing of the ashes with the two simulated runoff solutions to determine the potential field-sorption capacity of the ashes. At the termination of the sorption phase, the columns were flushed with a strong salt solution to determine whether or not the bound materials could be easily desorbed. These latter data (desorption) will be reported later. Specific Methods
The sequential extraction procedure (SEP) for all three ashes was outlined in detail in the Baseline Ash Characterization section of this paper. The detailed methods for the column experiments are as follows:
Replicates (3) of each ash along with three glass bead control columns were prepared in PVC columns. All columns were repeatedly (9 times) washed/leached with 150 ml ultra-pure distilled water and the leachates were collected for analysis. Columns were then assigned to receive applications (9 times) of simulated urban runoff solution with low or high concentrations of ammonium-N, nitrate-N and oxalate (organic C). A separate set of ash columns received ultra-pure distilled water to determine continued release of the study constituents and potential contaminants. All leachates were collected and analyzed for the elements/compounds of interest.
• Columns: PVC piping, 7.5cm id, 40 cm height; convex end-cap with fitted valve for leachate effluent drainage.
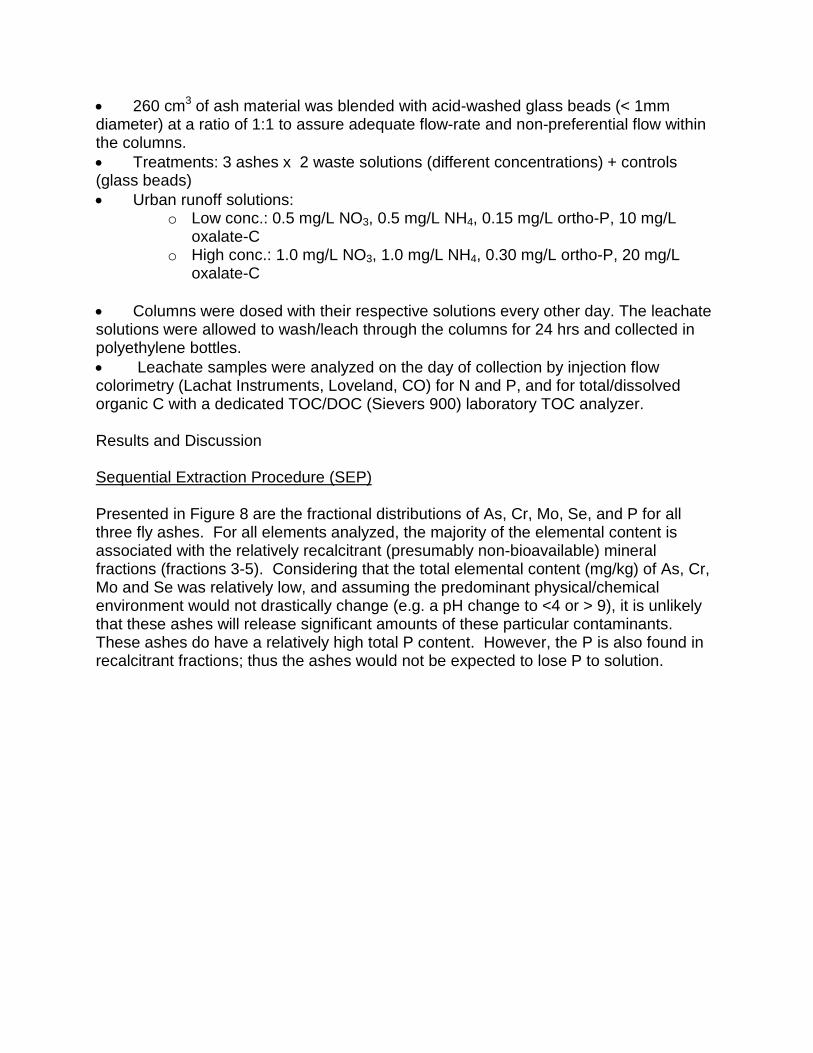
• 260 cm3 of ash material was blended with acid-washed glass beads (< 1mm diameter) at a ratio of 1:1 to assure adequate flow-rate and non-preferential flow within the columns. • Treatments: 3 ashes x 2 waste solutions (different concentrations) + controls (glass beads) • Urban runoff solutions:
o Low conc.: 0.5 mg/L NO3, 0.5 mg/L NH4, 0.15 mg/L ortho-P, 10 mg/L oxalate-C
o High conc.: 1.0 mg/L NO3, 1.0 mg/L NH4, 0.30 mg/L ortho-P, 20 mg/L oxalate-C
• Columns were dosed with their respective solutions every other day. The leachate solutions were allowed to wash/leach through the columns for 24 hrs and collected in polyethylene bottles. • Leachate samples were analyzed on the day of collection by injection flow colorimetry (Lachat Instruments, Loveland, CO) for N and P, and for total/dissolved organic C with a dedicated TOC/DOC (Sievers 900) laboratory TOC analyzer.
Results and Discussion
Sequential Extraction Procedure (SEP)
Presented in Figure 8 are the fractional distributions of As, Cr, Mo, Se, and P for all three fly ashes. For all elements analyzed, the majority of the elemental content is associated with the relatively recalcitrant (presumably non-bioavailable) mineral fractions (fractions 3-5). Considering that the total elemental content (mg/kg) of As, Cr, Mo and Se was relatively low, and assuming the predominant physical/chemical environment would not drastically change (e.g. a pH change to <4 or > 9), it is unlikely that these ashes will release significant amounts of these particular contaminants. These ashes do have a relatively high total P content. However, the P is also found in recalcitrant fractions; thus the ashes would not be expected to lose P to solution.

Figure 8. Sequential fractionation of As, Se, Cr, Mo, and P of three fly ashes. Total mass content is given at the top of each bar.
Exchangeable
Carbonates
Amorphous Fe & Mn
Crystalline Fe & Mn
Residual
0%
10%
20%
30%
40%
50%
60%
70%
80%
90%
100%
As Se Cr Mo P
Medium Carbon Fly Ash
pH: 4.87
EC: 1.36
CCE: 2.5
0%
10%
20%
30%
40%
50%
60%
70%
80%
90%
100%
As Se Cr Mo P
High Carbon Fly Ash
pH: 5.23
EC: 0.63
CCE: 3.1
0%
10%
20%
30%
40%
50%
60%
70%
80%
90%
100%
As Se Cr Mo P
Hopewell Fly Ash
pH: 5.49
EC: 4.02
CCE: 6.2
27.7 2.2 7.9 1.0 93.8 mg kg-1 54.2 8.8 10.5 2.4 98.2 mg kg-1
47.8 5.8 9.3 5.7 160.2 mg kg-1

Adsorption of Urban Runoff N, P and C by Ash Products
Presented in Figures 9-13 are the results of the ammonium-N, nitrate-N, ortho-P, and oxalate (as the organic C compound) adsorption/retention by the three fly ashes. The figures show: 1) the net cumulative sorption; and 2) the percentage of the input solution being retained (sorbed) by the column matrix. The cumulative sorption was calculated as follows: the quantity applied to each column minus the quantity eluted from each column after passing through the ash matrix minus the quantity of the respective element released by the control columns (of same ash matrix) being leached in parallel with distilled water.
Figure 9 shows the sorption characteristics of three ashes with respect to oxalate. This figure indicates continual, but decreasing net release of organic C (shown as negative sorption) for all three ashes when leached with distilled water. The Hopewell ash appears best suited to sorb oxalate-C as it retained 50% and 80% of the C contained in the 1st dose, indicating that C sorption was partially dependent on the on the C concentration of the influent solution. By the 9th dose, however, this concentration dependence had nearly diminished, and the Hopewell ash adsorbed approximately 70% of the applied C. The sorption capacity of the Medium and High Carbon ashes appeared to remain dependent on the influent C concentration, and both had considerably lower capacities to retain C. The Medium-C ash did exhibit positive C retention (% sorption > 0) until the 6th dosing, and subsequently achieved only 20% retention with the 9th dosing for the Low-C concentration solution. The retention of C from the -C concentration input solution varied from 5% of the first dose to 58% with the 9th dose. The High-C ash showed poor initial C retention with the 1st dosing, but improved considerably with the 2nd dosing, and retained 40% (Low-C input solution) and 75% (-C input solution) at the 9th dosing.
The Medium and High Carbon ashes were both very effective for ammonium (NH4) sorption (Figure 3). Regardless of the input solution concentration, nearly 100% was retained. The Hopewell ash was at first a net contributor of NH4, but improved in sorption capacity over time. While only 10% of the first dosing (on average for the two input concentrations) was retained, the sorption of the Hopewell ash improved to >90% with the 9th dosing.
The data for nitrate-N sorption was variable, but overall NO3-N retention was low and decreased over time. The High Carbon and Medium Carbon ashes sorbed >95% from the first dosing, but retention decreased to < 40% by the 7th dosing. Our results from Phase II on the determination of the adsorption maxima also indicated that all three ashes had low capacities to sorb NO3-N, and the column leaching further confirmed these results.
Initially, P sorption/retention was concentration-dependent as indicated by the differing (%) sorption values from the high- versus low-input concentrations (Figure 5). Initially, there was higher sorption from the high-P input solutions. However, by the 9th dosing event, net sorption varied between 75 and 85% for the three ashes, regardless of input

concentration. Our data from the batch experiment on P-sorption capacities of the ashes also indicated very similar total P-sorption capacities. Sorption capacities of the three ashes are quite similar; around 60 µg P cm-3 of ash. Thus, with an average cumulative retention of 1.25 µg cm-3, only about 1/40 of sorption capacity was used over the course of this experiment.

Figure 9. Net oxalate sorption by three fly ashes and the effect of influent oxalate concentration as measured by percent sorption from the input solution.
Net Cummulative Oxalate Sorption (ug / cm3)
-40.0
-20.0
0.0
20.0
40.0
60.0
80.0
0 1 2 3 4 5 6 7 8 9 10Sorption Event
Net
Oxa
late
Sor
ptio
n (u
g / c
m3 )
Ho-low HC-low MedC-low Glass-low
Ho-high HC-high MedC-high Glass-high
Ho-w ater HC-w ater MedC-w ater
Oxalate Sorption as Percent (%) of Input Solution
-50
-30
-10
10
30
50
70
90
110
0 1 2 3 4 5 6 7 8 9 10Sorption Event
Per
cent
(%) O
xala
te S
orpt
ion
Ho-low HC-low MedC-low Glass-low
Ho-high HC-high MedC-high Glass-high
Legend: Ho = Hopewell fly ash Med = Medium Carbon fly ash HC = High Carbon fly ash Glass = Glass beads as an inert control media -low = low element concentration input solution -high = high element concentration input solution

Figure 10. Net ammonium-N sorption by three fly ashes and the effect of ammonium-N concentration as measured by percent sorption from the input solutions.
Net Cummulative NH4 Sorption (ug NH4 / cm3 Ash)
-1.00
0.00
1.00
2.00
3.00
4.00
5.00
6.00
0 1 2 3 4 5 6 7 8 9 10
Sorption Event
Net
NH
4 Sor
ptio
n
Ho-low HC-low MedC-low Glass-lowHo-high HC-high MedC-high Glass-highHo-w ater HC-w ater MedC-w ater
NH4 Sorption as Percent (%) of Input Solution
-40
-20
0
20
40
60
80
100
120
140
0 1 2 3 4 5 6 7 8 9 10Sorption Event
Perc
ent (
%) N
H 4 S
orpt
ion
Ho-low HC-low MedC-low Glass-low
Ho-high HC-high MedC-high Glass-high

Figure 11. Net nitrate-N sorption by three fly ashes and the effect of nitrate-N concentration as measured by percent sorption from the input solutions.
Net Cummulative NO3 Sorption (ug / cm3)
-0.50
0.00
0.50
1.00
1.50
2.00
2.50
3.00
0 1 2 3 4 5 6 7 8Sorption Event
Net
NO
3 Sor
ptio
n
Ho-low HC-low MedC-low Glass-lowHo-high HC-high MedC-high Glass-highHo-w ater HC-w ater MedC-w ater
NO3 Sorption as Percent (%) of Input Solution
-20
0
20
40
60
80
100
120
0 1 2 3 4 5 6 7 8Sorption Event
Perc
ent (
%) N
O3 S
orpt
ion
Ho-low HC-low MedC-low Glass-low
Ho-high HC-high MedC-high Glass-high

Figure 12. Net P sorption by three fly ashes and the effect of P concentrations as measured by percent sorption from the input solutions.
Net Cummulative P Sorption (ug P / cm3 ash)
-0.40
-0.20
0.00
0.20
0.40
0.60
0.80
1.00
1.20
1.40
1.60
0 1 2 3 4 5 6 7 8 9 10Sorption Event
Net
P S
orpt
ion
(ug
/ cm
3 )
Ho-low HC-low MedC-low Glass-low
Ho-high HC-high MedC-high Glass-high
Ho-w ater HC-w ater MedC-w ater
P Sorption as Percent (%) of Input Solution
0
20
40
60
80
100
120
0 1 2 3 4 5 6 7 8 9 10Sorption Event
Perc
ent (
%) S
orpt
ion
Ho-low HC-low MedC-low Glass-low
Ho-high HC-high MedC-high Glass-high

PHASE IV – DESORPTION AND KSAT Specific Methods
Given below are the specific details for: 1) testing the potential for desorbing nutrients and organic phases (NH4-N, NO3-N, ortho-P, and oxalate) from the “used” fly ash materials and possibly regenerating them for future use (following 9 cycles of adsorption), and 2) determination of Ksat values using larger-sized columns and a higher (falling) head method.
Desorption of nutrients: Following the complete draining of the last (9th) 150 ml dose of the simulated urban waste solutions, we applied 150ml of a 1 M Na2SO4 solution to each column to presumably desorb various N, P and organic constituents via mass action. The leachate from this application was collected and analyzed for NH4-N, NO3-N, ortho-P, and oxalate-C. The results of this “washing” are presented as the removal (as percent) of the elements that had been adsorbed from the prior 9 dosing events with the urban waste solution.
Ksat: We utilized leaching columns with an inside diameter of 7.5 cm and a total height of 44 cm. The ash sample, 260 cm3, was placed on top of 1.5cm glass beads and a high-flow filter paper to avoid any loss of ash. The ash layer was thus approximately 6 cm thick and topped off with 1.5 cm glass bead layer to avoid disturbance of ash with the application of the water. 250 ml of water was applied and allowed to drain freely for 24 hrs in order to moisten the ash materials. The drain was then plugged, and 30 cm of water were ponded on top of the ash layer. The drain line was then unplugged to allow the water to drain through the ash layer. Periodic fall times and leachate volumes were recorded to calculate Ksat values.
Table 6. Saturated hydraulic conductivity of pure ashes and 50:50 ash:glass bead mixtures.
Glass
beads ----- Hopewell ------ -- High Carbon -- -- Medium Carbon --
Ash:Beads 0 : 100 100 : 0 50 : 50 100 : 0 50 : 50 100 : 0 50 : 50 --------------------------------------------- cm/sec --------------------------------------------
Ksat small sample
1.53E-02 3.30E-03 7.43E-03 9.59E-04 9.22E-04 2.28E-04 2.05E-04
Ksat large sample
ND* 8.42E-04 ND 4.66E-04 ND 1.38E-04 ND
*Not Determined

Table 7 Sorption and desorption of oxalate, NH4-N, NO3-N, and P by three fly ash materials. Oxalate (TOC)
(µg cm-3) NH4-N
(µg cm-3) NO3-N
(µg cm-3) P
(µg cm-3) Ash Material with treatment Sorbed Desorbed Sorbed Desorbed Sorbed Desorbed Sorbed Desorbed Hopewell – water -6.72 1.64 0.00 0.91 -0.02 0.00 -0.23 0.00 Hopewell – low conc. waste 27.72 5.65 0.83 0.90 0.77 0.06 0.60 0.22 Hopewell – high conc. waste 73.13 3.98 3.46 1.24 2.16 0.28 1.41 0.51
High-C – water -29.58 6.26 0.00 0.00 0.00 0.00 -0.03 0.00 High-C – low conc. waste -6.80 4.02 2.59 0.01 1.78 0.00 0.51 0.07 High-C – high conc. waste 33.83 4.11 4.95 0.00 2.65 0.17 1.15 0.07
Medium-C – water -20.59 4.88 0.00 0.22 -0.01 0.00 -0.01 0.00 Medium-C – low conc. waste 10.99 2.16 2.62 0.28 1.35 0.13 0.67 0.01 Medium-C – high conc. waste 64.24 4.13 4.86 0.16 1.83 0.23 1.32 0.04
RESULTS AND DISCUSSION FOR ALL FOUR PHASES OF THE STUDY
Phases I and II - Basic Characterization and Chemical Properties
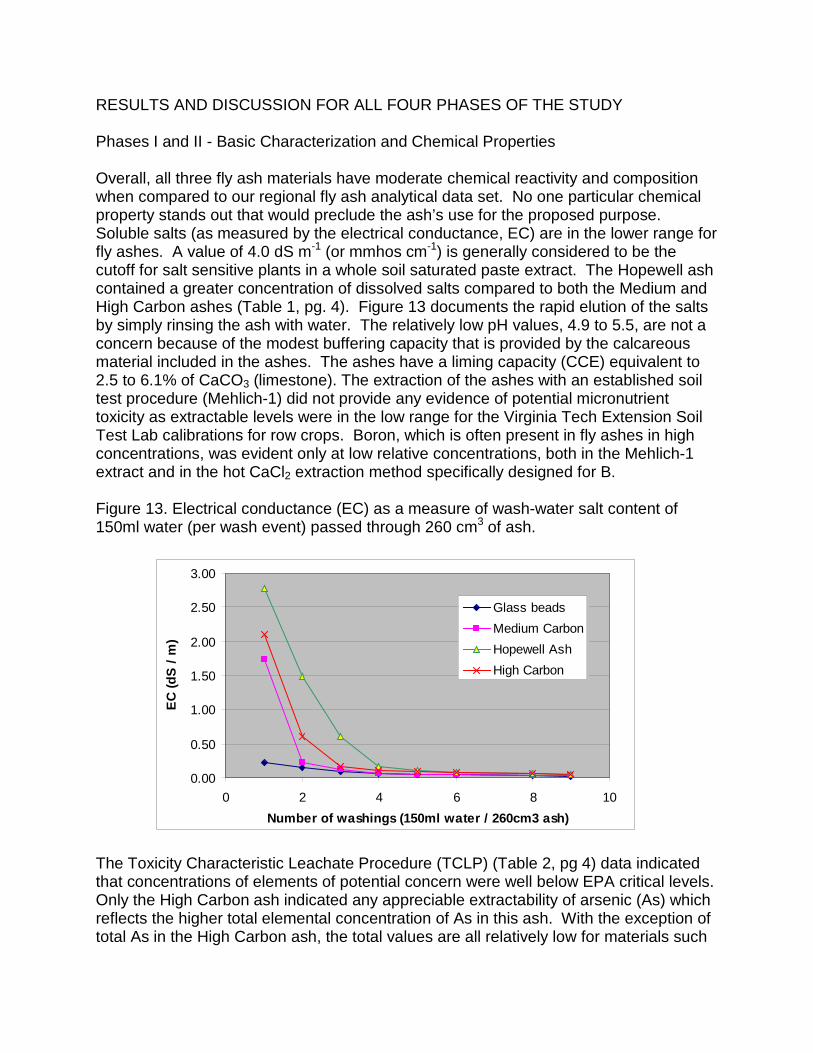
Overall, all three fly ash materials have moderate chemical reactivity and composition when compared to our regional fly ash analytical data set. No one particular chemical property stands out that would preclude the ash’s use for the proposed purpose. Soluble salts (as measured by the electrical conductance, EC) are in the lower range for fly ashes. A value of 4.0 dS m-1 (or mmhos cm-1) is generally considered to be the cutoff for salt sensitive plants in a whole soil saturated paste extract. The Hopewell ash contained a greater concentration of dissolved salts compared to both the Medium and High Carbon ashes (Table 1, pg. 4). Figure 13 documents the rapid elution of the salts by simply rinsing the ash with water. The relatively low pH values, 4.9 to 5.5, are not a concern because of the modest buffering capacity that is provided by the calcareous material included in the ashes. The ashes have a liming capacity (CCE) equivalent to 2.5 to 6.1% of CaCO3 (limestone). The extraction of the ashes with an established soil test procedure (Mehlich-1) did not provide any evidence of potential micronutrient toxicity as extractable levels were in the low range for the Virginia Tech Extension Soil Test Lab calibrations for row crops. Boron, which is often present in fly ashes in high concentrations, was evident only at low relative concentrations, both in the Mehlich-1 extract and in the hot CaCl2 extraction method specifically designed for B. Figure 13. Electrical conductance (EC) as a measure of wash-water salt content of 150ml water (per wash event) passed through 260 cm3 of ash.
The Toxicity Characteristic Leachate Procedure (TCLP) (Table 2, pg 4) data indicated that concentrations of elements of potential concern were well below EPA critical levels. Only the High Carbon ash indicated any appreciable extractability of arsenic (As) which reflects the higher total elemental concentration of As in this ash. With the exception of total As in the High Carbon ash, the total values are all relatively low for materials such
0.00
0.50
1.00
1.50
2.00
2.50
3.00
0 2 4 6 8 10Number of washings (150ml water / 260cm3 ash)
EC (d
S / m
)
Glass beadsMedium CarbonHopewell AshHigh Carbon

as these. Overall, the data from these three fly ash materials indicate that these materials are relatively “clean” with respect to elements of concern and their respective leachability, particularly in environments with moderate to neutral pH as would be expected in the target stormwater runoff environment.
Adequate saturated hydraulic conductivity (permeability) of the ash materials will be essential for its intended use. Table 3 (pg. 5) presents those data for pure ashes as received and for mixtures of each ash with glass beads at a ratio of 1:1 (v:v). These data were first obtained with a small-scale apparatus (20 cm3 sample volume and 9 cm falling head). Follow-up data were also obtained with larger scale (260 cm3 ash, 30 cm falling head) apparatus. The Hopewell ash, because of its coarser nature, has a very rapid and relatively unrestricted conductivity, similar to sand. The fine textured High Carbon and Medium Carbon ashes have significantly lower conductivity, similar to those of sandy clay. The coarse texture component of the Hopewell ash makes it more suitable for applications where flow rates are critical. How limiting the Ksat is for the fine-textured ashes will depend on the intended field applications, hydraulic heads, and nutrient sorption/flow requirements. The three ashes also differ significantly in their bulk density. The bulk density of the Hopewell and Medium Carbon ashes are 1.07 and 1.19 g cm-3, respectively, but only 0.47 g cm-3 for the High Carbon ash. For the intended use of the ashes, all data needs to be considered on volume basis. This is particularly important with respect to their sorption capacities. Table 4 (pg. 5) presents the sorption capacities on a per volume basis. The data show that the ashes do not differ as significantly by volume as when reported by mass (see Phase II report, 9/30/07). Phase III - Column Leaching and Sorption For all elements analyzed, the majority of the elemental content is associated with the relatively recalcitrant (presumably non-bioavailable) mineral fractions (fractions 3-5; Figure 8, pg 17). Considering that the total elemental content (mg/kg) of As, Cr, Mo and Se was relatively low, and assuming the predominant physical/chemical environment would not drastically change (e.g. a pH change to <4 or > 9), it is unlikely that these ashes will release significant amounts of these particular contaminants. These ashes do have a relatively high total P content. However, the P is also found in recalcitrant fractions; thus the ashes would not be expected to lose much P to solution. Adsorption of Urban Runoff N, P and C by Ash Products
Presented in Figures 9 -12 (pp. 20 – 23) are the results of the ammonium-N, nitrate-N, ortho-P, and oxalate (as the organic C compound) adsorption/retention by the three fly ashes. The figures show: 1) the net cumulative sorption; and 2) the percentage of the input solution being retained (sorbed) by the column matrix. The cumulative sorption was calculated as follows: the quantity applied to each column minus the quantity eluted from each column after passing through the ash matrix minus the quantity of the respective element released by the control columns (of same ash matrix) being leached in parallel with distilled water.

These data are discussed in detail in Phase III. The most important findings are as follows:
Oxalate: The Hopewell ash appears best suited to sorb oxalate-C as it retained 50% and 80% of the C contained in the 1st dose, indicating that C sorption was partially dependent on the C concentration of the influent solution (Figure 9, pg 20). By the 9th dose, however, this concentration dependence had nearly diminished, and the Hopewell ash adsorbed approximately 70% of the applied C. The C sorption properties of High Carbon and Medium Carbon ashes were very variable. The Medium Carbon ash showed poor initial C retention with the 1st dosing, but improved considerably with the 2nd dosing, and retained 40% (Low-C input solution) and 75% (Medium-C input solution) at the 9th dosing. The High Carbon ash did not exhibit positive C retention (% sorption > 0) until the 6th dosing, and subsequently achieved only 20% retention with the 9th dosing for the Low-C concentration solution. The retention of C from the Medium-C concentration input solution varied from 5% of the first dose to 58% with the 9th dose. NH4-N: The High Carbon and Medium Carbon ashes were both very effective for ammonium (NH4) sorption (Figure 10, pg 21). Regardless of the input solution concentration, nearly 100% was retained. The Hopewell ash was at first a net contributor of NH4, but improved in sorption capacity over time. While only 10% of the first dosing (on average for the two input concentrations) was retained, the sorption of the Hopewell ash improved to >90% with the 9th dosing.
NO3-N: The data for nitrate-N sorption was variable, but overall NO3-N retention was low and decreased over time (Figure 11, pg 22). The Medium Carbon and High Carbon ashes sorbed >95% from the first dosing, but retention decreased to < 40% by the 7th dosing. Our results from Phase II on the determination of the adsorption maxima also indicated that all three ashes had low capacities to sorb NO3-N, and the column leaching further confirmed these results.
Ortho-P: Percent P sorption/retention was initially concentration-dependent (Figure 12, pg 23). However, by the 9th dosing event, net sorption varied between 75 and 85% for the three ashes, regardless of input concentration. The Hopewell ash appears to be the most suitable for use as a filtration/sorbent material. It has the lowest release of inherent organic material to water and has the highest net sorption of oxalate at the low as well as the high concentration of the urban waste solution. The High Carbon ash appears to be unsuitable as a sorbent for organics. Only at the high concentration of the urban waste solution did it retain some of the oxalate. This ash also has the highest net TOC release when washed with distilled water. The Medium Carbon ash did sorb considerable quantities of oxalate (64 µg cm-3) from the high TOC concentration urban waste solution. However, it did not perform well at the low concentration (only 11 µg cm-3) and did release considerable quantities when leached with distilled water. All three ashes performed well in retaining ammonium-N from the waste solutions. Similarly all three ashes performed well in sorbing phosphate and exhibited similar sorption capacities (Table 4). Because
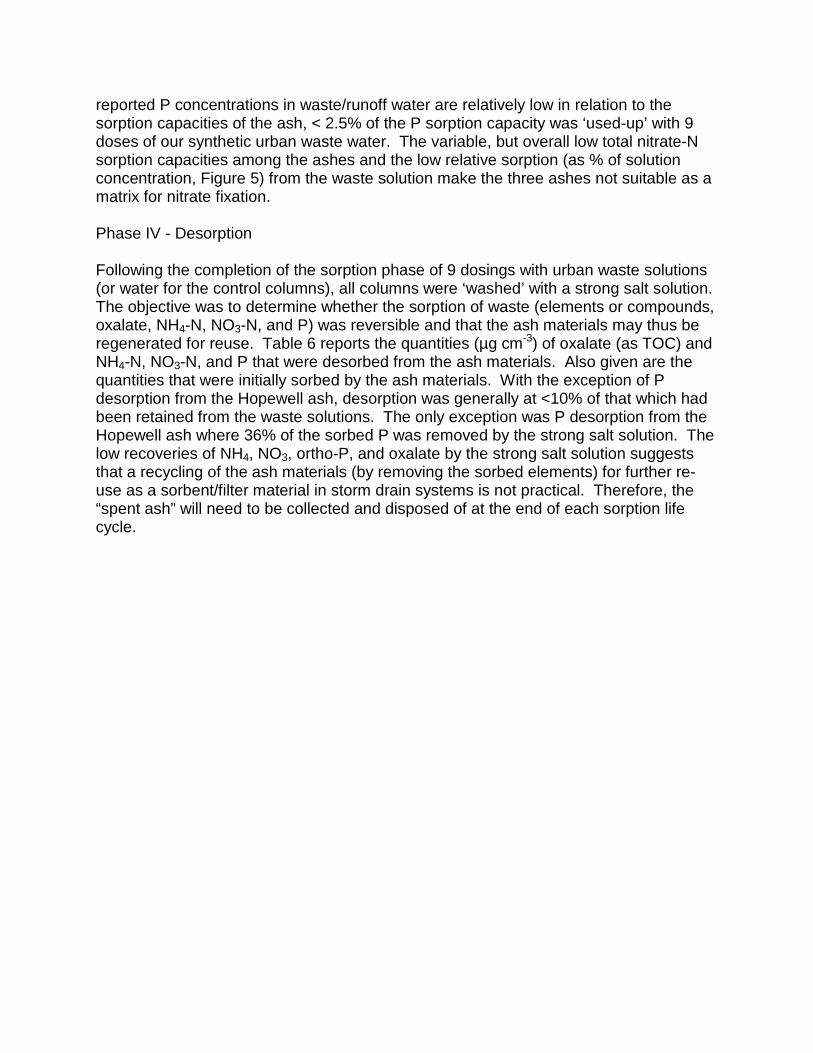
reported P concentrations in waste/runoff water are relatively low in relation to the sorption capacities of the ash, < 2.5% of the P sorption capacity was ‘used-up’ with 9 doses of our synthetic urban waste water. The variable, but overall low total nitrate-N sorption capacities among the ashes and the low relative sorption (as % of solution concentration, Figure 5) from the waste solution make the three ashes not suitable as a matrix for nitrate fixation.
Phase IV - Desorption
Following the completion of the sorption phase of 9 dosings with urban waste solutions (or water for the control columns), all columns were ‘washed’ with a strong salt solution. The objective was to determine whether the sorption of waste (elements or compounds, oxalate, NH4-N, NO3-N, and P) was reversible and that the ash materials may thus be regenerated for reuse. Table 6 reports the quantities (µg cm-3) of oxalate (as TOC) and NH4-N, NO3-N, and P that were desorbed from the ash materials. Also given are the quantities that were initially sorbed by the ash materials. With the exception of P desorption from the Hopewell ash, desorption was generally at <10% of that which had been retained from the waste solutions. The only exception was P desorption from the Hopewell ash where 36% of the sorbed P was removed by the strong salt solution. The low recoveries of NH4, NO3, ortho-P, and oxalate by the strong salt solution suggests that a recycling of the ash materials (by removing the sorbed elements) for further re-use as a sorbent/filter material in storm drain systems is not practical. Therefore, the “spent ash” will need to be collected and disposed of at the end of each sorption life cycle.

CONCLUSIONS
Baseline characterization of the chemical and physical properties of the three ash materials revealed no obvious limitations to their utilization in the proposed stormwater nutrient sorption application. The ash materials did not release any elements of concern to leaching waters that would pose an environmental release problem as long as bulk salts (primarily sulfate and borate) were flushed from the system before field placement.
The column sorption study results (Phase III) documented the capacity of all three ash materials to significantly retain nutrient elements and organics from simulated waste water. The ashes were effective in removing ammonium-N, ortho-P, and an organic C compound (oxalate) from simulated urban stormwater. The ash materials are a poor sorbent of nitrate-N, however, and would not be suitable for this purpose per se. While there is no one ash that exceeds the other two ashes in sorption capacity for all elements, the Hopewell product may provide the most balanced chemical and physical properties (e.g. coarser particle size) to make it most suitable for the intended purpose.
Our testing on the reversibility of the sorption of the various elements in order to “regenerate” used ash showed that very little of the sorbed elements are readily desorbed from their initial sorption sites. Consequently, the potential to readily (cost-effective and efficiently) “regenerate” the ash materials for re-use as a sorbent is unlikely. Thus, the used nutrient rich ash materials will need to be disposed of properly or possibly land-applied as a soil amendment.
Finally, while the saturated conductance/permeability of these ashes is somewhat limited, that parameter can be increased via bulk blending the ash with sand or some other coarser textured media or perhaps by pelletizing the ash with a permeable but stable polymer coating. Since our sorption data have been reported on both a mass and a volumetric basis, it should be relatively straightforward to design these filters. ADDITIONAL STUDY While initial lab results are promising, additional study is needed to verify the results in field application and determine design parameters. One design parameter of concern is the Ksat. With low flow rates, the constructed size of filtration structures may be larger than practical. CCPs mixed with glass beads, sand or other coarse materials should be studied both for flow rates and nutrient sorption capacity. When proper flow rates are achieved, the design structure will then be installed in both urban and rural runoff applications. Nutrient removal and flow rates will then be verified in actual field situations. REFERENCES Bingham, F.T. 1982. Boron. in Methods of soil analysis, Part 2. Chemical and Microbiological Properties. ASA-SSSA.

Brezonik, P.L., and T.H. Stadelmann. 2002. Analysis and predictive models of stormwater runoff volumes, loads, and pollutant concentrations from watersheds in the Twin Cities metropolitan area, Minnesota, USA. Water Research 36:1743-1757. Carleton, J.N., T.J. Grizzard, A.N. Godrej, H.E. Post, L. Lampe, and P.P. Kenel. 2000. Performance of a constructed wetland in treating urban stormwater runoff. Water Environment Research 72:295-304. Mehlich, A. 1953. Determination of P, Ca, Mg, K, Na, and NH4. North Carolina Soil Test Division (Mimeo 1953). Mensah-Biney, R K. and E H. Marten, An Integrated Approach to Processing of Coal Combustion Ash and Organic Bio-solids, World of Coal Ash, May 7-10 2007, paper No. 39. Rhoades, J.D. 1982. Soluble salts. in Methods of soil analysis, Part 2: Chemical and microbiological properties - Agronomy Mono. No. 9. ASA-SSSA, Madison, WI, USA.
Tessier, A., P.G.C. Campbell, and M. Bisson. 1979. Sequential extraction procedure for the speciation of particulate trace metals. Anal. Chem. 51:7, 844-851.
U.S. EPA. 1992a. Acid digestion of sediments, sludges, and soils. Section A. Part I. Chapter 3. Metallic analytes. 3.2, Sample preparation methods. Method 3050b, Test Methods for Evaluating Solid Waste: Physical/Chemical Methods (SW-846). U.S. EPA. 1992b. Toxicity characteristic leaching procedure. Method 1311, Test Methods for Evaluating Solid Waste: Physical/Chemical Methods (SW-846), 35pp.