remote sensing of lunar surface
TRANSCRIPT

Indian Journal of Radio & Space Physics Vol 49, September 2020, pp 59-78
Remote sensing of lunar surface
Om Prakash Narayan Calla*, Vishwa Sharma International Centre for Radio Science, Khokariya Bera, Nayapura, Mandore, Jodhpur, Rajasthan 342 304, India
Received: 4 September 2019; accepted: 7 September 2020
Remote Sensing of Lunar Surface has provided its Topographic, Geo-chemical composition, Radiation dose and Mineralogical information of Lunar Surface. The Indian Space Research Organisation's (ISRO) Chandrayaan-1 and National Aeronautical Space Administration's (NASA) Lunar Reconnaissance Orbiter (LRO) have different type of sensors for measuring and mapping of the entire Lunar Surface. For the Mapping of Topographical features Chandrayaan-1 has Terrain Mapping Camera (TMC), while Lunar Reconnaissance Orbiter (LRO) has Lunar Reconnaissance Orbiter Camera (LROC).
For determination of Chemical and Mineralogical features Chandrayaan-1 has Lunar Laser Ranging Instrument (LLRI) and Lunar Reconnaissance Orbiter (LRO) has Lunar Orbiter Laser Altimeter (LOLA) instrument. The mapping of Geo-chemicals has been done by Chandryaan-1 X-ray spectrometer (C1XS) and High Energy X-ray Spectrometer (HEX) onboard Chandrayaan-1 and Lunar Exploration Neutron Detector (LEND) onboard Lunar Reconnaissance Orbiter (LRO). The knowledge of mineral composition has been used for getting information about the evolution history of Moon. For this purpose the Chandrayaan-1 has Hyper Spectral Imager (HySI), near Infrared Spectrometer (SIR-2) and Moon Mineralogical Mapper (M3) and Lunar Reconnaissance Orbiter (LRO) has Lyman alpha Mapping Project (LAMP).
Radiation dose measurement is also important for designing the sensors and future manned missions. Therefore, Chandrayaan-1 has Radiation Dose Monitor (RADOM) and Lunar Reconnaissance Orbiter (LRO) has Cosmic Ray Telescope for determination of the Effect of Radiation (CRaTER). For the measurement of Backscattered or Energetic Neutral Atoms (ENAs) and predetermination of surface for future landing missions Chandrayaan-1 has Subatomic Reflection Analyser (SARA) and Moon Impactor Probe respectively along with the other payloads. The LRO has the Diviner Lunar Radiometer Experiment (DLRE) for measuring the temperature fluctuations, rough terrain and other landing hazards similar to Moon Impactor Probe (MIP) onboard Chandrayaan-1.
The active microwave sensors Miniature Synthetic Aperture Radar (Mini-SAR) onboard Chandrayaan-1 and Mini-RF onboard Lunar Reconnaissance Orbiter (LRO) have been used for identifying the traces of water in form of ice in the permanently shadowed regions at the poles of the Moon. The Mini-SAR instrument onboard Chandrayaan-1 has a primary antenna which transmits single right circularly polarized signal and receives the dual polarized (Left and Right) signal. While the antenna of Miniature Radio Frequency Radar (Mini-RF) onboard LRO transmits either left or right circularly polarized signal and then receives horizontal and vertical polarized signals.
The observations based on Circular Polarization Ratio (CPR>1) as well as m-chi (0 to 0.2) parameters and backscattering coefficient less than -15dB have helped in determining the presence of water-ice, differentiate the water-ice from rock abundances, surface and sub-surface characteristics for identifying the Possible landing sites for the future lunar missions. Quantification of water-ice in the Hermite-A crater gives the confirmation that only Circular Polarization Ratio (CPR) is not sufficient for identifying water-ice. The other parameters like m-chi and backscattering coefficient values must be taken into the consideration for distinguishing between water-ice and rocky terrains. The Dielectric properties of Terrestrial Analogue of Lunar Soil (TALS) have been studied and compared with the Apollo samples at different microwave frequencies. The study of variations in complex permittivity of TALS having different percentages of water has been done at different temperatures.
The variable Permittivity mapping of lunar surface has been done by using datasets of Microwave Radiometer (MRM) onboard Chang'e-1 and Diviner onboard LRO. The success of Chandrayaan-1 and Lunar Reconnaissance Orbiter (LRO) has greatly helped Scientist to go for further investigations in the areas of water-ice using microwave sensors for future missions for exploration the Moon.
Keywords: Lunar, Remote sensing, Chandrayaan-1, Lunar reconnaissance orbiter, Topographical features, Geo-chemical features, Mineralogical composition, Radiation dose, Energetic Neutral Atoms (ENAs), Water-ice, Apollo, Permanently Shadowed regions, Polarization, Circular Polarization Ratio (CPR), Dielectric properties, Quantification, Hermite-A crater, m-chi parameter, Backscattering coefficients, Pyroclastic deposits, Chang'e-1, Rocky terrain, Rock abundances
1 Introduction Remote sensing of planets can provide deep
understanding of their history of evolution, mineral
composition, surface and sub-surface properties, possibility of water and fossil etc. Remote sensing includes vast number of techniques1, i.e. Photo-geology, reflectance spectroscopy, gamma ray and X-ray spectroscopy, microwave remote sensing
—————— *Corresponding author (E-mail: [email protected])
INDIAN J RADIO SPACE PHYS, VOL 49, SEPTEMBER 2020
60
etc. The remote sensing of the Moon started from Luna 2, a Soviet Union spacecraft that reached at the surface of the Moon successfully followed by Luna 9 that was the first spacecraft to achieve controlled landing on the Moon. From 1968 to 1972, National Aeronautics and Space Administration (NASA) launched their manned lunar mission program Apollo. Apollo 8 was the first successful manned mission that entered into the orbit of the Moon in 1968, and was followed by Apollo 10, Apollo 11 (first successful crewed mission landed on the moon) to Apollo 13. After that European Space Agency’s SMART-1, Japan’s satellite Kaguya (SELENE), People’s Republic of China’s Chang’e-1, Republic of India’s
Chandrayaan-1, USA’s Lunar Reconnaissance Orbiter and many other missions have been sent to the Moon for the purpose of remote sensing of the lunar surface.
Indian Space research organization's first lunar mission Chandrayaan-1 has provided the data indicating the presence of water-Ice on the south polar region of the Moon. This paper provide the details about sensors onboard Chandrayaan-1 and Lunar Reconnaissance Orbiter (LRO). These sensors provide the information about topography, geo-chemical composition, mineralogy, radiation dose and existence of water-ice on the lunar surface. 2 Sensors complements onboard Chandrayaan-1 and lunar reconnaissance orbiter
2.1 Topographic mapping sensors
2.1.1 Terrain mapping camera onboard Chandrayaan-1 (TMC) Terrain mapping camera is a high resolution 3-D
stereoscopic camera which is developed and designed by the Space Application Centre, Ahmedabad of the ISRO, for providing 3-D topographic maps of lunar surface2.
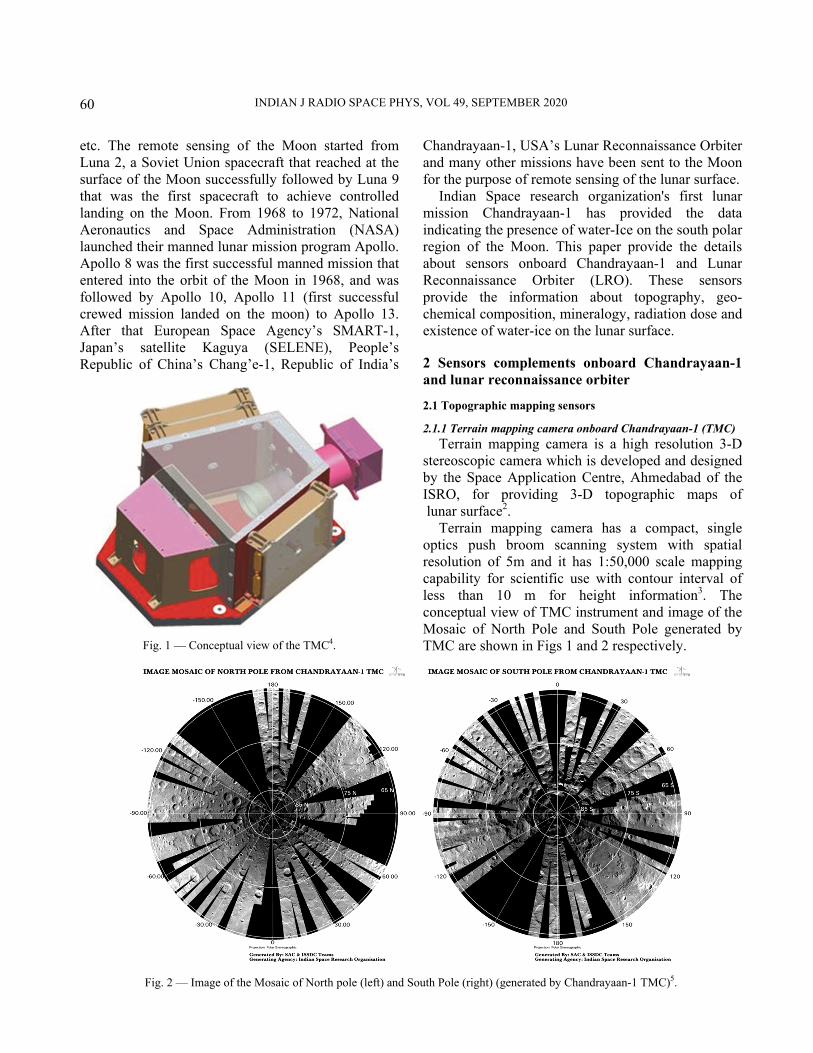
Terrain mapping camera has a compact, single optics push broom scanning system with spatial resolution of 5m and it has 1:50,000 scale mapping capability for scientific use with contour interval of less than 10 m for height information3. The conceptual view of TMC instrument and image of the Mosaic of North Pole and South Pole generated by TMC are shown in Figs 1 and 2 respectively.
Fig. 2 — Image of the Mosaic of North pole (left) and South Pole (right) (generated by Chandrayaan-1 TMC)5.
Fig. 1 — Conceptual view of the TMC4.

CALLA & SHARMA: REMOTE SENSING OF LUNAR SURFACE
61
2.1.2 Lunar Reconnaissance Orbiter Camera onboard Lunar Reconnaissance Orbiter
Lunar Reconnaissance Orbiter Camera (LROC), developed by the Arizona State University, Tempe has the combination of Two Narrow Angle Cameras (NACs) and one Wide Angle Camera (WAC)6. The two NACs (left and right) have the capability to provide 0.5m panchromatic images over a combined 5Km swath, while the WAC has the capability to provide global image at a scale of 100 m/pixel in seven color bands over a 105 Km swath in monochromatic mode and 57 Km swath in color mode6. The main objectives of LROC are finding of potential landing sites, mapping of permanently shadowed regions (PSRs), create high resolution maps of polar massifs (compact group of mountains), observe regions from multiple angles, improve mineralogical maps of lunar crust, create a global morphology base map, characterize the regolith and determining the Impact hazards sites for future Lunar Missions7. The photographs of LROC (WAC and NAC) and observations taken by LROC are shown in Figs 3, 4 and 5 respectively.
2.2 Laser Altimeters
2.2.1 Lunar Laser Ranging Instrument (LLRI) onboard Chandrayaan-1
The determination of chemical and mineralogical features of any surface depends on the knowledge of accurate height of the sensor from the surface. So that for mapping the chemical and mineralogical features of Moon LLRI was used, for which the electro-optics module was developed at ISRO's Laboratory for electro-optics System (LEOS), Bangalore, India. It has mainly two functions: (i) Determination of the
Fig. 3 — The Photographs of Lunar Reconnaissance OrbiterCamera [(a) Wide angle camera(WAC) and (b) Narrow Anglecamera (NAC)]8.
Fig. 4 — Wide Angle Camera (WAC) global Map, 16 January 2014 to 19 February 2014- 1km/pixel mosaic8.
Fig. 5 — Digital Terrain Models (DTMs) of Lunar Terraingenerated by Narrow Angle Camera (NAC)8.

INDIAN J RADIO SPACE PHYS, VOL 49, SEPTEMBER 2020
62
altitude of spacecraft from the lunar surface and (ii) Providing the data for improvement in gravity model of the Moon2. The Lunar Laser Ranging Instrument consists of three parts (i) An optical assembly (ii) An electronics package and (iii) a support structure. The optical part consists of two principal components: (i) The laser transmitter and (ii) receiver sub-system. The laser transmitter contains a diode pumped Nd:Yag laser source with transmission capability of 10 ns wide pulse rate. The receiver sub-system has a telescope with diameter of 200mm and overall field of view10 of 0.025°. The Illustration of LLRI, functional overview and observations taken by the LLRI are shown in Figs 6 and 7 respectively. 2.2.2 Lunar Orbiter Laser Altimeter (LOLA) onboard Lunar Reconnaissance Orbiter (LRO)
The Lunar Orbiter Laser Altimeter is a "Geodetic Tool" designed, integrated and tested at the the Goddard Space Flight center, in Greenbelt, Maryland. The objective of the LOLA is to provide topography of the Moon to an accuracy ±1m and 0.1 m precision, surface slopes in two directions and surface roughness to accuracy of 0.3 m, surface reflectance of the Moon at 1064 nm having accuracy within 5%, establish a global lunar "Geodetic" coordinate system and improve knowledge of the Lunar Gravity Field9.
LOLA has two primary components: (i) a transmitter and (ii) a receiver. The transmitter has the
two virtually identical, diode pumped, Q-switched Nd:YAG oscillators operating at 1064.4 nm with the repetition rate of 28 ± 0.1 Hz and the receiver sub-system consists of a refractive telescope of 14 cm clear aperture that focuses the received photons on to a fiber optic bundle with the effective focal length of 500 mm. The LOLA instrument can collect the maximum number of photons with minimum losses including background losses11. The illustration of LOLA and topographic map of the near side of the
Fig. 7 — 3-D profile of Lunar crater "CLAVIUS" as derived from LLRI data5.
Fig. 6 — Illustration and functional overview of LLRI4.

CALLA & SHARMA: REMOTE SENSING OF LUNAR SURFACE
63
Moon generated by LOLA are shown in Figs 8 and 9 respectively. 2.3 Geo-chemical mapping sensors 2.3.1 Chandrayaan-1 X-ray spectrometer (C1XS) and High Energy X-ray Spectrometer (HEX) onboard Chandrayaan-1
The richness of some major elements i.e. magnesium, aluminium, silicon, calcium, titanium and iron on the lunar surface can be determined by fluorescence X-rays. The C1XS instrument was designed and developed for this purpose by the Rutherford Appleton Laboratory, UK which was the modified version of SMART-1 X-ray spectrometer2,12. The C1XS instrument has 24 Nadir pointing swept charge device (SCD) detectors for providing high detection efficiency in the range of 0.8-7 Kev (kilo
electron volt) and a X-ray Solar Monitor (XSM) which provides wide field of view to enable Sun visibility during the significant fraction of time for the mission, which is requisite for obtaining calibration spectra within the energy range of 1-20Kev (kilo electron volt), spectral resolution of about 200ev (electron volt) and sensitivity about 7000 cps at a flux level of 10-4 W m-2 in the range 1–8 KeV (kilo electron volt). The schematic view of C1XS instrument and observation taken by C1XS instrument are shown in Fig. 10 and Fig. 11 respectively.
Besides, for the study of low energy 30-270 Kev (kilo electron volt) natural gamma rays emitted from the lunar surface due to the decay of Uranium (U), Potassium (K) Thorium (Th) and their daughter products, a high energy X-ray-gamma-ray spectrometer
Fig. 8 — Illustration of LOLA instrument9.
Fig. 9 — Lunar topographic map with the first 1 billion LOLA measurements8.

INDIAN J RADIO SPACE PHYS, VOL 49, SEPTEMBER 2020
64
(HEX) was placed on board Chandrayaan-1. This payload was jointly built by Physical Research Laboratory, Ahmedabad and ISRO Satellite Centre, Bangalore2,13. The HEX instrument consists of two units: (i) the detector system and (ii) the control unit. The detector system consists of a solid-state pixilated CZT arrays for the detection of low energy photons in the energy range 30–270 KeV (kilo electron volt) from the lunar surface and the function of Control (processing) electronics is to collect the pixel position, energy and Event Tagged Time (ETT), generated from within the HEX electronics, and formats the data into 2048 byte packets and stores in memory on command13. The schematic view of HEX instrument and observations taken by HEX instrument are shown in Fig. 12 and Fig. 13 respectively. 2.3.2 Lunar Exploration Neutron Detector (LEND) onboard Lunar Reconnaissance Orbiter (LRO)
The Lunar Exploration Neutron Detector (LEND) was developed at the Institute of Space Research in
Moscow, Russia has the objectives to generate high-resolution maps of hydrogen distribution with sensitivity of about 100 PPM of hydrogen weight and a spatial resolution of 5 km, collecting information about the neutron component of the Lunar radiation environment and characterization of surface distribution and column of possible near water-ice surface9,14. It has the combination of nine sensors (3He) which are used for detecting the thermal, epithermal and high energy neutrons. The schematic diagram and observations taken by Lunar Exploration Neutron Detector (LEND) are shown in Fig. 14 and Fig. 15 respectively.
Fig. 10 — The Schematic view of the CIXS instrument4.
Fig. 11— Simulated C1XS spectrum5.
Fig. 12 — Schematic view of the HEX instrument4.
Fig. 13 — Simulated lunar X-ray spectrum. Sreekumar13.

CALLA & SHARMA: REMOTE SENSING OF LUNAR SURFACE
65
2.4 Mineral mapping sensors 2.4.1 Hyper Spectral Imager (HySI), Near Infra-red Spectrometer (SIR-2) and Moon Mineralogy Mapper (M3) onboard Chandrayaan-1
The composition of various minerals on the surface of the Moon can tell about evolution (volcanic, melting, differentiation and crystallisation) history of the Moon2. For this purpose three sensors were placed onboard Chandrayaan-1. These are:
(i) Hyperspectral Imager (HySI):The HySI instrument was the first instrument onboard Chandrayaan-1 to map the Lunar surface with unique capability of resolving the spectral region, 0.4μm to 0.92μm, in 64 continuous bands with a resolution of better than 15 nm and a spatial resolution of 80m, built by Space Application Centre (SAC),
Ahmedabad15. This instrument had wedge filter operating in visible to near infrared region (400nm to 900 nm). This instrument operated in push broom mode in which it collects reflected light of the Sun from the lunar surface through a tele-centric refractive optics and focused onto detector. The conceptual view of HySI and observation taken by it are shown in Fig. 16 and Fig. 17 respectively.
(ii) Near Infrared Spectrometer (SIR-2): The near infrared spectrometer is another instrument onboard Chandrayaan-1 which is a grating spectrometer operating in the range of 930 to 2400 nm having an angular resolution of 1011 milliards and a spectral resolution of 6nm which was built at Max Planck Institute of Lindau, Germany2 for the determination of chemical composition of the crust and mantle of the Moon. This instrument has three parts (i) A telescope known as O-Box, (ii) the Sensor Head Radiator Unit (SHRU) and (iii) the Electronics box (E-Box). Like HySI Instrument this instrument also collects the Sunlight reflected from lunar surface. This collection of sunlight is done by the O-Box then the sunlight passes through the SHRU where it reaches at the grating and analysed by the photosensitive pixels. The E-Box provides the power supply and reduces the electronic noise16. The illustration of SIR-2 and the observation taken by SIR-2 instrument are shown in Fig. 18 and Fig.19 respectively.
(iii) Moon Mineralogy Mapper (M3): The Moon Mineralogy Mapper onboard Chandrayaan-1 was the state-of-the-art imaging spectrometer which provides
Fig. 14 — The schematic view of LEND instrument9.
Fig. 15 — Smoothed map 1° × 1° of exposure time (measured inseconds) of LEND lunar surface measurements during 1 yr ofmapping phase of LRO mission8.
Fig. 16 — Conceptual view of HySI EO module4.

INDIAN J RADIO SPACE PHYS, VOL 49, SEPTEMBER 2020
66
critical information beyond 2400 nm and identified the unidentified minerals or potential polar resources, such as water ice and other volatile compounds, built
by Brown University and Jet Propulsion Laboratory, USA2. The M3 instrument is a Push broom imaging spectrometer uses a compact system of optics. This
Fig. 17 — Image Mosaic of North pole (left) and South pole (right) From Chandrayaan-1 HySI5.
Fig. 18 — Illustration of the SIR-2 instrument units4.
Fig. 19 — The Left Plot is drawn between Pixel number and Wavelength and Right plot is drawn between Pixel number and Spectralresolution for the SIR-2 payload16.
CALLA & SHARMA: REMOTE SENSING OF LUNAR SURFACE
67
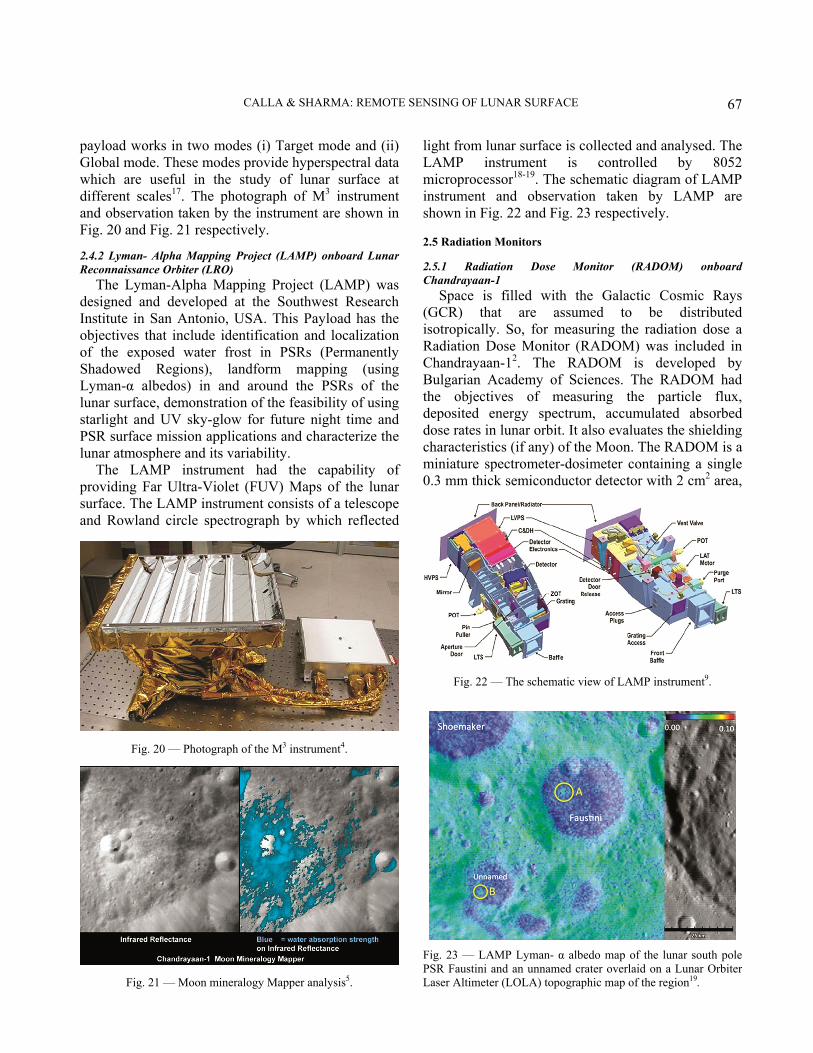
payload works in two modes (i) Target mode and (ii) Global mode. These modes provide hyperspectral data which are useful in the study of lunar surface at different scales17. The photograph of M3 instrument and observation taken by the instrument are shown in Fig. 20 and Fig. 21 respectively. 2.4.2 Lyman- Alpha Mapping Project (LAMP) onboard Lunar Reconnaissance Orbiter (LRO)
The Lyman-Alpha Mapping Project (LAMP) was designed and developed at the Southwest Research Institute in San Antonio, USA. This Payload has the objectives that include identification and localization of the exposed water frost in PSRs (Permanently Shadowed Regions), landform mapping (using Lyman-α albedos) in and around the PSRs of the lunar surface, demonstration of the feasibility of using starlight and UV sky-glow for future night time and PSR surface mission applications and characterize the lunar atmosphere and its variability.
The LAMP instrument had the capability of providing Far Ultra-Violet (FUV) Maps of the lunar surface. The LAMP instrument consists of a telescope and Rowland circle spectrograph by which reflected
light from lunar surface is collected and analysed. The LAMP instrument is controlled by 8052 microprocessor18-19. The schematic diagram of LAMP instrument and observation taken by LAMP are shown in Fig. 22 and Fig. 23 respectively. 2.5 Radiation Monitors
2.5.1 Radiation Dose Monitor (RADOM) onboard Chandrayaan-1
Space is filled with the Galactic Cosmic Rays (GCR) that are assumed to be distributed isotropically. So, for measuring the radiation dose a Radiation Dose Monitor (RADOM) was included in Chandrayaan-12. The RADOM is developed by Bulgarian Academy of Sciences. The RADOM had the objectives of measuring the particle flux, deposited energy spectrum, accumulated absorbed dose rates in lunar orbit. It also evaluates the shielding characteristics (if any) of the Moon. The RADOM is a miniature spectrometer-dosimeter containing a single 0.3 mm thick semiconductor detector with 2 cm2 area,
Fig. 20 — Photograph of the M3 instrument4.
Fig. 21 — Moon mineralogy Mapper analysis5.
Fig. 22 — The schematic view of LAMP instrument9.
Fig. 23 — LAMP Lyman- α albedo map of the lunar south polePSR Faustini and an unnamed crater overlaid on a Lunar OrbiterLaser Altimeter (LOLA) topographic map of the region19.
INDIAN J RADIO SPACE PHYS, VOL 49, SEPTEMBER 2020
68
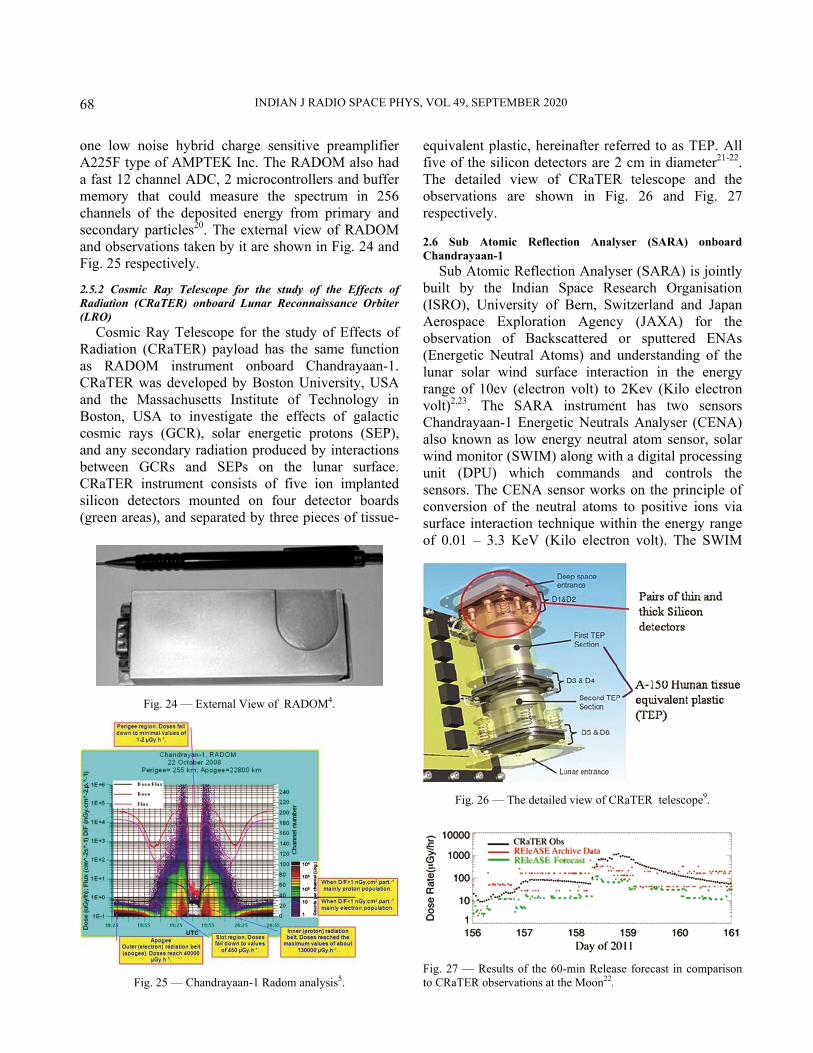
one low noise hybrid charge sensitive preamplifier A225F type of AMPTEK Inc. The RADOM also had a fast 12 channel ADC, 2 microcontrollers and buffer memory that could measure the spectrum in 256 channels of the deposited energy from primary and secondary particles20. The external view of RADOM and observations taken by it are shown in Fig. 24 and Fig. 25 respectively. 2.5.2 Cosmic Ray Telescope for the study of the Effects of Radiation (CRaTER) onboard Lunar Reconnaissance Orbiter (LRO)
Cosmic Ray Telescope for the study of Effects of Radiation (CRaTER) payload has the same function as RADOM instrument onboard Chandrayaan-1. CRaTER was developed by Boston University, USA and the Massachusetts Institute of Technology in Boston, USA to investigate the effects of galactic cosmic rays (GCR), solar energetic protons (SEP), and any secondary radiation produced by interactions between GCRs and SEPs on the lunar surface. CRaTER instrument consists of five ion implanted silicon detectors mounted on four detector boards (green areas), and separated by three pieces of tissue-
equivalent plastic, hereinafter referred to as TEP. All five of the silicon detectors are 2 cm in diameter21-22. The detailed view of CRaTER telescope and the observations are shown in Fig. 26 and Fig. 27 respectively. 2.6 Sub Atomic Reflection Analyser (SARA) onboard Chandrayaan-1
Sub Atomic Reflection Analyser (SARA) is jointly built by the Indian Space Research Organisation (ISRO), University of Bern, Switzerland and Japan Aerospace Exploration Agency (JAXA) for the observation of Backscattered or sputtered ENAs (Energetic Neutral Atoms) and understanding of the lunar solar wind surface interaction in the energy range of 10ev (electron volt) to 2Kev (Kilo electron volt)2,23. The SARA instrument has two sensors Chandrayaan-1 Energetic Neutrals Analyser (CENA) also known as low energy neutral atom sensor, solar wind monitor (SWIM) along with a digital processing unit (DPU) which commands and controls the sensors. The CENA sensor works on the principle of conversion of the neutral atoms to positive ions via surface interaction technique within the energy range of 0.01 – 3.3 KeV (Kilo electron volt). The SWIM
Fig. 24 — External View of RADOM4.
Fig. 25 — Chandrayaan-1 Radom analysis5.
Fig. 26 — The detailed view of CRaTER telescope9.
Fig. 27 — Results of the 60-min Release forecast in comparisonto CRaTER observations at the Moon22.

CALLA & SHARMA: REMOTE SENSING OF LUNAR SURFACE
69
sensor is an ion-mass analyser by which H, O, Na-Mg, K-Ca and Fe group elements can be distinguished in the energy range of 0.01 – 15 KeV/q (Kilo electron volt/charge). Along with giving command, the digital processing unit powers the sensors, sets the sensor modes and telemetry modes, acquires data from the sensors, does the time-integration and binning, formats the data, and transfers the data to telemetry23. The photograph of CENA with SWIM and observations taken by them are shown in Fig. 28 and Fig. 29 respectively. 2.7 Moon impactor probe onboard Chandrayaan-1
The Moon Impactor Probe (MIP) instrument was designed and developed by Vikram Sarabhai Space Centre (VSSC), Trivandrum. It was a micro satellite developed for impacting on the predetermined location at the south pole of the Moon and qualify some technologies for soft landing missions2,24. The Moon impactor probe had three sub system (i) Moon Imaging System (MIS) (ii) Radar Altimeter and (iii) Chandra's Altitudinal Compositional Explorer (CHACE). The Moon imaging system was took the images of lunar surface with the help of CCD camera
and compressed them and transmitted them using the processing electronics. The C-band radar Altimeter was included for measuring the altitude of probe till the last impact. The CHACE subsystem was a state of art quadruple subsystem which measures the lunar atmospheric constituents during lunar daytime24. The illustrated view of MIP instrument and observations taken by it are shown in Figs 30 and 31 respectively. 2.8 Diviner Lunar Radiometer Experiment (DLRE) onboard Lunar Reconnaissance Orbiter (LRO)
Diviner Lunar Radiometer Experiment (DLRE)was designed and developed by the University of California, Los Angeles, and NASA's Jet Propulsion Laboratory in Pasadena, Calif for measuring the extreme temperature fluctuations on the Moon, potential ice deposits, rough terrain, rock abundance and other landing hazards in the nine spectral channels within the range of 0.35μm to 400μm. The
Fig. 28 — Photograph of SARA with CENA (left) and SWIM(right)4.
Fig. 29 — The energy spectra of solar wind ions observed bySWIM on 25 January 2009. The solid line represents the spectraof the impacting solar wind ions and the dotted line representsthe spectra of the ions reflected from the lunar surface. Theplot shows integrated counts for 36 minutes centred at14:12UT23.
Fig. 30 — Illustration of the MIP structure with all subsystems4.
Fig. 31 — Chandrayaan-1's Moon Impact Probe captured thisimage as it descended to a hard impact on the lunar surface5 on November 14, 2008.
INDIAN J RADIO SPACE PHYS, VOL 49, SEPTEMBER 2020
70
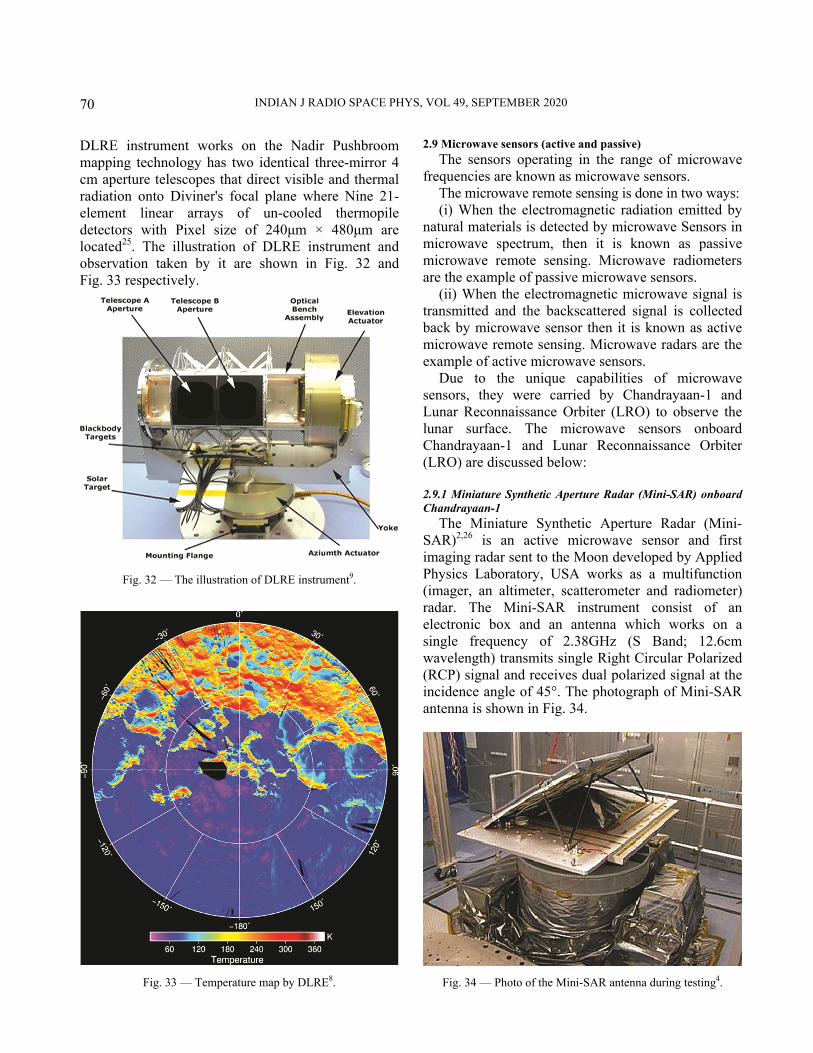
DLRE instrument works on the Nadir Pushbroom mapping technology has two identical three-mirror 4 cm aperture telescopes that direct visible and thermal radiation onto Diviner's focal plane where Nine 21-element linear arrays of un-cooled thermopile detectors with Pixel size of 240μm × 480μm are located25. The illustration of DLRE instrument and observation taken by it are shown in Fig. 32 and Fig. 33 respectively.
2.9 Microwave sensors (active and passive) The sensors operating in the range of microwave
frequencies are known as microwave sensors. The microwave remote sensing is done in two ways: (i) When the electromagnetic radiation emitted by
natural materials is detected by microwave Sensors in microwave spectrum, then it is known as passive microwave remote sensing. Microwave radiometers are the example of passive microwave sensors.
(ii) When the electromagnetic microwave signal is transmitted and the backscattered signal is collected back by microwave sensor then it is known as active microwave remote sensing. Microwave radars are the example of active microwave sensors.
Due to the unique capabilities of microwave sensors, they were carried by Chandrayaan-1 and Lunar Reconnaissance Orbiter (LRO) to observe the lunar surface. The microwave sensors onboard Chandrayaan-1 and Lunar Reconnaissance Orbiter (LRO) are discussed below: 2.9.1 Miniature Synthetic Aperture Radar (Mini-SAR) onboard Chandrayaan-1
The Miniature Synthetic Aperture Radar (Mini-SAR)2,26 is an active microwave sensor and first imaging radar sent to the Moon developed by Applied Physics Laboratory, USA works as a multifunction (imager, an altimeter, scatterometer and radiometer) radar. The Mini-SAR instrument consist of an electronic box and an antenna which works on a single frequency of 2.38GHz (S Band; 12.6cm wavelength) transmits single Right Circular Polarized (RCP) signal and receives dual polarized signal at the incidence angle of 45°. The photograph of Mini-SAR antenna is shown in Fig. 34.
Fig. 32 — The illustration of DLRE instrument9.
Fig. 33 — Temperature map by DLRE8.
Fig. 34 — Photo of the Mini-SAR antenna during testing4.

CALLA & SHARMA: REMOTE SENSING OF LUNAR SURFACE
71
2.9.2 Miniature Radio Frequency (Mini-RF) Radar onboard Lunar Reconnaissance Orbiter (LRO)
The Miniature Radio Frequency (Mini-RF) Radar onboard Lunar Reconnaissance Orbiter (LRO) is an advanced instrument which works on two bands (S-Band and X-Band) and two resolutions (150m and 30m) uses hybrid dual polarization technique in which, it transmits either left or right circularly polarized signal and receives horizontally and vertically polarized signal27-28. The photograph of Mini-RF instrument is shown in Fig. 35. 3 Microwave Remote Sensing of Lunar Surface through Mini-SAR onboard Chandrayaan-1 and Mini-RF onboard Lunar Reconnaissance Orbiter (LRO)
The objectives of Mini-SAR and Mini-RF are imaging of lunar poles and mapping the scattered energy from the lunar surface by which areas with presence of water-ice can be identified. 3.1 Observations of Mini-SAR and Mini-RF based on circular polarization ratio
3.1.1 Mini-RF observation for identifying the Lunar Polar Crater's surface characteristics (Rough, Smooth or Icy)
There are two types of analysis: (i) Polar Mosaic Analysis: In this analysis the
comparing of permanently and non- permanently shadowed regions for the floors of polar craters with the diameter greater than 15 km was done29. This analysis is shown in Fig. 36.
(ii) Bistatic observations: In this analysis the data of floors of Cabeus crater and Amundsen crater were compared as a function of bistatic angle and as a result, it was observed that the data were different for both craters at S-band frequency29. 3.1.2 Quantification of water-Ice:
In this analysis the Permanently Shadowed Regions (PSRs) of Hermite-A crater were selected and measured dielectric constant values of TALS for different percentage of water and values obtained using Campbell model30 were compared. As a result, it is obtained that 66.32% of the total PSR of Hermite-A crater is covered with the different percentages of Water-ice. Therefore, along with the circular polarization ratio values (greater than 1), m-chi31-32 (ranges from 0 to 0.2) parameters and low values of Backscattered coefficient (less than -15dB) are also taken into the consideration for identifying the presence of water ice33. This analysis is shown in the Figs 37, 38 and 39 respectively.
3.1.3 Circular polarization characteristics of South Polar lunar craters using Chandrayaan- 1 Mini-SAR and LRO Mini-RF:
In this area of study five craters located in South Pole region of lunar surface were selected for analysing the behaviour of both Mini-SAR and Mini-RF Radars. These five craters are Unnamed crater near Amundsen
Fig. 35 — Photograph of Mini-RF instrument8.
Fig. 36 — Mini-RF controlled polar mosaic of the north polar regions (80°N to 90°) overlain on WAC 100m base-map. Yellow colour indicates crater floor areas analysed in this study29.

INDIAN J RADIO SPACE PHYS, VOL 49, SEPTEMBER 2020
72
(86.20°S, 72.61°E), Cabeus B (82°18´S, 47°18´W), Ibn Bajja (86.3°S, 285.5°E), Faustini (87.3°S, 77.0°E) and Sverdrup crater (88.5°S, 152.0°W). From the analysis
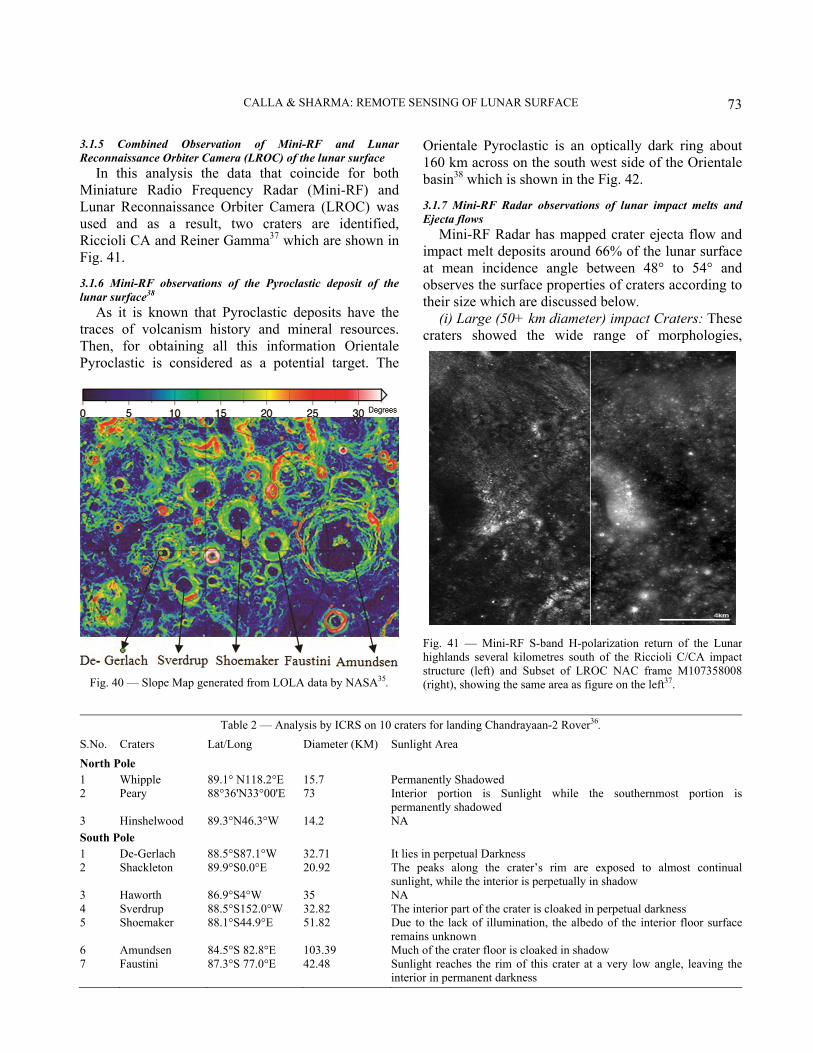
of data, it is observed that the received signal for both the SAR over common area is not same. The possible reason of the different results may be the different incidence angle of Radars34-35.The different polarization parameters are given in Table 1 and the Fig. 40 is showing the slope map generated for these five craters from the data of LOLA. 3.1.4 Possible landing sites for Chandrayaan-2 Rover
For the future lunar missions like Chandrayaan-2 the requirements for the Lander and Rover are better communication, landing area shape, topography and Sunlit area. For this analysis the experts of International Centre for Radio Science (ICRS) had used the data of Lunar Orbiter Laser Altimeter (LOLA) which is one of the payload onboard Lunar Reconnaissance Orbiter (LRO). Based upon the analysis of the data of LOLA, ICRS suggested the Amundsen Crater and Sverdrup crater could be the possible landing sites for Chandrayaan-2 Rover36. The Table 2 is showing the list of ten craters which are analysed by ICRS36 for this purpose.
Table 1 — The different polarization parameters over study area35. (Here, SC: Same Sense, OC: Opposite Sense, CPR: Circular Polarization Ratio, m: Degree of Polarization and χ: ellipticity angle)
Crater name LRO Mini- RF Chandrayaan- 1Mini-SAR
SC OC CPR m χ SC OC CPR m χ Unnamed crater near Amundsen 0.001 0.03 0.03 0.59 -7.75 0.02 0.03 0.67 0.45 14.49 Cabeus B 0.03 0.09 0.3 0.62 -8.28 0.02 0.04 0.5 0.61 23.06 IBN Bajja 0.01 0.03 0.3 0.53 -225 0.01 0.1 0.1 0.79 31.10 Faustini 0.02 0.08 0.25 0.49 0.99 0.02 0.05 0.4 0.65 23.26 Sverdrup 0.01 0.05 0.2 0.60 2.33 0.01 0.04 0.25 0.70 23.59
Fig. 39 — Hermite-A Crater PSR image obtained by overlaying the PSR over LRO WAC data using QGIS software33.
Fig. 37 — Diviner nighttime temperature map of the lunar northpole. Note that the crater floor temperatures are around 35K33.
Fig. 38 — Estimated dielectric constant values over Hermite-ACrater are obtained using the Campbell model33.
CALLA & SHARMA: REMOTE SENSING OF LUNAR SURFACE
73
3.1.5 Combined Observation of Mini-RF and Lunar Reconnaissance Orbiter Camera (LROC) of the lunar surface
In this analysis the data that coincide for both Miniature Radio Frequency Radar (Mini-RF) and Lunar Reconnaissance Orbiter Camera (LROC) was used and as a result, two craters are identified, Riccioli CA and Reiner Gamma37 which are shown in Fig. 41. 3.1.6 Mini-RF observations of the Pyroclastic deposit of the lunar surface38
As it is known that Pyroclastic deposits have the traces of volcanism history and mineral resources. Then, for obtaining all this information Orientale Pyroclastic is considered as a potential target. The
Orientale Pyroclastic is an optically dark ring about 160 km across on the south west side of the Orientale basin38 which is shown in the Fig. 42. 3.1.7 Mini-RF Radar observations of lunar impact melts and Ejecta flows
Mini-RF Radar has mapped crater ejecta flow and impact melt deposits around 66% of the lunar surface at mean incidence angle between 48° to 54° and observes the surface properties of craters according to their size which are discussed below.
(i) Large (50+ km diameter) impact Craters: These craters showed the wide range of morphologies,
Table 2 — Analysis by ICRS on 10 craters for landing Chandrayaan-2 Rover36.
S.No. Craters Lat/Long Diameter (KM) Sunlight Area
North Pole 1 Whipple 89.1° N118.2°E 15.7 Permanently Shadowed 2 Peary 88°36'N33°00'E 73 Interior portion is Sunlight while the southernmost portion is
permanently shadowed 3 Hinshelwood 89.3°N46.3°W 14.2 NA
South Pole 1 De-Gerlach 88.5°S87.1°W 32.71 It lies in perpetual Darkness 2 Shackleton 89.9°S0.0°E 20.92 The peaks along the crater’s rim are exposed to almost continual
sunlight, while the interior is perpetually in shadow 3 Haworth 86.9°S4°W 35 NA 4 Sverdrup 88.5°S152.0°W 32.82 The interior part of the crater is cloaked in perpetual darkness 5 Shoemaker 88.1°S44.9°E 51.82 Due to the lack of illumination, the albedo of the interior floor surface
remains unknown 6 Amundsen 84.5°S 82.8°E 103.39 Much of the crater floor is cloaked in shadow 7 Faustini 87.3°S 77.0°E 42.48 Sunlight reaches the rim of this crater at a very low angle, leaving the
interior in permanent darkness
Fig. 40 — Slope Map generated from LOLA data by NASA35.
Fig. 41 — Mini-RF S-band H-polarization return of the Lunar highlands several kilometres south of the Riccioli C/CA impactstructure (left) and Subset of LROC NAC frame M107358008(right), showing the same area as figure on the left37.

INDIAN J RADIO SPACE PHYS, VOL 49, SEPTEMBER 2020
74
including ponds and large flows. For Example, the Tycho crater39 (43.3 ˚S, 248.8 ˚E, 85 km dia.) which is shown in Fig. 43.
(ii) Medium size craters (20-50km diameter): These craters have significant amount of melt material that can flow to the large distances from the source crater. For Example, Glushko crater39 (8 ˚N, 282.4 ˚E) which is shown in Fig. 44.
(iii) Small size craters (diameter less than 20 km): Mini-RF images of craters within this size range revealed that these craters have large amount of impact melts mostly radar bright ponds, veneers and small flows39. The Fig. 45 shows the flow features associated with the small crater in the orientale basin.
3.2 Observations of Electrical properties of Lunar Simulants at Microwave Frequencies
In this entire study three different analysis were done:
(i) In the first analysis the Dielectric Properties of lunar Simulants were studied using Waveguide Cell method40 and compared these values with the Apollo
Table 3 — Percentage variation of ε´ and ε˝ with temperature -190˚C to +200˚C using Wave-Guide cell method41.
Frequency (GHz) ε´ ε˝
Temperature Difference Percentage variation (%)
Temperature Difference Percentage variation (%)
-190˚C +200˚C -190˚C +200˚C At 1.7 GHz 3.66 4.59 .93 20.26 0.15 0.43 .28 65.11 At 2.5 GHz 3.75 4.52 .77 17.04 0.12 0.39 .27 69.23 At 6.6 GHz 3.35 4.14 .79 19.08 0.18 0.26 .08 30.77 At 31.6 GHz 3.50 4 .5 12.5 0.09 0.15 .06 40
Fig. 43 — Mini-RF images of impact melt deposits to the east ofTycho39.
Fig. 42 — Forerunner radar SAR strip of the Orientale pyroclasticdeposit [Same Sense (SC) polarization] overlaid on aClemetine750nm image. The Pyroclastic deposit38 is centered at30.3° S, 97.5°W.

CALLA & SHARMA: REMOTE SENSING OF LUNAR SURFACE
75
samples at different microwave frequencies (1.7GHz, 2.56GHz, 6.6GHz and 31.6GHz). The measurements were made at temperatures ranging from -190°C to +200°C. As a result, it is seen that values of Complex Dielectric constant vary for different Microwave Frequencies. The Real (ε´) and Imaginary (ε˝) Part also increased with increase in temperature41. Table 3 and 4 shows the percentage variations of dielectric constant values and comparison with Apollo samples respectively.
(ii) In the second analysis the complex dielectric constant of terrestrial analogues of lunar soil (TALS) having different percentages of water is measured at
Room Temperature (+30°C). The complex dielectric constant with different percentage of water43 is shown in Fig. 46. The variation of complex dielectric constant with different percentages of water in TALS is shown in Fig. 47.
The variation of complex dielectric constant at -196°C for different percentage of water is used for
Fig. 46 — Complex permittivity of TALS for different percentages of water content at room temperature (+30°C) for the S-band (2.38 GHz, 12.6 cm wave- length) and the X-band (7.2 GHz, 4.2 cm wavelength)43
Table 4 — Comparison table for standard value of JSC-1A or terrestrial analogues of lunar soil & measured data at room
temperature41.
Temp (°C) Standard Value for JSC-1A or terrestrial
analogues of Lunar Soil42.
Data Comes from our measurements
23°C 4 (ε´) .1 (ε˝) 3.61-4.22 (ε´) .11-.29 (ε˝)
Fig. 45 — Images of flow features associated with a small (5km dia.) crater northeast of Maunder crater in the Orientale basin39.
Fig. 44 — Flows north of the crater Glushko. (a) Mini-RF totalpower image. Radar illumination is from the right. The location ofthe image in part C is shown with a box. (b) CPR image stretchedto a color scale and overlaid on the total power image. (c) AnLROC NAC image of part of the Gluskho flows39.

INDIAN J RADIO SPACE PHYS, VOL 49, SEPTEMBER 2020
76
determination of frozen water-ice present in the craters in permanently Shadowed Regions (PSR). One example is the determination of water-ice in the 'Hermite-A' crater.
(iii) The study and mapping of variable permittivity was done using the datasets like Brightness Temperature (TB) and Physical Temperature (TP) of
the Microwave Radiometer (MRM) onboard Chang'e-1 and Diviner onboard Lunar Reconnaissance Orbiter (LRO) respectively. As a result, it is obtained that values of permittivity are low (Up to 3) for equatorial and near - equatorial region and increasing away from the Equatorial regions. Figures 48 and 49 show the variation in permittivity values and scatter plots obtained from the datasets of microwave radiometer onboard Chang'e-1 and Diviner onboard LRO44. 4 Conclusion
The microwave remote sensing has unique capabilities45 as compared to other methods of remote sensing. That has helped in extraction of the information from lunar surface for the first time in the history of lunar exploration. The remote sensing of Moon was started in 1959 by Luna 2, a Soviet Spacecraft. In 1969 Apollo 11 was the first manned mission successfully landed on the Lunar surface. In 2008 Indian Space Research Organisation launched its first Lunar mission Chandrayaan-1 which had the eleven payloads along with an Impactor probe. In
Fig. 47 — Complex permittivity of TALS for different percentages of water content at Lunar Pole temperature (-196°C) for the S-band (2.38 GHz, 12.6 cm wave- length) and the X-band (7.2 GHz, 4.2 cm wavelength)43.
Fig. 48 —The variation in permittivity ε´ at different frequencies(a) 37.0 GHz(b) 19.35 GHz (c) 7.8 GHz; (d) 3 GHz obtained usingbrightness temperature (TB) from MRM and physical temperature(TP) from Diviner. Note that real permittivity at all frequencies isincreasing towards polar regions44.
Fig. 49 — Scatter plot between normalized laboratory measuredpermittivities versus normalized simulated permittivities from Chang’e-1 and Diviner Datasets over Apollo-14 and 17 locations44.

CALLA & SHARMA: REMOTE SENSING OF LUNAR SURFACE
77
2009, National Aeronautical Space Administration (NASA) launched their Lunar mission Lunar Reconnaissance Orbiter which carried Seven payloads.
For achieving the different objectives like topographic mapping, Chandrayaan-1 carried Terrain Mapping Camera (TMC) and LRO had Lunar Reconnaissance Orbiter Camera (LROC). For mapping of chemical and mineralogical features Chandrayaan-1 and LRO had Lunar Laser Ranging Instrument and Lunar Orbiter Laser Altimeter respectively. The geo-chemical mapping sensors onboard Chandryaan-1 were Chandrayaan-1 X-ray spectrometer and high energy spectrometer. The LRO had lunar exploration neutron detector instrument for the geochemical mapping. For the mapping of mineral composition Chandrayaan-1 had three sensors i.e. hyper spectral imager, near infrared spectrometer and Moon mineralogical mapping mapper instrument. Similarly, LRO had the Lyman Alpha Mapping Project instrument.
For the radiation dose measurement Chandrayaan-1 had radiation dose monitor instrument and LRO had cosmic ray telescope for the effect of radiation instrument. For measuring the Backscattered or energetic neutral atoms and landing site identification Chandrayaan-1 carried subatomic reflection analyser and Moon impactor probe respectively.
The diviner lunar radiometer experiment was carried by the LRO for measuring the temperature fluctuations, rough terrain and other landing hazards for the futuristic lunar missions.
Chandrayaan-1 had the first imaging radar system Mini-SAR for the exploration of water-ice which successfully detected the presence of water-ice at the lunar surface. The Mini-RF radar onboard LRO confirmed the presence of water-ice in the far regions of lunar surface. In this paper the comparative analysis of the different sensors onboard Chandrayaan-1 and LRO is done. In this paper, the observations and measurements taken by Mini-SAR onboard Chandrayaan-1, Diviner and Mini-RF onboard lunar reconnaissance orbiter with microwave radiometer onboard Chang'e-1 are also summarized.
On the basis of these observations presence of water-ice in the permanently shadowed regions was confirmed. This research will play an important role for further detailed analysis for presence of water-ice in the permanently shadowed regions of lunar poles.
Acknowledgements Authors would like to thank to all those who have
provided the research inputs for this paper. References 1 Dunkin S K & Heather D J, Fourth Int. Conf. on the
Exploration and Utilisation of the Moon, 10-14 July 2000 (ESA SP-462, Sept. 2000).
2 Bhandari Narendra, The Mysterious Moon and India's Chandrayaan Mission, (2008) 61.
3 Kumar Kiran A S & Chowdhury A Roy, J. Earth Syst. Sci. 114(6) (2005) 717.
4 https://directory.eoportal.org/web/eoportal/satellite-missions/c-missions/chandrayaan-1#sensors
5 https://www.isro.gov.in/Spacecraft/chandrayaan-1 6 http://lroc.sese.asu.edu/ 7 Robinson M S, Brylow S M & Tschimmel M, Lunar
Reconnaissance Orbiter Camera (LROC) Instrument Overview, Springer Science+Business Media B.V., (2010).
8 https://lunar.gsfc.nasa.gov/. 9 https://directory.eoportal.org/web/eoportal/satellite-
missions/l/lro. 10 Selvaraj P, Kutagulla Kalyani, Goswami Adwaita & Raja V
L N. Sridhar, Current Science, (2009) 512. 11 Haris Riris, Xiaoli Sun, Cavanaugh John F, Luis A &
Ramos-Izquierdo, The Lunar Orbiter Laser Altimeter (LOLA) on NASA’s Lunar Reconnaissance Orbiter (LRO) mission, Current Science, 150 (1) (2010) 209.
12 Grande M, Maddison B J, Howe C J, Kellett B J, Sreekumar P & Huovelin J, Planetary and Space Science, 57 (2009) 717.
13 Sreekumar P, Acharya Y B, Umapathy C N & Sharma M Ramakrishna, High Energy X-ray Spectrometer on Chandrayaan-1, Current Science, 96 (04) (2009).
14 Boynton William V, Chin Gordon, Evans Larry G & Garvin James, Space Science Reviews, 150 (1- 4) (2010) 183.
15 Kumar A S Kiran & Chowdhury A Roy, J. Earth Syst. Sci., 114 (6) (2005) 721.
16 Mall Urs, Banaszkiewicz Marek, BrØnstad Kjell, McKenna-Lawlor Susan, Nathues Andreas, SØrass Finn, Vilenius Esa & Ullaland Kjetil, Near Infrared Spectrometer SIR-2 on Chandrayaan-1, Current Science, 96 (04) (2009).
17 Petro N, Pieters C, Boardman J, Green R, Head J, Isaacson P & Nettles J, Targeting for the Moon Mineralogy Mapper (M3) Instrument on the Chandrayaan-1 Mission, Lunar and Planetary Science XXXIX (2008).
18 Gladstone Randall G, Stern S Alan, Retherford Kurt D & Black Ronald K, Space Science Rev, 150 (2010) 161.
19 Mandt Kathleen E, Greathouse Thomas K, Retherford Kurt D, Gladstone G. Randy, Hendrix Amanda R, Hurley Dana, Pryor Wayne, Koeber Steven D & Robinson Mark, Workshop on Issues in Crater Studies and the Dating of Planetary Surfaces (2015).
20 Dachev T, Tomov B, Dimitrov P & Matviichuk Y, Monitoring lunar radiation environment: RADOM instrument on Chandrayaan-1, Current science, 96 (04) (2009).
21 Spence H E, Case A W, GolightlyM J, Heine T, Larsen B A, Blake J B, Space Science Rev,150 (1-4) (2010) 243.
22 Schwadron N A, Baker T, Blake B, Case A W, Cooper J F, Golightly M, Jordan A, Joyce C, Kasper J, Kozarev K,

INDIAN J RADIO SPACE PHYS, VOL 49, SEPTEMBER 2020
78
Mislinski J, Mazur J, Posner A, Rother O, Smith S, Spence H E, Townsend L W, Wilson J & Zeitlin C, Journal of Geophysical Research, 117 (2012) E00H13.
23 Bhardwaj Anil, Wieser Martin, Dhanya M B, Barabashst As, The Sub-keV, Atom Reflecting Analyzer (SARA) Experiment Aboard Chandrayaan-1 Mission: Instrument and Observations, Current Science, (2010) 151.
24 Kumar Ashok Y & MIP team, The Moon Impactor Probe on Chandrayaan-1, Current Science, 96 (4) (2009) 540.
25 Paige D A, Foote M C, Greenhagen B T, Schofield J T & Calcutt S, Space Science Rev, 150 (2009) 125.
26 Spudis Paul, Nozette Stewart, Bussey Ben, Raney Keith & Winters Helene, Mini-SAR: an imaging radar experiment for the Chandrayaan-1 mission to the Moon, Current Science, 96 (2009).
27 Nozette Stewart, Spudis Paul, Bussey Ben, Jensen Robert, Raney Keith, Winters Helene, Lichtenberg Christopher L, Marinelli William, Crusan Jason, Gates Michele & Robinson Mark, Space Science Rev, 150 (2010) 285.
28 Bussey D B J, Carter L M, Spudis P D, Nozette S, Lichtenberg C L, Raney R K, Marinelli Wand Winters H L & the Mini-RF Science team, NLSI Lunar Science Conference, (2008) 2389.
29 Patterson G W, Jozwiak L M, Kirk R, Becker T L, Perkins R, Carter L M, Stickle A M, Cahill J T S, Thomson B J, Neish C D & the Mini-RF team Planetary Exploration Group, 50th Lunar and planetary science conference (LPI Contribution no. 2132), (2019).
30 Campbell B A, Grant J A & Maxwell T, Radar Penetration In Mars Analog Environments, Lunar and Planetary Science XXXIII (2002).
31 Mohan S, Saran S & Das A, Current Science, 105 (2013) 1579.
32 Raney R K, Cahill J T S, Patterson G W & Bussey D B J, J. Geophys. Res, 117 (E12) (2012).
33 Calla O P N, Mathur Shubhra & Gadri Kishan Lal, IEEE International Conference on Recent Advances and Innovations in Engineering (ICRAIE-2016), 13(7) (2016) 926.
34 Saran S, Das A, Mohan S, Chakraborty M, Space Sci. Planet. Space Sci., 71(1) (2012) 18.
35 Calla Om Prakash Narayan, Mathur Shubhra, Jangid Monika & Gadri Kishan Lal, Earth Moon Planets, 115 (2015) 83.
36 Calla O P N, Mathur Shubhra & Gadri Kishan Lal, IEEE International Conference on Recent Advances and Innovations in Engineering (ICRAIE-2016), (2016) 1.
37 Mechtley M, Spudis P, Bussey B, Robinson M S, 41st Lunar and planetary science conference, (2010) 2689.
38 Carter L M, Gillis-Davis J J, Bussey D B J, Spudis P D, Neish C D, Thompson B J, Patterson G W, Raney R K & the Mini-RF Science Team, 41st Lunar and planetary science conference, (2010).
39 Carter Lynn M, Neish Catherine D, Bussey D B J, Spudis, Paul D, Wesley Patterson G, Cahill and Joshua T & Raney R keith, Journal of Geophysical Research, 117 (2012).
40 Roberts S & Hippel Von A, J. Appl. Phys. 17 (1946) 610. 41 Calla Om Prakash Narayan, Rathore Inder Singh, Advances
in Space Research, 50 (12) (2012) 1607. 42 Ethridge Edwin C & Kaukler William, Moon COSMOL
Conference Boston, MA, Paper AIAA-2009-1342, (2009). 43 Calla O P N, Mathur Shubhra & Gadri Kishan Lal, IEEE
Geoscience and Remote Sensing Letters, 13 (2) (2016) 123. 44 Calla O P N, Mathur Shubhra & Jangid Monika, Advances in
Space Research, 58 (2016) 2393. 45 Calla OPN, Microwave Remote Sensing (DRDO
Monographs/Special publication series), (2009) 1.