lunar remote sensing and measurements
TRANSCRIPT
Lunar Remote Sensing and Measurements

UNITED STATES DEPARTMENT OF THE INTERIOR
CECIL D. ANDRUS, Secretary
GEOLOGICAL SURVEY
H. William Menard, Din'( t o 7
I ibrary of Congress C'alalo~ing in Publication Data
United States. Geological Survey. Lunar remote sensing and measii~erncnts
(Apollo 15-1 7 orbital investigalions) (Geological Survey protessional paper ; 1046-13) Bibliogrrapliy: p. B70-B78, Supt. ot Docs. no.: I 19.16: 1046-13 I . Moon -Rcmotc serisin~. 2. Project Apollo. 1. Moore, Henry I.
I . Title. Ill Series. IV. Series: United States. C;eological Survey. 1'rofession;il paper ; 1046-B.
QB591.U54 1979 559.9'1 79-607805
Foi sale by the Superintendent of Documents, U.S. Gmernment Printing Office
Washington, D.L 20402
I'age
Abstract - - - - - - ------------ - - - - - - - - - - - - B 1 Introduction ----- - - _ _ _ _ _ _ _ _ _ _ _ _ _ _ - - _ _ _ _ _ ------- 2
Acknowledgments - - 2 Apollo orbital results - - - . _ _ _ _ _ _ _ _ _ _ _ _ _ _ _ . _ _ _ 3
Ages of lunar plains, by J M Boyce and H J Moore _ _ _ _ _ 3 Review of methods of' estimating relative ages . 3
Fundamental concepts ~ -------- -------- --- 3 Rapid method for determining relative ages _ _ _ _ _ _ 5 Pitfi~lls i n determining relative ages 6
Relative ages of lunar plains - _ _ _ _ _ _ _ _ _ _ _ _ _ 8 Correlation of relative ages with radiometric ages - 9
Time-scale - - --- -- ---- - - 9 Cratering ra te with time - - - - - - - - - - - - - ~ 1 1
Comparison of relative ages with other remotely sensed data - _ _ _ _ _ - - _ _ _ 12
Geologic map units _ _ _ _ _ _ _ _ _ _ _ _ _ _ _ _ _ _ _ _ 12 Regolith thickness ------ _ _ _ _ - - _ _ _ _ _ _ 13 Bistatic-mdar results - ------ - - - ---- 14
Discussion ------------ ----- 14 Early major events _ _ _ _ _ _ _ _ _ _ _ _ _ _ _ _ _ _ _ 15 Ci uterine ra te ----- - - - - - - - - - - - - - - 17 Maria ,,,,,,,,,,Ñ- .______. . . - - 18 western maria - - - - - 18
Lunar gravity and tectonics, by D H Scoti ------ 18 Methods of analysis and application--- - - _ _ _ _ _ - _ 19 Gravity and geologic structure _ _ _ _ _ _ _ _ _ _ _ _ _ _ 2 l Summary and conclusion ----- 22
Lunar magnetism, by G G. Schaber _ _ _ _ _ _ _ _ _ _ _ _ 22 Orbital magnetic data 23 Lunar surface and sample magnetic data _ _ _ _ _ _ _ _ 23 Origin of lunar magnetism - - - - - - - - - - ----- 23 Geologic analysis and significance of lunar NKM- 27
Orbital geochemistry, by H. J Moore - _ _ - _ _ - _ 29 X-ray fluorescence spectrometry _ _ _ _ _ _ _ _ _ _ _ _ 29
Itescript ion ~ _ _ _ _ _ _ _ 29 Results ----------- _ _ _ _ _ _ _ -29
(hinrna-ray spectrometry ___. 31 Description 31
Apollo orbital results-Continued Orbital geochemistry, by 11 J Moore-Continued
Gamma-ray spectrometry-Continued Results ~ - - - - - - - - - - - - - - - - - - , 1 3 3 1 Discussion _ _ _ _ _ _ _ _ _ _ _ _ _ _ _ _ _ - _ 33
Bistatic radar, by H J Moore _ _ _ _ _ _ _ _ _ _ _ _ _ _ _ _ _ _ _ 34 Comparison of radar roughness with lunar terrain _ _ _ 34 Correlation with geologic map units- . ---------- 37 Correlation with infrared eclipse temperatures 37 Slope-probability distribution _ _ _ _ _ _ _ _ _ _ _ _ _ _ _ _ _ _ _ 38 Discussion --------- - - - - - - - - - ~ -------- 40
Ear th- based results - - - 41 Reflection of solar radiation with wavelengths from
0 3 ,urn to 2.2 urn, by G G , Schaber ------- 41 Photometry and polarimtion of sunlight - _ _ _ _ _ _ _ - - 41 Color - _ _ _ _ _ _ _ _ _ _ _ _ _ _ _ _ _ _ _ 43 Spectral reflectivity ----- - - - - - - - _ _ _ _ _ _ _ _ _ _ _ 43 Spectral response and chemical composition _ _ _ _ _ _ _ 47
Laboratory studies -------- - ~ ~ ------- 58 Discussion - - - - - - - 58
Infrared eclipse temperatures, by H J Moore _ _ _ _ _ _ _ _ _ 61 Eclipse temperatures and lunar features 6 1 Causes of high infrared eclipse temperatures _ _ _ _ _ _ _ _ 64
Lunar multiringed basins and the provenance of lunar highland samples -------- -------- 67
Regional and local chemical variations -------- - 68 Variation of physical propertips and roughness of'
ILLCS 1 RAT I O N S
Page
FIGURES 1-7 Graphs showing: 1 Cumulative frequency distributions of craters for three ages of surfaces ------ - - - - - - - - R4 2 Relationships between D,,, K , and 0; ------ - - - -------- - - - - - - - - - - - - - ~ - - - - - - - 5 3. Comparison of the observed and predicted ratio of" unshadowed t<) shadowed craters a s a function of crater
diameter _ -- - - -- ------------- - - - - - - - - - - - - - - ~ - - - - - - - 6 4 Ratio of unshadowed to shadowed craters a s a function of diameter for floors of Albategnius and Melon 7 5 Effects of photog:~ph resolution on the determination of relative ages _ - - ------ -------- - - 7 6 Errors in measurement of c ~ a t e r diameter a s a Function of sun elevation angle ------ - - - - - - - - S 7 Sample area necessary to establish Q, ------ - - - - - - - - - - - - - - - - - - - - - - _ _ _ _ _ 8
8 Histograms of relative ages of lunar plains ------ . - - - - - - - - ~ - ---- - - - - - - - _ 9
IV CONTENTS
Map showing distribution of relative ages of lunar plains in the "Apollo zone" ------- - - - - - - - - - B 1 0 Graphs showing:
10 Comparison of relative ages and radiometric ages and incremental flux of objects producing small craters 1 1 11 Size frequency distribution of craters on flanks of North Ray crater (Apollo 16) - 12 12 Correlation between incdian regolith thickness and relative age of surface - - - - - ------ -------- 13 13 Bistatic-radar roughness and relative ages --- - ----- ------ -------- - 15 14 Size frequency distributions of craters for selected lunar areas - - ------ - ------- - - 16
Topographic profile of Theophilus 20 Topographic and gravity profiles through Montes Secchi _ _ _ _ _ _ - - - - - - ------ - -------- ------ 21 Maps showing magnetic anomalies - - - ------ ~ - - -- 24 Diagram showing Apollo 15 laser altimeter da ta . - - - - - - - - - - - ------ - - - - - - - 25 Map showing Apollo 15 and 16 gamma-ray results - - - - - - - ----- ------ - - - - - - - - ---------- -- 25 Graph showing reflection coefficient for single orbit of 0 5-keV electron data obtained at high ra te from the
Apollo 16 subsatellite ---------------- ~ - - - - - - - 26 Maps showing:
21 Aluminum-silicon intensity ratios for the lunar near side from the Apollo 15 and 16 X-ray fluorescence experiments - - - -- -- -- -- - - -- - ------- - - - - - - ------ -------- ~ - - - - 30
22 Concentrations of five elements from the Apollo 15 and 16 gamma-ray spectrometer experiments - - - - 32 23 Hand-calculated root-mean-square slopes along the Apollo 14 bistatic-radar experiment subspecular track 35 24, Machine-calculated root-mean-squarc slopes along the Apollo 15 and 16 bistatic radar experiment
subspecular tracks -------------- ~ - -------- ----- - --------- ~ ~
- 36 25-32 Graphs showing:
2.5 Comparison of average S-hand and VHF root -mean-square slopes for selected geologic map units along the Apollo 14 and 15 bistatic-radar tracks ---- ------ ------ ~ - - - - - - - - - - - - - 3'7
26 Comparison of average S-band root-mean-square slopes and albedos for selected geologic units along the Apollo 14, 15, and 16 bistatic-radar tracks - - - - - - - - - - - - - - -------- 38
27, Comparison of S-band root-mean-square slopes and average infrared eclipse temperatures for selected geologic units along the Apollo 14, 15, and 16 bistatic-radar tracks ------ ---------- ~ 38
28 Bistatic-radar and photogra~nmetry slope-probability distributions of the normal type for highlands near Vitruvius ----------------- - ~ - - ---- ------ ------ ÑÑÑà 39
29 Bistatic-radar and photogramrnetry slope-probability dist,ributions of the tailed type for mare material 39 30 Bistatic-radar and photogramrnetry slope-probability distribution of the complex type for highlands
33 Composite color-difference photograph of the Moon__^ - - - - - - - - - - - - - - - - - - - - - - - 44 34 40 Graphs showing:
34 Normalized spectral reflectivity for selected lunar surfaces,- ------- ~ - - - - - - - - - 44 35 Relative spectral reflectivity for a series of background mare and highland areas ---- ~
46 36 Relative spectral reflectivity for selected craters in lunar maria and highlands ~ - - - - - - - - - 47 :37 Spectral reflectance for several common minerals -- - ----- ------ - ------------ 48 38 Position of short-wavelength absorption band plotted against long-wavelength band for Apollo samples - 48 39 Spectral reflectivity of glass made from 120fi3 whole-rock powder ------ 50 40 Plot of titanium oxide percentage in bulk lunar soils a s a function of 0.400 p m to 0 565 p m slope --- 51
41 Maps of polarized and depolarized 3 8-cin radar echoes from the Moon - - - - - - - --------- - - - - - - - - - 54
42 Maps of polarized and depolarized 70-cm radai echoes f'roni t he Moon - - - - - - - - - _ _ _ _ _ _ _ _ _ _ _ _ _ _ _ - ---- 56 43. Graphs showing comparison of polarized and depolarized echoes of 3.8-cm and 70-cm radar - - 58 44 Map showing infrared eclipse temperatures, albedos, and 3 8-cm and 70-cm radar depolarized echoes along
the Apollo 14 histatic-radar track - - - - - - - - - - - - - - - - - - - - - - - ~ ----- ~
- - - 59 45 Map showing 3 8-cm and 70-cm radar depolarized echoes along the Apollo 15 and 16 bistatic-radar tracks ---- - - 60
46 Picture showing scaled infrared eclipse temperatures of lunar near side -- - ------------ -~ 62 47. Map showing infrared eclipse temperatures and albedos along the Apollo 15 and 16 bistatic-radar tracks - _ _ _ 63 48 Graph showing average infrared eclipse temperatures and albedos of maria, highlands, and selected craters
along the Apollo 14, 15, and 16 bistatic-radar tracks - ---- ------------- _ _ _ _ - 64

CONTENTS
Pap
Comparison of results from relative age measurements (DL), net accomulated flux ( K ) , and upper limiting size ( ( ; s ) -- B6 Diameters ol craters measured stereoscopically and monoscopically, and measurement error - - 8 Relative ages of lunar plains and some craters -------- ~ - - - - - - - - - ------------- - -~ . _ _ _ _ _ _ _ _ 9 Relative ages of Apollo landing sites and radionietric ages of rocks returned from the Apollo landing sites - _ _ - - - - _ _ _ 10 Calculated incremental fluxes for small craters during the last 3 9 billion years ---------------- - ~ - 12 Comparison of regolith thickness and relative age of surface (DL) - - - - - -------------- - - - - 14 Aluminum-silicon intensity ratios associated with fourth order trend surface residuals and selected lunar features -- 31 Concentrations of five elements from the Apollo 15 and 16 gamma-ray spectrometer experiments -------- . - - - 33 Comparison of machine-calculated rms slopes, hand-calculated rms slopes, and algebraic standard deviations
estimated from slope-probability distributions - - - - - - - - - - - - - ~ - - - - - - - - - - 40 List of selected craters and areas in Apollo zone with relatively high eclipse temperatures tor general area _ _ _ - _ _ _ _ 65

A P 0 1 1 0 1\7-17 ORB1 I A1 I \ \ !Â¥ 1 I ( ;Al IONS
LUNAR REMOTE SENSING AND MEASUREMENTS
Remote sensing and measurements of the Moon from Apollo orbit- ing spacecraft and Earth form a basis for extrapolation of Apollo surface data to regions of the Moon where manned and unmanned spacecraft have not been and may he used to discover target. regions for future lunar exploration which will produce the highest scientific yields. Orbital remote sensing and measuiements discussed include (1) relative ages and inferred absolute ages, (2) gravity, (3) mag- netisrn, (4) chemical composition, and (5) reflection of radar waves (histatic) Eart,h-based remote sensing and measurements discussed include (1) reflection of sunlight, ( 2 ) reflection and scattering of radar waves, and (3) infrared eclipse t cmpera tu~es Photographs from the Apollo missions, Lunar Oihiters, and other sources provide a funda- mental source of data on the geology and topography of the Moon and a basis for comparing, correlating, and testing the remote sensing and measurements
Relative ages obtained from crater statistics and then empirically correlat.ed with absolute ages indicate that significant lunar vol- canism continued to 2 5 b y (billion years) afo-some 600 nl y (mil- lion years) after the youngest volcanic rocks sampled by Apollo and tha t intensive homhardment o f the Moon occuired in the interval of' 3.84 to 3 9 b y ago Estimated fluxes of cratei-pioducirig objects dur- ing the last 50 1x1 y. agree fairly well with fluxes measured by the Apollo passive seismic stations
Gravity measurements obt,ained by observing oibiting spacecraft reveal tha t mare basins have mass concentrations and that the vol- ume of material ejected from the Orientale basin is near 2 to 5 mill- ion kin3 depending on whether there has or has not been isostatic compensation, little or none ofwhich hasoccurred since 3 84 b y ago, Isostatic compensation may have occurred in some of the old large lunar basins, but more data are needed to prove it
Steady fields of remanent magnetism were detected by the Apollo 15 and 16 subsatellit,es, and the lunar dipole field was revised to no more than 6 x 10'" gauss High-resolution mapping of fields of weak remanent magnetism (to 0 1 gamma) was made possible by the Apollo plasma and energetic-particle experiment Alt,llough the causes of remanent magnetism are poorly understood, correlations with geologic units suggest the results may ultimately have far- reaching significance t,o lunar history Maria are much less struc- tured by strong surface magnetic anomalies than the highlands. The strongest anomalies are associated with ejccta of farside basins, plains materials filling pre-Imbrian craters, and other old Imbrian to pre-Iinbrian units The high remanent fields could be due to cooling of ejecta units in a n ancient magnetic field, lunar regolith maturity, extensive reworking and disruption o f a magnetized layer, or simply surface roughness
Orbital geochemical experiments have shown that lunar high-
lands have larger Al : Si rat,ios and smaller Mg : Si ratios than maria These two ratios a r e inversely related on a regional basis With the exception of fresh craters, albedo and A1 : Si ratios vary directly, showing that compositional differences a s well a s exposure of fresh materials a r e ~esponsihle for high albedos Statistically treated data show that geologic contacts and compositional bounda- ries arc concentric and can he roughly matched Some craters on mare material have penet,rated the mare fill, bringing highland-type materials to the surface Natural radioactivity from thorium, potas- sium, and uranium is inversely correlated with elevation Mare re- gions a r e enriched in iron, titanium, and magnesium relat,ive to the highlands.
Orbital bistatic-radar results provide estimates of surface rougli- ness a t two scale lengths (about, 30 in and 250 m), which agree with visual estimates of roughness The dielectric constant, of the lunar surface, where sampled, is uniform to 13-crn radar and near 3. Slope frequency distribut,ions measured by the radar vary and may be logarithmic, gaussian, or complex in form
Study of sunlight reflected from tlie lunar surface proved to be accurate in predicting the microscale physical properties of the lunar surface, and also the spectral character of the reflected light reveals differences in color related to chemical composit,ion and maturation of the lunai regolith. Color-difference photographs reveal boundaries bet,ween highland and mare units a s well as boundaries of units within t he maria and highlands Spectral reflectance data show that map units have unique spectral characteristics: (1) fresh mare cra- ters are different from fresh highland craters, (2) mature rnaria are different from mature highlands, and ( 3 ) units within the maria vary Spectral reflectances of returned samples correlate with those derived f rorn Earth-based telescopes
Lunar depolarized echoes of radar signals from Earth are affected by the physical and chemical properties of the lunar surface Al- though the properties affecting tlie echoes are only partly under- stood, lunar surfaces can be classified by their echoes Depolarized echoes from lunar maria are typically weaker than those from high- lands Young craters have echoes that a l e much stronger than aver- age Some areas with low albedos have echo(,s that a rc much weaker' than average
Infrared eclipse temperatures separate the Moon's features into two major groups: rnaria which are relatively warm and highlands which are relatively cool Superposed on this general pattern a r e "hot spots" which coincide with young craters and "cold spots" which coincide with dark mare-like materials With the exception of hot and cold spots, infrared eclipse temperatures are inversely correlated with albedo High eclipse tixnperatures are the result of blocky and relatively coarse grained regoliths.

Extrapolation of remote sensing and measurements indicate five pioblems tha t could be resolved by selecting proper sites and exper- iments for future exploration: (1) the duration of volcanic tictivity on the Moon, (2) early cratering history of the Moon before 3.85 b y ago, (3) the characteristics of multiringed hasins and the provenance of lunar highland samples, (4) high-resolution regional and local chern- c a l variations, and (5) variations of physical properties and rough- ness ot'the lunar surface The first problem can be resolved by collect- ing samples from western maria where the combined evidence from remotely measured relative ages, infrared eclipse temperatures, and photogeologic evidence indicate tha t very young maria are present The second and third problems could be resolved by a landed-sample return mission t.o a relatively young lunar basin such a s Orientale where the basin and ejecta units a re well preserved This mission should be combined with orbital and surface gravity measurements to determine i f isostatic equilibrium was achieved in early lunar history The fourth problem can best be resolved with high- resolution orbital geochemical experiments like those of Apollo com- bined with spectral reflectances measured from orbit. The last prob- lem could be resolved with a set of suitably designed experiments on a polar orbiting spacecraft, such a s a bistatic-radar experiment measuring quasi-specular and diffuse echoes, a n infrared experiment measuring (.he thermal responses ot lunar surfaces under a variety of insolation conditions, a high-resolution imaging experiment, and a photometry experiment
INTRODUCTION
This paper is one of four separate chapters sum- marizing Apollo 15- 17 orbital investigations; i t sum- marizes those data from remote sensing which extend the results from the Apollo landed missions to other parts of the Moon and indicates some unresolved lunar problems. This is done in two parts: (1) results from the Apollo orbital experiments and photography which art confined to areas beneath the orbits of the spacecraft and (2) results from terrestrial observations, which are confined to the Earth-facing side of the Moon. The re- sults reported were obtained a s part of NASA (Na- tional Aeronautics and Space Administration) Exper- iment S-222 (Photogeology-Apollo 15-17), whicl" started in March 1972 and ended December 1975.
Samples returned by the Apollo missions to the Moon have shown tha t the Moon was differentiating i r the interval from 4.55 billion years (b.y.) ago (Papana- stassiou and Wasserburg, 1975) to 4.35 t).y.. age (Lugamair and others, 1975). Possibly during thi: interval, and subsequently from about 4 0 b.y. ago tc 3.84 b.y ago, the Moon was bombarded by a massive flux of both large and small bodies producing huge basins and craters (Turner and Cadogan, 1975; Tera and others, 1974). Radiometric ages of mare basalts show that outpouring's of lava followed the formation of the huge basins and craters during the interval from 3.84 to 3.15 11.y. a m (Turner and C a d o m , 1975; Papanastassiou and Wasserburg, 1971a, b; Wasser-
burg and Papanastassiou, 1971; Nyquist and others, 1975).
This general framework, supplied by the returned samples, h a s been expanded using remote meas- urements from orbiting spacecraft and Earth Ages of the outpourings of lava extend to more recent times than indicated by the returned samples, and lunar sur- faces not sampled by Apollo can be related to and con- trasted with the Apollo landing sites using remotely sensed data, many yielding results that a re truly re- markable. Measured accelerations of spacecraft in orbit such a s Lunar Orbiter, Lunar Module Ascent Stages, Apollo subsatellites, and Command and Ser- vice Modules have provided data on the lunar gravity field, and Apollo laser altimetry and metric quality photographs have provided data on lunar topography which, when combined with the orbital results, yield the relation between the center of mass and center of figure of the Moon. Information on the lunar magnetic field h a s also become available. Apollo orbi tal geochemical experiments have produced a wealth of information on the chemical composition of lunar sur- faces along the orbital ground tracks.
As remarkable a s the other Apollo orbital exper- iments, although less dramatic, are the bistatic-radar experiments, which produced estimates of the rough- ness of lunar surfaces tha t agree with visual impres- sions of roughness seen in lunar photographs and im- ages. The relative dielectric constants of surfaces along the radar subspecular tracks were also measured Ter- restrial observations have been used to predict cor- rectly some characteristics of the lunar surface; these observations form a basis for extrapolating Apollo sur- face results to other areas of the Moon, and for elucidating problem areas for future lunar exploration
ACKNOWLEDGMENTS
Results reported in this paper a re based on work per- formed by the U S. Geological Survey a s part of NASA Experiment S 222 (Photogeology-Apollo 15- 17; NASA contract T- 11 67B) on behalf of the National Aeronau- tics and Space Adminstration. The authors thank S N. Hardee and J. Dixon of the Johnson Spacecraft Center, Houston, Tex., for their support and assistance in the experiment. Data along the Apollo bistatic radar ground tracks were furnished by G.L. Tyler (Apollo Bistatic Radar Experiment), T. W. Thompson of the J e t Propulsion Laboratories, Pasadena, Calif (70 cm Earth-based radar echoes and infrared eclipse temper- atures), and S H. Zisk of the FIaystack Observatory, Lexington, Mass. (3.8-cm Earth-based radar echoes)

LUNAR REMOTE SENSING AN11 MEASUREMENTS B3
APOLLO ORBITAL RESULTS
AGES 0 1 ' LUNAR PLAINS
By J M Boi( h and H J Moow
Volcanism and outpourings of volcanic flows on the Moon continued to a t least 2.5 b.y. ago-some 600 m.y, after the youngest mare basalts sampled by Apollo (Papanastassiou and Wasserburg, 1971a) were formed, and two distinct episodes of intensive bombardment of the lunar surface occurred about 3.84 b.y. and 3.9 b.y. ago. These results, determined from orbit, represent important advances in and substantial contributions to understanding of the geologic history of the Moon, They are based on a crater-morphology technique of obtaining relative ages of lunar plains (Soderblom and Lebofsky, 1972) tha t were empirically converted to ab- solute ages from returned samples (Soderblom and Boyce, 1972).
Apollo photographs taken from orbit (National Space Science Data Center, 1971a through 1974; Aeronauti- cal Chart and Information Center, 1971, 1972; and De- fense Mapping Agency, 1972, 1973) and Lunar Orbiter images (National Space Science Data Center, 1969) provide the necessary information to determine rela- tive ages. Here, results from 472 areas of lunar plains a re discussed along with other results Previously, rel- ative ages were correlated with color differences of mare surfaces (Soderblom and Lebofsky, 1972). This correlation indicated three stages of mare formation; (1) a n early stage of mare materials with relatively large blue reflectances and high titanium content, (2) a n intermediate stage of materials with relatively large red reflectances and low titanium content, and (3) a late stage of mare materials with relatively large blue reflectances and high titanium content. Relative ages of large lunar craters such a s Copernicus and Aristarchus also were determined. Many highland light plains photographed by Apollo 16 were found to be the same relative age, older than the maria and younger than surfaces related to the event t ha t formed the lmbrium basin The uniform relative ages were attributed to the event producing the Orientale basin, and a curve for converting relative ages to absolute ages was presented (Soderblom and Boyce, 1972). Older highland plains corresponding in age to the Imb- r ian event were discovered, and crater frequency dis- tributions within the Orientale basin and on its ejecta were found to be the same a s those of the extensive plains photographed by Apollo 16 (Boyce and others, 1974). Relative ages have also substantiated superpos- ition relations determined for the Imbrian flows (Schaber, 1973) and flows near Delisle and Diophantus
(Wilhelms, 1980). Maps showing the distribution of relative ages of lunar maria and highland plains ap- pear in the literature and later in this section (Boyce and Dial, 1973; Boyce and others, 1975).
R l \ I I \\ 0 1 M I I HODS 0 1 F S I I \ f A I I \ ( ; l < F l \ I I \ I - V T I S
There are three fundamental concepts required to understand the techniques of estimating relative ages: (1) Craters a re continuously produced by impacts on the lunar surface with a size-frequency distribution ex- tending from very small craters to very large craters, and there a re many more small craters t han large ones, (2) craters a re eroded and destroyed by sub- sequent impacts, with the chief effect being erosion of larger craters by impacts producing smaller craters, and (3) lunar surfaces reach a steady-state condition in which craters below a certain size a re destroyed a s rapidly a s they are produced. In addition, requirements of measurement and sampling must be met. The con cepts, requirements, and a brief description of methods for estimating relative ages appear belows
Continuous production of craters by impacts with the lunar surface producing a frequency distribution of craters is a fact established by Apollo (Duennebier and others, 1975; Morrison and others, 1972) a s well a s previous studies (see for example, Shoemaker, 1965) Lunar data indicate tha t crater frequency distributions directly reflecting the crater production curve are of the form
where N is the cumulative number of craters per unit
area on a surface with diameters equal to or larger than D ,
K is the net accumulated flux, which increases with relative age of the surface,
1) is the crater diameter, and a is an exponent with a value near -3 0 for the
range of sizes of craters considered here (Soderblom and Lebofsky, 1972; Neukum and others, 1975a; Moore, 1964).
Primary craters a re produced by objects from space and secondary craters by ejecta from primary craters. The relative importance of the two kinds of craters is a matter of debate. Some authors indicate secondary craters a r e dominant over some ranges of sizes (Soderblom, 1970a, Shoemaker, 1965), and others in- dicate conditions where primary craters a re dominant

B4 APOLLO 15- 1'7 ORB!
(Gault, 1970: Moore, 1964). Idealized crater frequency distributions are illustrated in figure 1.
Regardless of the primary or secondary origin of the craters, young surfaces have fewer craters than older ones. The net accumulated fluxes for three surfaces (K ,, K.,, K:,, in fig 1) increase with their relative ages. Crater frequency distributions reflecting the relative ages of surfaces have the form of equation (1) and are only valid for the larger sizes of craters, because theoretical considerations show tha t the area occupied by small craters produced by primary impacts alone exceeds the area of the surface or1 which they are produced within a short time (Moore, 1964; Shoemaker, 1965; Marcus, 1970; and Soderblom, 1970a). Thus, subsequent im- pacts must destroy previously formed craters. Erosion of larger craters by smaller ones is the chief mecha- nism of crater destruction (Soderblom, 1970a), al- though infilling by deposition of ejecta (Marcus, 1970; Moore, 1964, Soderblom, 1970a) also occurs. This ero- sion and infilling destroy small craters a s rapidly as they are produced so tha t the surface reaches a steady state (below a limiting crater size) in which the general appearance of the cratered surface remains the same although the details a re continually changing. Because the erosion occurs a t a fine scale by the production of craters in the steady-state size range (Shoemaker and others, 1969a, b), the surface has been saturated with craters many times over Thus, statistical errors pro- duced by swarms of secondary or primary impacts are averaged out , The erosion model used for most esti- mates of relative age in this section (Soderblom, 1970a; is valid for craters with interior slopes of about 8 O tc 25" Slopes steeper than about 25O erode partly by slumping and sliding, whereas slopes less than about 8" are degraded by overlap of craters and superposed e,jecta blankets.
Steady-state frequency distributions of craters on lunar surfaces a re well established (Gault, 1970. Shoemaker and others, 1969b; Trask, 1966,) In gen- eral, the steady-state distribution for lunar plains car be represented by an equation of the form
M L m-2 (2 where
M is the cumulative frequency of craters per unii area with diameters larger than D and
C is a parameter tha t varies with the manner ir which craters a re destroyed and the physical properties of the surface (Moore, 1964; Marcus 1970; Soderblom, 1970a; Morrison and others 1972); its value is near 10")9 craters-m2/106 krn' for most lunar plains (Trask, 1966; Moore 1964).
, INVESTIGATIONS
I o - ~ 10-1 l o 0 10' I o2 1 o3 CRATER D I A M E T E R I N K I L O M E 1 ERS
FIGURE 1 -Hypothetical cumulative frequency distributions of cra- ters for three ages of surfaces Distribution for each surface is composed of two parts, a steady-state distribution and a crater production distribution Crater production distribution of young surface joins steady-state distribution at C.,,; largest crater eroded to an interior slope angle of lo is a,,; net accumulated flux (K in qua t ion 1) is K, Crater production distribution of middle age surface joins steady-state distribution a t C,;; largest crater eroded to an interior slope angle of lo is Dn; net accumulated flux is K , Crater production distribution of old surface joins steady-state dis- tribution at Css; largest crater eroded to an interior slope angle of 1" ~SI)~, :~; net accumulated flux ~ s K : ~ Note diameters corresponding to C.,, C\,, and C.,:; increase with age of surface, diameters ofD,,,, Dl ,, Dr., also increase wit11 age of surface, and cumulative frcquen- cies corresponding to Kl , Kv, and K:,, increase with age of surface

LUNAR REMOTE SENSING AND MEASUREMENTS B5
Although the exponent on D is minus two for most lunar surfaces, other values a re possible where crater destruction is the result of thermal creep on steep slopes, seismic erosion, and blanketing (see for exam- ple Marcus, 1970), and the form of the crater produc- tion frequency distribution may alter this exponent (Moore, Lugn, and Newman, 1974). The technique is not applied where there is evidence tha t the conditions imposed by equations (1) and (2) a re not met,
In any event, for lunar plains, equations (1) and (2) join a t a point with the same frequency and diameter (fie,. 1) The upper limiting crater diameter a t which this join occurs is called C, (Shoemaker and others, 1969a, b). C ' increases with the relative age of the sur- face (C,.,, e,.,, 0,:; in fig. 1 ) and thus the net accumulated flux Below the upper limiting crater diameter (in the steady state), the relative frequencies of craters of any given size with the same morphology or state of preser- vation are the same (Trask, 1971, Moore, 1971a, 1964; Soderblom and Lebofsky, 19721, and so the cumulative frequency of craters eroded with a given interior slope angle (or greater) lies on a line parallel to the steady- state curve in figure 1. The diameter of craters eroded to an interior slope angle of lo has been termed D, (Soderblom and Lebofsky, 1972) and intersects the cra- ter frequency distribution a t a diameter larger than C7., (fig. 1) Like Of:, Dl increases with the relative age (Dl Dl.,, Dr., in fig 1) of the surface.
One procedure for establishing relative ages of lunar surfaces is to determine D l In practice, the maximum diameter (Dy) of craters is estimated from those with interior slopes eroded to the appropriate sun elevation angle (ST) by the accumulated flux. All craters larger than D, have shadows because their interior slope an- gles a re equal to or greater than the sun elevation an- gle Craters smaller than this size a re shadowed or unshadowed. The ratio of unshadowed to shadowed craters is zero for craters larger than TIs but finite for craters smaller than Ds and constant within the steady state The value of D,. may be determined rapidly by finding the largest unshadowed crater in a n image and the smallest diameter a t which all craters a re clearly shadowed (Soderblom and Lebofsky, 1972). This proce- dure yields lower and upper bounds forDs. The value of D, is then computed using the crater erosion model of Soderblom (1970a):
where S, is the initial interior slope angle of the crater (taken a s 30°) Thus, there a re three tests of' the va- lidity of the technique if' a= - 3: (1 ) the value of the net accumulated flux (K in equation 1) should be directly proportional to the largest crater eroded to a n interior slope angle of l0(DI) for the same surface, (2) the join between the steady-state distribution and the crater frequency distribution, C\., should be directly pro- portional to D/ , and (3) the ratio of shadowed to un- shadowed craters for different sun elevation angles should satisfy equation (3) Additionally, K and C,. should be directly proportional to each other. These tests a re reasonably well met As shown in figure 2 and table 1, (1) Dl, and K a re directly proportional (Soderblom and Boyce, 1972, (2) C,, and K are directly proportional, but the values of C,. for Surveyor 1 and 6 arc too small, and (3) D l and C\. are directly pro- portional, but C,. values for Surveyors 1 and 6 are too small. The deviations for C,. values for Surveyors 1 and 6 are the result of the constant for the steady-state curve used in calculating C\.; here the value of C in equation (2) is near 10" rather than 10'" (Shoemaker and others, 1969b). The values ofCs should be nearer to
L I M I I IN ( - C R A T E R S I Z E I N M E T E R S
F L U X ( C R A T E R S G R E A T E R T H A N O N E M E T E R I N D I A M E FER I'ER O N E M I L L I O N S Q U A R E K I L O M E T E R S )
FIGURE 2,-Relations between 11,. (diameter of largest crater the interior wall of which has been eroded below 1" ), K (integrated impact flux dctcimined from crater counts), and C, (limiting crater size). Arrows indicate C, values expectixi for correspond- ingD, values for Surveyors 1 and 6 data points and direction to upp~rhound 11, values for Apollo 14 Boxes represent ranges in estimates for Apollo 11 and 16 Vertical bars indicate ranges in estimates for 11, and (.',.*
B6 APOLLO 15- 17 ORBITAL INVESTIGATIONS
TABLE 1 ÑCompariso of results from relative age measurements (D,), net accumulated flux (K), and upper limiting size (C,,)
- - - -
K (number of craters)
Dl . I On, (,',
[vocation ( n ~ ) dianieterll 0"kni2) (in) - ~p
Surveyor 7 ' , 2 0 """ 2" '¥ 75
Surveyor 1 .._._._. '16@20 siO.r -c. '56
Surveyor 6 _ _ _ _ _ _ _ _ _ _ ___'25(>+30 21"131)> ^00
Apollo 11 (Surveyor 5 ) _ _ _ _ _ _ _ _'330±4 310~70 '141, '186
Apollo 16 ._____ 5 4 W 9 0 a1013 > -300 335
Apollo 14 5140@400 '10"' $700-790 North Ray Crater - - - - - - 6 =4 ¥¥lo 2'-10"." '2 2 to 2.7
-- ~~ --
'Soderhlom and Lebofsky (1972) 'Shoemaker and others (1969b) . . 'Shoemaker and others (1970) 47 . wdnn . and others (1971). 5SoderbIom and Boyce (1972) T h i s report; Apollo panoramic camera photographs will not permit an estimate ofD,
because the resolutions of the cameras are too poor; th is is also the c a s ~ for thp Lunar Orbiter images of Surveyor 7 site; D, is approximately 1 7xC,
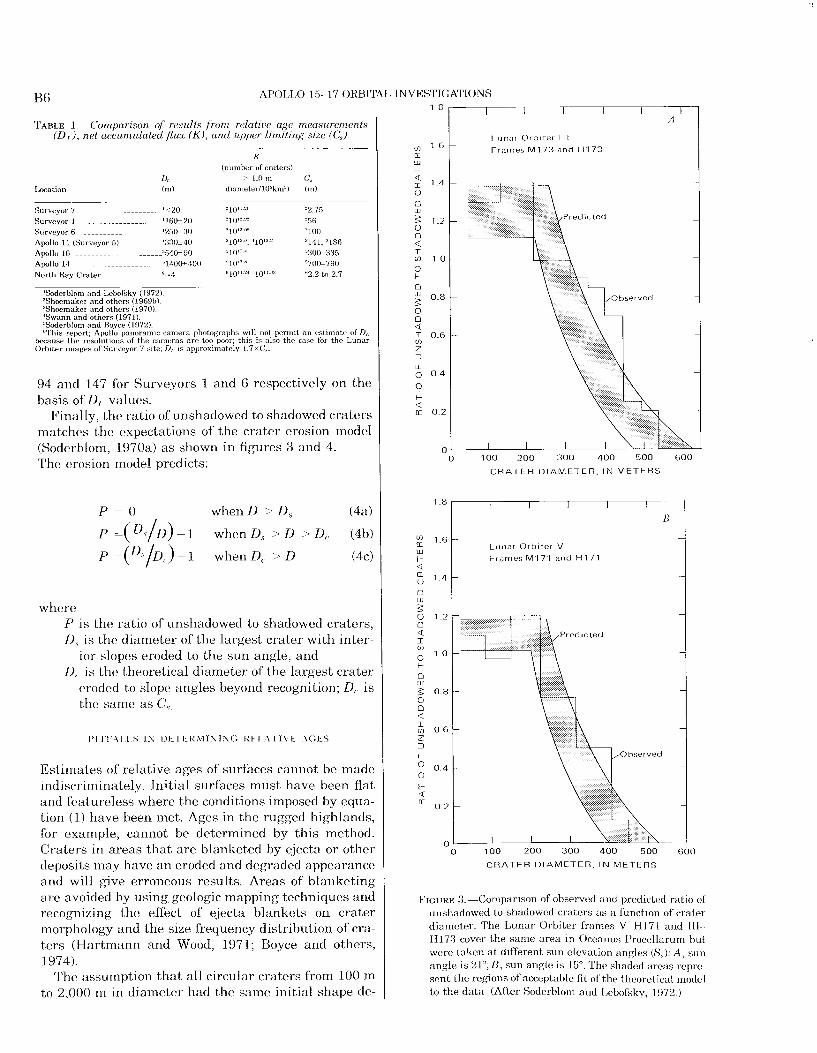
94 and 147 for Surveyors 1 and 6 respectively on the basis of D, values
Finally, the ratio of unshadowed to shadowed craters matches the expectations of the crater erosion model (Soderblom, 1970a) as shown in figures 3 and 4. The erosion model predicts:
P = 0 when D I) , ( 4 4
P -(')\/I)) - 1 when D* D - 11, (4b)
P =("$ID,) - 1 when D, D ( 4 ~ )
where P is the ratio of unshadowed to shadowed craters, D, is the diameter of the largest crater with inter-
ior slopes eroded to the sun angle, and 11, is the theoretical diameter of the largest crater
eroded to slope angles beyond recognition; D, is the same as C\
Estimates of relative ages of surfaces cannot be made indiscriminately. Initial surfaces must have been flat and featureless where the conditions imposed by equa- tion (1) have been met. Ages in the rugged highlands, for example, cannot be determined by this method Craters in areas that are blanketed by ejecta or o t h e ~ deposits may have an eroded and degraded appearance and will give erroneous results Areas of blanketing are avoided by using, geologic mapping techniques anc recognizing the effect of ejecta blankets on crate1 morphology and the size frequency distribution of cra- ters (Hartmann and Wood, 1971; Boyce and others 1 974).
The assumption that all circular craters from 100 rr to 2,000 m in diameter had the same initial shape de.
Lunar Orbiter I I I
Frames M173 a n d H I 7 3
w I-
CRATER DIAMETER, IN METERS
Lunar Orbiter V
Frcimes M I 71 and H I 71
0 100 200 300 400 500 600
CHATER DIAMETER. IN METERS
FIGURE 3.-Comparison of observed and predicted ratio of' unshadowed to shadowed craters a s a function of crater diameter The Lunar Orbiter frames V-HI71 and 111- HI73 cover the same area in Oceanus Proccllanim hut were taken a t different sun elevation angles (S,): A , sun angle is 21'; B , sun angle is 15". The shaded areas repre- sent the regions of acceptable f i t o f t h e theoretical model to the data (After Soderblom and Lobofsky, 1972 )

LUNAR REMOTE SENSING AND MEASUREMENTS B7
Or 1 160 1554 rT i
V) 1 2 Apol lo 16, F r a m e AS16 M 1274
a \ 1
- I l l 1 l l l l l l l l l l l l - - Sr loo - --1 Of 1 0 7 0 + 1 3 0 m
Or 1560-2010 m Observed
Lunar Orbiter IV,
Predicted
r ame 104 H ,
r --i CRATER D I A M E T E R , I N METERS
FIGURE 4 -Ratio of unshadowed to shadowed craters a s a fi~nction of diameter for floor of' Albategnius, A , and door of Meton, K Bumps in observed values a t about 1,800 m for Albategnius and 5,000 nl for Melon reflect old partially buried craters Dashed line repre- sents best fit of tlieorctical model of Soderblom and Lcbofsky (1972) S,, sun elevation angle; Dl,, relative ages; D,, maximum diameter (After Boyce and others, 1974 )
serves some comment Some support for this assump- tion is found in the data of Pike (1974), where least- squares regressions to data on craters indicate that depths of craters between about 80 m and 10 km across are directly proportional to crater diameters. On the other hand, craters deviating from a simple form, such as concentric craters, flat-floored craters, and craters with central peaks, do exist in the size range of 10 m to 500 m and arc particularly abundant 111 Oceanus Pro- cellarum (Quaide and Oberbeck, 1968) Generally speaking, these craters are smaller than £ and have little or no effect on the results. Irregularly shaped craters that may have had initially low slopes, such as dimple craters (Greeley, 1970; Kuiper, 1965), and swarms of secondary craters (Oberbeck and others, 1972) are identifiable, and areas where they occur are avoided.
Proper measurements are essential to the technique of estimating relative ages There are four ingredients for proper measurement. (1) Shadowed and un- shadowed craters must be distinguished, (2) image res-
olution must be good enough to show clearly craters in the size range of interest, ( 3 ) diameter measurements must be reasonably accurate, and (4) the area sampled must be sufficiently large. Photographs used for esti- mates of relative ages are well processed and present few problems in identification of shadowed and un- shadowed craters within the limits of error expressed in the reported D[ values. For the sun elevation angles (8¡-25O and images used in this study, image contrast is marked between the shadow and illuminated parts of clearly shadowed craters Moderate-resolution Lunar Orbiter images (about 30 in) are checked against high-resolution Lunar Orbiter images (1-3 rn) of the same craters to verify that shadowed and un- shadowed craters are properly identified
Boyce and others (1975) showed experimentally that consistent D, values or relative ages can be obtained if the resolution of the image is 0 15 times Dl or better. (Here, resolution is the size of the smallest crater that can be identified in the photograph or image. The data are summarized in Boyce and others, 1975, and in figure 5 ) Thus, it is important that crater frequency distributions be used for relative age measurements when the resolution criterion cannot be satisfied. Such conditions occur a t North Ray crater a t Apollo 16, the crater Tycho, and the light mantle a t the Apollo 17 site The results above not only show the relation be- tween resolution and D; , but they also substantiate the erosion model (Soderblom, l970a), because the I), val-
0 10 20 30 40 50 60 7 0 80 90 100
I D E N T I F I C A T I O N RESOLUTION, I N METERS
FIGURE 5 -Effects of photograph resolution on determination of 11, (relative age) Dashed line represents approximate location of critical resolution (=0 15 11,) For resolutions better than 0 15 TI, (left of dashed line), relative age measurements fix a particular unit a re constant; a t lower resolutions (diagonal l ines) , measu remen t s become inconsis tent x Mare Serenitatis; A, Eastern Mare Cognitum; o, dark mantle west of Apollo 17 landing site; C l , floor of Fra Mauro. (After Boyce and O~,IIPIS, 1975 )

B8 APOLLO 15-1 7 ORBITAL INVESTIGATIONS
ues calculated from D, remain constant over the pre- dicted range of sun elevation angles
Diameters of craters reported here have been rneas- ured monoscopically on photographs taken with sun elevation angles between and 25O. Although some workers argue tha t monoscopic measuren~ents may be a s much a s 20 percent in error (Young, 1975), our monoscopic measurements are less than 5 percent off compared to stereoscopic measurements a t these low sun elevation angles (fig. 6, table 2). Thus, monoscopic techniques are entirely suitable and well within the error limits of reported Dl values. Furthermore, re- gional studies require monoscopic measurements be- cause most of the usable images of the Moon are monoscopic
Minimum sizes of sample areas required for a reasonable estimate of relative ages a re a function of relative ages of the surfaces and sun elevation angles because the area should include more than ten ineas- ured craters with diameters equal to D5 (Soderblom
A 8 0 /--
z /' EXPLANATION
40 /
/ C l a t e r s
/' 0 H e n r y 0 S h a k e s p e a r e A C o c h l s e A C a m e l o t 0 S t e r i o
I- I s t l o l t y
< O v a n S e r g > w 10
w p p r o x i m a t e maximum e r r o r
z 3 0 I , I , I I 1 I I 1
en 0 2 4 6 8 10 12 14 16 18 20
E R R O R , IN P E R C E N T
FIGURE 6 -Errors in measurement olcrater diameter as a function of sun elevation angle (see table 2)
TABLE 2.-Diameters of craters measured stereoscopically ana monosropzrally, and measurement error
Shakespeare -___625+1 9 596 2 3 667t88 496-19 1 606 1 1 613 Cochia<. - - - - -__583-1 7 569 -4 0 583-1 7 496-16.4 583-1 7 593 Camelot _ _ -__667+20 650-06 6% 4 9 620-52 650-06 654 She -- - - - - - - - - 583-1 7 596 10 5 5S3-1 7 538-9 3 583- 1 7 593 Shorty , 1 1 2 0 0 108 3 6 113t09 108-3.6 107-45 112 Van Sere - - 87-54 98 1 6 5 90 2 2 81 120 931 1 1 92
'Apollo metric photograph AS17-M 0597, s u n 13" above local horizontal Apollo metric photograph AS17-M-1500, sun 28" above local horizontal Apollo metric photograph ASl7-M-2086, sun 47" above local horizontal Apollo metric photograph AS15ÑM-1113 sun 54" above local horizontal. ¥ lln panoramic photographs AS17-P-9557 and AS17-P-9559 both with sun 53" abov
focal horizontal o imoramic photo-iphs ASIT-P-2309 and AS17- P 2314 both with sun 15" a h v nArA { or~mnta l
tnd Lebofsky, 1972) Large areas are required for high iun elevation angles and old surfaces (Boyce and )triers, 1975, Fig 7). When large areas a rc required for idequate sampling, care must be taken to avoid sam- )ling mixtures of units with different ages by using ¥arefu mapping; otherwise, the tendency is to obtain he relative age of the oldest unit in the area of the mage (Soderblorn and Lebofsky, 1972).
In summary, the crater morphology technique of es- ablishing relative ages yields good results within the imits discussed Problems arising from the presence of nlanketed terrain and mixtures of geologic units can generally be recognized and solved. Areas with craters o r which the model does not apply can be identified Nhen resolution will not permit a n estimate ofDI, era ,er frequency distributions must be obtained. D, can be calculated a s 1.7 times C from the intersection of the neasured crater frequency distribution (equation 1) ind the empirically determined steady-state distribu- .ion (equation 2).
Three major subdivisions of relative ages a re indi- ;ated in a frequency histogram of relative ages for
S U N A N G L E , IN D E G R E E S
FIGURE 7 -Sample area necessary to establish Ds (maximum di ameter of craters) D,., relative ages (From Boyce and others, 1975 )

LUNAR REMOTE SENSING AND MJ3ASURKMENTS B9
lunar plains (fig. 8, table 3): (1) young mare plains, (2) light plains of intermediate age, and ( 3 ) old light plains. The latter two are confined to the highlands, A fourth group of ages representing very young craters such a s Tycho, Ar is ta rchus , and Copernicus (Soderblom and Lebofsky, 1972) can be added, and mare plains can be further subdivided, although somewhat arbitrarily, into five units corresponding to troughs and flexures in the histogram. Data on relative ages a re listed in Boyce and others (1975)
From figure 8 i t may be seen tha t a substantial frac- tion of mare plains have younger relative ages than the Apollo 12 landing site. Large expanses of mare plains that are younger than those of Apollo 12 occur in Oceanus Procellarum. This indicates that mare volcanism con- tinued to more recent times than a t Apollo 12.
The geographic distribution of surfaces with the same relative ages is substantially the same a s t ha t reported previously (fig. 9; Soderblorn and Boyce, 1972; Boyce and Dial, 1974, Boyce and others, 1974). More recent work (Boyce and Dial, 1975; Boyce, 1976) gives a clearer picture. Light plains of intermediate age scat- tered across the entire lunar highlands have the same relative age a s the cjecta or Hevelius Formation of the Orientale basin. Old light plains a re less frequent t han
', f $
<? <s Q *
L 1 1 p l a i n s
I r n b n u m 1 age
R E L A T I V E AGE, IN M E T E R S
FIGURE 8 -Histograms of relative ages of lunar plains Lower histngram represents frequencies in intervals of 117- 127 111, etc ; upper histogram represents frequencies in interval 122-132 in, etc Note frequency modes near 210 (rnare plains), 5 10 (light plains of intermediate age), and 1,100 (old light plains) Hiatus represents short interval of normal ac- tivity between t h e major basin-forrr~ing events (Orientale and Imbrium) Mare plains may be subdivided into five subunits based on minor modes and flexures in histograms (table 3) .
TABLE 3 -Relative ages of lunar p h m s and some craters
Light plains of intermediate age - -
Old light plains - - -
11, (m) Distribution - --
'l^I0 S<-iittered across the Moon 10IJ 495
Conwntrated in Oceanus Procc l l a r~~n~. ;;i229 229 260 260-302 302-472 Conccntratel in Mare Tranquillitatis
.-472-642 Scattered throughout the highlands 1,030-1,180 Do
the young light plains, but they are also scattered across the lunar highlands The relative ages of mare plains tend to decrease westward. The youngest mare plains a re concentrated in Oceanus Procellarum and the oldest in Mare Tranquillitatis. Relative ages of plains vary within the maria. Relatively young plains occur within Mare Imbrium and Mare Serenitatis where they are more or less centrally located
An approximate time scale for lunar events can be established by comparing relative ages (Dl) of the Apollo and Luna landing sites with ages of returned rocks and interpretations of the provenance of some samples collected by Apollo (Shoemaker, 1970, Soderblom and Lebofsky, 1972; Soderblom and Boyce, 1972; Boyce, 1975). Such a correlation can be made independently of the erosion model provided the crater flux has changed in a well-behaved way with time and has been uniformly distributed across the Moon Rela- tive ages (Ill values) a re plotted against radiometric ages in figure 10, and values used are listed in table 4 with the appropriate references. Radiometric ages for the old light plains a re taken a s 3 9 b y., and those for the light plains a re taken a s 3 85 b.y. (see Tera and others, 1974) Stratigraphic relations between the highland plains and mare un i t s (Wilhelms and McCauley, 1971) indicate these light plains must be older than the oldest mare basalts, which are about 3.84 b.y. (Nyquist and others, 1975; Turner and Cado- gan, 1975). Plotted points for the Apollo 17, 11, and 12 sites appear well behaved, but the relative age for Apollo 15 appears to be too old when compared to the smooth curve in figure 10. Thus, the relative age re- ported (Soderblom and Lebofsky, 1972) may represent a n older unit a t the Apollo 15 site. A more recent rela- tive age for Apollo 15 is lower and in agreement (Boyce and others, 1975). For two of the points shown in figure 10, Copernicus and Tycho, somewhat speculative in- terpretations a re required. Rock 12013 is presumably from Copernicus because rays from Copernicus streak

0 500 K I L O M E T E R S w
A P P R O X I M A T E SCALE
FIGURE 9 -Distribution of relative ages I ) , of l u n a r plains i n the "Apollo zone" (after Royce, 1976)
TABLE 4 -l<elative ages of Apollo landing sites and ~adunnetric uges of rocks returned from the Apollo landing site
- - - - - - -
Relative Radiometr~c Location Geologic unit age age References
Apollo 16 .___. North Ray - - - - - - - _ - 3 7 to 4 6
Apollo 17 .Light mantle 3.1 to t i8 (avalanche interpreted to have been produced by Tycho ejccta)
Ty cho - - - - - - - ..__ 4 7
,,.,.a,
48 Hi 1 7 ~11.y Marti and others (1973); Kirstpn and others  30 y (1971) this report (0,. taken as 1 7xCs).
5,&128 I,eich a n d o t h ~ r s (1975, light mantle); Hutcheon and others (1974, Boulder 2 Sla 2). Muehlbergei and others (1973)
-- Shoemaker and others (1969). I), taken as
1 7xC,

LUNAR REMOTE
4 Cayley F o r m a t i o n J A p o l l o 17
Apol lO 1% 0 1 1 0 1 5 %
I I
SENSI
Copernicus
N o r t h Ray t o present
A p o l l o 1 2 t o Copernicus --T Tycho to present
~ w a n n and Reed
TIME B E F O R E PRESENT, I N B I L L I O N S O F Y E A R S
FIGURE 10 -A, Comparison of relative age determinations made from orbital photography and radiometric ages determined from Apollo samples Small range of I ) , for Cayley plains indicates a short period tor their formation B , Incremental flux of objects producing small craters estimated from relative ages and radiometric ages determined from Apollo samples Error bars on both relative ages and radiometric ages indicate flux may have been nearly constant for more than 3 5 1) y , but flux may have been relatively low during the interval of 0 85 to 3 15 11.y ago, Flux was clearly high between 3.85 and 4.0 b y ago Results of Swann and Reed (1974) included for comparison
cross the general area of the Apollo 12 landing site (Silver, 1971) An argument for a genetic and temporal relation between the light mantle a t Apollo 17 and Tycho has been presented by a number of authors (Muehlberger and others, 1973, Howard, 1973, Luc- chitta, 1975) Crater counts on the light mantle yield a C\ of 2-4 and a n age of about 100 m y for the age of the light mantle and lend support for the contemporaneity of Tycho and the light mantle (Muehlberger and others, 1973) The Dl valtie of 13± rn reported in Muchlberger and others (1973) is probably invalid be- cause the resolution and sun elevation angle of the photographs used will not permit a reliable estimate of D l . An estimate of 0, compatible with the data and erosion model is 1 7 times C , or 3 4 to 6 8 ~n Such a Dl would reduce the estimate of age to roughly 50 m y
AND MEASUREMENTS B l l
Krypton exposure ages a t Boulder 1, Station 2, of 53+3 m,y, (Leich and others, 1975; Arvidson and others, 1975) place a lower boundary on the age of the light mantle because the boulder is superposed on it. Argon exposure ages of rocks collected a t Station 3 on the light mantle a re 195± rn.y (Crozaz and others, 1974) and 110 to 160 m.y. (Turner and Cadogan, 1975). Luc- chitta (1977) believes tha t the crater Camelot with ex- posure ages of 80 m , y , (Turner and Cadogan, 1975), 118-128 m.y. (Horn and others, 19751, and 71.7±1. m.y. (Crozaz and others, 1974) is older than those crat- ers interpreted to be secondary impact craters from Tycho, because Camelot is more subdued and eroded than the secondary craters. This would place the age of the light mantle and Tycho between 50 and 128 m.y.
Crater counts on the ejecta blanket of North Ray from the crater rim to roughly one-half crater radius from the rim, obtained from Apollo 16 Panoramic Camera photographs, can be fairly well described by equation (1) (fig. 1 I) , and calculations of K and C\. for North Ray using a = -3 in equation (1) and equation (2) a re 1,72-2.12x 10" craters110" km2 and 2.2 to 2.7 m, respectively. Again, the resolution of the photograph is too poor for a n estimate ofD,, which should be near 3.7 to 4.6 in or 1 7 times C'.,., The absolute age of North Ray is widely accepted a s 48.9 Â ± .7 m.y. (Marti and others, 1973), but smaller ages (near 30 m.y.) have been re- ported (Kirsten and others, 1973).
An incremental impact-flux history (fig. 10B) for rel- atively small craters can be derived in terms of AOI,/At from the cumulative curve shown in figure 10. The large flux during the interval from about 3.9 to 3.84 b y . ago is consistent with previous results (Soderblorn and Royce, 1972; Shoemaker, 1970; Soderblom and Lebofsky, 1972; Neukuin and others, 1975b) and much larger than that during the interval from 3.68 to 3.16 b.y. ago. These results when combined with the histo- grams of figure 8 indicate tha t two major crater- forming events, separated by a short hiatus, occurred early in lunar history. Vor ages less t han 3.15 11.y (Apollo 12), the incremental frequency is not well un- derstood. Computed incremental frequencies using the error bars yield mixed results (tables 4 and 5), but best-guess estimates suggest a n increase in flux during the last billion years. When the uncertainties for the data point represented by Copernicus are considered, the argument for such an increase in flux seems some- what weak. Neukum and others (1975b) combine data on terrestrial craters to indicate a n increase in flux of large craters (in contrast to the small craters consid- ered here) during the last billion years. This postulate needs further study using lunar data.

APOLLO 1 5 - 17 ORUITAI, INVESTIGATIONS
10 100 1000
CRATER D I A M E T E R , I N METERS
FIGURE 11 --Frequency distribution of craters on flanks of' North Ray crater (Apollo 16) from rim to about one-half crater radius from rim
TABLE 5 ÑCalc~~Latcc incremental fluxes for small craters during the l i s t 3 9 billion years
- - p- - - -- -- -
North Ray to present. .__. --- ._85 ndb y 4 2 m, 49 m y (76 to IMl Gj.7 rn , 49 m y . and
4 6 nl, 30 m y ) Tycho-Light Mant le to present _ _ - _ _ 53 n ~ / b y 4 7 m, 89 1x1 y
I27 to 136) 13 4 in. 128 m v and 6 8 m. 50 k v 1
Copernicus to present _ _ _ _ _ _ _ _ _ __I18 ndh Y. 100 in, 0 85 b y (70 to 173) (70 mi. 0 95 b y and
110m 0 7 l h v I Apollo 12 to present --- - - - ---
Apollo 17 to Apollo 12 - - - - - - -.-
6 8 nilh y. 215 rkri 16 b y ' (5'2 to 85) (170 m, 3.25 b y and
260 m, 3.07 h y I 288 m/b y . 215 ~ n , 3 16 b y and
189 to 9781 365 m. 3 68 b v
335 m, 3 Sb h y , 170 m, 3 27 h y and 3% m, 350 h y )
- - - - - - p p
An argument for an increase in impact flux in more recent times has been given by Swan11 and Reed (1974) Their increment flux (shown in fig. 10B) may be con- verted to AD,/At using the relation
A& - 8A£È 5) vhere 8 = 4.8x101", and using equation (1) with a 3 . The results are lower than expected when com-
tared with the other results. This may reflect the fact hat, many craters have been destroyed and were not ounted because the craters counted extend we11 into he steady-state sizes, and others could have been riissed because of illumination conditions..
Relative ages correlate, with some qualifications, with other remotely sensed data: (1) geologic map ini its, (2) regolith thickness estimates, and (3) oistatic-radar surface roughness estimates. These are briefly discussed below.
In a broad way, the sequence of formation of lunar plains units determined from relative ages is in agreement with relative ages based on geologic criteria such as superposition, intersection, and degree of modification (Shoemaker and Hackman, 1962; Wilhelms and McCauley, 1971, Wilhelms, 1980). IIigh- land geologic plains units are older than mare units by both relative age dating techniques (Dl values) and geologic techniques. Ejecta from craters such as Tycho, Copernicus, and Aristarchus are also found to be younger than the maria using both techniques. Rela- tive ages of highland plains fall into an older group and younger group. Generally those mapped as pre- Imbrian plains (Wilhelms and McCauley, 1971) cor- respond to the older relative ages, and those mapped as [mbriari plains (Wilhelms and McCauley, 1971) cor- respond to younger relative ages. These results are in- ternally consistent with the hypothesis that the "crater age clocks" of pre-Imbrian surfaces were reset by the Imbrian event and that Imbrian surfaces were reset by the Orientale event if the resetting of the crater age clocks was accomplished by a nondeposition process such as seismic erosion (Schultz and Gault, 1974) On the other hand, the results are inconsistent if thick deposits of primary ejecta produced the new surfaces (Chao and others, 1975) or thick deposits of secondary and tertiary crater ejecta produced the new surfaces (Oberbeck, Horz, and others, 1975). If this second pos- tulate is true, both groups of plains are Imbrian. Within the mare plains, particularly good correlations between relative ages and geology are found in Mare Imbrium, Oceanus Procellarum, and Mare Serenitatis. The Irnbrium flows are clearly superposed on other flows, and their relative ages (a, values) are clearly
LUNAR REMOTE SENSING AND MEASUREMENTS B13
younger than the subjacent flows (Schaher, 1973). Similar results are found for the young flows mundat- ing Delisle (Wilhelrns, 1980) The mare materials of Oceanus Procellarum are clearly superposed on those around Montes Agricola, just north of the Aristarchus Plateau, and in complete agreement with the 11, values for the two geologic units (Zisk and others, 1975, 1977, Boyce, 1975) Within Mare Serenitatis, part of the dark annulus has an older relative age than the material within the basin-a result consistent with geologic mapping (Boyce and Dial, 1973; Howard and others, 1973). Finally, both relative crater ages and geologic mapping show that Copernicus is younger than Eratos thenes and both are younger than the surrounding maria (Shoemaker and Hackman, 1962; Soderblom and Lebofsky, 1972).
Regolith thicknesses should increase with net ac- cumulated flux and D[ or relative age (Shoemaker and others, 1960b; Soderblom and Lebofsky, 1972). Four methods for estimating regolith thicknesses that are
44
40
36
0 V L L . ,_ 32 L L
Â¥ 7 - . 28 C/7 0 L L
z ^ 24 u 1 t-
= 20 I- _1
0 (3 LU 16
a: z 4 Q 12 HI
2
8
4
n
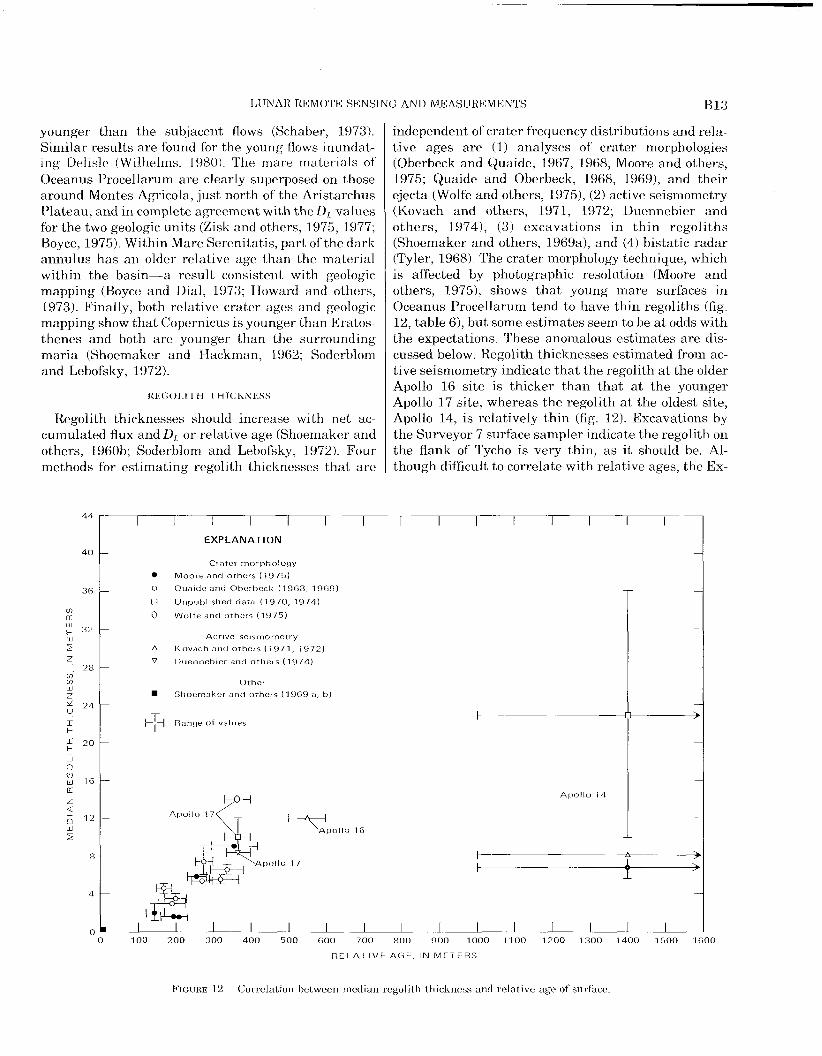
independent of crater frequency distributions and rela- tive ages are (1) analyses of crater morphologies (Oberbeck and Quaide, 1967, 1968, Moore and others, 1975; Quaide and Oberbeck, 1968, 1969), and their ejecta (Wolfe and others, 1975), (2) active seismometry (Kovach and others, 1971, 1972; Duennebier and others, 19741, (3) excavations in thin regoliths (Shoemaker and others, 1969a), and (4) bistatic radar (Tyler, 1968) The crater morphology technique, which is affected by photographic resolution (Moore and others, 1975), shows that young mare surfaces in Uceanus Procellarum tend to have thin regoliths (fig. 12, table 6), but some estimates seem to be a t odds with the expectations. These anomalous estimates are dis- cussed below. Regolith thicknesses estimated from ac- tive seismometry indicate that the regolith a t the older Apollo 16 site is thicker than that a t the younger Apollo 17 site, whereas the regolith a t the oldest site, Apollo 14, is relatively thin (fig. 12). Excavations by the Surveyor 7 surface sampler indicate the regolith on the flank of Tycho is very thin, as i t should be. Al- though difficult to correlate with relative ages, the Ex-
EXPLANATION
Crater m o r p h o l o g y
M o o r e a n d o t h e r s (1975)
0 Quaide a n d Oherbeck (1968, 1969)
D U n p u b l i s h e d da ta (1970, 1974)
0 W o l f e a n d o thers (1975)
A c t i v e se ismomet ry
A K o v a c h and o t h e r s (1971, 1972)
V Duenneh ier a n d o thers (1974)
Other
Shoemaker a n d o thers (1969 a b )
T !à 4 Range o f values IÑÑÑÑÃ
_L
w A p o l l o
- 0 100 200 300 400 500 600 700 800 900 1000 1100 1200 1300 1400 1500 1600
R E L A T I V E A G E , I N M E T E R S
FIGURE 12 -Correlation between median regolith thickness and relative age of surface
B 14 APOLLO 15 17 ORBITAL INVESTIGATIONS
TABLE 6,ÑCompariso of rrgolith thickness and relative of sur- face a,,)
2 0 5 ~ 2 5 Do 1 9 5 ~ 3 5 Do 1 9 0 ~ 4 0 Quaide and Oh~rbcck (1969) 170±2 no 255225 Moore and others (1975) 2?.5+61l U n ...... -" -
3%. 44"W 3-4 200^30 Quaide and Oberhpck (1968) 1%. 20"W 4 6 255 25 I)<>
Sinus ~ e d i , : 0 4"N 1"W 0 4-N, 1-w
Mare Tranquillitatus- 0 7"N, 24"E 2.6-N. 34"E
Fra Mauro: Apollo 14 site
Apollo 17 site
--
5 6 :i20?50 Quaide and Oheihck (1969) ti- 7 335±4 Do
10-36 1 , 4 0 0 ~ 4 0 Moore, unpiih data (1970) 5 6-8 1400540 Moore and others (1975) R- 12 365235 Monre, ~ lnpuh data (1974) 14 :365535 Wolfe and others (1975).
- - - - - - - - -
Active seismometer - - - - - - - - - -- - - Awllo 14 site - - - _.__8.2 1,4002400 Kovach and others (1971) Apollo 16 site --. _ _ I 2 550+50 Kovach and others (19721. Apollo 17 site .-- -, 8 5 365 "35 Duenn~bier and u t h ~ r s (1974)
Older surface 25"N, 25W ,1 =250 Moor? and others (19751
On flows - - - - - 10 200-' 20 On flows - - - - - - - - - - 8 160+20 on flows - - - - - 7 5 1x0 +4u
Est imates of regohth thicknesses made using Lunar Orhiters I1 and 111 high-resolution photopaphs
'%stirnates of regolith thicknesses made Using Apiillo Panoramic Camera and I,nn;ir Orbiter IV photographs which have con~parable resolutions These points not plotted in figure 12 because resolution affects thickness estimates (see Moore and others, 19751
plorer 35 bistatic-radar experiment indicates consider- able variation in thickness of the regolith. -
Some regolith thickness estimates are puzzling. The estimates a t the Apollo 14 landing site using active seismometry (8 2 m) and some crater morphology studies (5.6-8 m) are much lower than that predicted by the regolith-crater model of Shoemaker (Shoemaker and others, 1969b) Here a median regolith thickness ol 35 m (and a range of about 20-200 m) would be ex- pected instead of 6 to 8 m. A thick median regolith is in -
keeping with buried ~ r a t e r s - ~ e a t e r -- - than 500 rn across - - p- --
a t th&-~F&fi; 14 site, &>Jh Triplet, a cenmrmk crater 90 m a c r o - w n d early estimates of regolitb thickness (10-36 m, H. J. Moore, unpub. data, 1970) ~ s t i m a t e s % f X h ~ g o l l X ~ i - t 1 ^ ^ c ~ ~ 6 s ~ Z f " T h i p o l I 6 1 > site vary, less than 8.5 in (active seismonietry), 8- 12 rr (crater morphology), and 14 m (crater ejecta morphology). Regolith tlncknesses on the Imbriurr flows measured ukmg thecrater-morphQloey p - technique -- -- are Eea-S- 10 m) than onthe surface on --- which t h e ~ are sup%*~ecn^niyilncrare comparable to the thick L- -- ness o f t h e flows (M~ore-and'S~ha&r, 1975) rathei -- - than the regolith on the flows. Indeed-, relative age date
ndicate that the regolith on the Imbrium flows should )e near 2-4 m.
B I S l A 1 I( RADAR K1'SUI.T.S
With time, the lunar plains should become rougher jecause the number of craters increase with continued neteoroid impacts. If craters on lunar plains are the :hief factor producing surface roughness, one would expect a positive correlation between relative age and independent estimates of surface roughness. This is the ;ase. The bistatic-radar experiment (Howard and Tyler, 1971, 1972a, 1972b; and Tyler and Howard, 1973), which is discussed more fully below, provides independent estimates of surface roughness a t two scale lengths. Two wavelengths were used, 13 cm (S- band) and 116 cm (VHF), which measure surface roughness a t scale lengths between 10 and 250 wavelengths, or scale lengths comparable to or less than most D, values reported.
Surface roughness obtained from simple measures of radar echo broadening are expressed as root-mean- square (rrris) slopes, which increase with increasing roughness of the surface. Correlations of the rms slopes with relative ages along and near the bistatic-radar subspecular tracks for Apollo 14,15, and 16 (Moore and others, 1975, 1976) show they are directly related, al- though there is considerable scatter (fig 13). The missions are plotted separately because of differences in roughness estimates between missions.
The large amount of scatter in the results (fig. 13) may be the result of experimental error for both the radar and relative ages, contribution to surface rough- ness other than craters, and unknown causes
Relative ages of lunar plains and craters yield four significant results: (1) Two major events, accompanied by the production of a large number of craters, reset the crater-age clocks of many surfaces over the entire Moon prior to 3.84 b.y. ago; (2) the flux of objects pro- ducing relatively small craters (less than 1 km) was relatively higher between 3.2 and 3 84 b.y. ago than i t was after 3.2 b y. ago, and the flux of objects producing relatively small craters may have increased slightly in the interval from I b.y ago to the present; (3) outpour- ings of lava to produce the dark mare plains of the Moon extended to more recent times than indicated by samples returned from the Moon; and (4) great ex- panses of young mare plains are found on the west limb of the Moon in Oceanus Procellarum and in western Mare Imbrium, whereas expanses of old plains are found in Mare Tranquillitatis near the east limb of the Moon.

LUNAR REMOTE SENSING AND MEASUREMENTS B15
LU a 4 -I 0 w z < Ill =: I- w 0 a 0 0 B: w 0 0 w z I- - 4 - ^ '0 Y $ 4 (J Ill z - I L)
A
A
AAÃ
Apollo 14
,: .-:.. A 13-cm radar (S-band)
. 116-cm radar ( V H F )
. Apollo 15
A 13 cm radar (S-band)
1-â 116 cm radar ( V H F ) -
0 I I I t I I I I I I
A.
A
Apollo 16
A 13-ctn radar (S-band) i . 116 cm radar ( V H F )
I I I I I I I t
100 300 500 7 00 900 1100
R E L A T I V E AGE, IN M E T E R S
FIGURE 13 -Bistatic-radar roughness (root-mean-square slopes) and relative ages of units along and near the Apollo 14, Apollo 15, and Apollo 16 subspecular tracks
There are a number of questions related to the two major events, represented by D, values near 540 m and above 1,000 m, that occurred before 3 84 b y ago The first question is in regard to time: Do the relative ages actually represent two contemporaneous events or two episodes of penecontemporaneous events? Radiometric ages representing metamorphism of lunar highland samples indicate the events occurred within a rela- tively short interval of time from 4 0 to 3 85 b.y ago (Tera and others, 1974, Turner and Cadogan, 1975), and stratigraphic relations- the superposition of mare material on light plains-show that the last major event occurred before the formation of the maria, thus confirming that the events occurred within a short interval of time. Within the limits of measurement, relative ages can be interpreted as representing two
iistinct events occurring at one time within a few lours or days or so. The hiatus in relative ages between 9, values about 600 111 and above 1,000 in indicates a aeriod of normal, very low activity. On the other hand, :he limits of measurement of relative age are so large that they may represent episodes lasting tens of mil- [ions of years; but the period of normal activity re- mains. The time the last episode ceased is fixed to a sinall interval between mare formation and the forma- tion of the formation of the Orientale basin. Additional svidence for the synchronous occurrences of at least two major events is found in comparisons of crater fre- quency distributions obtained by independent observ- srs (fig. 14) Crater frequency distributions obtained for basin-related geologic units within the Orientale basin (Ulrich and Saunders, 1968; Neukurn and others, 1975) are the same as those for the ejecta on the flank of the Orientale basin (Boyce and others, 1974). These crater frequency distributions for Orientale are nearly the same as those for light plains of intermediate age (Cayley plains) far distant from the Orientale basin and its ejecta (Grudewicz, 1974-light plains near Hyginus Rille and mantled ones on the Aristarchus Plateau; Neukurn and others, 1975-light plains of the Apollo 16 site, Boyce and others, 1974-light plains in Albategnius, Ptolemaeus, and those of the Apollo 16 site). Frequency distributions of craters smaller than 3 to 5 kin on the flanks of the Imbrium basin in the Montes Apennirius (Neukum and others, 1975a) are similar to those for Orientale and light plains of inter- mediate age, and frequencies of craters larger than 3-5 krn are relatively higher than those of Orientale. This suggests that the degraded appearance of parts of the Imbrium ejecta and local partial resetting of the crater age clocks in the Montes Apenninus could have been due to the Orientale event, which destroyed craters smaller than 3 to 5 krn but not the larger ones
The crater frequency distribution for the Fra Mauro Formation (Neukum and others, 197%; Boyce and others, 1974; Soderblom and Boyce, 1972, Swan11 and others, 1971) matches the distributions of the widely scattered old light plains in Meton (Boyce and others, 1974). Although scarce, they could represent vestiges of evidence offered by craters for the Imbrium event.
Some crater frequency distributions may indicate other earlier events on the Moon. The distribution in Albategnius is one such example (fig. 14). Here, the frequency distribution of craters greater than 2.3 km exceeds that for the Fra Mauro Formation and indi- cates an older surface for which craters smaller than about 1.4 km were obliterated and the crater-age clock was reset at the time the Orientale basin formed Evi- dence for this older surface and still older ones are seen in the histograms comparing the ratio of unshadowed

< I I- a. LU I- <t w a: u ffl cr w 1- w 2 5 0
1 I- 3 ffl a. w I- < a 10 0
APOLLO 15- 17 OItBITAI, 1NVI-;S'l'IGA'l'10NS
CRATER DIAMETER, IN M E T E R S
FIGURE 14 -Size frequency distributions ol craters for selected lunar areas: Montes Rook Formation (R), light plains material oSOrientale (C), Apollo 16 landing site (D, N, A), Vallis Schroteri Formation (S),
Hyyinus light plains (II), F ra Mauro Formation at the Apollo 14 site (indicated by leader, F), floor of Albategnius (A), floor of Ptolernaeus (P), floor of Mendeleev (M), and floor oSMeton (indicated by leader) Data are Ikom Ulrich and Saunders (H, i:, 1968). (Irudewiu (S, H, 1974), h y c e and others (fia Mauro, Meton, 19741, and Neukurn and others (1975a) (N, A, and F) Steady-state curve a f t e r Trask (1966). Curves for younger Cayley-age light plains (S, 11, D, N, A, A, and P ) are similar to Orientale (R, C,) and very different from Irnbriuln W t a (F, F ra Mauro) and older light plains (M, Meton), Bends in curves of Albategnius and pblemaeus at about 2-3 km are int,erpreted to reflect old partially buried craters. Error bars excluded for
clarity
to shadowed craters (fig, 4) where, for Albategnius, a mode occurs a t diameters near 1.8 km Still larger craters are preserved in Meton (fig. 4 5) and Mendeleev (Neukum and others, 1975a).
A second question is what caused the ma,jor events There are a number of possibilities for resetting the crater age clocks represented by D , values near 540 m and above 1,000 m in the interval from about 4.0 to 3.84 b y . ago, some of which are: A. Exogenic
1. Tidal interactions between the Moon and Earth giving rise to seismic erosion or tectonism.
2. Anomalously large episodic increases in the flux of objects producing primary impact craters
3. Some unknown cosmic event. B. Endogenic
1. Lunar seismic erosion or tectonism and vol- canism.
C. Exo-endogenic 1. Tectonism or seismic erosion generated by the
impacts producing the large basins, 2. Anomalously large momentary increases in
flux of objects ejected from the large basins producing secondary impact craters that erode and smooth pre-existing terrain.
3 . Dynamic deposition of ejecta from large basins producing thick deposits that smooth pre- existing topography-such deposits are clearly continuous around the basin margins to, on the average, 2.38 basin radii from the basin center and are probably discontinuous beyond
Of these possibilities, the exo-endogenic ones appear to be the most likely, and all three possibilities in this category almost certainly contributed to some degree. Seismic erosion induced by tidal interactions between the Moon and Earth seems unlikely because such in- teractions would probably affect the entire Moon and would not permit the preservation of the scattered old light plains in some places but not in others. Anomal- ously large episodic increases of the flux of objects pro- ducing primary craters is possible but unlikely because of the hiatus. Although there is weak evidence for changes in flux from 3.84 to 3.16 b.y. ago (figs, 8, lo), no hiatus is observed in this interval. Additionally, the preservation of the scattered old plains in some places but not in others is difficult to explain with this pro- cess. Evidence for extensive endogenic tectonism and volcanism from about 4 0 to 3.84 b,y ago is practically nonexistent Indeed, evidence for extensive fracturing and faulting of the Orientale and Imbrium ejecta blan-
kets is scarce, and most highland rocks sampled by Apollo are shock-metamorphosed nonvolcanic rocks Thus, a t this time, exo-endogenic processes are the best mechanisms to account for the relative-age data.
Exo-endogenic processes offer an explanation for the data on relative ages and crater frequency distri- butions that is consistent with other photogeologic evi- dence Dynamic deposition of ejecta from basins that smooth preexisting topography and reset the crater- age clocks has certainly occurred near the rims of the larger basins (Moore and others, 1974, Chao and others, 1973, 1975) I t is also demonstrable that ejecta producing large secondary craters has produced new surfaces (Uberbeck, Horz, and others, 1975). Less cer- tain are the roles of seismic erosion (Schultz and Gault, 1974), dynamic deposition of ejecta from the basins producing continuous layers a t very large distances (Chao and others, 1973, 1975), small secondary impact craters produced by basin ejecta that form smooth sur- faces underlain by mixtures of ejecta and local mate- rials (Oberbeck, Horz, and others, 1975), and fluting and furrowing by the impact of concentrations of ejecta as far distant as the antipodes of the basins (Moore and others, 1974). The contributions to the formation of smooth plains cannot be separated a t this time. Photo- geologic evidence does support the hypothesis that ejecta from Imbrium produced fluting and furrowing a t the antipode of Imbrium near Mare Ingenii, where Im- brian age furrows and flutes are subparallel to one another, regardless of the magnitude and orientation of local slopes. The seismic erosion model may be least likely because i t is difficult to imagine how some areas, such as in Mendeleev and Meton, could have escaped the pervasive effects predicted (Schultz and Gault, 1974), whereas nearby plains did not. The known ir- regular patterns of ejecta from craters and basins per- mit the survival of local areas
The flux of objects producing small craters clearly decreased after 3.15 b.y. ago, and calculations using the reported D, values and ages (without considering the error bars) indicate a decrease in flux to the time the crater Copernicus formed. Subsequently the flux increased somewhat The relatively large flux from 3.68 to 3.16 b.y. ago is probably real because calculated fluxes are large for smaller intervals throughout that interval Assuming the worst possible errors, calcula- tions indicate that the flux could have been nearly con- stant from the time of mare formation to the present Our estimates of the flux for North Ray are consistent

B18 APOLLO 1 5 17 ORBITAL INVESTIGATIONS
with Apollo results from the passive seismic experi- ment (Dunnebier and others, 19751, for which estimate errors are just as severe as ours An order of magnitude estimate of compatibility between the flux of objects determined by us for North Ray and the estimate from the passive seismometer can be calculated. Ranger VIII struck the lunar surface with a kinetic energy of about 1016 l 4 ergs, producing a crater about 13 m across (Moore, 1968). Assuming diameter is proportional to the cube root of the energy of the object producing the crater, neglecting the effect of angle of impact, and using a velocity of 15 km/s (Zook, 1975), we calculate the mass of an object producing a crater 1 in across to be 5.6 g. When the mass is substituted in the preferred equation derived from the passive seismometer data (Duennebier and others.1975). the flux becomes 10"' 961
craters/km2 yr Since North Ray is about 50 m.y. old, the predicted net accumulated flux for North Ray be- comes 1011 '' craters/lOb km2. This value is somewhat larger than the measured values for North Ray of 1011 236 to 1011 326, but i t is within a factor of 3. The mass of a meteor traveling a t 15 kmls that is required to produce a 1 m crater (14 g), estimated from data on missile impact craters (Moore, 1976, 1971b), and the same type of calculations as above yield a net accumu- lated flux of 10"' craters/10*'km2. This is smaller than the lower value of K for North Ray but is within a factor of 3. From the foregoing discussion it is apparent that calculations could be made to yield better ag-ree- ment between the passive seismic preferred estimates of the flux and the measured one
Scaling laws for impact crater formation that result in crater frequency distributions for which the cumula- tive frequency is proportional to the inverse cube of the diameter (equation 1) can be satisified for conditions of constant projectile velocity by
Such a result suggests that scaling laws developed from studies of missile impact craters (Moore, 1976) might be more appropriate for small lunar craters than those produced by experimental impacts with sand in the laboratory (Oberbeck, 1970; Cook and Mortensen, 1967).
M A R I A
Outpourings of lava to produce the dark mare plains of the Moon extended to more recent times than indi- cated by samples returned from the Moon. The exact duration is difficult to determine because of the errors in DL values and the general flattening of the D, -time curve after 3.16 b.y. (see also Neukum and others, 1975b). For example, DL values of l80±3 could repre-
sent ages of 3.15 to 2.5 b.y., although the midpoint corresponds to 2.65 b.y. When this error is combined with the errors in both radiometric age (3.16±0.0 b.y. and Dl (215245) for Apollo 12, the possibility of overlap is clear. On the other hand, the consistent repetition of low relative ages or DL values in Oceanus Procellarurn gives a strong indication that there is, in fact, young mare material there that may have formed as recently as about 2.5 b.y. ago, some 0.6 b.y. after the Apollo 12 mare basalts. Other evidence supports this conclusion: (1) Infrared eclipse temperatures (Shorthill, 1973), which are discussed below, are uniformly large in Oceanus Procellarurn, suggesting the presence of large concentrations of rocks and thin regoliths which would be expected for young maria; (2) Lunar Orbiter images show a large number of blocky craters in Oceanus Pro- cellarum; (3) analyses of craters imaged by Surveyor 1 indicate that the regolith is, in fact, thin compared to that in other maria (Shoemaker and others, 1969b); and (4) the bistatic-radar results indicate smoother, less cratered surfaces in Oceanus Procellarum than in other maria (Moore and others, 1976).
WES I'F RN MARIA
The occurrence of vast expanses of young mare ma- terials in Oceanus Procellarum is an important obser- vation but the reason for their occurrence there is not understood. The surfaces of the maria in Oceanus Pro- cellarum are higher than those of earlier formed maria elsewhere on the Moon (Head, 1976). Larger hydrosta- tic heads of deeper magma sources would be expected in a lunar crust that thickens with time, but the reason why earlier formed maria a t lower elevations were not also flooded by younger lava is not certain. I t seems that some additional factors, perhaps inhomogeneities in the lunar crust or structural factors. were involved-
LUNAK GRAVITY A N D 7F.CTONICS
Among the most interesting' and significant results of the lunar space program was the discovery of large positive gravity anomalies on the Moon and their asso- ciation with circular maria. The mass concentrations or "mascons" responsible for the gravity anomalies were first revealed during' doppler tracking of space- craft in the Lunar Orbiter missions by Miiller and S.jo- p e n (1 968) of the Je t Propulsion Laboratory. I11 effect, the spacecraft acted as an accelerometer, responding to mass variations on the Moon by changes in velocity along its orbital path. The orbits, however, did not ap- proach closer than 100 krn to the lunar surface in the

LUNAR REMOTE SENSING AND MEASUREMENTS B19
early missions and consequently afforded inadequate resolution for the gravitational definition of many small to moderate-size topographic and geologic fea- tures. For example, the gravity response of a crater such as Copernicus showing a negative anomaly of -57 milligals (Sjogren and others, 1974a) a t 20 km space- craft altitude would only have a value of about -8 milligals a t 100 kin altitude. Moreover, the much smaller anomaly a t the higher altitude would be dis- persed over a radial distance several times as great During the later Apollo missions, nearside perilune al- titudes were lower, and relatively minor features such as some small craters, mare ridge systems, and certain mountain chains appeared a s "free-air" gravity anomalies The gravity data together with accurate elevations established by laser and radar altimetry to- gether with photogrammetric methods have shown that many structures of basin size and smaller are not isostatically compensated. The large basins, however, have probably passed through cycles of combined iso- static and hydrostatic changes ranging from (1) an un- compensated negative stage when first formed, through (2) a period of equilibrium resulting from updoming of the mantle and basalt flooding, followed by ( 3 ) an overly compensated positive stage as basalt filling progressed and the crust stiffened enough to maintain the load. These stages are illustrated by the Urientale basin. The smooth mare-filled central part of Orientale basin is a positive anomaly, whereas the rough outer floor of the basin is strongly negative. In all other lunar near-side basins the basalt filling has progressed much farther than a t Orie~itale, and the negative anomaly associated with the depression has virtually disappeared. These basins are large mascons. Yet, for the most part, gravity variations over large regions of the Moon are relatively mild compared with Earth, and equilibrium generally prevails (Kaula, 1975).
The following discussion will describe methods used in the analysis of gravity data, some of the results ob- tained from these methods, and relations between gravity anomalies and tectonic features, mostly on the near side of the Moon.
\ ( I 1 HODS 0 1 \ \ \ I '1 \ IS \ \ I ) \PPI I( \ I I O \
The gravity field a t any particular point depends upon the mass distribution around the point. I t is a direct function of the increniental masses and an in- verse function of the squares of the distances of the incremental masses from the point Thus, topography and rock units with varying densities produce varia- tions in the gravity field or anomalies. The magnitudes of the anomalies produced by rock units, neglecting
topography and distance between observer and the sur- face, are a function of density, depth, size, and shape of rock units below the surface. Ambiguities in the iri- terpretation of gravity anomalies result from the iri- numerable variations possible in these characteristics. In some places, however. the shape of a gravity ario- maly, revealed either by contours or profile, may pro- vide constraints on the depth and configuration of the causative mass This is true for many of the positive anomalies associated with the mascon basins- For example, the flat top of the gravity profile for the Nec- taris Basin mascon and the break in slope on the grav- ity profile across Mare Serenitatis together with the circular outlines of the anomalies indicate riear- surface, disk-shaped structures (Sjogren and others, 1972a, b) Using the shapes of the anomalies, Sjogren and his co-workers (19724 have shown that the mass distribution and hence thickness of the nearside mas- cons is quite uniform, their thickness may range from about 2.7 km to 8 km depending on whether the origi- nal basin was isostatically compensated or not.
In other areas, gravity observations obtained a t dif- ferent spacecraft altitudes have been useful in deter- mining the size of the source mass with less ambiguity than from single level data alone (Scott, 1974). The variables of density, thickness, depth of a thin cyliridri- cal or disk-shaped object such as a mascon, for exam- ple, are effectively eliminated from the computations provided differences in orbital altitudes are large rela- tive to body thickness.
All large craters on the near side as well as the Orientale basin on the west limb of the Moon are asso- ciated with negative free-air gravity anomalies (S.jo- gren and others, 1974b, c). Where topographic control is poor, as a t Orientale, the gravity data can be used to estimate the mass deficiency of the cavity and thus, indirectly, obtain a n approximation of the amount of material ejected (Scott, 1974). In areas where topo- graphic maps are reliable, theoretical or Bouguer grav- ity values due to the cavity can be calculated from cra- ter geometry. The difference between the observed (free-air) and theoretical gravity (Bouguer) values is a measure of the anomalous gravity (Bouguer anomaly) attributable to either a mass deficiency or a mass ex- cess associated with the crater. A negative anomaly implies a mass deficiency unaccounted for by the crater void; it might result from a lens of brecciated material beneath the crater floor having a relatively low bulk density (Innes, 1961) A positive anomaly indicates a mass excess and could be caused by basalt flows on the crater floor or uplift of relatively dense subsurface material reflecting some degree of isostatic adjust- rrierit Many nearside craters ranging in age from Copernican to pre-Nectarian show little or no Bouguer

R20 APOLLO 15-17 ORBITAL, INVESTIGATIONS
anomaly; observed and theoretical gravity are nearly equal (Sjogren and others, 197%; Scott, 1974). I t fbl- lows that these lunar craters, like the rnascon basins, are not in isostatic equilibrium. The lunar crust must have been sufficiently thick or rigid to support their negative load since early in lunar history. These stres- ses amount to more than 800 kg/crri2 for the mascons associated with the circular basins (Sjogren and others, 1974b) and about - 900 kg/cm2 for a young crater such as Theophilus, described below.
This type of analysis is presently restricted to areas covered by the LTO series 1-250,000-scale maps, or to selected craters whose geometry has been well estab- lished by photog~amrnetric studies. An example of the application of the 1:250,000-scale maps to gravity studies is shown using the crater Theophilus. Only half of this crater is presently covered by the large-scale maps (LT007'7D2 and LT078Cl), but its total volume is probably reliably extrapolated as photographs show Theophilus to be nearly circular in outline and sym- metrical in shape A representative schematic topo- graphic profile across the crater is shown in figure 15. The cavity has a depth of 3 km with respect to the terrain beyond the raised crater rim material; its vol- ume is 13,723 km^ after subtraction of the space oc- cupied by the central peak. In order to determine the gravity effect of this void, the dimensions of a disk or cylinder having an equal volume are calculated. The radius of this disk, having a thickness equal to the depth of Theophilus (3 km), is 38.2 km. From these data, and assuming a crustal density of 3 0 g/cm3 (War- ren and Anderson, 1972), a peak gravity value of about - 180 milligals is obtained for the mass deficiency, This closely compares to an observed (filter corrected) value of -184 milligals a t spacecraft altitudes of 22-23 km (W. L. Sjogren, oral conlmun., 1976). Thus, the new, more accurate and detailed elevation control from the large-scale topographic maps together with observed gravity results suggest that Theophilus, like other lunar craters, has undergone little if any isostatic ad- justment.
As previously mentioned, gravity data can be used in some places to estimate the volume of craters and basins where topographic control is poor (Scott, 1974).
FIGURE 15 - Topographic profile of Theophilus
rhe Orientale basin on the west limb of the Moon is a pod example of the application of orbital gravity re- u l ts to volume and mass estimates in the absence of idequate topographic data. As Orientale is relatively roung (middle Imbrian) and well preserved norphologically, i t is the prototype of all lunar mul- iringed basins. For this reason a large amount of itudy has been directed toward the geology of the lasin, the thickness and areal distribution of its ejecta banket, and the mechanics of its formation (Head, 1974; Howard and others, 1974, Moore and others, 1974; Scott and others, 1977). Volume estimates are mportant to these studies; they were made by calculat- ng the mass deficiency from gravity data obtained by \pollo 15 and Apollo 16 subsatellites (Scott, 1974). Fwo methods were used for the computations and are iriefly summarized here. The first method employed a ;et of surface mass points (Sjogren and others, 1974b) which were calculated to produce the observed residual iccelerations of the spacecraft. The sum of the negative mass points was believed to correspond to the minimum amount of material ejected from the basin, [ri the second method, gravity profiles across a part of ,he basin were visually adjusted to remove the distort- mg effect of the central mascon. The negative anomaly value remaining more nearly reflected the mass (and volume) deficiency of the present basin, about 2x10" km3, than the first method using mass points. Other ipproximations of the volume of the basalt plug or dike w a r m s intruding the central part of Orientale are .ibout 3 x 10" km3. Thus the total volume of the original cavity, equivalent to the amount of material ejected, may have been about 5 x 10'' km3.
Sjogren and others (1974a) have developed a more sophisticated approach in the reduction of Apollo 17 gavi ty results. This method uses a dynamic solution in which real data and data simulated from a model are identically processed. It is an iterative procedure; the model, a n assemblage of point masses, is progressively improved to obtain a best fit of simulated accelerations with real accelerations. The method seems to provide the most accurate estimations of mass as i t accounts for vertical components of gravity, spacecraft altitudes, and filtering effects. Volume determinations of craters made from high-quality topographic maps together with accurate mass estimates obtained from dynamic solutions of gravity data could provide reliable bulk densities of the lunar crustal rocks.
Several attempts a t lunar gravity data reduction using a template method to obtain residual gravity values have been made but without noticeable success, Residuals were calculated from the difference between the observed gravity a t a point and the average value of the observed gravity within a large area around the

LUNAR REMOTE SENSI AND MEASUREMENTS B21
point In effect this is a filtering process which tends to enhance small gravity deviations that otherwise might be obscured by large regional variations. When this method was applied to lunar gravity maps, however, no significant anomalies were disclosed. This failure probably results from a combination of the following: (1) Spacecraft altitudes a re so high over most areas that minor variations in the gravity field due to local or shallow sources a re effectively filtered out, (2) Spacing of gravity control lines is too great for the effective use of residual templates having radii less than the line spacing, tha t is, small enough to amplify anomalies associated with such features a s rilles, ridges, volcanic centers, and some craters. Another residual procedure involves the visual adjustment of observed gravity profiles to smooth continuous curves approximating regional slopes. Departures from the regional curve are due to local effects, and the magnitude of these anomalies can be measured. This method was used in the analysis of the gravity profile across Montes Secchi (fig. 16).
On a broad scale, the near side of the Moon shows positive gravity values except for a region extending around the central highlands in a broad semicircular arc (Sjogren, 1974, plate I) . This generally negative region consists of large basalt-filled areas within Maria Fecunditatis, Tranquillitatis, and Nubiurn a s well a s the highlands north of Mare Vaporum including a part of the Montes Apenninus and the highlands around Rima Hyginus and Rima Ariadaeus. As the negative anomalies include both high and low terrain, they are not simply related to the Bouguer effect, and their cause is not clear. The largest of these anomalies, in Mare Nubium, has a value of less t han -40 milligals. I t is centered along the northwest extension of Rupes Recta, a large fault scarp transecting Irnbriurn mare materials and having a vertical displacement of 410 m (EIolt, 1974). The present scarp is believed to be rela- tively young but probably represents recurrent move- ment along a n older fault. Possibly this area has been undergoing uplift in repeated adjustments toward equilibrium which i t has not yet reached. On a smaller scale, major mare ridge systems such a s those in Oceanus Procellarum show positive gravity anomalies, whereas large rilles, except for Hyginus and Ariadaeus as noted above, have no noticeable gravity response (Scott and others, J 975). The linear rilles a re believed to be grabens formed by extension of the lunar crust, The absence of associated gravity anomalies indicates t ha t these structures have not produced any substan- tial lateral discontinuities in crustal density distribu-
t ion Aside from the mascons associated with mul- tiringed basins, the largest positive anomaly on the lunar near side occurs over Rupes Altai, the great fault scarp forming the outer ring of the Nectaris Basin (Sjogren, 1974, plate I; Rowan, 1971) Although the scarp rises more than 1,000 m above the basin floor, i t is ridgelike in profile, and its height decreases to about one-half within about 10-20 km of its crest line. Thus, the average difference in elevation on either side of Rupes Altai is estimated to be about 500 m. The mag- nitude of the positive gravity anomaly attributed to the uplift is difficult to ascertain because of the large adja- cent mascon associated with the Nectaris basin. How- ever, a gravity difference of about 60 milligals appears to be a reasonable estimate from Sjogren (1974, plate I) The calculated gravity effect of a fault with 500 m vertical offset is about 63 milligals, using the formula Ag - 2 -nyat (Nettleton, 1940) and a density (o-) of 3.0 glcm". If the fault extends to and, in like degree, dis- places mantle material of density contrast 0 3 g/cm3, then 6.3 milligals should be added to the calculated gravity. This would increase the total anomaly to nearly 70 milligals but well within the probable range of the measured or observed value Here again, isosta- tic adjustment appears to be nil.
Gravity and topographic profiles constructed across the Montes Secchi, a highland ridge between Mare Fecunditatis and Mare Tranquillitatis, a re shown a t reduced scale in figure 16. Elevations increase to the northwest about 1,200 m between the two maria, but local relief of the Montes Secchi is only about 500 rn. Gravity also increases northwest to the Montes Secchi, which have a residual value of about 15 milligals above the regional,, The anomaly is somewhat oval in outline (Sjogren and others, 1974b, fig. 7) and so may be ap- proximated by a disk for theoretical computations. The dimensions of this disk, having the same volume as t ha t calculated for the near-spherical segment of the
EXPLANATION
t Loca l rel ief
Ag Grav i ty residua! ,n N W ff l "1
0: Montes Secchi
,gravity 5 0 -
E l e v a t i o n \- 4 0
L O N G I T U D E
FIGURE 16 -Topographic and giavity profiles through Monies Secchi

B22 APOLLO 15-1 7 ORBITAL INVESTIGATIONS
Montes Secchi in figure 16, are: iadius 30 km, thick- ness 250 m Assuming a spacecraft altitude of 15 km (Sjogren and others, 1974b, fig. 1) and density of 3 0 g/cnY1, no isostatic compensation appears to exist
Recent studies of long-term perturbations in the or- bits of lunar satellites has resulted in gravity maps of the far side (Ferrai'i, 1975; Ananda, 1975) These maps generally show negative anomalies to be associated with multiringed basins; thus they represent mass deficiencies lather than mascons This difference is at- tributed to the topographic asymmetry of the Moon, with the higher parts of the far side being unfilled by the hydrostatic flow of male basalts (Fen'ari, 1975) Although the details of the gravity field on the far side is known only within bioad limits, calculations of the Bouguer anomaly for the Mendeleev (Fenar i , 1975) and Hertzsprung basins (Scott and others, 1977) indi- cate that a large amount of isostatic compensation may have taken place As these basins contain little or no mare basalt, theii approach to a state of equilibrium reflects deep-seated uplift of mole dense material, probably the mantle This uplift is indicated on the floor of the Oiientale basin by concentric and radial fissures attiibuted to updoming before the extrusion of mare basalts (Scott and others, 1977)
The fiist large mass concentiations on the Moor were discoveied during the eaily Lunai Orbiter flights The resolution of these mascons was enhanced by the lower altitude Apollo missions, and otliers were founc as well Aside from the basin-associated mascons many other structures on the Moon including large ciateis and positive ielieffeatures such as Rupes Aita and Montes Secchi are not isostatically compensated Ovei broad areas, however, lunar gravity relief i: small compared with that of Earth
Giavity observations obtained at different heights above the lunar suiface have been useful in reducin~ the number of assumptions for determining the shape of buiied masses Also, the large-scale LTO sei ies map: with their excellent topgraphic control allow accurate volume calculations of selected featuies and hence their probable mass and resulting gravity anomaly value Reliable elevations together with a refinec method of reducing gravity data developed after the last Apollo missions should yield good estimates o bulk densities of lunai rocks In those areas w11eie top ographic data is poor, such as a t Orientale, gravity results give acceptable estimates of crater volume tha' provide constraints for ejecta distribution studies
Although all large craters on the near side of th( Moon are negative gravity anomalies, some high aiea:
ire also negative and the cause is not everywhere ap- aarent. Mare ridge systems are generally positive, but nany rilles show no gravity effect
On the lunar farside, preliminary calculations indi- :ate that isostatic compensation of large basins may be 'uither advanced, but more accurate data are needed to aursue these studies In the future, low-altitude polar ~rbi ters operating in conjunction with subsatellites nay provide this information
LUNAR MAGNEIISM
The discovery of stable components of natural rema- nent magnetization (NRM) in Apollo 11 samples (Doell and others, 1970; Helsley, 1970; Nagata and others, 1970; Runcorn and others, 1970; Strangway and others, 19701 was one of the most unexpected and sci- entifically important findings of the Apollo program Before Apollo, magnetometeis aboard Luna 10 (Dol- ginov and others, 1966) and Explorer 35 (Sonett and others, 1967) obtained no evidence of a global lunar magnetic field, implying a value of less than 10L'gauss cnY' for the lunar dipole This value is five orders of magnitude less than that fbr the geomagnetic dipole (Fuller, 19741,
Lunai surface magnetometers placed on the Moon starting with Apollo 12 monitored surprisingly high local surface fields of up to several hundreds of gammas (Dyal and others, 1970, 1972) These high fields a l e thought to be caused by remanent magnetization of local rocks. The size, distribution, and magnitude of the anomalies were further defined by the mag- netometers canied on the Apollo 15 and 16 subsatel- lites These experiments provided an additional sur- prise by revealing steady remanent fields associated in part with surface features and detectable a t heights of approximately 100 km (Coleman and others, 1971, 1972) The Apollo subsatellite magnetometel data also revised downward the present lunar dipole field to a maximum of 6x1Ot-" gauss
An electron scatteiing technique fbr high-resolution mapping of the lunar iemanent magnetic field was de- veloped by Lin and others (1975a, b ) Using low-energy electrons from 14 keV to 0 5 keV, they showed that extremely weak renianent fields (to 0 1 gamma) can be mapped with a resolution of about 15 km to 40 km
In the present discussion, I will concentiate on the geologic relations of available lunar magnetic data and will not detail the physics of lunai orbital, lunar sui- face, 01 lunar sample magnetic data beyond the point necessary for a basic geologic comprehension The reader is referred to an excellent summary article by Fuller (1974)

LUNAR REMOTE SENSING AND MEASUREMENTS B23
The first indication of geologically important varia- tions in the lunar magnetic field came from the Apollo 15 and 16 subsatellite magnetometer data that re- vealed stronger fields and more variability in the rern- anent magnetic fields over the far-side highlands than over the near-side maria In addition, strong magnetic anomalies were found associated with or near large far-side craters such as Milne, Gargarin, Pavlov, Van de Graaff, and old basins such as Korolev and Hertzsprung (Coleman and others, 1971, 1972). The strongest and most obvious feature found in the mag- netic records was correlated reasonably well with the crater Van de Graaff (fig 17). Attention has focused on the Van de Graaff anomaly because of its larger mag- nitude and the fact that i t is the central anomaly of a group of anomalies distributed somewhat symmetri- cally about 180Â longitude. In addition, this group of magnetic anomalies correlates well with a topographic low measured by the Apollo 15 laser altimeter (Rober- son and Kaula, 1972) and a region of high gamma-ray emission (Arnold and others, 1972b) (figs. 18, 19). It was concluded that the Van de Graaff magnetic ano- maly is related to a major depression centered a t 180Â longitude, perhaps representing an old, unfilled basin of which there is no surface trace.
Lin and others (197%) have presented preliminary results of an electron scattering technique to detect and measure weak and small-scale lunar magnetic fields. The technique makes use of the fact that solar and interplanetary charged particles are easily scat- tered in moving to a region of increased magnetic field strength as they approach the Moon. The particles, in effect, provide a probe along the external magnetic field line down to the lunar surface which is sensitive to increases in field strength along its path If no sur- face magnetization is present, the particles are guided by the external magnetic field into the lunar surface, where they are absorbed (except for less than 5 percent which are Coulomb backscattered from the surface material) If remanent magnetization is present, the total field strength increases as the particles enter the region of remanent magnetization A fraction of the particles scatter back with an intensity that increases with the strength of the total surface field
All of the remanent field regions found by the Apollo subsatellite magnetometers (Coleman and others, 1971,1972) were found to scatter the electrons strongly (over 50 percent). In addition, a number of new regions of remanent magnetization were found using the higher resolution electron scattering technique. Mag- netic scattering effects have been observed for elec- trons by the Apollo 15 and 16 Particles and Field Sub- satellites, with most observations being made with 14
keV electrons (Lin and others, 1975b). A limited amount of high-resolution data were also collected using the lower energy 0.5 keV electrons (Lin and others, 1975b) (fig. 20).
Starting' with the Apollo 12 mission, lunar surface magnetometers observed surprisingly high NRM (nat- ural remanent magnetism) ranging from a low of 6 gammas a t the Apollo 15 site to a high of 313 gammas a t the Apollo 16 site (Dyal and others, 1970, 1972). These fields are known to be due to remanent mag- netism of the lunar crust because as the Moon orbits the Earth, i t encounters a variety of magnetic envi- ronments, including a zero-source-field region that permits separation of the induced and remanent fields.
In order to better understand the nature and origin of the lunar surface NRM, extensive magnetism studies of the Apollo samples have been reported (Run- corn and others, 1970; Nagata and others, 1970, 1971, 1972, 1973, 1975; Pearce and others, 1972, 1973, 1974; Griscorn arid others, 1972, Collinsori and others, 1972). An NRM of between 10 and 10 gauss cm-' g ' has been reported in the samples of breccia which carry the strongest and most stable NRM.
These studies have confirmed that the most impor- tant ferromagnetic constituent is metallic iron, in some cases alloyed with a few percent of nickel or cobalt. Other ferromagnetic and ferrirnagnetic phases have been reported, but iron and iron-nickel alloys predorni- uate (Duller, 1974). The soils and breccias contain from a few tenths of a percent to 1 percent by weight metal- lic iron, but the feldspar-poor mare basalts contain only about one-tenth this amount In both the soil and unmetamorphosed breccia, the iron is predominantly in the form of extremely fine (about 100 A) single do- main particles and spherules, which occur in impact- generated glass. They appear to increase in content with maturity of the surface (Pearce and others, 1974). In well-annealed breccia the iron is somewhat coarser and multidomain. The high abundance of almost pure iron in breccias and fines is most likely to be the pro- duct of breakdown of fayalite, ulvospinel, ilrnenite, and other minerals by severe meteoritic impact (Nagata and others, 1974).
O R I L I \ 0 1 I l T \ / \ R \ lAG\L 1 ISM
The NRM of the samples strongly argues for the existence of ancient fields on the order of 10,' to 10' gammas in which they acquired their magnetization, and the variability of the sample NRM fields (ranging from hundreds of gammas to an oerstedÑ1O,OO gam-
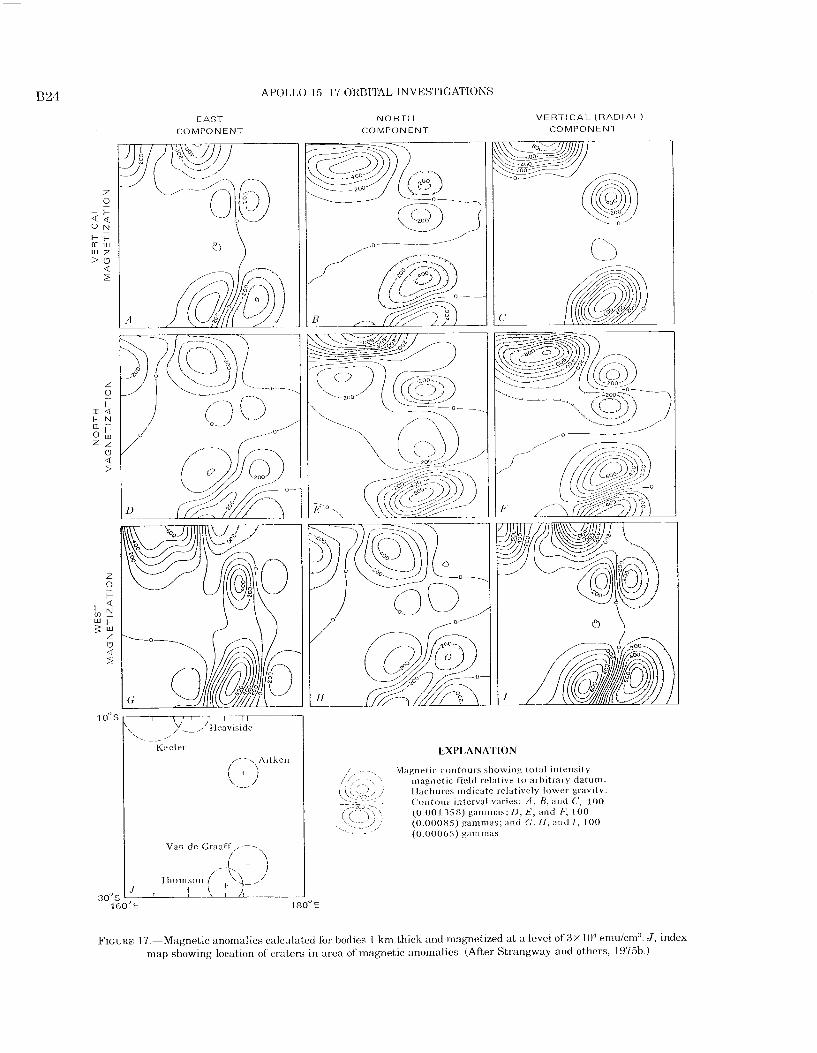
APOLT.0 1 S-17 ORBITAL INVESTIGATIONS
EAST
COMPONENT
Van d e Graaff, -1, /
r t10 111 SOII / ' \ ,
\ t -1-'
160 E 1 ;
N O R T H
COMPONENT
V E R T I C A L ( R A D I A L )
COMPONENT
EXPLANATION
Miignetic con tou r s showing to ta l intensity /4,:,,<\ rnagr~et ic +.ield relative t o arb i t rary d a t u n ~ .
, , Hachures indicate relatively lower gnivity - --.-" C'ontour interval varies: A . B, ;ind C. 1 0 0
(0 0 0 1 358) gammas; 11, E , and / - 1 0 0
\ , . , (0 0 0 0 8 5 ) gammas; a n d C;, H , a n d I , 1 0 0 *--. ( 0 . 00065 ) gammas
FIGURE. 17 -Magnetic anomalies calculated for bodies 1 km thick and magnetized a t a level o f 3 x 10' emulcm' J , index map showing location of craters i n area of magnetic anomalies (After Strangway a n d otheis, 1975b

LUNAR REMOTE SENSING; AND MEASUREMENTS B25
Procel larum S iny th i i
I7 3.3 k m me;in Iun;ir r;ninis
I Apennines
Y' radius
FIGURE 18 -Apollo 15 laser altimeter results (from Roherson rind Kaula, 1972)
EXPLANATION
n I es-, than 76 a 76 t o 79 s 79 5 t o 8 3 counts per counts per counts per second second second
FIGURE 19 -Apollo 15 and 16 relative gamma-ray emission intensities for lunar radioactive elements (from Arnold and others, 1972b) One degree of latitude is 30 kin
mas) suggests a complex origin of these fields The sur- face fields observed by the Apollo surface magnetome- ters revealed coherent sources of rernanent magnetiza- tion on the lunar surface, whereas the Apollo subsatel- lite data give evidence of an at-depth homogeneous magnetization of the lunar crust on a scale even greater than that suggested by the surface fields (Ful- ler, 1974). It is not yet clear whether a single explana- tion will account for all aspects of these phenomena or whether multiple explanations will be necessary
Many theories to date require a planet-wide field that induced the observed magnetization of the rocks and has since disappeared. Such a field has been at- tributed to external fields such as the solar wind or the
terrestrial field; and to internal origin, such as the pro- posed lunar dynamo (Nagata and others, 1972; Run- corn and others, 19'71) Additional models have also been proposed that assume that the whole Moon, or a large part of it, was magnetized early in its history to give rise to a primitive remanent field that is recorded in the lunar rocks. Later still the primitive renlanent field is thought to have been thermally demagnetized (Urey and Runcorn, 1973).
The origin of the large variability in lunar NRM has also been attributed to transient local fields generated by high-energy impacts (Dunn and others, 1972; Nagata and others, 1970, Cisowski and others, 1972).
The defenders of the lunar dynamo hypothesis, led by Runcorn (1975) and Collinson and others (1975), report measurements of paleointensities of the lunar field for samples of various ages, leading to the conclu- sion that the ancient lunar surface field had a strength of 1.2 oersteds some 4.5 b.y. ago-a value nearly three times the strength of the Earth's present surface equatorial field. Opponents of this model argue that the lunar magnetism is a manifestation of purely local, surface effects such as impact processes, and that no global dynamo-driven ancient lunar field need be pres- ent. This school draws its strength from a number of observations. (1) Apollo subsatellite magnetometer measurements (Russell and others, 1974, 1975) and subsatellite electron scattering observations (McCoy and others, 1975) show that the lunar surface is mag- netized with a variety of intensities and scale lengths in an apparently chaotic manner; (2) analysis of moonquakes (Nakamura and others, 1974) and lunar electromagnetic sounding (Sonett and others, 1971) rule out the existence of a metallic lunar core larger than 350 km in radius-thus for a lunar dipole surface field of 1 2 oersteds the core surface field must have exceeded 150 oersteds, an impossibly large value; (3) the remanence mechanisms which can operate on the lunar surface are greater in number than those found in classical terrestrial rock magnetism (Wasilewski, 1974), and so the usual paleointensity methods may not be applicable (Fuller, 1974; Hoffman and Banerjee, 1975) and the lunar field intensities of Collinson and others (1975) may be suspect, and (4) "ground truth" results of the lunar portable surface magnetometer (Dyal and others, 1970, 1972) confirm the small scale sizes and variable intensities and directions of the lunar surface fields
Dunn and others (1972) have suggested that there may be a t least two processes effective in generating shock-associated remanent magnetization. First, there may be remanence produced during the actual shock, and second, there may be remanence produced during
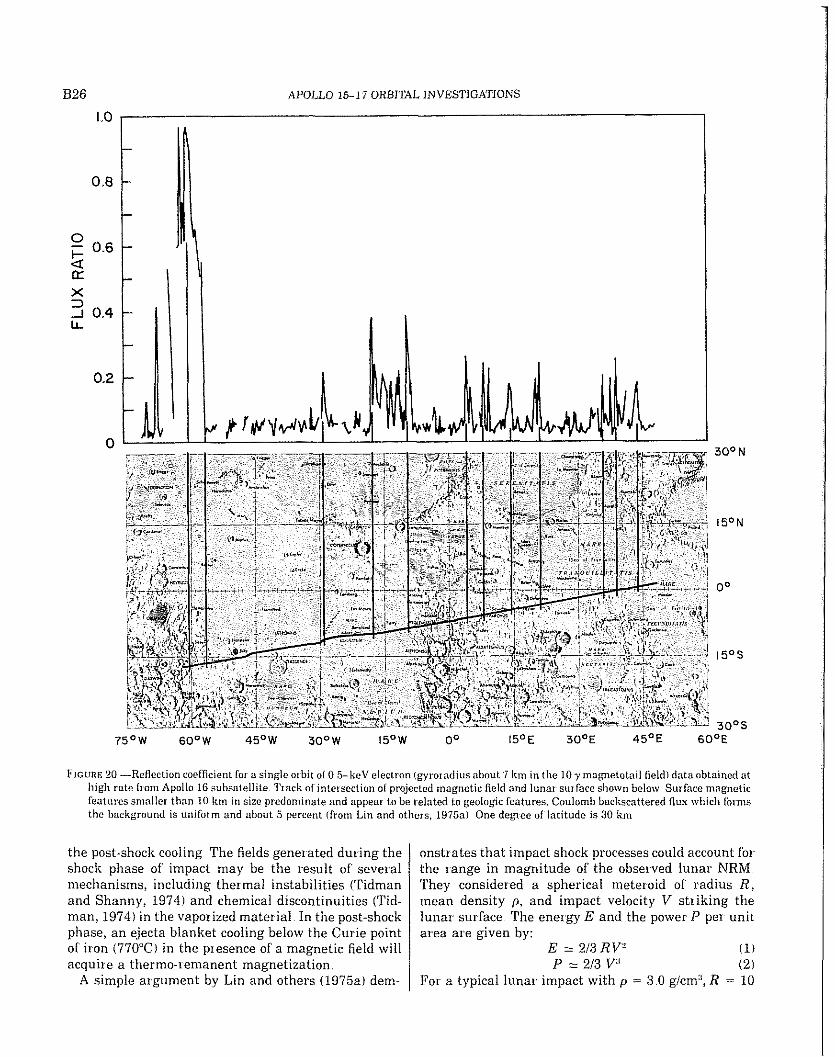
B26 APOLLO 15-1 7 ORBITAL INVESTIGATIONS
10 ,
FIGURE 20 -Reflection coefficient So1 a singleoibitof 0 5-keV election (gyroradius about 7 km in the 1Oymagnetotail field1 dataobtained a t high la te from Apollo 16 subsatdlite Track of inteisection of projected magnetic field and lunar surface shown below Sui Face magnetic features smallei than 10 km in size piedoininate and appeal to be related to geologic features. Coulomb backscattered flux which foims the background is uniform and about 5 percent (Srom Lin and others, 1975a) One degree of latitudo is 30 km
the post-shock cooling The fields geneiated during the shock phase of impact may he the result of seveial mechanisms, including thermal instabilities (Tidman and Shanny, 1974) and chemical discontinuities (Tid- man, 1974) in the vapolized mate1 ial In the post-shock phase, an ejecta blanket cooling below the Curie point of iron (770¡C in the piesence of a magnetic field will acquire a thermo-remanent magnetization
A simple argument by Lin and others (1975aI dem-
onstrates that impact shock processes could account for the range in magnitude of the observed lunar NRM They considered a spherical meteioid of radius R , mean density p, and impact velocity V striking the lunar surface The energy E and the power P per unit area are given by:
E = 213 RV (11 P = 213 V3 (2)
Foi a typical lunar impact with p = 3.0 glcm", R = 10

LUNAR REMOTE SENSING ANT) MEASUREMENTS B27
m, and V = 10 krnls, one finds the E = 2 x 10" joules/m2 and P =- 2 x 1 0'.' watts/rn2. These energy and power den- sities equal or exceed the levels commonly used in ex- periments on the interaction of focused laser light with solid matter, in which spontaneous magnetic fields of 10-10000 oersteds are usually found (Stamper and others, 1971, McKee and others, 1974). Although scal- ing effects must be considered when comparing the laser microexplosion with a cratering impact, i t is clear that the same physical processes must occur in the two situations when the energy and power per unit area are equally high (Lin and others, 1975a)
Magnetic studies of the 22-24-km-diameter Ries Basin impact structure in Germany (Dennis, 1971) and the 1,200-m-diameter Meteor Crater in Arizona (Re- gar1 and Hinze, 1975) have also shown evidence of sub- stantial impact-related NRM. For the Ries structure, Pohl and Angenheister (1969) found that the average total magnetization (+50 x 10 .' oersted) of the suevite around the crater is more than an order of magnitude greater than that of unaltered basement rocks. The strong magnetization of the suevite suggests crystalli- zation of new magnetite during the melting process, requiring local temperatures of a t least 1,400° Cool- ing past the Curie point (580°C must have taken place shortly after the suevite was deposited. Detailed pet- rographic investigations reported by Dennis (1971) in- dicate peak shock pressures and temperatures in ex- cess of 600 kb and 2,000°C
The origin of the complex lunar remanent fields is not understood a t the present time, but several obser- vations can be made. (1) whether ancient dynamo or primitive fossil magnetic fields were present or not, some local transient field effects (such as impact events) are required to account for the very high fields recorded in certain rocks, (2) the fossil fields, if present early in lunar history, could be used to explain some of the anomaly fields observed by the lunar surface mag- netometer and Apollo subsatellite magnetometers (Fuller, 1974).
Careful definition of the surface magnetic fields can lead to a variety of far-reaching conclusions about the Moon's modes of evolution and about its origin. The origin of the remanent magnetization may have a di- rect bearing on lunar thermal models For example (Lin and others, 1gr75a), no current thermal model that adequately accounts for the chemical compositions and ages (Apollo 12 and 15 basalts are youngest a t about 3.3-3.2 b.y.) of the returned lunar samples and the present physical state of the Moon provides Lor either a lunar dynamo or a permanently magnetized Moon that
aecame fully demagnetized later than about 3 0 b.y. +go Even the coolest of thermal models (Hubbard and Minear, 1975) predicts a demagnetized lunar interior ay 3 5 b y. ago.
Understanding the Moon's magnetic features will require detailed knowledge of the magnetic fields a t the Moon's surface 011 a spatial scale similar to that used for photogeology, crater studies, spectral reflec- tance studies and some orbital geochemical studies. The ability to correlate magnetic studies with crater- ing events, for example, is very desirable in light of the current interest in impact magnetization.
Geologic analyses of Apollo subsatellite magnetome- ter data have indicated a great variety in the size and magnitude of surface magnetic anomalies related in some cases to surface features such as large craters and basins (Coleman and others, 1971, 1972). Strangway and others (1975a, b) have recently looked a t the mag- netic anomalies in the region of the craters Van de Graaff (fig 17), Keeler, Aitken, Thompson, and Heaviside and determined that the magnetic field per- turbations are caused by breccias in the crater floors that have settled in place and cooled from a tempera- ture of 800Â C, acquiring a remanence in the presence of an ancient field. They suggest that these breccias have not been excessively reworked since their deposi- tion They further hypothesize that the light-colored plains materials present in many crater floors are the source of a t least some of the orbital anomalies.
A preliminary geologic evaluation of the Apollo 16 subsatellite electron scattering data (Lin and others, 1975a) has shown the technique to be extremely sensi- tive to the presence of terra breccias which appear to be carrying the major part of the lunar NRM as verified by the magnetic studies of the lunar samples. As was the case for the subsatellite magnetometer data, the electron scattering technique showed the near-side maria to be much less structured by strong surface magnetic anomalies than the far-side terrae. The most intense near-side field observed by the electron scatter- ing data was on the western shore of Oceanus Procel- larum (long 56' W. to 65Â W a t lat 16O S.) mapped as Imbrian and Nectarian rough terrain (Scott and McCauley, 1975). This perturbation is best seen on the high-resolution 0.5 keV electron scattering map shown in figure 20 The Van de Graaffanomaly, recognized in the subsatellite data, was also confirmed by the elec- tron scattering technique.
Strong natural remanent field anomalies were also found to be associated with the outer hummocky ejecta (not necessarily the basin structure) of the far-side basins Orientale, Hertzsprung, Korolev, Mendeleev, and two recently recognized very old basin structures i t lat 18" N, long 176O E., and lat 2Â N., long 112O E.
APOLLO 1 5 - 17 ORBITAL INVESTIGATIONS
(Abul Wafa region). The latter two basins are so de- graded that no ejecta blanket has been recognized. The geologic materials giving highly structured and strong remanerit fields on the lunar far side are Nectarian basin materials (undifferentiated); Nectarian basin materials (lineated); Nectarian terrain (undif'fer- entiated); Imbrian-Orientale rough mountain and hummocky rim mater ia ls and Nectariari-pre- Nectarian terra (Scott and McCauley, 1975; Wilhelms and El-Baz, 1975).
The near-side NRM field anomalies found by the electron scattering technique were all associated with various types of terra materials and terra plains mate- rials of pre-Imbrian or Inibrian age such as Imbrian hilly and pitted terrain; Irnbrian plains; pre-Imbrian rough mountain terrain; Imbrian and pre-Imbrian ter-- rain and pre-Imbrian crater materials (from Wilhelrns and McCauley, 197 1). All maria including Imbrian and Eratosthenian materials were found to have greatly reduced remanent field values with fewer and much less intense amplitude variations characteristic of the older highlands Additional regions of increased rema- nent magnetization on the near side include: (1) the southern part of the Riphaeus Mountains mapped as Imbrian and pre-Imbriari terra; (2) the region just south of the craters Perry and Bonplarid, mapped as Trnbrian plains filling pre-Irnbriari crater materials; ( 3 ) the floor of Hipparchus mapped as Imbrian plains; (4) the regions southwest and southeast of Delarnbre where the orbital track of the Apollo 16 subsatellite crosses Imbrian irregular crater materials thought to be secondaries from the Imbrian event; and (5) the terra peninsula on the southeastern rim of Mare Tranquillitatis composed of Imbrian and pre-Imbrian terra, Imbrian hilly and pitted materials, pre-Irnbriari rough mountain terrain, and Imbrian plains. Two geologically important observations have emerged from initial photogeologic analysis of the Apollo sub- satellite magnetometer and electron scattering data. First is the distinct enhancement of NRM associated with the older breccia terranes; second is the enhance- ment associated with some large craters and basin ma- terials. There is evidence that the magnetic charac- teristics of the lunar rocks are related to their iron content and petrologic type (Gose and others, 1972) and that lunar soil iron ratio !?ewe++ is in turn associated with soil maturity (Pearce and others, 1974).
There are large areas of the Moon that have less than 0.1 gamma remanent magnetic fields. Photo- geologic comparison of weakly magnetic regions with those of normal or enhanced magnetic fields should provide important clues to the origin of such diverse fields. The areas of very weak magnetic field may have been extensively reworked after the time when there
vas a strong global magnetic field. Alternatively, perhaps these are regions where an extensive, intact nagnetized layer a t depth has not been highly cratered ,o produce leakage of strong magnetic fields. A uni- ormly magnetized sheet of infinite extent has no out- ;ide magnetic field. However, there are "edge7' effects, ,hat is, leakage of magnetic lines a t regions of mag- letic field perturbarice such as a t the edge of craters ind mare boundaries (Collinson and others, 1975). A najor question to be answered is how deep is the source if the NRM Although most lunar maria exhibit g-eatly reduced NRM relative to the terra breccias, ,here are exceptions. A shallow mare region southeast )f the crater Parry (at lat lo0 S, long go-14O W ) ap- >ears to have a high NRM, the source of which is ~ e r h a p s below the mare fill A very strong NRM is observed for the Cayley plains just to the west of this mare area in the region of the craters Parry and Bon- pland (south of the crater Fra Mauro) (see fig. 20) The source of magnetic anomalies, such as that associated with the Van de Graaff features, have been estimated to be as great as 10 km deep (Coleman and others, 1972).
In an important recent observation, Srnka (19751, using Apollo laser altirnetry, showed a definite correla- tion between surface slope and lunar limb compres- sions in the solar wind determined by the Apollo sub- satellite. He found (1) that areas containing large sunset-facing slopes are significantly favored as limb compression source regions and (2) that magnetic anomalies correlate with rms slope (roughness). Srnka suggests that, the probable causes are (1) plasma heat- ing by energetic photoelectron emission from steep ter- rain illuminated a t the terminator or (2) plasma deflec- tion by remanent fields selectively enhanced a t sunset-facing slopes by electrostatic depositional re- marlent magnetization (eDRM) of lunar fines.
One of the present controversies in lunar geology is related to the modes of deposition and a real distribu- tion of ejecta from the large impact basins (Oberbeck, 1975, Morrison and Oberbeck, 1975; Eggleton and Schaber, 1972; Moore and others, 1974) The main con- tention lies in estimating the percentage of basin- related deposits attributable to excavation of pre-basin materials by the basin secondaries and the amount of mixing of this material with primary basin ejecta. The relat ion of observed reriianent magnetic field anomalies with basin rim deposits (as discussed above) and basin-related smooth plains materials (for exam- ple, the Cayley Formation) may provide significant new data to be used in resolving this controversy. It may be insignificant whether the basin-related anomalies in NRM are caused a t the time of basin im- pact or are the result of primitive internal or external
L,UNAR REMOTE SENSING AND MEASUREMENTS B29
fields. It is possible that the NRM and thus the iron content of the primary basin ejecta are sufficiently dif- ferent from that of secondary crater ejecta that they could be independently recognized
The geologic significance of obtaining higher resolu- tion NRM data for the entire Moon cannot be overem- phasized. The available data indicated that a correla- tion between such data and detailed surface geology does exist, but it is as yet poorly understood Recogni- tion of the Moon's remanent magnetic field stands as one of the Apollo program's major findings, and a care- ful investigation of the variations in this field should provide the lunar and planetary science community with exciting new data relating to the early history of the solar system
ORBITAL GEOCHEMISTRY
The Apollo orbital geochemical experiments are truly remarkable in both concept and results. Between the X-ray fluorescence and gamma ray spectrometer experiments, the amounts of aluminuni, silicon, mag- nesium, iron, titanium, thorium, and potassium were estimated from the orbiting Command and Service Modules for areas on the Moon where no spacecraft have landed These estimates will remain an irnpor- tant set of information for future plans for lunar sur- face exploration
X-ray fluorescence spectrometers were carried aboard the Command and Service Modules of Apollo 15 and 16 (Adler and others, 1972a, b, c, d, e). The charac- teristic energy distributions and intensities of secon- dary or fluorescent X-rays produced by the interaction of solar X-rays with the lunar surface were measured by the spectrometers so that results were confined to the sunlit lunar surface. Measurements were limited to the K-shell spectra of the elements Mg, A1, and Si be- cause of the special nature of the solar flux Elements heavier than Si are not appreciably excited by the solar flux and elements lighter than Mg are inefficiently de- tected. Results are reported as intensity and (or) con- centration ratios AlISi and MgISi. Intensity ratios vary with solar activity (Adler and others, 1972c), so care must be taken in interpreting results reported as in- tensity ratios in terms of concentration ratios. For nearly constant solar activity, concentration ratios are approximately linearly related to intensity ratios (compare tables 17-1 and 17-11 in Adler and others,
1972a; fig. 19-2 and tables 19-11 in Adier and others, 1972b; and see table 1 in Adler and others, 1972~).
Concentration ratios from returned lunar samples are used to calibrate the intensity ratios corresponding to the landing sites. Concentration ratios computed elsewhere rely on this empirical calibration and on theoretically derived relations between the solar flux, intensity ratios of the secondary flux, and concentra- tion ratios. Observed concentration ratios of the cross- over points of Apollo 15 and 16 agree within 10 per- cent, and those for the Apollo 16 landing site area agree well with those of samples returned by Apollo 16 (Adler and others, 1973).
The areas sampled are large. The instantaneous viewing area a t one-half peak response of the instru- ment colli~nator is 110 by 110 km a t an orbital altitude of 110 km (Adler and others, 1972c), which translates to 3 6 degrees longitude a t the equator. Data were ac- cumulated in intervals of 8 to 64 seconds corresponding to 11.5 to 92 2 km along the ground track. Thus, the spatial resolution may be taken approximately as 110x122 km to 110x200 km ( 3 . 6 ~ 4 . 0 degrees to 3.6 x 6 7 degrees) depending on the duration of accumu- lation, but contributions from peripheral areas are present. Thus, the areas sampled often exceed the areas of individual geologic map units, and so the ana- lytical results include mixtures. This does not mean that small units cannot be detected. Most of the in- strument response comes from an area 6 0 ~ 60 km, and sizes of residuals from trend surface analyses (Pod- wysocki and others, 1974) indicate features as small as about 30 to 60 km can be detected
Initial results (fig. 21) from the X-ray fluorescence experiment, despite the low resolution, are important (Adler and others, 1973, 1972~):
1. Lunar highlands have larger AlISi values and smaller MgISi values than the maria, and these two ratios vary inversely on a regional basis. This result shows, when combined with samples collected by the Apollo missions, that the lunar crust has differentiated into gabbroic anorthosites (highlands) and feldspathic basalts (maria).
2 The highland crust is broadly similar over large areas, and AlISi values measured from orbit for the Descartes landing area (includes Apollo 16 landing site) are large and comparable to those on the far side. This suggests that samples collected a t the Apollo 16 landing site are similar to the rocks of the far side.
3 AlISi values vary directly with albedo 011 a re- gional basis, although there are notable exceptions such as fresh craters. This result shows that compo-
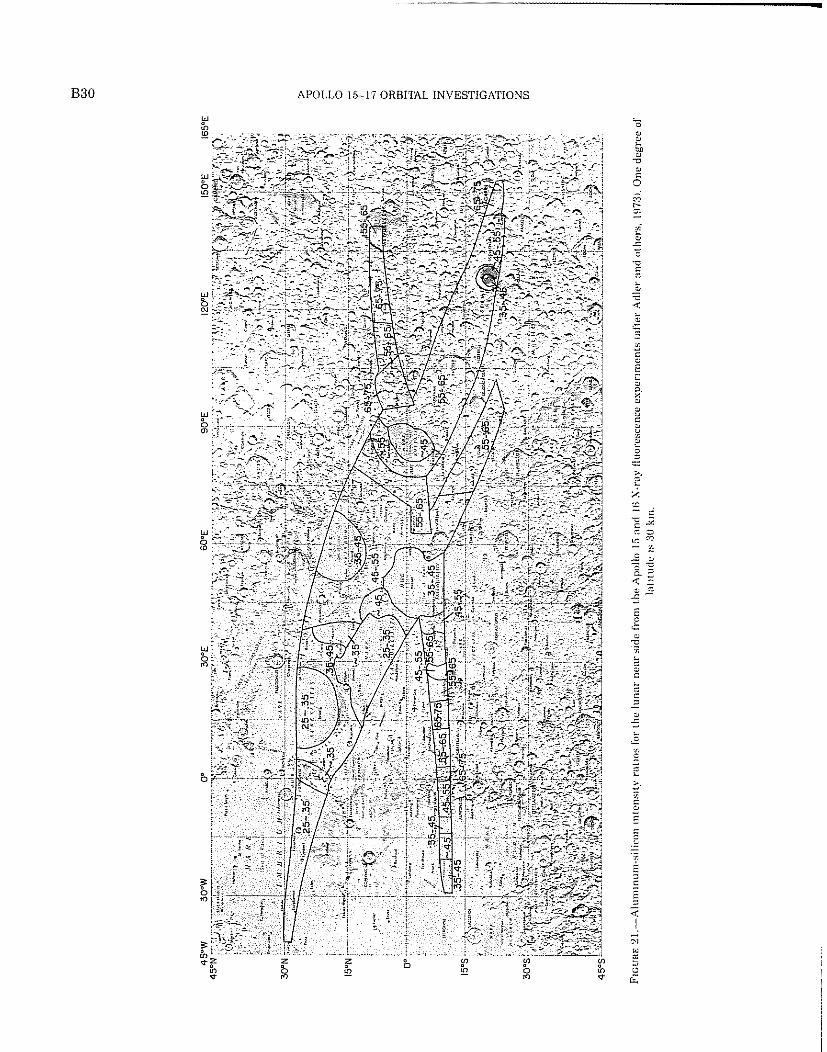
APOLLO 15-17 ORBITAL INVESTIGATIONS

LUNAR REMOTE SENSING AND MEASUREMENTS 3 3 1
sitional differences as well as exposure of fresh niate- rials by impact cratcring and mass wasting are respon- sible for the high albedos of lunar surfaces.
Trend surface analysis (Podwysocki and others, 1974) and sliding averages (Andre and others, 1975; Hallam and others, 1974) of the Serenitatis-Littrow- Tranquillitatis region of the Moon have produced re- fined results. Trend surface contours conform, in a gen- eral way, to mare-highland boundaries (Podwysocki and others, 1974), and contours based on residuals from the trend surface conform in a more detailed way with geologic contacts (Hallam and others, 1974) It is clear, however, that the mapping resolution is in no way as good as that achieved using images and photo- graphs. Trend surface residuals (Hallam and others, 1975; Podwysocki and others, 1974) associated with small lunar features such as craters are of particular interest because the results provide information on the type of material ejected from the crater. AlISi intensity ratios for selected features are listed in table 7, where i t may be seen that some mare impact craters have apparently excavated more aluminous materials (AlISi intensity >0,,95), indicating that thin units of mare material overlie more aluminous material-probably highland material.
The gamma-ray spectrometer experiment was con- ducted from the Command Service Modules of Apollo missions 15 and 16 (Arnold and others, 1972a, 1972b) Gamma rays from natural radioactive potassium-40 and daughters of thorium and uranium as well a s emit- ted gamma rays resulting from the interaction of galactic cosmic rays with the surface materials of the Moon are recorded by the spectrometer aboard the or- biting spacecraft. The gamma rays are separated by their energies and their intensities measured. After subtraction of the known continuum from the observed spectrum of galactic cosmic rays, a line spectrum re- sults from which the amounts of potassium, thorium, uranium, magnesium, iron, and titanium can be de- termined. In practice, the amounts of these elements are calibrated with Apollo data on chemical compo- sitions of returned samples. Surface data from Apollo missions and the agreeinent between Apollo 15 and 16 results a t the ground-track crossover points lead to a good prediction of the radioactivity of the surface ma- terials a t the Apollo 16 site. The resolution of the sys- ten1 is approximately 2.5" on the lunar surface, or 75 km. Some data are integrated to cover much larger areas.
TABLE 7 -Al/Si intensity ratio's associated with fourth-order trend surface residuals and selected lunar features
Name Location
--
West flank Plinius _ - - 16.5"N . 22 O"E Dark mare ust west
of Mons &aeus - 1 9 5"N. 28 5° Jansen _ _ _ _ _ _ _ _ _ _ _ _ 14 0"N, 28 5"f. Borel - - - - - - - - - - _ _ 2 2 3'N.. 26 4° Bessel--------- -- - 2 1 ION, 18 0° Bobilher ,,.. _ . _ _ _ _ _ _ _ _ _ _ _ I 9 6"N, 15 4-E Deseilligny ---- - 2 0 8"N, 21 4% Rant. flank Plinius _ _ _ _ _ _ _ _ _ _ _ I 5 5"N. 25 5"E ---------- ~
Lowalbedomare. ---Ñ190¡N,165 East of Jansen - -14 0"N , 29 0"E East of Jansen _ _ . _ _ _ _ _ _ _ _ _ _ _ I 3 5"N, 30 5"E Cauchv Rille I - - - - - 1 4 0"N , 36 0° Mare east of
Miraldi - ÑÑà _ _ _ _ _ I 8 0-N , 38 0"E Lucian _ _ _ _ _ _ _ _ _ _ _ 1 4 :%ON. 36 8"E
Mons Argaeus _ _ _ _ _ _ _ _ _ _ _ _ _ _ _ I 9 OON, 29 East of Janscn _ .____________I :% 0"N , 31 Wrinkle ridge join _ _ _ - 19.0-N , 20 3°F High albedo region _______.. . . -4.0-N , 37.5-E. Haemus Mountains ____________l6 .OoN, 20.0-E High albedo region 9.0-N., 34.0-E. Ross Ñà ____________12.O0N, 21.5-E Cauchy ---------- - 9 6"N . 38 6° Taum-Littrow
highlands (south) _ _ _ _ _ _ _ _ _ _ _ _ I 7 0"N , 32.5-E
Catena Littrow - - - - - 22 2"N ; 29 5"E Tacquet-------------- 17 0"N , 19 WE Beketov _______ãã_.. .. 16 2"N , 29 2"E S W ofProclus ..._________ 14 5"N , 44 0° Proclus ejecta - - - - 1 8 5"N , 47 0°
- ~ --
Crater cliarneter, AIISi depth below n m intensity crest, and depth ratio below surrounding
surface (km)
Natural radioactivity generally correlates with other Apollo lunar data (Trombka and others, 1973). Natural radioactivity is inversely correlated with mean elevation. Elevated regions of the lunar far side have low natural radioactivity. Relatively large radio activities were measured near the Van de Graaff de- pression of the far side. Highest natural radioactivities were recorded just south of the Fra Mauro landing area, a t the crater Archimedes, and near the Crater Aristarchus Western maria in Mare Imbrium and Oceanus Procellarum were relatively radioactive. Aluminum-silicon ratios are also inversely correlated with natural radioactivity.
Subsequent analyses of the gamma-ray spectrometer data have yielded surface concentrations of iron, mag- nesium, titanium, thorium, and potassium a t the sac- rifice of spatial resolution (Metzger and others, 1974). The large size of the areas to which the concentrations apply are of little use for detailed geologic studies, but they do yield valuable information on the grand scale. Some of the results available a t this time are shown in figure 22 and listed in table 8.
The chief results of the gamma-ray spectrometer are summarized below after Metzger and others (1974). First, mare regions are enriched in iron, titanium, and to a lesser degree magnesium relative to the highlands. Concentrations of radioactive elements tend to be

AF'OLLO 15 17 OKRI'rAL INVESTIGATIONS

LUNAR REMOTE SENSING AND MEASUREMENTS
TABLE 8 ÑConcentiatwiv of fiw elements from Lhx Apollo 1.5 r ~ r u l 16 gamma ray spectrometer expel unents
number I/onffitudinal (Metzger and hounds of Fc ME TI Th K others, 1974) sample area percent (ppm) (ppn~)
Apollo mission 15: Mare Fecunditatis _ _ _ _ _ _ _ _ __97 Mare Tranquillitatis _ _ _ _ _ '38 Mare &renitat is_____ 39 Archimedes ----?40 Mare lmbrium _ _ _ _ _ _ _ _ _ _ _ 4 1 Aristarchw _ _ _ _ _ _ _ _ _ '42 Oceanus Procellaruni N ----4.^
Apollo mission 16: Eastern near side hiphlands 19 83° 55° X 6 4 5 1 . 980 - Mare Fecunditatis _ _ _ _ _ _ _ _ _ _ 17 Capella-Thmptiilus _ _ _ _ _ _ _ _ _ 1 4 Central near side highlands 12 Ptolemaeus-Albategmus ____-'I0 Fia Mauro _ _ _ _ _ _ _ _ _ _ _ _ _ _ Y'-i Mare Comitum _ _ _ _ _ 8 20-W 130-W 12 1 4 9 8 4 31600 Oceanus Procellarum S ~ ---5 Grimaldi _ _ _ _ _ _ _ _ _ ----3
Apollo mission 15: Western far side highlands 44 Van de Graaff _ _ _ _ _ _ _ -34 Eastern far side highlands __35
'Values in parentheses are "ground truth" data used to normalise concentrations for these elements in all re ons
'Region of apparent depressed neutron flux; iron concentration may be a few percent higher than indicated
greater in the maria than in the highlands with a no- table exception, the region of Van de Graaff (table 8). Potassium and thorium concentrations near Van de Graaff are as high as typical maria; iron concen- trations are between maria and highland concen- trations, but titanium concentrations are the lowest indicated along the entire Apollo 15 zone. About 5 per- cent of material like granitic rock 12013 added to the highland soil a t Van de Graaff could produce the ob- served radioactivity. The highlands are not uniform: (1) iron and thorium concentrations are higher in east- ern regions than western ones, and (2) some regions (table 8) have depressed thermal neutron fluxes and appear to have high concentrations of KREEP (potas- sium, rare earth elements, and phosphorus).
DISCUSSION
If the details required for careful geologic analyses are to be obtained, much higher resolution of the geochernically sampled areas is necessary. Residuals from trend surface analyses certainly improve the de- tection resolution of the X-ray fluorescence data, and such studies should continue. Of particular interest are the craters and their ejecta, which can yield informa- tion on the uppermost layers of the Moon (Hallam and others, 1975). If the magnitude of intensity ratios as- signed to the residuals are correct, the thickness of basalt in Mare Tranquillitatis near Cauchy and Ross can be no greater than about 2.0 km, whereas Lucian and Cajal excavated chiefly basalts from depths no greater than 1.2 km (Hallam and others, 1975, and C. G. Andre, writ ten commun., 1975). In Mare
Serenitatis, the intensity ratios indicate that basalt ex- tends to depths of more than 1 km, and around the margin intensity ratios indicate that high-alumina highland materials were brought to the surface by Catena Littrow, Tacquet, and Beketov from depths less than 0.4, 0 9, and 0.8 km, respectively.
More detailed analyses such as those above with the goal of deciphering basin ejecta would be of interest.
Currently, gamma-ray spectrometer data are being analyzed further with the hope of producing results with higher resolution. Some of the integrated resolu- tion cells, such as the Aristarchus and Archimedes re- gions, include a wide variety of terrains and geologic map units. Indeed, high-resolution data show that the very large concentrations of natural radioactivity (Trombka and others, 1973) coincide with the crater Aristarchus and its southern flank, but such fine detail is lost in the large regions (fie, 22) which include di- verse geologic units of the Aristarchus Plateau such as rilles, highland materials, and mare materials as well as young crater materials Thus, the concentrations reported must correspond to the equivalent of mechan- ical mixtures. Mixing of samples must also be com- pounded by the omnidirectional sampling of the gamma-ray spectrometers as well as mechanical mix- ing by meteor impacts.
High concentrations of potassium and thorium gen- erally occur in regions of low elevation (Metzger and others, 1974), but regions with both high potassium and thorium and depressed thermal neutron fluxes are, with the exception of the Grimaldi region, associated with regions that contain Imbrium ejecta or reexca- vated Irribriu~n ejecta. Aristarchus probably reexca-

B34 APOLLO 15-17 ORBITAL INVESTIGATIONS
vated Imbrium ejecta (Zisk and otheis, 19771 and the F ia Mauio, Ptolemaeus, and Archimedes legions con- tain Imbrium ejecta Thus, it is entirely possible that the Imbiium impact event excavated in part KREEP- rich materials
BISIAIIC RADAR
Bistatic-radai experiments pioduced some of the finest scientific results of all the Apollo orbital science experiments Most significantly, slope-probability dis- tributions were derived from the radar echoes which agree in form with those obtained using Apollo panoramic cameia photographs and photogrammetric techniques The experiments weie conducted during Apollo missions 14, 15, and 16 (Howard and Tyler, 1971,1972a, b; Tyler and Howard, 19731 In the exper- iments, transmissions from orbiting Command Seivice Modules were received on Earth after reflection from the lunar surface Two wavelengths were used simultaneously-13 cm and 116 cm (2287 5 MHz, S-band, and 259 7 MHz, VHFI The data provide a sampling of lunar surface roughness a t two different scales, because scattering fiom the lunar surface is de- pendent on wavelength The longer wavelength meas- urements sample at large1 scale lengths than the shorter wavelength measurements
The echo spectiuni is broadened according to the roughness or slope probability distribution of the sur- face slopes' as expressed through the doppler shift (Howard and Tyler, 19711 Lunar slope-probability dis- tributions may he inferred directly from the histatic- radai data (Paikei and Tyler, 1973; Moore and Tyler, 1974) Single estimates of surface roughness may also be obtained from echo broadening in two ways The first is called machine-calculated loot-mean-square (rms) slope and is obtained from the equivalent aiea bandwidths (Tyler and Howard, 1973) based on an ob- jective measure of peak power spectral density and total signal power The second is called hand- calculated inis slope and is obtained by graphically measuring the bandwidth at the one-half power points of the echo spectium (Tylei and others, 1973) The rnis slope is equivalent to the algebraic standard deviation of a slope-probability distribution with an algebraic mean of zero
The data on ims slopes correspond to averages ovei resolution cells vaiying between about 10 and 20 km in diameter depending on the surface ioughness The
ia ta on slope-probability distributions represent about 28 combined resolution cells of echo spectra and cover a span of about two degrees in longitude along the sub- specular track (figs 23 and 24) At the piesent time, :he scale length of roughness measured is understood ~ n l y in a geneial way The best empirical estimate of the horizontal surface scales corresponding to the slope measurements is about 250 wavelengths (Tyler and ~ t h e i s , 1971), 01 about 32 m for the S-band radar and 290 m foi the VHF radar Theoretical considerations place the scale length between 10 to 100 wavelengths and the f i s t Fresnel zone (G L Tyler, oral commun, 1975) Foi the S-band radai, this coiresponds to scale lengths between 1 3 to 13 m and 335 m For the VHF radar, this corresponds to scale lengths between 11.6 to 116 m and 1000 m ,
Results vary systematically for each mission because $experimental conditions and techniques unrelated to the terrain traversed along the subspecular ground tracks (Moore and otheis, 1975, 1976) In paiticular, 11 machine-calculated rms slopes for the VHF radar of Apollo 14 a re conlmonly laiger than the hand- calculated ims slopes, and (2) machine-calculated rms slopes for the VHF radar of Apollo 16 a ie unifoimly low compared to Apollo 14 and 15 VHF rms slopes (Moore and others, 1976). S-band rms can be compaied fkom mission to mission to a good approximation, al- though Apollo 14 rms slopes tend to be slightly laiger than those of the other two missions
The subspecular ground track of the Apollo 14 bistatic-radar experiment covers a thin strip across the near side of the Moon from a point southwest of Lan- grenus (about lat 12Â S , long 45Â E ) to about lat go N , long 70' W . (fig 23) In the western part the ground track traveises chiefly malia; in the central and east- e in paits it tiaveises chiefly highlands. The Apolln 15 track covers an arcuate strip across the neai side of the Moon from 1 68' N , 70Â E to just south of Aichimedes (at 24 76Â N , 5 04' W I and west to 11 06' N ,7002' W (fig 24) The western part of the tiack tiaveises Oceanus PioceIIarum and Mare Imbiium To the east, the track crosses Montes Apenninus, Mare Serenitatis, and then chiefly highlands The Apollo 16 track is simi- a i to the Apollo 14 track It begins north of'Langrenus a t 0 2 1 Â ° S 70Â E and ends a t 2 42Â S. , 70 04' W (fig 241 The westein part covers chiefly maiia, and the eastern pait covers chiefly highlands except a t the ex- tieme east in Mare Fecunditatis
(:o\fl ' \ l<ISOs 0 1 l< \ I ) \ l< It01 (;IISbSS \ \ I H I I I S\ !< 1 bl<l<MS
Root-mean-square (rms) slopes for all three missions and a t both wavelengths correlate with lunar terrain As shown in figures 23 and 24, rms slopes are rela- tively large over the highland aieas and relatively
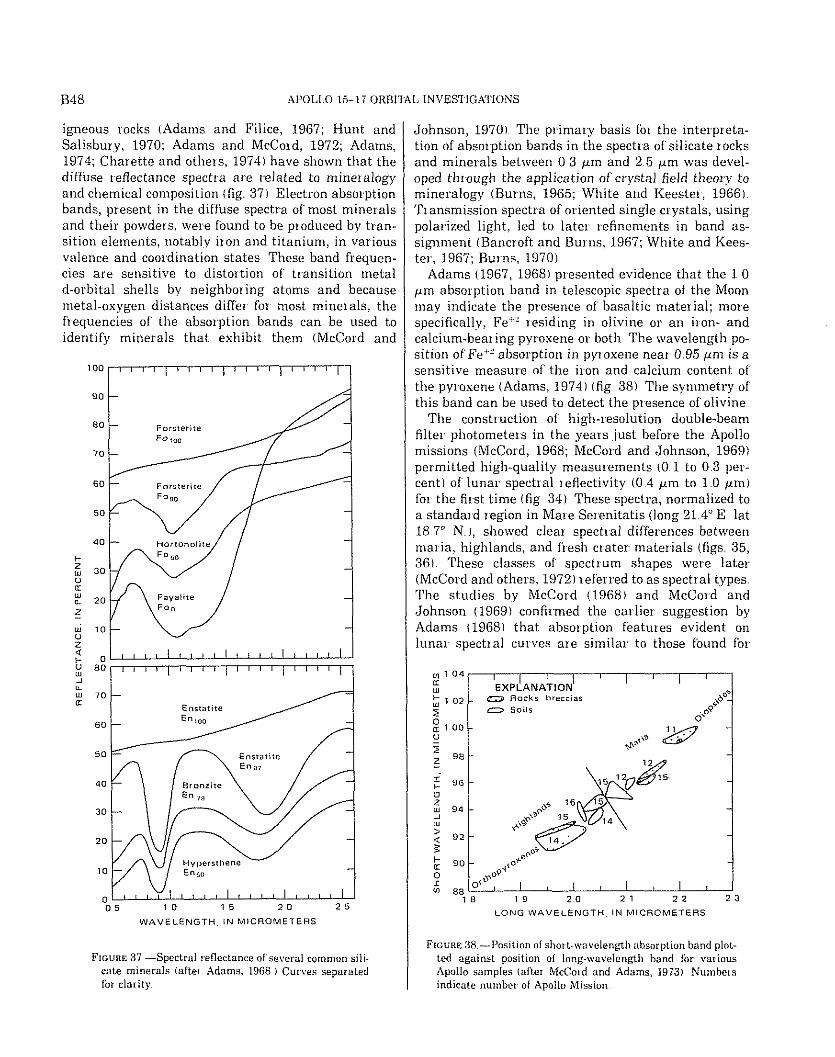
B48 APOL,LO 15- 17 ORBITAI. INVESTIGATIONS
igneous iocks (Adams and Filice, 1967; Hunt and Salisbury, 1970; Adams and McCoid, 1972; Adams, 1974; Chaiette and otheis, 19741 have shown that the diffuse ieflectance spectra are related to mineialogy and chemical composition (fig 371 Electron absorption bands, piesent in the diffuse spectra of most minerals and their powders, were found to be produced by tian- sition elements, notably iion and titanium, in various valence and coordination states These band frequen- cies are sensitive to distortion of transition metal d-orbital shells by neighboring atoms and because metal-oxygen distances differ for most n~ineials, the frequencies of the absorption bands can be used to identify minerals that exhibit them (McCoid and
u1 1 1 ' ' 1 3 " l t ~ ' ~ l ' 1 1 ~ l
0 5 1 0 1 5 2 0 2 5
W A V E L E N G T H , IN M I C R O M E T E R S
FIGURE 37 -Spectral reflectance of several common sili- cate minerals (aftel Adams, 1968 I Curves separated for clarity
lohnson, 19701 The primary basis foi the inteipreta- ion of absorption bands in the spectia of silicate iocks and minerals between 0 3 pm and 2 5 pm was devel- ~ped through the application of crystal field theory to nineralogy (Burns, 1965; White and Iceester, 19661 ITiansmission spectra of oriented single ci ystals, using rolaiized light, led to later ~efineinents in band as- iignment (Bancroft and Bums, 1967; White and Kees- e r , 1967; Bums, 19701
Adams (1967, 19681 presented evidence that the 1 0 i m absorption band in telescopic spectra of the Moon nay indicate the presence of basaltic material; more ipecifically, Fe"5es id ing in olivine or an iron- and calcium-beat ing pyroxene or both The wavelength po- iition of'Fe'+-' absorption in pyroxene near 0 95 pm is a iensitive measure of the iron and calcium content of h e pyroxene (Adams, 19741 (fig 38) The symmetry of :his band can be used to detect the presence of olivine
The construction of high-resolution double-bean? ^ilter photometeis in the yeais just before tlie Apollo nissions IMcCord, 1968; McCord and Johnson, 19691 3ermitted high-quality measuiements (0 1 to 0.3 per- :entl of lunar spectial ieflectivity (0 4 pm to 1.0 pml " r the first time (fig 341 These spectra, normalized to A standard region in Male Serenitatis (long 21 4Â E lat 18 7' N ), showed deal spectial differences between nalia, highlands, and fresh crater materials (figs 35, 361. These classes of spectrum shapes were later McCord and others, 19721 iefeiied to as spectial types The studies by McCord (19681 and McCord and Johnson (19691 confirmed the earlier suggestion by '\dams (1968) that absorption featuies evident on una i spectral curves are similar to those found foi
t,q 1 0 4 I I K I I u EXPLANATION'
I 02 0 Rocks breccia5 ,to* CÑ soils . o ~ "
0
L O N G W A V E L E N G T H . IN M I C R O M E T E R S
FIGURE 38 -Position of short-w~ivolenglh absorption band plot- ted against position of long-wavelength band for various Apollo samples (after McCosd and Adams, 1973) Numbers indicate number of Apollo Mission

LUNAR I<EMOTE SENSING AND MKASIJRKMENTS

APOLLO IT- 17 OKRTTAL, INVEKTIOATTONS

LUNAR REMOTE SENSING AND MEASUREMENTS B37
small over maria The change is most marked for the VHF radar, which samples a t greater slope lengths than the S-band Large rms slopes are measured where the ground track crosses craters such a s Lansberg (long 26 5 O W , fig 23), LaLande (long 8 5O W , fig 23), Herschel (long 2" W , fig Xi), Gaudibert (long 38O E , fig 23), Euler (Apollo 15, long 29 2" W , fig 24), and Hind (Apollo 16, long 7 3O E , fig 24) Detailed com- parisons of bistatic radar roughness estimates with visual impressions of roughness shown on Lunar Orbi- ter IV images and Apollo mapping camera photographs have shown there is a good correlation between the two (Moore and others, 1975, 1976) Visually smooth mare surfaces have relatively small S-band and VHF rms slopes. Visually rough craters and highlands have re1 atively large S-band and VHF rrns slopes With the exception of the Apollo 16 results (Moore and others, 1976), VHF rrns slopes in upland terrain a re commonly equal to the S-band rrns slopes and locally exceed them In contrast, VHF rms slopes for the maria are less than the S band rms slopes and are locally one-half the S-band rms slopes Areally small and subtle changes in roughness a re measured by the radar On the flanks of the crater Theophilus, sharp decreases in rms slopes coincide with smooth patches in a n otherwise rough ejecta blanket (Moore and others, 1975) Southwest of Kepler near Maestlin R (long 41 5O W , fig 23, Moore and others, 1975), the S-band radar measured the change in crater density on the maria as the track crossed more heavily cratered terrain on one side of a scarp to less heavily cratered terrain on the other side of the scarp
Because lunar photogeologic map units a re defined using topography a s one of several criteria (Wilhelms, 1970, 1972a; Shoemaker and Hackman, 1962), bistatic-radar rms slopes should be systematically re- lated to geologic map units This is the case (Moore and others, 1975, 1976) The systematic relation between radar roughness and geologic map units is bhown in a general way in figure 25 where average hand calculated S-band and VHF rms slopes for selected geologic map units along the Apollo 14 and 15 ground tracks are compared Mare materials have small rms slopes for both radars, and S-band rms slopes a re significantly larger than VHF rms slopes Highland geologic map units have larger average rms slopes for both radars, and average VHF rms slopes may equal or exceed the average S-band rms slopes. Similar results a re obtained for the craters, which in this case (fig 25) correspond to Copernican craters of Apollo 14 Fre- quency distributions of S-band and VHP7 rms slopes for
individual resolution cells within geologic map units (see for example Moore and others, 1975) indicate tha t the distribution of roughness of lunar surfaces shown in the radar data resembles the distribution of the major terrain units seen through telescopes and on photographs
Albedo (Pohn and Wildey, 1970) is also used a s a criterion for geologic map units (Wilhelms, 1970, 1972a; Shoemaker and Hackman, 1962). As seen in figure 26, albedo and rrns slopes, which are two inde- pendent variables, a re directly correlated (see also Moore and others, 1976). Dark, smooth mare surfaces have both low average albedos and small average S-band rrns slopes. Highland and crater units tend to have high average albedos and large average S-band rms slopes Here again, the combined use of albedo and rms slopes would produce a map tha t resembles the Moon a s viewed visually.
Comparison of average machine-calculated S-band rms slopes with average infrared eclipse temperatures
I I I I I I
L A C 76
57 ¥
A V E R A G E H A N D - C A L C U L A T E D V H F
ROOT-MEAN-SQUARE SLOPE, I N DEGREES
FIGURE 25 -Comparison of average hand-calculated S-band and VHF rms slopes for selected geologic map units along Apollo 14 and 15 bistatic-radar tracks. Points represent av- erages taken from Moore and others (1976) where number in sample is greater than 50 Marc materials (filled circles) plot at lower left, highland units (triangles) occur at upper right, and crater units (open circles) at upper right LAC (Lunar Astronautical Chart) numbers indicate l:l,000,000-scale geologic map in which mare material occurs (Carr, 1965,1966; McCauley 1967; Hackman, 1962; Eggleton, 1965) Straight line is loci of pointz with equal S-hand and VHF rrns slopes

--
AI'OLLO 15- 17 ORBITAL INVESTIGATIONS
Copernican craters ( A p o l l o 14 ) ^
A Lansberg
A L A C 7 6 0
A A Pre l rnbr ian craters. A 'i7
" Dark mare A
mater ial 0 Euler
- A C 3 8 *LAC 57 A
L A C 4 2 * L A C 7 9 39 * L A C 8 0
L A C 4 0 0
AC .LAC 5 6 L A C 7 6
7 4 * L A C 75 I I I I I I
8 0 9 0 1 0 0 1 1 0 1 2 0 1 3 0 1 4 0 1 5 0 1 6 0
A V E R A G E A L B E D O , T I M E S O N E T H O U S A N D
FIGURE 26 -Comparison of average machine-calculated S-brand rms slopes and albedos for selected geologic map units along Apollo 14, 15, and 16 bistatic-radar tracks Points represent av- erages taken from Moore and others (1976) where number in sample is greater t han 50 (except for points representing craters Herschel, Lansberg, and Euler, which have fewer than 50) Mare materials (filled circles) plot a t lower left (except mare material in Montes Riphaeus region, Apollo 14), highland (triangles) and crater (open circles) units a t upper right LAC numbers indicate geologic maps in which map unit occurs (Moore, 1965,1967; Cam, 1965, 1966; McCauley, 1967, 1973, Marshall, 1963; Hackman, 1962; Eggleton, 1965; Rlston, 1972; Hodges, 1973) (Average al- bedos of geologic units obtained froin map in Pohn and Wildey, 1970 )
(Shorthill, 1973) for selected geologic map units (fig 27) shows an inverse relation and suggests a thiro variable that could be used to subdivide the Moon intc surface types using remotely sensed data Frequency distributions of infrared eclipse temperatures of some mare materials are characterized by tails or anomal ously high frequencies of high temperatures (Moore and others, 1975) which are related to bright craters Such is the case for mare material in the Hevelius anc Kepler quadrangles (McCauley, 1967; Hackman 1962) Removal of the anomalies reduces the average scaled infrared eclipse temperatures in the Heveliui and Kepler quadrangles to about 120 and 1182 Mart materials sampled in the Seleucus and Aristarchu: quadrangles (Moore, 1965, 1967) do not have thest large "tails," and their position in figure 27 would be affected to only a small degree by the "tails." Thus, flu mare materials in these areas have anomalously higk infrared eclipse temperatures that separate them frorr the other maria sampled. Remote measurements rnaj also be used to subdivide maria (Moore and others 1975). and one such example using S-band bistatic
Uni t sa re scaled values using theequat ion ofShnrthil1 (1973); see also p B61. equation 8
-adar and scaled infrared eclipse temperatures is illus- .rated in figure 27 by the widely separat,ed positions of nare materials which are warm and smooth and high- and materials which are cool and rough. Anomalous ¥ondition such as mare material in the Riphaeus Viountains region (Eggleton, 1965) can be recognized Viare material in that region sampled by Apollo 14 is -ough and cool compared to mare material sampled ,here by Apollo 16 which is smooth and warm.
Three types of slope-probability distributions are ob- ained from the radar echoes: (1) normal, (2) tailed, and 3) complex. The normal distributions are reasonably lose to gaussian curves. Tailed distributions have ewer slopes a t small slope angles and more slopes a t a r e slope angles than a gaussian distribution Com- )lex distributions have two or more modes and cannot )e fitted by a gaussian curve. An example of a normal listribution is the highlands near Vitruvius (lat 18.8O sf , long 32 O0 E ) where a gaussian curve produces a
*A OCopernican craters ( A p o l l o 14)
A anshe rq \ A
* L A C 76 A A
v 0
Pre- lmbr ian A Dark rricire mater ial Eulero craters L A C 5 7
A L A C 38. .LAC 79
L A C 80*o LAC 4 2 L A C 3 9 L A C 40-
L A C 76
AVERAGE: S C A L E D I N F R A R E D ECLIPSE T E M P E R A T U R E S
FIGURE 27 --Comparison of average machine-calculated S-hand rrns siopcs and average infrared eclipse temperatures for selected geologic map units along Apollo 14, 15, and 16 bistatic-radar tracks Points represent averages taken from Moore and others (1976) where number in sample is greater than 50 (except points representing Herschel, Lansberg, and Euler, which have fewer than 50) LAC numbers indicate geologic maps in which mare units occur (see figs 25 and 26) Mare materials (filled circles) plot at lower right (except mare material in Montes Riphaeus region, Apollo 14); highland (triangles) and crater (open circles) units plot at upper left except for Euler, which has anomalously high average infrared eclipse temperatures

LUNAR REMOTE SENSING AND MEASUREMENTS
good fit to the S-band radar results (fig 28). The cumulative distribution is approximately a gaussian curve for the VHF radar, although the histogam shows minor departures (fig 28) Mare surfaces a t lat 23.F N , long 26O W., are examples of tailed distri butions. The tail or excess of slopes above the gaussian curve a t large slope angles is less strong for the S-band radar than that of the VHF radar in Mare Imbrium (fig 29) Distributions are complex in the highlands near Glaisher (lat 11.4O N., long 52O E.). Although the S-band distribution is approximately normal, the VHF distribution is clearly complex (fig. 30) The data avail- able have not been completely analyzed, but i t appears a t this time that mare surfaces have tailed distri-
Estimated -
alqebrdic -
- : G 1 0
m Z 0 - s - U J nUJ
lus- 0 2 UJ
I- n < E deviation - 3 : 2 3 0 0 1 :
0 01 0 5 10 15 20 25
S L O P E A N G L E ,
R o n q 31 B E
\ Estimated \ standard
deviation
I - 11 - -
-
Estimated -
ilqebraic -
standcird
deviation -
- -
-
- -
-
I
0 5 10 15 20 2 6
I N D E G R E E S
FIGURE 28 -13istatic-radar and photogrammetry slope-probability distributions of the normal type for A, 13-cm (S-band) radar, B, 116-cm (VHF radar), and C, 25-m slope length Photogrammetry distribution a t 202 m,D, is not the normal type Solid line is actual cumulative distribution; dashed line is cumulative gxussian dis- tribution. Histogram shown with solid lines Sampled area is high- lands near crater Vitruvius Radar data courtesy of G . 1, Tyler, Stanford University
Estimated
sraridar d
Estimated Estimated -
algebraic - standard
deviation 1 5 O -
- - - -
-
S L O P E A N G L E , I N D E G R E E S
FIGURE 29 --Bistatic-radar and photogrammetry slope-probability distributions of the tailed typed for A , 13-cm (S-band) radar, B , 116-cm (VHI?) radar, C, 25-m slope length, and D , 200-m slope length Solid line is actual cumulative distribution; dashed line is cumulative gaussian distribution Histogram shown with solid lines Actual distribution has more slopes a t large slope angles than gaussian distribution Area sampled by radar is mare mate- rial in Mare Imbrium Area sampled by photog~ammetry is mare material in Mare Serenitatis Radar data courtesy of G L Tyler, Stanford University
butions whereas highland surfaces may be normal, tailed, or complex.
The forms of the slope-probability distributions obtained by the radar are similar to those obtained independently using photogrammetric techniques in the same terrain type, and the algebraic standard de- viations are generally about the same for both tech- niques (figs. 28, 29, and 30; Moore and others, 1976). Slope-probability distributions of experimentally cra- tered surfaces also exhibit parallels with those ob- tained by the radar (Moore and others, 1974, 1975, 1976). Thus, the radar technique for obtaining slope- probability distributions and characterizing lunar surfaces is a valuable tool for future lunar exploration.

APOLLO 15- 17 ORBITAL INVESTIGATIONS
L a t 1 1 3 ' ~ ,
l o n g 52 O E
1 \ Est i rna ted
a lgebra ic
s t a n d a r d t \ d v i a t , o n
E s t i m a t e d
algebraic -
S L O P E A N G L E , IN D E G R E E S
FIGURE 30.-Histatic-radar and photogrammetry slope-probability distribution of the complex type for A , 13-cm (S-band) radar, B , 116-cm (VHF) radar, C, 25-m slope length, and D , 202-m slope length Solid line is actual cumulative distribution; dashed line is cumulative gaussian distribution Histogram shown with solid lines Sampled area is highlands near crater Glaisher. Note modes in histogram for 116-cin radar and photogrammetric distributions. Radar data courtesy of G Ii Tyler, Stanford University.
Although the bistatic-radar experiment was a suc- cess, three unresolved problems should be noted: (1) machine-calculated rms slopes are uniformly smaller than algebraic standard deviations estimated from the slope-probability d i~tr ibut ions ,~ (2) in the analysis of the echo spectra for slope-probability distributions, slope angles larger than 20Â are excluded, and (3) VHF rms slopes sometimes exceed S-band rms slopes. The machine-calculated rrns slopes are about 1 . 5 O smaller
'Algebraic standard deviations are estimated as that slope angle corresponding lo ;
cumulative of 0 :I16 for slopps equal lo and greater than that slope angle
,han the algebraic standard deviations (table 9, fig. 51) This difference may result because the surface is issumed to be gaussian and well behaved in the nachine-calculated rms slopes (Tyler and others, 1973), and signal-noise is treated differently in the two nethods.
The exclusion of slope angles larger than 20Â is not ierious for mare surfaces and relatively smooth high- ands For rough highlands and craters, this exclusion s significant. For example, the crater Euler has an ilgebraic standard deviation of about 1 9 O for an adirec- Aonal slope probability distribution for the surface
'ABLE 9 -Comparison of machine-calci~l(~t(,d rms slopes, hand- calculated rms, and algebiaic standard deviations (a) estimated /,om slope-probability distributions
- - - - - -- - -
S-band radar - VHF radar
rype of surface and location Machine Iland IT Machlnp Hand CT
Ware Ware Highland Highland Highland Highland Highland
7- I I I I I
0 EXPLANATION
/ X V H F radar / o S b a n d radar /
M A C H I N E C A L C U L A T E D
R O O T M E A N S Q U A R E S L O P E , IN D E G R E E S
FIGURE 31.-Comparison of algebraic standard deviations esti- mated from slope-probability distributions measured by radar- and machine-calculated rms slopes Estimated alge- braic standard deviations a r e larger than rms slopes for both S-band and VHF frequencies. Radar data courtesy of G. L Tyler, Stanford University

LUNAR REMOTE SENSING AND MEASUREMENTS B4 1
within the rim a t a scale length of 24 rn. If the crater interior were sampled to give unidirectional slopes, the algebraic standard deviation would be 12O instead of 19O. Thus, S-band rms slopes for Euler, which reach 5.6" (machine calculated) and 7.1Â (hand calculated), a re too low
VHF rms slopes tha t exceed S-band rms slopes would not be expected. Clearly, roughness increases with de- creasing scale length. However, if the two radars act a s a filter and measure roughness contributions between two different scale-length increments, such a result is possible..
Despite some minor inconsistencies, the bistatic- radar results a re very good; (1) The roughness esti- mates agree with the visual and photographic evidence for the Moon and are consistent with the geologic map units, (2) the combination of radar roughness, albedo, and infrared eclipse temperatures could be used to pro- duce maps of the Moon which would, in general, re- semble the distribution of the major terrain types, ( 3 ) the results on slope-probability distributions obtained by the radar a re in general agreement with those ob- tained using photographs and photogrammetric tech- niques.
EARTH-BASED RESULTS
REP LF,C 1 ION O F SOLAR RADIA HON WITH WAVLLLNTH FROM 0.3 pM '1 0 2.2 pM
By GERALD 0 SCIIABER
The methods of photometry, polarimetry, col- orimetry, and spectral reflectivity have been applied to reflected lunar light since early in the present century to obtain data on the physical and chemical composi- tion of the lunar surface. The four techniques for opti- cal characterization of the Moon will be summarized with reference to its major geologic significance in this section. Each of these techniques complimented one another and provided the basis for the resurgence since the Apollo missions of interest in high-resolution spectral reflectivity variations a s they relate to chemi- cal composition of the Moon They form a useful basis for extrapolation of the Apollo results to other areas of the Moon and for discovering lunar areas tha t have properties unlike those sampled by Apollo
Earth-based photometric and polarimetric investiga- tions of the Moon proved to be extremely accurate in predicting the fine-scale physical properties of the lunar surface before the first close-up observations by the Luna 9 and Surveyor I spacecraft in February and June 1966 (Dollf'us, 1962; Hapke, 1963; Hapke and Van Horn, 1963). The Moon was found to scatter light
in a unique manner, and i t could be characterized by four distinct photometric properties: (1) a visual albedo tha t is uniformly low, ranging from 5 percent to 18 percent, (2) a sharp maximum of visual albedo a t or near full Moon (zero phase), (3) a strong dependence between visual albedo and lunar phase, which is nearly independent of location on the lunar disk or type of terrain on the lunar surface; and (4) polarization of visible reflected light varying from (a) zero a t full (b) to maximum negative polarization of 1.2 percent a t a phase angle of 11Â (c) to zero again a t a phase angle of 23" where the plane of polarization suddenly rotates, and (d) then reaching a broad maximum near 110Â (Hapke, 1964).
These photometric properties were early recognized to be grossly different from most of the common ter- restrial materials (summarized by Fessenkov, 1962, and Markov, 1962; Hapke, 1963; Hapke and Van Horn, 1963; Pellicori, 1969; Dollfus and others, 1971). Al- though basaltic powders and dark volcanic ash and slag were among these lunar materials suggested, 110 firm conclusions about the composition and nature of the minerals involved could be determined (fig. 32) (Dollfus, 1962) Taken collectively, the photometric and polarization properties of the Moon were correctly interpreted to result from a uniform covering of the lunar surface by dust or ash-like material with up to 90 percent voids into which light from any direction could penetrate. The surface particles were suggested to be mostly opaque with fairly rough surfaces and a n aver- age grain size of 10 urn, capable of absorbing 70 per- cent or more of the light incident on them This porous, dark opaque layer need not be thick because of the very small penetration of sunlight.
: 12--
A N G L E O F S IGHT, IN D E G R E E S
FIGURE 32 -Polarization of' light of the Moon and of some mixtures of volcanic ashes (from Dollfi~s, 1962, after Lyot, 1929) A , Mix- ture of volcanic ashes with a n albedo of 0 13; B , mean curve for the Moon,

B42 APOLLO 15-17 ORBTTAI. INVESTIGATIONS
One of the main difficulties with duplicating the lunar photometric curves lay in the fact tha t pulveriza- tion of even the darkest terrestrial rocks results in a powder tha t has a relatively high albedo (Salisbury, 1970; Adarns, 1967; Minnaert, 1969) Consequently, i t was difficult to explain the low albedo of the lunar sur- face, interpreted by photometric and polarization studies to be covered with fine material.
Pulverized terrestrial silicate rocks have a high al- bedo because of the relatively low absorption coeffi- cient of silicate minerals, which allows progressively more light to pass successfully through some part of a grain, a s particle size is reduced, to be scattered back to the viewer (Salisbury, 1970). The only terrestrial nia- terials which have high absorption coefficients, and thus decreased albedo with pulverization, a re oxides, sulfides, and native metals. Opaque minerals such as magnetite and ilmenite a re present in terrestrial rocks, but not in the proportions necessary to cause decreasing albedo with decreasing particle size
After the samples were returned by Apollo, the lunar surface material was known to be a complex, multi- component system consisting of rocks of several major compositions, high concentrations of iron-titanium oxides, brown-red to black (including green and orange) glasses and agglutinates, and possibly metal- rich opaque grain coatings. The effects of the high iron-titanium glasses and metal-rich grain coatings on the observed lunar albedo have been the primary sub- ject of debate.
The production of glass a t the lunar surface is among the explanations offered to account for the lunar sur- face darkening process (Conel and Nash, 1970; Adanis and McCord, 1971a, b). I t was theorized tha t while crushed lunar rock has a relatively high albedo, glass produced by impact melting of the same rock is quite dark, thus a s more and more dark glass is churned into or deposited upon light-colored sediments, they darken with time. This postulate can be re,jected because true glasses of lunar composition, created in the laboratory, have an albedo much higher than tha t of lunar soil and thus mixing of this material with pulverized lunar crystalline rocks would not appreciably darken lunar soil (Hapke and others, 1973).
Partial devitrification could make lunar glasses more absorbing (darker) by crystallization of opaque inclusions rich in iron and titanium (Hapke and others, 19'73; Nash and Conel, 1973). The degree of devitrifica- tion, however, is a complex function of rate of cooling and composition of a glass (Cassidy and Hapke, 1975). Although black glass spherules a t the lunar surface do often show extensive devitrification i t is not known exactly what processes a re involved. Presumably, fresh glass within a thick ejecta blanket would cool slowly
enough to devitrify and would later be brought up to the surface by impact cratering. The degree of de- vitrification observed could then depend on the local conditions related to subsequent excavation of mate- rial by impacts. In conflict with this view, devitrified laboratory glasses have absorption bands characteris- tic of ilmenite, which are not visible in lunar fines and which would have to be masked during the course of lunar soil darkening (Cassidy and Hapke, 1975). Fur- thermore, the idea tha t subsurface sediments contain large amounts of darkened devitrified grains working their way upward is not supported by examination of core samples These observations lead to the resurrec- tion of a n earlier suggestion (Gold, 1955; Hapke, 1966, 1970, Gold and others, 19'70; Hapke and others, 1970) tha t darkened lunar fines have been coated by light- absorbing thin films produced by micrometeorite va- porization or solar wind sputter-vaporization and depo- sition. Chemical etching of dark lunar soil removes material a t grain surfaces and restores the soil to a condition of high reflectivity, characteristic of crushed lunar basalt, thus strengthening the theory of darken- ing by a coating process (Hapke and others, 1970, Gold and others, 19'70). The amount of additional iron-rich material added to the lunar fines was quantified by heating lunar fines (10084) and pulverized crystalline rock (10017) in a n oxygen atmosphere to 100° on the therniogravimetric balance (Cassidy and Hapke, 1975). The weight of the fines increased 2 percent, and the weight of the rock powder increased 1 percent. Cal- culations showed tha t if all metallic Fe and Fe" in the samples were oxidized to F e ' ', both weight increases would have been about 1 percent; thus, the excess weight increase of the fines could be explained by oxi- dation of submicroscopic metallic iron in vapor deposited films on grain surfaces. The argument has been strengthened by measurements of overall en- richments of iron a t the grain surfaces of smoothed lunar fines, compared to the bulk coniposition of the gram samples, the degree of iron enrichment was found to be correlated with the visual albedo of the fines (Gold and others, 1974) Unpublished data on the magnetic character of the thin iron-rich films on lunar fines indicate t ha t the films contain more than 10 per- cent iron a s superparamagnetic particles smaller than 3OA (Cassidy arid Hapke, 1975). Such materials could thus account for a large part of the lunar darkening effect by causing strong visible absorptions. The pres- ence of large concentrations of superparamagnetic iron in the grain coatings could also be a major factor in creating the variable natural remanent magnetization observed on the old, more mature, lunar breccia ter- ranes (see section on "Lunar Magnetism").
In another proposed mechanism for alteration and

LUNAR REMOTE SENSIN(; AND MEASUREMENTS B43
darkening of the lunar regolith (Housley and others, 1973, 19741, solar wind protons are embedded in the surfaces of lunar grains which are subsequently melted by micrometeroid impact, thus darkening the grain surfaces This process has not yet been verified exper- imentally.
An even more rewarding approach to analysis of re- flected lunar light has been to observe its behavior a s a function of wavelength and spectral energy distribu- tion of the reflected sunlight (McCord and Adams, 1973). This is, in short, observation of lunar color dif- ferences, distinct from albedo in that, for the latter, the reflected light is analyzed relative to the source light for its intensity a t one or more wavelengths.
Investigation of lunar surface color variations in the visible and near infrared have been of considerable sci- entific interest since early in this century. Beginning with the quantitative visual observations of Wilsing and Scheiner (1921) in 1908-1910, i t was recognized that the lunar highlands were redder than the lunar maria When the first lunar spectrally filtered photo- graphs were reported by Miethe and Seegert (1911)
"1 011s and Wood (1912), additional unique spectral re&. such a s the Aristarchus plateau (Wood's Spot) were recognized. These early lunar photographic studies were soon followed by those of Miethe and Seegert (1914) and Barabashov (1924). Wright (1929) was the first to obtain high-quality spectrally filtered compo- site photographs of the Moon.. He utilized six filters in the ultraviolet, violet, green, orange, red, and extreme red. The use of spectrally filtered composite plioto- graphs stresses differences in color and subdues differ- ences in albedo between reflecting areas.
In recent years Barabashov (1953), Scott (1964) and Whitaker (1972, 1973, and in Kuiper, 1965) have pro- duced improved definition, enhanced color-difference photographs of the Moon (fig. 33). These photographic studies of lunar color have all shown the same major color anomalies: t he relative redness of central Serenitatis compared with Tranquillitatis, the blue area in Mare Imbrium, and others. However, the dis- advantages of the photographic method for color analysis a re tha t i t is not rigorously quantitative and is weakly dependent on albedo variations, phase angle, and the exposure characteristics of the film. In some cases, these variables can be misinterpreted a s color differences.
I t was early recognized that, although the color image method was most useful to obtain data on the size, shape, and boundary sharpness of' lunar color re- gions, more quantitative data would be needed, Quan-
i tat ive methods were soon reported, and for the most "ions >art, they verified nearly all of the lunar color reg,'
i r s t described from the photographic image data. Fechniques applied to this task included (1) photo- graphic spectrophotometry, (2) photographic ipectroscopy, (3) photoelectric photometry, and more "ecently (4) four-color multi-spectral scanning tech- liques and (5) vidicon imaging photometry. A detailed historical account of the early investigations is re- oorted by McCord (1968).
The major goals of those attempting to quantify lunar spectral reflectivity were to determine (1) the shape of the reflectivity curves over large spectral range; (2) the magnitude of lunar color contrasts, (3) the time dependence, if any, of the color contrasts, and (4) the effect of albedo and surface morphology on color contrasts.
Determination of the shape of the spectral reflectiv- ity curve required measurements made a t several wavelengths and over a n extended spectral range. The methods of spectroscopy and rnultifilter photometry were utilized for this purpose (fig. 34) Workers using these techniques found tha t a t least some lunar spectral reflectivity curves contain flexures which were interpreted a s absorption and emission features asso- ciated with specific minerals and rock types (Adarns, 1967, 1968, Adams and Filice, 1967, Aronsori and others, 1967)
The magnitude of the color contrasts seems to de- pend on the size of the spectral interval considered and the areas of the lunar surface observed (fig. 35). Al- though the degree of color variations reported in ear- lier works (McCord, 1968) showed some discrepancy, recent high resolution (0.1 to 0.3 percent) meas- urements indicate tha t the spectral reflectivity differ- ences, measured with respect to a standard area in Mare Serenitatis (fig. 34A), a re most frequently under 5 percent, and differences of 10 percent a re common (McCord, 1969). In specific areas, differences reach above 20 percent, and the maxinium difference from the most red area to the most blue is about 60 percent
The verification of a time dependence of lunar color contrasts was to be a n important aspect of spectral re- flectivity investigations, especially in large-scale map- ping programs. Lunar spectral reflectance differences of the order of 2 to 3 percent have been measured for phase angles of 0" and 35" (McCord, 1968) The varia- tion between phase angles of 35O to 90- a re generally around 1 percent. Color index observations (Gehrels and others, 1964) were the first to show clearly tha t the Moon exhibits a slight reddening with phase angle and

B44 APOLLO 15- 17 ORRITAL TNVESTl(iATI0NS
FIGURE 33 -Composite color-difference photograph of the Moon Spectral bands used were 0 37 urn and 0 61 urn. Light is red, dark is blue Diameter of Moon is 3,476 k m Photograph courtesy of E A Whitaker, Lunar and Planetary L,aboratories, University of Arizona, r 1 1 ucson, Arizona
that the lunar brightness increases significantly within 5 O of full Moon ("opposition effect")
The dependence of lunar color on albedo has been reported by almost all workers, each observing a gen- eral reddening of the lunar surface with increased al- bedo Radlova (1941, 1943) reported that darker lunar regions exhibit a wide range of colors, while the lighter
regions, in general, are characterized by reddish tints. Fresh craters are very important exceptions to this rule, however (Radlova, 1943; McCord and others, 1972) The few exceptions to the reddening effect have important geologic significance and will be discussed later in this paper. The reddening law seems to hold more strongly in the maria than in the uplands or for
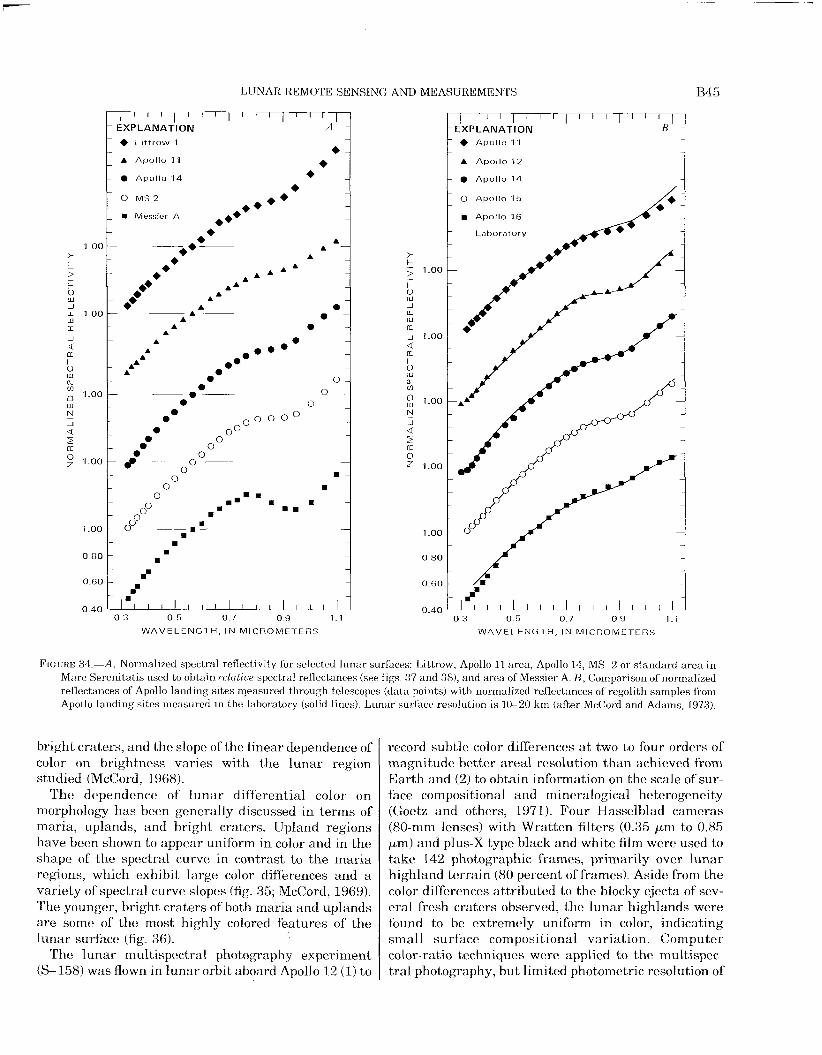
LUNAR REMOTE SENSING ANT) MEASUREMENTS B45
EXPLANA'T ION
 Lit t row 1
A Apollo 11
 Apollo 14 Â
0 M S 2
H Messier A 1
WAVELENGTH, IN MICROMETERS
EXPLANATION Â Apollo 11
A Apollo 12
 Apollo 14
WAVELENGTH, IN MICROMETERS
FIGURE :+-A, Normalized spectral reflectivity for selected lunar surfaces: Littrow, Apollo 11 area, Apollo 14, MS-2 or standard area i n Mare Serenitatis used to obtain iclatiue spectral reflectances (see figs. 37 and 38), and area of Messier A B , Coinparison of normalized reflectances of Apollo landing sites measured through telescopes (data points) with normalized reflectances of' regolith samples from Apollo landing sites measured in the laboratory (solid lines) Lunar surface resolution is 10-20 km (after McCord and Adanls, 1973).
bright craters, and the slope of the linear dependence of color on brightness varies with the lunar region studied (McCord, 1968).
The dependence of l una r differential color on morphology has been generally discussed in terms of maria, uplands, and bright craters. Upland regions have been shown to appear uniform in color and in the shape of the spectral curve in contrast to t he maria regions, which exhibit large color differences and a variety of spectral curve slopes (fig. 35; McCord, 1969). The younger, bright craters of both inaria and uplands are some of the most highly colored features of the lunar surface (fig. 36).
The lunar rnultispectral photography experiment (S- 158) was flown in lunar orbit aboard Apollo 12 (1) to
record subtle color differences a t two to four orders of magnitude better areal resolution than achieved from Earth and (2) to obtain information on the scale of sur- face compositional and mineralogical heterogeneity (Goetz and others, 1971). Four Hasselblad cameras (80-mm lenses) with Wratten filters (0.35 p r r i to 0.85 pm) and plus-X type black and white film were used to take 142 photographic frames, primarily over lunar highland terrain (80 percent of frames). Aside from the color differences attributed to the blocky ejecta of sev- eral fresh craters observed, the lunar highlands were found to be extremely uniform in color, indicating small surface compositional variation. Computer color-ratio techniques were applied to the multispec- tral photography, but limited photometric resolution of

B46 APOLLO 15- -17 ORBITAL INVESTIGATIONS 7-1 1 r- 1 I I
1 EXPLANATION T T I 1-1- I 1 -
EXPLANATION 0 Alphonsus 2
0 Mare Humoru rn 41
X Uplands 7 - Fra Mauro 7
. Descartes 3
Mare Frtgor is 1
Plato C
Miire t iu rnorurn 5 1
Le Monnier
F ta Mduro 15
Luna 16 landing site
Mare Hu rno rum 0
Mare Trar iqut l l~ ta t is 1
W A V E L E N G T H , I N M I C R O M E T E R S
W A V E L E N G T H , I N M I C R O M E T E R S
FIGURE 35-Relative spectral reflectivity of lunar maria, A, and highlands, B Curves are ratios of spectral reflectance a t 10-20 krn resolution for area indicated and standard area of Mare Serenitatis (MS- 2 in fig 34) Vertical bars represent range of values within one sigrna confidence level Although the Moon has a reddish color, areas with curves sloping to left a r e termed "red" and areas with curves sloping to right are termed "blue" (after McCord and Adams, 1973).

LUNAR REMOTE SENSING AND MEASUREMENTS B47
7 1-- I - r - I I--7- EXPLANATION *
0 Mosting C
Kepler
x Messier A
Mdre Humorum 45
Lir ine
0 3 0 5 0 7 0 9 1 1
W A V E L E N G T H , I N MICROMETERS
1 00
ffl ec UJ I- UJ 'S
1 0 0
u 2 [".
2 1 0 0
0 UJ _I
< u ffl > 1 00
I- > I- u UJ _1
LL 1 0 0 w re
0 96
0 92
0 88
0 84
0 80
EXPLANATION h
0 Proclus
Censorinus 2
X Descartes 2 - Fra Mauro 6 - Tycho 1 T ^
4
W A V E L E N G T H . I N MICROMETERS
FIGURE 36 -Relative spectral reflectivity of bright craters in maria, A, and highlands, B Both types of craters would appear to be relatively "blue" when measured with spectral bands near 1 0 p.m and 0.4 urn Form of relative reflectances of craters i n maria is distinct from those in highlands (after McCord and Adams, 1973) Vertical bars represent range of values within one sigma confidence level
the film emulsions and a number of systematic errors innate to photographic spectral observations impaired results (Goetz and others, 1971).
sion and found tha t these colored materials occurred only within the confines of the dark mantle deposits.
Apollo 17 lunar module pilot Harrison Schmitt SPf ( 1 RA1 f<l~SPO\SF \ \ U ( 11L\lI( \ I ~.O\Il'OSI 1 IOh
(1974) made direct orbital visual observations (near zero phase) of lunar color of both mare and upland in the Mare Serenitatis-Mare Crisiurn region H e re- ported unanticipated clarity of the color hues ranging from blue-tan to brown and orange to brown. Lucchitta and Schinitt (1974) discussed the presence of orange and red features observed and photographed in the Sulpicius Gallus Formation during the Apollo 17 mis-
The importance of remote quantitative spectral re- flectivity measurements lies in the uniqueness of visible and near-infrared diffuse spectra of pyroxenes and other common rock-forming minerals and the ex- tent to which telescopic spectra can be used to deter- mine mineraloey of the Moon and other planetary bodies Laboratory studies of the reflection spectra of

B48 APOLLO 1 5 1 7 ORRITAI, INVESTIGATIONS
igneous rocks (Adams and Filice, 1967; Hunt and Salisbury, 1970; Adarns and McCord, 1972; Adams, 1974; Charette and others, 1974) have shown tha t the diffuse reflectance spectra a re related to mineralogy and chemical composition (fig. 37). Electron absorption bands, present in the diffuse spectra of most minerals and their powders, were found to be produced by t r am sition elements, notably iron and titanium, in various valence and coordination states. These band frequen- cies a re sensitive to distortion of transition metal d-orbital shells by neighboring atoms and because metal-oxygen distances differ for most minerals, the frequencies of the absorption bands can be used to identify minerals tha t exhibit them (McCord and
a Enstat i te
W A V E L E N G T H , I N MICROMETERS
FIGURE 37 -Spectral reflectance of several common sili- cate minerals (alter Adams, 1968 ) Curves separated for clarity
Johnson, 1970). The primary basis for the interpreta- ,ion of absorption bands in the spectra of silicate rocks ind minerals between 0.3 urn and 2,5 p m was devel- iped through the application of crystal field theory to nineralogy (Burns, 1965; White and Keester, 1966). Transmission spectra of oriented single crystals, using solarized light, led to later refinements in band as- ji~~lme11t (Bancroft and Burns, 1967; White and Kees- ter, 1967, Burns, 1970).
Adams (1967, 1968) presented evidence tha t the 1 .0 fim absorption band in telescopic spectra of the Moon may indicate the presence of basaltic material; more specifically, Fe 2 residing in olivine or an iron- and calcium-bearing pyroxene or both. The wavelength po- sition ~ f ' F e + ~ absorption in pyroxene near 0.95 urn is a sensitive measure of the iron and calcium content of the pyroxene (Adams, 1974) (fig. 38). The symmetry of this band can be used to detect the presence of olivine.
The construction of high-resolution double-beam filter photometers in the years just before the Apollo missions (McCord, 1968, McCord and Johnson, 1969) permitted high-quality measurements (0.1 to 0.3 per- cent) of lunar spectral reflectivity (0.4 p m to 1.0 kin) for the first t ime (fig. 34), These spectra, normalized to a standard region in Mare Serenitatis (long 21.4O E , lat 18 7" N.), showed clear spectral differences between maria, highlands, and fresh crater materials (figs. 35, 36). These classes of spectrum shapes were later (McCord and others, 1972) referred to a s spectral types The studies by McCord (1968) and McCord and .Johnson (1969) confirmed the earlier suggestion by Adams (1968) tha t absorption features evident on lunar spectral curves a re similar to those found for
1 E X P L A N A T I O N 1 I 1 I 1 1
0 Rocks, breccias 8 a SOIIS 0Q
0'
3 1 9 2 0 2 1 2 2 2 3
I O N G W A V E L E N G T H , I N MICROMETERS
FJGIJBE 38 -Position of short-wavelength absorption band plot- ted against position of long-wavelength hand for various Apollo samples (after McCord and Adarns, 1973). Numbers indicate number of Apollo Mission
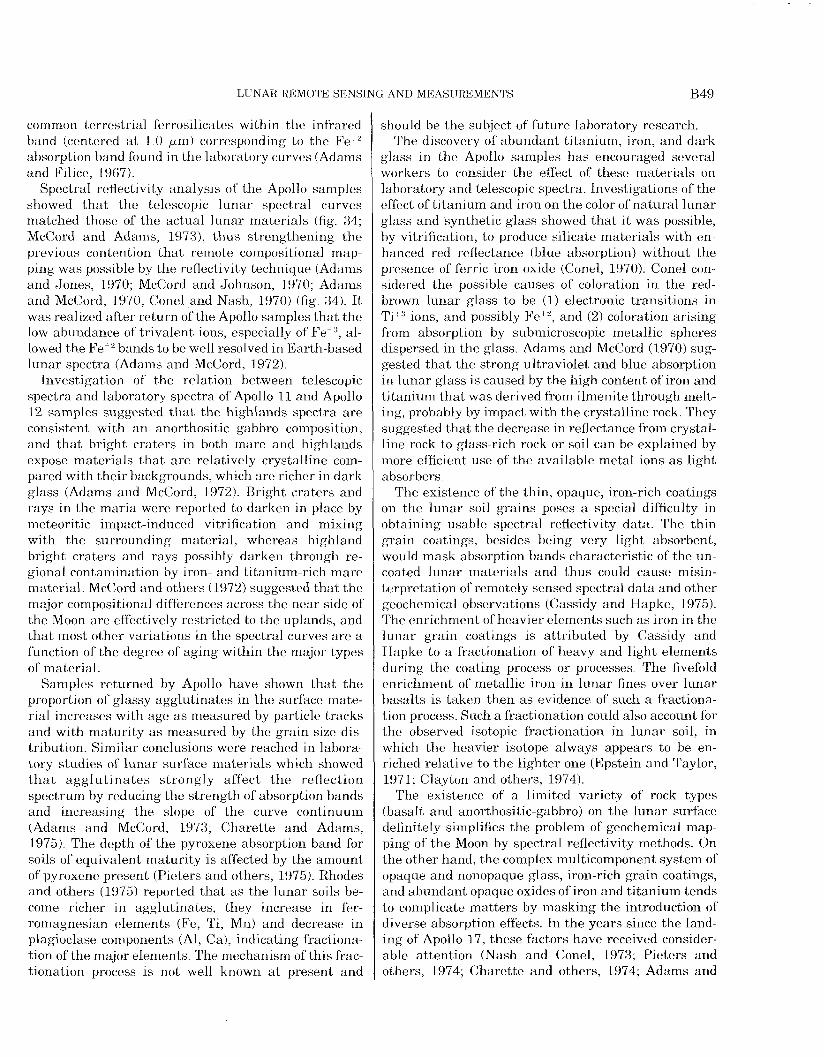
LUNAR REMOTE SENSl AND MEASUREMENTS B49
common terrestrial ferrosilicates within the infrared band (centered a t 1 .0 urn) corresponding to the Fe" absorption band found in the laboratory curves (Adams and Filice, 1967)"
Spectral reflectivity analysis of the Apollo samples showed tha t the telescopic lunar spectral curves matched those of the actual lunar materials (fig. 34; McCord and Adams, 1973), thus strengthening the previous contention tha t remote compositional map- ping was possible by the reflectivity technique (Adams and Jones, 19'70; McCord and Johnson, 1970; Adanis and McCord, 1970; Conel and Nash, 1970) (fig, 34). I t was realized after return of the Apollo saniples tha t the low abundance of trivalent ions, especially of Fei:{, al- lowed the Fet2 bands to be well resolved in Earth-based lunar spectra (Adams and McCord, 1972).
Investigation of the relation between telescopic spectra and laboratory spectra of Apollo 11 and Apollo 12 samples suggested tha t the highlands spectra a re consistent with a n anorthositic gabbro composition, and that bright craters in both mare and highlands expose materials t ha t a re relatively crystalline con- pared with their backgrounds, which are richer in dark glass (Adams and McCord, 1972). Bright craters and rays in the maria were reported to darken in place by meteoritic impact-induced vitrification and mixing with the surrounding material, whereas highland bright craters and rays possibly darken through re- gional contamination by iron- and titanium-rich mare material, McCord and others (1972) suggested tha t the major compositional differences across the near side of the Moon are effectively restricted to the uplands, and tha t most other variations in the spectral curves a re a function of the degree of aging within the major types of material.
Samples returned by Apollo have shown tha t the proportion of glassy agglutinates in the surface mate- rial increases with age a s measured by particle tracks and with maturity a s measured by the grain-size dis- tribution. Similar conclusions were reached in labora- tory studies of lunar surface materials which showed t h a t agglu t ina tes s trongly affect t h e reflection spectrum by reducing the strength of absorption bands and increasing the slope of the curve continuum (Adams and McCord, 1973, Charette and Adanis, 1975) The depth of the pyroxene absorption band for soils of equivalent maturity is affected by the amount of pyroxene present (Pieters and others, 1975). Rhodes and others (1975) reported tha t a s the lunar soils be- come richer in agglutinates, they increase in fer- romagnesian elements (Fe, Ti, Mn) and decrease in plagioclase components (A\, Ca), indicating fractiona- tion of the major elements The mechanism of this frac- tionation process is not well known at present and
should be the subject of future laboratory research. The discovery of abundant titanium, iron, and dark
glass in the Apollo samples has encouraged several workers to consider the effect of these materials on laboratory and telescopic spectra. Investigations of the effect of titanium and iron on the color of natural lunar glass and synthetic glass showed tha t i t was possible, by vitrification, to produce silicate materials with eri- hanced red reflectance (blue absorption) without the presence of ferric iron oxide (Conel, 1970). Conel con- sidered the possible causes of coloration in the red- brown lunar glass to be (1) electronic transitions in Ti':' ions, and possibly FeI2, and (2) coloration arising from absorption by submicroscopic metallic spheres dispersed in the glass. Adams and McCord (1970) sug- gested tha t the strong ultraviolet and blue absorption in lunar glass is caused by the high content of iron and titanium tha t was derived from ilmenite through melt- ing, probably by impact with the crystalline rock. They suggested tha t the decrease in reflectance from crystal- line rock to glass-rich rock or soil can be explained by more efficient use of the available metal ions a s light absorbers
The existence of the thin, opaque, iron-rich coatings on the lunar soil grains poses a special difficulty in obtaining usable spectral reflectivity data. The thin grain coatings, besides being very light absorbent, would mask absorption bands characteristic of the un- coated lunar materials and thus could cause misin- terpretation of remote1 y sensed spectral data and other geochemical observations (Cassidy and Hapke, 1975). The enrichment of heavier elements such a s iron in the lunar grain coatings is attributed by Cassidy and Hapke to a fractionation of heavy and light elements during the coating process or processes. The fivefold enrichment of metallic iron in lunar fines over lunar basalts is taken then as evidence of such a fractiona- tion process. Such a fractionation could also account for the observed isotopic fractionation in lunar soil, in which the heavier isotope always appears to be en- riched relative to the lighter one (Epstein and Taylor, 1971; Claytori and others, 1974).
The existence of a limited variety of rock types (basalt and anorthositic-gabbro) on the lunar surface definitely simplifies the problem of geochemical map- ping of the Moon by spectral reflectivity methods. On the other hand, the complex multicomponent system of opaque and nonopaque glass, iron-rich grain coatings, and abundant opaque oxides of iron and titanium tends to complicate matters by masking the introduction of diverse absorption effects. In the years since the land- ing of Apollo 17, these factors have received consider- able attention (Nash and Conel, 1973; Pieters and others, 1974; Charette and others, 1974; Adams and

B50 APOLLO 1 5 1 7 ORBITAL INVESTIGATIONS
others, 1974; Adams, 1974; Pieters and others, 1975). Nash and Conel (1974) have shown that with con-
struction of ternary plots of (a) reflectance a t 0.55 pm, (b) band depth4 a t 0.9 pin, and (c) red-to-blue ratios (0.7prri-0.4pm) with suitably calibrated curves, one can estimate mineral concentrations on a quantitative basis from spectral reflectivity data on unknown rock materials. They suggest that complicating factors to this technique include (1) the abundance of additional components not included in the calibration mixture such as olivine and glass and their degree of opaque- ness; (2) the albedo and band depth variations of the component mineral species as functions of their parti- cle size and bulk porosity of the mixture, and (3) the composition of the pyroxene, which affects the mean position and depth of the absorption band near 0.9 pm. Details on the effects of glasses and ilmenite on lunar and planetary spectral reflectances are summarized as follows (Nash and Conel, 1974): Devitrified glass mixed with crystalline material re-
duces the albedo and overall spectral reflectance in the range 0 3-2.0 prn and broadens, flattens and shifts absorption bands due to Fe^, originally in pyroxene, plagioclase, and olivine (fig. 39).
Nonopaque glass causes relatively deep absorption hand structures that distort or overwhelm bands from crystalline material. The albedo effect will be proportional to the glass content. The nonopaque glass will cause maximum band distortion but minimum darkening of material.
Opaque glass causes shallow absorption bands with lit- tle distortion effect on crystalline bands, but al- bedo depression will be large relative to glass con- tent (similar to ilmenite effect).
Ilmenite has a diluting effect disproportionate to its concentration in mixtures with nonopaque rniner- als, tending to reduce strongly the overall albedo and the absorption band depth for the mixture (Nash and Conel, 1974).
Special applications of spectral reflectivity data to lunar geochemistry have included the detection ofTiOa content in bulk lunar soil (Charette and others, 1974; fig. 40). This technique makes use of the slope ol lunar-sample-calibrated spectral curves between 0.402 and 0.564 pm which is primarily affected by the iron and titanium absorptions in the lunar agglutinates and glasses. Finely disseminated metallic iron in the agglutinates also may have a rna.jor effect in thi: spectral region (Adams and McCord, 19'73).
Before the Apollo 17 mission, the visible and near. infrared spectrum of a 10-km-diameter area of dark mantling material 50 km northwest of the landing site
'Band depth J S the fractional deplb tu bottom of band from assmned background b e i ~ q ~ i a l tu s t ra ight line througli shouldprs of band (Nash and on on el, 1973)
W A V E L E N G T H , IN MICROMETERS
'IGURE 39 -Spectral reflectivity of (a) whole-rock powder, Apollo 12 sample 12063, 79; (6 ) rock powder plus 20 percent glass; (c) rock powder plus 55 percent glass; (d) Apollo 12 surface fines, sample 12070, 111, and (e) whole-rock glass made from sample 12063,79 (after McCord and Adams, 1973)
was measured using a filter-photometer-equipped tele- ;cope (Pieters and others, 1973) The reflectance spectra for the dark mantle near the Apollo 17 site and it least four other lunar areas were found to be distin- ~uishable from the spectra of nearly 200 other meas- red lunar areas The lunar dark mantle areas have relative spectral reflectivity curves which are very blue in the visible region and relatively bright in the in- frared (Pieters and others, 1973)
The spectral reflectances of samples of the orange glass and black soils from the Apollo 17 site were found to match Earth-based spectra of the dark mantle in the Taurus-Littrow region obtained by digital vidicon methods (Pieters and others, 1974; Adams and others, 1974). The dark mantle appears to be well developed northwest of the actual landing site but is much di- luted in the immediate landing site region by mature mare regolith, probably by secondary crater materials (Lucchitta, 1977).
The orange glass spectrum, characteristic of an iron- and titanium-rich glass, has a broad absorption band feature near 1.1 pm due to Fej2 on octahedral lattice sites and a weak band near 0.5 pm arising from Tib.$. The similarity of the Apollo 17 orange glass (74220) and black soil (74001) is consistent with the interpreta- tion that the black glass is the devitrified equivalent of the orange glass and that both materials probably originated in a volcanic fire fountain (Heiken and McKay, 1974) The green glass spheres found a t the Apollo 15 site are very similar in morphology to that of the orange glass but are more ultrainafic and have a unique spectra (Adams and others, 1974)

LUNAR REMOTE SENSING AND MEASUREMENTS B5 1
M A T U R E SOILS
12042. 15601
15021 14421 14141 . I M M A T U R E SOILS 15501
 15301 15101
APOIIO 16 (telescopic) 64421 61241 /22001 67480 61 221 w - - -
0 400 0 565 MICROMETER SLOPE
FIGURE 40 ---Percentage of titanium oxide in the bulk lunar soils as a function of 0 400 urn-0 565 /-un slope Arrows indicate probable evolution of immature soils into mature soils as a function of agglutinate content and hence of time (after Charette and others,
Mare Serenitatis, Mare Humorurn, and the Aristar- chus plateau region have been subjects of recent inves- tigations utilizing remotely sensed data such as spectral reflectivity, photographic color differences, Earth-based radar reflectivity (3.8-cm and 70-cm wavelengths), Apollo bistatic-radar echoes, photo- geologic mapping, and infrared eclipse temperature data (Thompson and others, 1973; Pieters and others, 1975; Zisk and others, 1977). The multispectral ap- proach in defining the nature and extent of geologic and geochemical surface units is well developed in these studies. The Aristarchus plateau region is some- what enigmatic because of its unusual response: It has a low albedo combined with low infrared eclipse tem- peratures, an extremely red color, and low reflectivities to 3.8-crn and 70-cm Earth-based radar Zisk and others (1 97'7) attribute these responses to the presence of a titanium-rich material (at least 10 m deep) that is relatively rock-free, and probably relatively large amounts of orange glass exposed at the surface, similar to that found at the Apollo 17 site.
The potential is high for extending high-resolution (areas smaller than 10 km diameter) spectral reflectiv-
ity mapping to the entire Earth-facing hemisphere of the Moon. This remote-sensing technique is perhaps unique in that the spectral definition of regional geologic units on the lunar surface can be done from Earth, unlike other geochemically related rneas- urements such as X-ray fluorescence, gamma-ray spectrometry, or alpha-particle spectrometry that re- quire lunar orbital platforms.
There is an obvious need, however, for more exten- sive laboratory research to support the conclusions made from the spectral reflectance data. Areas of re- search should include (1) further definition of the elec- tron charge transfers involving titanium and iron; (2) continued investigation into the effects of mixtures of lunar materials on spectral reflectance; and (3) categorization and quantification of spectral signatures resulting from masking and shifting of ab- sorption bands by opaque grain coatings and various types of lunar glass materials.
Future geologic applications of Earth-based lunar spectral reflectivity methods should include (1) recog- nition and areal mapping of spectrally unique lunar materials such as crystalline rocks exposed by young craters; dark mantle deposits containing green, orange, or black glass; (2) detailed investigations of various light plains deposits with regard to possible

B52 APOLLO 15 17 ORBITAL INVESTIGATIONS
variations in chemical, mineral, or glass components (3) detection of mineralogical, chemical and glass vari- ations radially away from craters of diverse ages for the purpose of recognizing stratigraphically unique materials excavated by the crater; (4) correlation of Earth-based radar reflectivity anomalies with unique spectral reflectivity signatures such as that of the Im- brium flows (Schaber and others, 1975); (5) analysis of extremely red lunar features such as the Gruithuisen domes (lat 35O N , long 40" W.); and (6) continued spectral mapping of the lunar maria surface units.
Earth-based spectral measurements of the lunar sur- face will provide the only significant new data on lunar chemistry in the near future until they are bolstered by high-resolution instruments aboard future spacecraft.
REFLECTION OF RADAR WAVES I R O M EARTH BASED ST. A I IONS
By GERALD G. SCHABER and H. J MOORE
Starting with the earliest lunar radio-echoes pro- duced in 1946 (DeWitt and Stodola, 1949), the Moon has been the sub.ject of extensive studies by Earth- based radar utilizing a wide range of wavelengths. Ex- cellent summaries of the history of lunar radar obser- vations and early interpretations are given by Evarit- (1962) and Evans and Hagfors (1971).
It was early recognized that the Moon behaved like a specular reflector in a small region centered a t the cen- ter of the visible disk but exhibited rapid fading 01 echoes due to limb dark scattering away from this re- gion. Early analyses of the subearth specular retur~ifc from the Moon were extremely successful in predicting the lunar radius, relative dielectric constant, and roughness of the center of the lunar disk (Evans and Pettengill, 1963). These predictions were subsequentlj confirmed by Surveyor and Apollo data,
The echoes from the Moon could not be conipletelj described as reflections from a gently undulating sur- face. Instead, two components were postulated: a quasi-specular echo arising from the gent1 y undulating surface, and a diffuse echo arising from scattering b j small-scale roughness. These components of the lunai radar echoes became evident by measuring echc polarizations. The strongest echo component is callec the polarized component and has the polarization ex- pected for a specular reflector The second, weakei component is called the depolarized component and i; polarized in the opposite sense. In theory, the quasi. specular echo comes from a small region of the center o the lunar disk and makes no contribution to the de, polarized echo, whereas diffuse scattering originating from practically all the lunar disk contributes to the polarized echo and is the chief mechanisni producing
,he depolarized echoes (Thompson and others, 19'70, Fhompson and Zisk, 19'72). Attention will be given jrimarily to the depolarized echoes because they are a measure of fine-scale roughness and other properties. Depolarized echoes originate from most of the Earth- acing regions of the Moon.
Diffuse scattering is generally thought to be caused 3y single and multiple scattering of radar echoes by rocks on the surface and within the upper few meters of the regolith (Hagfors, 1967; Burns, 1969; Pollack and Whitehill, 1972) This interpretation of the diffuse component was strengthened by the discovery of momalously enhanced, incoherent radar echoes from the region of the crater Tycho (Pettengill and Thompson, 1968) Other factors, which will be dis- zussed below, are also involved
Maps of back-scattered polarized and depolarized echoes from the Moon have been made for wavelengths of 3.8 cm (Zisk and others, 1974), 23 cm (Hagfors and others, 1968), 70 cm (Thompson, 1974; Thompson and Uyce, 1966), 75 cm (Ponsonby and others, 1972), 185 cm (Ponsonby and others, 1972) and 7 5 nl (Thompson, 1970). The maps are prepared using echo delay and doppler as a means of locating the scattering regions on the lunar disk (Thompson, 1974, Thompson and Dyce, 1966; Lincoln Laboratory, 1968; Pettengill and others, 1974). With this technique lunar radar maps have been prepared with resolution cells about 2 x 2 km and 10x10 km for 3 8-cm and 70-cni wavelengths, re- spectively. Much lower resolution radar maps have been made for other wavelengths. Geologic investiga- tions of lunar backscatter have been almost exclusively concerned with the 3.8 cm (fig. 41) and 70 cni (fig 42) delay-doppler radar maps owing to their superior reso- lution.
In a general sense, there are three kinds of de- polarized echoes: (1) average ones, (2) positive anomalies or echoes that are much stronger than aver- age, and (3) negative anomalies or echoes that are much weaker than average Depolarized echoes from the highlands are generally stronger than those from the maria, but this is clearly not the case everywhere. The general tendencies, as well as exceptions, are shown in figure 43 where polarized echoes have been plotted against average depolarized echoes from selected terrain types with 3.8-cm and 70-cm radar along the Apollo bistatic-radar subspecular tracks (figs. 44,45) Superimposed on the average backscatter of both the highlands and the maria are positive

LUNAR REMOTE SENSING AND MEASUREMENTS B53
anomalies, generally corresponding to craters such a s Euler (fig. 45; 29O W., Apollo 15), Theophilus (fig. 44; 26O E., Apollo 14), Lansberg (fig. 44; 26.5O W,,, Apollo 14), and some very small craters (near 48O W. and 52O W., Apollo 14; fig. 44) not visible in the accompanying illustrations. A negative anomaly is represented by dark mare material a t the edge of Mare Serenitatis (fig 45; 27" E., Apollo 15).
The variables producing the depolarized echoes have never been completely separated in a suitable experi- ment In radar theory, there a re five factors that may cause a positive anomalous depolarized echo: (1) an in- crease in the number of rocks wavelength size and larger in the upper meter or so of the regolith, (2) a n increase in the dielectric constant of a normally rough or blocky surface, (3) an increase in the electromag- netic absorption in the upper meter or so of the reg- olith, (4) to a variable extent, a slope tha t tilts the surface toward the Earth-based radar, and (5) a n in- crease in fine-scale roughness. All the factors may con- tribute to the resulting echoes either singly or in var- ious combinations, and there is evidence for each
Evidence for 3.8- and 70-cm depolarized echo en- hancements due to a n increase in concentrations of blocks has been found by correlating strong echoes with high infrared eclipse temperatures and visually blocky surfaces shown in high-resolution images and photographs (Thompson and others, 1974; Zisk and Moore, 1972). Depolarized echoes from craters decrease with (1) increasing age of the craters, (2) decreasing concentrations of resolvable blocks seen in images, and (3) decrease in infrared eclipse temperatures, which also decrease with the decrease in concentrations of blocks. These results a re also consistent with a n in- crease in the dielectric constant of the surface. On the other hand, relative dielectric constants for the lunar highlands (about 2.8) and maria (about 3.2) estimated during the Apollo and Explorer 35 bistatic-radar ex- periments (Tyler, 1968; Howard and Tyler, 197%) are reversed in magnitude compared to the expected val- ues from the magnitudes of highland and mare de- polarized echoes, a finding in conflict with the second factor (increase of the dielectric constant of a normally rough or blocky surface) if the uplands and maria are, in fact, normally rough and blocky. Evidence for echo enhancements due to slopes tilted toward the Earth- based radar is clear because Earth-facing slopes within craters have larger depolarized echoes than slopes fac- ing in the opposite or perpendicular directions (Moore and others, 1975; Moore and Zisk, 1973). This may be seen in figures 41 and 42 a s well a s figures 44 and 45, where the strong depolarized echo peaks from the cra- ter Lansberg (26.5O w., Apollo 14) and Euler (29- w . , Apollo 15) a re displaced to the west side of the cr- -1 t ers.
A similar conclusion is reached when echoes from the flanks of craters such a s Delisle and Diophantus (Moore and others, 1975) a re considered. Here, slopes of crater flanks facing the Earth have stronger de- polarized echoes than those facing the opposite direc- tion Relatively strong echoes from the highlands, in contrast with the maria, a re consistent with surface tilt because the bistatic-radar experiment (Howard and Tyler, 1972a, 1972b) and photographs (Moore and others, 1975, 1976) show tha t the highlands are significantly rougher at scale lengths of 30 to 250 in than the maria Highlands could therefore have a rela- tively large fraction of area of Earth-facing slopes a s viewed by the radar Evidence for echo enhancements due to small-scale roughness is found at the Apollo 17 landing site, where smooth-looking level surfaces have weaker depolarized echoes than rougher-looking level surfaces (Moore and Zisk, 1973).
The notion tha t the weaker echoes result from elec- tromagnetic absorption has received considerable at- tention. Pollack and Whitehill (1972), in developing a physical model of lunar radar multiple scattering, sug- gested tha t the most important factor affecting the dif- ferences in radar back scattering between mare and highlands may be the radar absorption length in rocks and soil within the two regions, which is possibly re- lated to the ilmenite content. The absorption length of a material is defined a s the distance over which a n electromagnetic wave must travel in the material be- fore being attenuated to lle (36.8 percent) of its initial intensity A decrease of absorption length for a nor- mally rough and blocky regolith reduces the amount of backscattered depolarized echoes because fewer blocks are encountered by the shallow penetrating radar signals than by the deeply penetrating radar signals. Pollack and Whitehill (1972) suggest than a n increase in absorption length of a factor of only 3 5 would be required to produce a change of a factor of 5 in the depolarized lunar radar return observed between inaria and highlands Schaber and others (1970, 1975) have reported tha t the surface of Mare Imbrium con- tains sorne of the most distinct red-blue color bounda- ries and lowest depolarized 70-cm radar backscatter variations on the near side of the Moon. The weakest levels (less than 50 percent of the average power re- turned from the basin floor) of both 3.8-cm and 70-crn backscatter within Imbrium are confined to Imbrian and Eratosthenian mare surfaces of the blue spectral type. Variations in radar return are well correlated with individually mapped lava flow units of youngest Eratosthenian age whose source was traced to a fissure vent in the southwestern edge of the basin (Schaber, 1973). The frequency distribution of t he 70-cm polarized and depolarized radar echoes for five mare

APOLLO 15-17 ORBITAL INVESTIGATIONS
FIGURE 41 - Radar maps of the Moon at 3 8-cm wavelength One degree of

LUNAR REMOTE SENSING AND MEASUREMENTS
4, polarized echoes B , depolarized e c h o ~ s (courtesy o f S H Zisk) latitude is 30 km

APOLLO 1.7 17 ORBITAL INVh~STICATIONS
surfaces (one red, four blue) within the Imbrium basin indicate that echo strengths decrease generally from the earl iest Imbrian surf'aces to the youngest Erathosthenian surfaces This effect within Mare Im- brium was attributed to absorption resulting from in- creased amounts of the mineral ilmenite and other anomalies associated with deposition of the blue mare materials. Although somewhat speculative, it has been
FIGURE 42 -Radar maps o f the Moon at 70-cm wavelength A, polarized of Moon it>
suggested that 70-cm depolarized radar echo strengths vary inversely with Ti02 content and that the radar maps can be utilized for geochemical mapping of the maria in the same manner as spectral reflectivity (Charette and others, 1974).
A second type of lunar surface that returns very weak radar signals are the so-called lunar "black spots" (see for example, Pieters and others, 1973). The

LUNAR REMOTE SENSING AN11 MKASURKMENTS
echoes B , depolarized echoes (courtesy of T . W Thompson) Diameter 3,476 km
black spots, which include the Apollo 17 site, have spectral reflectances and radar reflectivities indicating relatively rock free surfaces, a very low ratio of crystal- line to amorphous (glass) material, and high concen- trations of iron and titanium in the amorphous phase, Data collected during the Apollo 17 mission verified the high iron (1 8 percent FeO in basalt; 15 percent FeO in soil) and titanium (13 percent Ti(]._; in basalt; 8 per-
cent T i a in soil) and a reduced population of surface rocks relative to other landing sites on maria The reg- olith a t the Apollo 17 site consisted primarily of pow- dered high-titanium subfloor basalt material (42-67 percent) with subordinate amounts of high-titanium orange glass and its devitrified equivalent (black glass beads) (12-22 percent), and aluminous massif compo- nents (21-36 percent) (Rhodes and others, 1974).
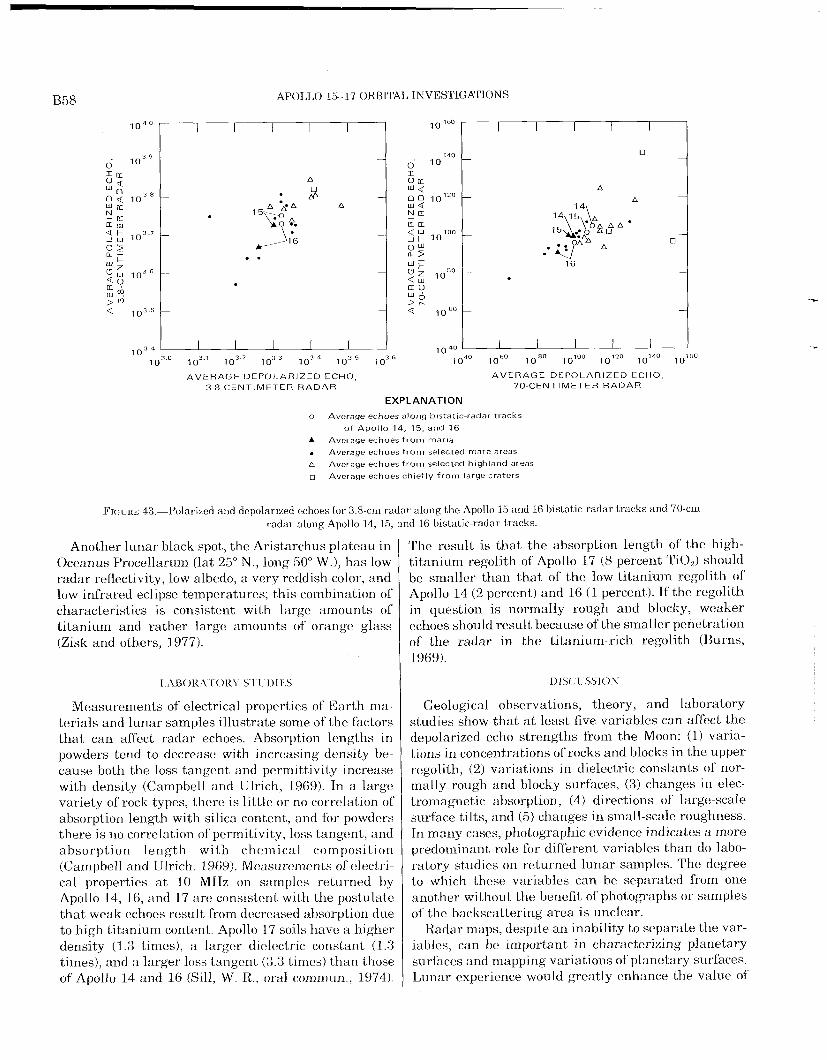
APOLLO 15- 17 ORBITAL INVESTIGATIONS
l o 3 1030 l o 3 ' 1 0 ' ~ lo3 '
1 1040 ?,,60 1080 10100 lo170 lol'10 l o l ' O
A V E R A G E D E P O L A R I Z E D ECHO, A V E R A G E D E P O L A R I Z E D ECHO,
3 8 C E N T I M E T E R R A D A R 70 C E N T I M E T E R R A D A R
EXPLANATION
o Average echoes a long h is ta t ic radar tracks
o f A p o l l o 14, 15, and 16
A Average echoes f r o m mar ia . Average echoes f rorn selected mare areas
A Average echoes f r o m selected h igh land areas
n Average echoes ch ie f ly f r o m large craters
FIGURE 43.-Polarized and dopolarized echoes for 3 8-cm radar along the Apollo 15 and 16 bistatic-radar tracks and 70-cm radar along Apollo 14, 15, and 16 bislatic-radar tracks
Another lunar black spot, the Aristarchus plateau in Oceanus Procellarum (lat 25O N., long 50Â W ,), has low radar reflectivity, low albedo, a very reddish color, and low infrared eclipse temperatures; this combination of characteristics is consistent with large amounts of titanium and rather large amounts of orange glass (Zisk and others, 1977).
I AUOR \ FOR1 S 1 I.DII'S
Measurements of electrical properties of Earth ma- terials and lunar samples illustrate some of the factors t ha t can affect radar echoes. Absorption lengths in powders tend to decrease with increasing density be- cause both the loss tangent and permittivity increase with density (Campbell and Ulrich, 1969). In a large variety of rock types, there is little or no correlation of absorption length with silica content, and for powders there is no correlation ofpermitivity, loss tangent, and absorpt ion l eng th with chemical composition (Campbell and Ulrich, 1969). Measurements of electri- cal properties a t 10 MHz on samples returned by Apollo 14, 16, and 17 are consistent with the postulate t ha t weak echoes result from decreased absorption due to high titanium content, Apollo 17 soils have a higher density (1 3 times), a larger dielectric constant (1.3 times), and a larger loss tangent (3.3 times) than those of Apollo 14 and 16 (Sill, W. R., oral conlmun,, 1974)"
The result is tha t the absorption length of the high- titanium regolith of Apollo 17 (8 percent 'ri02) should be smaller t han tha t of the low titanium regolith of Apollo 14 (2 percent) and 16 (1 percent). If the regolith in question is normally rough and blocky, weaker echoes should result because of the smaller penetration of the radar in the titanium-rich regolith (Burns, 1969).
Geological observations, theory, and laboratory studies show tha t at least five variables can affect the depolarized echo strengths from the Moon: (1) varia- tions in concentrations of rocks and blocks in the upper regolith, (2) variations in dielectric constants of nor- mally rough and blocky surfaces, ( 3 ) changes in elec- tromagnetic absorption, (4) directions of large-scale surface tilts, and (5) changes in small-scale roughness. In many cases, photographic evidence indicates a more predominant role for different variables than do labo- ratory studies on returned lunar samples. The degree to which these variables can be separated from one another without the benefit of photographs or samples of the backscattering area i s unclear.
Radar maps, despite a n inability to separate the var- iables, can be important in characterizing planetary surfaces and mapping variations of planetary surfaces Lunar experience would greatly enhance the value of
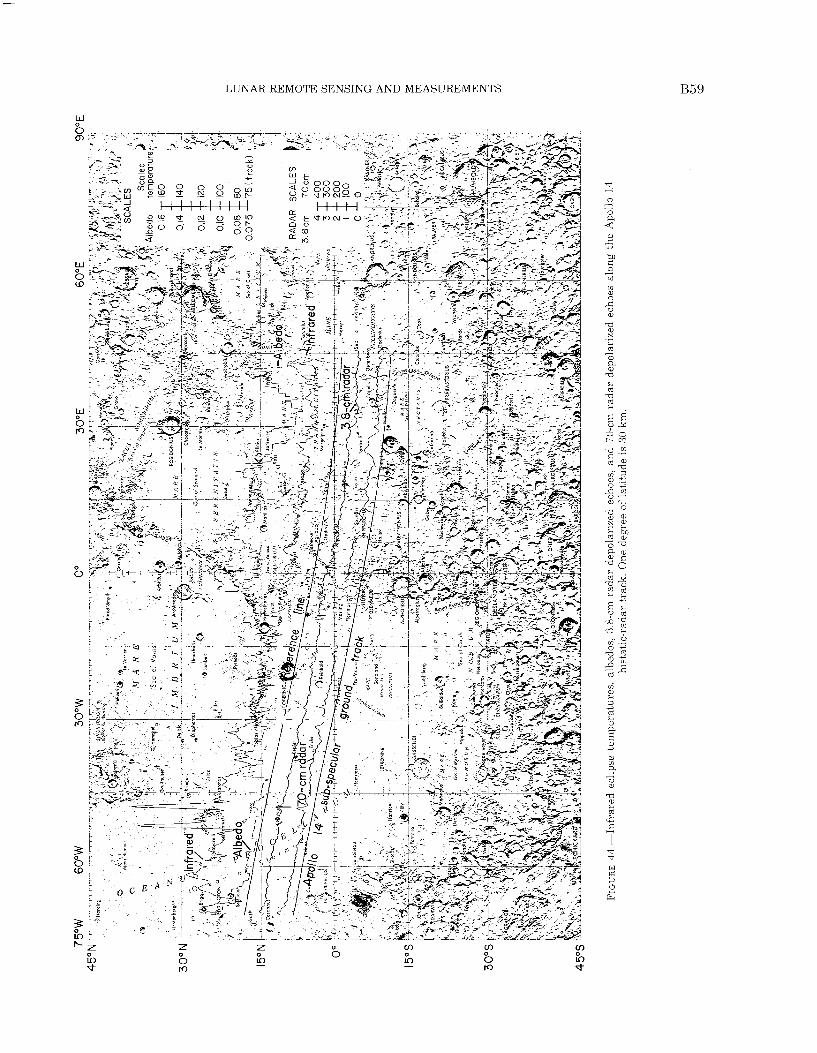
LUNAR REMOTE SENSING AND MEASUREMENTS
w

APOI.I.0 1 5 1 7 ORBITAL INVKSTICATIONS
w

LUNAR REMOTE SENSING AND MEASUREMENTS B61
the maps, as would more photographs, images of backscattering areas, and samples from the areas
On the Moon, weak depolarized echoes are of special interest, and much needs to be done to understand them There are three distinct occurrences of weak de- polarized echoes. (1) lunar black spots or dark mantled areas, (2) local and regional relatively blue mare sur- faces, and (3) halos surrounding certain large craters that extend to one or more crater diameters. The reasons for this last occurence have not yet been ad- dressed in the radar literature.
A primary unanswered question is how deep the radar signals penetrate the regolith before being backscattered For example, are the 70-cm radar waves penetrating the mare regoliths into the fractured sub- strate basalt If they are, where is the major absorption taking place.
INFRARED ECLIPSE I EMPERA rURF,S
By IT. J. MOORE The thermal response of the lunar surface has been
measured from the Earth during eclipses during which the average surface cools from the full-Moon temperature of about 400OK to about 150°K Eclipse temperature measurements used here were obtained during the penumbral phase of the lunar eclipse of December 19, 1964, in the wavelength band of 10-12 ,urn (Shorthill, 1973, 1970; Saari and others, 1966; Saari and Shorthill, 1963, 1966a, Shorthill and Saari, 1965a). A resolution of 10 arc seconds was achieved, corresponding to roughly 17 km a t the sub-Earth point. The positions of the scans on the Moon were determined by associating small features with observed anomalies. The positions of eclipse temperatures and thei r magnitudes have been correlated with root-mean-square slopes from the Apollo bistatic-radar experiment subspecular tracks and their magnitudes (Moore and others, 1975; 1976).
Lunar temperatures are calculated assuming the Moon is a blackbody radiator of its planetary heat (Pettit, 1961; Sinton, 1962a). 111 order to compare eclipse temperature measurements of different areas of the Moon on an equal basis, they were normalized to the average behavior of the highlands (Shorthill, 1970, 1973). The normalization is corrected for the decrease in temperature toward the limbs caused by the initial full-Moon temperature distribution, the asymmetry in the cooling time caused by the passage of the Earth's shadow across the disk, and differences of cooling times between successive observation scans.
A "flattened Moon" quantity, A M , results from the normalization. It is given by
where Tabs is the observed eclipsed temperature, Tt,~,,c is the expected localized background temperature, and Tfull is the localized full Moon temperature For some presentations and analyses, scaled values, IR, are used (T. W Thompson, written commun., 1975; Moore and others, 1975):
IR - 100 t 1000 AFM ( 8 )
Scaled infrared eclipse temperatures for the lunar near side are shown in figure 46.
Average values of observed infrared eclipse tempera- tures for geologic map units along the Apollo photo- graphic tracks and bistatic-radar tracks show a gen- eral inverse correlation with albedo (figs 44, 47), with the exception of bright young craters (Moore and others, 1976). The general inverse correlation is most marked in Oceanus Procellarum along the Apollo bistatic-radar ground tracks near 50O W. where albedos are low and scaled eclipse temperatures are high (figs 44, 47) The areal distribution of infrared eclipse tem- peratures is particularly well shown in figure 46 In contrast with Oceanus Procellarum, infrared eclipse temperatures of highland regions along the Apollo 14 and 16 bistatic-radar tracks are relatively low and al- bedos are high (figs 44,47), and for the highland area adjacent to the southwest edge of Mare Crisium (55" E, Apollo 15), infrared eclipse temperatures are low and albedos are high (fig. 47). Superimposed on this gener- al correlation are strong peaks where both infrared eclipse temperatures and albedos may be high. The spikes of high eclipse temperatures and albedos usually correlate with craters, particularly fresh ones which may be large (more than 10 km) or small (a few kilometers). The strongest infrared eclipse tempera- ture spikes along the Apollo 14 bistatic-radar track (fig. 44) correspond to small, very fresh craters near Suess (48O W.) and Reiner A (51.5O W ). Another high eclipse-temperature spike corresponds to LaLande (39O W., fig. 44). Striking examples of high infrared eclipse temperatures also occur along the Apollo 15 and 16 bistatic-radar tracks (fig. 47). Along the Apollo 15 histatic-radar pound tracks, the crater Euler (29O W ), the crater Vitruvius (35O E.), and the Tycho ray that passes through Bessel (18" E.) have both a high eclipse temperature and a high albedo. Other spikes are com- monly related to small craters and their ejecta. A small crater near Capella (36O E., Apollo 16 track) has high

APOLLO 15- 17 ORBITAL INVESTIGATIONS
FIGURE 46 -Scaled infrared eclipse temperatures of lunar near side Bright areas are relatively warm, dark areas are relatively cool Note high temperatures in Oceanus Procellaruni, Mare Frigoris, and lorthwest,crn Mare In ib~~ ium (outer part. of upper left quandrant). Bright circular area in lower left IS Mare Hun~orum Very bright circular areas a r e young craters such a s Tycho, Aristarchus, Copernicus, and Langrenns Dark areas are relatively cool highlands. Measured at. 11 pin (Image courtesy ol R W Shorthill, University of Utah Research Institute and T W Thompson, Jet, Piopulsion Laboratory, California Institute Technology Data from eclipse temperature observa- tions of ' J M Saari and R W Shorthill, December 19, 1964 ) Diameter of Moon is 3,476 k m
eclipse temperatures and albedos, a s does another small crater in Parry (16O W., Apollo 16 track, fig. 47).
These relations a re shown in a quantitative way in figure 48, where average values of scaled eclipse tem- peratures for geologic map units a re inversely related to average albedos (see also Moore and others, 1975, 1976). Western niaria (points 38, ;39, 56, 57, and 75 in fig. 48) a re generally warm and may exceed the aver- age temperatures for the crater Euler and its ejecta. Two points are plott,ed for mare material in the Montes Riphaeus region (76) which represent, the average val- ues along the Apollo 14 track (lower eclipse tempera- ture) and along the Apollo 16 track (higher eclipse temperature); their separation indicates local varia- tions in the maria. Another notable variation is tha t
high infrared eclipse temperatures gerierally coincide with the Imbrian flows of western Imbrium (Schaber and others, 1975), and lower ones coincide with eastern Imbrium (fig 48; variation indicated by arrows from point 40).
As with the terrestrial radar echoes, there are three genera1 classes of infrared eclipse tempeatures. (1 ) av- erage ones, (2) anomalously high ones or hot spots (Saari and Shorthill, 1966b; Shorthill and Saari , 19651, b), and ( 3 ) anomalously low ones or cold spots. The crater Euler in figures 47 and 48, where average values for the crater and its ejecta have been plotted, is a hot spot Peak scaled values o f t h e infrared eclipse temperatures within the crater a re near 174 (fig 47). Eclipse temperatures for the ejecta and ~ns ides of other

LUNAR REMOTE SENSING AN11 MEASUREMENTS LJ

B64
1 5 0
Ill u 3
1 4 0 a. w Q_
2 Ill I- UJ 1 3 0 01 Q_
- _I
(J Ill
0 Ill
1 2 0 < 0" LL z - 0 UJ 1 1 0
< u w w 0
1 0 0 Ill > 4
9 0
EXPLANATION
Mare mater ial
A Mater ials
0 Euler 0 Crater mater ia ls \ \ . 38 \ Small crater
56 .\ 7 5 *'\ Western I rnbr iurn
mater ial 76 A
', A d L d l a n d e
7 6 '1. A
A Hipparchus C
A A - -
Eastern Imbr i u m --
A U
P ie I rnhr ian A A
% ~ d n s h e r g K a n t plateau Craters ( A p o l l o 16)
z - 16 >
w Y
01 w w u
1 2 U Ill 0 7. -
LC u
8 w 0: w 11 u - 0
A V E R A G E A L B E D O , T I M E S O N E T H O U S A N D
FIGURE 48,-Average infrared eclipse temperatures and average albedos of' maria, highlands, and selected craters along Apollo 14, 15, and 16 histatic-radar ground tracks Numbers by data points for maria indicate maps in the LAC series (table 10) in which they are located Solid line indicates scaled-eclipse temperatures that can be ascribed to initial temperatures resulting from albedo for materials with identical ernissivities, thermal conductivities, densities, and specific heats Note inverse relation between average scaled infrared eclipse temperatures and albedos (indicated by dashed line); maria are generally warmer than highlands Euler and small crater (lat 5 . F S , long 36" E ) are hot spots with unusually high eclipse temperatures Average temperatures for craters and ejecta of LaLande, Tlieophilus, Herschel, and Hipparchus C are low compared to Euler arid small crater Larisherg arid pre-Irnbrian craters of Apolla 16 have low average eclipse temperatures
large craters along the Apollo bistatic-radar tracks (Lansberg, fig. 44; 26 5O W ; Theophilus, fig 44, 27O E, and Herschel, fig 44, 3Â W.) are not hot spots (except the central peak of Theophilus which is a hot spot) Selected hot spots in the "Apollo zone" of the lunar near side are listed in table 10-
The Aristarchus-Montes Harbinger region, a cold spot, is especially noteworthy because of the combina- tion of a low albedo and low infrared eclipse tempera- ture, suggesting that unusual materials are present on the surface there (Zisk and others, 1977).
Initial temperature differences resulting from albedo differences (Saari and Shorthill, 1967, 1972) of mate- rials with the same ernissivities and thermal inertias can only be maintained to a minor degree during an eclipse. Initial temperatures of materials are related to their albedos by the equation
where T,, is the initial temperature, Ty, is the bright- ness temperature corresponding to zero albedo (Too =
408 6"K), and A is the albedo (Saari and Shorthill, 1972, p. 171, eq 3) The final temperature can be calcu- lated from
where e is the emissivity, (J is the Stefan-Boltzman constant, t,, is the time, K is the thermal conductivity, p is the density, and c is the specific heat (Saari and Shorthill, 1963, p. 133). Solutions for the equations, where e, t,,, K , p, and c are taken as constant and TI =
150O for To = 391 .8OK, are tabulated below:
Thus, albedo alone will account for only about 1° of the temperature difference in figure 48.

LUNAR REMOTE. SENSING AND MEASUREMENTS B65
'FABLE 10 -List of selected craters and areas in "Apollo zone" with relatively h& eclipse temperatures f o r @/ic/.(~l ur'ea
LAC :3X Seleiicus quadrangle moor^ 1967):
Maria west and south of Ariskii'chus Plateall
Manus Hills area (48%' to 57"W ; 1 O"N to l8"N I
LAC 39 Anstarchus region (Moore, I Vallis Schniten Anstarchus crater Wollaston Aristarchus CA & G Crater on south rim of Kneger Angstrom Delisle Diuphantus Diopha-ntus A Diophantus 1% Small crater between Delisle and
Diophantus Brayley Brayley C Brayley 13 Maria south of Aristarchus Plateau Maritis hills area (48"W to 57"W ;
1U"N to 18"N I
.AC 40 Timocharis region (Can-, 1965)- Euler Lambert Pithpas Carlini B Timochans C 'Sirnocharis I)? Timocharis H
. A C 4 1 Montes Apenniims region (Hackman, 1966):
Aratus C Sulpicius-Gallus M Small crater southwest of A m t t ~ s C Conon Hadley rille Dome near Eratosthenrs A
LAC 42 Mare Sererntatis repon (Cari, 1966):
Dawes Menelaus B ~ s s e l Deseilligny Posidonius y mare ridge Linne Sulpicius Gallus Small crater northwest of Sulpicius
Gallus
LAC 43 Macrobms quadiangIc (Scott and Fohn. 1972):
Ronler Romer I, Proclus Vitruvius A Macrobius A Macrobius B Macrobius (north wall)
LAC 56 Hevelius region (McCauley, 1967). Marius hill area (48"W to 57"W ; 10"N
to 1X"N ) Renner - ~ ~ ~ . - Reiner A Reiner C Maria (46-W to 55"W ; 3% to 5ON )
1J.C 57 Kepler reinon (Hackman, 1962): Maria (46"W to 55"W ; 3% to 5"N ) Suess SUPS F Maestlm H Enkc Kepler Kepler A Hortensius A
LAC 60 .Julius Caesar (Morns and Wilhelms, 1967):
Plinius Ross Ross I) Jansen B Manner Arago
LAS 61 Tanmtius quadrangle (Wilhelms, 1972h):
Taruntius H Taruntius G Taruntiu-s B Tamntius C
Taruntms F Taruntius I' Cauchy Cauchy I) Maskelynr Janscn F Sinas Sinas H
-.AC 62 Mare Undarun~ quadrangle (Olson and W~lhvlms, 1974).
Area of W W , 2 5"N Apollonms W Picard Lick D Area of ndge 62"E, 12"N to 64"E ;
14"N Condorset 'r Taruntius 0
LAC 74 Grin~aldi quadrangle (McCauley, 19731-
Maria (46OW to .i.VW, 3% to 5"N ) L o l m a n A Hem'inn Flamsteed G C
LAC 75 Letronne region (Marshall, 1963): Maria (4VW to 55"W ; 3- to 5"N ) Flamsteed Flamstced B Hengonius Herigunius EC Herigonius E Wichmann 1,ansberg D Other small craters
LAC 76 Riphaeus Mountains region gletun, 1965):
Euchdes Darney C Turner Turner F Fra Mauro 1) Bon land ~ucf ides D Many small craters in SIC comer of
LAC 77 Ptolemaeus quadrangle (Howard and Masursky, 1963):
Mosting Mosting C Mosting A Lalande Lalande C Lalande A Davy A Ptolemaeus A Pickering Hipparchus C Hipparchus W At 1 2 3 , 7°
LAC 78 Theophilus quadrangle (Miltun, 1968):
Theophilus, central peak Madler Ton-icelli B Torricelli C Torricelli Moltke Alfraganus Alfraganus C IIypatia A Kant Alhufeda C, and R
LAC 79 Colombo quadrangle (Elston, 1972):
Messier Messier A Messier 0 Bellot Censorinus 1sidoru.s I) Bnght crater (5 X'S, 36% I Isidor~is A Capella A
LAC 80 Langrenus quadrangle (Ilodges, 19731:
Lan renu, web% H "
Lanpenus M Lanpenus I' Godenius Ul3, UA Messier G Langrenus F F
Localized high temperature anomalies, or hot spots, a re believed to result from an excess of bare rocks on the lunar surface (Roelof, 1968; Winter, 1970; Allen, 1971). The surface rocks must be about 10 crn or more in diameter, and the number of rocks per unit area must be larger than tha t observed by Surveyors 1 and 3 (Thompson and others, 1974). A particularly good example of a lunar hot spot is the crater Tycho (Sinton, 1962b). Tycho can be accounted for with a model of 0.3 mm of dust over bare rocks-in contrast to the thick dust required for Tycho's surroundings. Geologic ob- servations support the hypothesis tha t rocks on the surface are responsible for the high infrared eclipse temperatures (Thompson and others, 1974).
Measurements of thermal conductivities and specific heats of returned lunar samples show tha t they are both functions of temperature (Cremers and Hsia, 1973, 1974; Hemingway and others, 1973) Conductiv- ity differences of fines returned by Apollo from maria (Cremers and Hsia, 1973) and Apollo 16 highlands (Cremers and Hsia, 1974) would produce the differ- ences in infrared eclipse temperature tha t are ob- served Furthermore, the product of density and specific heat could account for the observed eclipse temperature differences Cremers and Hsia (1974) in- dicate t ha t the differences of thermal properties of lunar and terrestrial fines a re most probably caused by differences in typical particle size and shape.
Perhaps the most significant observation of the in- frared eclipse temperatures is the high temperatures observed in Oceanus Procellarurn and western Mare Irnbrium. The distribution of these high temperatures is very similar to the distribution of young mare plains (Boyce, 1976) If one postulates a coincidence of rela- tively coarse grained regolith with abundant blocks because of a youthful surface with a thin regolith-as is the case for young fresh craters-then Oceanus Pro- cellarum is indeed young, and the flows i n western Mare Irnbrium are also young by these criteria
A BASIS FOR EXTRAPOLATION
As the last Apollo mission was preparing to leave the vicinity of the Moon, the Apollo 17 crew said tha t Apollo wasjust the beginning Someday we may return to the lunar surface. Until then, the scientific commu- nity is charged with the responsibility of assimilating existing lunar data and extrapolating Apollo, Sur- veyor, Luna, and Lunakod surface results to other parts of the Moon using remote sensing and ineas- urements to discover targets for future lunar explora-
B6G APOLLO 15- 1 7 ORBITAL INVESTIGATIONS
tion which will produce the highest scientific yields The remote sensing and measuiements described here could form the basis foi extrapolation of lunar surface iesults, but supplemental measurements from both Earth and spaceciaft in lunar orbit would enhance the validity of the extrapolations
Although data from the surface and from remote sensing are only partly assimilated, the basis fbr ex- trapolation can be illustrated with selected examples of unresolved problems that iequire lunar rock samples and surface data Indeed, it is not possible to iesolve many lunar and planetary problems without carefully collected and documented samples and subsequent isotopic, chemical, and petiologic analyses Five geu- eial extrapolations will be discussed: 1 Duiation of volcanic activity on the Moon 2 Early ciateiing history of the Moon before 3 84 b y , ago. 3 Lunar multiiinged basins and the piovenance of lunai highland samples 4 Regional and local chemical variations, 5 Val iation of physical piopei ties and lougliness of lunar surface
DURA 1 ION OF VOLCANIC ACTIVITY
Remote sensing and measuienients indicate that volcanic flows continued to h i m well beyond the time indicated by samples retuined by the Apollo and Luna missions There are four lines of evidence for this First, relative ages of the Imbiium flows and Oceanus Piocellaruni maria a le younger than the mare of Apollo 12, wheie basalts are as young as 3 15 b .y The best estimate from relative age determinations indi- cafe that basalt continued to flow at least as recently as 2 5 b y ago Second, the iemai liable geographic coinci- dence between mare suifaces with young relative ages and mare surfaces with high inflated eclipse tempera- tures lends strong support to the youth ofthe Imbrium flows and maria in Oceanus Procellaium High in- frared eclipse temperatures indicate that the iegolitlis of these areas are blocky and ielatively coarse grained Such a result is consistent with ielatively young vol- canic flows overlain by ielatively thin and immature iegolith Third, stlatigraphic evidence for the youth of the Imbrium flows and some of the maria in Oceanus Procellarum is compelling The Imbrium flows are un- usual, their crisp well-preserved n~orphology showing that they have not been extensively degiaded and eroded by micrometeoroid bombardment (Scliaber, 1973) Nearby, mare units are superposed on the ejecta of Euler and Delisle (Wilhelms, 1980) North and west of the Aristarchus plateau in Oceanus Procellarum, youthful volcanic ianipart maars are present (Moore,
1971a; Pike, 19801, and flows are superposed on older ?ows around the plateau as well a s on relatively small :raters (Willielms, 1980) Fourth, Surveyor I surface data (Shoemaker and others, 1969b) and craters seen in Lunar Orbiter images show that the regolith in the Plamsteed area of Oceanus Piocella~um is relatively thin (Oberbeck and Quaide, 1967) and the area is un- usually blocky compared to maiia with older relative ages Thus, a good target foi future lunar surface ex- ploiation should be somewhere in Oceanus Procel- a r u m 01. western Mare Imbrium where the pieponder- ance of data nieasuied remotely indicate there are young volcanic flows Locating such sites precisely must await more caieful and detailed studies,
EARLY CRATERING HISTORY BEFORE 38.1 B Y AGO
Altliougli the elucidation of the bioad timing of the eaily ciatering and basin-forniing period iepiesents a niajoi accomplishment of the Apollo piogram, many of the details are unresolved Geologic evidence shows that the Moon has a population ofmultiring basins in the steady state, or at least close to it (Howard and others, 1974) The interval of time over which basins formed, the existence or absence of predecessors, and the origin of' t he bodies producing them a i e unknown-indeed, the bodies producing them could have come from the Moon itself or elsewhere The iela- lively small interval represented by metamorphic ages of rocks collected during Apollo from the highlands is only a few bundled million years or so and could repre- sent a large number of big events or one event (G J Wasseiburg, oral commun , 1976) Photogeologic evi- dence and theoretical evidence for the widespread dis- tiibution of ejecta from both the Oiientale and Im- brium basins (Moore and otheis, 1974; O'Keefe and Ahiens, 1976; McGetchin and otheis, 1973) or even pervasive distiibution (Chao and others, 1973, 1975) also indicate that ejecta fiom one or several basin events may have been sampled by the Apollo missions a t any one or all of the highland sites. On the other hand, Reed and Wolfe (1975) offer an excellent argu- ment for the presence of ejecta from a nearby southern Serenitatis basin some 300 km across a t the Apollo 17 site Relative ages of highland plains and ciatei fre- quency distributions yield strong evidence for two majoi moonwide events and vestiges of earlier ones
In keeping with the common practice used in the study of complicated mineial deposits on Earth, aieas wheie geologic relations appear to be least complicated are examined b e h e proceeding to the complex area of the deposit itself Thus, the Orientale basin is a likely candidate fbr future lunar exploiation in order to clarify the early cratering history of the Moon There,
LUNAR REMOTE SENSING AND MEASUREMENTS B67
the morphology of all the geologic map units is re- markably well preserved and interpretable (Moore and others, 1974; Scott and others, 1977). Large massifs protrude above the basin floor, and blocks from out- crops in the massifs have moved downslope where they are easily accessible to landed spacecraft. Similar rela- tions occur on the steep inward-facing slopes of the basin outer rim or Montes Cordillera The ejecta units beyond the Cordillera r im are crisply preserved- Everywhere fresh craters with a wide range of sizes penetrate the regolith and have exhumed material from depth.
Populations of craters in the lunar highlands, from 30 km to 1 kni across, have always been a n important lunar problem. Were they produced by debris from space or by debris ejected from the lunar basins? Photogeologic evidence lends strong support for the no- tion tha t many of them, if not most, were produced by ejecta from the lunar basins (Wilhelms, 1980) Secon- dary craters from Imbrium have been systematically mapped in the near-side highlands (Eggleton, in Ulrich and Muehlberger, 19801, where they cover a substan- tial area. Secondary craters from Orientale have been described and systematically mapped in the vicinity of the basin (Scott and McCauley, 1977), but efforts to locate them elsewhere on the Moon are confined to lim- ited regions (Wilhelms, 1980). Degraded secondary craters from the Nectaris basin abound on its south- west t o southeas t f lank (Stuart-Alexander a n d Wilhelms, 1975). In general, existing maps of secon- dary craters do not exceed more than one to three basin diameters from the centers of the basins from which the secondary projectiles originated; yet, ejecta from the basins may have traveled to the antipodes of the basins (Moore and others, 1974); photogeologic evi- dence indicates tha t fluting and furrowing near Mare Ingenii a t the antipode of the Imbriurn basin were due to the impact of ejecta from Imbrium. At Ingenii, fur- rows and ridges a re alined along radials from the anti- pode of Imbriurn. Characteristically, they are well de- veloped on crater walls with directions of slopes paral- lel to the radials, but furrows and ridges on walls with slopes a t right angles to the radials a re either absent or parallel to the radials and contours. Furrows and ridges a re not confined to crater walls- They also occur on level but irregular terrain and crater flanks where they are again subparallel to Imbrium antipode ra- dials. Furrowed terrain is present a t the antipode of Orientale just north of Mare Marginis, but evidence is weaker than for Imbrium because existing photo- graphic coverage and Lunar Orbiter images are rather poor.
Geologic mapping with the goal of identifying basin secondaries is far from complete. To our knowledge the
only way to resolve the problem of the role of secondary cratering in the lunar highlands is by more photo- geologic studies of the Moon.
Good arguments for a dominant population of secon- dary craters were initiated by Shoemaker (1965) for smaller craters and adopted for large secondary craters from basins by Oberbeck (1gr75), who incorporated data from Mars and Mercury in his argument.
Such impact cratering may also have occurred at a fine scale (several hundred meters and less) according to na tura l vagaries and variations in t he basin- forming events Thus, secondary impact cratering at the fine scale could have been responsible for resetting the crater-age clocks in local areas but not in others (Boyce and others, 1974) Whether or not the resetting of the crater-age clocks was due chiefly to a process resulting in net deposition of basin ejecta or to impact erosion and extensive mixing of substrate materials can best be resolved with lunar samples from a basin such a s Orientale collected along azimuths from the basin center a t progressively larger distances from the basin rim
LUNAR MUI.IIRINGF:D BASINS ANT) THE PROVENANCE OF LUNAR HIGHLAND SAMPI-ES
Five major lunar questions and a host of others a re unanswered: 1 What a re the stratigraphic relations in the lunar
highlands? 2. How deep did the lunar basins excavate? 3. Was there a strong lunar magnetic field early in
lunar history? 4 Is the layering of the lunar mantle and crust in the
far-side highlands the same as tha t in the central lunar near side?
5. Did the highland crust compensate isostatically during the period of basin formation or later?
The problem of resolving the stratigraphic complex- ity of the highlands representing the early history of the Moon during the period of extensive basin forma- tion is formidable if the s tate of lunar affairs a t t ha t time was a s complicated as viewed by some workers Clearly any one basin, say Orientale or Imbrium, could have ejected debris to any point on the Moon (Moore and others, 1974) Photogeologic evidence for Irnbrium ejecta reaching all of the Apollo sites is strongest, but Orientale ejecta could also have reached these sites. If a single event were responsible for all the highland rocks collected, the small range in metamorphic ages would represent partial resetting of the radiometric clocks and experimental error.
The provenance of some rocks collected a t the Apollo 15 site is not entirely clear Rocks such as 15415,
15455, and 15362 could represent lrnbrium ejecta or Orientale e,jecta. The basis for saying so is the fre- quency distribution for craters measured in the Montes Apenninus just southeast of the Apollo 15 site (Neukurn and others, 1975a). This crater frequency distribution for craters smaller than 8 km is remarka- bly close to those of the Urientale ejecta and unlike those of the Fra Mauro Formation (Boyce and others, 1974). Although Orientale cjecta may be present a t the Apollo 14 site, photogeologic evidence shows tha t the radial f'acies textures of Imbrium ejecta were not de- stroyed by the possible dynamic deposition of Orientale ejecta. With a steady-state distribution of' lunar basins, some ejecta from the many lunar basins could have been transported from one side of the Moon and back again, possibly a number of times. The result would be a "proto-regolith" many kilometers thick tha t is pene- trated by only the largest lunar basins (see also Short and Forman, 1972) In this model, the small range in metamorphic ages would represent a number of basin events close together in time.
Despite the potential complications, the basin exhib- iting both the least morphologic degradation of its fea- tures and a large size should be a prime target for exploration in future years. The Orientale basin is such a basin, perhaps the only one. Its ejecta can be confidently recognized, and also the crater probably ex- cavated mater ia l from beneath a thick "proto- regolith."
The depths from which certain lunar highland sam- ples have come are problematical, because of a lack of knowledge of basin shape during the formation stages Here the only test of depth can come from returned samples in conjunction with data on the layering of the Moon Good geologic arguments for the source of the rocks being e,jected from a mare-filled basin centered in southeast Mare Serenitatis have been put forth (Reed and Wolfe, 1975). In these arguments, the Apollo 17 massifs a re interpreted to be the rim and are entirely composed of e,jecta from deep within the Serenitatis basin. Large depths of excavation by basin-forming events a r e consistent wi th anorthi te-aluminous enstatite-forsterite-aluminous spinel assemblages in samples returned from the Apollo 17 lunar highlands (Bence and McGee, 1976). If these assemblages repre- sent equilibrium assemblages, pressures of 3 to 7.5 kbar a re indicated, and inferred depths of excav -1 t" ion are 60 to 150 km. Gravity data might provide con- straints on basin size when coupled with suitable top- ographic measurements. For this purpose, Orientale must be studied and far-side basins should be studied because gravity data for Orientale a re incomplete and those for other far-side basins a re far from satisfactory Independent measures of anomalies do not agree a s to
magnitude, shape, and even location. If the problem of isostatic compensation can ever be resolved, both qual- ity topographic maps and surface or low orbiting satel- lite gravimetry will be required.
REGIONAL AND LOCAL CHEMICAL VARIATIONS
Although major strides in understanding regional and local chemical variations were made by the Apollo orbital g-eochemical experiments, the coverage ob- tained is confined to mostly equatorial strips, or bands, related to the orbital tracks of Apollo 15 and 16. Thus, the rnoonwide distributions of the AlISi and MgISi ratios and of iron, titanium, magnesium, thorium, uranium, and potassium are essentially unknown. Ad- ditionally, the orbital geochemical experiments gen- erally do not have the resolution necessary for unravel- ing complex geology in certain regions
Spectral reflectance data measured from both the Earth and orbiting spacecraft offer great promise in obtaining inforn~ation on the composition of the Moon with the resolutions required for careful geologic analyses. From Earth, resolutions near 20-40 km have been achieved. From lunar orbit, resolutions a t least a hundredfold better should be achievable. Of particular interest are the relatively young fresh craters t ha t have excavated materials from depth, exposing them in the near-rim ejecta and within the crater. Two par- ticularly good examples a re the craters Linne and Aristarchus, which have excavated mare and highland materials respectively Indeed, Earth-based telescopic measurements of the relative reflectance of materials brought to the surface by the lunar crater Linn6 is the same a s the relative reflectances, determined in the laboratory, of crushed basalt collected a t the Apollo 12 site. This shows tha t I i n n e is a very young crater t ha t has chiefly, if not entirely, excavated mare basalt. Earth-based telescopic measurements of the relative reflectances of materials brought to the surface by the lunar crater Aristarchus are practically the same a s the relative reflectances of fresh Cone crater ejecta from the Apollo 14 site some 1,000 krn away (see McCord and Adams, 1973) This fact, when combined with the anomalous radioactivity for both the vicinity of Aristarchus and the Apollo 14 site, suggests t ha t similar materials a re present in both places. Geologic interpretation leads to the conclusion tha t both the Apollo 14 site and Aristarchus contain KREEP-rich Imbiium ejecta. A t Aristarclius, the importance of high resolution of the spectral reflectance data (less than 30 km) is critical, Aristarchus is surrounded by mare basalts to the east and south and other volcanic niate- rials on the Aristarchus Plateau to the northwest. Un- like tlie averaged Apollo orbital geochemical data

LUNAR REMOTE SENSING AND MEASUREMENTS B69
which do not resolve the necessary detail, the spectral reflectance data have supplied the necessary detail for unraveling the sequence of layers of materials (Zisk and others, 1977).
Spectral reflectances could also provide evidence for relative ages of some surfaces. A particularly impor- tan t goal would be a detailed study of Oceanus Procel- larum to see if the regoliths there are relatively young compared to maria elsewhere, particularly a t the Apollo landing sites. An example of such a correlation is revealed by the Reiner Gamma area which has a telescopic relative reflectance indicating i t contains exposures of fresh mare basalt. Here, geologic interpre- tation requires a t least two hypotheses: ( I ) Reiner Gamma is a young event exposing fresh rock or (2) the maria of Oceanus Procellarum are relatively young.
More examples could be cited but would be beyond the scope of this paper. The examples illustrate the importance of high-resolution data, the ways in which such data can be used to establish the types of lunar materials a t a given locality, and ways to establish the layering of the Moon.
VARIATION 0 1 ' PHYSICAL PROPERTIES A N D ROUGHNESS 01' LUNAR SURFACE
Variations of physical properties and roughness of the lunar surface can be detected using several remote measurement techniques (1) analyses of quasi- specular radar echoes, (2) analyses of diffusely scat- tered radar echoes, (3) analyses of the thermal re- spouse under a variety of insolation conditions, (4) analyses of spectral reflectances a t short wavelengths, (5) light polarization properties, and 6) high-resolution stereoscopic images. Sys temat ic collection a n d analyses of data using these techniques are far from complete The three Apollo bistatic-radar tracks cover only a limited part of the Moon, and supplemental cov- erage by Explorer 35 is sparse. Although the quasi- specular part of Apollo bistatic-radar echoes has been studied in detail, the diffuse part has not, and i t is this part of the echo tha t can be used to estimate rock popu- lations and regolith thickness. Three kinds of geologi- cally interesting units have never been adequately sampled by the radar: (1) fresh lunar craters such a s Aristarchus, (2) lunar dark spots such a s the annulus of Mare Serenitatis, and (3) unusually hued areas such a s the Aristarchus plateau. Although data a re incom- plete, extrapolation of the bistatic-radar results indi- cate the following:
1. The uppermost lunar regolith is remarkably uni- form with a dielectric constant near 3.0.
2. Locally, the lunar surface is layered with a thin
regolith overlying a denser layer. 3 Highland rms slopes are near 5' to 7Â for radar
wavelengths of 13 and 116 cm, and those of the maria are 2" to 4O for the shorter (S-band) wavelength and lo to 2Â for the longer (VHF) wavelength.
4. Forms of slope-probability distributions vary with terrain.
The results above are consistent with other data. Mechanical properties measured on the lunar surface (Costes, 1973) indicate a uniform lunar surface. Crater morphology shows tha t regolith thicknesses vary from place to place (Oberbeck and Quaide, 1968). Photo- grammetry yields slope probability distributions that i r e compatible in form with those of the radar and show tha t the highlands are, in fact, rougher than maria.
Maps of diffuse polarized and depolarized echoes from terrestrial radar provide data for the entire lunar near side. The echo strengths have not yet been unam- biguously interpreted. Although the role of blocks and fragments and slopes tilted toward the Ear th a re well established, those two variables cannot be separated everywhere, and the effects of other variables a re poorly understood. Despite the uncertainties, the dif- fuse reflectivities of the lunar surface do provide a basis for extrapolation and another variable for tests of similarity. The usefulness of these variables is severely hampered by the fact tha t the subsets of the Earth- based data for the 3 8 and 70 cm radars a re improperly correlated, which results in mismatched echo strengths a t the mutual boundaries of the data subsets.
The most complete and hence most useful data set describing the thermal response of the lunar near side are the infrared eclipse temperatures measured from Earth. Unlike the terrestrial radar data, there a re 110 subsets of data with mismatched boundaries. Interpre- tations of the high infrared eclipse temperature are ambiguous. Large blocks and fragments could be re- sponsible for the high eclipse temperatures, and simple increases in grain size above the average could produce the effect. In reality, both and possibly more variables a re involved. Nevertheless, infrared eclipse tempera- tures can be used for extrapolation.
The application of spectral reflectances have not been completely explored, nor is coverage of the lunar s u r f ace complete Of particular interest a re the con- trasting relative reflectances of the different areas. The region of Reiner Gamma in Oceanus Procellarum must contain little glass and large amounts of crushed basalt Highland craters such a s Proclus expose fresh materials from beneath the surface. Other areas have old mature regoliths. Complete data on spectral reflec- t a n c e ~ could be very valuable in looking for future ex- ploration sites.

B70 APOL,LO 1 5 1 7 ORBITAL INVESTIGATIONS
Adams, J B , 1967, Lunar surface composition and particle size: Im- plications from laboratory and lunar spectral reflectance data: J o u r Geophys Research, v 72, p 5717-5720 - 1968, Lunar and martian surface: Petrologic significance of
absorption bands in the near-infrared: Science, v. 159, p 1453- 1455 - 1974, Visible and near-infiared diffuse reflectance spectra of
pyroxenes a s applied to remote sensing of solid objects in the solar system: J o u r Geophys Research, v . 79 p 4829-4836
Adams, J B,, and Filice, A L., 1967, Spectral reflectance 0 4 to 2 0 microns of silicate rock powdeis: Jour Geophys Research, v. 72, p 5705-5715
Adams, J . 13, and Jones, R I , , 1970, Spectral reflectivity of lunar samples: Science, v 167, p 737-739
Adams, J . B , and McCord, T B., 1970, Remote sensing of lunar surface mineralogy: Implications from visible and near-infrared reflectivity of Apollo 11 samples: Proc Apollo 11 Lunar Sci Conf, Geochim et, Cosrnochim Acta, Suppl 1, v 3, p 1937- 1945.
- ~- 197la. Alteration of lunar optical properties: Age and compo- sition effects: Science, v 171, p 567-571
1971b. Optical properties of mineral separates, glass and anorthositic fragments from Apollo mare samples: I'roc Second Lunar Sci Conf, Geochim et Cosmochirn Acta, Supp 2, v 3, p 21 83-21 95
-- 1972, Electronic spectra of pyroxenes and interpretation of
telescopic spectral reflectivit,y curves of the Moon: Proc Third Lunar Sci Conf , Geochinl e t Cosmochirn Acta, Supp 3, v 3, p 3021- 3034.
1973, Vitrification darkening in the lunar highlands and identification of Descartes material at t,he Apollo 16 site: Proc. Fourth Lunar Sci Conf , Gcochim et Cosmochirn Acta, Supp 4, v 1, p. 163-177
Adams, ,I 13 , Pieters, Carle, and McCord, J B , , 1974, Orange glass: Evidence for icgional deposit,^ of pyroclastic origin on the Moon: I'roc Fifth Lunai Sci Conf , Gcochim ot Cosmnchiin Acta, Supp 5, v 1 p 171-187
Adler, I , Trombka, J I, Geiard, J , Schmadebeck, 11 , Lowrnan, P , Blodgett, H , Yin, I . , Eller, E , Lamotl~e, R , Gorenstein, P , Bjorkholm, P , H a m s , B , and Gursky, H , 19721, X-ray Fluores- cence Expeiiment, in Apollo 15 prelirnina~y science report: Natl. Aeionautics Space Admin. Spec Pub NASA SP-289, 11 17 (1)- 17 (17)
Adlcr, I , Trombka, J I, Gerald, J , Lowman, I' , S c h m a d e l ~ ~ k , I? , Blodgett, I i , Eller, E , Yin, I., Lamothe, R , Osswald, G , Gorenstein, P , Bjorkholm, P , Gursky, I I , and Harris, B , Golub, I , , and Ilarnden, F R , J r , 1972b, X-ray fluorescence Experi- ment, in Apollo 16 preliminary science report: Natl Aeronautics Space Ad~n in Spec Pub NASA SP-315, 11 l9(1)-19(14).
A d c t , 1 , Trombka, J 1 , GerariJ, J , Schrriadebeck, R., Lowman, I' Blodgett. 1i , Yin, L , Eller, E . , I,amothe, R , Gorenstein, P Bjorkholm, P , Harris, B , and Gursky, I l , , 1972c, Apollo li- X-ray Fluorescence Experiment: Greenbelt, Md , Goddard Space Flight Cent,ei, Preprint X-641 72-57, 37 11
Adler, 1 , Tiornhka, J 1, Gerard, J , Lowman, I' , Schmadcbeck, R Blodgett, H , Eller, E , Yin, L , Larnothc, It , Gorenstein, I' , and Bjorkholm, I' , 1972d, Apollo 15 Geochemical X-ray Fluores- cence Experiment: Preliminary Report: Science, v 175, p 436Ã 440
Adler, J , Trombka, J J , Gerard, J , Lowrnan, P , Schrnadebeck, R , Blodgett, 11, EIler, E, Yin, L . I,arnothe, R,, Osswald, G , Gorenstoin, F' , Bjorkholn~, I' , Gursky, H , and Harris, B , 1972e,
liminary report: Science, v 177, p 25C1~25.9 idler, I , Trombka, J I , Schmadebeck, I? , Lowman, P , Blodgett, I1 ,
Yin, L , Eller, E , Podwysocki, M. H , Weidner, J !3 , Bickel, A I , , Lurn, R K L , Gerard, J , Gorenstein, P , Bjorkholm, P , and Harris, B., 1973, Results of Apollo 15 and 16 X-ray Experiment: Proc Fourth Lunar Sci Conf , Geochi~n et Cosinochim, Acta, Supp. 4, v 3, p 2783-2791
k i ~ o n a u t i d Chart and Information Center, 1971, Apollo 14 Lunar pltotogl':q~hy Tndexps: Prepared by the Aeronautical Char+ and Information Center, U S Air Force, for Natl Aeronautics Space Admin. (photography indexes compiled by the Manned Space- craft Center, Mapping Sciences Branch, Houston, Tex ), 3 sheets
-1972, Apollo 15 lunar photography index maps: prepared by the Aeronautical Chart and Information Center, U S Air Force, for the Natl Aeronautics Space Admin , 10 sheets
Illen, I) A , 1971, Infrared studies of the lunar terrain, I: The back- ground Moon: The Moon, v 2, p 320 -337
Ynanda, Mohan, 1975, Farside lunar gravity from a mass point model labs.]: Proc Sixth Lunar Sci Conf, Geochim et Cos- nochim Acta, Supp 6, Part I, p. 9 1 1
gndre, C G., Hallam, M E., d a r k , P E., Podwysocki, M H , Weidner, J R , and Adler, I , , 1975, Synthesis of remote sensing da t a from the TranquillitatisISerenitatis a r e a labs.], in Abstracts of papers submitted to the Sixth Lunar Science Con- ference: Houston, TPX , Lunar Sci Inst,, p 15-17
\mold, J I? , Metxger, A E., Peterson, L E,, and Trornbka, J I., 1972a, Gamma-Ray Spectrometer Kxpcriment, in Apollo 15 pre- liminary science report, pt 16: Natl. Aeronautics Space Adinin Spec Pub NASA SP-289, p 16(l)-16 (6)
Arnold, J R , Metzger, A I{:, Peterson, L E , Reedy, R C., and 'Prombka, J I , 1972b, Gamma-Ray Spectrometer I<xperiment, in Apollo 16 preliminary science report, pi 18: Natl Aeronau- tics Space Admin Spec Pub NASA SP- :H5, p 18(1)- 18(8).
Aronson, J I ? , Emslie, A G , Allen, I? V , and McLinden, H. G , 1967, Studies of the niiddle-and-far-infrared spectra of mineral surfaces for application in remote composition of the Moon and planets: Jour Geophys Research, v '72, p. 687-703
Arvidson, K , Cro~az , (1 , Droxd, I? J , Hohenberg, C M , and Morgan, C J , 1975, Cosmic ray exposure ages of features and events at the Apollo landing site: The Moon, v 13, p 259-276
Bancroft, C. M , and Burns, R G,, 1967, Interpretation of the elec- tronic spectra of iron in pyroxenes: Am Mineralogist, v 52, p 12'78- 1 287
Barahashov, N P , 1924, Spectrophotometric investigations of the lunar surface: Astron Zhur , v 1, p 44 57
1953, On color contrasts of the lunar surface: Priroda, v, 42, p 88-90.
Bence, A K , and McGcc, J , 1976, Significance of the assemblage anot'thit.e-alun~inous enstatitc-fosteritc~nlu~ninous spinel in the lunar highlands labs I: Geol Soc Ainerica Ann. Mtg , De- nver, Colo , 8 Nov-11 Nov 1976, Proc., p 772
Boyce, J . M , 1975, Chronology of the major flow units in the western nearside maria, in Conference on origins of marc basalts and their implications hi lunar evolution: Houston, Tex , Lunar Sci Inst , p 11 14
-- 1976, Relative ages offlow units in the lunar nearside maria, 17; Abstracts of papers submitted to the Seventh Lunar Science Conference: Houston, Tex., Lunar Sci. Inst,, p 85 87
Boyce, J M a n d Dial, A I , 1973, Relative ages of some nearside mare units based on Apollo 17 metric photog~aphs, in Apollo 17 preliminary science report: Natl Aeronaut. Space Admin Spec Pub 330, 11 29- 26 to 29-28
LUNAR REMOTE SENSING AND MEASUREMENTS B71
-- - 1975, Relative ages offlow units in Mare Imbrium and Sinus Iridum: Proc. Sixth Lunar Sci Conf, Geochim. et Cosmochirn Acta, Supp 6, v 3, p 2585-2595
Boyce, ,J M., Dial, A I., and Soderblom, I, A , , 1974, Ages of the lunar nearside light plains and maria: Proc. Fifth Lunar Sci Conf , i;eocliirri et Cosmochini Acta, Supp 5, v 1, p 11-23
-1 975, A summary of relative ages of lunar nearside and far- s ide p la ins , U S . Geol Su rvey In teragency Report ~~~~~~~~~~~~66, 26 p
Burns, A. A,, 1969, Diffuse component of lunar radar echoes: Jour Geophys Research, v. 74, p 6553 6566
Burns, R G , 1965, Electronic spectra of silicate minerals: Applica- tion of crystal field theory to aspects of geochemistry: Univ California, Berkeley, P h D thesis, 293 p
1970, Mineralogical applications of crystal-field theory: Lon- don, Cambridge Univ Press, 224 p
Campbell, M ,J , and Ulrichs, J , 1969, Electrical pioperties of rocks and their significance for lunar radar observations, ;Jour Geophys. Research, v 74, p 5867-5881
Carr, M H , 1965, Geologic map ofthe Mare Timocharis region of the Moon: U.S. Geol Survey Misc. Geol Inv Map 1-462 (LAC 401, scale 1:1,000,000.
-. 1966, Geologic map of the Mare Serenitatis region of t he
Moon: U S . Geol Survery Misc. Geol Inv. Map 1 489 (LAC 42), scale 1:1,000,000.
Cassidy, W. A , and Hapkc, 13 W , 1975, Effects of darkening pro- cesses on surfaces of airless bodies: Icarus, v 25, p 371-383
Chao, E C T , Hodges, C A , Boyce, J M , and Soderblom, L A., 1975, Origin of lunar light plains: U S Geol Survey Jour Re- search, v 3, no 4, p 379-392
Chao, E C T , Soderblom, L A,, Boyce, J . M , Wilhelms, 1) E , and Hodges, C, A , 1973, Lunar light plains deposits (Cayley Formation)-A reinterpretation of origin [ahs 1, in Abstracts submitted to the Fourth Lunai Science Conference: Houston, Tex , Lunar Sci Inst., p 127-128
Charette, M P. , and Adams, ,I. B , 1975, Agglutinates a s indicators of lunar soil maturity: Proc Sixth Lanar Sci Conf , Geochim et Coshochim Acta, Supp 6, v 2, p 2281-2289
Charette, M I', McCord, 'I' B , I'ieters, Carlu, and Adams, J . 1 3 , 1974, Application of remote spectral reflectance measurements to lunar geology: Classification and determination of titanium content of lunar soils: Jou r Geophys Research, v 79, p 1605 I61:3
Cisowski, S , Fuller, M D , Rose, M E , and Wasilewski, P J , 1972, Magnetic effects of experimental shocking of lunar soil: Proc Fourth Lunar Sci Conf , Geochim et Cosrnochiin Acta, Supp. 4, v 3, p 3003-3017
Clayton, R N , Mayeda, T K., and Hurd, J . M , 1974, Loss o f 0 , Si, S, and K from the lunar regolith labs 1, in Abstracts submitted to the Fifth Lunar Science Conference: Houston, Tex , Lunar Sci Inst. p. 129- 131.
Coleman, P J . , Lichtenstein, B R , Russell, C , T , Schubert, G., and S h a r p , I,. R , 1972, The Particles and Fields Subsatellite Mag- nctonieter Experiment, in Apollo 16 Preliminary Science Re- port: Natl Aeronautics Space Adrnin Spec Pub 315, p 2 5 1 to 29- 13
Coleman, I' J , Jr. , Schubert, 0 , Russell, C 'I', and Sharp, L R., 1971, The Particles and Fields Subsatellite Magnetometer Ex- periment, in Apollo 15 Preliminary Science Report: Natl Aeronautics Space Admin Spec Pub 289, p 22 1 to 22-9.
Collinson, I) W , Runcorn, S K , and Stephenson, A,, 1975, On changes in the ancient lunar magnetic field intensity fabs J, in Abstracts submitted to the Sixth Lunar Science Conference: Houst,on, Tex , Lunar Sci Inst , p 158-160
Gollinson, D W., Runcorn, S , K , Stephenson, A , and Manson, A J , 1972, Magnetic properties of Apollo 14 rocks and fines: Proc Third Lunar Sci Conf, Geochim et Cosmochim, Acta, Supp 3, v 3, p 2343-2361
Cone], J E , 1970, Coloring of synthetic and natural lunar glass by t i tanium and iron, Part A, Section VI, Lunar and planetary sciencesÑSpac Science Division: Pasadena, California Inst Technolo~y Space Programs Summary 37-62, v 111, Je t I'ropul- sion L a b p 26Ñ3
Conel, J E , and Nash, D B., 1970, Spectral reflectance and albedo of Apollo 11 lunar samples: Effects of irradiation and vitrification and comparison with telescopic observations: Proc. Apollo 11 Lunar Sci Conf', Geochim et Cosmochim Acta, Supp, 1, v 3, p 20 13-2023
Cook, M I> , and Mortensen, K , S , 1967, Impact cratering in gi'anu- a r materials: l o u r , Appl Pliysics, v 38, p 5125-5128
Cost,es, N C , 1973, Regional variations in physical and mechanical properties of lunar surface regolith [abs 1, in Abstracts submit. ted to the Fourth Lunar Science Conference: Houston, Tex , Lunar Sci Inst , p 159-161
Cremers, C J , and Hsia, H S 1973, Thermal conductivity and diffusivity of Apollo 15 fines a t low density, Proc Fourth Lunar Sci Conf", Geochim. et Cosmochim Acta, supp. 4, v 4, p 2459- 2464
1974, Thermal conductivity of Apollo 16 lunar fines: Proc Fifth Lunar Sci. C o n f Geochim et Cosmochim Acta, Supp, 5, v 3, p. 2703-2708,
Crozaz, G , Owid, R J , Hohenberg, C M ,Morgan, C ,J , Ralston, C , Walker, R , and Yuhas, D , 1974, Lunar surface dynamics: Some general conclusions and new results from Apollo 16 and 17: Proc. Fifth Lunar Sci Conf , Geochim. et Cosmochim. Acta, Supp. 5, p 2475-2499
Defense Mapping Agency, Aerospace Center, 1972, Apollo Mission 16 lunar ~ h o t o g r a p h ~ index maps: prepared and published by Defense Mapping Agency, Aerospace Center, St. Louis, Mo , for t he Natl Aeronautics Space Admin (photography indexes corn- piled by Manned Spacecraft Center, Mapping Sci Branch, Hous- ton, Tcx.), 6 sheets.
-. - 1973, Apollo Mission 17 lunar photography index maps: pre- pared and published by the Defense Mapping Agency Aerospace Center, St . Louis, Mo,, for the Nat,l Aeronautics Space Admin , 8 sheets
Dennis, ,J 0 , 1971, Ries structure, southern Germany-A review: Jou r Geophys Research, v 76, p 5394-5406,
DeWitt, ,J H., and Stodola, E K , 1949, Detection of radio signals reflected from the Moon: Proc Inst Radio E n g , v 37, p, 229
Doell, R R , Groinme, C S., Thorpe, A N , and Senftle, F E , 1970, Magnetic studies of Apollo 11 lunar samples: Proc Apollo 11 Conf', Geochim ct Cosniochim Acta, Supp, 1, v 34, p 2097- a1 20
Dolginov, S h Sh , Eroshenko, E G., Zhuxgov, L N , and Pushkov, N V 1966, Measurements of the magnetic field in the vicinity of' t he Moon by the artificial satellite Luna 10: Dokl. Akad Nauk SSSR, v. 170, p 574-577
Dollfus, A,, 1902, The polarization of moonlight, in Kopal, Zdenhk, cd , Physics and astronomy of the Moon: New York, Academic Press, p. 131 159
Dollfus, A , Bowell, E , and Titulaer, C , 1971, Polarimetric prop- erties of the lunar surface and its interpretation, Part 11- Terrestrial samples in orange light: Astronomy and As- trophysics, v 10, p. 450 460
Duennebier, F K , Dorrnan, J , Lammlein, D , Latham, G , and Nakamura, Y , 1975, Metcroid flux from passive seismic exper- iment data: Proc Sixth Lunar Sci Conf, Geochirn et Cos-

mochirn Acta, Supp t i , v 2, p 24 17 2426 Duennebicr, F K , Watkins, ,J S , and Kovach, R I , , 1974, Results
from the Lunar Surface Profiling Experiment: Ahs Filth Lunar Sci Conf, Johnson Spacecraft Centel, Houston, T e x Marcli 18-22, 1974, p 183
Dunri, ,J , Fisher, R M , Fuller, M I), Lally, S , Rose, M I < , Schwerer, F I,, and Wasilewski, I' J , 1972, Shock renianent magnetization of lunar soil [abs 1, in Abstracts submitted to the Fourth Lunar Science Conference: Houston, Tex , Lunar Sci In s t , p 194-195
Dyal, P C , Parkin, C W , and Sonnett, C 1' , 1970, Lunai Surface Magnetomelei Experiment., in Apollo 12 Preliminary Science Report: Nat,l Aeronautics Space Admin Spec Pub 235, p 55 73
Dyal, I' C, Parkin, C W , Colhurn, I) S , and Schubeit, G , 1972. Lunar Surface Magnetometer Expeiiment: Apollo 16 Prelim Sci Rept , Natl Aeronautics Space Admin Spec Pub 315, p 11 1 to 11-14
Eggleton, R. E , 1965, Geologic map of the Riphaeus Mountains re- gion of the Moon: U.S Geol Survey Misc Geol Inv Map 1-458 (LAC 761, scale 1 : 1,000,000
Eggleton, K E , and Schaber, G G , 1972, Cayley Formation inter- preted as basin ejecta, in Apollo 16 preliminary science report: Natl Aeronautics Space Admin. Spec Pub 315, p 29-7 to 29- 16
Elston, D P , 1972, Geologic map of the Colombo quadrangle of the Moon: 1.1 S Gcol Survey Misc Geol Inc Map 1-714 (LAC 79), scale 1 : 1,000,000
Epsteiri, S , and Taylor, H P , J r , 1971, 0"'/0'", Si¥'^"/Si" D m , and (y:i/("2 1- ~i t ios in lunar samples: Proc Second Lunar Sci Conf , Geochim. et Cosmochim Acta, Supp. 2, v 2, p , 1421-1441
Evans, J V , 1962, Radio echo studies of the Moon, in Kopal, Zdenek, cd , Physics and astronomy of the Moon: New York, Academic Press, 11 429-479.
Evans, J V , and Harfbrs, T , 1971, Radar studies of t,he Moon, in Advances in astrorionly and astrophysics: New York, Academic Press, p 29-105
Evans, J V , and F'cttengill, G 11 , 1963, The scattering behavior of the Moon at wavelengths o f 3 6, 68, and 784 centimetres: Jour Geophys Research, v 68, p 423-447
Feirari , A J , 1975, Lunar gravity: The farsidc map: Science, v 188, p 1297- 1 :300
Fessenkov, V G , 1962, Photometry of the Moon, 11; Kopal, Zdenek, eel , Physics and ast,ronorny of" the Moon: New York, Academic Press, p 99 128
Ful ler M D,, 1974, Lunar magnetism: Rev Geophysics and Space Physics, v 12, p. 23-70
Gault, D E , 1970, Saturation and equilibrium conditions for impact crateiing on the lunar surface: Criteria and implications: Radio Sci v 5, no 12, p 273-291
Gt:lirels, T , Colleen, T. , and Owings, D , 1964, Wavelength depen- dence of polarization-I11 The lunar surface: Astron. Jour , v 69, p 826-852
Goetz, A F 11 , Billingsley, F C , Head, J W , McCord, T B , and Yost, E , , 1971, Apollo 12 multispcctral photography experiment: I'roc Second Lunar Sci. Conf', Geochim et Cosrnochiin Acta, Supp 2, v. 3, p 2301-2310
Gold, T , 1955, The lunar surface: Monthly Notes Royal Astrori Soc , v 1 15, p 585-604,
Gold, T , Bilson, E , and Baron, I< L , 1974, Observations of iron-rich coating on lunar grains and relation to low albedo: Proc Fifth Lunar Sci Conf. Geochim et Cosmochirn, Acta, Supp 5, v 3, p. 24 13- 2422
Gold, T . Campbell, M J , and O'Leary, 13 'r , 1970, Optical and high frequency electrical properties of the lunar sample: Sci- ence, v 167, p, 707-709
Jose W A , Pearce, G W , Strangway, D W , and Larson, E E , 1972, O n the applicability of lunar breccias for paleomagnetic interpretations: The Moon, v 5, p, 156Ñ16
Jreeley, R., 1970, Terrestrial analogs to lunar dimple (drainage) cl.. '+ t , a s . . .. The Moon, v 1, p 237-252
iriscom, D L , Friebele, E J , and Marquardt, C L , 1972, P:viderice for a ubic~uitous, sub-microscopic "magnetite-like" constitiicnt in lunar soils: Proc Fourth Lunar Science Conf, Geochim et Cos- mochim Acta, Supp 4, v 3, p 2709-2727
irudewicz, 14; B , 1974, Lunar upland and plains relative age deter- mination and their bearing on the provenance of the Caylcy Formation [abs 1, i n Abstracts submitted to t he Fifth Lunar Science Conference: Hoi~stori, Tex,, Lunar Sci Inst., p 568- 570.
-lackrnan, R ,I , 1962, Geologic map and sections of the Kepler re- gion of the Moon: U.S Oeol Survey Misc Geol Inv Map 1-355 (LAC 57), scale 1 : 1,000,000.
1966, Geologic map of the Montes Apenninus region of the Moon: U S Geol. Survey Misc Oeol Inv Map 1-463 (LAC 411, scale 1 : 1,000,000
Hagfors, T , 1967, A study of the depolarization of lunar radar echoes: Radio Sci , v 2, p 445 465.
Haefors, I . , Narnii, B , and St.one, K., 1968, Aperture synthesis in . . a( i ar . astronomy . . and some applications to lunar and planetary studies: Radio Sci , v 3, p 491-509
Hallam, M E , Andre, C G , d a r k , I' E , Podwysocki, M. H , and Weidner, ,I I? , 1974, Stat,istical analysis of'Al/Si intensity ratios as a lunar geologic mapping technique tabs] , in Abstracts of papers suhmit,ted to the Sixth Lunar Science Conference: How- ton, Tex , Lunar Sci I n s t , p. 327-329,
Hallam, M E , Andre, (; G , and Weidner, J R., 1975, AlISi inten- sities of crater materials and the depths of Tranquillitatis and Serenitatis basalts labs I: Meteoritics, v 10, p 409,
IIapkc, 13 W , 196.'3, A theoretical photometric function for the lunar surface: l o u r Oeophys Research, v 68, p 4571 4586
-- 1964, Photometric and other laboratory studies relating to the lunai surface, i r ~ Salisbury, J W , and Glaser, P, E , e d s , The lunar surface layer-materials and characteristics: New York, Academic Press, p 323-334
-1966, Optical properties of the Moon's surface, in Hess, W., Menzel, I) , and O'Keefc, J , eds., The nature of the lunar sur- face: Baltimore, Md , Johns Hopkins Univ Press, p 141 - 153 ~- 1970, Inferences from the optical properties of the Moon con-
cerning the nature and evolution of the lunar surface: Radio Sci , v 5, p 293 299.
Hapke, B W , Cassidy, W A , and Wells, E. N , 1973, Chemical, magnetic and optical characterizations of glasses produced by simulated lunar surface processes: Trans Am Geophys. Union, v 54, p 356
l h p k e , 13 W., Cohen, A J , Cassidy, W A , and Wells, E N., 1970, Solar radiation effects on the optical properties of Apollo 11 samples: Proc Apollo 11 Lunar Sci Conf, Gcochim e t Cos- mochim Acta, Supp 1, v 3, p 2199-2212
I lapkc, 13 W , and Van Horn, H., 1963, Photometric studies of' con- plex surfaces with applications to the Moon: Jour Geophys. Re- search, v 68, p. 454L4570
I lai tmann, W K , and Wood, C A., 1971, Mow-Origin and evolu- tion of multi-ring basins: The Moon, v 3, p. 3-78
Head, J W , 1974, Orientale multi-ringed basin interior and implica- tions for the petrogenesis of lunar highland samples: The Moon, v 11, p 327 356.
- ~- 1976, Lunar volcanism in space and time: Rev Geophysics Space Physics, v. 14, p 265-.'TOO,
Heiken, G H , and McKay, 1) S , 1974, Petrology of Apollo 17 soils: I'roc Fifth Lunar Sci Conf,, Geochim et Cosmochim Acta, Supp, 5, v, 1, p 843 860.
Helsley, 0. E , 1970, Magnetic propeities of Luriai 10022, 10069,

LUNAR REMOTE SENSING AND MEASUREMENTS B73
10084, and 10085 samples: Proc Apollo 11 Lunar Sci Conf., Geochim e t Cosmochi~n Acta, Supp 1, v 3, p 2213-2219
Hemingway, B S , Robic, R. A., and Wilson, W H , 1973, Specific heats of lunar soils, basalt, and breccias from the Apollo 14, 15, and 16 landing sites, between 90" and 350°K Proc Fourth Lunar Sci Conf , Geochim et Cosmochim Acta, Supp 4, v 3, p. 2481- 2487
Hodges, C A., 1973, Geologic map of the 1,angrenus quadrangle of' the Moon: [J S Geol Survey Misc Geol lnv Map 1-714 (LAC 80), scale 1:1,000,000
Hoffman, K A , and Banerjee, S K , 1975, Magnetic "rig-zag" behav- ior in lunar rocks: Ear th and Planetary Sci Letters, v 25, p 331-337
Holt, H E , 1974, Geologic map of the I'urbach quadrangle of the Moon: [ J S . Geol Survey Misc Geol lnv, Map 1-822, (LAC 9 9 , scale 1:1,000,000.
Horn, P , Jessberger, E K , Kirsl,en, T , and Richter, H , 1975, ^"Ar/ '"Ar dating of lunar rocks: Effects of g a i n size and neutron irradiation: Proc Sixth Lunar Sci Conf, Geochim et Cos- mochim Acta, Supp 6, v 2, p 1563-1Ml
IIouslcy, R M , Cirlin, E H , Paton, N E , and Goldberg, I B , 1974, Solar wind and mici'omcteorite alteration of the lunar regolith: Proc. Fifth Lunar Sci Cant , Geochim et Cosmochi~n Acta , Supp 5, v 3, p 2623 2642
Housley, R M , Grant, R. W., and Paton, N E , 1973, Origin and characteristics and excess Fe metal in lunar glass welded aggre- gates: Proc Fourth Lunar Sci. ConfK, Geochim et Cos~nochim Acta, Supp. 4, v 3, p 2737-2749
Howard, H T, and Tyler, G L , 1971, Bistatic-radar investigations, in Apollo 14 preliminary science report: Natl Aeronautics Space Admin. Spec Pub NASA SP-272, p 257-266 ~- 19721, Bistatic-radar investigation, in Apollo 15 preliminary
science report: NatI, Aeronautics Space Admin Spec Pub NASA SP-289, p 23-1 to 23-10
-1972b, Bistatic-radar investigation, in Apollo 16 preliminary science report: Natl Aeronautics Space Adniin Spec Pub, NASA SP-315, p 25-1 to 25-13
Howard, K A,, 19'73, Avalanche mode of motion-Implication from lunar samples: Science, v 180, p 1052- 1055,
Howard, K A , C a n , M. H , and Muehlberger, W R 1973, Basalt stratigraphy of southern Mare Serenitatis, in. Apollo 17 prelimi- nary science report: Natl Aeronautics Space Admin Spec. Pub. NASA SP-330, p 29(1)-29(12).
Howard, K. A., and Masursky, Harold, 1968, Geologic map of the Ptolernaeus quadrangle of the Moon: U S Geol Survey Misc Geol Inv Map 1-566 (LAC 77, RLC- 13), scale 1 : 1,000,000.
Howard, K A , Wilhelms, D E , and Scott, D H , 1974, Lunar basin formation and highland stratigraphy: Rev Geophysics Space Physics, v 12, no 3, p 309-327.
Hubbard, J J , and Minear, J W , 1975, A physical and chemical model of early lunar history: Proc Sixth Lunar Sci Conf, Geochim e t Cosmochi~n Acta, Supp 6, v 1 , p 1057- 1085
Hunt, G R , and Salisbury, J W., 1970, Visible and near-infrared spectra of minerals and rocks, 1, Silicate minerals: Modern Geology, v 1, p 283-300
Hutcheon, I 1) , Macdougall, D , and Stevenson, J., 1974, Apollo 17 particle track studies-surface residence times and fission track ages for orange glass and large boulders: Proc 5 th Lunar Sci Conf'., Geochim. e t Cosmochim, Acta, Supp 5, v 3, p 2597-2608
limes, M, J . S , 1961, The use of gravity methods to study the under- ground structure and impact energy of meteorite craters: Jour Geophys Research, v. 66, p 2225-2239
Kaula, W M , 1975, The gravity and shape of the Moon: EOS, Trans Am Geophys Union, v 56, p 309-316
Kirsten, T., Horn, P , and Kiko, J , 1973, ^"Ar-^'Ar dating and rare r a s analysis of Apollo 16 rocks and soils: Proc. Fourth Lunar Sci
Conf , Gcochim el Cosmochim Acta, Supp 4, v 2, p 1757-1'784. Kovacli, R. I., Watkins, J S , and Landers, T , 1971, Active Seismic
Experiment, in Apollo 14 preliminary science report: Natl. Aeronautics Space Admin Spec Pub NASA SP-272, p. 163- 174
Kovach, R L , Watkins, J. S., and Talwani, P , 1972, Active Seismic Experiment, in Apollo 16 preliminary science report: Natl. Aeronautics Space Admin Spec Pub. NASA SP-315, p 10(1)- lO(14)
Kuiper, G I' , 1965, Interpretation of Ranger VII records, in Ranger VII, pt 2: Experimenters' analysis and interpretation: Pasadena, Calif', J e t Propulsion Laboratory, California Inst Technology Tech Kept 32-700, p 9-73,
Leich, D A , Kalil, S. B., Kirschhaum, A.R, Niemeyer, S , and Phin- ncy, I) , 1975, Rare gas studies on Boulder 1, Station 2, Apollo 17 labs], in Abstracts submitted to the Sixth Lunar Science Confer- once: Houston, Tex , Lunar Sci, Inst., p 501-503
[An, R P , Anderson, K A , Goldstein, B , Gose, W A, Hubbard, N J . , McCoy, J E , Schaher, G G , and Srnka, 1,. F. J., 1975a, Proposal to measure t he lunar surface magnetic fields using the electron scattering method: Space Sciences Lab , Univ. Califor- nia, Berkeley, UCBSSL No 581174, 216 p
Lin, 11 I' , McGuire, R E , Howe, H 0 , and Anderson, K A , 1975h, Mapping of lunar surface remanent magnetic fields by electron scattering: Proc Sixth Lunar Sci Conf, Geochim e t Cos- mochim Acta, Supp 6, v 3, p, 2971-2973.
Lincoln Laboratory, 1968, Radar studies of the Moon, vols I and 11; Lexington, Mass , Lincoln Laboratory, Mass Inst Technology, 125 p
Lucchitta, B K , 1977, Tycho, secondary crater clusters and the ori- gin of the Apollo 17 light mantle: Icarus, v 30, p 80-96
Lucchitta, B K and Sanchez, A G 1975, Crater studies i n the Apollo 17 region: Proc. Sixth Lunar Sci Conf', Geochim. et Cos- mochin~ Acta, Supp 6, v 3, p 2427-2441
Lucchitta, B K , and Schmitt, H H , 1974, Orange glass in the Sul- picius Gallus Formation a t the southwestern edge of Mare Sereni t a t is: Proc Fifth Lunar Sci. Conf ., Geochim e t Cos- mochim. Acta, Supp 5, v 1, p 223-234.
Lugmair, G. W., Scheinin, N B , and Marti, K., 1975, Sm-Nd age and history of Apollo 17 basalt 75075: Evidence for early differentia- tion of the lunar exterior: Proc Sixth Lunar Sci. Conf., Geochim, et Cosmochim Acta, Supp 6, v 2, p 1419- 1429
Lyot, B , 1929, Research on the polarization of light from planets and some terrestrial substances: Ann, Obs. Paris, v. 8, pt , 1, 161 p ; translated 1964; Natl Aeronautics Space A d ~ n i n Tech Transla- tion I?-187, 144 p
McCauley, J F 1967, Geologic map of the Hevelius region of the Moon: U S Geol. Survey Misc. Geol lnv Map 1-491 ( IAC 561, scale 1:1,000,000
- -1973, Geologic map of the Grirnaldi quadrangle of the Moon: LJ S Reol Survey Misc Geol Tnv Map 1-740 (LAC-741, scale 1 :1,000,000
McCord, T B , 1968, Color differences on the lunar surface: p. asadena, .. California Inst of Technology, Pt1.D. thesis, 181 p
-1969, Color differences on the lunar surface: Jou r Geophys, Research, v 74, p 3131-3142.
McCord, 'r B and Adams, J B, 1973, Progress in remote optical analysis of l u a m surface composition: The Moon, v 7, p 453- 474
McCord, T B , Charette, M P , Johnson, T V., Lebofsky, I.. A , and Pieters, Carle, 1972, Spectrophotometry (0.3 to 1.1 microns) of visited and proposed Apollo lunar landings sites: The Moon, v 4, p 52 89
McCord, T. B , and Johnson, T, V , 1969, Relative spectral reflectivity (0.4 to 1 0 microns) of selected areas of the lunar surface: Jou r Geophys Research, v 74, p 4395-4401.
B74 APOLLO 15- 17 OKRITAI, INVESTIGATIONS
1970, Lunar spectral reflectivity (0 30 to 2 50 microns) and iniplications for remot,e mineralogical analysis: Science, v 169, p 855- 858
McCoy, rJ E. , Anderson, K. A , Lin, R P , Howe, H. C , and McGuire, R E , 1975, Lunar remanent magnetic field mapping from orbi- tal observation of mirrored electrons: The Moon, v 14, p 35- 47.
McGetchin, T R , Settle, Mark, and Head, J W , 1973, Radial thick- ness variation in impact crater ejecta: Implications for lunar basin deposits: Ear th Planetary Sci Letters, v 20, p 226-236.
McKee, L I., Bird, R S , and Schwirzke, F , 1974, Selt-generated magnet,ic fields associated with a laser-produced plasma: Phys Rev Part A, v 9, p. 1305-1311.
Marcus, A H , 1970, Comparison of equilibrium size distributions for lunar craters: Jour Geophys Research, v 75, no 26, p. 4977- 4984
Markov, A V , 1962, The physical properties of the lunar surface, in The Moon-A Russian view: Univ Chicago Press, p 123- 156
Marshall, C H , 1963, Geologic map and sections of the Letronne region of the Moon: U S Geol Survey Misc Geol Inv. Map 1- 385 (LAC 75>, scale 1:1,000,000
Marti, K , Lightner, B. 11 , and Osbo~~n, 'r W., 1973, Krypton and xenon in some lunar samples and the age of North Ray Crater: Proc Fourth Lunar Sci Conf., Geochini et Cosmochim. Acta, Supp 4, v 2, p 2037-2048
Metxger, A. E , Trombka, ,J 1 , Reedy, R C , and Arnold, J R , 1974, Element concentrations from lunar orbital gamma-ray rnea- siirements: Proc Fifth Lunar Sci Conf, Geochim e t Cos- mochim Acta, Supp 5, v 2, p 1067-1078
Miethe, A and Seegert, B , 1911, On qualitative differences of light reflected by various parts of t,he Moon's surface: Astron Nach- richten. v 188, no 4489, p 9- 12; no 4502, p 239-246; no 4510, p. 371-374
-1914, Qualitative differences in the light reflected from var- ious parts ol the Moon: Astion Nachrichten, v 198, no 4736, p. 121- 124
Milton, 1). J , 1968, Geologic map of the Theopliilus quadrangle of the Moon: U S. Geol Survey Misc Geol Inv. Map 1-546 (LAC-78), scale 1:1,000,000
Miniiaert, M G J , 1969, The effect of pulverization on the albedo of lunar rocks, Icarus, v 11, p 332 337.
Moore, I1 ;I , 1964, Density of small craters on the lunar surface, in Astrogeologic studies annual progress report, August 24, 1962- -July 1, 1963, pt. I): U.S Cool Survey open-file report, p 34-5 1 - -1965, Geologic map of the Aristarchus legion of the Moon:
U S Geol Survey Misc Geol Jnv Map 1-465 (LAC 39), scale 1 : 1,000,000 - 1967, Geologic Map of the Seleucus quadrangle of the Moon:
U S Geol Survey Misc Geol Inv Map 1-527 (LAC 38), scale 1 : 1,000,000. - 1968, Ranger VIII and gravity scaling of lunar craters: Sci-
cncc; v 159, p 333-334 -1971a, Geologic in terpr~ta t ion of lunar data: Eart,h Sci Rev.,
v 7, [I. 5-33 - --1971b, Craters produced by missile impacts: Jour. Geophys
Research, v 76, p 5750 5755 1976, Missile impact craters (White Sands Missile Range,
New Mexico) and applications to lunar research: U S Ceol Sur- vey Piof Paper 812-B, 47 p
Moore, H J , Hedges, 0 A , and Scott, D 11 , 1974, Multirillged basins-Illustrated by Olicntale and associated features: Proc Fifth Lunar Sci Cont , Geocliiin et Cosmochim Acta, S u p p 5, v 1, TI 71-100
Moore, H J , Lugn, It V, arid Newman, 1'; B , 1974, Some morphometric properties of expel imentally cratered surfaces: U S Geol Survey Jour Research, v 2, p 279-388
Moore, II J , and Schaber, G G., 1975, An estimate of the yield strength of the Irnbrium flows: l'roc. Sixth Lunar Science Conf , Geochim et Cosrnochim Actti, Supp 6, v 1, p 101- 118
Moore, H , J , and Tyler, G L., 1974, Comparison between photo- grammetric and bistatic radar slope-frequency distributions, in Apollo 17 preliminary science report, pt C: Natl. Aeronautics Space Admin Spec. Pub NASA SP-330, p 33(17)-33(26).
Moore, 11 ,J., Tyler, G L , Boyce, J . M, Shorthill, R W ,Thompson, T. W , Walker, A S , Wilhelms, D E., Wu, S S C , and Zisk, S H , 1975, Correlation of photogeology and remote sensing data along the Apollo 14 bistatic-radar ground track, Part I-A working compendium: U S. Geol, Survey Interagency Repoi't Astrogeol- nky 75 (Open-File Rept 75-284), 8 8 p
--- 1976, Correlation of photogeology and remote sensing data along the Apollo 14, 15, 1 6 bistatic-radar ground track, Par t 11-A working compendium: U S Geol. Survey Interagency Rept. Astrogeology 80, (Open-File Kept 76-298), 101 p.
Moore, H J , and Zisk, S, H , 1973, Calibration of radar data from Apollo 17 and other mission results, in Apollo 17 preliminary science report: Natl Aeronautics Space Admin. Spec Pub NASA SP-330, part B, p 33(10)-33(17)
Morris, E C , and Wilhelms, I) E , , 1967, Geologic map of the Julius Caesar quadrangle of the Moon: U S Geol Survey Misc. Geol Inv Map 1-510 (LAC 60), scale 1:1,000,000.
Morrison, D A , McKay, D S , Moore, H J,, and Ileiken, G I i , 1972, Microciaters on lunar rocks, in Criswell, D , R , ed , Proc. Third Lunar Sci Conf, Geochim et Cosmochim Acta, Supp 3, v 3, p 2767- 2791
Morrison, R I1 , and Oberbeck, V K , 1975, Geomorphology of crater and basin deposits -Emplacement of the F ra Mauro Formation: Proc Sixth Lunar Sci Conf', Geochini et Cosmochim Acta, Supp 6, v 3, p 2503-2530.
Muehlberger, W. R , Batson, R M , Fieernan, V L., l lai t , M H., Holt, H. E , Howard, K A , Jackson, E I ) , Larson, K B, , Reed, V. S , Reniiilson, J A , Scott, I) H., Sutton, R I. , Stuart-Alexander, 11 K , Swarm, G A, Trask, N. J, Ulrich, G. K , Wilshire, H. G , and Wolfe, E W,, 1973, Preliminary geologic analysis of the Apollo 17 site, in Apollo 17 preliminary science repoit: Natl. Acronau- tics Space Admin Spec Pub 330, 11. 6 1 to 6-91
Muller, P M , and Sjofren, W L , 1968, Lunar mass concentrations: Science, v 161, no 3842, p 680-684.
Nagata, T., Fisher, R M , Schwerei, 1'' C., Fuller, M D , and Dnnn, ;J R , 197 1, Magnetic properties and remanent magnetization of Apollo 12 lunar mat,erials and Apollo 11 lunar niicrobreccias: Proc Second Lunar Sci. Conf., Geochim et Cosrnochim Acta, S u p p 2, v 3, p 246 1-247 1
-- 1972, Rock magnetism of Apollo 14 and 15 materials: l'roc Third Lunar Sci. Gont', Geochim, e t Cosmochim Acta, Supp 3, v 3, p 2423-2447.
-1973, Magnetic properties and natural reinanent magnetixa- tion of Apollo 15 and 16 lunar materials: I'roc. Fourth Lunar Sci Conf , Geochim et Cosmochim Acta, Supp, 4, v. 3, p 3019-3043 - 1975, Basic magnetic properties of Apollo 17 basaltic and anorthositic materials 1 ahs 1, in Abstracts submitted to the Sixth Lunar Science Conference: Houston, Tex., Lunar Sci. lust., p 58-1-586
Nagata, 'I' Ishikawa, Y , Kinoshita, H Kono, M , Syono, Y and Fisher, R, M., 1970, Magnetic properties and natural remanent magnetization of lunar samples: Proc. Apollo 11 Lunar Sci Conf , Geochim. et Cosmochim Acta, Supp 1, v 3, p 2325-2340
Nagata,'I1, Sugiura, N., Fisher, R M , Schwerer, F C ,Fuller, M D., and Dunri, J . R , 1974, Magnetic properties of Apollo 11-17 lunar materials with special reference to effect,^ of meteorite impact.: I'roc Fifth Lunar Sci Conf, Geochirn et Cosrnochim Acta, Supp 5, v 3, p 2827-2839
Nakamurti, Y , Latham, (1 , Lannnlein, D., Ewing, Maurice, Duen-
LUNAR REMOTE SENSING AND MEASUREMENTS B75
nebicr, F K , and Dorman, J , 1974, Deep lunar interior inferred from recent seismic data: Geophys Research Letters, v 1, p 137- 140
Nash, 1) B , and Conel, J E , 1973, Vitrication darkening of rock powders: Implications for optical properties of the lunar surface: The Moon, v 8, p 346-364
-1974, Spectral reflectance systematics for mixtures of pow- dered hypersthene, laboradorite, and ilmenite: Jour Geophys Research, v. 79, p 1615 1621.
National Space Science Data Center, 1969, Lunar Orbiter photo- graphic data: Greenbelt, Md , Goddard Space Flight Center, Data User's Note NSSDC 69-05, 37 p and plates
-- 1971 a, Apollo 14 lunar photography: Greenbelt, Md , Goddard
Spaceflight Center, Data User's Note NSSDC 71- 16a, 25 p -1971h. Apollo 14 photography: Greenbelt, Md , Goddard
Spaceflight Center, Data User's Note NSSDC 71 16h, 139 p -1971c, Apollo 14 photographic catalog: Greenbelt, M d , God-
dard Spaceflight Center, Data User's Note NSSDC 71-16c, 375
P" -1972, Apollo 15 Lunar photography: Greenbelt, M d Goddard
Spaceflight Center, Data User's Note NSSDC 72-07, 33 p , 2 appendices
-1973, Apollo 16 lunar photography: Greenbelt, Md , Goddard Spaceflight Center, Data User's Note NSSDC 73-01, 47 p , 2 appendices.
-1974, Apollo 17 lunar photography: Greenbelt, M d Goddard Spaceflight Center, Data User's Note NSSDC, 74 08, 59 p , 2 appendices
Nettleton, L. L,, 1940, Geophysical prospecting Sor oil: New York, McGraw-I Iill, 444 p.
Neukum, G , Konig, B,, and Arkani-Hamed, J., 1975a, Study oflunar impact crater size-distributions: The Moon, v 12, no 2, p 201- 230
Neukum, 0 , Knnig, B , Fechtig, H , and Storzer, D , 19731, Crater- i n s in the Earth-Moon system: Consequences for age detennina- tion by crater counting: Proc. Lunar Sci Conf' 6th, Geochim e l Cosrnochim Acta, Supp. 6, v 3, p 2597-2620
Nyquist, L E , Bonsai, B M, and Wiesmann, H , 1975, Rb-Sr ages and initial !"Sr/>"'Sr for Apollo 17 basalts and KREEP basalt 15386: I'roc Sixth Lunar Sci Conf,, Geochim et Cosmochim, Acta, Supp 6, v 2, p 1445 1465
Oherheck, V 13 , 1970, Laboratory simulation of impact cratering with high explosives: Natl Aeronautics Space Admin. Tech Mom NASA TM-~X-620 10, 56 p,
-- 1975, The role of ballistic erosion and sedimentation in lunar stratigraphy: Rev Geophysics Space Physics, v. 13, no 2, p  ¥ a 362
Oberbeck, V R , Unrz, F., Morrison, Ii H , Quaide, W L, and Gault, 1) E , 1975, The origin of lunar smooth-plains: The Moon, v 12, no 1, p 19-54
Oberbcck, V R , Morrison, It H , and Wcdckin, John, 1972, Lunar secondary craters, in Apollo 16 preliminary science report: Natl Aeronautics Space Admin Spec Pub, NASA SP-315, p 29(5 1)-29(56)
Oberheck, V. Ii , and Quaide, W L , 1967, Estimated thickness of a fragmental surface layer of Oceanus Procellarurn: J o u r Geophys Research, v 72, p 4697 4704 - 1968, Genetic implications of lunar regolith thickness varia-
tions: Icarus, v 9, p 446-465 O'Kepfe, J I ) , and Ahrens, 'I' J . , 1976, Distribution of initial impact
cjecta, in Abstracts submitted to the Seventh Lunar Science Conference: Houston, Tex , Lunar Sci In s t , p, 648 650
Olson, A. 15, and Wilhelms, I) E , 1974, Geologic m a p of the Mare Undarum quadrangle of the Moon: U S Geol Survey Misc Geol Inv Map 1- 837 (LAC 621, scale 1 : 1,000,000
I'ap:~nastassiou, D A and Wassorburg, (I J , 1970, Rb-Sr ages of
lunar rocks from the Sea of Tranquillity: Ear th Planetary Sci Letters, v 8, p 1-19.
-1971a. Lunar chronology and evolution from Rb-Sr studies of Apollo 11 and 12 samples: Earth Planetary Sci. Letters, v 11, no. 37, p 37--62
-1971b, The Rh-Sr ages of igneous rocks from the Apollo 14 mission and the ages of t he Fra Mauro Formation: Earth Planetary Sci Letters, v 12, p 36-48
1972, The lib-Sr age of a crystalline rock from Apollo 16: Ear th Planetary Sci Letters, v 16, p 289-298
1973, Rb-Sr ages and initial strontium in basalts from Apollo 15: Earth Planetary Sci Letters, v 17, p 324-337.
1975, Rb-Sr study of a lunar dunite and evidence for early lunar differentiates: Proc. Sixth Lunar Sci, Conf, Geochim et Cosmochim A d a , Supp 6, v 2, p. 1478 - 1489
Parker, M. N,, and Tyler, G. 1 , 1973, Bistatic-radar estimation of surface-slope probability distributions with applications to the Moon: Radio Sci., v 8, p. 177- 184.
I'earce, G, W , Gose, W A , and Strangway, D W , 1973, Magnetic studies of Apollo I5 and 16 lunar samples: Proc. Fourth Lunar Science Conf,, Geochim, et Cosrnochim Acta, Supp 4, v 3, p 3045-3076
Pearce, G W , Strangway, D W , and Gose, W A", 1972, Reinanent magnetization of the lunar surface: Proc Second Lunar Sci Conf , Geochim et Cosmochirn Acta, Supp 2, v 3, p. 2449-2464
1974, Magnetic properties of Apollo samples and implications for regolith formation: Proc Fifth Lunar Sci Conf., Geochim. e t Cosmochim Acta, Supp 5, v 3, p 2815-2826
Pellicori, S F , 1969, Polarization-cilbedo relationship for selected lunar regions: Nature, v 221, p 162
Pettengill, G H , and Thompson, T W , 1968, A radar study of" the lunar crater Tycho at 3 8 cm and 70 cm wavelengths: Icarus, v 8, p 457-471
Pettengill, G H., Zisk, S. I1 , and Thompson, T W , 1974, The map- ping of lunar radar scattering characteristics: The Moon, v 10, p 3-16
Pettit, Edison, 1961, Planetary temperature measurements, in Kuiper, G P , and Middlehurst, B M , eds , The solar system, planets and satellites, v. Ill, chap 10: Univ Chicago Press, p. 400-428,
I'ieters, Carle, Head, J W , McCord, T. B , Adams, J B , and Zisk, S H , 1975, Geochemical and geological units of Mare Humoruni: Definition using remote sensing and lunar sample information: I'roc Sixth Lunar Sci. Conf , Geochim. et Cosinochim A d a , Supp. 6, v 3, p 2689-2710
I'ieters, Carie, McCord, 'I' B , Charette, M P., and Adarns, J B , 1974, Lunar surfaces: Identification of the dark mantling mate- rial in the Apollo 17 soil samples: Science, v 183, p. 1191-1194
I'ieters, Carle, McCord, T B , Zisk, S H , and Adams, J. 13 , 1973, Lunar black spots and the nature of the Apollo 17 landing area: Jou r Geophys. Research, v 78, p. 5867~- 5875.
Pike, R J 1974, Depthldiameter relations of fresh lunar craters; Revision from spacecraft data: Geophys Research Lett , v 1, no. 7, p 291-294
- -1980, Geometric interpretation of lunar craters: U S. Geol Survey Prof&ssional Paper 1046-C (in press)
Podwysocki, M H , Weidner, J K , Andre, C , G , Bickel, A L , Lum, R S , Adler, 1 , and Trombka, J . I , 1974, The application of trend surface analysis to a portion of the Apollo 15 X-ray fluorescence data: Proc Fifth Lunar Sci Coni', Geochim et Cosmochim Acta, Supp 5, v 3, p. 30 17-3024
Pohl, ,I , and Aiigenheister, G., 1969, Anomalien des Erdmag- netifeldes und Magnet is ie~ung (ler Gestcine irn Nordlinger Ries: Geol Bavarica, v 61, p 327 336
Pohn, H. A , and Wildey, R L , 1970, A photoelectric-photographic study of the normal albedo of the Moon: U S Geol Survey Prof'

Br76 AI'OLLO 15-1 7 ORBITAL INVESTIGATIONS
Paper 599-E, 20 1) Pollack, J B , and Whitchill, Laird, 1972, A multiple-scait,eri~lg
model of the diffuse component of lunar radar echoes: l ou r . Gcophys Research, v 77, no. 23, p 4289 4303
Ijonsonby, rJ E B ,Morrison, 1 , Birks, A It , and Landon, ,I K., 1972, Radar images of the Moon a t '75 and 185 cm wavelengths: The Moon, v 5, p 286-293
Quaide, W I , , and Oherheck, V R , 1968, Thickness determinations of the lunar surface layer from lunar impact craters: Jour Goophys Research, v. 73, no 16, p 5244-5270
- - -1969, Geology of the Apollo landing sites: Eart,h Sci Rev , v. 5, p 255-278
Radlova, L N , 1941, Visual colorimetry of the Moon, Uchenyyc Zapiski: Leningrad State Un iv , no 82, p 99-129 (in Russian).
- -1943, Photographic colorimetry of the Moon: Astron Zhur , v
20, 1) 1-13 (in Russian with English summary) Reed, V S , , and Wolfe, E W, , 1975, Origin of the Taurus-Littrow
massifs: Proc. Sixth Lunar Sci Conf, Geochirn et Cosmochim Acta, Supp 6, v 3, p 2443 2461.
Regan, R D , and Hinze, W J , 1975, Gravity and magnetic investi. gat,ions of Meteor Crater, Arizona: Jour Geophys Research, v 80, p 776 788
Rhodes, J M , Adams, J I3 , Charette, M B , and Rogers, K V , 1975, 'Phe chemistry of agglutinate fractions in lunar soils: Lunar Sci- ence VI, Lunar Sci Inst , Houston, Tex , p 665-666
Roberson, F I , and Kaula, W M , 1972, Apollo 15 laser altimeter, in Apollo 15 preliminary science report: Natl Aeronautics Space Admin Spec Pub NASA SP-289, p 25(48)-25(50)
Roelof, E C , 1968, Thermal behavior of rocks on the lunar surface: Icarus, v 8, p 138- 159
Rowan, L C , 1971, Geologic map of the Rupes Altai quadrangle of the Moon: U S Geol. Survey Misc Geol Inv Map 1-690 (LAC 96), scale 1 : 1,000,000
ltuncorn, S. K , 1975, An ancient lunar magnetic dipole field: Nature, v 253, p 701 703
Runcorn, S K , Collinson, D W , O'Reilly, W , Battey, M H , Stephenson, A , Jones, rJ M, Manson, A J. , and Readman, I' W , 1970, Magnetic properties of Apollo 11 lunar samples: Gcochim et Cosrnochim Acta, Supp 1, v 34, p. 2369-2398
Runcorn, S K , Collinson, D W , O'Reilly, W , Stephenson, A , Battey, M H , Manson, A J , and Readman, P W , 1971, Mag- netic properties of Apollo 12 lunar samples: Proc Royal Soc. London, Ser A,, v 325, p, 157-174
Russell, C T , Coleman, 1' J , Lichtenstein, B R., Schubert, G , and Sharp, I. K , 1974, Apollo 15 and 16 subsatellite magnetometer measurements of the lunar magnetic field: I'roc 16th plenary meeting of COSPAR Akademie-Velga, Berlin, Space Research, v 14, p 629-634
Russell, C; T , Coleman, P. J , J r , Fleming, B K , Hilbuin, L , Lichtcnstein, B R , and Schubert, G , 1975, Low altitude lunar magnetic field observations, in Abstracts submitted to the Sixth Lunar Science Conference: Houston, Tex., Lunar Sci lnst , p 695
S a a r i J M , and Shorthill, I< W , 1963, Isotherms of crater regions on the illuminated and eclipsed Moon: Icarus, v 2, p 1 1 5 1 3 6 -1965, Thermal anomalies on the totally eclipsed Moon of De- cember 19, 1964: Nature, v 205, p. 964-965.
-- 1966a, Isotherms in the equatorial region of the totally eclipsed Moon: Boeing Sci Research Laboratories Doc, Dl-82- 0530, 3 p , 1 chart
1966i1, Hot spots on the Moon: Sky and Telescope, v 31, no 6, p. 3 - 7
-1967, Isothermal and isophotic atlas of the Moon-contours through a lunation: Natl Aeronautics Space Admin Contractor Report NASA OR -855, 186 p
- --1972, The sunlit lunar surface 1, albedo studies and full Moon temperature distribution: The Moon, v 5, p 161 - 178
Saari, J M , Shorthill, K W , and Deatori, 'Y K , 1966, Infrared and visible images of the eclipsed Moon of December 19, 1964: Icarus, v 5, p. 635-659
Salisbury, J W , 1970, Albedo of lunarsoil: Icarus, v. 13, p 509 512. Schaber, 0 G , 1973, Lava flows in Mare Imbrium: Geologic evalua-
tion from Apollo orbital photography: Proc Fourth Lunar Sci Conf, Geochim et Cosmochim. Acta, Supp, 4, v 1, p 73-92
%haher, (; G , Eggleton, R. E , and Thompson, T W , 1970, Lunar radar mapping correlation between radar reflectivity and stratigraphy in northwestern Mare Imbrium: Nature, v 226, no 5252, p 1236 1239.
Schahei, G G , Thompson, T W , and Zisk, S H , 1975, Lava flows in Mare Imbrium: An evaluation of anomalously low Earth-based radar reflectivity: The Moon, v 13, p. 395-423,
Schrnitt, H H 1974, Lunar mare color provinces a s observed on Apollo 17: Geology, v 2, p, 55-56
Schultz, F'. 11 , and Gault, 11 K , 1974, Seismic effects from major basin formation on (.he Moon and Mercury: Natl. Aeronautics Space Admin NASA TM, S-62, 388, 39 p
Scott, D H , Diaz, J M , and Watkins, J A , 1975, The geologic evaluation and regional synthesis of metric and panoramic pho- tographs: Proc Sixth Lunar Sci. Conf , Geochim e t Cosmochim Acta, S u ~ p , 6, v 3, p 2531-2540
Scott, I ) 11 , McCauley, J F , and West, M N , 1977, Geologic map of t he west side of the Moon: U S Geol Survey Misc Inv Map 1 1034, scale 1 : 5,000,000
Scott, U H , and I'ohn, H. A, 1972, Geologic map of the Macrobius quadrangle of the Moon: U.S Geol Survey Misc Geol Inv. Map 1-799 (LAC 43), scale 1 : 1,000,000
-- 1974, The geologic significance of some luna r gravity
anomalies: Proc Fifth Lunar C o n f Geochim, et Cosmochim A d a , Supp 5, v 3, p 30253036
Scott, N. W , 1964, Color on the Moon: Nature, v. 204, p 1075- 1076. Shoemaker, E M , 1965, Preliminary analysis of the fine structure of
the lunar surface in Marc Cogniturn, in Ranger VII, Part 11, Experimenters ' analyses and in terpre ta t ions : Pasadena, California Inst. Technology Je t Propulsion Lab. Tech Rept 32-700, p 75- 134.
-1970, Origin of fragmental debris on the lunar surfhce and the history of the bombardment of the Moon: paper presented a t I Seminaris de Geologia Lunar, Univ Barcelona, May 1970,
Shoemaker, 14; M., 13atson, It M, Holt, H E , Morris, E C , Rennil- son, J . J , and Whitakcr, E A , 1969a, Observations of the lunar regolith and the Ear th from the television camera on Surveyor 7: Jou r Geophys Research, v 74, no 25, p, 6081-6119
Shoemaker, E M , and Hackman, R. J , 1962, St ra t ipaphie basis for a lunai time scale, in Kopal, Zdengk, and Mikhailov, Z K , eds , The Moon: New York, Academic Press, p 289-300
Shoemaker, E M, Hait, M H , Swann, G A , Schleicher, D. L, Ijahlern, D H , Scliaher, G G , and Sutton, R L , 1970, Lunar regolith a t Tranquillity Base: Science, v , 167, no 3918, p 452- 455
Shoemaker, E M , Morris, E , C , Batson, R M., Holt, I1 E Larson, K B , Montgomery, D R , Rcnnilson, J J , and Whitaker, E. A , 1969i1, Television observations from Surveyor, in Surveyor pro- gram results: Natl Aeronautics Space Adnlin Spec Pub NASA S P 184, p 19-128
Short, N,M , and Forman, M L , 1972, Thickness of impact crater ejecta on the lunar surface: Modern Geology, v 3, p 69-91
Shorthill, R.W , 1970, "Infrared Moon": A review: Jour Spacecraft and Rockets, v 7, p 385 397
-- 1973, Infrared atlas charts of the eclipsed Moon: The Moon, v
7, p 22-45

B72 APOLLO 15-1 7 ORBITAL INVES'l IGAI IONS
c h i m A d a , Supp 6. v . 2. p 241 7-2426 Duennebier. I" I< Watkins, J S and Kovach R L 1974. Results
from the Lunai Suiface Piotiling Expeiimerit: Abs Fifth Lunai Sci Conf , Johnson Spitceciuft Centei , Houston Tex, Maich 18-22 197.1, p 183
Dunn. J , Fishei R M , Fullei, M D 1-ally. S , Rose. h'l E , S c h w n n IÂ¥ L and \\'nsilewski. P J. 1972 Shock icmanent riiagnetization of luniit soil t abs 1, i n Abstiiicts submitted to the Fnurth Lunai Science Confeience: Houston, 'Sex . Lunai Sci Inst , 11 19.1- 195
Dyal P C Pal kin, C \$I , and Sonnett. C P . 1970. Lunai Suil'ace Magnetometei Expeiimcnt, in Apollo 12 Pieliminars Science Repoit: Natl Aeronautics SPEIL-c Admin Spec Pub 235, p 55-73
Dyal, P C Pinkin C \\I, Colbuin. D S , and S c h u l m t G . 1972. Luniii Surface Maffnetometel Expcument: ApoIIo 16 Prelim Sci Rept Natl Acionuutics Splice Admin Spec Pub 315 p 11-1 to 11-1.1
Eggleton, R E . 1965. Geologic map of the Ripli~ieus Mountains 10-
gion of the Moon: U S Geol Suivcy Misc Geol Inv Map 1-453 ILAC 761. scnle 1 : 1,000 I100
Eggleton. R E . and Schabel G G , 19Z. Cayley Foimation intci- piotc'd as basin ejecta. i" Apollo I 6 pieliminaiy science icpoit: Natl Aeionautks Space Admin Spec Pub 3 1 5 p 29-7 to 29- If;
Elston, D I' . 1972 Geologic mnp of the Colombo quatiiiingle of the Moon: U S Geol S U I V L ' ~ Misc Geol Inc Map 1 - 7 1 4 (LAC 791. scale 1 : 1 000 000
Epstcin S , and Taylm. 1-1 P . .JL 1971, O1'10'", Si:"'/SP DIH, and C"VC1: iat ios in luniii samples: Proc Second Lunai Sci Con! Geochim c t Cosmochim Actii, Suiip. 2. v 2, p 1-121-1-1.H
Evans, J V , 1962 Radio echo studies of the Moon, in Kopnl, Zdenek cd . Physics and astronomy of the Moon: New Ynik. Aciidomic Piess. -129-1751
Evans, J V , and t lngkns 'S , 1971, Radzit studies of the Moon, 111
Advances in ~tstronomy and :istn~ph!sics: New Y(nk Aciidemic P8ess. p 29-105
1- ins. ., J V , and Pcttengill. G H 1963 The s u i t t e ~ irig behaviol of the Moon a t wavelengths of 3 6. (58, and '78-1 centiinyties: Jour G e o p h p Rcseorch. v GS. 1, 423-.I47
Fe~r i l r i , A J , 1975, Lunai gravi1y:'I he h i s i de map: Science v 188. p 1297-1300
Fessenkov. V G , 1962, P h i l o m e t ~ y of thc Moon i n Kolxil. Zdenek, d. Physics and astronomy of the Moon: New Yoi k, Academic Piess, p 99-128
Fullei , M D , 197-1. Lunar magnetism: Rev Geophysics and Space Physics v 12. p 23-70
Gault , D E , 1970. Sittuiation and equilibt ium conditions tbi impact c r a t e ~ i n g on the lunur sur l ice : Critei ia and implications: Radio Sci v 5, no 12, p. 273-291
Gehreb , T , Coflken, T . and Owings, D . 1964. Wavelength depen- dence of polarization-Ill The lunw suiface: Astron Joui , v 69, p 826-852.
Goetz, A !Â¥ H , Billingsley, F C . Head. J W , McCmd. I B . and Yost, E , 1971, Apollo I 2 multispectial photogiapl~y experiment: Proc Second Lunai Sci Con1 , Geoehim e l Cosrnochim Acta Supp 2. v 3. p. 2301-2310
Gold, T , 1955,'The lunai surface: Monthly Notes Royal Astron S w . v 115, p 58.5-604
Gold. T , Bilson, E a n d Baron. R L., 1974, Observationsol iron-rich touting on lunar g a i n s and relation to low albedo: Proc Fifth Lunar Sci Conf , Geochim e t Cosmochim Acta, Supp 5, v 3, p 24 13-2.122
Gold, .I , Campbell, M J . and O'Leary, B T , 1970, Optical and high frequency electrical piopeities 01 the lunat sample: Sci- ence, v 167, p 707-709
3 0 ~ 6 . \\I A , Peaice G \V , S t ~ a n g w a y , D \\I . and Laison. E E , 1972 On the iipplicabiiity of lunai breccias foi paleomagiietic inteiprettitions: The Moon. v ,5, 1, 156-169
Si-celey. R . 1970 Tcnes t i ia l analogs to lunai dimple Idiainagel craters: The Moon, v. 1 p 237-252
i s , 0 L , Fiiebek'. E J , a n d Miirquardt, C L , 1972 Evidence f i i a uhiquitcius. suh-micioscopic "magnetite-like" constituent in lunai soils: Proc Fnm t h Lumu Science Conf , Geochim e l Cos- mocliini Acta. Supp .I v 3, p 2709-V27
Qiudewicz, E B 1974, 1,un;n upland and plains ielative age dele>- n a t i o n and theil beaiing on the provenance of the Cayley Foi miition [abs 1, in Abstracts submitted lo the Fifth Lunai Science Conference: Houston. Tcx , Lunai Sci I n s t , p 508-$70
Htickiiitin, 13. J . 1.962, Geologic m;ip and srclions of the Keplei ~ e - gion of the Moon: U S Geol Survey Misc Gcol Inv Map 1-355 ILAC 571. scale 1 : l.O0O.O00
-1966, Geologic niap of the Montes Apenninus legion of tlie Moon: U S Geol Suivey Misc Geol Inv Map 1-163 (LAC .Ill, scale 1 : l.O~IO.00lJ
I-lagl"is, T , 1967 A study of the depolaxi'/.tition of lunar ladai choes : Radio Sci , v 2. 11 445--165
Hiigibis. T , Namii B . and Stone K 1968, Apeituie synthesis in riidai iistionomy ;ind some ;.ipplicntions to luna; and planetaiy studies: Radio Sci . v 3, p 491-509
Hallam. M E , Andie. C G . Clnik P E , Podwysocki M H , and \tfeidnei J R . 197-1. SliUislical annlysisol AllSi intensity iiitius as a luniii geologic mapping technique labs 1, iu Abstracts nf plipeis submitted 1~ the Sixth Lunar Science Confbicnce: Hous- tun 'Sex . Lunai Sci I n s t , p 327-329
Hnlltim. M E , Andie C G and Weidnet, J R . 1975. AIISi inten. sities of cgiitei materials rind thc dopths of Ti;inquiIlitEitis and SescnitEitis busalts [abs 1: Meteoiitics v 10, p 409
thtpko, B \\I . 1963, A theoretical phiiloniet~ic function foi the lunar suifaco: JOUI Geophys Research v 68, p -1571--1586
-196.1, Photometi ic and other lnboiatory studies relating to the lunui suililce. in Sulishury. .I \Ir. and Glasei. P E e d s , The luniii surface layer-muterials iind chaiacteiistics: New Yoi k. Acndemil: Pless p 323-33.1
-1966, Optical piopcities of the Moons suifiico, in Mess, \\' Menzcl. D , und 0 Keefe. J , eds , The nature of t he lunui sur - face;: Biiltimoie, Md . Johns Hopkina Univ Press, p 1-11-153
-1970, Infeicnccs horn the optical properties d l11e Moon con- cerning the na tu i eand evolution of the lunai suif ice: RudioSci , v Y. p 293-299
Hapke. B \$' Cassidy, \V A , and Wells, E N , 1973, Chemical. magnetic ;ind optical chaiacteiii'.ations of glasses produced by simulated luniir surface processes: Fians Am Geophys Union, v 5-i. p 356
Hapke. B \V , Colien A .I . Cassidy, W A . and Wells, E N . 1970, S o h indialion effects on the opticiil propeities of ApoHo 11 samples: Pioc Apollo 11 Lunai Sci Con1 Geochim el Cos- mochim Actn, Supp 1, v 3 p 2199-2212
Hapke B \\I , ;ind Van Hoi n, H , 1963, Phutonietric studies of com- plex susfaces with applications to the Moon: Jciui Geophys Re- se i i~~ch. v 68, p 45-15-4570
Hartmann, I\' I < , and Wood, C A , 1971, Moon-O~igin and evolu- tion oS multi-) ing basins: The Moon, v 3, p 3-76
Hcad, J W . 1974. Orienlale multi-iinged basin interior and implica- tions 1'0, the pctrogenesis 01 l u n a highland samples: The Moon, v ll, p 327-356
-1976, Lunar volc~inism in space and time: Rev Geophysics Space Physics, v. 1-1, p 265-300
Heiken, G H , a n d McKay, D S , 1974, Petinlogy of Apollo 17 soils: Proc Fifth Lunar Sci Conf Geochim e l Cosmochim Acta, Supp 5. v 1. p 843-860
Helsley, C E , 1970, Magnetic piopeities of Lunar 1002'! 10069,
R78 APOLLO 15- 17 ORBITAL INVESTIGATIONS
Research, v 73, p 7608- 7620 Tyler, G L , and Howard, H '1' , 1973, Dual-frequency bistatic-radar
investigations of the Moon with Apollos 14 and 15: Jour Geophys Research, v 78, p 4852-4874
Tyler, G L , Howard, 11 T , and Dow, G R , 1973, Stanford Apollo Bistatic-Radar Experiment (S 170): National Space Science Data Center description: Stanford, Calif , Stanford Electronics Laboratories, Center foi Radar Astronon~y, Radioscience Labo- ratory Tech Rept 3282- 1 (SU SEL72-006), 8 3 p
Tyler, C L , Simpson, R , A , and Moore, I1 J , 1971, Lunar slope distributions: Comparison of histatic-radar and photographic re- sults: Jour Gcophys Research, v 76, p 2790-2795
Ulrich, 0 E , and Muetilberger, W E , ed , 1980, Geology of the Apollo 16 area, central lunar highlands: U S Cool Survey Prof Paper 1048 (in press)
Ulrich, G I< , and Saunders, R S , 1968, Advanced system traverse research project report with a section on problems for geologic investigations of the Orientale region of the Moon: U S Geol Survey open-file rept Astrogeology 7, 11 p
Urey, Harold, and Runcorn, S K , 1973, A new theory on lunar magnetism Science, v 180, p 636-638
Wartcn, N , and Ancieison, 0 L , 1972, Applications to lunar geophysical models of the velocity-density propeities of lunar rocks, glasses, and artificial glasses: Proc. Third Lunar Sci Conf , Geochim. et Cosmochim Acta, Supp 3. v 3, p 2587- 2598
Wasilewski, I' J , 1974, Magnetic remanence mechanisms in iron and iron-nickel alloys, metallographic recognition criteria and implications for lunar sample research: The Moon, v 9, p 335- 354
Wasserburg, C J , and I'apanastassiou, D. A , 1971, Age of a n Apollo 15 mare basalt: L,unar crust and mantle evolution: Ear th Planetary Sci Lett., v 13, p 97- 104
Whitaker, E . A , 1972, Color contrasts in Mare Nubium and the southern Oceanus Procellarurn, in Apollo 16 Preliminary Sci- ence Report: Natl Aeronautics Space Admin Spec Pub NASA SP-315, p. 29- 104 to 29-105
1973, Lunar color boundaries and their relationship to topo- graphic features: A preliminary survey: The Moon, v 4, p. 348- 355
White, W B., and Keester, K L , 1966, Optical absorption spectra ot
iron in the rock-forming silicates: Am, Mineralogist, v 51, p 7 7 4 7 9 1
- -1967, Selection rules and assignments f i x the spectra of Ser- rous iron in pyroxenes: Am Mineralogist, v 52, p. 1508-1514
Wilhclins, D. E, 19'70, Summary of lunar stratigraphy-Telescopic observations: U S Geol Survey Prof Paper 599 F, 47 p
m a , Geologic mapping of the second planet: U S Geol, Sur- vey Interagency Kept Astrogeolog-y 55, 36 p
- -1 972h. Geologic map ol the Taruntius quadrangle of the Moon: U.S Geol Survey Misc Geol Inv Map 1 722 (LAC-61), scale 1 : 1,000,000
- -1980, Stratigraphy of part of the lunar nearside: U S . Geologi- cal Survey Prof Paper 1046 A (in press)
Wilhelrns, J) E , and El-Bax, Farouk, 1975, Geologic map of the east region of the Moon: U S Geol Survey Misc Inv. Map I 948, scale 1 : 5,000,000.
Wilhelms, 11 E , and McCauley, J . I? , 1971, Geologic map of the near side of the Moon: U S Geol Survey Misc Geol Inv. Map 1-703, scale 1 : 5,000,000
Wilsing, I , and Scheiner, I , 1921, Spectrophotometric meas- urements on rocks on the Moon, Mars, and .Jupiter: Pub As- trophys Observatory F'otsdam, v. 24, p. 3-25
Winter, D I(', 1970, Tlie infrared Moon: Data interpretations and implications: Radio Sci , v 5, p 229-240
Wolfe, E , W , Lucchitta, B K., Reed, V S , Ulrich, G E., and San- chez, A G , 1975, Geology of the Taurus-Littrow valley floor: 1'roc Sixth Lunar Sci Conf., Geochim et Cosmochim. Acta, Supp 6, v 3, p 246:j-2482,
Wood, R. W , 1912, Selective absorption of light on the Moon's su r - face and lunar petrography: Astrophys, ,Jour., v 36, p 75-84
Wright, W H., 1929, The Moon a s photographed by light of" different colors: Astron Soc Pacific P u b , v 41, p 125-132.
Young, R A , 1975, Marc crater size frequency distributions: Impli- cat.ions for relative surfaces ages and regolith development, in
Abstracts submitted to t he Sixth Lunar Science Conference: Houston, Tex , Lunar Sci I n s t , p 890 892
Zisk, S 11, Hodges, C A , Moore, H J , Shorthill, k W., Thompson, T W , Whitakor, E A , and Wilhelms, D E., 1977, The Aristarchus-Harhingei region of the Moon: Surface geology and history from recent remote-sensing observations: The Moon, v. 17, p 59 99
Xisk, S 11 , Hodges, (.; A , Whitaker, E A,, Moore, 11 ,J , Shorthill, R. W., Thompson, T W , and Wilhelms, D K , 1975, An exainina- tion of the Aristarchus area by remote sensing measurements, in Abstracts of papers submitted to Sixth Lunar Science Confer- ence: Houston, Tex , Lunar Sci In s t , Pa r t 11, p, 896-897
Zisk, S. 11 , and Moore, H. J , 1972, Calibration of radar data from Apollo 16 result-s, in Apollo 16 preliminary science report: Natl. Aeronautics Space Adniin Spec Pub. SP-315, p. 29- 110 to 29- 113,
Zisk, S H , Pettengill, (; H , and Catura, G. W , 1974, 3.8-cm radar atlas of" the Moon: The Moon, v. 10, p. 17 50.
Zook, H. A , 1975, The state of meteoric material on the Moon: F'roc Sixth Lunar Sci Conf', Gcochim ct Cosmochim Acta, Supp 6, v 2, p 1653-1672