remote sensing for drainage
TRANSCRIPT

8/3/2019 Remote Sensing for Drainage
http://slidepdf.com/reader/full/remote-sensing-for-drainage 1/54
1
Remote Sensing for Water Management:
The Drainage Component
Recommended Actions for Implementation
U S E RS C IE N T IS T
Report Ede-Wageningen Expert Consultation Meeting
May 15 to 16, 2001

8/3/2019 Remote Sensing for Drainage
http://slidepdf.com/reader/full/remote-sensing-for-drainage 2/54
2
The Expert Consultation was organized by representatives of the ICID, IPTRID, ILRI,
WaterWatch and the World Bank.
It was organized as an open discussion between the developers of the Remote Sensing tool
(researchers at universities and laboratories) and potential users (staff of river basin authorities, water
management institutions, irrigation and drainage organizations).

8/3/2019 Remote Sensing for Drainage
http://slidepdf.com/reader/full/remote-sensing-for-drainage 3/54
3
Remote Sensing for Water Management:
The Drainage Component
Report Ede-Wageningen Expert Consultation Meeting
May 15 to 16, 2001
Dr Marinus G. Bos
Senior irrigation adviser with ILRI, Editor-in-Chief of the international journal Irrigation and Drainage Systems (Kluwer), and Chairman of WG-PERF
Dr Safwat Abdel Dayem Drainage Adviser with the WB, and Vice-Chairman of WG-DRAIN
Prof Dr Wim Bastiaanssen Director of WaterWatch, and professor at the ITC on RS and GIS for water management
Dr Alain Vidal Senior researcher on RS and GIS with CEMAGREF, task manager with IPTRID andChairman of WG-ILWRM

8/3/2019 Remote Sensing for Drainage
http://slidepdf.com/reader/full/remote-sensing-for-drainage 4/54
4
Abstract
An expert consultation was organized on 15 and 16 May 2001 in Ede-Wageningen tosynthesize the state-of-the-art of remote sensing technology for assessing theperformance of existing irrigation and drainage schemes, as well as the need for drainageto combat soil salinity in irrigated lands. The attainable accuracy with which parameterscan be measured was agreed upon. Drainage related parameters can be estimated withan average accuracy of 78% at a confidence level of 95%. Water and crop relatedparameters such as land use, irrigated area, water logging and crop evapotranspirationhave an accuracy between 80 to 85%. There is more research required on soil-relatedparameters: in particular to determine soil moisture and soil salinity. Efforts should bemade to develop algorithms that are more robust, and to design user-friendly tools. Theseare needed to help water managers in their decision making of water allocation and toincrease the productivity of water. Considering that the accuracies of drainage relatedparameters are acceptable, and the costs being affordable, the workshop concluded thatthe core activity in remote sensing sciences during the next decade should focus onmaking products. The remote sensing has failed to develop user driven products, because
the remote sensing scientist, instead of the theme specialists themselves, often ledprojects. A product-oriented approach is needed that produces easily accessibleinformation to clients. This requires a long-term business strategy. The expert consultationrecommends a capacity building program including e-commerce, training courses andsoftware development. Capacity building programs should be imbedded in newdemonstration and implementation projects. Project ideas have been inventoried andformulated.

8/3/2019 Remote Sensing for Drainage
http://slidepdf.com/reader/full/remote-sensing-for-drainage 5/54
5
Frequently used abbreviations
ADB Asian Development BankASTER Advanced Space-borne Thermal Emission and Reflection Radiometer
AVHRR Advanced Very High Resolution RadiometerCBERS China-Brazil Earth Resources SatelliteCEMAGREF Institut de Recherche pour l'Ingénierie de l'Agriculture et de
l'EnvironnementEARSEL European Association of Remote SensingEOS Earth Observing SystemFAO Food and Agriculture OrganizationGIS Geographic Information SystemICID International Commission on Irrigation and DrainageIEC International Executive Council Meeting of the ICIDIGARSS InternationalILRI International Institute for Land reclamation and ImprovementIPTRID International Program on Technological research in Irrigation and
DrainageIRS Indian Remote Sensing SatelliteISPRS International Society of Photogrammetry and Remote SensingITC International Institute for Aerospace Survey and Earth ScienceIWMI International Water Management InstituteKluwer Kluwer Academic PublishersMODIS Moderate Resolution Imaging SpectrometerNOAA National Oceanic and Atmospheric AdministrationNGO Non-Governmental OrganizationPAN PanchromaticSPC SpectralRS Remote Sensing (by use of satellite images)
TIR Thermal InfraRedTM Thematic MapperWB World BankWG-DRAIN ICID Working Group on DrainageWG-ILWRM ICID Working Group on Integrated Land and Water Resource
ManagementWG-PERF ICID Working Group on Performance Assessment of Irrigation and
Drainage
8/3/2019 Remote Sensing for Drainage
http://slidepdf.com/reader/full/remote-sensing-for-drainage 6/54
6
Table of contents
1 Background............................................................................................................ 7 2 Rationale................................................................................................................ 8 3 State-of-the-art ....................................................................................................... 9
3.1 Satellite systems ............................................................................................. 9 3.2 The drainage parameters .............................................................................. 11 3.2 Attainable accuracies .................................................................................... 14 3.3 What did we do wrong?................................................................................ 17 3.4 Costs............................................................................................................. 18 3.5 The opportunities........................................................................................... 20 3.6 Alternative solutions........................................................................................... 23
4 Capacity building .................................................................................................. 23 4.1 Exchange of know-how................................................................................. 23 4.2 Institutional development............................................................................... 24 4.3 Software........................................................................................................ 25
5 Conclusions and recommendations...................................................................... 25 6 References........................................................................................................... 26 Appendix 1: List of participants.................................................................................... 28 Appendix 2: Programme of the Consultation................................................................ 30 Appendix 3: Format for projects................................................................................... 32 A3.1 Argentina....................................................................................................... 33 A3.2 China............................................................................................................. 36 A3.4 France........................................................................................................... 38 A3.6 Iran................................................................................................................ 40 A3.7 Malaysia........................................................................................................ 43 A3.9 Turkey ........................................................................................................... 46 Appendix 4: Examples of remote sensing projects related to irrigation and drainagesystems conducted in the past..................................................................................... 50 Appendix 5: Conclusions of scientific presentations..................................................... 52

8/3/2019 Remote Sensing for Drainage
http://slidepdf.com/reader/full/remote-sensing-for-drainage 7/54
7
1 Background
The World Vision of Water for Food and Rural Development (Hofwegen and Svendsen,2000) showed that by 2025 the world population would increase by 2 billion inhabitants toa total of approximately 8 billion people. The water requirement critical to livelihoodincluding food production is 1700 m3 /capita. This water is not available for everybody;
nearly one-third of the world’s population will live in regions that will experience severewater scarcity (Figure 1).
0 - 1700
10%
1700 - 3000
49%
3000 - 5000
13%
5000 - 10000
8%
More than 10000
19%
No data
1%
Figure 1; Distribution of world population among economies grouped by annual freshwater resources in cubic meters per capita (World Bank 1999).
In order to meet future demands for food, the world food production should have anannual growth rate of about 3%. Presently, the total harvested area is about 1600 millionha. This harvested area could be expanded while harvesting the same area more thanonce per year is feasible at certain places. Recent FAO assessments put the world’s areaof potentially suitable cropland at some 3200 million ha (FAO, 1996).
Agriculture in areas with artificial water management (irrigation and drainage) contribute toabout 50% of present food and fiber production (Table 1). To improve the productivity (interms of crop yield per m3 water consumed) water resources need to be more alertlymanaged. New tools have to be developed to facilitate integrated water resourcesmanagement. Managers have to be able to assess to which extend targets are met andevaluate their strategy. This management process requires an advanced quantitative
approach and a well-thought data acquisition system.
Table 1; Overview of word food and fiber production (FAO 1996; Smedema et al 2000)
Harvested area (million ha)Percentagecontribution toproduction
Rain-fed only 1350 50 %Rain-fed plus drainage 100 10 %Irrigation plus drainage 250 250 40 %Total: 1600 350 100 %

8/3/2019 Remote Sensing for Drainage
http://slidepdf.com/reader/full/remote-sensing-for-drainage 8/54
8
As shown in Table 1, agriculture with artificial water management accounts for about 50%of the world food production although it covers with 350 million ha only 22 % of thecropped lands. This implies that the irrigation and drainage sector has chances tosignificantly increase the world’s food production. Irrigation and drainage schemes are,however, in many cases performing at an unsatisfactory level. Irrigation and drainageperformance indicators are useful tools to keep monitor and assess water use andchanging groundwater tables (Bos, 1997). The framework of performance assessment isnowadays recognized as an opportunity to determine the necessary strategy andimplement appropriate actions to get more productivity from water as a scarce commodity.
The level of detail information and data required to manage water resources properly,depends on the user of the data. Whereas researchers like a maximum of detailedhydrological and agronomical data, managers need only performance indicators toevaluate whether they meet their targets. Politicians are used to cope with simplified datasets on essential aspects.
Relative to irrigation, little is known on the need and impact of drainage on crop production
and on the environment. Drainage research was conducted world-wide at smallexperimental plots. Considerable knowledge was established on design, construction andmaintenance of drainage systems at farm scale. Knowledge on the long-term effect ofagricultural drainage at the hydrological processes at regional scale is, however, limited.Soil salinity, for example, is a major constraint for agricultural production in the arid andsemi arid zones.
Field data collection and measurement on drainage rates, groundwater table fluctuations,salinity, waterlogging and crop growth are time consuming and expensive. Hence, there isa need to develop a low-cost methodology to monitor irrigation and drainage systems ina spatial-distributed manner, complementary to classical point data collection. Remotesensing in conjunction with in situ data measurement can meet this data requirement
(Bastiaanssen and Bos, 1999), and needs to be explored further.
2 Rationale
The use of satellite images to support land and water management is technically possiblesince the end of the seventies. Unfortunately, a breakthrough never occurred. Thesuccess of remote sensing (RS) applications in land and water management is limited,and, for example, far behind the successes of RS applications in weather and climatestudies. Overselling of the technique caused this, among others, and by the low attentionuniversities have given to develop remote sensing algorithms that can be adopted by thecommercial sector.
Because accurate, timely and cost-effective information for the planning and monitoring ofdrainage systems are badly needed, it is recommended to review the possible contributionof advanced space information technologies in irrigated and drained agriculture. Ameeting between representatives of three ICID Working Groups (PerformanceAssessment of Irrigation and Drainage, Integrated Land and Water ResourceManagement, and Drainage) and of IPTRID, ILRI, and the World Bank at Cape Town,October 24. 2000, concluded that time is ripe to boost the use of the remote sensingtechnology to quantify drainage needs, for strategic planning of drainage in an integratedwater resources management manner and for monitoring and evaluation.
A significant remote sensing literature database has been build up during the last 20
years, but the number of case studies lag far behind. There is a need for consensus onthe scientific achievements made to date and to chalk out a strategy with consultants to

8/3/2019 Remote Sensing for Drainage
http://slidepdf.com/reader/full/remote-sensing-for-drainage 9/54
9
explore the possibilities to increase the number of case studies. This requires an opendiscussion between the developers of the tool (researchers at universities andlaboratories), potential users (staff of river basin authorities, water managementinstitutions, irrigation and drainage organizations) and international consultants.
A roundtable consultation is suitable for discussing the state of the art and exchangeworld-wide experience in order to develop an approach and guidelines for the practicaluse of this technology in land drainage. An earlier Expert Consultation Meeting wasconducted by FAO in Montpellier during November 1993 (Vidal et al, 1994). The majorrecommendations of the working group on “drainage and salinity monitoring and control”were:
• Operational methods must be proposed by drainage experts before the end of thecentury. Initiatives should arise from the own discipline as they best know theproblems and know where remote sensing can contribute
• Technology transfer should be pursued with appropriate training of local staff• Satellite images should be available at the time of occurrence of the diagnostic event
• Surface waterlogging (ponding) should be distinct from high water table
Although the Montpellier Meeting covered essentially the same themes, most of therecommendations made are not fulfilled. In order to keep the dialogue going, a new expertmeeting was organized. The participants of the Ede-Wageningen Meeting represented abroad group of academics. Representatives of the scientific community (no. 8),consultancy firms (no. 7), decision maker and water policy makers (no. 4) and donors (no.1) assembled. A list of participants is presented in Appendix 1. The 20 expertsrepresented 14 different countries spread over 4 continents.
This report describes the highlights and the actions of the two-day plenary meeting. Aprogram of the meeting is attached in Appendix 2.
Terms of Reference Ede-Wageningen Meeting
To synthesize the present state-of-the-art of remote sensing technology and project toolsfor developing a reliable and cost-effective methodology for assessing the performance ofexisting irrigation and drainage schemes, as well as the need for drainage to combat soilsalinity in irrigated lands. The effort should lead to international strengthened forces andcollaborative efforts to test and disseminate the methodology in new regional scaledrainage pilot projects, having strong local capacity building components.
3 State-of-the-art
3.1 Satellite systems
Remote sensing in irrigation and drainage related studies can be broadly grouped intothree different categories:
a Monitoring of irrigation and drainage processes across larger areas
b Identification of local crop classes, salinity hazards and crop yield
c Surveying field layout, plot boundaries and legislative aspects
Category (a) requires repetitive image collection, and is therefore often based on lower
resolution images (250 to 1100 m) with a potential repeat cycle of one day. Category (b) isbased on multi-spectral images designed for earth resources monitoring (15 to 30 m).

8/3/2019 Remote Sensing for Drainage
http://slidepdf.com/reader/full/remote-sensing-for-drainage 10/54
10
Category (c) needs the involvement of very high-resolution images (1 to 6 m) suitable todetect small objects on the earth surface. A few images per year are sufficient to applycategories (b) and (c).
The sensor onboard of the satellite is a radiometer that measures electromagneticradiation in small and finite parts of the spectrum. Some radiometers have only a fewbands (IKONOS has 4 narrow spectral bands and 1 wide band) whereas others havemany more bands that enable them to measure in a broader part of the spectrum (e.g.MODIS has 36 narrow spectral bands). The visible bands are found in the range between0.4 and 0.7 µm. The blue band has the lowest wavelength (0.43 to 0.48 µm), followed bythe green (0.51 to 0.56 µm) and red band (0.62 to 0.76 µm). The near-infrared bandsmeasure in the 0.7 to 1.5 µm, and the thermal-infrared in the region between 8 to 15 µm.The thermal-infrared region between 0.3 to 3.0 µm is not related to reflected solarradiation, but to natural emission of radiation. Some information on basic characteristics oftoday's satellite systems is provided in Table 2. More background information on technicalspecifications is found on the world wide web of the various providers of the satellite data.
The images of category (c) are more costly per unit land than for categories "a" and "b".Most category "a" images are free of charge available. Due to national politics on datafreeware in the USA, a world-wide tendency has emerged to sharply reduce the costs ofsatellite images falling into category "b". ASTER images – which represent the state of theart – can be ordered through the world wide web without charges. Most countries have anational point of contact from where these images can be obtained. To shorten thedelivery time of fresh images, space agencies are creating more electronic data archivesfrom where data can be directly selected, viewed and ordered. In several cases, it isfeasible to download the data, which considerably reduces the time delay betweenmoment of acquisition and moment of processing and interpretation. The link betweensensors and potential applications on the basis of the presentations by the experts(Appendix 5) and a literature search done earlier by Bastiaanssen (1998) and Vidal (2000)
is further worked out in Table 3. Also Appendix 4 with a selection of remote sensingresearch studies conducted in the past has been used for the preparation of Table 3.
Table 2: Major characteristics of operational earth resources satellites potentially suitable for irrigation and drainage studies
Platform Sensor Spatial resolution Temporalresolution
Imagedimensions
Price
(m) (days) (km) (US$/km2)IKONOS-1 - 1 (pan), 4 (spc) 3 15 39SPIN-2 - 2, 10 (pan) on request 40 30
SPOT-4 XS 10 (pan), 20 (spc), 26 60 1.14IRS-1D WIFS 1100 m (spc.) 5 806 0.001IRS-1D LISS 6 (pan), 23.5 (spc) 24 141 km 0.25Terra ASTER 15 (spc), 30 (spc),
90 (tir)4 to 16 60 Free
Landsat-7 ETM 15 (pan), 30 (spc),60 (tir)
16 185 0.018
CBERS-2 - 80, 160 26 120 0.007Terra MODIS 250, 500, 1000 (spc) 1 2330 FreeNOAA AVHRR 1100 (spc) 0.5 2800 Free

8/3/2019 Remote Sensing for Drainage
http://slidepdf.com/reader/full/remote-sensing-for-drainage 11/54
11
Table 3: Sensors or satellites that produce images suitable for irrigation and drainagemanagement
Application Satellite and sensor Category
• plot boundaries
• irrigation/drainage canals• cartographic information• micro-scale salinity features• micro-scale waterlogging
IKONOS, SPIN, IRS (pan), SPOT (pan) a
• land use• irrigated area• crop identification• soil salinity• water logging• Leaf Area Index• potential evapotranspiration
Landsat, SPOT, IRS, ASTER, CBERS b
• crop growth• crop yield• crop evapotranspiration• root zone soil moisture
Landsat, ASTER, CBERS b
• floods• surface soil moisture• surface roughness
Radarsat b
• crop growth• crop yield• crop evapotranspiration• root zone soil moisture• floods• potential evapotranspiration
NOAA-AVHRR, TERRA-MODIS c
• precipitation•
TRMM, METEOSAT c
3.2 The drainage parameters
The scientists participating to the expert consultation were invited to present the mainoutcomes of their own research work. Table 4 provides an overview of the participantswho gave a presentation on mapping of irrigation and drainage performance. There werealso other presentations dealing with product-oriented approaches (Alain Vidal and Albertvan Dijk), however, these introductions focused on strategies to be followed, rather thanon salient findings from research projects. It goes beyond the objective of this report tosummarize all research activities and their outcomes. Instead, Appendix 5 provides aselection of remote sensing projects executed in irrigation and drainage systems invarious countries. Appendix 6 reveals the conclusion sections of the individual lecturesgiven during the expert consultation. Section 3.2 only summarizes the headlines anddraws some generic conclusions on where we stand in the overall progress achievedduring the last 10 years.

8/3/2019 Remote Sensing for Drainage
http://slidepdf.com/reader/full/remote-sensing-for-drainage 12/54
12
Table 4: Results from research studies presented during the round table conference
Country Category Research Speaker
Pakistan b Soil salinity assessment Dunia TabetPakistan b Salinity as a hazard Daniel ZimmerChina a,b Agricultural water management Li JirenPakistan b,c Drainage systems in relation to salinity Bernard VincentPakistan a,b Drainage and deep percolation Mobin ud-Din AhmadBrazil a,b Irrigation performance and drainage
effluentRicardo Brito
Argentina c Land and water information systems Javier ZuletaUSA b Leaf Area Index and soil moisture Jiaguo QiMexico b Soil salinity mapping Leonardo Pulido
Land use and topographical information
High-resolution images are required to describe land use and to detect changes in croptypes and irrigated area. Crop classes have to be known for individual plots (ground truth)to verify the legitimacy of crop cultivation and verifying the right to irrigate. Water rightscan be more than a century old. IKONOS and SPIN images with 1 to 4 m resolution canbe used to solve legal conflicts on land ownerships.
Waterlogging and salinity tend to occur in the vicinity of earthen irrigation (conveyance)canals. Panchromatic images from Landsat (15 m), SPOT (10 m) and IRS (6 m) can beused to detect canals and survey the effect of water leakage on the surrounding area.
Crop acreage is primary information needed for water allocation and irrigation scheduling.Over-irrigation (more water supply than consumed by the crop) leads to increaseddrainage flows. This may develop into a waterlogging (and salinity) problem. Accurateinformation on the irrigated area can save scarce irrigation water. SPOT, IRS and Landsatmulti-spectral data can be used for classifying cropped fields and the type of crop. Theoverall accuracy is about 85 %. However, large differences in the classificationperformance of individual crops occur (Bastiaanssen 1998). The spectral information fromirrigated fruit trees cannot be discriminated very well. The spacing between fruit trees andthe herbaceous layer between the trees affects the total spectral behavior. Perennial fruittrees also have different ages and sizes, which makes them difficult to differentiate.
Soil salinity
Statistics about the extent of salt affected soils, and the evolution of salinity with time, are
scarce and often unreliable. Soil salinization is far from being a uniform process. Salinitycan develop both; naturally and from interventions in the water cycle through irrigation.Salt only moves through the movement of soil moisture. Thus, the time-depth behavior ofsalt is highly dynamic. Longer time series of measurements are required to describesalinity as a hazard to crop production. Although most remote sensing studies on salinitywere conducted with SPOT and Landsat, there is a new trend to use the very high-resolution satellites to describe local salinization processes better.
The French participants to the Expert Consultation proposed to conceive salinity more asa hazard than as an environmental variable. From the viewpoint of costs, the constraint ofa satellite image is that only a few snapshots can be taken for the description of thesalinity. The inherent problem is to relate a one-time satellite snapshot with a dynamic
hazard.
8/3/2019 Remote Sensing for Drainage
http://slidepdf.com/reader/full/remote-sensing-for-drainage 13/54
13
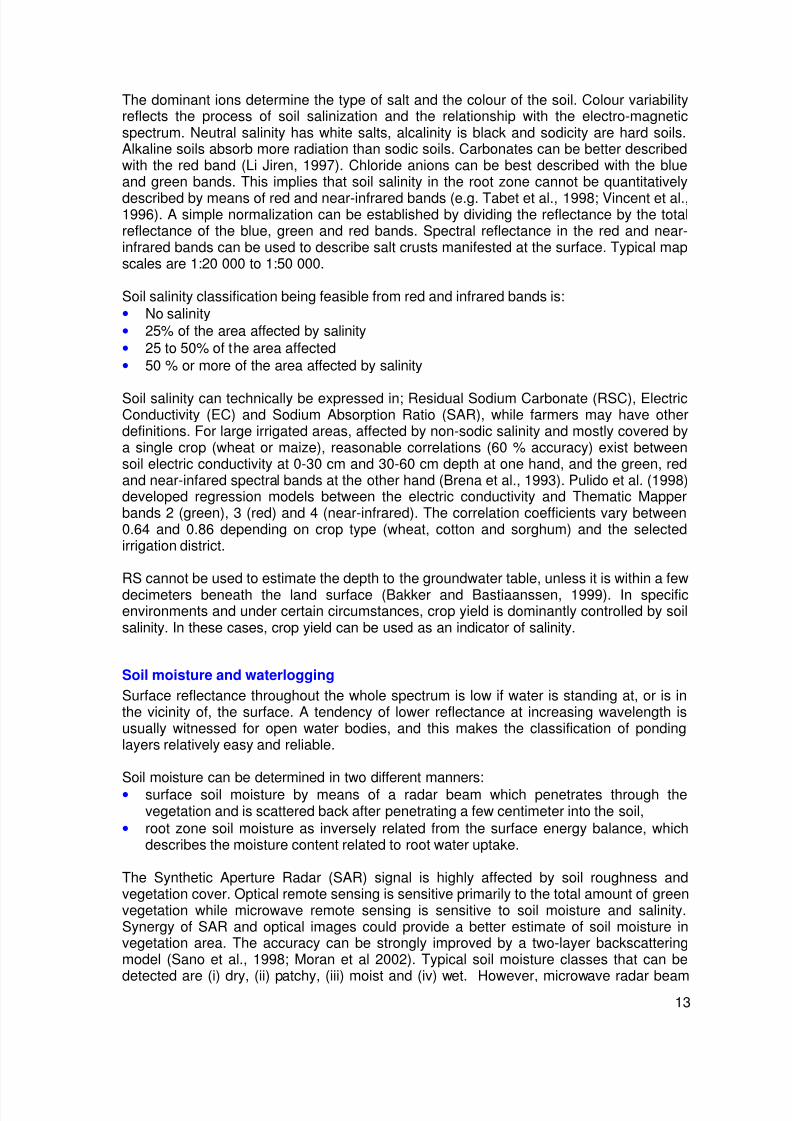
The dominant ions determine the type of salt and the colour of the soil. Colour variabilityreflects the process of soil salinization and the relationship with the electro-magneticspectrum. Neutral salinity has white salts, alcalinity is black and sodicity are hard soils.Alkaline soils absorb more radiation than sodic soils. Carbonates can be better describedwith the red band (Li Jiren, 1997). Chloride anions can be best described with the blueand green bands. This implies that soil salinity in the root zone cannot be quantitativelydescribed by means of red and near-infrared bands (e.g. Tabet et al., 1998; Vincent et al.,1996). A simple normalization can be established by dividing the reflectance by the totalreflectance of the blue, green and red bands. Spectral reflectance in the red and near-infrared bands can be used to describe salt crusts manifested at the surface. Typical mapscales are 1:20 000 to 1:50 000.
Soil salinity classification being feasible from red and infrared bands is:• No salinity• 25% of the area affected by salinity• 25 to 50% of the area affected• 50 % or more of the area affected by salinity
Soil salinity can technically be expressed in; Residual Sodium Carbonate (RSC), ElectricConductivity (EC) and Sodium Absorption Ratio (SAR), while farmers may have otherdefinitions. For large irrigated areas, affected by non-sodic salinity and mostly covered bya single crop (wheat or maize), reasonable correlations (60 % accuracy) exist betweensoil electric conductivity at 0-30 cm and 30-60 cm depth at one hand, and the green, redand near-infared spectral bands at the other hand (Brena et al., 1993). Pulido et al. (1998)developed regression models between the electric conductivity and Thematic Mapperbands 2 (green), 3 (red) and 4 (near-infrared). The correlation coefficients vary between0.64 and 0.86 depending on crop type (wheat, cotton and sorghum) and the selectedirrigation district.
RS cannot be used to estimate the depth to the groundwater table, unless it is within a fewdecimeters beneath the land surface (Bakker and Bastiaanssen, 1999). In specificenvironments and under certain circumstances, crop yield is dominantly controlled by soilsalinity. In these cases, crop yield can be used as an indicator of salinity.
Soil moisture and waterlogging
Surface reflectance throughout the whole spectrum is low if water is standing at, or is inthe vicinity of, the surface. A tendency of lower reflectance at increasing wavelength isusually witnessed for open water bodies, and this makes the classification of pondinglayers relatively easy and reliable.
Soil moisture can be determined in two different manners:• surface soil moisture by means of a radar beam which penetrates through the
vegetation and is scattered back after penetrating a few centimeter into the soil,• root zone soil moisture as inversely related from the surface energy balance, which
describes the moisture content related to root water uptake.
The Synthetic Aperture Radar (SAR) signal is highly affected by soil roughness andvegetation cover. Optical remote sensing is sensitive primarily to the total amount of greenvegetation while microwave remote sensing is sensitive to soil moisture and salinity.Synergy of SAR and optical images could provide a better estimate of soil moisture invegetation area. The accuracy can be strongly improved by a two-layer backscattering
model (Sano et al., 1998; Moran et al 2002). Typical soil moisture classes that can bedetected are (i) dry, (ii) patchy, (iii) moist and (iv) wet. However, microwave radar beam

8/3/2019 Remote Sensing for Drainage
http://slidepdf.com/reader/full/remote-sensing-for-drainage 14/54
14
data is not operationally available with a high spatial resolution on satellites, and yet is notsuitable for implementation in drainage studies. Future sensor will make it feasible though.
Despite that root zone soil moisture is an empirical function of the evaporative fraction ofthe surface energy balance, it has shown to give reasonable good agreement with fielddata collected in different climates and soil types (USA, Spain, Pakistan, Niger). Soilmoisture classes with 5 volume percent of moisture interval can be accurately classified.The relationship ought to be soil type dependent, and a correction term of porosity isincluded. Similarly, logarithmic relationships between Crop Water Stress Index (Jacksonet al., 1977) and soil moisture have been developed and are applied in China (Yu andTian, 1997; Kondo et al., 1998).
Water balance terms
Actual evapotranspiration can be estimated with an acceptable accuracy in an operationalmanner using, for example, the Surface Energy Balance Algorithm for Land (SEBAL).When combining actual evapotranspiration with soil moisture changes in the root zone,
rain gauge data and canal water delivery data, the opportunity arises to compute thedrainage flow as a residual of the water balance (Bastiaanssen et al., 2001). Thisdrainage component includes also a percolation component, but it is ultimately all waterthat needs to be drained from a given area to prevent excess water storage. Thecomputation of drainage volumes is very important for the design of surface drains andsub-surface drainage systems. If this surplus water from the water budget is notevacuated through, for example, a sub-surface drainage system, rising groundwatertables and ultimately water logged conditions may arise.
Crop growth
Different approaches to compute crop growth have been developed. Simple empiricalrelationships with spectral vegetation indices or the Leaf Area Index perform well.However, these relationships need to be calibrated with extensive ground data sets forevery season again and again (Wiegand et al., 1994). Physically based models on thebasis of photosythetical active radiation and soil moisture availability for the conversion ofradiation to dry matter production are nowadays developed and tested. Crop yields of fruitcrops (mango, banana, grapes), grains (wheat, rice) and trade crops (tea, cotton) can bepredicted with 85% accuracy.
A general problem in applying remote sensing for crop growth and evapotranspiration isthat a continuous set of high-resolution satellite images is required. The higher resolutionof the scale of Landsat (30 m) is necessary to discriminate crops. The availability of
Landsat images is an uncertain factor due to a revisit frequency of 16 days and thechance on cloud contamination on the images. Low-resolution images (1100 m) are easierto create time series, because they have daily overpasses. The limitation of MODIS andNOAA is that they cannot detect individual fields. Fusion techniques for merging low andhigh-resolution images need to be developed.
3.2 Attainable accuracies
One of the explanations that remote sensing is not commonly used in water resourcesmanagement is that there is disagreement on the attainable of collected data. Fifteenparticipants of the Expert Consultation who are scientifically involved in experimentalremote sensing have given their view on the accuracy of retrieving drainage related
parameters from remote sensing data (Table 5).

8/3/2019 Remote Sensing for Drainage
http://slidepdf.com/reader/full/remote-sensing-for-drainage 15/54
15
Table 5: Accuracy of remote sensing parameters in drainage estimated by the Ede- Wageningen Expert Consultation at a 95% confidence interval. The range of accuracy indicated by individual scientists is added
Thematic parameter Accuracy Standarddeviation
accuracyassessment
Coefficient ofvariation
accuracyassessment(%) (%) (%)
Topographical characteristics 81 16 20Land use 84 8 10Land wetness (drought index) 78 8 10Soil moisture (surface) 70 11 16Soil moisture (root zone) 64 25 39Waterlogging 87 7 8Drainage from area 78 3 4Salinity occurrence on surface 77 19 25Soil salinity 63 18 28
Irrigated area 85 8 10Crop identification 78 12 16Reference ET 81 12 14Potential ET (crop coefficient) 79 8 10Actual ET 83 9 10LAI 80 9 11Biomass growth 79 12 15Crop yield 72 19 19Water rights 93 3 3Soil erosion 68 38 38
AVERAGE 78
The accuracies are related to a single event, i.e. the day of image acquisition, and to fieldmeasurements that are usually conducted at the plot scale. The errors have usually anormal distribution, and at averaging over time or across the space domain, the error for alonger period or a larger area cancels out. The accuracy at a 95% confidence interval fora single event is presented. Although there is a no unified opinion among the experts(because the accuracy of the remote sensing product depends also on the algorithmchosen), the average assessment is a first order approximation on how experts generallyexperience the progress of the technique (Table 5). The range of accuracy assessmentsamong the experts varied significantly, and the coefficient of variation in the accuracy
assessment is added to the table.
The outcome of Table 5 is that drainage related parameters can be estimated with anaverage accuracy of 78%. The range of individual thematic parameters lies between 63 to92 % and this is a wide variability. The practical meaning is that certain parameters can beassessed with significantly more accuracy than other parameters. The ranking ofaccuracies for the thematic parameter discussed at the meeting is provided in Figure 2.Drainage engineers should assess whether that is good enough and acceptable for them.Considering the lack of data available to make strategic planning and to monitor theadequacy of drainage systems, the meeting felt overall that an accuracy of 78% or more isgood enough for implementation of the remote sensing technology. This is partially basedon the fact that several of the bio-and soil physical parameters elaborated in Table 5 can
only be measured at experimental farms being equipped with special instruments.

8/3/2019 Remote Sensing for Drainage
http://slidepdf.com/reader/full/remote-sensing-for-drainage 16/54
16
Irrigation and drainage engineers have hardly access to these parameters at the regionalscale, so any reasonable estimate is a big gain.
0
10
20
30
40
50
60
70
80
90
100
S o i l s a l i n i t y
S
o i l m o i s t u r e ( r o o t z o n e )
S o i l e r o s i o n
S o i l m o i s t u r e ( s u r f a c e )
C r o p y i e l d
S a l i n i t
y o c c u r r e n c e o n s u r f a c e
C r o p i d e n t i f i c a t i o n
L a n d w
e t n e s s ( d r o u g h t i n d e x )
D r a i n a g e f r o m
a r e a
B i o m a s s g r o w t h
P o t e n
t i a l E T ( c r o p c o e f f i c i e n t )
L A I
R e f e r e n c e E T
T o p o
g r a p h i c a l c h a r a c t e r i s t i c s
A c t u a l E T
L a n d u s e
I r r i g a t e d a r e a
W a t e r l o g g i n g
W a t e r r i g h t s
A c c u r a c y a t 9 5 %
c o n f i d e n c e i n t e r v a l (
% )
Figure 2: Accuracy of remotely sensed irrigation and drainage related parameters inascending order
Land use related information (water rights, waterlogging, irrigated area) can according tothe group of experts with a good accuracy (≥85 %) be classified. Land use,evapotranspiration (actual and reference) and LAI are regarded as being feasible (≥80 %).Parameters with the lowest accuracy are all soil related parameters and physical variables
(salinity, moisture, erosion). These need more attention in the research laboratories,although they may be applied in areas with data scarcity. The same conclusion on lowaccuracy associated to soil salinity mapping was drawn earlier by Bos (2001), whoestimated the approximate accuracy as 40%.
The agreement among the remote sensing scientists is not equal for all parameters. Theirviews are wrapped-up in Figure 3. Generally speaking, an inverse relationship betweenFigsure 2 and 3 exist; there is little variability in the expert judgements on the parameterswhich can be mapped with a good accuracy. Disputes and disagreements were foundamong the experts when the parameters soil salinity, soil erosion and soil moisture in theroot zone were evaluated.

8/3/2019 Remote Sensing for Drainage
http://slidepdf.com/reader/full/remote-sensing-for-drainage 17/54
17
Based on the above :• It is recommended that research institutes and universities should give more attention
to the mapping of soil related parameters such as salinity, moisture and erosion.Water and crop related parameter are judged to have more confidence, and could beused in drainage studies. Salinity mapping is evaluated with an accuracy of 63%,which implies it is only feasible in areas where field data is not available or lessaccurate.
0.0
5.0
10.0
15.0
20.0
25.0
30.0
35.0
40.0
45.0
W a t e r r i g h t s
D r a i n a g e f r o m
a r e a
W a t e r l o g g i n g
I r r i g a t e d a r e a
L a n d w e t n e s s ( d r o u g h t i n d e x )
L a n d u s e
P o t e n t i a l E T ( c r o p c o e f f i c i e n t )
A c t u a l E T
L A I
R e f e r e n c e E T
B i o m a s s g r o w t h
C r o p i d e n t i f i c a t i o n
S o i l m o
i s t u r e ( s u r f a c e )
C r o p y i e l d
T o p o g r a p h i c a
l c h a r a c t e r i s t i c s
S a l i n i t y o c c u r r
e n c e o n s u r f a c e
S o i l s a l i n i t y
S o i l e r o s i o n
S o i l m o i s t u r e ( r o o t z o n e )
C o e f f i c i e n t o f
v a r i a t i o n ( % )
Figure 3: Degree of agreement among remote sensing scientists on attainable accuracy ofremotely sensed irrigation and drainage parameters
3.3 What did we do wrong?
Despite the fact that the accuracy of the land and water parameters are reasonable togood (average 78 % accuracy), the technique has failed to become a common ingredientof information technology for water management. The Expert Consultation has discussedplausible factors underlying this development, and recognizes the following issues:
• Remote sensing has emerged more as research tool than a user driven product. Manyremote sensing applications in the past were led by the remote sensing specialists,instead of the theme specialists themselves. Since the research was not meant forusers, the research tool has never made attractive and user friendly
• A product-oriented approach is necessary to satisfy clients. Clients are not interestedin studying images, but more in the information and the confidence they can retrievefrom it. Clients are also critical as they have been let down in the past
• The remote sensing product should be easily accessible, e.g. on-line available. At thismoment, there are not many systems that supports a customer in finding reports of

8/3/2019 Remote Sensing for Drainage
http://slidepdf.com/reader/full/remote-sensing-for-drainage 18/54
18
remote sensing studies and desks with databases filled with raw and interpretedsatellite data
• Potential customers don’t know about the progress and need to be informed about thepossibilities This category of persons don’t read scientific remote sensing literature.This implies that publications should appear in water-related magazines.
• The accuracy is often hidden and not attached to the remote sensing data delivery.This makes customers doubting whether they can use the data.
• The results of research projects have too often site or crop specific. The technicalsolutions are then undermined by lack of practicality, as they cannot be transferred toother case studies. A move from empirical to physically-based solutions is necessary
• There is no financial investment from the commercial sector. Consultants mainlyoperate by small, subsidized projects. Investments need to be made to create aproduct, and convince customers. The commercial sector has failed to do so. A long-term “business” type of marketing strategy is required.
• Most academic remote sensing researchers are evaluated on their personal researchpublication lists, and not on their efforts to implement the technology
• Apart from a few exceptions, drainage experts, remote sensing scientists and
consultants have no common dialogue. Apparently, drainage (and water management)experts are not impressed by the work of remote sensing experts. Drainage expertsshould define their demands better.
• The technique was very expensive to apply. The price for computers, however, hascollapsed and their computational speed is rapidly increasing. Also the prices forimages have started to go down, and several space agencies have announced toprovide the data virtually free. This makes the technology cost effective to implement(see Section 3.4). The costs of land reclamation (drainage), is very high with respectto the monitoring technique that can prevent waterlogging. Hence, spending resourcesin monitoring is attractive.
• The capacity building in remote sensing and GIS is a weak. At the remote sensing-irrigation-drainage interface, there are very limited possibilities to receive training.
3.4 Costs
Irrigation and drainage managers and policy makers are expected to use advancedinformation technologies only if they get better results at equal or lower costs. The valueof remote sensing data relies therefore on the balance between costs and benefits(accuracy). The costs of remote sensing cannot be generalized. Different applicationsexist, the remote sensing parameters have different scales (both in spatial and temporaldetail) and the price of satellite images diverge between 39 US$/km2 to virtual free (onlysome shipping costs are charged for TERRA data). The salary cost in the country wherethe images are processed varies between a few to hundreds of US dollars per day.
Particularly these salaries (and commercial rates per man-day) determine the final costs.Experts may have higher rates than technicians, but their experience can beneficiallyaffect the quality of the product and reduce the time lag between image delivery andproduct delivery.
It also matters, whether a water resources department is investing in an own GIS/RS unitor contracts an external consultant for such activity. In the first case, a heavy initialinvestment in hardware and software plus education is required. It takes some years toget benefits. Hiring consultants avoids the need to recruit experts and you can hire themonly for limited tasks. All these aspects of wages and laboratory investment affects thefinal costs of the products, and products cannot be easily compared. Despite of this, it isappropriate to indicate the non-remote sensing community of the range of costs. Table 6
was made to give guidance on costs.

8/3/2019 Remote Sensing for Drainage
http://slidepdf.com/reader/full/remote-sensing-for-drainage 19/54
19
Furthermore, several applications are increasingly cost-effective per unit area if a largerarea is covered. Figure 4 demonstrates the price for an annual irrigation performancemonitoring with a monthly time interval. If the images are processed in a country like TheNetherlands, the price per hectare is approximately US$ 0.80/ha (1 Euro) for an irrigationscheme of 10,000 ha, but the price drops down to US$ 0.08/ha for an area of 500,000 ha.This suggests that remote sensing techniques are economically attractive for larger areas.
Table 6: Total costs related to image processing and interpretation for drainage related parameters. Image procurement, labour and overhead is included
Parameter Country of imageprocessing
Number of images used CostsUS$/ha
Soil salinity Mexico 2 Landsat images 0.8China 4 CBERS images 0.003France 3 SPOT images 2.5India 1 IRS image 0.0002
Soil moisture China 50 NOAA images 0.003France 1 Landsat image 2.0The Netherlands 1 Landsat image 0.007
Land use Argentina 1 IKONOS image 0.31France 2 SPOT images 1.0Sri Lanka 3 Landsat images 0.005
Actual ET and crop yield The Netherlands 12 NOAA images 1.0France 12 NOAA images 0.5Sri Lanka 80 NOAA images 0.005India 24 NOAA images 0.012
Obviously, the costs for all stages of image analysis in China are very low. This is relatedto the fact that (i) China has own image receiving facilities which can be used to studyvast areas, (ii) China has its own earth resources satellite (CBERS), (iii) software isinexpensive and (iv) wages are relatively low. According to the estimations, the cheapestapplication in China is land wetness monitoring throughout the year (US$ 0.003/ha) andcrop yield mapping is with US$ 0.22/ha the most expensive application. The sameremarks made for China apply to Sri Lanka and India.

8/3/2019 Remote Sensing for Drainage
http://slidepdf.com/reader/full/remote-sensing-for-drainage 20/54
20
0.000
0.200
0.400
0.600
0.800
1.000
1.200
10000 1000000
Covered area in ha
Figure 4: Commercial prize to monitor the annual cycle of irrigation and drainage performance with monthly intervals.
3.5 The opportunities
Considering that crop and land use classifications together with water balance parameterssuch as evapotranspiration and drainage rates can be obtained with the desired
confidence, it is a logical consequence to conclude that demonstration andimplementation projects have to be initiated. Such projects can be continuations of themore research style of projects presented in Appendix 4. A demonstration type of projectshould have substantial subsidy to let potential users build up experience. There shouldbe minimal room for research. Financial damage to the client - if he/she is unsatisfied – should be excluded as far as possible. An implementation project is usually a continuationof a demonstration project where the end-users cover the majority of the costs. TheExpert Consultation advises to start tandem projects – both the demonstration andimplementation phase in one project – on the following topics:
Field scale surveying of changes in land use and water use
This section discusses the survey of changes in irrigation and drainage systems only. It
includes database development of areas having water rights, surveying areas underirrigation, mapping of sub-surface drainage systems, crop types and waterlogging at thesurface. The satellite monitoring takes place at field scale and will be done ones or twice ayear. It is not expected that soil salinity can be seen, but if the soil has been degraded,salts may manifest at the land surface towards the end of a canal closure period. Thechanges in waterlogging, surface salinity, land use and crop acreages are suitableindicators of sustainability. The hypothesis behind this concept is that with increasingirrigation and/or drainage problems, farmers will abandon the field or change the crop to amore salt tolerant type (for instance wheat to oilseed).
Sub-regional scale monitoring of irrigation and drainage processes
Water Resources Departments or Irrigation Departments usually do not bear responsibilityfor field scale (on farm) processes. Their main interest is on monitoring aggregated water

8/3/2019 Remote Sensing for Drainage
http://slidepdf.com/reader/full/remote-sensing-for-drainage 21/54
21
use at the sub-regional level such as for groups of surface drains, polders, conveyancecanals etc. Monthly parameters such as soil moisture, drainage rate and crop growthshould be deduced from low-resolution images. That together with ancillary ground truthwill whether the management target is met.
The demonstration- and implementation projects should be executed with well-definedpartnership, and all stakeholders should be involved (Figure 5). The client should be atypical Irrigation and Drainage Department (in some countries this is a task of the WaterResources Department). The consultant should use his expertise on remote sensing andirrigation or drainage projects to develop (together with the client) a tool that satisfies theclients’ demands. The client needs to be involved in an early stage and should define thedata product together with the consultant. The type of projects foreseen should have acomponent in which algorithms developed at universities and research centers are testedon their robustness. Often, models perform unsatisfactory when they are applied outsidethe environment where they have been developed. This testing is the responsibility ofengineers. The 'engineer' and the 'consultant' should translate the language of theacademic scientist into language that can be understood by the clients. The consultant
should be the driving force behind the cycle of study, execution, control and maintenance.
Figure 5: Suggested tasks and partnerships in new remote sensing oriented demonstration and implementation projects on RS for irrigation and drainage management
Vidal (2001) suggested RS data products along five different categories:• Information and communication products• products enabling longer term (strategic) planning• products enabling medium term planning• products enabling short tem (operational) planning• warning products.
These products have to undergo a certain flow path from information products via thedecision making process and key success factors (knowledge, norms) to strategy. In orderto strengthen the marketing of remote sensing technology and to let Water ResourcesDepartments profit from it by means of a more alert management tool, it was suggested to
compile a list of projects which meet the criteria and purpose outlined in this section. A
Researcher:
Developalgorithm
Consultant:
User friendlytool
Agency:Data
management
Engineers:Enhance
robustness
8/3/2019 Remote Sensing for Drainage
http://slidepdf.com/reader/full/remote-sensing-for-drainage 22/54
22
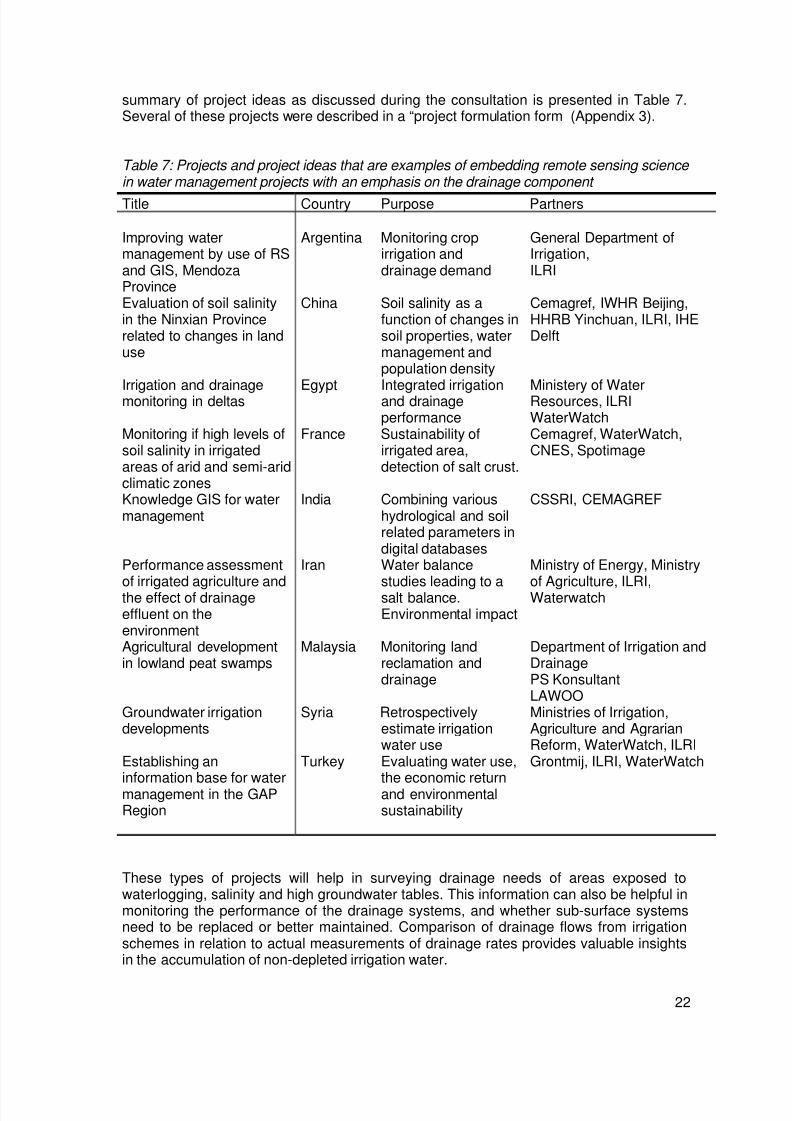
summary of project ideas as discussed during the consultation is presented in Table 7.Several of these projects were described in a “project formulation form (Appendix 3).
Table 7: Projects and project ideas that are examples of embedding remote sensing science in water management projects with an emphasis on the drainage component
Title Country Purpose Partners
Improving watermanagement by use of RSand GIS, MendozaProvince
Argentina Monitoring cropirrigation anddrainage demand
General Department ofIrrigation,ILRI
Evaluation of soil salinityin the Ninxian Provincerelated to changes in landuse
China Soil salinity as afunction of changes insoil properties, watermanagement andpopulation density
Cemagref, IWHR Beijing,HHRB Yinchuan, ILRI, IHEDelft
Irrigation and drainagemonitoring in deltas
Egypt Integrated irrigationand drainageperformance
Ministery of WaterResources, ILRIWaterWatch
Monitoring if high levels ofsoil salinity in irrigatedareas of arid and semi-aridclimatic zones
France Sustainability ofirrigated area,detection of salt crust.
Cemagref, WaterWatch,CNES, Spotimage
Knowledge GIS for watermanagement
India Combining varioushydrological and soilrelated parameters indigital databases
CSSRI, CEMAGREF
Performance assessment
of irrigated agriculture andthe effect of drainageeffluent on theenvironment
Iran Water balance
studies leading to asalt balance.Environmental impact
Ministry of Energy, Ministry
of Agriculture, ILRI,Waterwatch
Agricultural developmentin lowland peat swamps
Malaysia Monitoring landreclamation anddrainage
Department of Irrigation andDrainagePS KonsultantLAWOO
Groundwater irrigationdevelopments
Syria Retrospectivelyestimate irrigationwater use
Ministries of Irrigation,Agriculture and AgrarianReform, WaterWatch, ILRI
Establishing aninformation base for watermanagement in the GAPRegion
Turkey Evaluating water use,the economic returnand environmentalsustainability
Grontmij, ILRI, WaterWatch
These types of projects will help in surveying drainage needs of areas exposed towaterlogging, salinity and high groundwater tables. This information can also be helpful inmonitoring the performance of the drainage systems, and whether sub-surface systemsneed to be replaced or better maintained. Comparison of drainage flows from irrigationschemes in relation to actual measurements of drainage rates provides valuable insights
in the accumulation of non-depleted irrigation water.

8/3/2019 Remote Sensing for Drainage
http://slidepdf.com/reader/full/remote-sensing-for-drainage 23/54
23
Remote sensing can also help in the irrigation sector to aid the water allocation throughcrop water requirements and the spatial variability of the water demand. Differencesbetween demand and consumptive use is crucial for re-allocation of water resources.Groundwater use for irrigation can be detected if crop consumptive use exceeds rainfalland canal water supply. Irrigation managers want a high performance of their systems, i.e.from diversion to the root zone. The entire pathway of water can be tracked when groundand remote sensing measurements are combined.
3.6 Alternative solutions
Alternative solutions to remote sensing mainly consists of laborious field surveys. Mappingof dynamic state variables such as solute concentration and soil moisture – which alsovary with depth – is not straightforward. Basically repetitive measurements are required,which at the scale of an irrigation scheme or a canal command area are impossible tofulfill. Field surveys are always associated with a sampling problem: only a part of the areacan be measured. Soil data needs often to be analyzed in the laboratory.
Other parameters such as actual evapotranspiration and crop growth can only bemeasured at experimental sites equipped with special instruments such as lysimeters orflux towers. In that case, there is practical no alternative to the use of remote sensingdata.
4 Capacity building
4.1 Exchange of know-how
Different type of exchanges are conceivable; the scientists prefer to communicate amongthemselves, that is at least what they have been doing in the last 20 years. Several
journals such as Remote Sensing of Environment and International Journal of RemoteSensing are good vehicles for professional scientists. There are also several internationalworking groups such as ISPRS, EARSEL and IGARSS were research achievements arediscussed. The agenda of the Expert Consultation included a specific item to discusswhether a new type of publication medium is required:
• Recommend on the establishment of an international Journal on the use of RS andGIS for water management for various user groups: river basin management, irrigationand drainage.
It was concluded before that a dialogue between water managers and consultants shouldbe endeavored. The consultation firstly discussed the target audience of the “know-how”that is to be exchanged. It was recommended to focus on the (water) managers of regionsof which large parts are irrigated and/or artificially drained. International watermanagement journals have that task, but most journals don’t have remote sensing in theircurriculum. It was recognized that this audience reads a journal like “Irrigation andDrainage Systems” but not a specialized journal on remote sensing. It therefore wasrecommended to ask Kluwer to expand the possibilities of “Irrigation and DrainageSystems” as follows:
• Include color figures (inc. photo’s and images) in the electronic version of the Journal.• Organize a link between the Journal paper and the database of the author(s) so that
RS images can be accessed by the reader.

8/3/2019 Remote Sensing for Drainage
http://slidepdf.com/reader/full/remote-sensing-for-drainage 24/54
24
• Facilitate the access to databases on RS for water management. Databases shouldbe reviewed by editorial board members before inclusion to avoid “flooding” of readersby useless material.
According to the latest surveys, 29.3 million web-servers were linked to the worldwide web(www) by June 2001. On-line services in the field of remote sensing for irrigation anddrainage are not present. There is a need to facilitate information finding and to provide aplatform for sharing professional knowledge.
Kluwer Academic Publishers (Dordrecht, The Netherlands) is willing to start such a journal(via Internet) on the recommendation of the expert consultation. Follow-up discussionswith Kluwer are ongoing. An alternative way to communicate with water managers is theinsertion of brief project achievements in glossy newsletters such as the GRID magazineof the IPTRID network and outlets of several other international institutes.
4.2 Institutional development
The critical constraint to drainage development in the developing countries is the building-up of the policy and institutional frameworks and the mobilization of public support(Smedema et al., 2000). To a large extent, an analogy can be made to remote sensingtechnologies. Over the last few years, computer technologies have become cheaper, andmany water resources centers are equipped with strong GIS laboratories. Often, theinformation systems set up are not used to their full potential, or became quickly obsoletedue to fast developments on the software market. Training should be given andmaintained to ensure proper utilization of the technical infrastructure. But the trainingshould be tied to the niche of irrigation and drainage. Very often, remote sensing and GIScourse are too broad and cover themes like “natural resources management”.
Training and capacity building develops the institutes’ skills and capabilities. Training in
the field of remote sensing should be facilitated in the country where project are executedand technical GIS and Remote Sensing analysts should be involved. These personsshould be active in maintaining the database and update the tool. In terms of thepersonalities presented in Figure 5, they should belong to the category of engineers andconsultants. The course objective should be the explanation and transfer of remotesensing algorithms to engineers and consultants active in the field of remote sensing andGIS. A minimum background in remote sensing physics is necessary. By absence of thelatter basic knowledge, participants should first attend introduction courses in remotesensing. The duration of a local course should be 10 working days (two weeks).
The clients are senior water managers and policy makers responsible for the planning and
operation of water resources. Their full agenda and there limited interest in thetechnology, requires a short course of a few days only. Such course should be convincingand show them in due time the cost/benefit in respect to confidence limits.
The Expert Consultation recommends launching locally organized short courses forsenior water managers and analysts. Decision makers need to see the cost/benefit ofthe technique and how it can help them reforming irrigation institutions. Technicalassistants and local consultants should be involved in more technical courses that maylast about three weeks or longer to get a full understanding of advanced informationsystems.

8/3/2019 Remote Sensing for Drainage
http://slidepdf.com/reader/full/remote-sensing-for-drainage 25/54
25
To the knowledge of the participants, there are currently no standard courses given on thevery specific issue of remote sensing applications in the field of irrigation and drainage.The International Institute for Aerospace Survey and Earth Sciences (www.itc.nl) togetherwith the International Institute for Land Reclamation and Improvement (www.ilri.nl) haveplanned to start such an event during April 2002. A first track of the course will orient onwater managers. A follow-up course for the remote sensing and GIS specialists, as wellas for technicians, is planned in the summer of 2002. The participants recommend suchdedicated course to be given in the context of a demonstration project and at the premisesof the end user in order to boost the influx from local participants.
Remote sensing costs money. The investment is only worth if irrigation water can besaved, crops don’t longer suffer from high groundwater tables, the economic benefitsincrease etc. The costs are related to training of staff, recruitment of specialists, hiring ofconsultants, purchases of dedicated software and image acquisitions. But whenimplemented, remote sensing techniques can partial replace field surveyors. Theemphasis is on partial, because field visits remain necessary, but with a smaller group ofsurveyors. Sampling can be prepared and organized more efficient if the spatial variability
in a certain region is known. Hence, the use of satellite remote sensing requires therecruitment of experts (or hiring consultants) for digital analysis. This, however, will resultin a reduction of field surveyors. The change in labor cost is therefore expected to besmall.
4.3 Software
Image processing requires staff time in order to get acquainted with specialized software.There is a wide variation among available packages, ranging from low-cost and simple(MapInfo, IDRISI, ER-Mapper, PCI) to complete and simple (ILWIS, GRASS) andprofessional and expensive (Erdas-Imagine, IDL-Envi, ArcView-spatial analyst). Toprevent starters of becoming overwhelmed, it is recommended first to learn to use the
freely downloadable software tools. These software packages suffice for certainapplications only. Especially when it comes to data merging and conversions betweenpoint, raster and vector data, it is necessary to shift to more professional packages.
Another important aspect in this context is the availability of tutorials and practical userguides. The water management oriented user of the remote sensing software wants tolearn quickly how to operate his/her applications. A good step-by-step guide willsignificantly help this process.
5 Conclusions and recommendations
Considering that the accuracy with which water management related parameters can bemeasured is acceptable, and the cost is affordable, the expert consultation concluded thatthe core activity in remote sensing sciences should focus on making products, rather thandeveloping new algorithms. There is, however, more scientific research required on soilsrelated parameters, in particular on the determination of soil moisture and soil salinity.
Efforts should be made to make algorithms more robust and design user-friendly tools thatcan help water managers in their decision making of water allocation and increase theproductivity of water. The algorithms should have a sound physical basis and not bebased on empirical solution for specific crop and soil environments. At this moment,applications should be endorsed on areas where the accuracy of field data is low or notavailable at the desired spatial and temporal scales.

8/3/2019 Remote Sensing for Drainage
http://slidepdf.com/reader/full/remote-sensing-for-drainage 26/54
26
The final product describes the deviation of the drainage parameter to a reference ortarget (benchmark) value. Software dedicated to satellite remote sensing in irrigation anddrainage studies need to be made, and course should be offered to learn the advances ininformation science. Statistics should be built in the software to show the deviations fromthe target levels. The uncertainty of the data should be indicated as part of data qualitycontrol.
The headline recommendations of the Expert Consultation are:
• Focus efforts on converting remote sensing as a tool to a product. This implies astrong involvement and commitment of the private sector on the marketing of thetechnology.
• Disseminate the results of remote sensing techniques in water resources managementstudies through easily accessible newsletter and by electronic newsletters withreferences to Internet databases. A new electronic news center dedicated to remotesensing applications on irrigation and drainage has to be created, as existing oneshave not sufficient focus
• Enhance local capacity building by means of tailor made training courses for seniordecision makers (short duration) to expose them to potential applications and juniortechnicians (intermediate duration) to learn them how to process images
• Initiate demonstration and implementation projects (two-phases) for exposing drainageengineers with remote sensing data. A large portion of subsidy is required for the firstphase, followed by the second phase where the end-user is substantially sharing thecosts. Every project should have a strong capacity building component.
• Remote sensing products should be associated with uncertainty bounds as part of thedata quality control
• Future remote sensing research for irrigation and drainage should emphasize on soilmoisture and soil salinity, in particular in the average root zone values.
Further to that, the following issues were agreed:
• There is a need for a remote sensing glossary for irrigation and drainage engineers.• Open the option for electronic publications to make the dissemination of colorful
results easier.• Writing of popular research output in existing newsletters, e.g. a special issue of GRID
or the electronic newsletters of USDA-ARS, CSIRO etc.• Open a remote sensing window in GRID.• Organize a thematic workshop during ICID Montreal.• Focus remote sensing work within only one single ICID working group.• Report salient finding of the Expert Consultancy Meeting to international ICID events
(e.g. 52nd International Executive Council Meeting and 1st Asian Regional Conferenceof ICID Seoul and 4th Interregional Conference on Environment and Water, Fortaleza.This has been achieved.
6 References
Abdel-Dayem, S. 2000. Drainage experiences in the arid and semi-arid regions,Proceedings of the 8th ICID International Drainage Workshop, Jan/Feb., 2000, NewDelhi, Vol. 1, INCID, New Delhi
Bakker, M. and W.G.M. Bastiaanssen, 1999. Earth observation for environmental impactassessment in irrigation and drainage projects, a demonstration project for the TungabhadraIrrigation Pilot Project II, India, DHV Consultants, BCRS report 99-13, Delft, The Netherlands:42 pp.

8/3/2019 Remote Sensing for Drainage
http://slidepdf.com/reader/full/remote-sensing-for-drainage 27/54
27
Bastiaanssen, W.G.M., 1998. Remote sensing in water resources management; the state of theart, Monograph, International Water Management Institute (IWMI), Colombo, Sri Lanka: 118 pp.
Bastiaanssen, W.G.M. and M.G. Bos, 1999. Irrigation performance indicators based on remotelysensed data: a review of literature, Irrigation and Drainage Systems, 13(4): 291-311
Bastiaanssen, W.G.M., R.A.L. Brito, M.G. Bos, R.A. Souza, E.B. Cavalcanti and M.M. Bakker,2001. Low cost satellite data for monthly irrigation performance monitoring: benchmarks from
Nilo Coelho, Irrigation and Drainage Systems 15: 53-79Bos, M.G., 1997. Performance indicators for irrigation and drainage, Irrigation and DrainageSystems 11: 119-137
Bos, M.G., 2001. Why would we use a GIS database and remote sensing in irrigation management?, in (eds.) A, van Dijk and M.G. Bos, GIS and Remote Sensing techniques in land- and watermanagement, Kluwer Academic Publishers, ISBN 0-7923-6788-X: 1-8
Brena, J, L. Sanvicente and L. Pulido., 1995. Salinity assessment in Mexico, in (ed.) Vidal, FAOWater Report 4: 190-196
FAO, 1996. Fact Sheets, World Food Summit (November 1996), Food and AgricultureOrganization, Rome, Italy
Hofwegen, van, P. and M. Svendsen, 2000. A vision of water for food and rural development,World Water Forum, 17 March 2000, The Hague, The Netherlands
Jackson, R.D., R.J. Reginato and S.B. Idso, 1977. Wheat canopy temperatures: a practical tool for
evaluating water requirements, Water Resources Research 13: 651-656Kondo, A., A. Higuchi, S. Kishi, T. Fukuzone and J. Li, 1998. The use of multi-temporal
NOAA/AVHRR data to monitor surface moisture status in the Huaihe River Basin, China, Adv.Space Research, ol. 22, no. 5: 645-654
Li Jiren, C. Zhedan, X. Fuchuan, L. Jian, W. Wen and C. Lei, 1997. Application of remore sensingand GIS techniques for irrigable land investigation, IAHS Red Book Publ. no.242: 1-5
Moran, M.S., D.C.Hymer, J.Qi and Y.Kerr, 2002. Comparison of ERS-2 SAR and Landsat TMimagery for monitoring agricultural crops and soil conditions, Remote Sensing of Environment,79: 243-252.
Pulido, L. B. Robles, C.L. Wiegand, J. Gonzalez and H. Sanvicente, 1998. Advances in the use ofremote sensors to detect soil salinity in Mexican irrigation districts, World Congress of SoilScience, Montpellier, France.
Sano, E.E., M.S. Moran, A.R. Huette and T. Miura, 1998. C and multi-angle Ku-band synthetic
aperture radar data for bare soil moisture estimation in agricultural areas, Remote Sensing Env.64: 77-90
Smedema, L.K., S. Abdel Dayemand W.J. Ochs, 2000. Drainage and agricultural development,Irrigation and Drainage Systems 14: 223-235
Tabet, D., D Zimmer, P. Strosser and A. Vidal, 1998. Irrigation management and soil salinitydiagnosis – a case study in Pakistan, 16th World Congress of Soil Science, 20-26 August 1998,Montpelllier, France: 8 pp.
Vidal, A., 1994. Use of remote sensing techniques in irrigation and drainage, FAO Water Reports4, Rome, Italy: 201 pp.
Vidal, A., 2000 (editor). Remote sensing and geographic information systems in irrigation anddrainage, methodological guide and applications, ICID Working group on remote sensing andGIS, ISBN 81-85068-72-0, New Delhi: 126 pp.
Vincent, B., A. Vidal, D. Tabbet, A. Baqri and M. Kuper, 1996. Use of satellite remote sensing for
the assessment of waterlogging and salinization as an indication of the performance of drainedsystems, 16
thCongress ICID, Egypt, 15-22 September 1996, New Delhi, India
Wiegand, C.L., J.D. Rhoades, D.E. Escobar and J.H. Everitt, 1994. Photographic and videographicobservations for determining and mapping the response of cotton to soil salinity, Rem. Sens. OfEnv. 48: 1-25
Yu, T., and G. Tian, 1997. The research on the method of monitoring soil moisture in North ChinaPlain based on NOAA-AVHRR data, physical measurement and signature in remote sensing, in(eds.) Guyot and Phulpin, A.A. Balkema – Rotterdam, vol.2: 613-619

8/3/2019 Remote Sensing for Drainage
http://slidepdf.com/reader/full/remote-sensing-for-drainage 28/54
28
Appendix 1: List of participants
Expert Affiliation Nationality
1 Dr. Safwat Abdel Dayem World Bank, Washington DC
Egypt
2 Dr. Alain Vidal IPTRID, FAO/AGLWViale delle Terme di Caracalla00100 [email protected]
France
3 Dr. Daniel Zimmer CEMAGREFDirection GeneraleParc de TourvoieBP 44, 92163 Antony [email protected]
France
4 Dr. Dunia Tabet Dar Al-Handasah-Shair and Partners,
Resources and EnvironmentDepartment, Dar-Al-Handasah Bldf.,Verdun Street, P.O. Box 7159, [email protected]
Lebanon
5 Prof. Jiaguo Qi Michigan State UniversityDept. Basic Science and RemoteSensing Initiative, [email protected]
China
6 Dr. Hany Abdel Kader ElSadany
Planning Sector, Ministry of WaterResources and IrrigationCornish El-Nil, Imbaba, P.O. Box12666, Giza, [email protected]
Egypt
7 Dr. Thiruvengadachari Agrinet Solutions Ltd., Plot no. 694,Road 33, Jubilee Hills, Hyderabad 500033, [email protected]
India
8 Mr. Palitha Bandara Irrigation Department,P.O. Box 1138Colombo, Sri [email protected] (also associated with IWMI)
Sri Lanka
9 Mr. R. Sinan Erer [email protected] Turkey10 Prof. Li Jiren China Institute of Water Resources andHydropower ResearchRemote Sensing Center of MWR20 West, Chegongzhuang RoadBeijing, [email protected]
China
11 Dr. Ricardo Brito EMBRAPA, CP 151, Sete Lagoas, MG,[email protected]
Brazil
12 Mr. Leonardo Pulido IMTA, Paso Cuaahnahuac 8532,Progreso Jiutepec Morelos, 62550
Mexico

8/3/2019 Remote Sensing for Drainage
http://slidepdf.com/reader/full/remote-sensing-for-drainage 29/54
29
Expert Affiliation Nationality13 Mr. Javier Zuleta General Department of Irrigation,
Mendoza, Argentina [email protected]
Argentina
14 Mr. Tony Morse Idaho Department of Water Resources,1301 North Orchard St.,Boise, ID [email protected]
USA
15 Dr. M.(Rien) G. Bos ILRI, P.O. Box 45, [email protected]
Netherlands
16 Prof. Wim Bastiaanssen WaterWatch,Generaal Foulkesweg 28, 6703 BS,[email protected] (also associated with ITC and IWMI)
Netherlands
17 Mr. Mobin-ud-deen-Ahmed
International Water ManagementInstitute, 12km Multan Rd., ChowkThokar Niaz Baig, Lahore 53700,
[email protected] (also associated with ITC)
Pakistan
18 Dr. Albert van Dijk DHV Consultants, Laan 1945,[email protected]
Netherlands
19 Dr. Arjen de Vries IWACO, P.O. Box 8520, 3009 AM,[email protected]
Netherlands
20 Mr. Bernard Vincent CEMAGREF, Aix en Provence, [email protected]
France

8/3/2019 Remote Sensing for Drainage
http://slidepdf.com/reader/full/remote-sensing-for-drainage 30/54
30
Appendix 2: Programme of the Consultation
Tuesday, 15 May 2001
09.00 Opening of the Expert Consultation
09.15 Introduction on Performance Assessment of water use for irrigation, drainage,environment, etc.
10.00 Presentation and discussion of state-of-the-art papers by participants.As mentioned in the ToR of the expert consultation, presentations should includeinformation on the accuracy with which “measurables” can be determined and itscost. The participants are requested to bring relevant articles and reports, whichhelp in getting an appropriate list of references and exchange know-how. Thepresentation and discussions are expected to define the outlines of practicalapproach and guidelines for applying the technology on a pilot scale in some
priority areas to be decided upon in consultation with the World Bank operationsand the governments concerned.
12.30 Lunch
13.30 Presentation and discussion of state-of-the-art papers (continued)
16.00 Summary of the state-of-the-art on the use of RS to quantify key-aspects of wateruse and related environmental effects.
17.30 Drinks, etc.
19.15 Dinner at the Reehorst
Wednesday, 16 May 2001
09.00 Presentations and discussion on user demands and institutional aspects relatedto the introduction of RS as a water management tool. Recommendations ontraining, maintenance & service of software, exchange of know-how, etc.
11.30 Exchange of know-how and experience.• Consider the establishment of a new ICID working group, one dealing with
remote sensing techniques for water management. Such a Working Groupwould support the sustainability and continuity of the effort through anindependent and non-profit NGO professional organization.
• Recommend on the establishment of an international Journal on the use ofRS and GIS for water management for various user groups: river basinmanagement, irrigation and drainage. Kluwer is willing to start such a journal(via internet) on the recommendation of the expert consultation.
• Review paper on the state-of-the-art and/or an annotated bibliography?
12.30 Lunch
8/3/2019 Remote Sensing for Drainage
http://slidepdf.com/reader/full/remote-sensing-for-drainage 31/54
31
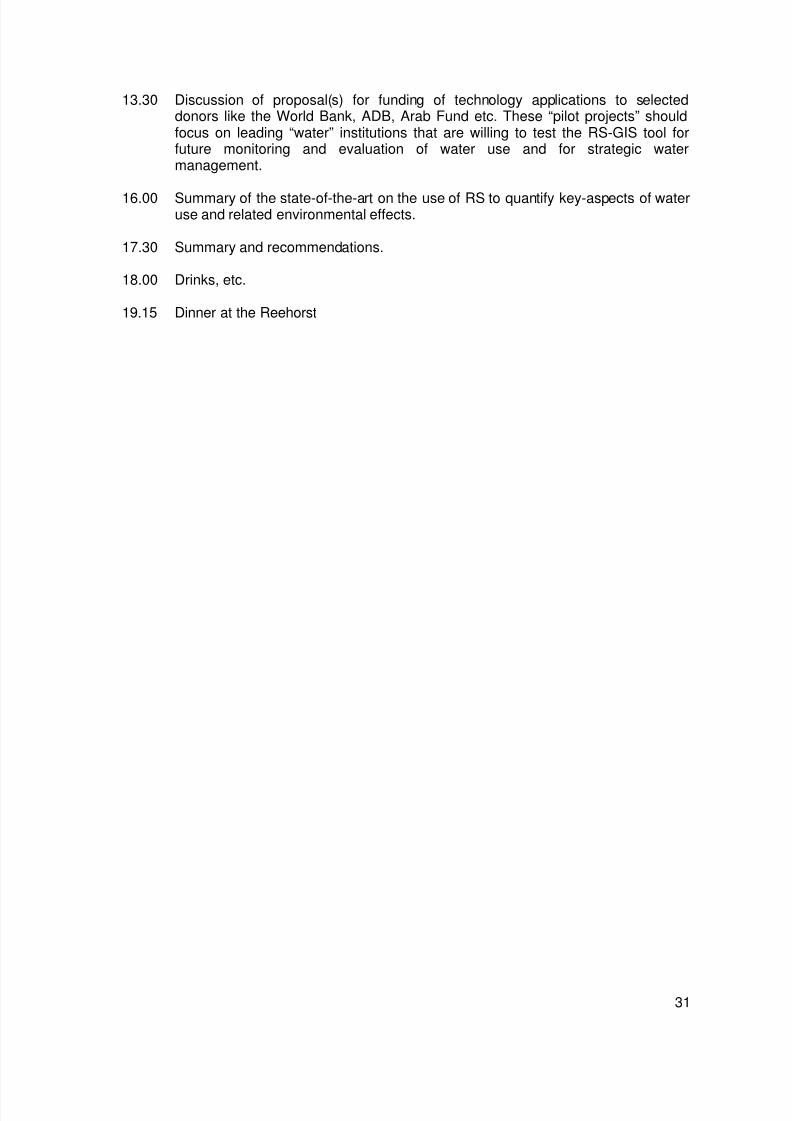
13.30 Discussion of proposal(s) for funding of technology applications to selecteddonors like the World Bank, ADB, Arab Fund etc. These “pilot projects” shouldfocus on leading “water” institutions that are willing to test the RS-GIS tool forfuture monitoring and evaluation of water use and for strategic watermanagement.
16.00 Summary of the state-of-the-art on the use of RS to quantify key-aspects of wateruse and related environmental effects.
17.30 Summary and recommendations.
18.00 Drinks, etc.
19.15 Dinner at the Reehorst

8/3/2019 Remote Sensing for Drainage
http://slidepdf.com/reader/full/remote-sensing-for-drainage 32/54
32
Appendix 3: Format for projects
A format for formulating project ideas on integrated water resources management wasdiscussed. For several projects the ideas of table 7 the format has been included in thisAppendix.
Title Country Purpose Partners
Improving watermanagement by use of RSand GIS, MendozaProvince
Argentina Monitoring cropirrigation anddrainage demand
General Department ofIrrigation,ILRI
Evaluation of soil salinityin the Ninxian Provincerelated to changes in landuse
China Soil salinity as afunction of changes insoil properties, watermanagement andpopulation density
Cemagref, IWHR Beijing,HHRB Yinchuan, ILRI, IHEDelft
Irrigation and drainagemonitoring in deltas
Egypt* Integrated irrigationand drainageperformance
Ministery of WaterResources, ILRIWaterWatch
Monitoring if high levels ofsoil salinity in irrigatedareas of arid and semi-aridclimatic zones
France Sustainability ofirrigated area,detection of salt crust.
Cemagref, WaterWatch,CNES, Spotimage
Knowledge GIS for watermanagement
India* Combining varioushydrological and soilrelated parameters indigital databases
CSSRI, CEMAGREF
Performance assessment
of irrigated agriculture andthe effect of drainageeffluent on theenvironment
Iran Water balance
studies leading to asalt balance.Environmental impact
Ministry of Energy, Ministry
of Agriculture, ILRI,Waterwatch
Agricultural developmentin lowland peat swamps
Malaysia Monitoring landreclamation anddrainage
Department of Irrigation andDrainagePS KonsultantLAWOO
Groundwater irrigationdevelopments
Syria* Retrospectivelyestimate irrigationwater use
Ministries of Irrigation,Agriculture and AgrarianReform, WaterWatch, ILRI
Establishing an
information base for watermanagement in the GAPRegion
Turkey Evaluating water use,
the economic returnand environmentalsustainability
Grontmij, ILRI, WaterWatch
*) not in this appendix

8/3/2019 Remote Sensing for Drainage
http://slidepdf.com/reader/full/remote-sensing-for-drainage 33/54
33
A3.1 Argentina
Country: Argentina Date: October 2001Project Symbol:
Proposed title:Improving Water Management Using RS and GISMendoza, Argentina
Estimated duration: 3 yearsTentative donor contribution: 500.000 U$S
Donor: To be identifiedEstimated government contribution: 500.000 U$S
A Development problem(s) intended to be addressed by proposed project:
• Water use and management performance with respect to target levels concerningsustainability of irrigated agriculture and the provincial water administration system.
• Lack of institutional capacity for water management.• Limited development of Basin Master Plan design and implementation process due to
information availability limitations.• Need to support planning, preparation and implementation processes of rehabilitation
and modernization projects.• Unavailability of a ready to use tools for water management based on GeographicalInformation Systems and Remote Sensing, at operational level.
• Lack of confidence among water operators about the potentiality of new technologiesapplied to the improvement of water management routines.
• Remarkable deficit of knowledge and training on GIS and RS tools development andimplementation
• Bad information dissemination about water availability and crop requirements at minorcanals level reduced user’s participation on water administration, creatingdisagreements between WUA's and water agency on sector diagnosis and mainissues and priorities to be solve.
B Concerned parties/target beneficiaries
• Irrigation Department of Mendoza Province, Argentina.• Water User Associations of Mendoza River Basin and other basins of the region• Water Administration Agencies of the region• People and Government of Mendoza• Different economic sectors highly dependable on water supply and administration
(irrigated agriculture, food industry, urban and domestic water distribution companies,etc.)
C Pre-project and end of project status
• Basic initiative on GIS and RS implementation on Mendoza River Basin sponsored by
FAO projects• DGI cadastral improvement project aimed to obtain updated parcel information about
water rights allocation and land use.• Provincial Water Plan proposal launched in 1999 on discussion at a legislative level• Strategic Provincial Development Plan preparation initiative proposed by Private
Investors Council (Consejo Empresario Mendocino-CEM) where water planningproblems are one of the major issues. Analysis and discussion limited by poor, notdetailed and clear information about water availability, water requirement and currentperformance use.
• FAO/UNDP – DGI contract for Water Plan studies and investment projects preparationas an opportunity to cope basic information, institutional skills, and analysis tools
deficits.

8/3/2019 Remote Sensing for Drainage
http://slidepdf.com/reader/full/remote-sensing-for-drainage 34/54
34
• Too few technicians trained on RS and GIS use on water planning and projectpreparation and operation.
• Considerable conflicts between competitive water consumers in an increasing waterscarcity due to a gradual reduction of main rivers flows and precipitation in lastdecades and important water demand growth.
• Low values of many performance indicators due to poor knowledge about the quantityand opportunity of water allocation at agency, WUA and farm levels.• Large water distribution canals network unlined with high seepage losses increasing
waterlogging and land degradation processes.• Limited user’s participation on water administration due to lack of agreement about
main issues and priorities to be solve. Such a disagreement on diagnosis is based onthe poor knowledge and inaccurate information related basic figures explaining howthe system works and where are the main problems to solve.
D Relationship to other programmes in the same sub-sector
Programa de Servicios Agrícolas Provinciales PROSAP (Provincial Agricultural Sector Investment Programme)
Financed by the IDB and World Bank these have programmes supported investments onirrigation and drainage sector in Mendoza Province since 1997. DGI uses a loan (approvalof 40 million dollars) for investments up to 2003. Main components of the project are;infrastructure rehabilitation, technologies transfer, water administration amelioration,master plans design using RS and GIS. Project and master plans preparation havecontracted by DGI to FAO Investment Centre via UTF contract. 2001-2002.
Mendoza River Regulation Project The start of service (December 2001) of the storage dam at Potrerillos (450hm3) posesthe challenge to proceed to a redesign of the traditional water distribution system ofMendoza River (75.000 has irrigated). From now on, the system has to be improved inorder to guarantee that the benefits of flow regulation arrives to each of the more than20000 users located along the 3200 km canal network and to mitigate the eventualnegative impacts of the sediment retention and the increase of seepage at the unlinedcanals and soils degradation due waterlogging and salinisation. This task requires a hugeplanning process where the use of GIS and RS to define and evaluate strategies andpolicies is one of the main tools.
Information System for Water Planning - SIPH - in the Mendoza River Basin The Irrigation Department have developed in cooperation with FAO/Japan project an“Information System for Water Planning - SIPH“, useful to evaluate the currentperformance of the system and to estimate the most probable impacts of variousimprovement strategies over more than 10000 farms. Developing this tool have been
implemented a Geographic Information System where have been geo-referenced 44000water use concessions over the 35000 cadastral parcels establishing relations with bio-climatic, soil and land use information. The preliminary results have facilitated theprocesses of identification and prioritization of investment projects that have to be done ascomplementary actions of the regulation project. Recently the system has been improvedwith detailed RS Landsat 7 and IKONOS 4+1 land use information combined with wateruse scenarios design and modeling techniques.
E Development objective and its relation to the country's policies and prioritiesfor the sector/sub-sector
• Increase institutional capacity for water management• Support project planning and implementation of rehabilitation and modernisation
projects.

8/3/2019 Remote Sensing for Drainage
http://slidepdf.com/reader/full/remote-sensing-for-drainage 35/54
35
• Produced a ready to use tools for water management based on GIS&RS in arepresentative pilot case for practical and training purposes
F Major elements and Activities
Outputs Activities Party
responsible for the activity
Kick Off meetingDeveloping a GISLand and water use informationcollectionLand and water managementinfo collectionLand and water quality infocollectionImplementation of the interfaceRS application to water
managementMethodological analysis
Images acquisition and processingObtained information analysisInclusion of the information in theGISModeling and assessing scenariosconsidering changes on;Institutional aspectsClimatic (global change)Infrastructure modernisationLegal reorganisation (water rights
change)Increasing institutional capacity
ITCINAILRILocalUniversities
G Training needs
• Courses (national or regional)• Young Professionals on GIS/RS 2 courses (2 weeks) x 15 people = 30 people• DSS using GIS/RS for Managers; 2 courses (1 weeks) x 10 people = 20 people• Users Association operators seminars; 4 seminars (2 days) x 10 people = 40 people• On the Job training• Five young professionals scholarships for development and training from Europe and
the region x 6 month• Special (research) studies Subcontracted to Academic Sector
J Budget
In continuation to earlier technical assistance, the following organizations will beapproached; World Bank (Monitoring Program Funds, Preparation Programs Funds,Country Grants), GWP, FAO (TCP Program),DGI and User Associations, ArgentinaFederal Government, Mendoza Province Government and Dutch Government orinstitutions
Required Financial support is estimated at 500.000 U$S

8/3/2019 Remote Sensing for Drainage
http://slidepdf.com/reader/full/remote-sensing-for-drainage 36/54
36
A3.2 China
Country: ChinaDate: 09/01Project Symbol:
Proposed title:Evolution of the soil salinity in the Ninxia province(China) related to changes in soil property
regimes, water management strategies andpopulation density
Estimated duration: 2 yearsTentative donor contribution: 65 000 €
Donor: World bank, FAO, UnescoEstimated government contribution to bedetermined.
A Development problem(s) intended to be addressed by proposed project.
The Ninxia (China, Ninxia province) is severely affected by irrigation induced soilsalinisation. On going projects are showing that salinisation can be detected by satelliteremote sensing, as salt crust are highly visible and low intense cropping area can berelated to low NDVI values.
The project aims at monitoring the evolution of salinity within the times and to relate thisevolution to the major rural events like for instance in the 80's land privatisation andallocation, or nowadays increase of population. It is assumed that the first process has ledto abandon lands, and the second is leading to recover abandoned lands. This evolutionhas of course to be confronted to the changes in management of irrigation and drainageschemes. At a particular time, it should be able to clarify the relevant process and assessthe impact of water management strategies.
B Concerned parties/target beneficiaries
Local government, irrigation district, farmer association.
C Pre-project and end of project status
Data processed for the year 1999, sociological aspects excepted
D Relationship to other programmes in the same subsection
Work has started in the frame of the INCO-DC “Yellow River water saving project”.
E Development objective and its relation to the country's policies and prioritiesfor the sector/subsection
Water saving in the upper reaches of the Yellow River is a national Chinese concern.Operational outputs would result from the project
F Major elements
Probably one of the rarest projects where historical and sociological of soil salinitychanges would be reached. The approach would interest grand donors and internationalAssociations.

8/3/2019 Remote Sensing for Drainage
http://slidepdf.com/reader/full/remote-sensing-for-drainage 37/54
37
Outputs Activities Party responsible for the activity
To collect and process images
versus historical aspects ofsalinityTo record agricultural practiceswithin times, changes in landoccupation and allocationHydraulic modeling,performance assessment ofstructures
Archive Image processing and
GIS; salinity mapping
Farmer inquiries
Water level and dischargemeasurements interpretation
Cemagref, ILRI,
IWHR Beijing(RS lab)HWRB,Yinchuan
IHE Delft, ILRI
G Host country commitment
Chinese partners would be met in November 2001 in China.
H Budget
The tentative budget is as follows:Images 20 000€Labour 30 000 €Travel 10 000 €Overhead 5 000 €Total 65 000 €

8/3/2019 Remote Sensing for Drainage
http://slidepdf.com/reader/full/remote-sensing-for-drainage 38/54
38
A3.4 France
Country: FranceDate: September 2001Project Symbol:
Proposed title:Monitoring of high levels of soil salinity in irrigatedareas of the arid and semi-arid climatic zones, byuse of satellite remote sensing Feasibility study
Estimated duration: 2 yearsTentative donor contribution: 50 000 €
Donor: World bank, FAO, UnescoEstimated government contribution:
A Development problem(s) intended to be addressed by proposed project.
the salinisation process is well known and described, the geographic extension of theproblem needs at least further investigation: all the information about geographicextension relies upon the assessment of experts and, indeed statistics might beconsidered as low reliable. In this context, governments and grand international donorswould give due attention to an indicator that assesses the extension of soil salinityhazards and their variation within times.
The project aims Soil Salinity is a major concern of irrigated areas in the arid and semi-arid climatic zone. If at providing such an indicator, by use of global remote sensingapproach. It is known that high levels of salinity can be detected, when salt crust occurs.Thus, to monitor the extension of the salt crust is likely to assess the salinity status of thearea, and his evolution within times would reflect the changes in this status. If we canhave maps with the location of irrigated areas it would be easy to purchase ad hoc imagesand to process salt crust detection.
The main difficulty would be the information about irrigated areas, as it is not available at aglobal scale. It would be a long time to get it through the various nations under concern.
Thus, this delimitation might be derived from a global NOAA NDVI mosaic, a DEM toselect the sub-horizontal zones, and climatic data to select arid and semi-arid regions,where it is sure with a reasonable approximation that medium and high NDVI valuescorrespond to irrigated area. After what the salt crust detection and the elaboration ofstatistics is possible.
B Concerned parties/target beneficiaries
World Bank, FAO, UNESCO,
C Pre-project and end of project status
Detection of salt crust by remote sensing has been tested positively in various regions.
D Development objective and its relation to the country's policies and prioritiesfor the sector/sub-sector
The project addresses to international donors that may use the results as an investmentand programming tool.

8/3/2019 Remote Sensing for Drainage
http://slidepdf.com/reader/full/remote-sensing-for-drainage 39/54
39
E Major elements
Outputs Activities Party responsible for the activity
To assess the feasibility of
delimitation of irrigated areas withNDVI NOAA mosaicsTo detect salt crustTo elaborate statistics
Image processing and GIS Cemagref
WaterWatch+ CNES,Spotimage etc
F Host country commitment
To be completed upon selection of countries.
G Risk
The main difficulty would be the information about irrigated areas, as it is not available at a
global scale. It would be a long time to get it through the various nations under concern.
H Budget
Excluding labour cost, the budget is:Images 20 000 €Labour 35 000 €Overheads 5 000 €Total 60 000 €

8/3/2019 Remote Sensing for Drainage
http://slidepdf.com/reader/full/remote-sensing-for-drainage 40/54
40
A3.6 Iran
Country: IranDate: March 2002Project Symbol:
Proposed title: Performance assessment ofirrigated agriculture and the effect of drainageeffluent of the environment.
Estimated duration: 3 years
Tentative donor contribution:
Funder: Ministry of Agriculture (LNV) The
Netherlands Ministry of Energy (MoE), Iran.Estimated LNV contribution: 150 000 €Plus 100 000 € from the Ministry of Energy.
A Development problem(s) intended to be addressed by proposed project.
Irrigation can be considered as a human intervention in the environment; water isimported into an area to grow a crop that would not grow without this imported water. Inreverse, drainage discharges water from an area to improve crop growth, accessibility offields, discharge salts from the area, etc. Besides the above, intended impacts of watermanagement (usually labeled positive) there are unintended impacts (usually labelednegative). The positive impacts are mostly restricted to the irrigated (or drained) area,while the negative impacts may spread over the irrigated area, the river basin downstreamof the water diversion, and the drainage basin downstream of the drained area.
Within the irrigated area, several negative impacts (waterlogging, salinity, and watershortage due to competition for water) cause a reduction of the (actually) irrigated area. Afurther reduction of the irrigated area is related with population growth and the relatedurbanization, road construction, etc. Aspects of physical sustainability (of the irrigatedarea) that can be affected by irrigation managers relate primarily to over- or under-supplyof irrigation water leading to waterlogging or salinity.
The number of parameters that have to be monitored at the various reference sites may
differ, but the method of monitoring should be the same for all locations. This makes iteasier and faster to compare and analyse the collected data and adjust the monitoringprogramme if necessary. We consider the following topics for irrigated areas importantand recommend a monitoring program for:• Land use• Productivity of agricultural land• Water management• Environment
The environmental aspects of agricultural development will be included in themanagement tool. Land use and the condition of the peat land is closely related. Undernatural circumstances the sustainability of peat will be ‘guaranteed’. Any intervention in
these areas will lead to degradation and loss of peat.
Water management for agriculture will lead to a loss of peat through subsidence. Cropyield and environment are mainly related to human activity. Development for agriculturewill lead to the use of fertilisers and pesticides and deteriorate water quality.
B Concerned parties/target beneficiaries
Government of Iran. The Wageningen UR team intends to extend on the first draft of the"guidelines performance assessment of irrigation and drainage”.

8/3/2019 Remote Sensing for Drainage
http://slidepdf.com/reader/full/remote-sensing-for-drainage 41/54
41
C Pre-project and end of project status
Monitoring and evaluation of agricultural development in irrigated areas and the effect ofdrainage effluent on the downstream environment. A methodology will be tested andmade available to support water management decisions.
D Relationship to other programmes in the same sub sectorNew techniques for RS monitoring have been developed and several of these data couldalso be derived from low-cost satellite information. For remote sensing to be used, acorrelation needs to be established between:• Depth to the groundwater table versus the temperature of the soil surface.• Depth to the groundwater table versus crop yield• Depth to the groundwater table versus actual evapotranspiration (of groundwater) of
the crop.• Bio-mass production versus marketable crop yield of selected commercial crops.
Parameters like soil temperature, actual ET, bio-mass production can be measured withincreasing accuracy through the energy balance as based on satellite sensed data. Theuse of NOAA images (1100m pixel size) seems to be sufficiently accurate for themonitoring of the above ‘measurables’. With a known correlation between the aboveparameters and crop characteristics, a low-cost monitoring system for the entire coastalplain of Sarawak would be feasible
E Development objective and its relation to the country's policies and prioritiesfor the sector or sub sector
The project addresses policy developments in Iran. Developments in other countries insemi-arid regions can also use the tool.
F Major elements
Outputs Activities Party responsible for the activity
Establishment of a land &water monitoring programthat employs both remotesensing and field analysistechniques
Identifying sampling locations for field data(representing all minor catchments)Identifying parameters for land & wateruse monitoring within the scope of effectsof agricultural and urban-born nutrient andpollution loads.Determine period and frequency ofsampling as a start-up of a monitoringprogram
ConsultantsSteeringCommittee (ofpertinentstakeholders)
Establishment of acommon dataorganization system andcomputer based land &water use maps forassessing temporal andspatial changes.
Assessing the type and quality of dataproduced by different institutionsIdentifying a suitable database system ordata map that shows the type of dataproduced by any institution.Producing different land & water use mapsfor each monitoring parameter, makinguse of remote sensing and GISapplications at each sampling occasion.
ConsultantsSteeringCommittee (ofpertinentstakeholders)

8/3/2019 Remote Sensing for Drainage
http://slidepdf.com/reader/full/remote-sensing-for-drainage 42/54
42
Outputs Activities Party responsible for the activity
Constructing an
integrated hydrologicalmodeling
Selecting appropriate software for the
modeling of selected parameters andperformance indicators on land and wateruse. This includes the monitoring of theeffects of changes in land use.Constructing and running of themanagement tool with available data.
Consultants
SteeringCommittee (ofpertinentstakeholders)
Framework for a land &water management plan
Determining the basic needs for asustainable water management plan.
ConsultantsSteeringCommittee (ofpertinentstakeholders)
G Project strategy:
The project strategy is to establish the information base to be developed through acontinuous monitoring system with a view toward implementation of sustainable watermanagement a representative catchment area.
Main focus area of the project is the use of remote sensing and GIS technology in themonitoring of a wide area of land use. This will enable timely taken measures with regardsto development activities on environmental aspects.
F Host country commitment
The Ministry of Energy is co-funding the project and is fully committed to its success andthe future application of results. Water is an extremely scarce resource in Iran.
G Risk
The major risk foreseen is the duration it will take to establish relationships between thetwo Ministries of Agriculture and Energy. Difficulties that may rise in access to pastinformation and data on land use and water quality in the region is another factor of riskthat can hinder the project flow.
H Budget
Tentatively, the budget is as follows:LNV 150000 €MoE 100000 €

8/3/2019 Remote Sensing for Drainage
http://slidepdf.com/reader/full/remote-sensing-for-drainage 43/54
43
A3.7 Malaysia
Country: Malaysia, SarawakDate: January 2002Project Symbol:
Proposed title: Monitoring of agriculturaldevelopment in the central coastal plain ofSarawak, Malaysia.
Estimated duration: 3 years
Tentative donor contribution:
Funder: Government of Sarawak
Estimated government contribution: 500 000€Plus 100 000€ from Wageningen UR
A Development problem(s) intended to be addressed by proposed project.
Sarawak has around 1.7 million ha of peat land. More than 1.0 million ha is due to bedeveloped for agriculture during the next decades. Most development will be throughprivate companies receiving a 60-year land lease for 5000 ha lots. The Government ofSarawak needs a tool to manage (including monitoring and evaluation) land developmentin this coastal area.
The number of parameters that have to be monitored at the various reference sites maydiffer, but the method of monitoring should be the same for all locations. This makes iteasier and faster to compare and analyse the collected data and adjust the monitoringprogramme if necessary. We consider the following topics for the Sarawak peat landsimportant and recommend a monitoring program for:• Land use• Condition of the peat lands• Water management• Environment
The environmental aspects of coastal development will be included in the managementtool. Land use and the condition of the peat land is closely related. Under natural
circumstances the sustainability of peat will be ‘guaranteed’. Any intervention in theseareas will lead to degradation and loss of peat.
Water management for agriculture will lead to a loss of peat through subsidence. Cropyield and environment are mainly related to human activity. Development for agriculturewill lead to loss of peat, while the use of fertilisers and pesticides and may deterioratewater quality. Water management for water supply relies on (conserved) peat landsbecause the natural outflow from the peat area is used as water source.
B Concerned parties/target beneficiaries
Government of Sarawak. The Wageningen UR team intends to extend on the first draft ofthe "guidelines for peat development in the coastal plains of Sarawak" and publish it as amore general guideline for South-east Asia.
C Pre-project and end of project status
Monitoring and evaluation of agricultural development in coastal plains with densevegetation.
D Relationship to other programmes in the same sub sector
The project is a component of Phase 2 of the DID-LAWOO study on peat subsidence.New techniques for RS monitoring have been developed and several of these data couldalso be derived from low-cost satellite information. Applied research on the potential useof this technology is recommended. For remote sensing to be used, a correlation needs to
be established between:• Depth to the groundwater table versus the temperature of the soil surface.

8/3/2019 Remote Sensing for Drainage
http://slidepdf.com/reader/full/remote-sensing-for-drainage 44/54
44
• Depth to the groundwater table versus crop yield• Depth to the groundwater table versus actual evapotranspiration (of groundwater) of
the crop.• Bio-mass production versus marketable crop yield of selected commercial crops.
Parameters like soil temperature, actual ET, bio-mass production can be measured withincreasing accuracy through the energy balance as based on satellite sensed data. Theuse of NOAA images (1100m pixel size) seems to be sufficiently accurate for themonitoring of the above ‘measurables’. With a known correlation between the aboveparameters and crop characteristics, a low-cost monitoring system for the entire coastalplain of Sarawak would be feasible
E Development objective and its relation to the country's policies and prioritiesfor the sector or sub sector
The project addresses policy developments in Sarawak. Developments in other countriesin south-east Asia can also use the tool.
F Major elementsOutputs Activities Party
responsible for the activity
Establishment of a land& water monitoringprogram that employsboth remote sensing andfield analysis techniques
Identifying sampling locations for field data(representing all minor catchments)Identifying parameters for land & wateruse monitoring within the scope of effectsof agricultural and urban-born nutrient andpollution loads.
Determine period and frequency ofsampling as a start-up of a monitoringprogram
ConsultantsSteeringCommittee (ofpertinentstakeholders)
Establishment of acommon dataorganization system andcomputer based land &water use maps forassessing temporal andspatial changes.
Assessing the type and quality of dataproduced by different institutionsIdentifying a suitable database system ordata map that shows the type of dataproduced by any institution.Producing different land & water use mapsfor each monitoring parameter, makinguse of remote sensing and GIS
applications at each sampling occasion.
ConsultantsSteeringCommittee (ofpertinentstakeholders)
Constructing anintegrated hydrologicalmodeling
Selecting appropriate software for themodeling of selected parameters andperformance indicators on land and wateruse. This includes the monitoring of theeffects of changes in land use.Constructing and running of themanagement tool with available data.
ConsultantsSteeringCommittee (ofpertinentstakeholders)
Framework for a land &water management plan
Determining the basic needs for asustainable water management plan.
ConsultantsSteeringCommittee (of
pertinentstakeholders)

8/3/2019 Remote Sensing for Drainage
http://slidepdf.com/reader/full/remote-sensing-for-drainage 45/54
45
G Project strategy:
The project strategy is to establish the information base to be developed through acontinuous monitoring system with a view toward implementation of sustainable water
management in the Central Coastal Area. Main focus area of the project is the wide use ofremote sensing and GIS technology in the monitoring of a wide area of land use. This willenable timely taken measures with regards to development activities on environmentalaspects.
H Host country commitment
The Government of Sarawak is funding the project and is fully committed to its successand the future application of results.
I Risk
The major risk foreseen is the duration it will take to establish relationships betweenagricultural parameters and remotely sensed data. Particularly data on land subsidencewill take long time series before a reliable relationship becomes available.Difficulties that may rise in access to past information and data on land use and waterquality in the region is another factor of risk that can hinder the project flow.
J Budget
GoS 500000 €WUR 100000 €

8/3/2019 Remote Sensing for Drainage
http://slidepdf.com/reader/full/remote-sensing-for-drainage 46/54
46
A3.9 Turkey
Country: TurkeyDate:Project Symbol:
Proposed title: Establishing an information basetowards sustainable water management plan inGAP-Region, TURKEY
Estimated duration: 12 monthsTentative donor contribution:
Donor: To be identifiedEstimated government contribution:
A Development problem(s) intended to be addressed by proposed project
Rural development in the South Eastern part of Turkey is accelerated through the start ofthe South Eastern Anatolia Project (GAP), which mainly focuses on three areas:hydropower development, irrigated agriculture and agro-industries.
South Eastern Anatolia Region accomplished a huge agricultural potential with the GAP,depending mostly on irrigation projects and establishment of new agricultural techniques.The irrigation projects within this region will provide a substantial increase in theagricultural production. However, GAP region will possibly come across with thedeterioration of water resources and agricultural soils basically due to mis-implementationof the irrigation techniques.The project can be justified on the need for a common water-monitoring data organizationsystem. Therefore, it is aimed to collect all the water monitoring data in a commondatabase that with the cooperation and collaboration of different organisations. A commondatabase for the GAP region will be the first step in establishment of a coordinateddatabase and monitoring program.
B Concerned parties/target beneficiaries
GAP Regional Development Administration
State Hydraulic Works (DSI)Local Authorities/PublicMinistry of Agriculture
C Pre-project and end of project status
For hundreds of years, rain-fed agriculture techniques were practiced in the GAP region.Transition to irrigated agriculture techniques will possibly result in some negative effectson the natural environment and water resources via altering hydrological regime, overuseof water, agricultural pollution and nutrient loads to the environment. For this reason, theeffect of increased water-use for agriculture on the environment, both within anddownstream of the agricultural areas, as well as the side effects such as erosion due tourban and industrial development at the upstream need to be quantified. Such aninformation base will enable formulation of strategies and policy decisions drawing theframes for sustainable water and land management plans toward a sustainable regionaldevelopment.
This project aims to assess the basic information needs to establish a base for thepreparation of a sustainable water management plan in the GAP region. In this process,participation of all local and national stakeholders is particularly significant. Therefore, theproject is formulated to be executed in a multi-stakeholder manner with the involvement ofall concerned agencies.
D Relationship to other programmes in the same sub-sector
The primary objective of the project is to prepare the information base towards asustainable water quality management plan in the GAP region with the participation of all

8/3/2019 Remote Sensing for Drainage
http://slidepdf.com/reader/full/remote-sensing-for-drainage 47/54
47
the local and national stakeholders. Establishing a water quality monitoring program and adata organization map which shows the type of data gathered by any organization, arealso important components of the project.
The GAP Master Plan that draws a frame for regional development laid down a scheduleespecially for the development of land and water resources by considering availablefinancial and technical capacities. In this respect the project is also directly in accordancewith the one of the four basic target of GAP Master Plan; “development and managementof water and land resources for both irrigation purposes and for urban-industrial uses”.
E Development objective and its relation to the country's policies and prioritiesfor the sector/sub-sector
Due to transition from rain-fed agriculture to irrigated agriculture in GAP region waterresources are facing with the risk of altered hydrological regime and contamination byagricultural nutrients and polluters since the knowledge of irrigated agricultural practice isnot settled among farmers. For this reason it is required to prepare a sustainable watermanagement plan in the region for a long time use of water resources including an
education program for the farmers.
In Turkey, many national and local institutions have certain responsibilities on waterresources, but these are very ambiguous that result in uncoordinated managementpractices. The project aims to bring together the representatives of the all water relatednational and local institutions and organizations to discuss the possible means ofcoordination between the institutions, and to discuss on a general frame of sustainablewater management in the region, making use of the modeling work.
In addition, lack of a common water-monitoring data organization system is one of theimportant problems in the country. In this project it is aimed to collect all the watermonitoring data in a common database or establish a database map, which shows each
data produced by different institutions. A common database or a database map for theGAP region will be a first step in establishment of a countrywide database program.
F Major elements
Outputs Activities Party responsible for the activity
Output 1Integration of all waterrelated national and localstakeholders to discuss
towards a sustainablewater qualitymanagement plan
1.1 Constructing an initial project-planningworkshop with the representatives of allwater related national and local institutions
to present the project and to define therole of each institution within the projectand within a potential water managementplan.
1.2 Defining a strategy for projectimplementation1.3 Establishing a Project SteeringCommittee1.4 Regular meetings of the SteeringCommittee
Consultants(coordination)GAP RDA

8/3/2019 Remote Sensing for Drainage
http://slidepdf.com/reader/full/remote-sensing-for-drainage 48/54
48
Outputs Activities Party responsible for the activity
Output 2Description of Existing
Situation with regards towater quality in the GAPRegion.
2.1 Collecting and compiling the past
water related data on water qualityparameters (general physical andchemical data, nutrient data, pollutiondata, ecological data etc.) to assess thepast water quality condition.2.2 Collecting all current water relateddata and conducting new analyses.2.3 Acquiring of appropriate satelliteimages to be analyzed in correlation withfield analyses.
Consultants
SteeringCommittee (ofpertinentstakeholders)
Output 3Establishment of a water
quality and hydrologicalmonitoring program thatemploys both remotesensing and field analysistechniques
3.1 Identifying sampling locations
(representing all minor catchments)3.2 Identifying water quality parameters forwater quality monitoring within the scopeof effects of agricultural and urban-bornnutrient and pollution loads.3.3 Determining period and frequency ofsampling as a start-up of a monitoringprogram
Consultants
SteeringCommittee (ofpertinentstakeholders)
Output 4Establishment of acommon dataorganization system and
computer based waterquality map for assessingthe temporal and spatialchanges in water quality.
4.1 Assessing the type and quality ofwater quality data produced by differentinstitutions
4.2 Identifying a suitable database systemor data map that shows the type of dataproduced by any institution.4.3 Producing different water quality mapsfor each monitoring parameter, i.e. nutrientquality, pollution, salinity etc., making useof remote sensing and GIS applications ateach sampling occasion.
ConsultantsSteeringCommittee (of
pertinentstakeholders)
Output 5Constructing anintegrated hydrologicalmodeling
5.1 Selecting an appropriate software forthe hydrological modeling (which includesthe parameters of water supply, irrigationand drainage, contamination from wastedisposal sites, impacts of farmingpractices, effects of changes in land use,effects of changes in climate5.2 Constructing and running of thehydrological model with available data.
ConsultantsSteeringCommittee (ofpertinentstakeholders)
Output 6Framework for a waterquality management plan
6.1 Determining the basic needs,implementation projects and an actionplan towards a sustainable watermanagement plan.
ConsultantsSteeringCommittee (ofpertinentstakeholders)

8/3/2019 Remote Sensing for Drainage
http://slidepdf.com/reader/full/remote-sensing-for-drainage 49/54
49
G Project strategy
The project strategy is to establish the information base to be developed through acontinuous monitoring system with a view toward implementation of sustainable watermanagement in the GAP Region. Main focus area of the project is the wide use of remotesensing and GIS technology in the monitoring of a wide area of land. This will enable
timely taken measures with regards to development activities on water and soil quality.
H Host country commitment
GAP Regional Development Administration, under the Office of the Prime Ministry, is theresponsible authority for coordinating all sorts of projects geared toward socio-economicdevelopment in the South-eastern Anatolian Region of Turkey. The initial Master Plan thatwas prepared in 1989 had the major goal of enhancing rural and urban development,generating employment, raising income levels and improving of quality of life for thepeople of the region. A decade of various development projects primarily based onconstruction of dams and irrigation systems have resulted in social and environmentalimpacts. It has been realised that the risks of desertification and salinisation of soil wereneglected to a recent past as it came to threaten future economy from irrigated
agriculture. In this frame, a revised master plan has been under preparation with theoverall coordination of the State Planning Organisation and GAP RDA, with the new visionof sustainable development, paying a major concern on the social and environmentalissues.
As an integrated and multi-sectoral regional development project, GAP brings togethercentral government organisations and local authorities. The State Hydraulic Works underthe Ministry of Energy and Natural Resources is a significant stakeholder in terms of itsresponsibility for the development and management of water resources.
The State Planning Organisation attached to the Prime Ministry that prepares five-yearnational development plans and annual investment programs, gives an emphasis to theanticipated challenges in all newly irrigated areas in the GAP region. Such risks related toan important extent with the excessive use of water and agricultural inputs leading tosalinization of agricultural land lie within the range of responsibilities of State HydraulicWorks and GAP RDA.
I Risk
The major risk foreseen is the difficulties in accomplishing coordination between thepertinent stakeholders, which are aimed to be brought together to establish a commondata-base of water quality. A difficulty that may rise in access to past information and dataon water quality in the region is another factor of risk that can hinder the project flow.
J BudgetWill be provided at a later stage.

8/3/2019 Remote Sensing for Drainage
http://slidepdf.com/reader/full/remote-sensing-for-drainage 50/54
50
Appendix 4: Examples of remote sensing projects related to irrigationand drainage systems conducted in the past
Country Project Organisations involved
Argentina Water rightsCrop identificationCrop water requirementsIrrigation performanceSoil salinity
INCYTH, DGI, DLO-Winand StaringCentre, INTA, CONICET, UNC-FCA
Australia Crop yieldsIrrigation managementWater use efficiency
CSIRO
Bolivia Land use CLAS, ITC
Brazil Irrigation performance EMBRAPA, DHV
China EvapotranspirationErosionCrop yieldSoil moistureSoil salinity
LIPAP, Ministry of Water Resources,CSIRO, DLO-Winand Staring Centre
Egypt River Nile Discharge forecastingLand use mappingCrop identification
EvapotranspirationSoil salinity mapping
Ministry of Public Works, Ministry ofAgriculture and Land Reclamation,Drainage Research Institute,
Groundwater Research Institute, Dar Al-Handasah,DLO-Winand Staring Centre
India Crop identificationRice yieldWheat yieldCanal lining
NRSA, IIT, IIRS, IWMI
Indonesia Land userice yield
ITC, FAO
Italy Crop water requirement University of Campobasso, University ofNapels, Alterra
Iran Land useLand evaluationCrop yield forecastingEvapotranspiration
Ministry of Agriculture, Ministry ofForestry, ITC, IWMI
Mexico Soil moistureSoil salinity
IMPA, University of Tamaulipus, IWMI,USDA
Morocco Irrigated areaCrop yield forecasting
Flood controlIrrigation management
ORMVAG, CEMAGREF, IPTRID,ENGEES

8/3/2019 Remote Sensing for Drainage
http://slidepdf.com/reader/full/remote-sensing-for-drainage 51/54
51
Country Project Organisations involved
Drainage performance
Niger Pond monitoring
Evapotranspiration
CEMAGREF, IPTRID, DLO-Winand
Staring Centre, University of Copenhagen
Pakistan Soil salinityCrop water stressEvapotranspirationSoil moistureCrop yield
CEMAGREF, WAPDA, IWMI, Euroconsult,University of Tsukuba
Senegal Soil salinity mapping Dar Al-Handasah
Spain EvapotranspirationWater rights
Desertification monitoring
University of Valencia, University ofCastilla la Mancha, Geosys, ITC, EARS
South Africa Crop growth EARS, MaxiFarm
Turkey Irrigated areaEvapotranspiration
GDRS, IWMI, NASA, University of Idaho
USA EvapotranspirationCrop water stressCrop growthSoil moisture
USDA, USBR, NASA, University of Idaho,Utah State University, University of NewMexico
Uzbekistan Land useSoil salinity
Royal Haskoning b.v.
Yemen Groundwater use for irrigation Ministry of Water Resources, ITC

8/3/2019 Remote Sensing for Drainage
http://slidepdf.com/reader/full/remote-sensing-for-drainage 52/54
52
Appendix 5: Conclusions of scientific presentations
Soi l sa l in i ty assessm ent , Dun ia Tabet Conclusions
• Unmanaged Salinity: easy identification by RS.Its organization transcends agriculturaland cadastral limits. Its evolution indicates farmers capacity to handle the problem
• Managed Salinity: difficult identification by RS. Disorganised (no particular pattern)and complex. Necessity to take into account farmers practises and management
• Products scale :• medium resolution data: 1:50,000 to 1:20,000; high resolution data: 1/5,000 but
expensiveReferencesTabet, D., A. Vidal, D. Zimmer, S. Asif, M. Aslam, M. Kuper and P. Strosser, 1997. Soilsalinity characterisation ofSPOT images: a case study in one irrigation system of the Punjab, Pakistan, in (eds.)Guyot and Phulpin,Physical measurements and signatures in remote sensing, Balkema, Rotterdam, ISBN9054109173: 795-800
Sal in i t y as a hazard , Dan ie l Z im m er Conclusions
• Salts behave more as a hazard, rather than a soil state variable• Perceptions of farmers on salinity need to be included in the definition of soil salinity• Salinity and sodicity need to be separated• Remote sensing data needs to be combined with ancillary data (water table, water
quality, crop development etc.)ReferencesTabet, D., D Zimmer, P. Strosser and A. Vidal, 1998. Irrigation management and soil
salinity diagnosis – a case study in Pakistan, 16th World Congress of Soil Science,20-26 August, 1998, Montpelllier, France: 8 pp.
Agr i cu l t u ra l W a te r Managem en t , L i Ji ren
Conclusions
• The accuracy of investigation by remote sensing and GIS is quite high• Consumption of labor and expenditure is low, 10% of traditional method• Duration is short, ont third of traditional method• Remote sensing and GIS techniques are applicable to investigation of irrigation area
ReferencesKondo, A., A. Higuchi, S. Kishi, T. Fukuzone and J. Li, 1998. The use of multi-temporal
NOAA/AVHRR data to monitor surface moisture status in the Huaihe River Basin,China, Adv. Space Research, ol. 22, no. 5: 645-654
Li Jiren, C. Zhedan, X. Fuchuan, L. Jian, W. Wen and C. Lei, 1997. Application of remore sensing and GIS techniques for irrigable land investigation, IAHS Red BookPubl. no.242: 1-5
Yu, T., and G. Tian, 1997. The research on the method of monitoring soil moisture inNorth China Plain based on NOAA-AVHRR data, phyical measurement and signaturein remote sensing, in (eds.) Guyot and Phulpin, A.A. Balkema – Rotterdamn, vol.2:613-619
Drainage systems in relation to salinity, Bernard VincentConclusions

8/3/2019 Remote Sensing for Drainage
http://slidepdf.com/reader/full/remote-sensing-for-drainage 53/54
53
• The position of fields in relation to drainage canals is important for salinity• Cropping intensities provide useful information on salinity occurrancesReferencesVincent, B., A. Vidal, D. Tabbet, A. Baqri and M. Kuper, 1996. Use of satellite remote
sensing for the assessment of waterlogging and salinization as an indication of theperformance of drained systems, 16th Congress ICID, Egypt, 15-22 September1996, New Delhi, India
Drainage and deep percolation, Mobin ud-Din Ahmad Conclusions• Numerical models can be used to compute sub-surface drainage and groundwater
recharge rates• Numerical models can use remotely sensed distributed input data on cropping
intensity, crop type, evapotranspiration and soil moisture to cover larger areasReferencesAhmad, M.D., W.G.M. Bastiaanssen and R.A. Feddes, 2001. Recycling throughrecharge and groundwater use of
irrigated fields in Pakistan; Int. J. of Irrigation and Drainage (submitted)Sarwar, A. and R.A. Feddes, 2000. Evaluating drainage design parameters for the FourthDrainage Project,Pakistan by using SWAP model: part II – modeling results, Irrigation and DrainageSystems 14: 281-299
Irrigation performance and drainage effluent, Ricardo Brito Conclusions• Remote sensing can help determining the waterbalance• Remote sensing can determine soil moisture• Remote sensing can describe crop growth and yield• Combination of the above makes it feasibe quantify drainage needs and evaluate
drainage performanceReferencesBandara, K.P.M.S., 2001. Monitoring irrigation performance from satellites: a case
study from Sri Lanka, Agricultural Water Management (in press)Bastiaanssen, W.G.M., R.A.L. Brito, M.G. Bos, R.A. Souza, E.B. Cavalcanti and M.M.
Bakker, 2001. Low cost satellite data for monthly irrigation performancemonitoring: benchmarks from Nilo Coelho, Irrigation and Drainage Systems 15: 53-79
Land and water information systems, Javier Zuleta Conclusions
• Remote sensing detects illegal irrigation activities
• Land use maps can be derived from remotely sensed data to plan water allocations• Additional information on soil and climate is necessary• Costs of very high resolution images (category a) are highReferences
DGI, 1999. Mendoza Province Water Plan, basis and proposals for the concensus of apolicy of state, Government of Mendoza, General Department of IrrigationDGI, 2000. SIPH, Sistema de Informacion para la Planificacion Hidrica de Mendoza,Gobierno de Mendoza, Departamento General de Irrigacion
Leaf Area Index and soil moisture, Jiaguo Qi Conclusions
• Synergy of optical and microwave remote sensing is promising in estimate of soilmoisture

8/3/2019 Remote Sensing for Drainage
http://slidepdf.com/reader/full/remote-sensing-for-drainage 54/54
• Multi-regression has better accuracy in field level than pixel level, and shows moredetails than field survey in higher moisture conditions;
ReferencesSano, E.E., M.S. Moran, A.R. Huette and T. Miura, 1998. C and multiangle Ku-band
synthetic aperture radar data for bare soil moisture estimation in agricultural areas,Remote Sensing Env. 64: 77-90
Qi, J., Y.H. Kerr, M.S. Moran, M. Weltz, A.R. Huette, S. Sorooshian and R. Bryant, 2000.Leaf area indexestimates using remotely sensed data and BRDF models in a semiarid region, Rem.Sens. Env. (in press)Wang, C., J. Qi, M.S. Moran and R. Marsett, 2001. Soil moisture estimation in a semiaridrangeland using ERS-2and TM imagery (submitted)
Soil salinity mapping, Leonardo Pulido Conclusions
• There is a relationship between wheat yield Thematic Mapper bands 2, 3 and 4
(r=0.80)• There is a relationship between of the weighted electrical conductivity of the root zoneand Thematic Mapper bands 2, 3 and 4 (r=0.86)
• Wheat crop can be identified through unsupervised classification techniquesReferencesBrena, J, L. Sanvicente and L. Pulido., 1995. Salinity assessment in Mexico, in (ed.)
Vidal, FAO Water Report 4: 190-1906Pulido, L.M., H.S. Sanvicente, C.Z. Rodriguez and C.L. Wiegand, 1996. Using Landsat
TM and SPOT satellite images to identify salinity in irrigated areas of Mexico, ICID,16th congress, Cairo, Q46-p.21: 52-53
Pulido, M.L, J. Gonzalez-Meraz, B. Robles-Rubio and C.L. Wiegand, 1997. Soil salinitysurveying using satellite imagery and a portable sensor, Proc. of the int.
symposium on sustainable management of salt affected soils in the arid ecosystem,Cairo, Egypt, 21-26 September 1997: 85-96Pulido, L. B. Robles, C.L. Wiegand, J. Gonzalez and H. Sanvicente, 1998. Advances in
the use of remote sensors to detect soil salinity in Mexican irrigation districts, WorldCongress of Soil Science, symp. no. 17, Montpellier, France.
Wiegand, C.L., J.D. Rhoades, D.E. Escobar and J.H. Everitt, 1994. Photographic andvideographic observations for determining and mapping the response of cotton tosoil salinity, Rem. Sens. Of Env. 48: 1-25