remote control and data compression -based … control and data compression -based wireless data...
TRANSCRIPT

Remote Control and Data Compression -based Wireless Data Acquisition System
*Ning ZHAO1), Guoqing HUANG2), Haili LIAO3) and Mingshui LI4)
1), 2), 3), 4) Research Center for Wind Engineering, Southwest Jiaotong University, Chengdu 610031, China
ABSTRACT
The wind field measurement for severe winds such as hurricanes (or typhoons), thunderstorm downbursts and other gales is important issue for wind engineering community (e.g., Balderrama et al. 2011). Although the wind field measurement acquisition in the remote area such as the bridge site in mountain area is addressed by Huang et al. (Huang et al. 2015), it has a need to further improve such a system. In this study, a wireless high-frequency instrumentation system with the functions of remote control and data compression was developed. The system structure and working principle of the collector are presented. Then the features of this newly-developed system are compared with the existing data acquisition systems. Finally, its application to the field is discussed in detail.
1. INTRODUCTION
Over the last decade, more and more information acquisition and remote control
system use a wireless data transmission technology (Otero et al. 2009; Subramanian et
al. 2011). Compared with wired data transmission technology, it has advantages of
wireless collection, easy installation, and moving conveniently. Although existing
wireless collection systems can acquire directly all data from anemometers in distance,
apparently, it may not be very suitable for obtaining the high-frequency fluctuating wind
time history in remote areas due to much data and poor working conditions.
In order to be more convenient and efficient for the measurement of wind field in
remote areas, this paper develops a high frequency wind speed acquisition system with
remote interaction and data compression function. First, the structure and working
1)
Graduate Student 2), 3), 4)
Professor

principles of the system are described in detail. Then, the interactive and data
processing functions and other functions are introduced. Finally, the system is
compared with other existing wireless data acquisition systems.
2. SYSTEM STRUCTURE AND PRINCIPLE
2.1 Overall Layout
The wireless anemometry system mainly includes the collection part and the client
part, as is shown in Fig. 1. Anemometer, collector and power supply device constitute
the collection part. The data from the anemometer is transmitted to the collector by the
RS485 cable. Solar cells are used as a power supply device for the anemometer and
collector. The client part is mainly the cloud server, and other terminal based on the
cloud server, such as mobile phone app, mailbox, etc. The collection part and the client
part are connected through the wireless communication based on GPRS wireless
network between cloud server and collector. Mobile app is mainly used for real-time
monitoring system, waning instructions, etc. The mailbox is mainly used for the user to
obtain the data and other information that can be used directly.
Fig. 1 System structure
2.2 Structure of the Collector
The collector is composed of SCMs (single chip microcomputer) based on
integrated circuit technology, as shown in Fig. 2. It mainly consists of 8 working
elements. In order to obtain the wind speed data that contain the time, clock is
necessary to process the raw data. We need communication transform interface to
switch the format of the data from the anemometer into the format which can be
recognized by the collector. Central processor controls the whole work process. The
“Data CPU” controls the collection, processing and storage of the data, and the
“Transmission CPU” controls the transmission of the data and the monitor of the power.
The two CPUs develop mutual cooperation through internal communication, in order to
avoid disorder of multiple instructions. Internal cache is a place for temporary storage of
data that waits for being transmitted. By using cache, transmission of data becomes
more efficient. Users can know the working condition of the battery in time through
power monitor unit. Memory controller is used to store all the output data from
Anemomet er Col l ect or Cl oud Ser ver
Power Suppl y Devi ce
RS485 GPRS
Spot Par t Cl i ent Par t
Mobi l e APP Mai l box
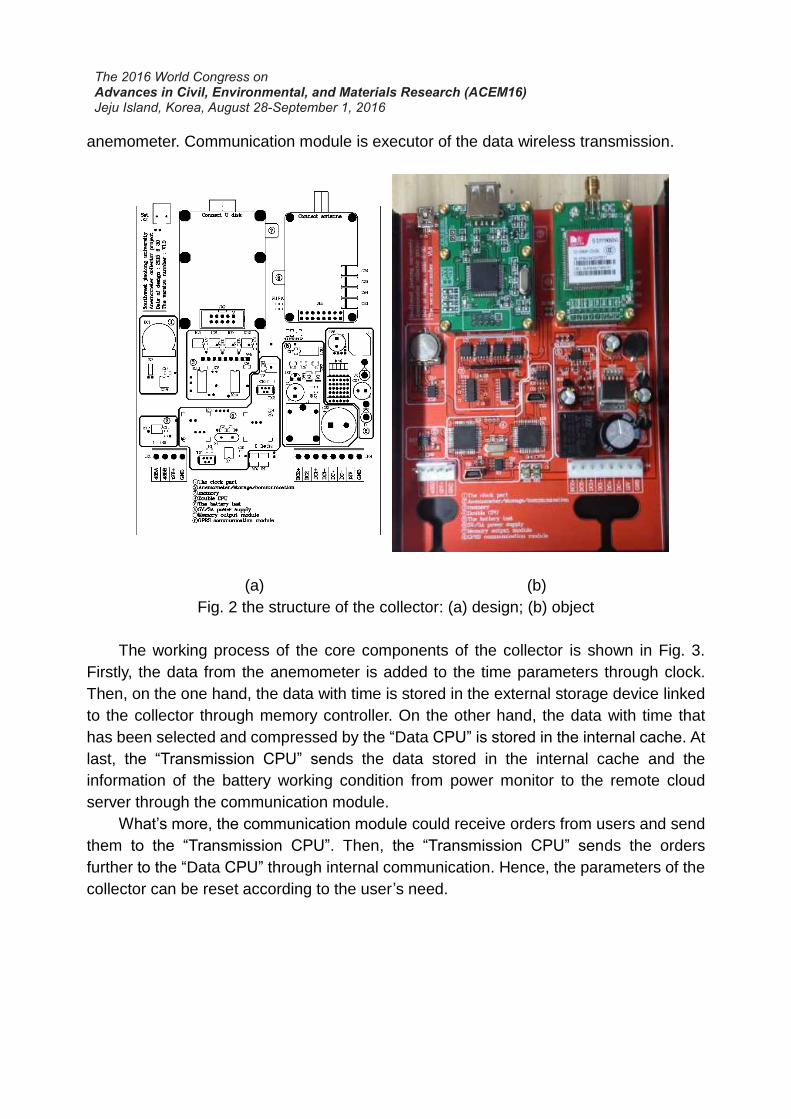
anemometer. Communication module is executor of the data wireless transmission.
(a) (b)
Fig. 2 the structure of the collector: (a) design; (b) object
The working process of the core components of the collector is shown in Fig. 3.
Firstly, the data from the anemometer is added to the time parameters through clock.
Then, on the one hand, the data with time is stored in the external storage device linked
to the collector through memory controller. On the other hand, the data with time that
has been selected and compressed by the “Data CPU” is stored in the internal cache. At
last, the “Transmission CPU” sends the data stored in the internal cache and the
information of the battery working condition from power monitor to the remote cloud
server through the communication module.
What’s more, the communication module could receive orders from users and send
them to the “Transmission CPU”. Then, the “Transmission CPU” sends the orders
further to the “Data CPU” through internal communication. Hence, the parameters of the
collector can be reset according to the user’s need.

Fig. 3 Working principle of the collector
3. MAIN FUNCTIONS OF THE COLLECTOR
In addition to the feature of hardware integration mentioned above, in practical
application, there are also many convenient and practical functions for the collector.
3.1 Interactive Function
As mentioned before, through the communication module of the collector, the data
from the anemometer can be transmitted wirelessly to users’ cloud server. Reversely,
the cloud server can send controlling commands to the collector. They may include the
frequency of collecting data, the minimum wind speed (wind speed threshold), data
items which need to be transmitted, and so on, e.g. see Fig. 4.
Through the interactive function, data that only users need is transmitted, which
greatly extends the range of application of the anemometer system and improves the
efficiency of data transmission.
Fig. 4 Remote controlling interface
♩Dat a CPU
♩Tr ansmi ssi on CPU
♪ I nt er nal Cache
㈜Memor y Cont r ol l er
№Communi cat i on Modul e♬Power Moni t or
↘Cl ock

3.2 Data Compression Function
As mentioned before, we want to obtain the wind speed data that contain time.
Simply, we just add time to the first set of data every second, and the time parameters
include hours, minutes and seconds, all of which are only recorded once. That is to say,
when the adjacent two time parameters have the same hour or minute, the latter will be
omitted. Whatever the collection frequency is, the first set of data per second will be
selected out, so all data with time parameters will be collected by this way, which is
accurate and efficient. As for the date of the data, a document named after the date is
established every day to save the data of the whole day, e.g. see Fig. 5.
(a)
(b)
Fig. 5 Comparison of two methods of adding time parameters (collection frequency:
2HZ): (a) the traditional method; (b) the latest method
As the output data of the Young81000 shown in Fig. 6, each set of data contains
some redundant space characters and the decimal points in some fixed position. These
characters also produce transmission flow, so removing the redundant characters can
reduce the transmission flow, and it doesn’t have any impact on the transmission
results.
Also, according to the characteristics of the output data of the anemoscope, the
transmission of data, combined with the hexadecimal conversion, can be further

reduced. Every two continuous effective digits can be converted to hexadecimal number.
Hexadecimal "1" is used to represent the negative sign, and hexadecimal "0" means
positive sign. The first effective digit of sound velocity must be 3, so it can be ignored.
(a)
(b)
Fig. 6 (a) Remove of redundant characters and (b) hexadecimal conversion
In addition, users can also use interactive function to not transmit the needless data,
which also reduces the transmission flow to some extent. In general, through data
compression and interactive functions, the transmission efficiency is greatly improved,
meanwhile transmission flow reduces clearly.
3.3 Other Functions
Based on the actual needs for users, more convenient and practical functions are
provided. The system generates performance log to ensure that the user can make
appropriate judgments to the received data. Through emergency alarm function, some
emergency or important situations that may occur during the operation of the system will
be notified to users in time. Users can check conveniently real-time wind data and other
information such as the voltage and fault conditions and so on by mobile phone app
function.
4. COMPARISON
There are also many existing wireless acquisition systems to collect high-frequency
fluctuating wind. Last system developed by Huang et al. (Huang et al. 2015) combines
collector with wireless transmission devices, and has been applied to the actual
mountain wind speed measurement. Others are the collector with data transmission

function, such as CR3000 and NI CompactRIO. Tab. 1 compares four existing wireless
acquisition systems, and it shows that the latest acquisition system has been
significantly improved, especially the interactive and data compression processing
functions.
Tab. 1 Comparison of different wireless data acquisition systems
Properties Last system CR3000 NI CompactRIO Latest system
Integration no yes yes yes
Interactive no no good very good
Compression no no no very good
5. CONCLUSIONS
Compared with the existing data acquisition system, this system has obvious
advantages and broad application prospects. Firstly, the field equipment is simple,
portable, and easy to install. Then, the parameters of collector can be easily modified by
the client. Furthermore, it can save resources by efficient transmission. In addition,
mobile App makes the operation more flexible and convenient.
ACKNOWLEDGEMENTS
The supports of the “National 1000 Young Talents (China)” and the Ministry of
Transport of China (Grant No. 201231835250) are acknowledged.
REFERENCES
Balderrama, J. A., Masters, F. J., Gurley, K. R., Prevatt, D. O., Aponte-Bermúdez, L. D., Reinhold, T. A., Pinelli, J. -P., Subramanian, C. S., Schiff, S. D., and Chowdhury, A. G. (2011). “The Florida coastal monitoring program (FCMP): A review.” Journal of Wind Engineering and Industrial Aerodynamics, 99(9), 979-995.
Huang G.*, Peng L., Su Y., Liao H. and Li M. (2015). “A wireless high-frequency anemometer instrumentation system in field measurement.” Wind and Structures, An International Journal, 20(6), 739-749.
Otero, C. E., Velazquez, A., Kostanic, I., Subramanian, C., Pinelli, J. -P., and Buist, L. (2009). “Real-time monitoring of hurricane winds using wireless and sensor technology.” Journal of Computers, 4(12), 1275-1285.
Subramanian, C. S., Lapilli, G., Kreit, F., Pinelli, J. -P., and Kostanic, I. (2011). “Experimental and computational performance analysis of a multi-sensor wireless network system for hurricane monitoring.” Sensors and Transducers, 10, 206-244.