released november 2017 educative assessment …
TRANSCRIPT

EDUCATIVE ASSESSMENT & MEANINGFUL SUPPORT2016 edTPA Administrative Report
Released November 2017

1
Preface and AcknowledgementsedTPA is a performance assessment for initial licensure teacher candidates, which was developed and field tested beginning in 2009 and used operationally since September 2013. This report presents analyses based on teacher candidate performance from January 1st to December 31st, 2016, and complements prior reports that have reviewed the development of the assessment, as previously described in detail in the 2013 edTPA Field Test Summary Report and the 2014 and 2015 edTPA Annual Administrative Reports. The Field Test Report and all Administrative Reports are located in the edTPA Resource Library here.
This administrative report was authored by: Raymond L. Pecheone, Executive Director, Stanford Center for Assessment, Learning and Equity (SCALE); Andrea Whittaker, Director, Teacher Performance Assessment, SCALE; and Heather Klesch, Director, Educator Solutions for Licensing and Learning, Evaluation Systems group of Pearson, with support from Laura Gutmann, SCALE.
SCALE is the sole developer of edTPA, and Stanford University is the exclusive owner of edTPA. The University has a licensing agreement with the Evaluation Systems group of Pearson, to provide operational support for the national administration of edTPA.
The structure of this report and its contents are highly similar to our previous Administrative reports and represent a framework used annually to present edTPA candidate performance data and reliability and validity evidence. The past full reports may be referenced for additional information. The analyses
presented this year mirror those conducted for the 2014 and 2015 Administrative Reports that were reviewed by technical advisory committee (TAC) members and advisors. See Appendix H for a complete list of TAC members. We are grateful to them for their advice and recommendations, which continue to strengthen the analyses of edTPA and inform an ongoing research agenda.
This year’s report includes additional candidate performance data related to demographic variables for length of clinical field placement and program type (e.g., alternative certification). We are very pleased to present these results as a contribution to the research on teacher preparation.
We also are grateful to the early funders of the research and development process, including the Ford Foundation, the MetLife Foundation, the Morgan Family Foundation, the Stuart Foundation, and the Hewlett Foundation. We continue to be grateful for the input and critique of the hundreds of teachers and teacher educators who participated in past handbook and support resource development as design team members, content validation participants, bias and sensitivity reviewers, scorers, trainers, and supervisors as well as Educator Preparation Program (EPP) faculty who have piloted, field tested, and implemented edTPA since 2009.
As developers of edTPA, we welcome all comments regarding this report and its data and will carefully consider such comments as we continue to research, enhance, and improve edTPA as a support and assessment system.

edTPA ANNUAL ADMINISTRATIVE REPORT Data range: 1/1/2016 - 12/31/2016
2
Table of Contents PREFACE AND ACKNOWLEDGEMENTS ........................................................................................................................................................................1
TABLE OF CONTENTS ..................................................................................................................................................................................................2
EXECUTIVE SUMMARY ...............................................................................................................................................................................................4 EDTPA DESIGN............................................................................................................................................................................................................................. 4 EDTPA’S EDUCATIVE PURPOSE – A SUPPORT AND ASSESSMENT SYSTEM ............................................................................................................................................... 5 SCORER TRAINING, MONITORING, AND RELIABILITY OF SCORES ............................................................................................................................................................ 5 VALIDITY EVIDENCE ....................................................................................................................................................................................................................... 6 CANDIDATE PERFORMANCE ............................................................................................................................................................................................................ 6 CONCLUSION................................................................................................................................................................................................................................ 7
INTRODUCTION .........................................................................................................................................................................................................8 BY THE PROFESSION, FOR THE PROFESSION ....................................................................................................................................................................................... 8 ROLE OF THE PARTNERS ................................................................................................................................................................................................................. 8 EDTPA AS SUPPORT AND ASSESSMENT ............................................................................................................................................................................................. 9 STATES PARTICIPATING IN EDTPA .................................................................................................................................................................................................. 12
EDTPA SCORING 2016 .............................................................................................................................................................................................. 13 SCORER TRAINING ........................................................................................................................................................................................................................ 13 EDTPA’S SCORING MODEL ........................................................................................................................................................................................................... 14 REGIONAL SCORING OPTION ......................................................................................................................................................................................................... 15 CANDIDATE SUBMISSIONS, ORIGINALITY, SCORE CONFIRMATION, AND RETAKES ................................................................................................................................... 16
VALIDITY EVIDENCE .................................................................................................................................................................................................. 17 CONTENT VALIDITY AND JOB ANALYSIS ........................................................................................................................................................................................... 17 CONSTRUCT VALIDITY ................................................................................................................................................................................................................... 18 CONSEQUENTIAL VALIDITY ........................................................................................................................................................................................................... 18 CONCURRENT VALIDITY ................................................................................................................................................................................................................ 19 PREDICTIVE VALIDITY ................................................................................................................................................................................................................... 20 INTERNAL STRUCTURE ................................................................................................................................................................................................................. 21

edTPA ANNUAL ADMINISTRATIVE REPORT Data range: 1/1/2016 - 12/31/2016
3
CANDIDATE PERFORMANCE ..................................................................................................................................................................................... 24 OVERALL SCORES ........................................................................................................................................................................................................................ 24 TASK AND RUBRIC SCORES ............................................................................................................................................................................................................. 25 DESCRIPTIVE SUMMARY BY TASK AND RUBRIC .................................................................................................................................................................................... 26 PERFORMANCE BY CONTENT FIELD ................................................................................................................................................................................................ 26 PERFORMANCE BY CONSEQUENTIAL USE ........................................................................................................................................................................................ 27 PERFORMANCE BY DEMOGRAPHIC SUBGROUPS ............................................................................................................................................................................... 28
RELIABILITY EVIDENCE .............................................................................................................................................................................................. 33 INTER-RATER AGREEMENT ........................................................................................................................................................................................................... 33 INTERNAL CONSISTENCY ............................................................................................................................................................................................................... 35
SETTING CUT SCORES USING STANDARD ERROR OF MEASUREMENT ......................................................................................................................... 36
CANDIDATE PASSING RATES ..................................................................................................................................................................................... 36
STATE STANDARD SETTING....................................................................................................................................................................................... 37 EDTPA STANDARD SETTING EVENT OVERVIEW ................................................................................................................................................................................ 37 STATE-BASED PASSING STANDARDS (AS OF THE END OF 2016) ............................................................................................................................................................... 38
CONCLUSION ........................................................................................................................................................................................................... 39
APPENDIX A: INTERNAL STRUCTURE ......................................................................................................................................................................... 41
APPENDIX B: PERFORMANCE BY CONTENT FIELD ...................................................................................................................................................... 44
APPENDIX C: SCORE DISTRIBUTIONS BY CONTENT FIELD ........................................................................................................................................... 47
APPENDIX D: PORTFOLIOS REPRESENTED BY STATE .................................................................................................................................................. 49
APPENDIX E: CONSEQUENTIAL USE BY CONTENT FIELD ............................................................................................................................................. 50
APPENDIX F: ANOVAS AND POST-HOC ANALYSES ..................................................................................................................................................... 52
APPENDIX G: DEMOGRAPHIC SUBGROUPS WITHIN TEACHING CONTEXT ................................................................................................................... 55
APPENDIX H: NATIONAL TECHNICAL ADVISORY COMMITTEE (TAC) ........................................................................................................................... 58
CITATIONS ............................................................................................................................................................................................................... 59
edTPA ANNUAL ADMINISTRATIVE REPORT Data range: 1/1/2016 - 12/31/2016
4
Executive Summary The Stanford Center for Assessment, Learning and Equity (SCALE), the American Association of Colleges of Teacher Education (AACTE), and the Evaluation Systems group of Pearson are pleased to release the 2016 Administrative Report. This report presents candidate performance data from over 35,000 candidates who participated in edTPA during the third full operational year (January 1 to December 31, 2016) and associated analyses affirming reliability of scoring and validity evidence supporting its intended use as a measure of readiness to teach as well as a metric used to inform program approval or accreditation. As in previous years, all analyses and results have been informed and guided by a technical advisory committee of nationally recognized psychometricians, and meet the technical standards for licensure assessments set forth by AERA, APA, & NCME (2014).
SCALE and AACTE commend the 750+ educator preparation programs and alternative route programs in 40 states that contributed to the development and field testing of edTPA and its use since 2009. We also commend the teaching candidates who have engaged with edTPA during the development stages, and since the operational launch in September 2013, as a reflective experience that demonstrates the knowledge, skills, and abilities embedded in their real teaching with real students in real classrooms across the country. Moreover, edTPA was purposefully designed to reflect the job-related teaching tasks that are essential for novice teachers as well as represented in the National Board for Professional Teaching Standards (NBPTS) as it pertains to the skills and competencies attained as part of teacher preparation.
Developed by subject-specific faculty design teams and staff at SCALE with input from hundreds of teachers and teacher educators from across the country, edTPA is the first nationally available, educator-designed support and assessment system for teachers entering the profession. It provides a measure of teacher candidates’ readiness to teach that can inform licensure, accreditation decisions, and program completion. Most
importantly, edTPA is an educative assessment that supports candidate learning and preparation program renewal.
edTPA Design
edTPA is a subject-specific performance assessment that evaluates a common set of teaching principles and teaching behaviors as well as pedagogical strategies that are focused on specific content learning outcomes for P-12 students. SCALE’s extensive Review of Research on Teacher Education provides the conceptual and empirical rationale for edTPA’s three-task design and the rubrics’ representation of initial competencies needed to be ready to teach. The assessment systematically examines an authentic cycle of teaching aimed at subject-specific student learning goals, using evidence derived from candidates’ practice in their student teaching or internship placement. A cycle of teaching, captured by the three tasks that compose an edTPA portfolio, includes:
1) planning,
2) instruction, and
3) assessment of student learning.
Authentic and job-related evidence includes lesson plans, instructional materials, student assignments and assessments, feedback on student work, and unedited video recordings of instruction. Also assessed through the three tasks are candidates’ abilities to develop their students’ academic language and to justify and analyze their own teaching practices.
All 27 edTPA handbooks share approximately 80% of their design, assessing pedagogical constructs that underlie the integrated cycle of planning, instruction, and assessment. The other 20% features key subject-specific components of teaching and learning drawn from the content standards for student learning and pedagogical standards of national organizations. For example, consistent with the National Council of Teachers of Mathematics standards, the elementary, middle childhood, and secondary mathematics

edTPA ANNUAL ADMINISTRATIVE REPORT Data range: 1/1/2016 - 12/31/2016
5
versions of edTPA require candidates to demonstrate subject-specific, grade-level appropriate pedagogy in mathematics. The assessment requires that the central focus of their learning segment supports students’ development of conceptual understanding, procedural fluency, and problem solving/reasoning skills of a standards-based topic; that their lesson design includes mathematics-pertinent language demands and supports; and that assessments provide opportunities for students to demonstrate development of mathematics concepts and reasoning skills.
edTPA’s Educative Purpose – A Support and Assessment System
Unlike typical licensure assessments external to programs, edTPA is intended to be embedded in a teacher preparation program and to be “educative” for candidates, faculty, and programs. Candidates deepen their understanding of teaching through use of formative resources and materials while preparing for edTPA, and the score reports provide feedback on candidates’ strengths and challenges as they move forward into their first years of teaching. For faculty and programs, the various edTPA resources and candidate, program, and campus results can be used to identify areas of program strength and determine areas for curricular renewal (Pecheone & Whittaker, 2016). In addition, the recently developed professional growth plan resource uses edTPA results and other evidence of teaching to inform candidates’ goal setting for induction and the early years of teaching.
Since edTPA launched its first “online community” in 2011, membership has grown to about 9,700 faculty from approximately 750 teacher preparation programs. The website (edtpa.aacte.org) also includes over 170 publicly available materials for various stakeholders. In addition to the website, edTPA offers a National Academy of experienced consultants available to provide professional development to new users and to network in a learning community across the country. Lastly, programs using edTPA are provided with a variety of tools and reporting formats to access, analyze, and make decisions about their own candidate performance data, as well as state and national summary reports.
Scorer Training, Monitoring, and Reliability of Scores
Educators play a critical role in the scoring of edTPA. Over 3,000 qualified teachers and teacher educators now serve as scorer trainers, supervisors, or scorers. Scorers must be P-12 teachers or teacher preparation faculty with significant pedagogical content knowledge in the field in which they score, as well as have experience working as instructors or mentors for novice teachers (e.g., NBTPS teachers). Before becoming an official edTPA scorer, educators must go through an extensive scorer training curriculum developed by SCALE and meet qualification standards demonstrated by scoring consistently and accurately. Once scorers qualify and score operationally, they are systematically monitored during the scoring process (through quality monitoring processes such as backreading, validity/calibration portfolios, and requalification exercises) to ensure that they continue to score reliably.
Scorer reliability was evaluated using several different statistical tests. In a random sample of 2,671 portfolios double-scored independently by two scorers, the scorers assigned either the same or adjacent scores (total agreement) in approximately 95% of all cases. Kappa n agreement rates reveal that scorers tend to assign scores within +/- 1 and rarely assign scores that differ by more than 1 point (overall kappa n reliability = .89). As in 2014 and 2015, all reliability coefficients indicate a high degree of internal consistency of rubrics to the measured construct (readiness to teach). These results are consistent with the Standards for Educational and Psychological Testing (AERA, APA, & NCME, 2014) technical standards for licensure assessments of this type and support the use of edTPA scores as a reliable and valid estimate of a prospective teacher’s readiness to teach.

edTPA ANNUAL ADMINISTRATIVE REPORT Data range: 1/1/2016 - 12/31/2016
6
Validity Evidence
edTPA was developed as an authentic, subject-specific, performance-based support and assessment system of a candidate’s readiness to teach. Following the validity guidelines presented in the Standards for Educational and Psychological Testing (AERA, APA, & NCME, 2014), this report defines the constructs assessed by edTPA and presents evidence that examines its use and interpretations. The validity section reviews sources of validity evidence for edTPA; these include the empirical research and theory on which the development was based; the design process and content development to ensure that the assessment represents the skills, knowledge, and abilities that represent a candidate’s readiness to teach; and evidence based on content and internal structure. Results from a Confirmatory Factor Analyses (CFA) and a polytomous item response theory (IRT) model provide empirical support for the edTPA constructs of planning, instruction, and assessment.
Candidate Performance
This report presents performance data from 35,458 first-attempt officially scored edTPA submissions including average scores and distributions overall by task and by rubric for the entire sample, as well as for each of the 27 individual content fields. The total score, computed as an aggregation of scores on a 5-point scale across 15 rubrics, ranges from 5 to 75 total points. The average edTPA score across 34,786 portfolios from fields with 15-rubric handbooks (including the first 15 rubrics of Elementary Education) was 45.0, with a total standard deviation of 6.9. Performance by task is an aggregation of scores on the 5 rubrics that make up each of the three tasks; these range from 5 to 25 points for each task. Across field testing and operational use, a consistent candidate performance across edTPA teaching tasks has emerged: candidates performed most strongly on the planning task (15.4), followed by the instruction task (14.8) and the assessment task (14.7). This conforms to other studies that have found that learning to evaluate and respond to students’ learning and provide meaningful feedback is one of the more challenging elements of teaching (Black & William, 1998; Otero, 2006; Siegel & Wissehr, 2011); however, these findings show improved performance on each of the three tasks over the years.
Scores across content fields were examined overall as well as disaggregated based on state-wide policy regarding consequential edTPA use, that is, whether or not the results of edTPA are used to make consequential decisions about candidates or programs. Within the 34,786 portfolios from fields with 15-rubric handbooks, 27,319 came from consequential states, and 7,467 came from non-consequential states. The overall mean score for 15-rubric fields for all candidates in states with consequential policy was 45.35 (N of 27,319). Based on the national recommended professional performance standard of 42 (note that to date no state has a cut score of 42), the modeled pass rate for all candidates who submitted an edTPA portfolio in 2016 was 75% across all states, and 77% in states using the assessment consequentially. Note that cut scores vary by state as do passing rates, and to date state cut scores range from 35 to 41. See details in the body of the report for pass rates by cut score.
Due to large differences in sample size, populations represented within the sample, and smaller numbers of total submissions in certain fields, interpretations and comparisons across fields should be approached with caution and should not be generalized across the entire profession.
When submitting an edTPA portfolio for official scoring, the candidate is asked to voluntarily provide demographic information in several categories: gender, ethnicity, teaching placement context (including school location [city, rural, suburb, town]), length of placement, student characteristics (% English learner, % special education eligibility, % free/reduced lunch), program type (traditional or alternative route), education level, and primary language. Portfolios submitted in states that have policy for consequential use of edTPA were used to examine performance by these demographic categories (N of 27,319). These analyses revealed that all demographic variables taken together explained less than 4% of the total variance in edTPA scores. Differences by racial/ethnic group were small, women generally scored more highly than men, and suburban teachers on average scored more highly than teachers in other teaching contexts. Performance differences were found between African American and White candidates, with differences in mean

edTPA ANNUAL ADMINISTRATIVE REPORT Data range: 1/1/2016 - 12/31/2016
7
performance at about one half of a standard deviation. In addition, White and Hispanic candidates had comparable performance, as did those indicating Other for ethnicity and those that declined to answer. Small sample sizes for some groups and differences in group sizes prevent strong generalizations of sub-group performance.
edTPA is committed to providing equal opportunity for all teacher candidates and will continue to explore research in this area as well as monitor candidate performance, scorer training, assessment design, and implementation for any potential sources of differential impact.
Conclusion
As with the Field Test data (2013) and those of the previous Administrative Reports for 2014 and 2015, data presented here are consistent with the technical standards of APA, AERA and NCME (2014) and support the use of edTPA to grant an initial license to pre-service teacher candidates as well as to inform state and national accreditation. The reporting of performance of all candidates who submitted edTPA portfolios in 2016 is presented for all content fields and informs the use of edTPA across states.
As is the case with NBPTS, educative use of a performance-based assessment is more than a testing exercise completed by a candidate. edTPA’s emphasis on support for implementation mirrors the NBPTS use of professional networks of experienced users to assist others as they prepare for the assessment. The opportunities for educator preparation program faculty and their P-12 partners to engage with edTPA are instrumental to its power as an educative tool. The extensive and growing library of resources developed by SCALE, the National Academy of consultants, and state infrastructures of learning communities for faculty and program leaders promote edTPA as a tool for candidate and program learning. As candidates are provided with formative opportunities to develop and practice the constructs embedded in edTPA throughout their programs, and reflect on their edTPA experience with faculty and P-12 partners, they are more likely to internalize the cycle of effective teaching (planning, instruction, and assessment) as a way of thinking about practice—a way of thinking about students and student learning that will sustain them in the profession well beyond their early years in the classroom.

edTPA ANNUAL ADMINISTRATIVE REPORT Data range: 1/1/2016 - 12/31/2016
8
Introduction
By the Profession, for the Profession
Based upon a 25+-year history of assessment development led by Raymond Pecheone and Linda Darling-Hammond, edTPA draws on experiences in developing performance-based assessments including the National Board for Professional Teaching Standards’ (NBPTS) assessments of accomplished veteran teachers, the Interstate Teacher Assessment and Support Consortium (InTASC) Portfolio, and the Performance Assessment for California Teachers (PACT). These portfolio-based designs have stood the test of time and consistently reveal key features of effective teaching. After more than four years of development and analysis, including two years of field testing with more than 12,000 teacher candidates, edTPA was launched operationally in September 2013 as a performance-based assessment to measure the classroom practice of pre-service teacher candidates—to ensure they are ready to teach on day one. The assessment was developed by faculty and staff at Stanford University with leadership by the American Association of Colleges for Teacher Education (AACTE), subject-specific design teams composed of teachers and teacher educators who are subject-matter experts, and substantive advice and feedback from educators nationwide. More than 1,000 educators from 29 states and the District of Columbia and more than 430 institutions of higher education participated in the design, development, piloting, and field testing of edTPA from 2009 to 2013. edTPA has been used operationally to assess teacher candidates since fall 2013 and is now used by over 750 programs in 40 states. edTPA is the first subject-specific, standards-based pre-service assessment and support system to be nationally available in the United States.
Role of the Partners
edTPA was created with input from teachers and teacher educators across the country in a process led by Stanford University’s Center for Assessment, Learning and Equity (SCALE) and supported by AACTE.
Each of the edTPA partners supports edTPA development and implementation in different ways. Stanford University faculty and staff at SCALE developed edTPA and are the sole authors. They receive substantive advice and feedback from teachers and teacher educators. The national design team and individual subject-specific design teams were convened annually to develop and update the handbooks for each of the 27 teaching fields. Design team members included subject-matter organization representatives from higher education and P-12.
As the lead in development, Stanford University exclusively owns all of the intellectual property rights and trademark for edTPA. SCALE is responsible for all edTPA development including candidate handbooks, scoring rubrics and the scorer training design, scorer training curriculum, and materials (including benchmarks), as well as support materials for programs, faculty, and candidates. SCALE also recruits, reviews, trains, and endorses National Academy consultants who act as support providers within the edTPA community (see description below).
AACTE partners with edTPA to support development and implementation, and disseminates resources via edtpa.aacte.org so that teacher preparation programs and faculty using edTPA have the materials they need to support teacher candidates. AACTE also supports the deployment of over 100 National Academy consultants via the website and an online community forum for networking and program assistance.
Stanford University/SCALE engaged Evaluation Systems, a group of Pearson, as an operational partner in March 2011 to make edTPA available to a national educational audience. As the operational partner, Evaluation Systems provides the management system required for multistate use of edTPA, including the infrastructure that facilitates administration of the assessment for candidate registration, submission, scoring, quality assurance, and reporting of results from both national and regional scoring. Evaluation Systems also recruits scorers (who consist of educators from public schools and educator preparation programs), manages the scoring

edTPA ANNUAL ADMINISTRATIVE REPORT Data range: 1/1/2016 - 12/31/2016
9
pool, monitors scoring quality, and provides a delivery platform for the SCALE-developed scorer training curriculum. Evaluation Systems collects and records the scores generated by qualified scorers.
The design framework for edTPA and constructs assessed were established prior to the partnership with Evaluation Systems/Pearson and were informed by earlier experiences and work led by SCALE staff (National Board and PACT). Evaluation Systems was chosen as the operational partner to ensure that edTPA assessment development built by the profession and supported by foundation funds could be scaled up for national use. That is, the Evaluation Systems/Pearson group has no authority or decision-making role in the design and development of edTPA.
edTPA as Support and Assessment
Unlike typical licensure assessments external to programs, edTPA is intended to be embedded in a teacher preparation program and to be “educative” for candidates, faculty, and programs. Candidates deepen their understanding of teaching through use of formative resources and materials while preparing for edTPA, and the score reports provide feedback on candidates’ strengths and challenges as they move forward into their first years of teaching. For faculty and programs, the various edTPA resources and candidate, program, and campus results can be used to identify areas of program strength and determine areas for curricular renewal (Pecheone & Whittaker, 2016).
Summary of resources
Since edTPA launched its first “online community” in 2011, membership has grown to 9,739 faculty from approximately 757 teacher preparation programs who have access to more than 170 resources including candidate handbooks, rubrics, templates, support guides for candidates, local evaluation protocols, retake guidelines, guidelines for supervising teachers, and webinars addressing edTPA constructs such as Academic Language. The website, edtpa.aacte.org, also includes publicly available materials for various stakeholders (for example, video and webinar explanations of edTPA and its
benefits). Materials in the resource library have been downloaded over one million times.
The most commonly downloaded resources include:
Resource Number of Downloads
Understanding Rubric Level Progressions 2017-2018 - Complete Collection
84385
Academic Language Summary Handouts 2017-2018 - Complete Collection
68958
edTPA Administrative Reports 46438 edTPA Handouts to Share with Stakeholders 46425 State Policies & EPP Implementation Support Chart 35636 edTPA FAQ 25257 edTPA Guidance To Supervising Teachers 20054 National Academy of Consultants 18653 Making Good Choices - A Support Guide for edTPA Candidates 2017-2018 - Complete Collection
17207
In addition to the Resource Library for edTPA members, the website also includes an online community platform used by faculty to pose questions or share resources developed locally.
Each year, SCALE revises and updates numerous resources that can be used by candidates and programs not only to provide formative opportunities to develop and practice the features of effective teaching assessed by edTPA but also to help candidates interpret their edTPA performance, and for faculty to understand edTPA results as actionable evidence. Several examples are described here:
• Making Good Choices - For candidates to review as they prepare their portfolios; support guide for navigating edTPA and preparing artifacts and commentaries for submission
• Local Evaluation rubrics & samples - Available to programs/coordinators/faculty who have either completed the online orientation to local evaluation or attended an in-depth local

edTPA ANNUAL ADMINISTRATIVE REPORT Data range: 1/1/2016 - 12/31/2016
10
evaluation workshop. The materials are available through the secure online system and can be used to engage faculty and P-12 partners in examining and providing feedback to candidates.
• Understanding Rubric Level Progressions (URLP) - For programs to use when guiding candidates toward a deeper understanding of what evidence of beginning teacher practice looks like at each rubric level, building across each rubric progression
o Available in 27 versions representing all edTPA handbooks, the resource is highly similar to the Thinking Behind the Rubrics used by scorers who evaluate edTPA portfolios. The URLP is designed to help faculty and candidates understand edTPA expectations.
• Academic Language handouts – Summary handouts for each field with subject-specific examples to support candidates and programs in understanding the academic language components of edTPA (Rubrics 4 & 14)
• Guidance for Acceptable Support - Provides examples of acceptable vs. unacceptable support for programs to provide to candidates. A supplemental resource is also available on the “Educative Use of edTPA Materials” and how they can be examined for formative purposes and faculty/peer feedback.
• Review of Low Scoring edTPAs - Describes common reasons for low performance and how to address them. Provides guidance to inform retakes.
• Retake Guidelines – Describes how to interpret candidate evidence and support candidates in retaking edTPA—includes instructions for resubmission for each task as appropriate
• Professional Growth Plan – A tool for helping candidates integrate edTPA, along with other sources of data, into their professional development plan as a beginning teacher.
National Academy
edTPA’s National Academy of consultants provides onsite professional development and implementation support for programs, states, and regional networks, as well as webinar-based support for individual programs seeking more peer interaction. National Academy members must demonstrate edTPA leadership within a program, have experience leading state or local implementation and/or developing and delivering edTPA-related professional development, and have disciplinary expertise related to national scoring and training. Since the National Academy launched in early 2015, over 100 consultants are part of the academy, and over 175 workshops and events have been supported.
Common workshop topics include:
• General introduction to edTPA
• “Deep-dive” handbook and rubric walk-throughs
• Preparation for local evaluation
• Curriculum inquiry
• Academic language
• P-12 support
• Candidate support
• Leading faculty in a change process
SCALE collects feedback from each workshop to inform continual improvement of the National Academy, which is intended to be an adaptive and responsive resource addressing programs’ evolving needs.
Semi-Annual Summary Reports
edTPA Summary Reports are made available to Educator Preparation Programs (EPPs) and state agencies on a biannual basis (January and July) to assist them in examining the performance of their candidates as compared to the population of candidates taking edTPA within the associated state and

edTPA ANNUAL ADMINISTRATIVE REPORT Data range: 1/1/2016 - 12/31/2016
11
nationally. The reports provide analyses at three levels for the date ranges referenced:
edTPA National Performance Summary
Provides a summary that represents national-level data for candidates scored and reported within the stated date ranges. Programs who have received edTPA official data in these date ranges will receive this summary.
edTPA State Performance Summary
Provides a summary that represents state-level summary data for candidates who indicated they were prepared in the state, and were scored and reported within the stated date ranges. Programs who have received edTPA official data in these date ranges will receive this summary for their respective state.
edTPA EPP Performance Summary
Provides a summary that represents program-level summary data for candidates who indicated they were prepared at the specific program, and were scored and reported within the stated date ranges. Programs who have received edTPA official data in these date ranges for candidates preparing at the program will receive this summary for their program.
All summary reports contain: a) mean edTPA scores, total and by rubric, b) distributions of total scores, and c) rubric means and distributions for each field. In addition to the three summary reports, EPPs are provided a spreadsheet or roster that provides official scores by rubric as well as total scores by task and overall for each candidate who indicated they were prepared by the program and was officially scored and reported during the stated date ranges. The report allows the EPP to easily analyze performance by subject area, cohort, or other program features.
EPPs utilizing the data are also provided with a detailed table of contents and suggested questions to guide conversation about each part of the reported data. Examples of questions include: “What do the data show in terms of teacher candidates’ understandings and professional performance? What are the implications for our program in terms of what and how we teach?” SCALE encourages programs utilizing the data to connect numerical trends to local evaluation of candidate portfolios.
edTPA National Condition Code Report
A National Condition Code Report is available annually to provide programs with more information to inform curriculum and knowledge of current trends in edTPA submissions. The report summarizes the condition codes that were applied during the operational year, providing the frequency of condition codes by field and by condition code reason. In order for a candidate’s edTPA submission to be scored, it must meet assessment Submission Requirements. If a submission does not meet the requirements and the submission or portions of the submission are unable to be evaluated by a scorer, a “Condition Code” will be assigned indicating the requirement(s) that have not been met for that particular rubric. Condition codes are assigned when materials do not meet the submission guidelines (e.g., wrong file format, file is unreadable, video has been edited). The Submission Requirements provide examples of reasons why a particular condition code may be assigned. The most recent Condition Code Report identified that the total number of portfolios assigned one or more condition codes cumulatively represents about 5% of total edTPA submissions.
These reports are critical to building understanding and discussion about edTPA, and for this reason, SCALE strongly encourages EPPs to share these data with all participating faculty and P-12 partners to celebrate candidate success and as part of ongoing program renewal conversations.

edTPA ANNUAL ADMINISTRATIVE REPORT Data range: 1/1/2016 - 12/31/2016
12
Evaluation Systems/Pearson Supports
Pearson (through edTPA.com, the candidate-facing program website) provides operational assessment services associated with registration, scoring, and reporting of edTPA scores. Assessment services include use of the technology platform that registers the candidate, receives the portfolio, coordinates the logistics of scoring the portfolio, and reports the results to the candidate. Additionally, a faculty feedback feature is available through the Pearson Portfolio system, allowing candidates to request formative feedback from a designated faculty member based on SCALE’s guidelines of acceptable support. Assessment services also include the recruiting and management of qualified educators who serve as scorers, scoring supervisors, or trainers. Scorers are trained using a training curriculum developed by SCALE, specifically for use with edTPA rubrics. Scorers use standardized scoring procedures and are calibrated and monitored during scoring. Pearson also works with EPPs and state agencies to securely report candidate scores as appropriate. Through the ResultsAnalyzer tool, stakeholders are able to review and utilize their data sets as provided on each reporting date.
Pearson also provides fee waivers in the form of financial hardship vouchers to eligible candidates. Since September 2013, over 3,900 fee waivers have been made available to candidates. Waivers are provided directly to State Agencies and/or EPPs who then distribute them based on student need.
States Participating in edTPA
The map below shows the states currently participating in edTPA as of April 2017, signaling those with an edTPA implementation policy in place and those expecting to have an implementation policy in place soon. Visit edTPA online at http://www.edtpa.aacte.org/ for up-to-date information on states and their policies.

edTPA ANNUAL ADMINISTRATIVE REPORT Data range: 1/1/2016 - 12/31/2016
13
edTPA Scoring 2016 Over 3,000 teachers and teacher educators now serve as trainers, scoring supervisors, or scorers of edTPA as part of the National Scoring Pool. Scorers must be P-12 teachers or teacher preparation faculty (including adjuncts and clinical supervisors) with significant pedagogical content knowledge in the field in which they score, as well as experience working as instructors or mentors for novice teachers. In the 2016 administrative year (January 1st, 2016 – December 31st, 2016), recruitment goals targeted a balance of scorers with approximately 50% teacher educators and 50% classroom teachers. Of these qualified scorers, 25% of the practicing classroom teachers and 18% of the qualified scoring pool are National Board-certified teachers.
Scorer Training
Before becoming an official edTPA scorer, educators must go through an extensive scorer training curriculum and meet qualification standards. All scorer training materials are authored or reviewed by SCALE. Training for scorers comprises both individual online and interactive group sessions, totaling about 20 hours. The individualized training includes a series of modules that orient scorers to the tasks, rubrics, and scoring system, and provides numerous opportunities to identify and evaluate evidence for each rubric. After completing the individual portion of the training materials, scorers independently score a sample edTPA portfolio coded by experienced scorers and trainers and then review evidence and score justifications in that content area. Following the independent sample scoring of a practice portfolio and explanations for score justifications, scorers must consistently score two qualifying portfolios within calibration standards before becoming fully qualified to score.
Low-Incidence Fields:
The following fields have low candidate volumes and follow a slightly modified training plan that includes several online modules and the completion of up to four training/qualification portfolios with the additional
requirement to meet with the trainer to discuss the results prior to moving to the next portfolio:
1. Agricultural Education 2. Business Education 3. Family and Consumer Science 4. Health Education 5. Library Specialist 6. Technology and Engineering Education
Consensus Fields:
1. Classical Languages
2. Education Technology Specialist
3. Literacy Specialist
Consensus fields have very low candidate volumes. Both training and scoring are completed using a Consensus model. Consensus scoring consists of a process whereby two or three scorers meet with a trainer/facilitator to score the same portfolio and to arrive at a consensus score for each rubric. New scorers participate in the consensus sessions and then meet with the trainer to review their results. It is the trainer’s decision when the scorer becomes a qualified scorer. Following the training, fully qualified, active scorers in all fields are monitored by their supervisors through a back-reading process and routinely score previously scored “benchmark” portfolios to ensure they are applying scores accurately and consistently.
Scorers are recruited, trained, and qualified to score in two scoring pools—national and regional (see additional information in the “Regional Scoring Option” section below). The national pool includes qualified scorers who access and score portfolios submitted from across the country. In the regional scoring pool, qualified faculty from preparation programs (in implementing states where regional scoring is an accepted scoring model) score a sample of their program’s own candidate portfolios. Regional scorers

edTPA ANNUAL ADMINISTRATIVE REPORT Data range: 1/1/2016 - 12/31/2016
14
complete the same training and qualify using the same criteria before scoring, and have the same quality monitoring and scoring consistency requirements as those scoring in the national pool. Additionally, portfolios scored by regional scorers are double scored by the national pool.
Each edTPA scorer is assigned to score portfolios at the grade-level span and subject area for which he or she has qualified. The scorer utilizes a secure online scoring platform to access each candidate’s materials and determines the rubric scores after viewing all evidence from artifacts, commentaries, and video recording(s) submitted by the candidate. Drawing upon SCALE’s theory of action from PACT that examined the benefits of understanding the interrelationships within a cycle of effective teaching, each scorer scores an entire candidate submission (rather than independent scorers of discrete tasks or rubrics). As a result, the scorer can effectively review the entirety of a candidate’s teaching evidence and ensure the components are appropriately interrelated. The scorer evaluates how the candidate plans to support subject-specific student learning, enacts those plans in ways that develop student learning, and analyzes the impact of that teaching on student learning.
Guided by 15 analytic rubrics (five rubrics within each of the three assessment tasks) that use a five-point scale, the scorer assesses the extent to which—and the areas in which—the candidate is ready to teach, as well as any particular areas for improvement. The total possible scores on edTPA for fields with 15 rubrics, added across all 15 rubrics, range from 15 to 75 points.
edTPA’s Scoring Model
Overview of the edTPA Scoring Model:
• Scorers evaluate the entire portfolio. • Rubric scores are on a five-point scale; rater agreement is evaluated
by exact and adjacent scores. • Scoring model: currently about 30% of portfolios are double scored,
for two reasons: 1. 10% of portfolios are randomly selected for reliability reads OR
2. The portfolio lies within the double scoring band around the state or national cut score.
• Inter-rater reliability is calculated by examining the double scored portfolios cited under #1 above (10% reliability reads).
• If a portfolio score falls within the double scoring band (a band calculated based on the standard error of measurement around a state cut score or the national recommended professional performance standard), it is scored by a second scorer.
• Double scored portfolios can be read by a scoring supervisor (a third “chief” scorer) for rubric score resolution, or for portfolio score adjudication. o Resolution: If Scorer 1 and Scorer 2 are discrepant (i.e., more
than 1 score point apart) on any rubric, the portfolio is resolved by a scoring supervisor. The supervisor score is reported for the discrepant rubrics.
o Adjudication: If Scorer 1 and Scorer 2 are on opposite sides of the national recommended professional performance standard, the portfolio is adjudicated by a scoring supervisor who scores the entire portfolio. The scoring supervisor scores are reported to candidates.
• If a portfolio is double scored and does not need resolution or adjudication, then the average of Scorer 1 and Scorer 2 is reported to the candidate.
• If a portfolio is double scored and has 5 or more adjacent scores, the portfolio is scored by a scoring supervisor, whose scores are reported to the candidate.
The double scoring procedures increase the decision consistency of the final scores assigned to edTPA candidates. In all such cases the final score is based on at least two scorers who agree on the decision in relation to the state cut score or the national recommended professional performance standard. Ideally, decisions of the two scorers on each of the 15 rubrics would be the same across the portfolio. However, in practice, the high complexity of teaching and 15 different decisions by rubric may result in a difference in total scores across two raters. Evidence of high total agreement (the rate at which scorers assign the same or adjacent scores) presented in

edTPA ANNUAL ADMINISTRATIVE REPORT Data range: 1/1/2016 - 12/31/2016
15
the “Reliability” section of this report supports the consistency of edTPA scores.
Scoring for edTPA occurs year-round, with results typically reported approximately every two weeks. Given this ongoing scoring model (as contrasted with a single, event-based scoring session), scorer quality monitoring is in place on a constant basis. Facets of the quality management of scorers include:
• Validity Portfolio Performance: Validity portfolios are benchmarked portfolios (i.e., calibration exercises) that are randomly sent to scorers to evaluate scorer performance. Approximately 10% of the portfolios a scorer sees are validity portfolios.
• Inter-Rater Reliability: As described above, 10% of portfolios are randomly double-scored to monitor agreement rates amongst scorers.
• Monitoring after Initial Qualification: All newly qualified scorers are backread by a scoring supervisor. All scorers are flagged for backreading after they have scored their first portfolio.
• Scoring Rate: Scorers are monitored to ensure they are not scoring too quickly or too slowly, which may impact quality. On average, a portfolio is scored in 2-3 hours. A scorer’s average scoring rate per portfolio cannot not exceed or fall below edTPA program thresholds.
• Excessive Scoring: Scorers are not permitted to score an excessive number of portfolios in a designated time period.
• Portfolio Limits: The edTPA program limits the number of portfolios in each subject area that any individual scorer may score during a specific timeframe.
• Backreading: Scorers are systematically monitored by their supervisors through a backreading process that ensures they are applying scores accurately and consistently. Backreading is defined as supervisors scoring a previously scored portfolio for the purpose of reviewing the original scoring and providing feedback to the scorer. During backreading, a scoring supervisor applies scores and
identifies key evidence to support the scores. After applying scores, supervisors review scores from the original scoring and review backreading scores with feedback to the original scorer.
• Period of Inactivity: Inactive scorers (those who have not scored within 120 days) need to score a complete benchmarked portfolio as a re-qualification exercise in order to remain calibrated to edTPA rubrics and prior to returning to score.
Regional Scoring Option
Faculty engagement in the scoring of edTPA portfolios is an ideal way to deepen and sustain an understanding of candidate performance and educative implementation. In addition to faculty participation as scorers in the national official scoring outlined above, EPPs can participate in regional official scoring, wherein faculty are able to officially score portfolios from their own campus or region. This option provides faculty with additional opportunity to directly serve their candidates.
Regional scorers complete the same training and qualify using the same criteria as all official scorers before scoring, and have the same quality monitoring and scoring consistency requirements as those scoring in the national pool and as described above. edTPA regional scoring is conducted in accordance with all quality standards in place for national scoring, to ensure that the levels of service and quality of the national program are maintained. These quality standards refer to both the actual scoring statistics and figures, as well as scorer training quality protocol. Scorers observe all conditions and requirements for training and qualification, as well as of confidentiality and self-recusal for personal knowledge of the candidate.
The regional scoring option was piloted in spring 2015 in California and was made available to all edTPA Implementation Members in a second comprehensive pilot phase in spring 2016, in order to establish processes for a broad-based implementation of edTPA regional scoring. Further piloting was conducted in spring 2017, and based on the results of this pilot, the regional scoring option is being offered with scoring occurring in spring 2018.

edTPA ANNUAL ADMINISTRATIVE REPORT Data range: 1/1/2016 - 12/31/2016
16
The EPP will play a primary role in the management and implementation of regional scoring on their campus. The number of faculty from the EPP who complete scorer training and qualify will determine the number of portfolios that can be identified for regional scoring at the location during specified scoring windows.
It is hoped that regional scoring will offer EPPs additional opportunities to build faculty capacity to support prospective teachers as well as become more engaged and knowledgeable about edTPA handbooks, the scoring process, and performance of candidates.
Candidate Submissions, Originality, Score Confirmation, and Retakes
At the time of the submission, edTPA candidates are required to attest to the originality of their work, including confirmation that the candidate is sole author of the commentaries and other written responses to prompts and other requests for original information in this assessment, and that the candidate has appropriately cited all materials in the assessment whose sources are from published text, the Internet, or other educators. Pearson uses a well-established and reliable software platform to screen submissions for originality of content. Submissions that are flagged as a result of initial screening are subject to additional review and investigation in coordination with individual IHEs or state, as appropriate. In some cases, the release of a candidate’s edTPA results may be delayed as the result of an administrative review. An administrative review may occur for several reasons, including confirmation that a submission meets all requirements and is in compliance with the rules of assessment participation.
Following score reporting, if a candidate believes that one or more of their scores has been reported in error, they may request a score confirmation. The score confirmation process involves having a supervisor or trainer who did not serve as one of the original scorers review the original reported scores to confirm that they are accurate. As the supervisor or trainer conducts their review, should there be a score with which the supervisor or trainer disagrees, they rescore the entire portfolio and provide the updated rubric scores.
If the score confirmation process results in a score alteration, the candidate is issued an updated Score Profile, the score confirmation fee is refunded, and the candidate’s records is updated. If the original score is confirmed as a result of the score confirmation process, the candidate is sent a letter indicating that their score has been confirmed, and the score confirmation fee is not refunded.
Candidates who do not meet their educator preparation program or state requirement may retake the assessment by choosing from either retaking the full assessment or retaking single or multiple tasks. The edTPA Retake Instructions for Candidates provide important information on the process of retaking and materials necessary for a retake submission.

edTPA ANNUAL ADMINISTRATIVE REPORT Data range: 1/1/2016 - 12/31/2016
17
Validity Evidence According to the Standards for Educational and Psychological Testing (AERA, APA, & NCME, 2014) and leading psychometric experts (Bell et al., 2012; Haertel, 2008; Haertel & Lorié, 2004; Kane, 2006; Sheppard, 1993), the process of validation begins with defining the intended purpose of the assessment and the constructs being measured. The inferences made by this definition are then examined using various sources of validity evidence that may support the interpretation and use of scores. edTPA was developed to be an authentic, subject-specific, performance-based support and assessment system of a candidate’s initial readiness to teach. The following section of the report presents the inferences made by this purpose and use of edTPA, followed by evidence that evaluates the validity of proposed score interpretations.
Content Validity and Job Analysis
edTPA was designed following standards for credentialing exams, and intended to be used as an assessment of the knowledge, skills, and abilities necessary for beginning teaching. According to the Standards for Educational and Psychological Testing (AERA, APA, & NCME, 2014), “validation of credentialing tests depends mainly on content-related evidence, often in the form of judgments that the test adequately represents the content domain associated with the occupation or specialty being considered.” The AERA, APA, & NCME Standards (2014) indicate that, “To identify the knowledge and skills necessary for competent practice….A wide variety of empirical approaches may be used, including the critical incident technique, job analysis, training needs assessments, or practice studies and surveys of practicing professionals.” Building on the foundation of NBPTS, PACT, and InTASC, the development of the edTPA rubrics was informed by a combination of content validation and job analysis activities and information. The information obtained through these activities is a key contributor to validating edTPA as an effective, authentic instrument that can be used for teacher licensure decisions. The review by teachers and teacher educators provided statistical data to support edTPA as a highly representative tool in
measuring candidates’ knowledge and skills needed to perform on the job as a novice teacher. The data support edTPA as an evaluation tool for both pedagogical and subject-specific knowledge and skills, which, together with other measures of teacher competence, form the basis of what teacher candidates must possess starting on day one of their professional career.
To further support the content validity findings in 2013, a confirmatory job analysis study was conducted to support the job-related validity of edTPA by drawing upon the list of Knowledge, Skills, and Abilities (KSAs) that were identified by educators, faculty, and subject-matter experts during the edTPA development process. Subject-matter experts for edTPA, composed of teachers and/or educators who train those entering the profession, generated the following list of KSAs:
1. Planning for content understanding
2. Planning to support varied student needs
3. Planning assessments to monitor and support student learning
4. Demonstrating a positive and engaging learning environment
5. Engaging students in learning
6. Deepening student learning while teaching
7. Subject-specific pedagogy
8. Analyzing student work
9. Providing feedback to guide learning
10. Supporting students’ use of feedback
11. Using knowledge of students to inform planning
12. Analyzing teaching
13. Using assessments to inform instruction

edTPA ANNUAL ADMINISTRATIVE REPORT Data range: 1/1/2016 - 12/31/2016
18
14. Identifying and supporting language demands
15. Using evidence of language use to support content understanding
These edTPA KSAs served to inform refinements to the design and development of edTPA. The assessment instruments’ tasks and scoring rubrics directly align to these KSAs. As a form of confirmatory evidence, job analysis activities were conducted to examine the links between these KSAs and teachers’ actual work. The job analysis confirmation serves as evidence supporting the validity of the interpretations made based on the edTPA results.
Through this process the 15 core edTPA rubrics were confirmed as representing knowledge, skills, and abilities that are judged to be important or critically important to perform the job of a teacher as represented on the job-related survey.
For a full overview of the Content Validity and Job Analysis evidence gathered in edTPA development, please refer to past Administrative Reports.
Construct Validity
Based on this foundation and design process, edTPA is a subject-specific performance assessment that evaluates a common set of teaching principles, teaching behaviors, and pedagogical strategies. The rubrics of the assessment are divided into three tasks that assess the integrated cycle of planning, instruction, and assessment that underlies teaching. Exploratory Factor Analyses (EFA) of 2013 field test data provided support for the common underlying structure of edTPA that unifies all rubrics, as well as for the three-task structure (see pg. 22 of the 2013 edTPA Field Test Summary Report). Confirmatory Factor Analyses (CFA) as well as a Partial Credit IRT model are conducted annually, and results from portfolios submitted in 2016 are described in the “Internal Structure” section below. Each year, these models have confirmed that the tasks are measuring a common unifying teaching construct and that there are three common latent constructs (planning, instruction, and assessment) that are appropriately assessed by
the rubrics that make up each of the three tasks. These analyses confirm the intended design and structure of edTPA and provide evidence that edTPA scores measure key job-related teaching skills that are used to evaluate a candidate’s overall readiness to enter the profession of teaching.
In addition to the evidence presented in the Field Test Summary Report and described above, the edTPA Review of the Research, developed by SCALE staff with input from educators and researchers, is a resource that identifies foundational research literature that informed the development of edTPA and ongoing validity research. The extensive literature review cited provides a foundation for the common edTPA architecture used across 27 different subject-specific licensure/certification areas and the fifteen shared rubric constructs that define effective teaching. The document includes foundational texts in the field relevant to each performance task (planning, instruction, and assessment) and rubrics. The studies cited provide an empirical examination of the constructs including reviews that summarize the state of the research evidence in that field, and professional papers, chapters, and books that make research-based recommendations for practice. The first section of the review presents relevant literature and research that speaks to the role of assessment in teacher education and student learning. The following sections are organized according to the three edTPA tasks (planning, instruction, and assessment), and by rubric within each task, and provide a strong basis for the teaching competencies used in edTPA.
Consequential Validity
edTPA is intended to be embedded in a teacher preparation program as an educative tool and support system for candidates, faculty, and programs. Evidence of validity, then, must come from examining how use and implementation of edTPA impact program curricula, faculty, and teacher candidates.
Numerous scholars have outlined the benefits of high-quality formative performance assessment and the opportunities for improvement that common standards, experience of implementation, and use of data gathered

edTPA ANNUAL ADMINISTRATIVE REPORT Data range: 1/1/2016 - 12/31/2016
19
can provide (e.g., Darling-Hammond, 2010; Darling-Hammond & Falk, 2013; Pecheone & Chung, 2006; Peck, Gallucci, Sloan, & Lippincott, 2009; Peck, Singer-Gabella, Sloan, & Lin, 2010; Sato, 2014).
Several studies have now verified these claims using their experience with edTPA as well as PACT, the precursor to edTPA that shares the same architecture and assesses many of the same constructs. Reports by these programs indicate that thoughtful integration of PACT/edTPA knowledge, skills, and constructs into pre-service preparation programs has improved the content, methods, and supports of program curriculum (Fayne & Qian, 2016; Gillham & Gallagher, 2015; Himangshu-Pennybacker & Fuller, 2017; Lahey, 2017; Pecheone & Whittaker, 2016; Peck & McDonald, 2013; Sloan, 2013). The use of PACT and edTPA has been reported to support program improvement and inquiry; collaboration within and between institutions around program structure, practice, and quality; as well as reflection on teacher candidates’ performance and needs (Chung, 2008; Cochran-Smith, et al., 2016; Darling-Hammond & Hyler, 2013; Kleyn, Lopez, & Makar, 2015; Liu & Milman, 2013; Meuwissen, Choppin, Cloonan & Shang-Butler, 2016; Peck, Gallucci, & Sloan, 2010; Ratner & Coleman, 2016; Sloan, 2013; Stillman, Anderson, Arellano, Lindquist Wong, Berta-Avila, Alfaro, & Struthers, 2013).
edTPA enables programs to clearly communicate expectations to students, and to engage in conversations and collaborations across programs and institutions using a common language. These studies also report some challenges or unintended consequences experienced by programs, faculty, and candidates as they work to integrate edTPA requirements into existing practice and navigate the pressures that come with high-stakes policy—findings that are well documented in student assessment. However, edTPA was designed as a support and an assessment program and targeted attention to capacity building and implementation was explicitly built into the system to help mitigate the high-stakes use of edTPA—from a system of compliance to a system of inquiry.
Policy and approach to implementation play important roles in the impact of the assessment on the program and the teacher candidates’ experiences (Cochran-Smith, et al., 2016; Meuwissen, Choppin, Cloonan & Shang-Butler,
2016; Peck, Gallucci, & Sloan, 2010; Whittaker & Nelson, 2013). A recent study has found that candidate engagement with these opportunities to learn implicit in the process of taking edTPA is mediated by the attitudes and actions of faculty, cooperating teachers, and field supervisors (Lin, 2015). Evidence supports the inference that despite challenges and workload, teacher candidates report that constructing their PACT/edTPA portfolios has expanded their understanding of pedagogy and assessment of student learning and caused them to reflect more deeply on their instruction, and that they expected this experience to be useful to their future practice (Chung, 2008; Darling-Hammond, Newton, & Chung Wei, 2013; Himangshu-Pennybacker & Fuller, 2017; Lin, 2015).
Concurrent Validity
Evidence of concurrent validity examines the inference that edTPA scores accurately reflect a candidate’s readiness to teach by testing whether total scores are related to other indicators of instructional capability. Empirical examinations of this type of evidence require datasets with a substantial sample size that include variables from various measures of performance, as well as variables that allow for the control of other sources of variance such as demographic categories and prior skills and knowledge. These studies are now beginning to emerge: a study from Illinois State University has found that candidates’ edTPA scores correlate with GPA, scores on a content knowledge assessment, and scores on a pedagogy and skills assessment (Adkins, Klass, & Palmer, 2015). Findings presented later in this report also indicate that demographic variables are not associated with differences in edTPA scores. Another study that focused on supervisors’ predictions about their candidates’ performance on PACT found that these predictions accurately predicted PACT scores (Pecheone & Chung, 2006). As programs gather more data, several studies around the country are being conducted that will add to this collection of evidence. SCALE is currently working on a state-wide concurrent validity study with the state of Georgia to examine the relationship between edTPA scores and other markers of performance completed during pre-service teacher preparation that can provide evidence of convergent and divergent validity, as well as interactions with demographics, program type, and degree type. Dissemination of these

edTPA ANNUAL ADMINISTRATIVE REPORT Data range: 1/1/2016 - 12/31/2016
20
results as they become available will inform all programs and states working with teacher candidates taking edTPA.
Predictive Validity
Licensure assessment is designed to assess core skills and abilities in teaching and learning that are aligned to professional standards, research, professional practice, job-related skills, and wisdom of practice. Predictive validity studies (routinely conducted after the assessment has been in operational use for several years) provide another method of validating the use of edTPA scores as markers of readiness to teach by examining their ability to predict student learning and instructional practice on the job. However, we must exercise caution in not narrowing and marginalizing effective teaching. While valuable, current predictive validity studies do not always address the relationships of preparation with other known measures of teacher effectiveness (teacher evaluation, impact of mentoring, impact of culturally relevant pedagogy, etc.). Finally, licensure testing is a threshold measure (i.e., a demonstration of a minimum competency to be ready to teach), as contrasted with a highly effective teacher that could impact student learning, which is a demonstration of a much higher bar than entry level performance. SCALE encourages conducting predictive validity studies as part of a comprehensive study of teaching, when individual candidate data is available and able to be shared at the state level. There are limitations to the data as based on a state’s ability to match prospective teachers with their teaching assignments.
Predictive validity evidence for PACT was revealed in a study by Darling-Hammond, Newton, & Chung Wei (2013), which found that teachers’ PACT scores predict growth in their students’ math and literacy achievement using value-added statistical modeling. Preliminary data from studies by Benner and Wishart (2015) has revealed that edTPA scores predict candidates’ ratings of teacher effectiveness, as measured by a composite score that combines students’ performance data and classroom observations. More recent data reported at the May and August 2016 meetings of the Tennessee Board of Education subcommittee on educator preparation and licensing demonstrated that candidates with higher scores on edTPA were also more
likely to have higher ratings on the TN teacher evaluation system, which includes supervisor observation evidence and student learning measures.
Further, a recent study by Goldhaber, Cowan, and Thoebald (2016) used teacher candidates’ scores on edTPA (from the field test and first operational year) to provide estimates of the extent to which edTPA performance is predictive of the likelihood of employment in the teacher workforce and value-added measures of teacher effectiveness. They found that edTPA scores were “highly predictive of employment in the state’s public teaching workforce, and evidence on the relationship between edTPA scores and teaching effectiveness was mixed. Specifically, continuous edTPA scores are a significant predictor of student mathematics achievement, but when edTPA was a binary screen of teaching effectiveness (i.e., pass/fail), passing edTPA was significantly predictive of teacher effectiveness in reading but not in mathematics.” These results are consistent with VAM studies conducted on the National Board.
In addition, the Education Policy Initiative at Carolina (EPIC), in partnership with the UNC General Administration and the 15 UNC system institutions engaged in teacher preparation, has established and is continuing a body of research to assess the construct validity, reliability, and predictive validity of both locally and officially evaluated edTPA portfolios. This work initiated with analyses of locally evaluated TPA portfolios from the 2011-12 graduating cohort at one UNC system institution (Bastion, Henry, Pan & Lys, 2016).
In fall 2016, EPIC produced a policy brief (summarizing edTPA implementation in North Carolina, detailing how UNC system candidates are scoring on edTPA and assessing the construct validity and predictive validity of officially scored portfolios (Bastian, Henry, & Lys, 2016). These predictive validity analyses focus on the 2013-14 graduating cohort of one UNC system institution who went on to be first-year teachers in the 2014-15 school year. Importantly, these predictive validity analyses focus on first-year teachers’ value-added estimates and evaluation ratings. Overall, these predictive validity results show that edTPA measures significantly predict first-year teacher performance. Concerning teacher value-added, 7 of 15 edTPA rubrics are significantly associated with a standardized measure of

edTPA ANNUAL ADMINISTRATIVE REPORT Data range: 1/1/2016 - 12/31/2016
21
teacher effectiveness; summatively, the standardized edTPA total score and having a total score of 42 or greater also predict significantly higher value-added estimates. Regarding teacher evaluation ratings, the edTPA Instruction construct predicts significantly higher evaluation ratings on 4 of 5 teaching standards; the Assessment construct predicts significantly higher evaluation ratings on 2 of 5 teaching standards. At the edTPA rubric level, many rubrics, particularly in the Instruction construct, predict significantly higher evaluation ratings. Lastly, the two summative edTPA measures—the standardized total score and scoring at 42 or greater—predict significantly higher evaluation ratings for 3 of 5 teaching standards. More data are needed—from additional universities and graduating cohorts—to replicate these results.
Likewise, in fall 2016, EPIC released a working paper that illustrates a two-pronged empirical framework—latent class analysis and predictive validity analyses—that teacher preparation programs can use to analyze their edTPA data for program improvement purposes (Bastian & Lys, 2016). With new consequential policy for edTPA and expanding use in North Carolina—including several universities that have edTPA scores beginning with their 2014-15 graduating cohort—EPIC will continue analyses of the most recent data by academic year throughout 2017. These analyses, expected in 2018, will assess the predictive validity of officially evaluated edTPA portfolios from multiple UNC system institutions.
As mentioned above, predictive validity studies focus on first-year teaching because it is not possible to analyze predictive validity during clinical practice, as candidates are not the teacher of record during this time. Additionally, analyzing these relationships requires gathering data on a sample that is large enough to determine consistent, generalizable patterns (as with the UNC and Goldhaber studies). Once candidates become teachers of record, the examination of predictive validity is more robust if researchers are able to follow candidates into their teaching practice for several years in order to obtain more stable estimates of student learning and teacher effectiveness as captured by student test scores and other assessments of performance (e.g., observations of teaching practice; classroom climate surveys;
supervisor, co-teacher, student, and peer evaluations). SCALE, and state level partners like those in Georgia and North Carolina, are committed to conducting predictive validity studies that follow candidates into employment if the state database enables linking teachers to classrooms and student achievement, providing states grant access to these data. The edTPA National Technical Advisory Committee of leading psychometricians in the field advises SCALE on the design of studies that examine the impact of edTPA implementation. In addition, an edTPA research group composed of faculty representatives across states using edTPA is working with SCALE to identify and collaborate on research efforts relevant to teacher education.
Internal Structure
The use of edTPA rubric, task, or overall scores depends on the intended purpose as well as the policy and approach to implementation of each program and state. The score on a particular rubric provides a candidate’s level of readiness on the particular skill/ability being measured, and informs conversations about the strengths and weaknesses of a particular candidate or a preparation program. Scores on each of the rubrics and total scores for the three edTPA tasks are reported to candidates, programs, and states to inform decisions and level of competency for each of the three components of the teaching cycle (planning, instruction, and assessment). The final score is the summed score across rubrics in all three tasks, and is used as an overall measure of readiness to teach. As a valid assessment, the claim is made that the scoring procedure appropriately summarizes relevant aspects of performance and is applied accurately and consistently for all candidates. This is based on evidence that the scoring rules are appropriate and that the data fit the scoring model. The following analyses of the internal structure of edTPA provide psychometric evidence that support the structure of levels within each rubric, the fit of rubrics within the three edTPA tasks, and the use of a single summed total score to represent candidates’ overall performance. The accuracy and consistency of the scoring process is supported by the scoring model, scorer training, double scoring procedures, and quality management outlined in the “edTPA Scoring 2016” section above.

edTPA ANNUAL ADMINISTRATIVE REPORT Data range: 1/1/2016 - 12/31/2016
22
Confirmatory Factor Analyses
Exploratory factor analyses of 2013 field test data provided support for the use of a total score on edTPA to summarize a candidate’s performance, as well as for the underlying task structure (see pg. 22 of the edTPA 2013 Field Summary Report). These analyses were provided in the 2014 and 2015 Administration Reports, and to confirm these factor structures again, Confirmatory Factor Analyses (CFAs) were conducted using data from operational portfolios submitted in 2016. CFAs test whether patterns (correlations) among observed scores on a set of test items conform to hypothesized structures (Brown, 2006), providing validity evidence based on a test’s “internal structure” to support score interpretations (AERA, APA, & NCME, 2014).
These analyses included 34,786 first-time edTPA submissions, and excluded incomplete portfolios and portfolios with condition codes.1 In cases where a portfolio was double scored, only the first rater’s score is included in the analyses. CFA models were estimated based on the observed sample covariance matrix among rubric scores for the 2016 administration cycle. Models were estimated using maximum likelihood estimation with standard errors and scaled chi-square fit statistics, as implemented in the R package “lavaan” (Rosseel, 2012), to fit all models.
Based on the design and interpretation of the edTPA total score, a 1-factor model in which all rubric scores load on a single latent factor was estimated. To account for the task-based design and structure of edTPA portfolios, a 3-factor model with correlated factors and with each rubric loading only on its associated task was also estimated. All factor loadings for the three-factor solution were positive and statistically significant as anticipated (most standardized loadings were greater than .6 in the 3-factor model). Table A in Appendix A presents the estimated standardized factor loadings for the 1-
1 Condition codes are applied to one or more rubrics when the candidate’s materials do not comply with edTPA evidence requirements (e.g., inaudible video, missing artifact, wrong artifact) and are therefore unscorable.
and 3-factor models in the full sample of portfolios. Table B presents the estimated correlations among the task factors in the 3-factor model, which are also strongly positive and statistically significant. The large magnitude of the correlations further supports the interpretation that edTPA rubrics measure three highly interrelated sub-dimensions—planning, instruction, and assessment.
IRT: Partial Credit Model
As outlined in prior Administrative reports, a polytomous item response theory (IRT) model, the partial credit model (PCM; Masters, 1982), was fit to the same sample of edTPA submissions included in the CFA models. The PCM provides a statistical model of the probability that a candidate earns each possible rubric score as a function of a single, continuous, underlying dimension “theta.”
The unidimensional PCM was fit to the 2016 sample of 34,786 candidates. Models were estimated using marginal maximum likelihood. As noted above, edTPA scores are derived from the ratings of a single scorer who scores the entire portfolio; rubric scores may reflect some rater effects. Additionally, the results presented below are based upon aggregating data across credential areas. Because edTPA is used based on a single total score calculated equally across fields with 15 rubrics, this analysis provides evidence about how this measure functions overall.
To evaluate fit, INFIT mean square statistics were computed for each rubric and examined to identify rubrics with INFIT values less than 0.75 or greater than 1.33, which would suggest a lack of fit. Plots of expected and observed rubric scores across the theta range were compared across the theta range to identify potential model misfit. A Wright Map depicting the distribution of candidate proficiency estimates alongside rubric threshold parameter estimates was inspected to determine whether: a) rubric thresholds conformed to the expected ordering, and b) whether the rubric thresholds for each score point were well-distributed across the range of the theta distribution. Finally, to summarize precision of theta estimates, the test information function and conditional standard error of estimate were plotted

edTPA ANNUAL ADMINISTRATIVE REPORT Data range: 1/1/2016 - 12/31/2016
23
across the range of the theta distribution and a person separation reliability index was estimated.
Inspection of the Wright Maps and rubric parameter estimates showed the hypothesized ordering of rubric thresholds and demonstrated that the Thurstonian thresholds (proficiency level at which a candidate has a 50% chance of scoring above a given score level) were located across the entire range of estimated candidate performance on the theta scale (see Appendix A). The test information function (and hence standard error of measurement in the theta metric) was consistent across the range of candidate performance. To summarize, these results provide information about the level of performance at which candidates are likely to move from one possible rubric score to the next. The fact that these points are distributed across the theta distribution affirms that edTPA rubrics are constructed to provide useful discriminating information about candidate performance at different levels of overall performance.

edTPA ANNUAL ADMINISTRATIVE REPORT Data range: 1/1/2016 - 12/31/2016
24
Candidate Performance
Overall Scores
The following figure presents the score distribution of 34,786 edTPA portfolios, in fields scored based on 15 rubrics and submitted January 1 - December 31, 2016, the third full calendar year for which edTPA was used consequentially.
This represents the distribution of final scores on all complete portfolios scored on five separate rubrics within each of the three major edTPA tasks: planning, instruction, and assessment. There are five levels of possible performance for each rubric, with level 3 characterizing “ready to teach” and a total score range from 15 to 75. This figure shows that scores are normally distributed across this range. The dip in scores around 37-41 is an artifact of the double scoring process automatically applied to all portfolios that fall within the state or national double-scoring band.
Frequency
0100200300400500600700800900
1000110012001300140015001600170018001900200021002200230024002500260027002800290030003100
Total Score (15 Rubrics)
15
20
25
30
35
40
45
50
55
60
65
70
75

edTPA ANNUAL ADMINISTRATIVE REPORT Data range: 1/1/2016 - 12/31/2016
25
Task and Rubric Scores
Summary descriptive statistics and distributions for each task and rubric are presented in the following table.* As a reference, rubrics are listed below by title.2
Rubric Mean S.D. Min Max Task 1: Planning P01 3.1 .7 1 5 P02 3.1 .7 1 5 P03 3.1 .7 1 5 P04 3.0 .7 1 5 P05 3.0 .7 1 5 Task1 Total 15.4 2.6 5 25 Task 2: Instruction I06 3.1 .5 1 5 I07 3.0 .6 1 5 I08 3.0 .7 1 5 I09 2.9 .7 1 5 I10 2.8 .7 1 5 Task2 Total 14.8 2.3 5 25 Task 3: Assessment A11 3.0 .8 1 5 A12 3.2 .9 1 5 A13 2.7 .8 1 5 A14 2.9 .7 1 5 A15 3.0 .8 1 5 Task3 Total 14.7 3.0 5 25 Overall Total 45.0 6.9 15 75
2 Descriptive statistics for Task 4 rubrics of the Elementary Education Handbook (M19: Analyzing Whole Class Understandings, M20: Analyzing Individual Student Work Samples, M21: Using Evidence to Reflect on Teaching) are presented in Appendix C.
*Does not include 13-rubric fields (World Language, Classical Language); includes first 15 rubrics of Elementary Education only.
Task 1: Planning
P01. Planning for Content Understandings P02. Planning to Support Varied Student Needs P03. Using Knowledge of Students to Inform Teaching and Learning P04. Identifying and Supporting Language Demands
P05. Planning Assessments to Monitor and Support Student Learning
Task 2: Instruction
I06. Learning Environment I07. Engaging Students in Learning I08. Deepening Student Learning I09. Subject-Specific Pedagogy I10. Analyzing Teaching Effectiveness
Task 3: Assessment
A11. Analysis of Student Learning A12. Providing Feedback to Guide Learning A13. Student Use of Feedback A14. Analyzing Students’ Language Use and Content Learning A15. Using Assessment to Inform Instruction

edTPA ANNUAL ADMINISTRATIVE REPORT Data range: 1/1/2016 - 12/31/2016
Descriptive Summary by Task and Rubric
The average edTPA score across the 34,786 portfolios (consequential and non-consequential) from fields with 15-rubric handbooks was 45.0, with a standard deviation of 6.9. This average performance shows incremental growth in mean scores and reduction in the standard deviation since the 2013 field test data where the average score was 42.8 (SD = 8.17). Mean scores and standard deviations were 44.3 (SD = 7.8) for 2014, and 44.2 (SD = 7.4) in 2015. As per previous years, scores ranged across the entire range of possible scores, from 15 to 75. Candidate performance by task continues to demonstrate a consistent pattern over time, showing that candidates performed most highly on the planning task (mean = 15.4), followed by the instruction task (mean = 14.8), and then the assessment task (14.7), though Task 3 performance has improved over time (mean 2013 = 13.4, mean 2014 = 14.1, mean 2015 = 14.2). This result is consistent with other studies and literature in teacher education that identifies the evaluation and response to students’ learning as one of the more challenging elements of teaching (Black & William, 1998; Mertler, 2009). Based on the national recommended cut score of 42, the pass rate for candidates who submitted an edTPA portfolio in 2016 was 75% across all states, and 77% in states using the assessment consequentially. Note that to date, passing scores established by states range from scores of 35 to 41.
Performance by Content Field
The following graph shows total score means by subject area field for edTPA portfolios submitted January 1 - December 31, 2016, in fields scored based on 15 rubrics. Data reflect complete submissions in fields with sample size (N) > 100. For double-scored portfolios, the average score across the two was used. Bars represent scores one standard deviation (SD) below and one SD above the mean. Mean total scores for low incidence fields can be found in Appendix B.
Tables in Appendices B and C provide mean candidate performance, an abbreviated distribution of total scores for national fields, and distributions of rubric-level scores and condition codes reported by field. Due to
differences in sample size, content knowledge demands, and low numbers of submissions in some fields, comparisons across fields should be approached with caution.
MEAN TOTAL SCORE BY FIELD
26
49.2 44.7
43.1 45.7 45.2 45.9
48.7 43.6
36.3 45.2
48.9 47.5
45.5 44 45.4
44.3 46.7
44.6 41.5
45.7 43.9
40.7 46.9
0 10 20 30 40 50 60 70
Agricultural Education Business Education
Early Childhood Elementary Education
Elementary Literacy Elementary Mathematics
English as an Additional Language Family and Consumer Sciences
Health Education K-12 Performing Arts
Library Specialist Middle Childhood English-Lang. Arts
Middle Childhood History/Social Studies Middle Childhood Mathematics
Middle Childhood Science Physical Education
Secondary English-Language Arts Secondary History/Social Studies
Secondary Mathematics Secondary Science Special Education
Technology and Engineering Education Visual Arts
Mean

edTPA ANNUAL ADMINISTRATIVE REPORT Data range: 1/1/2016 - 12/31/2016
27
All edTPA handbooks examine the same underlying constructs and follow the same architecture with 80% overlap in content, with particular subject-specific elements that align to standards and expectations for pedagogy and student learning in that field accounting for the other 20%. Patterns of performance across content fields are confirmed systematically in a multipronged approach:
1. Factor analyses models of latent structure are reviewed for each field with appropriate sample size.
2. Summary data, distributions, and patterns of overall scores, tasks, and rubrics are compared across fields for flags of outlier behavior.
3. Indices of reliability (internal consistency, exact and adjacent agreement by rubric, kappa Ns) are reviewed for each field with appropriate sample size.
4. Scoring trainers and supervisors are consulted to confirm scoring and backreading processes and flag any recurring questions from scorers.
5. Experts in each profession are consulted to review the data, and to discuss alignment of the handbook to the standards and expectations of the profession.
6. Input from programs and faculty using edTPA via the Online Community at edtpa.aacte.org and email to SCALE or AACTE staff are reviewed.
7. Review of and clarification to handbooks, scorer training, and support materials is conducted annually based on all quantitative and qualitative data.
Performance by Consequential Use
edTPA portfolios officially scored in the 2016 operational year represent submissions from candidates in 31 states. Of the 34,786 portfolios scored, 7,467 were submitted by candidates in states that do not currently have policy for edTPA use, and 27,319 were submitted in states with consequential
policy. States without policy with submissions in 2016 are AL, AZ, CO, DE, HI, IN, MD, NC, NJ, OH, OK, OR, PA, UT, VA, WV, and WY. States with consequential policy and submissions in 2016 are AR, CA, GA, IA, IL, MN, NY, TN, WA, and WI. Appendix D presents the approximate percentage of portfolios coming from each state.
State policy mandating edTPA for purposes of teacher licensure and/or program evaluation results in greater consistency for use and implementation. It was therefore hypothesized that submissions from states with official policy would have higher average scores than those from states without edTPA policy. The table in Appendix E shows overall performance (mean, standard deviation, and number of submissions) by field in states without state-wide policy for use of edTPA, and states where such policy exists.
As predicted, edTPA scores were higher in states with policy requiring edTPA, with non-policy states having a mean of 43.50 and policy states having a mean of 45.35. This finding is consistent with expectations given the increased consistency of implementation and support structures, as well as levels of effort and motivation, that come about as a result of state-wide policy for consequential assessment. This pattern is present across most content fields, although low sample sizes in some fields mean that any interpretations or comparisons should be approached with caution at this time. Typically, faculty preparing candidates in states with consequential policy have had more time to become familiar with and utilize edTPA as an assessment and educative tool, as well as to draw upon edTPA resources and build supports for their candidates. It is also an artifact of high-stakes assessment that higher stakes influence higher levels of effort, motivation, and consistency for all stakeholders. Ongoing integration of edTPA by states and EPPs will inform research into the approaches and practices that best facilitate, support, and assess teaching effectiveness of pre-service teaching candidates.

edTPA ANNUAL ADMINISTRATIVE REPORT Data range: 1/1/2016 - 12/31/2016
28
Performance by Demographic Subgroups
When submitting an edTPA portfolio for official scoring, the candidate is asked to provide demographic information in several categories: gender, ethnicity, teaching placement context, program type, education level, and primary language. Analyses of performance by subgroup within these categories included only portfolios submitted in states that have policy for consequential use of edTPA. In states without such policy, many factors may affect candidate performance in the assessment of teaching competence such as variability in the level of implementation, support structures, level of effort, and candidate motivation and preparation. The portfolios represented here were submitted in AR, CA, GA, IA, IL, MN, NY, TN, WA, and WI.
The analyses revealed small differences in performance across some of the subgroups. It is important to note the difference in sample sizes of some of the subgroups within each demographic category may affect the ability to generalize these results to the national pre-service teaching population; all estimates of performance should not be overgeneralized and should be interpreted with caution. Further, differences in performance do not take into account any prior or experiential differences in the applicant pool, differences in program quality or preparation of candidates, and other factors that may contribute to a candidate’s score and cause differences in performance. What follows is a description of subgroup performance in the following categories: Teaching Context, Ethnicity, Primary Language, Gender, and Education Level. Finally, a regression analysis was conducted to examine the contribution of these demographic categories in explaining and interpreting edTPA candidate scores.
Teaching Context (School Locale)
Upon submission of their edTPA portfolio, candidates are asked to indicate the context of their teaching placement. Based on these data, an ANOVA was run to analyze whether overall edTPA scores differed based on the teaching context of the candidate. The table below displays mean scores, standard deviations, and submission volumes by teaching placement categories.
Results showed that candidates teaching in suburban settings had the highest average scores, while candidates teaching in rural settings had the lowest average scores. For the ANOVA and Games-Howell post hoc analyses, see Appendix F.
School Locale N Mean Std Dev City 11443 45.42 6.89 Rural 4501 44.47 6.80 Suburb 8812 45.88 6.58 Town 2509 44.79 6.67 Declined to answer 54 45.20 6.81
This finding provides evidence that candidates in suburban settings had the highest overall performance, and that candidates whose practice or clinical teaching takes place in rural settings have significantly lower average scores. Differences between city/suburban, suburban/town, and city/rural were also statistically significant, though the actual difference between mean scores is very small (less than one point for any comparison).
Teaching Context (Student Characteristics)
The current report presents a new set of teaching context variables associated with student characteristics in the candidate’s placement including the percentage of English language learners, students eligible for special education services, and those receiving free and reduced lunch. As with all information collected at the time of registration, this information is based on candidate self-report. See Appendix F for tests of significance.
% ELL Students N Mean Std Dev <10% 16092 45.28 6.71 10-25% 3858 45.54 6.61 26-50% 1897 45.79 6.69 51-75% 928 46.01 7.04 76-100% 1510 45.55 7.56 Decline to answer 2738 45.13 6.81

edTPA ANNUAL ADMINISTRATIVE REPORT Data range: 1/1/2016 - 12/31/2016
29
% Students Free and Reduced Lunch N Mean Std Dev <10% 4080 45.63 6.70 10-25% 3403 45.36 6.59 26-50% 3859 45.52 6.62 51-75% 3600 45.35 6.81 76-100% 7257 45.30 6.93 Decline to answer 4824 45.21 6.78
% Students SPED Eligibility N Mean Std Dev <10% 12097 45.74 6.54 10-25% 6910 45.43 6.75 26-50% 2064 44.95 6.95 51-75% 383 44.10 7.16 76-100% 2290 44.15 7.54 Decline to answer 3279 45.25 6.77
The analysis of student characteristics variables revealed some statistically significant differences in candidate performance. In general, candidates teaching fewer students eligible for special education outperformed those who had classes with more, those teaching a larger percentage of English language learners outperformed those with a small percentage, and there were no differences in performance related to the free and reduced lunch frequency. It is interesting to note the success of edTPA candidates who teach classes with a larger number of English language learners: when candidates are able to plan for and differentiate instruction and assessment for English learners they score higher on several edTPA rubrics. If they are teaching in contexts with more English learners, they may be more likely to demonstrate these skills.
Teaching Context (Placement Length)
The calendar year 2016 was the first time edTPA candidates indicated the length of their clinical/student teaching placement. As can be seen below, there were differences in candidate performance associated with their reported length of placement (shown in number of weeks). Strongest
candidate performance was found in placements of 21-30 weeks and lowest performance was indicated in placements of zero weeks, 41 or more weeks, and 1-10 weeks. Further exploration is needed to determine the relationship between placement length and program type.
Length of Placement (weeks) N Mean Std Dev 0 233 43.13 7.57 1-10 7082 45.17 6.64 11-20 6961 45.40 6.60 21-30 3263 46.50 6.69 31-40 2122 45.63 6.81 41+ 4715 45.08 6.97 Decline to answer 2647 45.02 6.98
Different teaching contexts present different sets of experiences and opportunities for a pre-service teacher candidate. Many programs purposefully place students in field experiences in a range of teaching contexts, and vary in their approach to preparing candidates for teaching in different contexts. Therefore, depth and breadth of experiences provided by the preparation program should be considered. The process used by each program to select candidates, the resources and supports available, as well as the candidate’s disposition or preference are also likely to play a role in how a candidate performs within a particular teaching context. These data can help programs reflect on how they serve and prepare their candidates and to scaffold conversation about teaching strategies that best support learners across various teaching contexts.
Program Type
Beginning in fall 2016, candidates registering for edTPA were asked to identify which type of program best described their preparation. The table below shows the means for various options that distinguish traditional university-based programs from alternative certification in a university, district, or Teach for America.
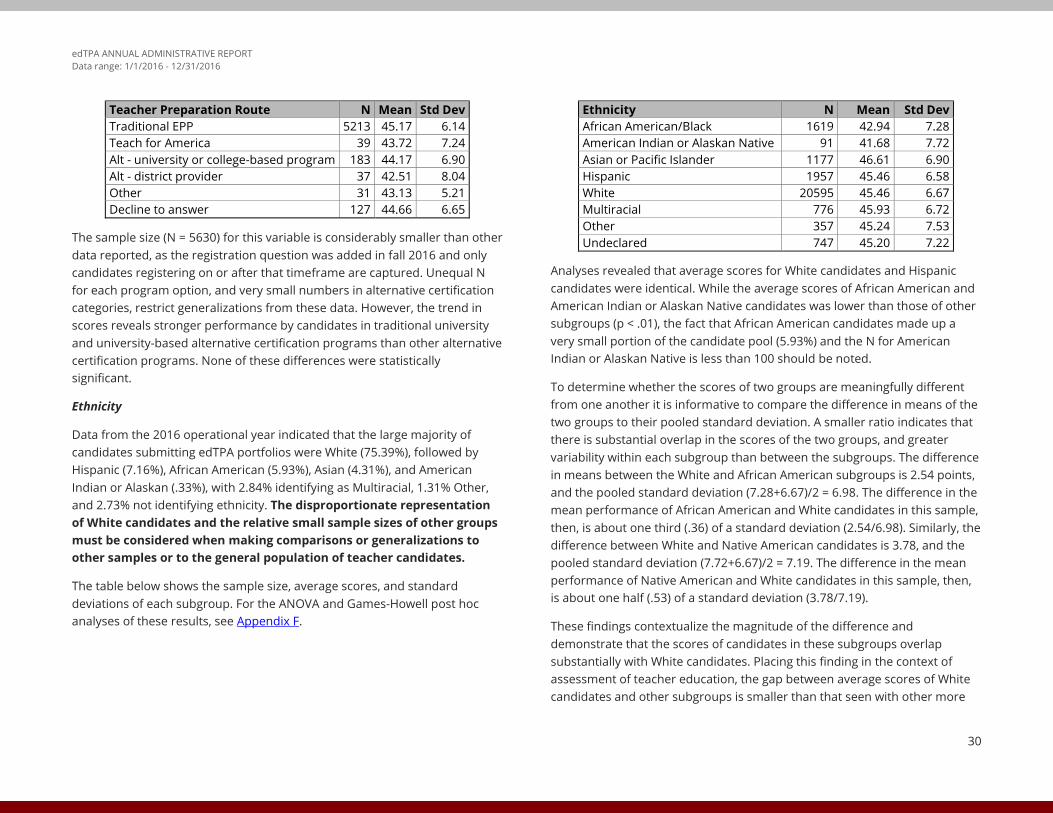
edTPA ANNUAL ADMINISTRATIVE REPORT Data range: 1/1/2016 - 12/31/2016
30
Teacher Preparation Route N Mean Std Dev Traditional EPP 5213 45.17 6.14 Teach for America 39 43.72 7.24 Alt - university or college-based program 183 44.17 6.90 Alt - district provider 37 42.51 8.04 Other 31 43.13 5.21 Decline to answer 127 44.66 6.65
The sample size (N = 5630) for this variable is considerably smaller than other data reported, as the registration question was added in fall 2016 and only candidates registering on or after that timeframe are captured. Unequal N for each program option, and very small numbers in alternative certification categories, restrict generalizations from these data. However, the trend in scores reveals stronger performance by candidates in traditional university and university-based alternative certification programs than other alternative certification programs. None of these differences were statistically significant.
Ethnicity
Data from the 2016 operational year indicated that the large majority of candidates submitting edTPA portfolios were White (75.39%), followed by Hispanic (7.16%), African American (5.93%), Asian (4.31%), and American Indian or Alaskan (.33%), with 2.84% identifying as Multiracial, 1.31% Other, and 2.73% not identifying ethnicity. The disproportionate representation of White candidates and the relative small sample sizes of other groups must be considered when making comparisons or generalizations to other samples or to the general population of teacher candidates.
The table below shows the sample size, average scores, and standard deviations of each subgroup. For the ANOVA and Games-Howell post hoc analyses of these results, see Appendix F.
Ethnicity N Mean Std Dev African American/Black 1619 42.94 7.28 American Indian or Alaskan Native 91 41.68 7.72 Asian or Pacific Islander 1177 46.61 6.90 Hispanic 1957 45.46 6.58 White 20595 45.46 6.67 Multiracial 776 45.93 6.72 Other 357 45.24 7.53 Undeclared 747 45.20 7.22
Analyses revealed that average scores for White candidates and Hispanic candidates were identical. While the average scores of African American and American Indian or Alaskan Native candidates was lower than those of other subgroups (p < .01), the fact that African American candidates made up a very small portion of the candidate pool (5.93%) and the N for American Indian or Alaskan Native is less than 100 should be noted.
To determine whether the scores of two groups are meaningfully different from one another it is informative to compare the difference in means of the two groups to their pooled standard deviation. A smaller ratio indicates that there is substantial overlap in the scores of the two groups, and greater variability within each subgroup than between the subgroups. The difference in means between the White and African American subgroups is 2.54 points, and the pooled standard deviation (7.28+6.67)/2 = 6.98. The difference in the mean performance of African American and White candidates in this sample, then, is about one third (.36) of a standard deviation (2.54/6.98). Similarly, the difference between White and Native American candidates is 3.78, and the pooled standard deviation (7.72+6.67)/2 = 7.19. The difference in the mean performance of Native American and White candidates in this sample, then, is about one half (.53) of a standard deviation (3.78/7.19).
These findings contextualize the magnitude of the difference and demonstrate that the scores of candidates in these subgroups overlap substantially with White candidates. Placing this finding in the context of assessment of teacher education, the gap between average scores of White candidates and other subgroups is smaller than that seen with other more

edTPA ANNUAL ADMINISTRATIVE REPORT Data range: 1/1/2016 - 12/31/2016
31
traditional standardized assessments of initial teaching (e.g., Goldhaber and Hansen, 2010). Furthermore, the difference between White and African American candidates in 2016 is smaller than that noted in 2015.
The performance of candidates was also examined by subgroup within each teaching context to see whether the pattern of the overall sample was consistent across the different placements (contexts). This examination revealed that the difference in means of the White and Hispanic candidates was consistently less than 1 point within all teaching contexts. There was greater variation in mean differences between African American and White candidates, with differences being greater in suburban/urban settings than in rural settings or urban settings. As noted in the “Teaching Context” section above, the performance of candidates in rural settings is systematically lower than that in all other contexts, suggesting that further research in this area is needed.
These data reveal overall trends in edTPA performance for this sample, and while findings should not be overgeneralized, educator preparation programs and state agencies are encouraged to use data from their respective populations to conduct further analyses and consider implications. edTPA is committed to providing an equitable assessment that is free of bias and adverse impact. While caution must be taken in making generalizations based on such small sample sizes, these findings are consistent with other reported portfolio-based performance assessment data (e.g., NBPTS, PACT, ProTeach).
Primary Language
Candidates were asked to identify whether English is their primary language. Primary Language English candidates had the same mean score as those candidates who indicated their Primary Language was not English.
Primary Language N Mean Std Dev English 26311 45.35 6.77 Other 688 45.35 6.94 Declined to answer 320 45.18 7.11
While the disproportionate N size for these two populations would warrant caution in overgeneralizing (candidates who indicated their Primary Language was not English represent 2.5% of the population), the small difference in mean performance is an encouraging finding.
Gender
In this sample, 76.8% of submissions came from female candidates, and 22.2% from male candidates. Female candidates scored higher than their male counterparts; this difference (1.48) was statistically significant (p < .01).
Gender N Mean Std Deviation Male 6073 44.21 7.04 Female 20990 45.69 6.65 Not Provided 256 44.61 7.37
Follow-up analyses reveal that the difference was greatest in suburban/urban teaching contexts (2.02 points), and smallest within urban contexts (1.24 points); see Appendix G. These findings suggest that the difference in performance by gender may vary based on other variables such as educational background or preparation program.
Education Level
The achieved level of education prior to taking edTPA was reported by candidates. Candidates holding a doctorate degree had the highest average scores. For the ANOVA and Games-Howell post hoc analyses, see Appendix F.
Education Level N Mean Std Dev High school/Some college 12928 45.27 6.42 Bachelor’s/Bachelor’s plus credits 11825 45.60 7.00 Master’s/Master’s plus credits 2446 44.53 7.42 Doctorate 120 46.72 6.38
Due to the significant disparities in the size between the Master’s/Master’s plus credits sample and that of the HS/Some college and the Bachelor’s/Bachelor’s plus credits samples, results should be interpreted with caution. One hypothesis is that candidates who take edTPA after earning a

edTPA ANNUAL ADMINISTRATIVE REPORT Data range: 1/1/2016 - 12/31/2016
32
Master’s degree may have a background in a different field or have had less coursework and/or student teaching experience prior to taking edTPA. Structure of program curricula, timing of the assessment within the program, and prior experience with pedagogical theory and teaching practice may also play a role in outcomes on an assessment of teaching readiness.
Regression Analysis
Regression analyses are used to determine whether particular variables significantly predict an outcome, and the extent to which these variables explain the differences in outcomes within the sample. To examine the contribution of all demographic factors to the performance of the candidates, a multiple regression model including School Context, Program Type, Student Characteristics, Ethnicity, Gender, Education Level, and Primary Language was run to examine the extent to which demographic factors explain the variability in total edTPA scores.
It is important to note that a finding that a factor is a “statistically significant” predictor does not necessarily indicate that this factor makes a substantial or meaningful difference in outcomes. The percent of variance explained (Delta R2) by each factor is therefore presented here to describe the extent to which each variable explains the differences in candidates’ edTPA scores.
The overall model was statistically significant, F (49, 27269) = 22.04 (p < 0.001), indicating that this model predicts edTPA scores better than chance alone. The following table presents each factor included in the model, and the percentage of variance in total scores accounted for by each factor and by the overall model.
Factor Variance Explained (%) Teacher Preparation Route 0.09 School Locale 0.54 Gender 0.82 Ethnicity 1.02 Primary Language 0.02 Education Level 0.31 Length of Placement (weeks) 0.50 Free and Reduced Lunch 0.02 Special Education Eligibility 0.47 English Language Learners 0.02 OVERALL MODEL 3.81
Overall, this model accounts for only 3.81% of the variance in total scores (R2 = .381); 96.19% of the variability in scores is explained by other factors not accounted for by the variables included in this model. This result highlights that demographic factors account for a very small portion of the variables that contribute to how a candidate scores on edTPA. In other words, a candidate’s demographic characteristics alone are a poor predictor of a candidate’s edTPA performance or readiness to teach. This finding further supports the conclusion that while some statistically significant differences do exist between subgroups, approximately 96% of the explanation of candidate performance can be explained by other non-demographic factors. How a candidate performs on edTPA may be largely explained by other factors such as the candidate’s knowledge, skills, and abilities to begin teaching; initial level of academic readiness; the quality of the preparation program; and/or the supports provided by the program. Further research into each of these and other variables can serve to inform the ways in which candidates, faculty, and programs employ edTPA as a tool for candidate and program learning.

edTPA ANNUAL ADMINISTRATIVE REPORT Data range: 1/1/2016 - 12/31/2016
33
Reliability Evidence
Inter-Rater Agreement
The table below shows inter-rater agreement for the 2016 edTPA administration cycle (January 1, 2016 - December 31, 2016). The table shows agreement rates for each rubric as well as for judgments overall. Inter-rater agreement (IRA) measures to what extent multiple raters provide ratings of items or performance tasks consistently. The check of inter-rater agreement is part of the general quality control for a scoring process, and it requires a process that randomly assigns portfolios to be read by two scorers, independently. It is customary to summarize IRA for three levels of granularity (Chodorow & Burnstein, 2004; Powers, 2000; Stemler & Tsai, 2008), such as:
• Exact agreement – proportion of cases in which the first and second scores match exactly;
• Adjacent agreement – proportion of cases in which the first and second scores are apart by one score point, in absolute value; and
• Total agreement – proportion of cases in which the pairs of scores are ± 1 score point apart from each other.
The data set included 2,671 complete submissions (approximately 10% of the total number of examinees) that were scored independently by two scorers as part of the random sample of double-scored portfolios for the 2016
administration cycle. Across all 15 rubrics, independent scorers assigned the same score (exact agreement) in approximately 53.8% of all cases. Scorers assigned scores that were one point apart (adjacent agreement) in approximately 40.8% of all instances. When combining exact and adjacent agreement into a total agreement, scorers assigned scores that were the same or +/- 1 point apart in approximately 94.6% of all cases. These exact and adjacent agreement rates are consistent with past edTPA operational years, and with that of other performance assessments, such as the NBPTS.
The kappa n provides chance-corrected total agreement, or inter-rater agreement measures that result from removing total agreement that may have occurred randomly (Brennan & Prediger, 1981). Chance-corrected agreement ranges from zero to one. There are no widely accepted guidelines for what constitutes an adequate value of the coefficients, although higher values represent greater levels of agreement. The table below shows kappa n ranged from 0.825 (rubric 12) to 0.964 (rubric 6), with an average value of 0.887. This outcome corroborates that scorers tend to assign scores within +/- 1 and rarely assign scores that differ by more than 1 point. The overall chance-corrected total agreement rate (0.887) is consistent in magnitude with the kappa n rate found in the 2014 and 2015 operational years.

edTPA ANNUAL ADMINISTRATIVE REPORT Data range: 1/1/2016 - 12/31/2016
34
Task
Rubric
Inter-Rater Agreement Exact Adjacent Total Kappa N
Task 1: Planning
Rubric 01 0.538 0.420 0.958 0.913
Rubric 02 0.499 0.424 0.923 0.839
Rubric 03 0.535 0.419 0.954 0.904
Rubric 04 0.549 0.398 0.947 0.889
Rubric 05 0.514 0.407 0.921 0.835
Task 2: Instruction Rubric 06 0.715 0.268 0.983 0.964
Rubric 07 0.566 0.402 0.968 0.934
Rubric 08 0.565 0.392 0.957 0.911
Rubric 09 0.535 0.412 0.946 0.888
Rubric 10 0.560 0.404 0.963 0.924
Task 3: Assessment Rubric 11 0.484 0.444 0.928 0.850
Rubric 12 0.468 0.448 0.916 0.825
Rubric 13 0.482 0.447 0.929 0.851
Rubric 14 0.536 0.411 0.947 0.890
Rubric 15 0.524 0.422 0.946 0.886
Overall Average 0.538 0.408 0.946 0.887

edTPA ANNUAL ADMINISTRATIVE REPORT Data range: 1/1/2016 - 12/31/2016
35
Internal Consistency
Cronbach’s alpha is a measure of internal consistency of raw test scores, an important characteristic of test scores that indicates the extent to which the items of the assessment measure the intended common construct (Cronbach, 1951). Cronbach’s alpha estimates range from zero to one, and higher values reflect higher levels of consistency of a person’s scores across the items (rubrics).
The following table shows edTPA estimates of Cronbach’s alpha coefficient for the 2016 administration cycle. The table shows descriptive statistics for total scores and reliability estimates for individual fields and the overall group. The data set included 34,786 complete submissions (excluding
portfolios with condition codes). The estimation of reliability took place with the data from the first rater. Reliability coefficients ranged from 0.858 (Secondary Mathematics) to 0.941 (Agricultural Education), with an overall alpha of 0.907, indicating a high level of consistency across the rubrics, meaning that the rubrics as a group are measuring a common construct of teacher readiness.
The person separation reliability calculated as part of the IRT internal structure analyses presented in the “Validity” section of this report was estimated as 0.910, indicating a high level of reliability for distinguishing among candidates’ levels of performance. This index is similar to Cronbach’s alpha. Generally, values of 0.90 or greater are expected for such reliability indices.
Field Name N Mean Variance Alpha Agricultural Education 127 49.157 65.832 0.941 Business Education 151 44.728 37.172 0.916 Early Childhood 3119 43.13 30.722 0.865 Elementary Education 6093 45.686 48.912 0.905 Elementary Literacy 3994 45.238 38.142 0.899 Elementary Mathematics 2995 45.927 36.153 0.884 English as an Additional Language 433 48.744 62.353 0.924 Family and Consumer Sciences 86 43.570 69.589 0.936 Health Education 105 36.267 59.601 0.925 K-12 Performing Arts 1455 45.175 47.996 0.896 Middle Childhood English-Language Arts 480 47.542 52.324 0.909 Middle Childhood History/Social Studies 397 45.516 45.230 0.899 Middle Childhood Mathematics 531 44.023 40.067 0.883 Middle Childhood Science 416 45.413 47.385 0.894 Physical Education 1017 44.332 54.567 0.887 Secondary English-Language Arts 2459 46.682 44.593 0.913 Secondary History/Social Studies 2265 44.592 36.016 0.889 Secondary Mathematics 1744 41.535 35.761 0.858 Secondary Science 1735 45.728 50.287 0.900 Special Education 4427 43.898 61.826 0.914 Visual Arts 625 46.947 51.361 0.884 Overall 34786 44.587 53.330 0.900

edTPA ANNUAL ADMINISTRATIVE REPORT Data range: 1/1/2016 - 12/31/2016
36
Setting Cut Scores Using Standard Error of Measurement In assessment, each time an examinee takes a test there is a random chance that the score will be slightly different, and applying the standard error of measurement (SEM) is one way to take this into account. The SEM allows educational analysts to determine the range of scores an examinee would receive if tested repeatedly without studying or contemplating the answers between tests. By applying this technical adjustment, a given examinee’s score may be more representative of “true” knowledge because the variation in scores is taken into account, and it provides a safeguard against placing undue emphasis on a single test score.
There are different ways to estimate the standard error of measurement. For edTPA, we used a method based on the total number of score points
available (75) and the recommended passing standard (Lord, 1959; Gardner, 1970). In determining state-specific cut scores for edTPA, state agencies are provided with the panel-recommended passing standards along with SEM adjustments so that they may consider the impact on pass rates overall or by subgroup for scores at a given SEM adjustment. Providing these SEM considerations gives states context for a number of policy considerations involved in determining a passing standard for a consequential assessment in a state. See the 2014 Administration Report for a full description of the SEM process.
Candidate Passing Rates The following table reports the percent of candidates (out of 34,786) who would have “passed” edTPA (based on the edTPA 2016 data) at different potential cut scores for edTPA assessments with 15 rubrics. The table lists possible passing scores within the band of 35 and 42 (within one and a half standard error of measurement of the Recommended Professional Performance Standard). Estimated passing rates are reported for cut scores within this band. These passing rates are pooled across states and credential areas. Note that these data include portfolios submitted in states where edTPA was not completed under high-stakes or consequential circumstances, and from institutions that may still be in the process of developing support strategies for candidates. Passing rates by program and state are likely to differ based on policy, support structures, and experience with edTPA.
Candidate Passing Rates
Overall Passing Rate
Cut Score
92.7% 35
36 90.8%
37 88.4%
38 85.3%
39 83.4%
40 81.2%
41 78.3%
42 74.7%

edTPA ANNUAL ADMINISTRATIVE REPORT Data range: 1/1/2016 - 12/31/2016
37
State Standard Setting
edTPA Standard Setting Event Overview
edTPA state standard setting conferences occur over one or multiple days. The method used to conduct the standard setting is the Briefing Book Method (Haertel, Beimers, & Miles, 2012). The Briefing Book Method (BBM) is an evidence-based standard setting method intended to develop an appropriate and defensible cut score that can be supported with a validity argument. The BBM provides a framework and approach to standard setting rather than a specific set of steps or procedures that must be followed exactly. The primary aim is to follow a process that allows a body with the appropriate authority and knowledge to reach a defensible and appropriate judgment of a passing cut score.
Participants in the conference include groups of subject area experts, educators, and policymakers who are convened into a panel for the standard setting session. For each participant group, the conference organizers strive to have an equal mix of higher education faculty, non-traditional educational preparation program providers (e.g., area education service organizations), and P-12 educators. Panelists are informed of the purpose of the assessment and are provided with the “briefing book” to guide their activity. Prior to the meeting, each invited panelist receives edTPA handbooks, rubrics, scoring materials, and three previously scored sample portfolio submissions representing different performance levels across various content areas. Panelists are asked to review materials submitted by candidates and the scoring evidence identified by trained benchmarkers for the submissions assigned to them. During the facilitated session, panelists familiarize themselves with the assessment and with the information contained in the briefing book. After a series of “Policy Capture Activities” examining whole portfolios and score profiles representing a range of candidate performances, panelists recommend an initial cut score (which may also be referred to as a “passing standard”) for each task, which is then discussed and evaluated based on impact data. Following that, panelists recommend a final cut score.
edTPA Guiding Question
Throughout the standard setting event and examination of sample edTPA score profiles, a prompt and a guiding question are used and revisited to frame all discussions. This contextual prompt and guiding question provide a common framework in which all participants anchor their decisions.
• Think about a teacher candidate who is just at the level of knowledge and skills required to perform effectively the job of a new teacher in (Insert State Name) public schools.
• Guiding question: What score (the sum of all of the rubric scores of edTPA) represents the level of performance that would be achieved by this individual?
The purpose of the edTPA standard-setting guiding question and contextual prompt is to identify the performance expectation of an initially licensed, classroom-ready teacher. The step-by-step standard setting process of examining actual candidate submissions, candidate score profiles, and impact data guides participants to determine the candidate performance on edTPA that, as stated in the Briefing Book Method, “just meets the definition of performing effectively the job of a new teacher.”
Refer to the 2014 edTPA Administration Report for in-depth explanation of the steps included in the standard-setting process.
Outcomes
Typically, in setting a cut score for a pass-fail decision, a standard error of measurement is applied to the recommended score so as to reduce decisions influenced by measurement error (e.g., false negatives). The full standard error of measurement puts a lower bound on the recommended score of about five points.

edTPA ANNUAL ADMINISTRATIVE REPORT Data range: 1/1/2016 - 12/31/2016
38
States may set their own passing scores based on state standard-setting panels that take into account state-specific data, measurement data, and the state’s policy considerations. As discussed by the national standard-setting panel members, as well as the state panelists, states may consider setting their initial cut score lower than the panel-recommended score to give programs time to learn to deliver and support edTPA activities and to support candidates’ preparation of their submissions. This “phase-in” strategy allows for a ramping up of the state based standard over time, eventually reaching the panel-recommended score, or other cut score, after a defined period of time. An example of a phase-in strategy would be to establish a passing score at -1 SEM from the panel-recommended score, raise the passing score to -1/2 SEM after the first year of operational use, and finally to raise the passing score to the panel-recommended score after the second year of operational use. This allows states time to examine operational data during the defined timeframes and review pass rates over time. As warranted, the state performance standard can be reviewed and adjusted as appropriate over time.
State-Based Passing Standards (as of the end of 2016)
Between fall 2013 and the end of 2016, the following states established or adjusted state-based passing standards as follows (for 15-rubric fields):
• Alabama (37)*
• Arkansas (37)*
• California (41)
• Delaware (38)*
• Georgia (35)
• Illinois (35)*
• Iowa (41)
• Minnesota (Task 1: 13, Task 2: 13, Task 3: 12)
• New York (41)
• Washington (35, excludes Student Voice)
• Wisconsin (38)
* indicates states utilizing a methodology outside of the Briefing Book.
Note that state-based passing standards may be reevaluated and adjusted, as driven by state reviews. The passing standards cited above were in use during the 2016 calendar year, the date range which this report covers. See the edTPA State Policies Overview for the most up-to-date information on state policies and any updates to established state consequential score information that may have changed since 2016, including planned adjustments over time.

edTPA ANNUAL ADMINISTRATIVE REPORT Data range: 1/1/2016 - 12/31/2016
39
Conclusion edTPA was developed for the profession by the profession to be a reflection of the broad skills and competencies necessary to be a successful teacher. Founded on the subject-specific architecture of the National Board for Professional Teaching Standards’ assessments and the work in California on the Performance Assessment of California Teachers (PACT), edTPA is aligned with the Interstate Teacher Assessment and Support Consortium (InTASC) standards for beginning teacher licensing (2013). The development of edTPA, content validity studies and subsequent revisions, and job analyses add to research-based evidence of effective teacher performance and capture the skills, knowledge, and abilities of a novice teacher. The Review of Research on Teacher Education presents the research foundation of edTPA as an assessment of teacher readiness as defined by the leading experts and existing literature on teacher preparation. As with the field test data, data from the first two years of operational use are consistent with Standards for Educational and Psychological Testing (AERA, APA, & NCME, 2014), and affirm the reliability and validity evidence necessary for edTPA to be used for the evaluation of teacher candidates.
The use of edTPA scores by EPPs and state agencies as a reflection of a candidate’s readiness to be an effective and proficient educator is predicated on observed scores being accurate, unbiased, reliable, and consistent across relevant conditions of measurement. The scoring model, training design, double scoring and adjudication processes, and quality management of scorers describe the rigorous scoring model applied to the reporting of edTPA final scores, and analyses of inter-rater reliability quantify the precision and reliability of these scores. The confirmatory factor and partial credit model analyses of internal structure support the construction of levels within each rubric, the fit of rubrics within the three edTPA tasks, and the use of a single summed total score to represent candidates’ performance. Data on candidates’ performance by content field and demographic categories presented in the report suggest that these factors explain a very small portion of variance in total scores, and do not suggest systematic bias against any group or field. As more data become available, the interactions
among variables that contribute to candidates’ performance on edTPA will inform the use and interpretation of rubric, task, and total scores.
edTPA was designed as a support and assessment system for teachers entering the profession. The use of edTPA to inform decisions about a candidate’s readiness to successfully begin his or her career as a teacher is supported by studies that have explored relationships between PACT or edTPA scores with other performance measures of teacher candidates. Summarized in the “Validity” section of this report, emerging studies indicate that performance on these teacher performance assessments is related to candidate performance or readiness to teach: candidates’ GPAs, scores on assessments of pedagogy, supervisors’ predictions of success, and evidence of student learning. Most importantly, edTPA is an educative assessment that supports candidate learning and preparation program improvement. This report synthesizes the systems of support and resources available to candidates, faculty, and programs with the process of taking the assessment, using it to reflect on individual and program practices, and to use data in systematic and reflective ways. Qualitative and quantitative analyses presented in this report describe the impact of edTPA on programs, faculty, and teacher candidates’ educative experience.
More evidence of the concurrent, predictive, and consequential validity of edTPA is eagerly anticipated as data become available; existing research provides strong support that completing edTPA is an educative experience that further improves readiness to teach, while passing edTPA is a signal of readiness that is linked to becoming a more proficient teacher. As more states and educator preparation programs move toward integrated and consistent methods of assessing teacher candidates, it is crucial to continue the examination of reliability and validity arguments of assessments used for licensure/certification, program improvement, and/or program completion. Access to data on candidate performance allows for examination of the preparedness of teachers entering the profession across various skills and constructs. As a subject-specific assessment, edTPA data allows us to

edTPA ANNUAL ADMINISTRATIVE REPORT Data range: 1/1/2016 - 12/31/2016
40
consider candidates’ readiness to teach for each content field, as well as to present programs with national data trends that in turn inform program preparation and reflection. In collaboration with the edTPA Technical Advisory Committee and the edTPA Research Group, SCALE is committed to continuing research that informs and advances the field of teacher preparation. The findings presented in this report can guide and support educator preparation programs, states, and P-12 partners to inform and reform teaching and learning. It also serves as a call for further research and lays the foundation for research questions that will continue to improve assessment and preparation of readiness to teach P-12 students in every classroom, every school, and every field.
Lastly, as with the case of the National Board for Professional Teaching Standards (NBPTS), educative use of a performance-based assessment is more than a testing exercise completed by a candidate. edTPA’s emphasis on
support for implementation mirrors the NBPTS use of professional networks of experienced users to assist others as they prepare for the assessment. The opportunities for educator preparation program faculty and their P-12 partners to engage with edTPA is instrumental to its power as an educative tool. The extensive library of resources developed by SCALE, the National Academy of consultants, and state infrastructures of learning communities for faculty and program leaders promote edTPA as a tool for candidate and program learning. As candidates are provided with formative opportunities to develop and practice the constructs embedded in edTPA throughout their programs, and reflect on their edTPA experience with faculty and P-12 partners, they are more likely to internalize the cycle of teaching (planning, instruction, and assessment) as a way of thinking about practice—a way of thinking about students and student learning that will sustain them in the profession well beyond their early years in the classroom.

edTPA ANNUAL ADMINISTRATIVE REPORT Data range: 1/1/2016 - 12/31/2016
41
Appendix A: Internal Structure Table 1: Confirmatory Factor Analyses: Standardized Factor Loading Estimates
The table below presents the estimated standardized factor loadings for the 1- and 3-factor models in the full sample of portfolios (N=27,759).
1-Factor Model 3-Factor (Task) Model Rubric F1 Planning Instruction Assessment 1 0.628 0.691 -- -- 2 0.603 0.667 -- -- 3 0.632 0.677 -- -- 4 0.613 0.652 -- -- 5 0.640 0.709 -- -- 6 0.481 -- 0.591 -- 7 0.623 -- 0.756 -- 8 0.589 -- 0.721 -- 9 0.580 -- 0.677 -- 10 0.602 -- 0.567 -- 11 0.672 -- -- 0.713 12 0.590 -- -- 0.660 13 0.633 -- -- 0.713 14 0.644 -- -- 0.667 15 0.664 -- -- 0.712 Note: "--" indicates factor loadings fixed to 0.0 in model estimation.
All factor loadings for the three-factor solution were positive and most were statistically significant as anticipated (all but two standardized loadings were greater than .6 in the 3-factor model).
All but one of the factor loadings for the one-factor solution attained magnitudes of at least 0.50, with just a single rubric (Rubric 6) with a factor loading slightly below that target (0.481).

edTPA ANNUAL ADMINISTRATIVE REPORT Data range: 1/1/2016 - 12/31/2016
42
Table 2: Confirmatory Factor Analyses: Task Factor Correlation Matrix
The table below presents the estimated correlations among the task factors in the 3-factor model.
Planning Instruction Assessment Planning 1.00 Instruction 0.71 1.00 Assessment 0.78 0.71 1.00
The task factor correlations are moderately strong and statistically significant. This result supports the edTPA structure consisting of three correlated abilities: Planning, Instruction, and Assessment.

edTPA ANNUAL ADMINISTRATIVE REPORT Data range: 1/1/2016 - 12/31/2016
43
Table 3: Partial Credit Model: Wright Map
The following figure shows the ordering and distribution of Thurstonian thresholds across the range of candidates’ theta estimates. The histogram on the left shows the distribution of candidate theta estimates. These are a direct function of total scores, which represent estimates of teacher effectiveness. The points on the graph (Thurstonian thresholds) represent the point on the underlying theta scale at which a candidate has a 50% chance of scoring at or above score k for a particular rubric. For example, the furthest left point labeled “2” indicates the point on the theta (logit) scale at which a candidate is predicted to have a 50% chance of scoring a 2 or higher on Rubric 1, the furthest left point labeled “3” is the point at which a candidate is predicted to have a 50% chance of scoring a 3 or higher on Rubric 1, and so on.
This graph shows that the ordering of thresholds is as intended (the threshold for scoring 3 is higher than for scoring 2 on a given rubric, etc.). This graph also shows that thresholds are typically evenly distributed across the theta distribution, indicating that differences in rubric scores are sensitive to differences in candidate performance at a range of performance levels. Rubric 6 shows a lower threshold for scoring 3 than other rubrics.
Rubric
-6
-4
-2
0
2
4
6
Logit
s
2
2
2
2
2
22
2
2
2
22 2
22
33
33 3
3
33
3
3
3 3
3
33
4 4 44 4
4 4 4 4
4
4
4
4 44
5
55
5
5
5
5
5 5 55
5
5 55
Rubric1 Rubric2 Rubric3 Rubric4 Rubric5 Rubric6 Rubric7 Rubric8 Rubric9 Rubric10 Rubric11 Rubric12 Rubric13 Rubric14 Rubric15
Wright Map for Overall Sample
Resp
onde
nts
Dim1

edTPA ANNUAL ADMINISTRATIVE REPORT Data range: 1/1/2016 - 12/31/2016
44
Appendix B: Performance by Content Field The following tables contain average candidate performance, overall and for each task and rubric, for 15-, 13-, and 18-rubric content fields.
Data cautions for interpretation of tables:
• Total portfolio scores are based on the 13, 15, or 18 rubrics (depending on the handbook) that are common to all national handbooks.
• Results for Washington handbooks are included in the national results reported here and are based on the rubrics common to all handbooks. State-specific rubrics, such as Washington’s Student Voice, are excluded for the purpose of this report.
• Occasionally, rubrics receive a final score ending in a .5. This occurs when edTPA portfolio submissions are scored by two independent scorers. For those portfolios, the final rubric score is the average of the scores assigned by each scorer.
• For this report, the scores included in the distribution of portfolio total scores were rounded up to the nearest whole number if the total portfolio score ended in .5.
• Occasionally, portfolios are submitted that do not meet submission requirements and result in a condition code for one or more rubrics. A condition code explaining the reason a rubric is deemed unscorable is reported to the candidate. No portfolios with condition codes were included in these reports and analyses.
Means and distributions of total scores are not provided for fields with fewer than 10 portfolios. Fields with fewer than 10 portfolios are omitted from the rubric-level distribution reporting tables. Note that estimates based on sample sizes below 100 may be unstable and should be interpreted with caution.
Means N
Total Score Mean
Planning Instruction Assessment Mean by Task
P01 P02 P03 P04 P05 I06 I07 I08 I09 I10 A11 A12 A13 A14 A15 P I A
All 15-Rubric Handbooks 34,786 45.0 3.1 3.1 3.1 3.0 3.0 3.1 3.0 3.0 2.9 2.8 3.0 3.2 2.7 2.9 3.0 15.4 14.8 14.7
Agricultural Education 127 49.2 3.6 3.4 3.3 3.3 3.4 3.4 3.3 3.2 3.3 3.2 3.4 3.2 3.0 2.9 3.2 17.0 16.4 15.7
Business Education 151 44.7 3.1 3.1 3.0 3.1 3.1 3.1 3.1 2.9 2.9 2.9 3.0 3.0 2.7 2.7 2.9 15.3 14.9 14.5
Early Childhood 3,119 43.1 3.0 3.1 3.0 3.0 3.0 3.1 3.0 2.9 2.3 2.7 2.9 2.8 2.4 2.9 2.9 15.1 14.0 14.0
Educational Technology Specialist 6
Elementary Education 6,093 45.7 3.0 3.1 3.1 3.1 3.0 3.1 3.0 3.0 3.1 2.8 3.1 3.3 2.8 2.9 3.1 15.4 15.0 15.2
Elementary Literacy 3,994 45.2 3.0 3.1 3.2 3.1 3.0 3.1 3.0 2.9 3.0 2.8 3.0 3.2 2.8 2.9 3.1 15.3 14.9 15.0

edTPA ANNUAL ADMINISTRATIVE REPORT Data range: 1/1/2016 - 12/31/2016
45
Means N
Total Score Mean
Planning Instruction Assessment Mean by Task
P01 P02 P03 P04 P05 I06 I07 I08 I09 I10 A11 A12 A13 A14 A15 P I A
Elementary Mathematics 2,995 45.9 3.3 3.2 3.2 3.0 3.0 3.1 3.1 3.0 3.0 2.9 3.2 3.2 2.8 2.9 3.1 15.6 15.0 15.2
English as an Additional Language 433 48.7 3.5 3.3 3.3 3.3 3.4 3.3 3.3 3.2 3.0 3.2 3.3 3.3 2.9 3.2 3.3 16.9 15.9 16.0
Family and Consumer Sciences 86 43.6 3.2 3.1 3.1 3.0 3.0 3.1 3.0 2.9 3.0 2.9 2.9 2.8 2.5 2.5 2.7 15.3 14.8 13.4
Health Education 105 36.3 2.5 2.6 2.5 2.5 2.5 3.0 2.3 2.3 2.3 2.3 2.4 2.6 2.1 2.2 2.2 12.6 12.2 11.4
K-12 Performing Arts 1,455 45.2 3.2 3.1 3.2 3.1 3.1 3.1 2.9 2.8 3.1 2.8 3.0 3.2 2.7 2.9 3.1 15.6 14.6 14.9
Library Specialist 52 48.9 3.7 3.7 3.3 3.3 3.7 3.5 3.3 3.0 3.4 3.1 3.2 3.2 2.6 3.0 3.0 17.7 16.3 14.9
Literacy Specialist 8
Middle Childhood English-Lang. Arts 480 47.5 3.5 3.2 3.5 3.1 3.3 3.2 3.1 3.1 3.0 2.9 3.2 3.4 2.9 2.9 3.2 16.6 15.3 15.6
Middle Childhood History/Social Studies 397 45.5 3.3 3.2 3.2 3.1 3.1 3.1 3.0 2.9 2.9 2.8 3.1 3.3 2.8 2.8 3.0 15.7 14.8 14.9
Middle Childhood Mathematics 531 44.0 3.1 2.8 3.2 2.8 3.0 3.1 2.8 2.8 3.0 2.7 3.1 3.3 2.8 2.8 2.9 14.9 14.3 14.8
Middle Childhood Science 416 45.4 3.2 3.1 3.2 3.1 3.2 3.2 2.9 3.0 2.7 2.8 3.1 3.3 2.8 2.9 2.9 15.8 14.5 15.1
Physical Education 1,017 44.3 3.2 3.2 2.9 2.9 2.9 3.3 3.1 3.5 3.1 2.7 2.7 3.0 2.4 2.5 2.7 15.2 15.7 13.4
Secondary English-Language Arts 2,459 46.7 3.3 3.2 3.2 3.1 3.2 3.2 3.1 3.1 3.0 2.9 3.2 3.3 2.8 3.0 3.1 16.0 15.3 15.3
Secondary History/Social Studies 2,265 44.6 3.1 3.1 3.1 3.0 3.1 3.0 3.0 2.9 2.8 2.8 3.0 3.1 2.7 2.8 3.0 15.3 14.6 14.6
Secondary Mathematics 1,744 41.5 2.9 2.6 2.9 2.6 2.6 3.1 2.7 2.7 2.9 2.5 2.9 3.2 2.6 2.6 2.7 13.7 13.8 14.0
Secondary Science 1,735 45.7 3.3 3.2 3.3 3.0 3.2 3.2 2.9 3.0 2.6 2.7 3.2 3.4 2.8 2.9 3.0 16.1 14.4 15.2
Special Education 4,427 43.9 3.0 3.0 3.1 3.1 2.8 3.2 3.1 3.0 3.0 2.7 2.6 3.0 2.6 3.0 2.7 15.0 15.0 13.9
Technology and Engineering Education 66 40.7 3.2 2.8 2.8 2.9 2.7 3.1 2.8 2.8 2.8 2.5 2.6 2.5 2.3 2.5 2.5 14.4 14.0 12.3
Visual Arts 625 46.9 3.6 3.3 3.3 3.2 3.5 3.2 3.2 3.1 3.1 2.8 3.1 3.2 2.7 2.8 2.9 16.9 15.3 14.7

edTPA ANNUAL ADMINISTRATIVE REPORT Data range: 1/1/2016 - 12/31/2016
46
Means N
Total Score Mean
Planning Instruction Assessment Mean by Task
P01 P02 P03 P04 P05 I06 I07 I08 I09 I10 A11 A12 A13 A14 A15 P I A
All 13-Rubric Handbooks 672 35.9 3.1 3.0 3.1 3.0 3.1 2.6 2.5 1.9 2.5 2.9 3.0 2.6 2.7 12.2 12.6 11.1
Classical Languages 17 35.5 3.1 2.8 3.4 3.1 3.1 2.6 2.6 1.9 2.5 2.4 2.8 2.6 2.5 12.3 12.8 10.4
World Language 655 35.9 3.1 3.0 3.1 3.0 3.1 2.6 2.4 1.9 2.5 2.9 3.0 2.6 2.7 12.2 12.6 11.1
Means N
Total Score Mean
Planning Instruction Assessment Mathematics Mean by Task
P01 P02 P03 P04 P05 I06 I07 I08 I09 I10 A11 A12 A13 A14 A15 M19 M20 M21 P I A
All 18-Rubric Handbooks 6,022 54.5 3.0 3.1 3.2 3.1 3.0 3.1 3.0 3.0 3.1 2.8 3.1 3.3 2.8 2.9 3.1 2.9 3.0 2.8 15.4 15.0 15.3
Elementary Education 6,022 54.5 3.0 3.1 3.2 3.1 3.0 3.1 3.0 3.0 3.1 2.8 3.1 3.3 2.8 2.9 3.1 2.9 3.0 2.8 15.4 15.0 15.3

edTPA ANNUAL ADMINISTRATIVE REPORT Data range: 1/1/2016 - 12/31/2016
47
Appendix C: Score Distributions by Content Field The following tables present the mean scores and distribution of total scores across 15-, 13-, and 18-rubric content fields.
N
Distribution of Total Score (%)
Mean Score < 35 35 36 37 38 39 40 41 42 > 42
15 Rubrics Handbook
34,786 45.0 7 2 2 3 2 2 3 4 4 71 National All 15-Rubric Handbooks
National Agricultural Education 127 49.2 2 2 2 1 1 1 2 2 1 87
Business Education 151 44.7 3 4 1 5 2 3 4 5 6 67
Early Childhood 3,119 43.1 7 2 4 4 3 3 4 6 5 62
Educational Technology Specialist 6
Elementary Education 6,093 45.7 7 2 2 2 2 2 2 3 4 74
Elementary Literacy 3,994 45.2 5 2 2 2 2 2 3 4 4 74
Elementary Mathematics 2,995 45.9 4 1 2 2 1 2 3 3 3 78
English as an Additional Language 433 48.7 6 2 2 2 1 0 1 1 1 85
Family and Consumer Sciences 86 43.6 10 5 2 1 3 3 3 7 5 59
Health Education 105 36.3 50 3 5 6 1 2 3 2 4 25
K-12 Performing Arts 1,455 45.2 7 1 3 3 2 3 3 4 3 71
Library Specialist 52 48.9 8 2 6 4 2 79
Literacy Specialist 8
Middle Childhood English-Lang. Arts 480 47.5 6 1 1 1 1 1 2 2 3 81
Middle Childhood History/Social Studies 397 45.5 5 2 3 4 1 3 2 5 5 70
Middle Childhood Mathematics 531 44.0 7 1 1 3 4 4 4 5 5 67
Middle Childhood Science 416 45.4 6 2 2 2 1 2 2 5 3 74

edTPA ANNUAL ADMINISTRATIVE REPORT Data range: 1/1/2016 - 12/31/2016
48
N
Distribution of Total Score (%)
Mean Score < 35 35 36 37 38 39 40 41 42 > 42
Physical Education 1,017 44.3 11 1 3 5 2 2 3 3 4 66
Secondary English-Language Arts 2,459 46.7 4 1 1 3 1 1 2 2 2 81
Secondary History/Social Studies 2,265 44.6 6 2 2 3 2 2 2 4 5 73
Secondary Mathematics 1,744 41.5 13 4 5 8 3 4 4 6 6 49
Secondary Science 1,735 45.7 7 2 3 3 2 2 2 2 4 74
Special Education 4,427 43.9 11 3 3 4 2 3 3 4 4 63
Technology and Engineering Education 66 40.7 26 5 2 2 5 2 5 9 47
Visual Arts 625 46.9 5 1 2 3 1 1 2 2 4 80
N
Distribution of Total Score (%)
Mean Score < 30 30 31 32 33 34 35 > 35
13 Rubrics Handbook
672 35.9 17 3 8 2 3 5 8 53 National All 13-Rubric Handbooks
National Classical Languages 17 35.5 12 18 12 24 6 29
World Language 655 35.9 17 4 9 2 3 4 8 54
18 Rubric Handbook N
Distribution of Total Score (%)
Mean Score < 40 40 41 42 43 44 45 46 47 48 49 > 49
National Elementary Education 6,022 54.5 6 1 1 2 1 3 1 1 2 2 2 78

edTPA ANNUAL ADMINISTRATIVE REPORT Data range: 1/1/2016 - 12/31/2016
49
Appendix D: Portfolios Represented by State
The following table shows all states that submitted edTPA portfolios during the 2016 administrative year, and the approximate percentage of the total sample that each state contributed.
State Approx %
AL 1%
AR <1%
AZ <1%
CA 7%
CO <1%
CT <1%
DE <1%
GA 11%
HI <1%
IA <1%
IL 13%
IN <1%
LA <1%
MD <1%
MI <1%
MN 8%
MO <1%
NC 3%
NJ <1%
NY 20%
OH 9%
OR 2%
PA <1%
SC <1%
TN 4%
UT <1%
VA <1%
WA 7%
WI 8%
WV <1%
WY <1%

edTPA ANNUAL ADMINISTRATIVE REPORT Data range: 1/1/2016 - 12/31/2016
50
Appendix E: Consequential Use by Content Field The following table presents a comparison of average scores and standard deviations of portfolios from all states, from states without consequential policy, and from states with consequential policy for all 15-, 13-, and 18-rubric handbooks.
All Non-Policy Policy States
N Mean Std
Deviation N Mean Std
Deviation N Mean Std
Deviation
15 Rubrics Field
127 49.16 8.11 21 48.19 8.62 106 49.35 8.04 Agricultural Education
Business Education 151 44.73 6.10 25 45.40 6.04 126 44.60 6.12
Early Childhood 3119 43.13 5.54 1313 42.94 5.73 1806 43.27 5.40
Educational Technology Specialist 6 44.00 6.96 3 39.00 1.73 3 49.00 6.56
Elementary Education 6093 45.69 6.99 1421 43.31 7.46 4672 46.41 6.68
Elementary Literacy 3994 45.24 6.18 378 44.48 6.47 3616 45.32 6.14
Elementary Mathematics 2995 45.93 6.01 182 45.19 7.47 2813 45.97 5.90
English as an Additional Language 433 48.74 7.90 59 49.12 8.90 374 48.68 7.74
Family and Consumer Sciences 86 43.57 8.34 12 43.33 4.66 74 43.61 8.82
Health Education 105 36.27 7.72 28 37.07 6.13 77 35.97 8.24
K-12 Performing Arts 1455 45.18 6.93 377 43.62 7.14 1078 45.72 6.77
Library Specialist 52 48.87 10.64 6 47.17 9.66 46 49.09 10.84
Literacy Specialist 8 37.25 8.68 3 38.67 10.26 5 36.40 8.76
Middle Childhood English-Language Arts 480 47.54 7.23 189 47.40 7.68 291 47.64 6.94
Middle Childhood History/Social Studies 397 45.52 6.73 148 45.66 6.66 249 45.43 6.77
Middle Childhood Mathematics 531 44.02 6.33 189 43.66 6.83 342 44.22 6.03

edTPA ANNUAL ADMINISTRATIVE REPORT Data range: 1/1/2016 - 12/31/2016
51
All Non-Policy Policy States
N Mean Std
Deviation N Mean Std
Deviation N Mean Std
Deviation
Middle Childhood Science 416 45.41 6.88 158 44.89 6.73 258 45.74 6.97
Physical Education 1017 44.33 7.39 167 41.65 7.66 850 44.86 7.22
Secondary English-Language Arts 2459 46.68 6.68 534 45.28 6.73 1925 47.07 6.61
Secondary History/Social Studies 2265 44.59 6.00 493 43.07 6.29 1772 45.02 5.85
Secondary Mathematics 1744 41.53 5.98 373 39.89 6.42 1371 41.98 5.78
Secondary Science 1735 45.73 7.09 308 43.71 7.35 1427 46.16 6.96
Special Education 4427 43.90 7.86 917 42.85 7.79 3510 44.17 7.86
Technology and Engineering Education 66 40.73 8.97 17 41.18 9.04 49 40.57 9.03
Visual Arts 625 46.95 7.17 146 44.79 7.41 479 47.61 6.97
All 34786 44.95 6.89 7467 43.50 7.10 27319 45.35 6.78
13 Rubrics Field
17 35.47 5.77 2 33.00 1.41 15 35.80 6.07 Classical Languages
World Language 655 35.94 6.47 119 35.55 6.71 536 36.03 6.43
All 672 35.93 6.45 121 35.51 6.66 551 36.02 6.41
18 Rubrics Field
6022 54.48 8.43 1391 51.54 9.02 4631 55.36 8.04 Elementary Education
All 6022 54.48 8.43 1391 51.54 9.02 4631 55.36 8.04

edTPA ANNUAL ADMINISTRATIVE REPORT Data range: 1/1/2016 - 12/31/2016
52
Appendix F: ANOVAs and Post-hoc Analyses Each ANOVA was run using the general linear model because it is more robust to unbalanced group sizes. Within an ANOVA table, a Sig* indicates the subgroups do not have homogeneous variances and the significance comes from A Welch’s ANOVA, which better controls the Type I error rate in the case of heterogeneous variance.
Note: Analyses presented do not include portfolios that do not fall into an interpretable category for that demographic field (i.e., other, unidentified) or have a sample size of less than 100. Due to unequal sample sizes and variances between subgroups, all comparisons should be interpreted with caution.
Table 1: Teaching Placement Context
ANOVA
Sum of Squares Df Mean Square F Sig.*
Between Groups 6836.150 4 1709.038 37.42 <.0001
Within Groups 1247431.562 27314 45.670
Total 1254267.712 27318
Post Hoc Analyses
School Locale Difference Between
Means Suburb - City 0.46196*** Suburb - Town 1.09243*** Suburb - Rural 1.41348*** City - Suburb -0.46196*** City - Town 0.63047*** City - Rural 0.95152*** Town - Suburb -1.09243*** Town - City -0.63047*** Town - Rural 0.32105 Rural - Suburb -1.41348*** Rural - City -0.95152*** Rural - Town -0.32105 *** Comparisons significant at the 0.05 level

edTPA ANNUAL ADMINISTRATIVE REPORT Data range: 1/1/2016 - 12/31/2016
53
Table 2: Ethnicity ANOVA
Sum of Squares df Mean Square F Sig.* Between Groups 13062.693 7 1866.099 41.06 <.0001 Within Groups 1241205.019 27311 45.447 Total 1254267.712 27318
Post Hoc Analyses
Ethnicity Difference
Between Means Asian - Hispanic 1.14758***
Asian - White 1.14909*** Asian - Black 3.67117***
Asian - NatAm 4.92871*** Hispanic - Asian -1.14758*** Hispanic - White 0.00151 Hispanic - Black 2.52359***
Hispanic - NatAm 3.78112*** White - Asian -1.14909***
White - Hispanic -0.00151 White - Black 2.52209***
White - NatAm 3.77962*** Black - Asian -3.67117***
Black - Hispanic -2.52359*** Black - White -2.52209***
Black - NatAm 1.25753

edTPA ANNUAL ADMINISTRATIVE REPORT Data range: 1/1/2016 - 12/31/2016
54
Table 3: Primary Language ANOVA
Sum of
Squares df Mean Square F Sig.* Between Groups 9.065 2 4.532 0.10 0.9060 Within Groups 1254258.647 27316 45.917 Total 1254267.712 27318
Table 4: Gender ANOVA
Sum of
Squares df Mean Square F Sig.* Between Groups 10348.993 1 10348.993 227.70 <.0001 Within Groups 1229941.720 27061 45.451 Total 1240290.712 27062
Table 5: Education level ANOVA
Sum of Squares df Mean Square F Sig.* Between Groups 2677.544 3 892.515 19.48 <.0001 Within Groups 1251590.168 27315 45.821 Total 1254267.712 27318

edTPA ANNUAL ADMINISTRATIVE REPORT Data range: 1/1/2016 - 12/31/2016
55
Appendix G: Demographic Subgroups within Teaching Context The following tables present cross-tabs breakdowns of candidates’ ethnicity and gender within each teaching context.
Table 1: Ethnicity by Teaching Context
Mean N Std.
Deviation
Teaching Context Ethnicity
42.97 1035 7.24 City African American/Black
American Indian or Alaskan Native 42.44 27 6.20
Asian or Pacific Islander 46.21 737 7.01
Hispanic 45.37 1195 6.62
White 45.70 7373 6.77
Multiracial 45.73 419 6.96
Other 45.14 239 7.19
Undeclared 45.24 418 7.25
Rural African American/Black 42.25 175 7.80
American Indian or Alaskan Native 35.81 21 8.21
Asian or Pacific Islander 46.09 54 6.60
Hispanic 45.09 150 6.25
White 44.58 3941 6.75
Multiracial 44.75 75 5.36
Other 43.25 20 6.33
Undeclared 43.49 65 6.82

edTPA ANNUAL ADMINISTRATIVE REPORT Data range: 1/1/2016 - 12/31/2016
56
Suburb African American/Black 43.49 331 7.06
American Indian or Alaskan Native 45.84 32 6.33
Asian or Pacific Islander 47.57 353 6.72
Hispanic 45.76 486 6.61
White 45.89 7091 6.46
Multiracial 46.76 228 6.78
Other 46.38 81 8.69
Undeclared 45.63 210 7.31
Town African American/Black 41.47 76 7.19
American Indian or Alaskan Native 38.20 10 6.21
Asian or Pacific Islander 46.22 32 5.89
Hispanic 45.52 124 6.58
White 44.85 2149 6.64
Multiracial 45.40 52 5.98
Other 43.44 16 7.59
Undeclared 45.30 50 6.67
Declined to answer African American/Black 51.00 2 7.07
American Indian or Alaskan Native 46.00 1 .
Asian or Pacific Islander 42.00 1 .
Hispanic 53.50 2 2.12
White 44.44 41 6.49
Multiracial 50.00 2 4.24
Other 44.00 1 .
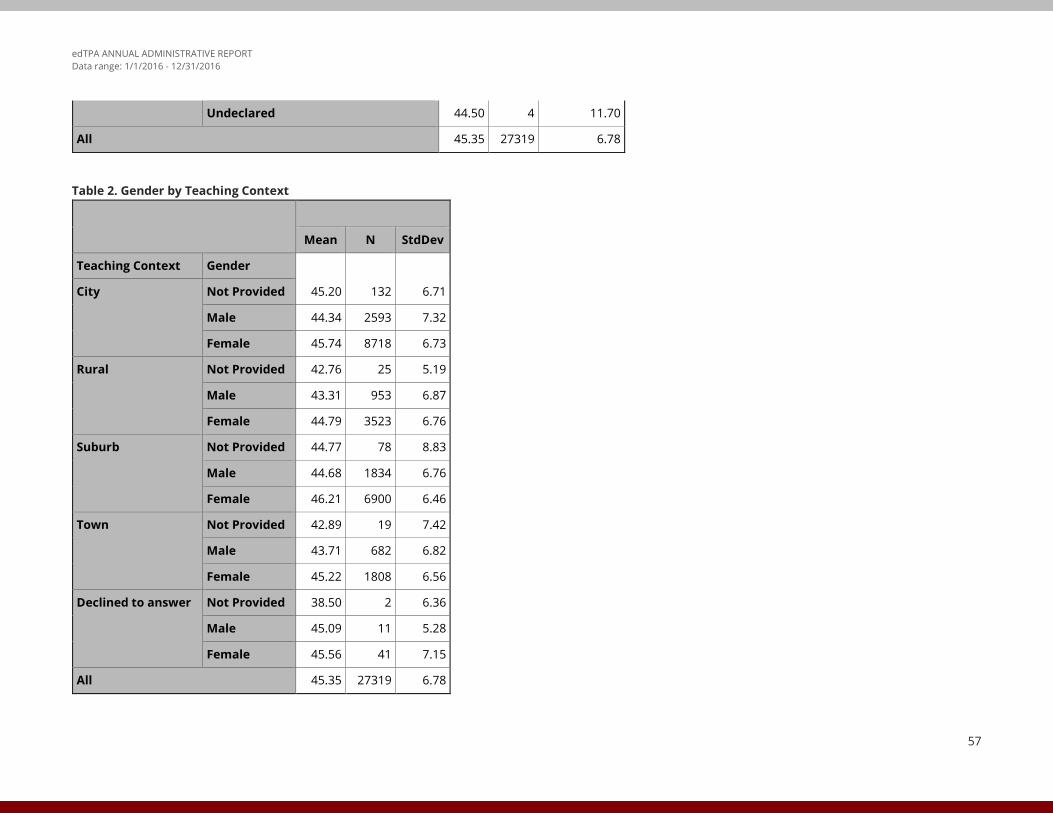
edTPA ANNUAL ADMINISTRATIVE REPORT Data range: 1/1/2016 - 12/31/2016
57
Undeclared 44.50 4 11.70
All 45.35 27319 6.78
Table 2. Gender by Teaching Context
Mean N StdDev
Teaching Context Gender
45.20 132 6.71 City Not Provided
Male 44.34 2593 7.32
Female 45.74 8718 6.73
Rural Not Provided 42.76 25 5.19
Male 43.31 953 6.87
Female 44.79 3523 6.76
Suburb Not Provided 44.77 78 8.83
Male 44.68 1834 6.76
Female 46.21 6900 6.46
Town Not Provided 42.89 19 7.42
Male 43.71 682 6.82
Female 45.22 1808 6.56
Declined to answer Not Provided 38.50 2 6.36
Male 45.09 11 5.28
Female 45.56 41 7.15
All 45.35 27319 6.78
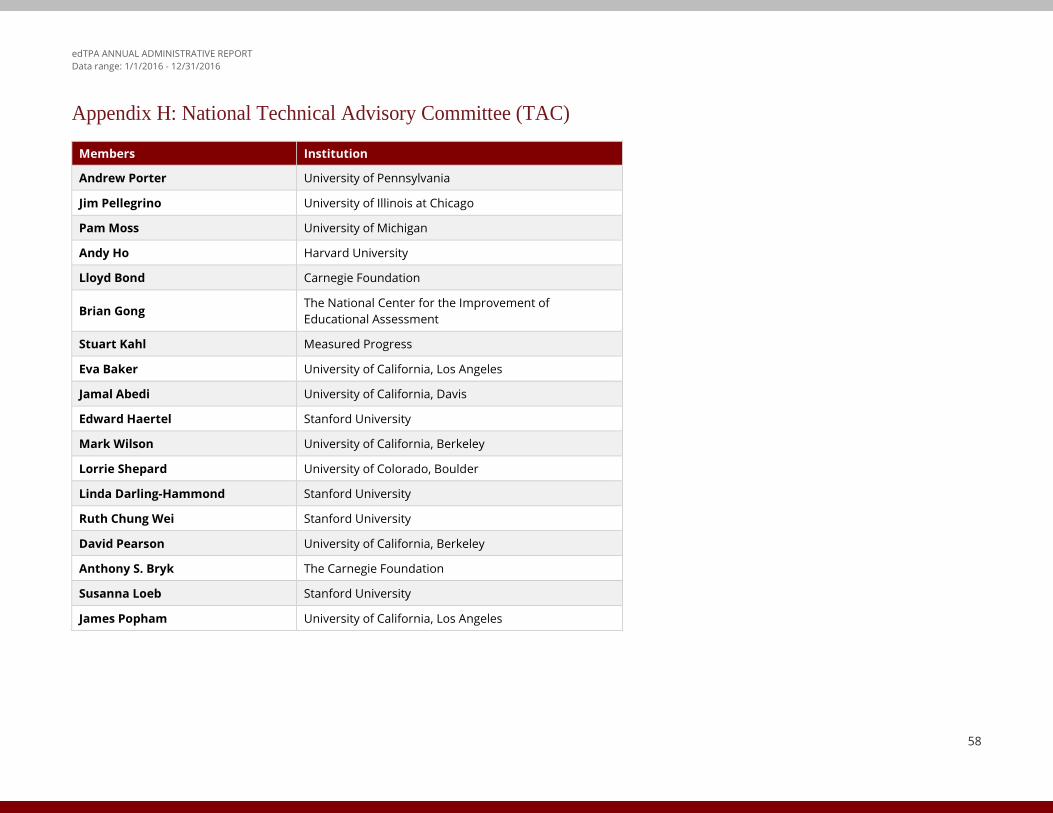
edTPA ANNUAL ADMINISTRATIVE REPORT Data range: 1/1/2016 - 12/31/2016
58
Appendix H: National Technical Advisory Committee (TAC)
Members Institution
Andrew Porter University of Pennsylvania
Jim Pellegrino University of Illinois at Chicago
Pam Moss University of Michigan
Andy Ho Harvard University
Lloyd Bond Carnegie Foundation
Brian Gong The National Center for the Improvement of Educational Assessment
Stuart Kahl Measured Progress
Eva Baker University of California, Los Angeles
Jamal Abedi University of California, Davis
Edward Haertel Stanford University
Mark Wilson University of California, Berkeley
Lorrie Shepard University of Colorado, Boulder
Linda Darling-Hammond Stanford University
Ruth Chung Wei Stanford University
David Pearson University of California, Berkeley
Anthony S. Bryk The Carnegie Foundation
Susanna Loeb Stanford University
James Popham University of California, Los Angeles

edTPA ANNUAL ADMINISTRATIVE REPORT Data range: 1/1/2016 - 12/31/2016
59
Citations Adkins, A., Klass, P., & Palmer, E. (2015). Identifying demographic and preserve teacher performance predictors of success on the edTPA. Paper Presented at the 2015 Hawaii
International Conference on Education. Honolulu, Hawaii.
American Educational Research Association, American Psychological Association, National Council on Measurement in Education. (2014). Standards for educational and psychological testing. Washington, DC: American Educational Research Association.
Bastian, K., Henry, G., & Lys, D. (2016). Teacher candidate performance assessments: Local scoring and implications for teacher preparation program improvement. Teaching and Teacher Education, Volume 59, October 2016, pages 1-12.
Bastian, K., & Lys, D. (2016). Initial Findings from edTPA Implementation in North Carolina. Education Policy Initiative at Carolina (EPIC). https://publicpolicy.unc.edu/files/2016/10/Initial-Findings-from-edTPA-Implementation.pdf
Bell, C. A., Gitomer, D. H., McCaffrey, D. F., Hamre, B. K., Pianta, R. C., & Qi, Y. (2012). An argument approach to observation protocol validity. Educational Assessment, 17(2-3), 62–87. doi:10.1080/10627197.2012.715014
Benner, S. M., & Wishart, B. (2015) Teacher preparation program impact on student learning: Correlations between edTPA, and VAM levels of effectiveness. Paper presented at the 2015 annual meeting of the meeting of the American Educational Research Association, Chicago, IL.
Black, P., & Wiliam, D. (1998). Inside the black box: Raising standards through classroom assessment. Phi Delta Kappan, 80(2), 139–148.
Brennan, R. L., & Prediger, D. J. (1981). Coefficient Kappa: Some uses, misuses, and alternatives. Educational and Psychological Measurement, 41(3), 687-699.
Brown, T. A. (2006). Confirmatory factor analysis for applied research. New York: The Guilford Press.
Cavalluzzo, L., Barrow, L., Mokher, C., Geraghty, T., & Sartain, L. (2014). From Large Urban to Small Rural Schools: An empirical study of National Board certification and teaching effectiveness. Alexandria, VA: The CNA Corporation. Retrieved from http://www.cna.org/sites/default/files/research/IRM-2015-U 010313.pdf
Cowan, J., & Goldhaber, D. (2015). National Board Certification and Teacher Effectiveness: Evidence from Washington. Technical Report 2015-1, Center for Education Data and Research, Seattle, WA. Retrieved from http://www.cedr.us/papers/working/CEDR%20WP%2020153_NBPTS%20Cert.pdf
Chodorow, M., & Burstein, J. (2004). Beyond Essay Length: Evaluating e-raters’ performance on TOEFL testing. ETS Research Report Series, 2004(1), i-38.
Chung, R. R. (2008). Beyond assessment: Performance assessments in teacher education. Teacher Education Quarterly, 35(1), 8-28.
Cochran-Smith, M., Stern, R., Sanchez, J.G., Miller, A., Keefe, E., Fernandez, M.B., Chang, W-C., Carney, M.C., Burton, S., & Baker, M. (2016). Holding Teacher Preparation Accountable: A Review of Claims and Evidence. National Education Policy Center, Boulder, CO.
Cohen, J. (1960). A coefficient of agreement for nominal scales. Educational and Psychological Measurement, 20(1), 37-46.
Cronbach, L. J. (1951). Coefficient alpha and the internal structure of tests. Psychometrika, 16, 297-334.

edTPA ANNUAL ADMINISTRATIVE REPORT Data range: 1/1/2016 - 12/31/2016
60
Darling-Hammond, L. (2010). Evaluating teacher effectiveness: How teacher performance assessments can measure and improve teaching. Washington, DC: Center for American Progress.
Darling-Hammond, L., & Falk, B. (2013). Teacher learning through assessment: How student-performance assessments can support teacher learning. Center for American Progress. Retrieved from www.americanprogress.org
Darling-Hammond, L., & Hyler, M. E. (2013). The role of performance assessment in developing teaching as a profession. Rethinking Schools, 27(4), 1–5.
Darling-Hammond, L., Newton, S. P., & Wei, R. C. (2013). Developing and assessing beginning teacher effectiveness: The potential of performance assessments. Educational Assessment, Evaluation and Accountability, 25(3), 179-204.
Duckor, B., Castellano, K. E., Tellez, K., Wihardini, D., & Wilson, M. (2014). Examining the internal structure evidence for the Performance Assessment for California Teachers: A validation study of the Elementary Literacy Teaching Event for Tier I teacher licensure. Journal of Teacher Education, 65(5), 402–420. http://doi.org/10.1177/0022487114542517
Fayne, H., & Qian, G. (2016). What Does It Mean to Be Student Centered? An Institutional Case Study of edTPA Implementation. The New Educator, 12(4), 311-321.
Gardner, P. L. (1970). Test Length and the Standard Error of Measurement. Journal of Educational Measurement, 7: 271–273.
Goldhaber, D., & Hansen, M. (2010). Race, gender, and teacher testing: How informative a tool is teacher licensure testing? American Educational Research Journal, 47(1), 218-251.
Goldhaber, D., Cowan, J., and Theobald, R. (2016). Evaluating Prospective Teachers: Testing the Predictive Validity of the edTPA. CEDR Working Paper 2016-2.2. University of Washington, Seattle, WA. http://www.cedr.us/papers/working/CEDR%20WP%202016-2.2.pdf
Gillham, J. C., & Gallagher, D. (2015). Pilot Implementation of the edTPA in Ohio. Paper presented at the 2015 annual meeting of the American Association of Colleges for Teacher Education, Atlanta, GA.
Haertel, E. H. (2008). Standard setting. In K. E. Ryan & L. A. Shepard (Eds.), The future of test-based educational accountability (pp. 139–154). New York: Taylor & Francis.
Haertel, E. H., Beimers, J. N., & Miles, J. A. (2012). The briefing book method. In G. J. Cizek (Ed.), Setting performance standards: Foundations, methods, and innovations (2nd ed., pp. 283–299). New York, NY: Routledge.
Haertel, E. H., & Lorié, W. A. (2004). Validating standards-based test score interpretations. Measurement: Interdisciplinary Research and Perspectives, 2(12), 61-103.
Himangshu-Pennybacker, S., & Fuller, D. P. (2017). Preparing Pre-Service Candidates as Effective Reflective Practitioners Using edTPA. In Z. Djoub (Ed.), Fostering Reflective Teaching Practice in Pre-Service Education (pp. 205-217). Hershey, PA: IGI Global. doi:10.4018/978-1-5225-2963-7.ch011
Kane, M. (2004). Certification testing as an illustration of argument-based validation. Measurement: Interdisciplinary Research & Perspective, 2(3), 135–170.
Kane, M. (2006). Validation. In R. Brennan (Ed.), Educational measurement (4th ed., pp.17–64). Westport, CT: American Council on Education and Praeger.
edTPA ANNUAL ADMINISTRATIVE REPORT Data range: 1/1/2016 - 12/31/2016
61
Kiefer, T., Robitzsch, A., & Wu, M. L. (2015). Test analysis modules (Version 1.6-0) [R Package]. Retrieved from http://cran.us.r-project.org/web/packages/TAM/index.html
Kleyn, T., López, D., & Makar, C. (2015). What About Bilingualism? A Critical Reflection on the edTPA With Teachers of Emergent Bilinguals. Bilingual Research Journal: The Journal of the National Association for Bilingual Education, 38:1, 88-106. doi:10.1080/15235882.2015.1017029
Lahey, T. (2017). Collaborating to Address the Challenge of Academic Language. Journal of Teacher Education, 68(3).
Lin, S. (2015). Learning through Action: Teacher Candidates and Performance Assessments. Doctoral dissertation, University of Washington, Seattle, WA.
Liu, L. B., & Milman, N. B. (2013). Year one implications of a teacher performance assessment’s impact on Multicultural Education across a secondary education teacher preparation program. Action in Teacher Education, 35(2), 125-142.
Lord, F. M. (1959). Tests of the same length do have the same standard error of measurement. Educational and Psychological Measurement, 19, 233-239.
Masters, G. N. (1982). A Rasch model for partial credit scoring. Psychometrika, 47(2), 149–174.
Mertler, C. A. (2009). Teachers’ assessment knowledge and their perceptions of the impact of classroom assessment professional development. Improving Schools, 12(2), 101-113.
Meuwissen, K., Choppin, J., Cloonan, K., & Shang-Butler, H. (2016). Teaching Candidates’ Experiences with the edTPA as an Initial Certification Test in New York and Washington States: Survey Results from the Second Year of a Two-Year Study. https://doi.org/10.13140/rg.2.2.20644.78726
Otero, V. K. (2006). Moving beyond the ‘‘Get it or don’t’’ conception of formative assessment. Journal of Teacher Education, 57, 247–255.
Pecheone, R. L., &, Chung, R. R. (2006). Evidence in teacher education: The Performance Assessment for California Teachers (PACT). Journal of Teacher Education, 57(1), 22–36. doi:10.1177/0022487105284045
Pecheone, R. L., &, Whittaker, A. (2016). Well prepared teachers inspire student learning. Kappan, 97(7), 8-13.
Peck, C., Gallucci, C., & Sloan, T. (2010). Negotiating implementation of high-stakes performance assessment policies in teacher education: From compliance to inquiry. Journal of Teacher Education, 61(5), 451-463. doi:10.1177/0022487109354520
Peck, C., Gallucci, C., Sloan, T., & Lippincott, A. (2009). Organizational learning and program renewal in teacher education: A socio-cultural theory of learning, innovation and change. Educational Research Review, 4, 16-25. doi:10.1016/j.edurev.2008.06.001
Peck, C., & McDonald, M. (2013). Creating “cultures of evidence” in teacher education: Context, policy and practice in three high data use programs. The New Educator, 9(1), 12-28. doi:10.1080/1547688X.2013.751312
Peck, C. A., Singer-Gabella, M., Sloan, T., & Lin, S. (2014). Driving blind: Why we need standardized performance assessment in teacher education. Journal of Curriculum and Instruction, 8(1), 8-30.
Powers, D. E. (2000). Computing reader agreement for the GRE Writing Assessment. Princeton, NJ: Educational Testing Service.

edTPA ANNUAL ADMINISTRATIVE REPORT Data range: 1/1/2016 - 12/31/2016
62
Ratner, A., & Kolman, J. (2016). Breakers, benders, and obeyers: Inquiring into teacher educators’ mediation of edTPA. Education Policy Analysis Archives, 24(35).
Rosseel, Y. (2012). Lavaan: An R package for structural equation modeling. Journal of Statistical Software, 48(2), 1-36.
Sandholtz, J. H., & Shea, L. M. (2012). Predicting performance: A comparison of university supervisors’ predictions and teacher candidates’ scores on a teaching performance assessment. Journal of Teacher Education, 63(1), 39–50. doi:10.1177/0022487111421175
Sato, M. (2014). What is the underlying conception of teaching of the edTPA? Journal of Teacher Education, 0022487114542518.
Shepard, L. A. (1993). Evaluating test validity. Review of Research in Education, 405-450.
Siegel, M. A., & Wissehr, C. (2011). Preparing for the plunge: Preservice teachers’ assessment literacy. Journal of Science Teacher Education, 22(4), 371-391.
Sloan, T. (2013). Distributed leadership and organizational change: Implementation of a teaching performance measure. The New Educator, 9, 29-53. doi:10.1080/1547688X.2013.751313
Stanford Center for Assessment, Learning and Equity (SCALE). (2013). edTPA Field test: Summary report. Palo Alto, CA: Author.
Stemler, S. E., & Tsai, J. (2008). Best practices in interrater reliability: Three common approaches. Best practices in quantitative methods, 29-4.
Stillman, J., Anderson, L., Arellano, A., Lindquist Wong, P., Berta-Avila, M., Alfaro, C., & Struthers, K. (2013). Putting PACT in context and context in PACT: Teacher educators collaborating around program-specific and shared learning goals. Teacher Education Quarterly, 40(4), 135-157.
Tennessee Department of Education (2016). Subcommittee on Educator Preparation and Licensing, State Board of Education, May 19 and August 12, 2016, Nashville, TN.
Whittaker, A., & Nelson, C. (2013). Assessment with an “End in View”. The New Educator, 9(1), 77-93.
Wu, M. L., Adams, R. J., Wilson, M. R., & Haldane, S. A. (2007). ACER ConQuest version 2.0: Generalised item response modeling software. ACER Press.