relaunch of brc tams slides · 2018-10-04 · coca-cola sprite stoney sparletta fanta iron brew...
TRANSCRIPT

October 2018

2
METHODOLOGY…
ES interview
Leave-behind self-completion
Booklet(collected after 7 days)
P&B modulen=3,154
ESn=12,535
Jan-Jun 2018 Focused, user-friendly,
easy 20-30 mins to complete

3
COMPREHENSIVE DATASET TO HARNESS THE POWER OF THE ESTABLISHMENT SURVEY…
Multi-mediaDemographics
SEM
Brand usage+
Weighted to be fully rep of SA
Multi-media depth
Powerful granular respondent-level branded media data
Single source therefore 100% predictive accuracy
ES Products and Brands
Module
=

4
ES PRODUCTS & BRANDS – VITAL SIGNS…
NATIONAL SAMPLE
Universe: Population aged 15+
40.1 million
3,154 sampleJAN – JUN 2018
70% Metro
15% Urban
15% Rural

5
THE SAMPLE…
Products & Brands sample Re-weighted to population
70% Metro
15%Rural
15% Urban
41% Metro
31%Rural
28% Urban

6
ES PRODUCTS & BRANDS DEMOGRAPHIC LANDSCAPE…
24
2726
15
8 15 - 24
25 - 34
35 - 49
50 - 64
65 +
16.2 millionHOUSEHOLDS
40.1 millionADULTS 15 YEARS+
BLACK
79%
WHITE
9%
COLOURED
9%
INDIAN
3%
4133
2017161614
5433
English
Zulu
Afrikaans
Sepedi
Xhosa
Sesotho
Setswana
Tsonga
Swati
Ndebele
Venda
48%52%
AGE % LANGUAGES SPOKEN IN HOME %
n=3,154

7
ES PRODUCTS & BRANDS DEMOGRAPHIC LANDSCAPE…
8
16
8
30
24
11 31
R0 - R1 999R2 000 - R3 999R4 000 - R4 999R5 000 - R9 999R10 000 - R19 999R20 000 - R39 999R40 000 - R59 999R60 000+
MONTHLY HOUSEHOLD INCOME %AVERAGE: R12,491
49% WORKING
33
50
16
Below Matric
Matric
Tertiary
50% CHILDREN
50% NONE
CHILDREN UNDER 15 YEARS LIVING AT HOME %
R
40
9
20
4
13
10
4
Working full-time
Working part-time
Unemployed
Not looking for work
Student
Retired
Home executive
51% NOT WORKING
n=3,154

Categories/Products Covered
8
9
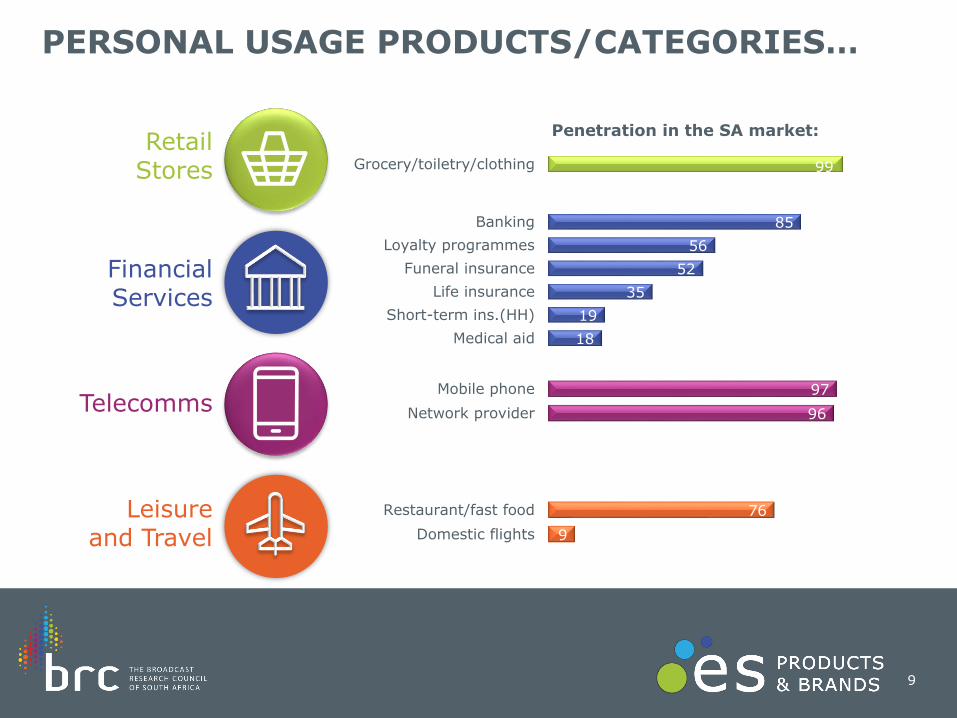
PERSONAL USAGE PRODUCTS/CATEGORIES…
Retail Stores
Financial Services
Telecomms
Leisure and Travel
99Grocery/toiletry/clothing
85
56
52
35
19
18
Banking
Loyalty programmes
Funeral insurance
Life insurance
Short-term ins.(HH)
Medical aid
97
96
Mobile phone
Network provider
76
9
Restaurant/fast food
Domestic flights
Penetration in the SA market:

10
PERSONAL USAGE PRODUCTS/CATEGORIES…
Food
Beverages
Personal Care
99
99
94
92
91
82
79
Bread
Rice/maize/pasta
Condiments/spices
Spreads
Canned food
Breakfast cereals
Chilled proc.meats
96
94
92
91
73
47
31
CSDs
Non-CSDs
Milk
Tea
Instant coffee
Beer/cider
Whisky/brandy/vodka
99
99
97
91
83
64
31
Toothpaste
Hand and body soap
Deodorants
Skin care
OTC medication
Shampoo/hair care
Make-up
11
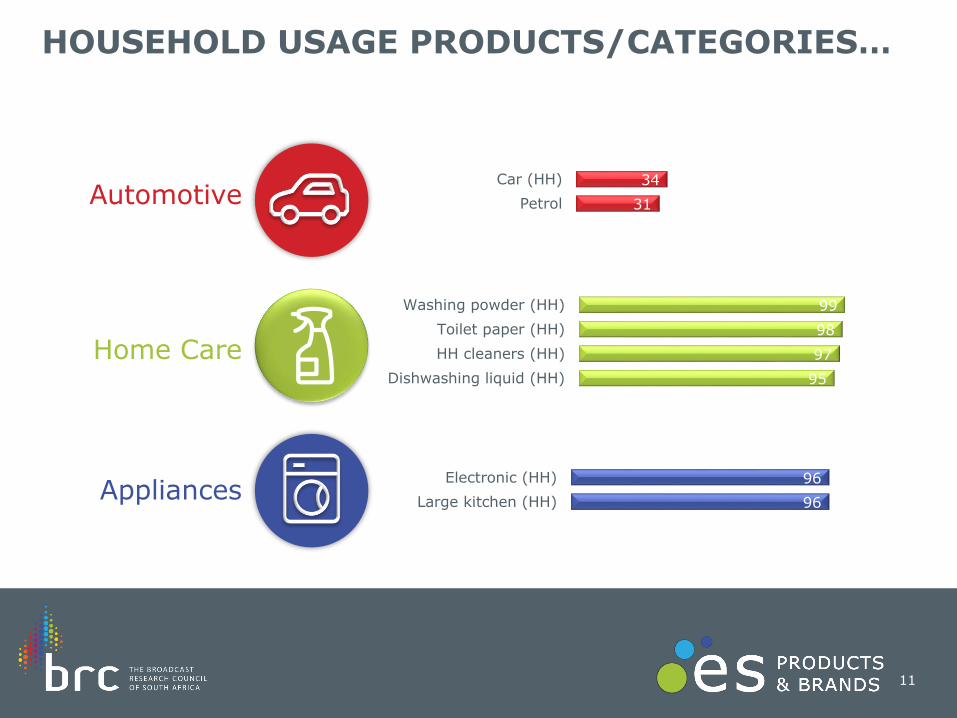
HOUSEHOLD USAGE PRODUCTS/CATEGORIES…
Home Care
Appliances
Automotive34
31
Car (HH)
Petrol
99
98
97
95
Washing powder (HH)
Toilet paper (HH)
HH cleaners (HH)
Dishwashing liquid (HH)
96
96
Electronic (HH)
Large kitchen (HH)
97
95
26
12
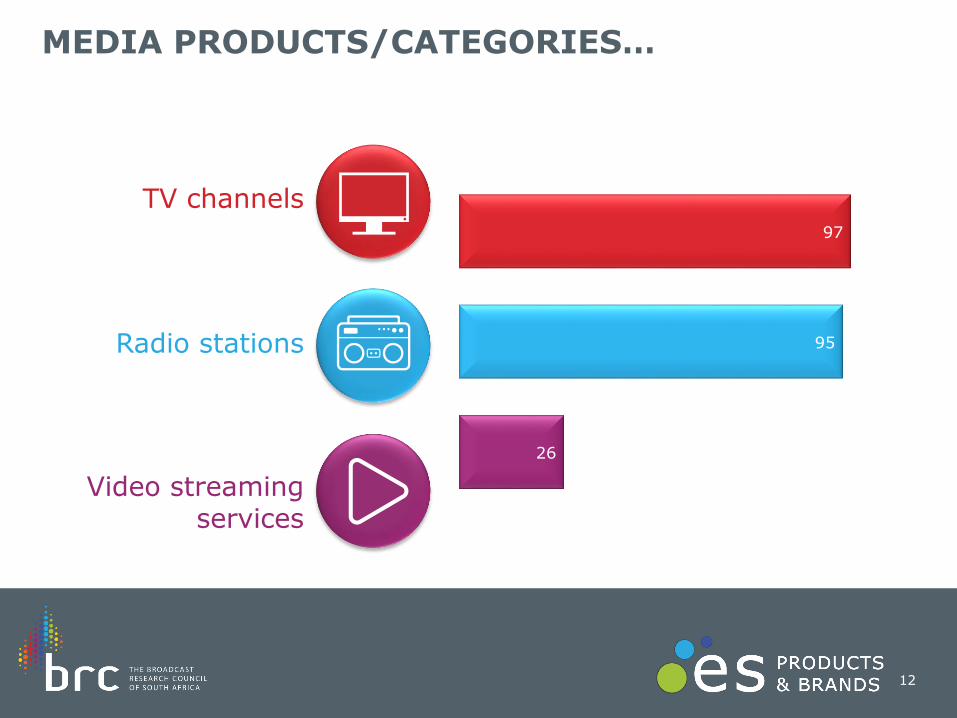
MEDIA PRODUCTS/CATEGORIES…
TV channels
Radio stations
Video streaming services

13
PRODUCT AND BRAND USAGE…
Frequency of product usage
Brand usage
Brand usage
Most often brand
Brand usage
Funeral insuranceLife insuranceShort-term insuranceMedical aidCarsCellphonesMobile network providersToothpasteHand and body soapToilet paperLarge kitchen appliancesElectronic goodsAirlines
Retail storesBankingLoyalty programmesOTC medicationNon-carbonated soft drinksWhisky/brandy/vodkaRice/maize/pastaTV channelsVideo streaming servicesRadio stations
FuelDeodorantsSkin careShampoo/hair careMake-upCarbonated soft drinksMilkTeaInstant coffeeBeer/ciderBreadCondiments/spices/saucesSpreadsCanned foodBreakfast cerealsChilled processed meatsWashing powderHH cleanersDishwashing liquidRestaurants/fast food outlets
14
Retail Stores

15
RETAIL STORES…
68
38
37
34
33
31
26
21
20
19
12
12
Shoprite
Mr Price (MRP)
Pick n Pay
PEP
Spar
Clicks
Ackermans
Checkers
Edgars
Jet
Truworths
Woolworths
Top 12 Retail Stores shopped at in PM (n = 3,154)
45
17
12
7
2
2
17
Shoprite
Pick n Pay
Spar
Checkers
Cambridge Food
Checkers Hyper
Other (Nett)
Most often store: Groceries (Filter: Shoppers n=3,136)
%%

45
17 12 7
Shoprite Pick n Pay Spar Checkers
16
GROCERY STORE – PROFILE…
AVERAGE MONTHLY INCOME
R
18
26
40
14
2
SEM Supergroup 1
SEM Supergroup 2
SEM Supergroup 3
SEM Supergroup 4
SEM Supergroup 5
MO GROCERY STORE:
9
9
33
25
24
13
26
33
12
16
9
12
25
32
22
Household R9,020 R19,200 R12,325 R20,381
Personal R4,239 R10,258 R5,920 R7,736
%

97
93
58
40
20
97
93
75
49
32
98
90
77
61
33
17
GROCERY STORE – MEDIA REACH…
98
93
60
40
15
TV
Radio
Internet
Newspapers
Magazines
P7D MEDIA REACH BY BRAND
%

18
Financial Services

19
12
5
27
19
9
8
7
2
11
EC
FS
GP
KZN
LP
MP
NW
NC
WC %
Financial Services: Banking
44
20
18
18
17
3
1
15
Capitec
FNB
ABSA
Nedbank
Standard Bank
Postbank
African Bank
Do not have a bank
account
41
16
15
14
12
1
Capitec
FNB
ABSA
Standard Bank
Nedbank
Postbank
Banked: 85%
79 1128
Black WhiteIndian Coloured
43
29 28
Metro Urban Rural
20
29
28
15
8
15-24
25-34
35-49
50-64
65+
15
20
35
18
12
SEM SG 1
SEM SG 2
SEM SG 3
SEM SG 4
SEM SG 5
48
52
Male
Female
Personal account with(n=3,154)
Main bank(Filter: Banked people n=2,790)
Profile of Banked people(Filter: Banked people n=2,790)
44
20 18 18 17
Capitec FNB ABSA Nedbank Standard Bank
20
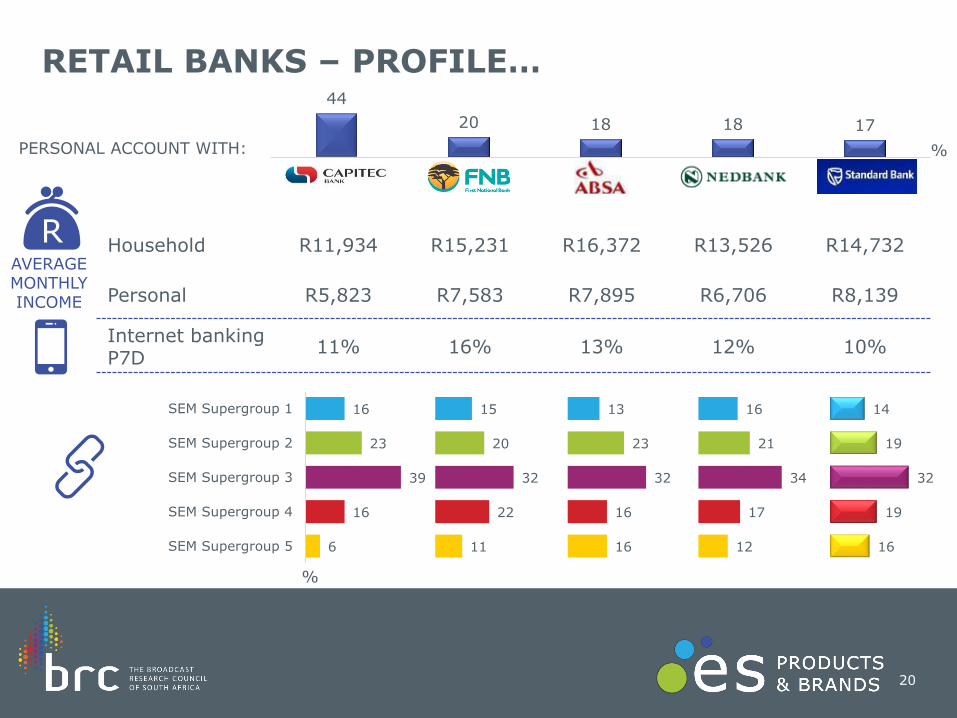
RETAIL BANKS – PROFILE…
AVERAGE MONTHLY INCOME
R
%
16
23
39
16
6
SEM Supergroup 1
SEM Supergroup 2
SEM Supergroup 3
SEM Supergroup 4
SEM Supergroup 5
PERSONAL ACCOUNT WITH:
15
20
32
22
11
13
23
32
16
16
16
21
34
17
12
14
19
32
19
16
Household R11,934 R15,231 R16,372 R13,526 R14,732
Personal R5,823 R7,583 R7,895 R6,706 R8,139
Internet banking P7D
11% 16% 13% 12% 10%
%

97
91
66
42
22
98
87
65
51
24
98
94
71
50
23
98
92
70
45
20
21
RETAIL BANKS – MEDIA REACH…
98
92
71
43
20
TV
Radio
Internet
Newspapers
Magazines
P7D MEDIA REACH BY BRAND
%

22
Telecommunication

23
CELLPHONE TYPES…
%
61
18
39
56
13
31
Smartphone Feature phone Ordinary cellphone
In home Personally use

24
CELLPHONE TYPES – SEM…
3547
5874
89
Supergroup 1 Supergroup 2 Supergroup 3 Supergroup 4 Supergroup 5%
Smartphone
Feature phone
Ordinary cellphone
13 13 14 12 6
Supergroup 1 Supergroup 2 Supergroup 3 Supergroup 4 Supergroup 5%
4940
2818
7
Supergroup 1 Supergroup 2 Supergroup 3 Supergroup 4 Supergroup 5%

25
CELLPHONE BRANDS…
51
27
16
5
5
4
4
3
3
2
1
1
1
3
3
Samsung
Nokia
Huawei
LG
Blackberry
Mobicel
Sony
Vodafone
Apple iPhone
Hisense
Motorola
Alcatel
AG Mobile
Other (Nett)
I do not have a cellphone
Cellphone currently have (n=3,081)
%

20
21
39
16
4
51
2716
5 5
Samsung Nokia Huawei LG Blackberry
26
CELLPHONE BRANDS – PROFILE…
%
14
20
34
18
13
SEM Supergroup 1
SEM Supergroup 2
SEM Supergroup 3
SEM Supergroup 4
SEM Supergroup 5
CELLPHONE CURRENTLY HAVE:
18
27
35
14
6
15
19
40
17
9
19
26
39
11
5
%
Brands smaller than 5% eg. iPhone (3%) not charted

98
90
79
42
19
96
93
48
39
16
27
CELLPHONE BRANDS – MEDIA REACH…
98
93
74
47
24
TV
Radio
Internet
Newspapers
Magazines
P7D MEDIA REACH BY BRAND
96
95
76
49
26
98
93
69
43
22
%
Brands smaller than 5% eg. iPhone (3%) not charted

28
Leisure and Travel

29
Leisure and Travel: Airlines
9
6
35
9
12
11
6
2
10
EC
FS
GP
KZN
LP
MP
NW
NC
WC
Domestic air travellers: 9%
69 18 76
Black WhiteIndian Coloured
48
24 28
Metro Urban Rural
22
29
26
17
6
15-24
25-34
35-49
50-64
65+
7
20
30
20
23
SEM SG 1
SEM SG 2
SEM SG 3
SEM SG 4
SEM SG 5
47
53
Male
Female
5
4
2
2
1
90
Mango
South African Airways
Kulula
British Airways
Safair
I have not travelled by air
within SA in P12M
Domestic flights past 12 months(n=3,154)
Profile of domestic air travellers(Filter: travellers n=295)
%

5 4 2 2 1
Mango South African Airways Kulula British Airways Safair
30
DOMESTIC AIRLINES – PROFILE…
%
4
20
38
21
17
SEM Supergroup 1
SEM Supergroup 2
SEM Supergroup 3
SEM Supergroup 4
SEM Supergroup 5
FLOWN DOMESTICALLY P12M:
12
26
26
16
20
3
19
38
14
26
10
30
26
12
21
2
20
38
9
31
Caution: small base size (n=49)
Caution: small base size (n=49)
%

31
13
5
27
17
9
8
7
2
12
EC
FS
GP
KZN
LP
MP
NW
NC
WC
Diners: 76%
78 103 9
Black WhiteIndian Coloured
45
27 28
Metro Urban Rural
24
28
26
15
7
15-24
25-34
35-49
50-64
65+
13
21
37
17
12
SEM SG 1
SEM SG 2
SEM SG 3
SEM SG 4
SEM SG 5
47
53
Male
Female
Leisure and Travel: Restaurants/Fast Food Outlets
73
25
25
19
17
16
13
13
10
10
10
9
6
5
5
5
3
2
2
2
2
7
3
KFC
Chicken Licken
Debonairs Pizza
Nando’s
Spur
Steers
Fish and Chip Co.
McDonald’s/Mc…
Wimpy
Chesa Nyama
Roman’s Pizza
Hungry Lion
King Pie
FishAways
Burger King
Mugg & Bean
Ocean Basket
Domino’s Pizza
RocoMamas
Something Fishy
Panarottis
Other (Nett)
Not eaten out PM
Repertoire: 2.8 Mentions 2% and above
Visited in past month(Filter: Diners n=2,521)
Profile of diners(Filter: Diners n=2,521)
%

32
Food

33
RICE, MAIZE AND PASTA…
62
42
18
6
1
2
1
Tastic
Spekko
Aunt Caroline
Housebrands/No name…
Royal
Other rice brand
Unsure of rice brand
Rice (97%)
41
27
16
10
7
3
9
2
White Star
Ace
Iwisa
Nyala
Impala
Housebrands/No name…
Other (Nett)
Unsure of maize brand
Maize (90%)
46
8
2
2
Fatti’s & Moni’s
Housebrands/No name…
Barilla
Unsure of pasta brand
Pasta (54%)

15
25
40
15
6
6246 42 41
27
Tastic Fatti’s & Moni’s Spekko White Star Ace
34
RICE, MAIZE, PASTA BRANDS – PROFILE…
%
14
21
34
19
12
SEM Supergroup 1
SEM Supergroup 2
SEM Supergroup 3
SEM Supergroup 4
SEM Supergroup 5
EATEN IN PAST MONTH:
10
19
34
22
16
13
23
39
18
7
14
20
39
19
8
%
35
Beverages
36
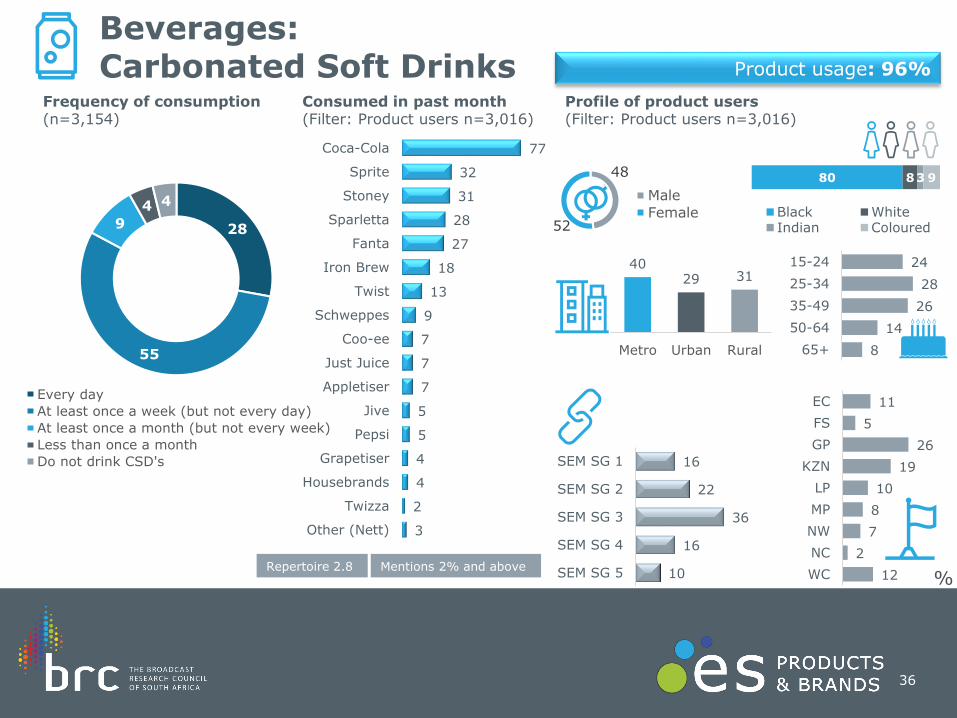
Beverages: Carbonated Soft Drinks
11
5
26
19
10
8
7
2
12
EC
FS
GP
KZN
LP
MP
NW
NC
WC
Product usage: 96%
80 83 9
Black WhiteIndian Coloured
4029 31
Metro Urban Rural
24
28
26
14
8
15-24
25-34
35-49
50-64
65+
16
22
36
16
10
SEM SG 1
SEM SG 2
SEM SG 3
SEM SG 4
SEM SG 5
48
52
Male
Female28
55
9
4 4
Every day
At least once a week (but not every day)
At least once a month (but not every week)
Less than once a month
Do not drink CSD's
77
32
31
28
27
18
13
9
7
7
7
5
5
4
4
2
3
Coca-Cola
Sprite
Stoney
Sparletta
Fanta
Iron Brew
Twist
Schweppes
Coo-ee
Just Juice
Appletiser
Jive
Pepsi
Grapetiser
Housebrands
Twizza
Other (Nett)
Frequency of consumption(n=3,154)
Consumed in past month(Filter: Product users n=3,016)
Profile of product users(Filter: Product users n=3,016)
%Repertoire 2.8 Mentions 2% and above

37
Beverages: Beer/Cider
11
7
28
16
10
10
7
1
10
EC
FS
GP
KZN
LP
MP
NW
NC
WC
Product usage: 47%
81 1027
Black WhiteIndian Coloured
44
27 29
Metro Urban Rural
21
33
30
12
4
15-24
25-34
35-49
50-64
65+
16
20
37
16
11
SEM SG 1
SEM SG 2
SEM SG 3
SEM SG 4
SEM SG 5
61
39
Male
Female
34
28
24
17
17
14
13
11
9
9
4
4
4
3
2
4
1
Castle Lite
Hunter’s …
Heineken
Savanna…
Carling Black Label
Castle Lager/Draught
Flying Fish…
Amstel Lager
Hansa
Redd’s Dry/Original
Windhoek
Amstel Lite
Castle Milk Stout
Lion Larger
Miller Genuine Draft
Other (Nett)
Not consumed in PM
Repertoire: 2.0 Mentions 2% and above
Consumed in past month(Filter: Product users n=1,450)
Profile of product users(Filter: Product users n=1,450)

38
Beverages: Whisky/Brandy/Vodka
11
7
27
18
10
8
6
2
11
EC
FS
GP
KZN
LP
MP
NW
NC
WC
Product usage: 31%
82 1017
Black WhiteIndian Coloured
43
2532
Metro Urban Rural
24
36
26
9
5
15-24
25-34
35-49
50-64
65+
16
20
38
16
10
SEM SG 1
SEM SG 2
SEM SG 3
SEM SG 4
SEM SG 5
69
31
Male
Female
14
11
8
7
7
7
7
7
6
5
5
4
3
3
3
2
2
Smirnoff
Jameson
Russian Bear
Bell’s
Skyy Vodka
J & B
Klipdrift
Johnnie Walker
Three Ships
Black & White
Absolut
Firstwatch
Viceroy
Jack Daniel's
Richelieu
KWV
Chivas Regal
Mentions 2% and above
6
6
6
6
5
4
3
3
2
2
3
Jameson
Bell’s
J & B
Johnnie Walker
Three Ships
Jack Daniel's
Black & White
Firstwatch
Chivas Regal
Glenfiddich
Other (Nett)
Whisky (24%)
8
5
5
3
2
Smirnoff
Russian Bear
Skyy Vodka
Absolut
Cruz Vodka
Vodka (16%)
5
2
2
24
Klipdrift
Richelieu
Viceroy
KWV
Other (Nett)
Brandy (11%)
Mentions 2% and above %
Consumed in past month(n=3,154)
Drink most often(Filter: Product users n=868)
Profile of product users(Filter: Product users n=868)

39
Personal Care

40
Personal Care: Toothpaste
12
5
26
19
10
7
7
2
12
EC
FS
GP
KZN
LP
MP
NW
NC
WC
Product usage: 99%
79 9 3 9
Black WhiteIndian Coloured
41
28 31
Metro Urban Rural
24
27
26
15
8
15-24
25-34
35-49
50-64
65+
16
22
35
17
10
SEM SG 1
SEM SG 2
SEM SG 3
SEM SG 4
SEM SG 5
48
52
Male
Female
71
53
13
8
6
4
Colgate
Aquafresh
Sensodyne
Close-Up
Oral B
Mentadent P
Repertoire: 1.6
Used in past month(n=3,154)
Profile of product users(Filter: Product users n=3,136)
%

41
Personal Care: Hand and Body Soap
12
5
26
19
9
8
7
2
12
EC
FS
GP
KZN
LP
MP
NW
NC
WC
Product usage: 99%
79 9 3 9
Black WhiteIndian Coloured
41
28 31
Metro Urban Rural
23
28
26
15
8
15-24
25-34
35-49
50-64
65+
16
21
36
17
10
SEM SG 1
SEM SG 2
SEM SG 3
SEM SG 4
SEM SG 5
48
52
Male
Female
51
41
31
25
20
15
13
8
2
1
Sunlight
Protex
Dettol
Lux
Lifebuoy
Vaseline
Dove
Palmolive
Housebrands
I have not used soap in
the past month
Used in past month(n=3,154)
Profile of product users(Filter: Product users n=3,143)
%Repertoire: 2.1

42
Automotive

43
CARS IN HOUSEHOLD…
10
9
4
4
3
3
3
2
2
2
2
1
1
66
Toyota
Volkswagen
Ford
BMW
Hyundai
Audi
Nissan
Mercedes-Benz
Opel
Mazda
Kia
Renault
Honda
I do not have a car
Cars in household (n=3,154)
Cars in household: 34%
9
5
35
13
8
9
5
2
14
EC
FS
GP
KZN
LP
MP
NW
NC
WC
Profile of those with cars in HH
(Filter: Cars in HH n=1,039)
59 26 6 9
Black WhiteIndian Coloured56
2618
Metro Urban Rural
5
10
27
29
29
SEM SG 1
SEM SG 2
SEM SG 3
SEM SG 4
SEM SG 5% %

10 9 4 4
Toyota Volkswagen Ford BMW
44
CARS IN HOUSEHOLD – PROFILE…
AVERAGE MONTHLY INCOME
R
%
6
15
27
32
20
SEM Supergroup 1
SEM Supergroup 2
SEM Supergroup 3
SEM Supergroup 4
SEM Supergroup 5
CARS IN HOME:
5
6
28
29
32
3
11
21
30
35
7
18
21
29
25
Household R19,069 R22,203 R25,598 R23,675
Personal R8,341 R11,480 R12,867 R10,211
%
100
95
77
64
39
100
91
76
48
27
98
93
83
60
43
45
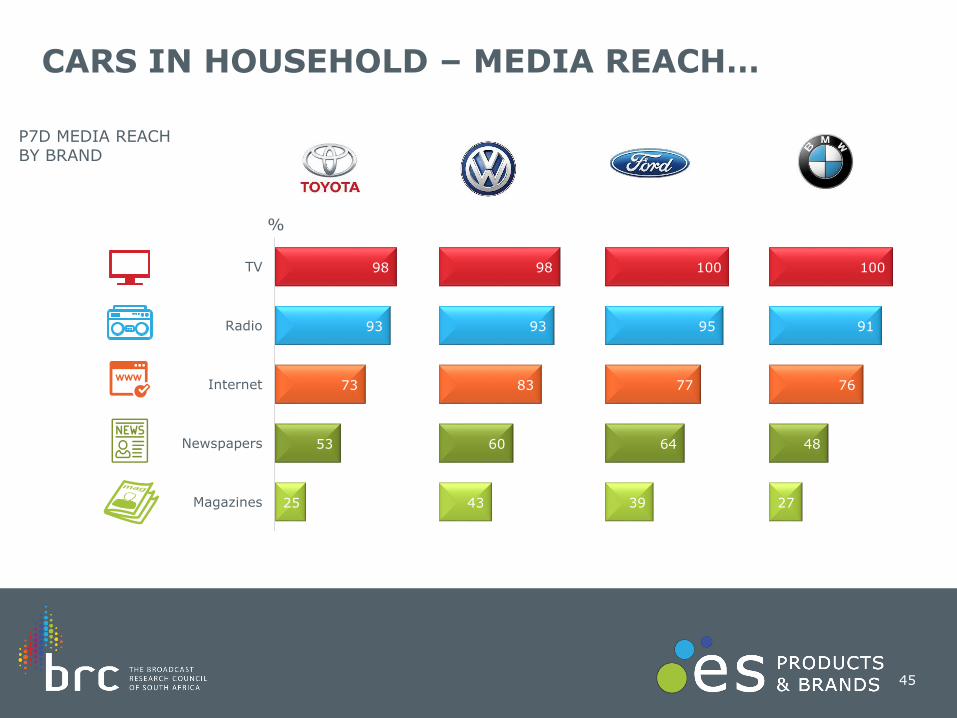
CARS IN HOUSEHOLD – MEDIA REACH…
98
93
73
53
25
TV
Radio
Internet
Newspapers
Magazines
P7D MEDIA REACH BY BRAND
%

46
Product usage: 31%
10
5
32
12
8
11
4
4
14
EC
FS
GP
KZN
LP
MP
NW
NC
WC
59 26 510
Black WhiteIndian Coloured
54
2818
Metro Urban Rural
17
24
28
19
12
15-24
25-34
35-49
50-64
65+
5
10
28
28
29
SEM SG 1
SEM SG 2
SEM SG 3
SEM SG 4
SEM SG 5
56
44
Male
Female
Automotive: Fuel
3
21
6
267
Every day
At least once a week (but not every
day)At least once a month (but not every
week)Less than once a month
Do not visit petrol stations
53
39
37
33
22
18
2
2
1
Engen
BP
Caltex
Shell
Sasol
Total
Exel
Other
Not visited in
PM
Frequency of re-fueling(n=3,154)
Re-fueled at in past month(Filter: Products users n=961)
Profile of product users(Filter: Product uses n=961)
%
47
Homecare

48
Home Care: Dishwashing Liquid
Frequency of usage(n=3,154)
Used in past month(Filter: Product users n=2,995)
Profile of product users(Filter: Product users n=2,995)
ES Products & Brands Module Jan-Jun 2018Data weighted at a Household level
11
5
29
17
10
7
8
2
11
EC
FS
GP
KZN
LP
MP
NW
NC
WC
Product users: 95%
79 1038
Black WhiteIndian Coloured
43
29 28
Metro Urban Rural
15
21
36
17
11
SEM SG 1
SEM SG 2
SEM SG 3
SEM SG 4
SEM SG 5 %
89
4
11
5
Every day
At least once a week (but not every day)
At least once a month (but not every week)
Less than once a month
Do not use dishwashing liquid
87
21
11
10
1
Sunlight
MAQ
Ajax
Housebrands
Other

49
Home Care: Household Cleaners
12
5
29
17
9
7
7
2
12
EC
FS
GP
KZN
LP
MP
NW
NC
WC
Product users: 97%
79 1038
Black WhiteIndian Coloured
43
29 28
Metro Urban Rural
15
22
36
17
10
SEM SG 1
SEM SG 2
SEM SG 3
SEM SG 4
SEM SG 5
Frequency of usage(n=3,154)
Used in past month(Filter: Product users n=3,071)
Profile of product users(Filter: Product users n=3,071)
%
ES Products & Brands Module Jan-Jun 2018Data weighted at a Household level
70
24
312
Every day
At least once a week (but not every day)
At least once a month (but not every week)
Less than once a month
Do not use household cleaners
74
46
42
19
19
18
14
13
9
6
6
1
Handy Andy
Domestos
Jik
Cobra
Dettol
Mr Muscle
Jeyes
Toilet Duck
Housebrands
Harpic
Vanish
Other
Repertoire: 2.7

50
Appliances
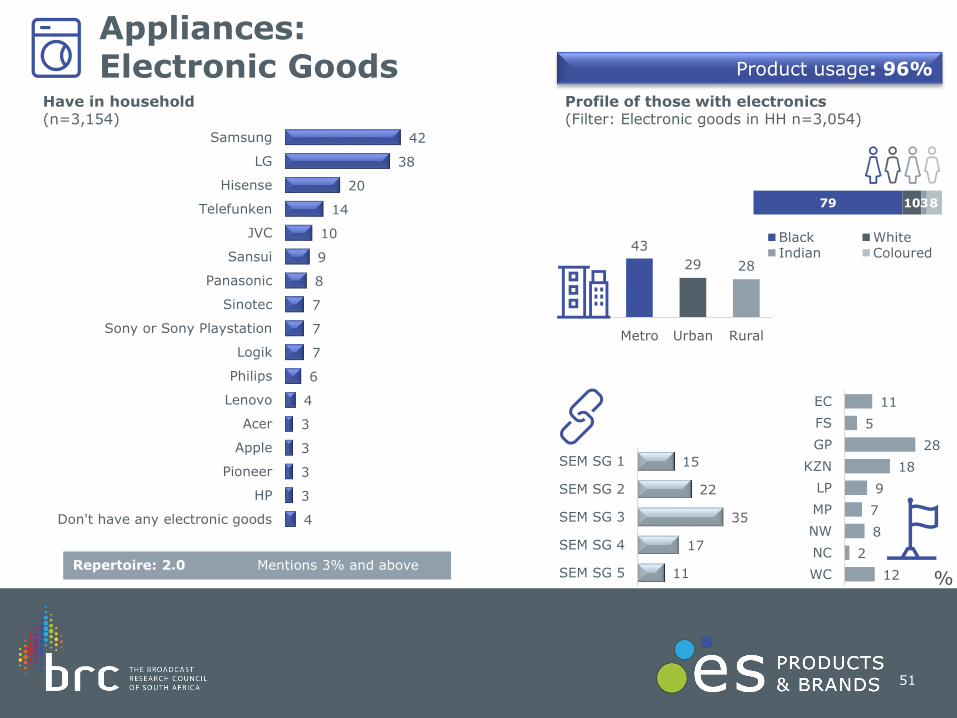
51
Appliances:Electronic Goods
11
5
28
18
9
7
8
2
12
EC
FS
GP
KZN
LP
MP
NW
NC
WC
Product usage: 96%
79 1038
Black WhiteIndian Coloured
43
29 28
Metro Urban Rural
15
22
35
17
11
SEM SG 1
SEM SG 2
SEM SG 3
SEM SG 4
SEM SG 5
42
38
20
14
10
9
8
7
7
7
6
4
3
3
3
3
4
Samsung
LG
Hisense
Telefunken
JVC
Sansui
Panasonic
Sinotec
Sony or Sony Playstation
Logik
Philips
Lenovo
Acer
Apple
Pioneer
HP
Don't have any electronic goods
Repertoire: 2.0 Mentions 3% and above
Have in household(n=3,154)
Profile of those with electronics(Filter: Electronic goods in HH n=3,054)
%

52
TV Channels

76
62
58
51
22
13
13
12
12
12
11
9
9
8
8
8
8
SABC 1
SABC 2
e.tv
SABC 3
Mzansi Magic
Channel O
SuperSport 4
Mzansi Bioskop
M-Net Movies…
SuperSport 3
eMovies
SABC News
SuperSport 1
eExtra
Mzansi Magic Music
eNCA
M-Net
45
9
8
7
3
3
2
2
2
2
2
15
SABC 1
e.tv
Mzansi Magic
SABC 2
SABC 3
M-Net Movies Action
SuperSport 4
SuperSport 3
eNCA
Channel O
Zee World
Other (Nett 1%
mentions)
53
Media: TV
Channels watched past week(n=3,154)
Watch most often(Filter: TV viewers n=3,078)
12
5
26
19
10
7
7
2
12
EC
FS
GP
KZN
LP
MP
NW
NC
WC
Past week viewership: 97%
79 9 3 9
Black WhiteIndian Coloured
41
28 31
Metro Urban Rural
23
28
26
15
8
15-24
25-34
35-49
50-64
65+
15
22
36
17
10
SEM SG 1
SEM SG 2
SEM SG 3
SEM SG 4
SEM SG 5
49
51
Male
Female
Profile of TV viewers(Filter: TV viewers n=3,078)
%Repertoire 5.4 Mentions 8% and above Mentions 2% and above

54
VIEWING BY DEVICE…
% SABC 1 SABC 2 e.tv SABC 3MzansiMagic
ChannelO
MzansiBioskop
M-Net Movies Action
eMoviesSuper-Sport 4
TV set 98 98 98 98 99 99 99 100 100 99
Smart phone
5 5 4 4 7 6 6 6 5 5
Tablet 1 1 1 1 2 3 2 3 1 1
Laptop/ desktop
1 1 1 1 2 1 2 1 2 1

55
VIEWING BY LOCATION…
% SABC 1 SABC 2 e.tv SABC 3MzansiMagic
ChannelO
MzansiBioskop
M-Net Movies Action
eMoviesSuper-Sport 4
Home/ someone
else’s home98 98 99 98 100 99 100 100 100 100
Shopping centre/shop/
bank6 6 6 6 8 14 10 10 6 11
Bar/ shebeen/ pub/café
6 6 6 7 8 11 10 9 7 13
Work 6 6 7 7 7 8 9 8 8 8
Restaurant/ coffee shop 4 4 4 4 7 10 7 10 7 10
Car/taxi/bus 4 4 4 3 5 5 6 3 5 4
School/ university/
college1 1 1 2 2 3 2 1 1 2

56
Radio Stations

57
Media: Radio
Listened to past week(n=3,154)
Listen to most often(Filter: Radio listeners n=2,962)
12
5
25
20
10
8
7
2
11
EC
FS
GP
KZN
LP
MP
NW
NC
WC
Past week listenership: 95%
79 1038
Black WhiteIndian Coloured
41
28 31
Metro Urban Rural
24
27
26
15
8
15-24
25-34
35-49
50-64
65+
16
22
35
17
10
SEM SG 1
SEM SG 2
SEM SG 3
SEM SG 4
SEM SG 5
49
51
Male
Female
Profile of Radio listeners(Filter: Radio listeners n=2,962)
%
35
23
14
12
11
11
11
8
6
6
5
5
5
5
5
5
4
4
4
4
4
4
5
Metro FM
Ukhozi FM
Umhlobo Wenene FM
Lesedi FM
Thobela FM
Motsweding FM
Gagasi FM
5FM
Radio 2000
RSG
Kaya FM 95.9
Ikwekwezi FM
KFM
Capricorn FM
YFM 99.2
Munghana Lonene FM…
Jacaranda FM
Ligwalagwala FM
Good Hope FM
947
702
East Coast Radio
Did not listen in PW
14
12
12
7
6
5
4
4
3
33
Ukhozi FM
Metro FM
Umhlobo Wenene FM
(UWFM)
Lesedi FM
Thobela FM
Motsweding FM
RSG
Gagasi FM
Munghana Lonene FM
(MLFM)
Other (Nett 1%
mentions)
Repertoire 2.2 Mentions 4% and above Mentions 3% and above

58
Video Streaming Services

59
Media: Video Streaming Services
9
5
29
9
19
12
4
1
12
EC
FS
GP
KZN
LP
MP
NW
NC
WC
Past week viewership: 26%
78 1147
Black WhiteIndian Coloured
42
2434
Metro Urban Rural
38
32
18
8
4
15-24
25-34
35-49
50-64
65+
53
47
Male
Female
%
14
22
31
20
13
SEM SG 1
SEM SG 2
SEM SG 3
SEM SG 4
SEM SG 5
24
5
4
1
73
YouTube
Showmax
Netflix
Other
Video streaming
services not used
in past week
87
6
5
2
YouTube
Showmax
Netflix
Other
Used in past week(n=3,154)
Use most often(Filter: Viewers n=754)
Profile of video streaming viewers(Filter: Viewers n=754)

245 4
YouTube Showmax Netflix
VIDEO STREAMING SERVICES – PROFILE…
%
14
22
32
19
12
SEM Supergroup 1
SEM Supergroup 2
SEM Supergroup 3
SEM Supergroup 4
SEM Supergroup 5
SERVICES USED P7D:
6
30
32
15
17
4
21
36
17
22
P7D INTERNET ACCESS: 82% 86% 85%
%

Detailed dashboards
61

www.brcsa.org.za
62