relationships between hemodynamic, hemorheological and
TRANSCRIPT

HAL Id: hal-01203389https://hal.univ-antilles.fr/hal-01203389
Submitted on 4 Nov 2019
HAL is a multi-disciplinary open accessarchive for the deposit and dissemination of sci-entific research documents, whether they are pub-lished or not. The documents may come fromteaching and research institutions in France orabroad, or from public or private research centers.
L’archive ouverte pluridisciplinaire HAL, estdestinée au dépôt et à la diffusion de documentsscientifiques de niveau recherche, publiés ou non,émanant des établissements d’enseignement et derecherche français ou étrangers, des laboratoirespublics ou privés.
Relationships between hemodynamic, hemorheologicaland metabolic responses during exercise
Philippe Connes, Julien Tripette, Martin Mukisi-Mukaza, Oguz Baskurt,Kálmán Tóth, Herbert Meiselman, Olivier Hue, Sophie Antoine-Jonville
To cite this version:Philippe Connes, Julien Tripette, Martin Mukisi-Mukaza, Oguz Baskurt, Kálmán Tóth, et al.. Rela-tionships between hemodynamic, hemorheological and metabolic responses during exercise. Biorheol-ogy, IOS Press, 2009, �10.3233/BIR-2009-0529�. �hal-01203389�

1
Relationships between hemodynamic, hemorheological and
metabolic responses during exercise
Philippe Connesa**
, Julien Tripettea,b
, Martin Mukisi-Mukazab,c
, Oguz K. Baskurtd, Kalman
Tothe, Herbert J. Meiselman
f, Olivier Hue
a and Sophie Antoine-Jonville
a.
aDépartement de Physiologie, Université des Antilles et de la Guyane, Campus de Fouillole,
Pointe-à- Pitre, Guadeloupe bUMR S 763 Inserm/Université des Antilles et de la Guyane, CHU Pointe-à-Pitre, Pointe-à-
Pitre, Guadeloupe cService d’Orthopédie et de Traumatologie, CHU Pointe-à-Pitre/Abymes, Pointe-à-Pitre,
Guadeloupe dDepartment of Physiology, Akdeniz University Faculty of Medicine, Antalya, Turkey
e1
st Department of Medicine, University of Pécs, School of Medicine, Pécs, Hungary
fDepartment of Physiology and Biophysics, Keck School of Medicine, University of Southern
California, Los Angeles, California 90033, USA.
Abstract: Aerobic performance is dependent on both cardio-respiratory and peripheral factors
with hemodynamic parameters playing a major role. However, whether blood rheology might
affect aerobic performance through an effect on hemodynamic factors is not known. The aim
of the present study was to assess the relationships between hemodynamic, hemorheological
and metabolic parameters in response to a sub-maximal cycling exercise protocol. Ten young
sportsmen participated in the present study. Mean arterial pressure (MAP) was measured
manually, with thoracic impedance used to monitor cardiac output (Qc): systemic vascular
resistance (SVR) was then calculated. Whole blood viscosity (ηb) was measured and used to
calculate systemic vascular hindrance. Hematocrit (Hct) was determined by micro-
centrifugation and red blood cell (RBC) deformability (EI) was determined by ecktacytometry.
A breath-by-breath gas analyzer was used to measure oxygen uptake (VO2); the Fick equation
was used to calculate arterio-venous oxygen difference [(a-v)O2] from VO2 and Qc. All
measurements were performed at rest, during exercise and during recovery. Compared to
baseline, Qc, MAP, Hct, EI, VO2, and (a-v)O2 increased during exercise. ηb increased above
baseline only at 150W and remained elevated during recovery; the increase in ηb during the
last level of exercise was associated with a decrease of SVR and systemic vascular hindrance.
There was a significant negative correlation between EI and SVR and a significant positive
relationship between EI and (a-v)O2 and between EI and VO2 across all exercise workloads,
thus suggesting a potential role for RBC deformability as a factor affecting aerobic
performance via oxygen delivery to tissues. These data lend support to the concept that
hemorheological parameters may contribute to hemodynamic and cardio-respiratory
adaptations in response to exercise in moderately trained sportsmen.
Key words: blood rheology, exercise physiology, hemodynamics, oxygen uptake
Running title: Physical activity and blood rheology
*This article is based on presentation given by Dr. Connes in Symposium 11 at the 13th International
Congress of Biorheology and 6th
Conference on Clinical Hemorheology, Penn State University, PA, July 09-14,
2008.
Address for correspondence: Dr. Philippe Connes, Laboratoire ACTES (EA 3596), Département de
Physiologie, Université des Antilles et de la Guyane - Campus de Fouillole, 97159 Pointe-à-Pitre, Guadeloupe
(French West Indies) ; Email: [email protected]

2
1. Introduction
Aerobic physical fitness is limited by several factors such as pulmonary oxygen diffusion
capacity, cardiac output, the capacity of blood to carry oxygen and the capacity of muscles to
extract and use oxygen for adenosine tri-phosphate re-synthesis [3]. Since oxygen
consumption is the product of cardiac output and arterio-venous oxygen content difference,
the rate at which oxygen is delivered to muscles depends on its content in blood and on blood
flow rate, with the latter being dependent on pressure gradient and the resistance to blood
flow. In turn, flow resistance is determined by systemic vascular hindrance (i.e., the
contribution of vascular geometry to flow resistance) and by blood viscosity. Vascular
geometry is usually considered to be the main determinant of blood flow resistance with
vasomotor tone playing a central role; the impact of blood rheology (e.g., apparent blood
viscosity) is very often ignored or underestimated [2,41].
Considering only apparent blood viscosity as the sole hemorheological factor affecting
hemodynamic resistance is a reductionist approach [11]. As demonstrated by using intravital
microscopy on isolated vessels or whole perfused organs, each determinant of blood viscosity
(e.g., RBC deformability, RBC aggregation) may affect blood flow resistance [2]. However,
few studies have investigated the relationships between blood rheological parameters and
whole body hemodynamic responses to exercise in humans. Toth, et al. [45] compared some
blood rheological and hemodynamic parameters between healthy subjects and patients with
ischemic heart disease at rest and at peak exercise. Although they found no significant
difference in resting hemodynamic parameters between the two groups, patients with
ischemic heart disease had higher hematocrit, plasma viscosity and blood viscosity. At peak
exercise, these patients had higher hematocrit, plasma viscosity and blood viscosity and a
lower cardiac index, possibly explaining their lower relative aerobic capacity [45]; evaluation
of RBC rheologic properties was not part of this prior study [45].

3
While the present literature does not directly address exercise-metabolism-rheology
relations, it has been suggested that blood fluidity and RBC deformability may play an
important role in aerobic physical fitness by facilitating muscle perfusion [6,15]. The present
study was designed to measure the hemodynamic, hemorheological and metabolic responses
during exercise in sportsmen, and to evaluate relationships between these variables, thus
exploring whether blood rheology may play a role in hemodynamic and metabolic
adjustments during exercise. Since training levels may influence many aspects of blood
rheological and hemodynamic responses, we focused mainly on a group of moderately trained
sportsmen with comparable fitness levels.
2. Materials and Methods
2.1. Protocol
All subjects were informed of the procedures and purposes of the study and all gave their
written informed consent. The protocol was in accordance with the guidelines set by the
Declaration of Helsinki and was approved by the Ethics Committee of the Academics
Hospitals of Pointe-à-Pitre.
Ten male subjects (age 20.8 ± 1.1 yrs, mean ± SD) who trained regularly in several sports
such as sprint running, football, basket-ball, racket sports, water sports and swimming were
involved in the study. The duration of sports practice ranged between 8 and 12 hours per week
and clinical interviews did not reveal any signs of overtraining. None of the subjects were
involved in high level (i.e. national or international) competition and none of them trained
specifically in endurance sports. Previous results showed that their maximal oxygen
consumption (VO2max), as determined during a progressive and maximal exercise cycling test
(3 min warm-up at 60 W followed by increments of 30 W/min until VO2max was reached),
ranged between 45-51 ml/kg/min as determined for 7 of the 10 subjects in the present study.

4
After a resting-acclimation period of 10 minutes, the subjects underwent a sub-maximal
cycling exercise protocol consisting of three nine minute successive levels of 50, 100 and 150
W. Pedalling speed remained constant at 70 RPM during each period with the different levels
obtained by varying the cycling resistance. Exercise was then stopped and the subjects had a
recovery period of 10 min in the same seated position without pedalling. Hemodynamic
parameters and oxygen uptake (VO2) were continuously recorded and a mean value was
calculated at the 6th
min of each level for resting, three levels of exercise and recovery. Also
at this six minute point, ear oxyhemoglobin saturation (SaO2) and arterial pressures were
measured, and five ml of blood was sampled (EDTA, 1.5 mg/ml) from an antecubital vein for
hemorheological measurements.
2.2. Hemodynamic parameters
A validated bioimpedance device using four electrodes was used to non-invasively measure
stroke volume (SV) (Physioflow, Manatec type PF05L1, Paris, France). The bioimpedance
method of cardiac output (Qc) determination uses changes in transthoracic impedance during
cardiac ejection to calculate SV. In addition, two additional electrodes were used for heart rate
(HR) determination [8,37,44] based on the R-R interval duration determined using the first
derivative of the electrocardiogram (ECG). Qc was calculated as the product of HR and SV.
Systolic and diastolic blood pressures were manually measured at the brachial artery by the
same experienced clinician and mean arterial pressure (MAP) was then calculated as: diastolic
pressure + 1/3 pulse pressure; systemic vascular resistance (SVR) was calculated by dividing
MAP by Qc.
2.3. Oxygen uptake, oxyhemoglobin saturation and arterio-venous oxygen content difference

5
Oxygen uptake (Qc, VO2) was measured using a breath-by-breath automated exercise
metabolic system (Vmax 229, Sensor Medics, USA), with non-invasive pulse oximetry
(model 3740, Datex-Ohmeda, Helsinki, Finland) used to assess oxyhemoglobin saturation
(SaO2). The arterio-venous oxygen content difference (a-v)O2 was calculated using the Fick
equation (i.e., VO2 divided by Qc) as previously reported [27,38].
2.4. Hemorheological-hematological measurements and systemic vascular hindrance
Blood was stored at 4°C until tested and all hemorheological measurements were carried out
within 4 hours following venipuncture to avoid rheological alterations [48]. Apparent
viscosity of blood at 25°C for the as-drawn samples (ηb) was measured at a shear rate of 225
s-1
using a cone/plate viscometer (Brookfield DVII+ with CPE40 spindle, Brookfield
Engineering Labs, Natick, MA). Hematocrit (Hct) was measured by the micro-method
(16,000 g, 10 min, 25°C). RBC deformability, as an Elongation Index EI, was determined at a
shear stress of 3 Pa by laser diffraction analysis of dilute cell suspensions using the Laser
assisted Optical Rotational Cell Analyzer (LORCA, RR Mechtronics, Hoorn, The
Netherlands) operating at 37°C. At constant shear stress, EI increases with increasing cell
deformation [24]. Note that blood flow in arteries, arterioles and capillaries causes shear
stresses up to about 5 Pa [26], and hence we elected to use a shear stress of 3 Pa for RBC
deformability measurements. RBC aggregation at stasis, as an Aggregation Index AI, was
determined at 37 °C using the LORCA for blood samples whose Hct was adjusted to 40% by
appropriate combination of RBC and autologous plasma; AI increases with the extent of
aggregation. Systemic vascular hindrance, a parameter reflecting the contribution of
geometric factors to SVR, was calculated by dividing SVR by 8ηb and multiplying it by [9].
2.5. Statistical analysis

6
Results are presented as mean ± SD. The effects of exercise on hemodynamic,
hemorheologic and metabolic parameters were investigated using a one-way analysis of
variance with repeated measures, with the Spearman correlation used to investigate
relationships between these parameters. Tukey post hoc tests were used when necessary to
locate the differences. The significance level was defined as p < 0.05. Analyses were
conducted using Statistica (v. 5.5, Statsoft, USA).
3. Results
3.1. Hemodynamic parameters
As shown in the Table 1, exercise increased HR and Qc above resting values which
remained higher than resting during recovery. SV also increased at 50, 100 and 150 W
compared to resting value and return to baseline during recovery. MAP measured at 50 W
was not significantly different from resting level, but increased above baseline at 100 and 150
W and remained elevated during recovery. SVR decreased below baseline from 50 W to 150
W, and tended to be lower than resting during recovery (p = 0.09).
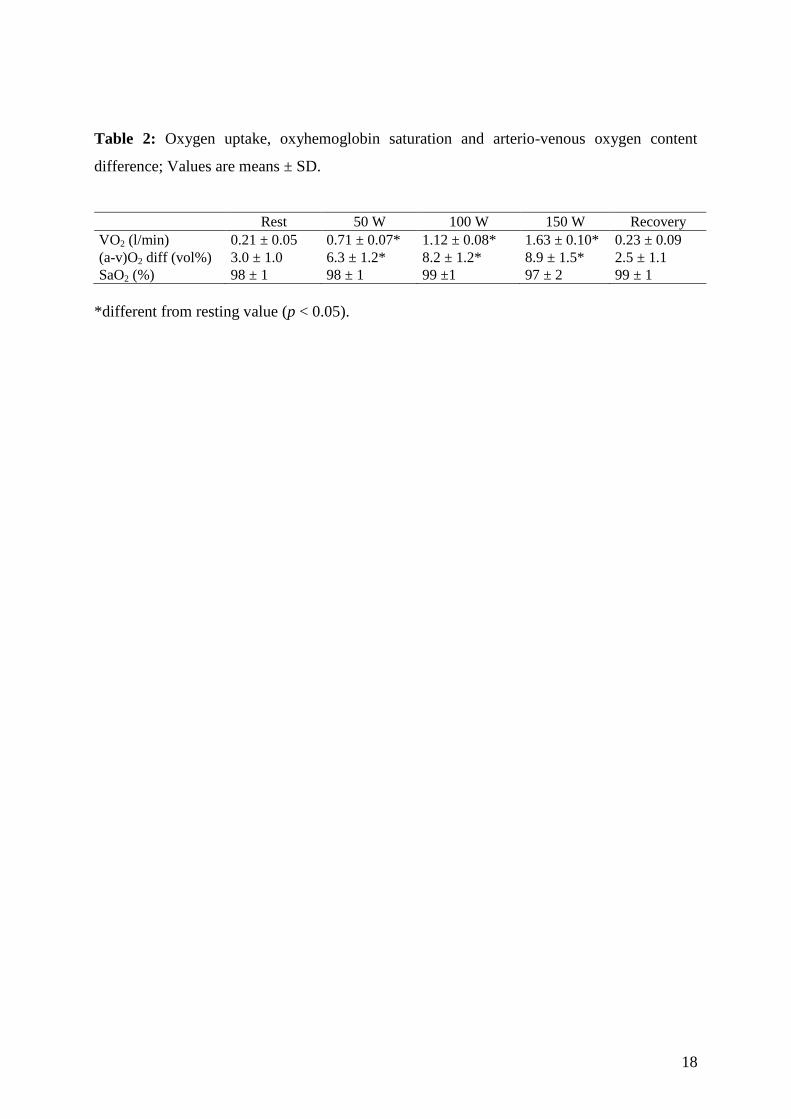
3.2. Oxygen uptake, oxyhemoglobin saturation and arterio-venous oxygen content difference
These parameters are presented in Table 2: VO2 and (a-v)O2 increased with exercise
intensity and returned to resting levels during recovery, with no significant change in SaO2
observed during exercise or recovery.
3.3. Hemorheological-hematological measurements and systemic vascular hindrance
As shown in Figs. 1A and 1D, Hct and EI increased during exercise and remained above
resting levels during the recovery. Blood viscosity (Fig. 1B) measured at 50 and 100 W was
not significantly different from the resting value but increased above the resting value at 150

7
W and remained elevated during recovery. RBC aggregation (AI, Fig. 1C) decreased below
the resting value at 50 W and then returned to the resting level during the following exercise
steps. Systemic vascular hindrance decreased progressively during the three exercise steps
and remained below the resting level in the recovery period (Fig. 2).
3.4. Correlations
A significant negative correlation was found between EI and SVR (r = -0.35, p < 0.01),
with positive correlations between EI and VO2 (r = 0.37, p < 0.01) and EI and (a-v)O2 (r =
0.35 , p < 0.01). No significant relationship was found between blood viscosity and SVR (r =
-0.05, p > 0.05). We also calculated the change in blood rheological properties, vascular
resistance and (a-v)O2 difference between rest and each workload (i.e. 50, 100 and 150 W),
and then tested several correlations between the change of (a-v)O2 and the changes of the
other variables. We found no significant relationships between the changes between rest and
50 W or between rest and 100 W. In contrast, there was a positive correlation at 150 W
between the changes of (a-v)O2 and blood viscosity (r = 0.66; p < 0.05). Finally, to test the
effects of Hct on blood viscosity, we tested the correlations between the two parameters at
each exercise level: a significant relationship was found at 150 W (r = 0.87; p < 0.05) but not
at the two lower levels of exercise.
4. Discussion
The present study investigated the hemorheological, hemodynamic and metabolic responses
in sportsmen performing a submaximal exercise protocol. We observed that hemorheological
parameters, notably blood viscosity and RBC deformability, were influenced by exercise; our
results suggest that these changes could play a role in the hemodynamic and metabolic
adjustments.

8
As anticipated [43], Qc, HR, SV and MAP increased with exercise intensity and reached
their highest values at the maximum exercise level of 150 W (Table 1). The increase of Qc,
together with the widening of (a-v)O2, is consistent with the increase of VO2 with exercise
intensity [4].
Blood pressure tends to increase during graded exercise, yet MAP remained unchanged at
50 W in spite of the increased Qc (Table 1). Since MAP is proportional to the product of Qc
times SVR, this suggests the presence of a compensatory decrease of SVR. As indicated in
Fig. 1B, blood viscosity was not elevated at 50 W and thus the decrease of SVR at 50 W was
solely related to the decrease of systemic vascular hindrance, thereby indicating marked
changes of vascular geometry (i.e., vasodilation) at this exercise level. However, at the two
higher levels of exercise, MAP increased above the resting value, indicating a greater rise of
Qc than the decrease of SVR [4], with the decrease of SVR associated with a further decrease
of systemic vascular hindrance (Table 1, Figure 2).
As suggested by many authors, the progressively increased vasodilatation with exercise is
probably related to metabolic mechanisms in response to tissue hypoxia and to the release of
vasodilator substances such as ATP, potassium or hydrogen ions [10,31,40]. Although blood
viscosity was increased by about 10% above the resting value at 150 W (Fig. 1B) due mainly
to the increased Hct at this exercise level (Fig. 1A), SVR was below the resting value,
indicating that the small hematocrit-mediated increase of blood viscosity did not, by itself,
counteract the decrease of systemic vascular hindrance. The lack of significant correlation
between SVR and ηb supports this conclusion. Nitric oxide (NO) elicits vasodilation, with fluid shear stress at the vessel wall being one of
the main stimuli of NO production by endothelial cells [52]; wall shear stress is effective for
both acute activation of nitric oxide production and for the chronic expression of endothelial

9
nitric oxide synthase [20,46]. Increased wall shear stress therefore stimulates NO release,
leading to vascular relaxation and decreased systemic vascular hindrance. Since wall shear
stress can be estimated as the product of blood viscosity times shear rate, the increase of Qc
and flow rate during exercise would be expected to increase shear stress, thereby contributing
to the decrease of systemic vascular hindrance (Fig. 2). The elevated blood viscosity at 150 W
(Fig. 2B), combined with the increased Qc, could have generated a greater shear stress than
during the previous exercise steps, with a greater contribution to the decrement of SVR at that
exercise intensity. Therefore, it could be argued that increased blood viscosity may be viewed
as beneficial during exercise by eliciting vasodilation and greater tissue perfusion; the
correlation found between the change from rest to 150 W of blood viscosity and of (a-v)O2
supports this view. It is interesting to note that previous studies employing blood substitutes
have demonstrated that an elevated viscosity elicits a vasodilatory response due to increased
shear stress [39,47]. In addition, Tsai et al. [47] reported that increased plasma viscosity
stimulates nitric oxide generation by the endothelium and decreases vascular resistance.
Although Hct increased above the resting value at 50 and 100 W (Fig. 1A), blood viscosity
did not significantly change at these times (Fig. 2B). This unchanged viscosity was most
likely due to the relatively small increase in hematocrit (i.e., 1 or 1.5 hematocrit units) and the
slight improvement of RBC deformability (Fig. 1D). At 150 W, the much more pronounced
increase in hematocrit (i.e., 2.5 or 3 hematocrit units) was not compensated for by the slight
improvement of RBC deformability, and hence there was a significant increase of blood
viscosity at that level. The mechanisms responsible for the transient decrease of RBC
aggregation during graded exercise (Fig. 1C) are not yet understood and require further
studies.
Few studies have investigated RBC aggregation in response to exercise and the results are
not in agreement: some studies describe no change [13], an increase [19] or a delayed

10
decrease of RBC aggregation [51]. The reasons for these various results are unclear, but may
be related to: 1) the population tested (i.e., sportsmen in the present study, very well
endurance trained subjects in [13], sedentary and endurance trained subjects in [19] and
sedentary subjects in [51]); 2) the exercise performed (sub-maximal cycling exercise in the
present study of less than 30 min duration, ramp exercise test conducted to VO2max in [13],
sub-maximal cycling test of 3 hrs duration in [19] and a supra-maximal Wingate exercise test
in [51]); 3) the technique used to measure aggregation (backscattered technique in our
protocol with light transmission used in [13,19,51]). Note that aggregation at 100 W, 150 W
and during recovery did not differ from the resting level, suggesting that RBC aggregation
probably played only a minor role in the regulation of SVR during this exercise.
It is well known that RBC deformability is an important determinant of flow resistance in
blood vessels with dimensions similar to the size of RBC [2]. Entrance of RBC into true
capillaries is characterized by a dramatic increase in flow resistance [28,29], with the
magnitude of the increase dependent on RBC deformability; RBC transit times through the
microcirculation are prolonged when suspensions of RBC rigidified by glutaraldehyde
treatment are perfused [30]. Although the presence of rigid RBC may disturb the
microcirculation [30,42], they may also cause hemodynamic abnormalities in larger vessels
[29]. RBC deformability increased by seven to eight percent in the current study (Fig. 1D),
suggesting the possibility that this improvement may have contributed to the decrease of SVR.
This suggestion is partly supported by the significant negative correlation found between
RBC deformability and SVR (r = -0.35, p < 0.01). In addition, Parthasarathi and Lipowsky
[34] reported that impairment in RBC deformability may adversely affect capillary
recruitment and physiological mechanisms that ensure adequate delivery of oxygen to tissue.
A decrease of RBC deformability may result in reduced capillary perfusion and O2 delivery to

11
tissues [17]. Our results lend support to this concept since we found a significant positive
correlation between RBC deformability and both (a-v)O2 and VO2.
The effects of exercise on RBC deformability have been examined in several studies, with
most reporting a decrease [5,19,21,22,32,36,50,51]. Correlations between the increment in
blood lactate level during exercise and the decrement in RBC deformability have been shown
[5], suggesting that lactate could be responsible for the decrease of RBC deformability.
Recently, we have reported a significant positive correlation between RBC monocarboxylate
transporter (MCT-1) activity and RBC rigidity: MCT-1 is a co-transporter lactate/H+ [14] and
is responsible of about 90% of the total lactate uptake by RBC [16]. RBC MCT-1 could
therefore play a role in the regulation of RBC rheology.
It is notable that rather than finding a decrease in deformability with exercise, the present
study and others [12,23,49] indicate an increase of RBC deformability during exercise by
trained subjects in spite of elevated blood lactate concentrations. The increase of RBC
deformability found by Connes et al. [12] was around 6 percent, which is quite close to the
seven to eight percent found in the present study. Although this percent increase is not large,
it is in marked contrast to other reports of RBC deformability decreases ranging from 4% to
100% [7,18,21,36]. We have investigated the effects of lactate anion on blood rheology in
trained and untrained subjects and found a strong effect of training: RBC deformability
decreased with increased lactate concentration in untrained subjects but increased in trained
athletes [12].
Another possible explanation for the differing effects of exercise on RBC deformability
relates to the blood oxygen saturation level during exercise. Closer evaluation of the results
obtained in the study of Connes et al. [12] indicated two different responses: 1) unchanged
deformability in subjects who exhibited a phenomenon called exercise induced hypoxemia
(i.e., EIH, an impairment of blood gas homeostasis with more than a 4% decrease of SaO2

12
during exercise); 2) increased deformability in subjects who did not exhibit EIH. In the
current study none of the subjects had EIH, and thus the increase of deformability was in the
absence of hypoxia (Table 2, Fig. 1D). Therefore, it seems that changes in RBC rheological
properties during exercise are dependant on the fitness level of subjects and also on their
“hypoxemic status”.
After exercise stopped, (a-v)O2 and VO2 rapidly returned to resting values despite the
persistent elevation of Qc; the elevated Qc during recovery was attributable to an increased
HR reflecting high circulating catecholamine levels. Since SVR tended to be lower than
resting during recovery, the increased MAP was due to the elevated Qc; the low SVR reflects
the continuing low systemic vascular hindrance indicating vasodilatation. The “mismatch”
between the return of VO2 to baseline, the elevated Qc, and the continued decrease of systemic
vascular hindrance suggests that blood flow during recovery is not directly regulated by the
need of oxygen in the exercised muscles [1]. This hyperemic response during recovery is
likely linked to locally released factors, such as ions and metabolites, but may also be
influenced by the elevated blood viscosity due to higher hematocrit. As mentioned above,
both elevated Qc and blood viscosity favor high wall shear stress and the release of nitric
oxide, and thus rheological factors may contribute to the recovery process following cessation
of exercise.
A potential limitation of the present study resides in the approach to data analysis that did
not explicitly consider the complexity of hemodynamic changes in response to exercise. The
changes we observed for the SVR are not only the results of decreased systemic vascular
hindrance and/or changes in RBC deformability/blood viscosity. Rather, additional factors are
likely involved: 1) the redistribution of Qc occurring during exercise [25,33]; 2) the intensity-
dependent constriction in non-active vascular beds; 3) the vascular reactivity differences

13
between upper and lower extremities [35]. Nevertheless, the experimental approach used in
the present study has been used by some investigators during exercise stress or in patients
[41,45], and does provide interesting information about hemodynamic changes and their
relationships with blood rheology. Our results are in agreement with the previous classical
descriptions of hemodynamical responses during exercise, and our results also support the
idea that blood rheology, and particularly RBC deformability, might play a role in
cardiorespiratory and hemodynamic adaptations during exercise in sportsmen. Additional
studies focusing on higher exercise intensity will be necessary to confirm this suggestion, and
to determine the extent to which our results are applicable to the general population.
References
[1] J. Bangsbo and Y. Hellsten. Muscle blood flow and oxygen uptake in recovery from
exercise. Acta Physiol Scand 162 (1998), 305-312.
[2] O.K. Baskurt and H.J. Meiselman. In vivo hemorheology. In: Handbook of
Hemorheology and hemodynamics. Baskurt OK, Hardeman PR, Rampling MW and
Meiselman HJ. Ed. IOS Press. (2007), 322-338.
[3] D.R. Bassett, Jr. and E.T. Howley. Limiting factors for maximum oxygen uptake and
determinants of endurance performance. Med Sci Sports Exerc 32 (2000), 70-84.
[4] G.A. Brooks, T.D. Fahey, T.P. White and K.M. Baldwin. Exercise Physiology:
Human Bioenergetics and Its Applications, 3rd ed. Mountain View, CA: Mayfield
Publishing Company. (2000).
[5] J.F. Brun, C. Fons, C. Supparo, C. Mallard and A. Orsetti. Could exercise-induced
increase in blood viscosity at high shear rate be entirely explained by hematocrit and
plasma viscosity changes? Clin Hemorheol 13(2) (1993), 187-199.
[6] J.F. Brun, S. Khaled, E. Raynaud, D. Bouix, J.P. Micallef and A. Orsetti. The triphasic
effects of exercise on blood rheology: which relevance to physiology and
pathophysiology? Clin Hemorheol Microcirc 19 (1998), 89-104.
[7] J.F. Brun, C. Supparo, D. Rama, C. Benezis and A. Orsetti. Maximal oxygen uptake
and lactate thresholds during exercise are related to blood viscosity and erythrocyte
aggregation in professional football players. Clin Hemorheol 15 (1995), 201-212.
[8] A. Charloux, E. Lonsdorfer-Wolf, R. Richard, E. Lampert, M. Oswald-Mammosser, B.
Mettauer, B. Geny and J. Lonsdorfer. A new impedance cardiograph device for the
non-invasive evaluation of cardiac output at rest and during exercise: comparison with
the "direct" Fick method. Eur J Appl Physiol 82 (2000), 313-320.
[9] S. Chien, R.J. Dellenback, S. Usami, D.A. Burton, P.F. Gustavson and V.
Magazinovic. Blood volume, hemodynamic, and metabolic changes in hemorrhagic
shock in normal and splenectomized dogs. Am J Physiol 225 (1973), 866-879.

14
[10] P.S. Clifford and Y. Hellsten. Vasodilatory mechanisms in contracting skeletal muscle.
J Appl Physiol 97 (2004), 393-403.
[11] G.R. Cokelet and H.J. Meiselman. Macro- and Micro-Rheological Properties of Blood.
In: Handbook of Hemorheology and hemodynamics. Baskurt OK, Hardeman PR,
Rampling MW and Meiselman HJ. Ed. IOS Press. (2007), 45-71.
[12] P. Connes, D. Bouix, F. Durand, P. Kippelen, J. Mercier, C. Prefaut, J.F. Brun and C.
Caillaud. Is hemoglobin desaturation related to blood viscosity in athletes during
exercise? Int J Sports Med 25 (2004), 569-574.
[13] P. Connes, C. Caillaud, G. Py, J. Mercier, O. Hue and J.F. Brun. Maximal exercise
and lactate do not change red blood cell aggregation in well trained athletes. Clin
Hemorheol Microcirc 36 (2007), 319-326.
[14] P. Connes, F. Sara, M.D. Hardy-Dessources, M. Etienne-Julan and O. Hue. Does
Higher Red Blood Cell (RBC) Lactate Transporter Activity Explain Impaired RBC
Deformability in Sickle Cell Trait? Jpn J Physiol 55 (2005), 385-387.
[15] P. Connes, O. Yalcin, O. Baskurt, J.F. Brun and M. Hardeman. In health and in a
normoxic environment, VO2 max is/is not limited primarily by cardiac output and
locomotor muscle blood flow. J Appl Physiol 100 (2006), 2099.
[16] B. Deuticke, E. Beyer and B. Forst. Discrimination of three parallel pathways of
lactate transport in the human erythrocyte membrane by inhibitors and kinetic
properties. Biochim Biophys Acta 684 (1982), 96-110.
[17] G.K. Driessen, C.W. Haest, H. Heidtmann, D. Kamp and H. Schmid-Schonbein.
Effect of reduced red cell "deformability" on flow velocity in capillaries of rat
mesentery. Pflugers Arch 388 (1980), 75-78.
[18] E. Ernst. Changes in blood rheology produced by exercise. J Am Med Assoc 253
(1985), 2962-2963.
[19] E. Ernst, L. Daburger and T. Saradeth. The kinetics of blood rheology during and after
prolonged standardized exercise. Clin Hemorheol 11 (1991), 429-439.
[20] I. Fleming and R. Busse. Molecular mechanisms involved in the regulation of the
endothelial nitric oxide synthase. Am J Physiol Regul Integr Comp Physiol 284 (2003),
R1-12.
[21] G. Galea and R.J. Davidson. Hemorrheology of marathon running. Int J Sports Med 6
(1985), 136-138.
[22] M. Gueguen-Duchesne, F. Durand, J. Beillot, J. Dezier, P. Rochcongar, M. LeGoff, M.
Pommereuil and B. Genetet. Could maximal exercise be a hemorheological risk
factor? Clin Hemorheol 7 (1987), 418.
[23] M. Hardeman, H.P. Peters and P.T. Goedhart. Low hematocrit and plasma fibrinogen
in trained athletes increase hemorheological tolerance for physical stress (Abstract).
Biorheology 32 (1995), 401.
[24] M.R. Hardeman, P.T. Goedhart and N.H. Schut. Laser assisted Optical Rotational Cell
Analyser. (L.O.R.C.A.) Red blood cell deformability: Elongation index versus cell
transit time. Clin Hemorheol 4 (1994), 619-630.
[25] C.A. Harms. Effect of skeletal muscle demand on cardiovascular function. Med Sci
Sports Exerc 32 (2000), 94-99.
[26] D.N. Ku and D.P. Giddens. Pulsatile flow in a model carotid bifurcation.
Arteriosclerosis 3 (1983), 31-39.
[27] P.M. Lepretre, J.P. Koralsztein and V.L. Billat. Effect of exercise intensity on
relationship between VO2max and cardiac output. Med Sci Sports Exerc 36 (2004),
1357-1363.
[28] H.H. Lipowsky. Microvascular rheology and hemodynamics. Microcirculation 12
(2005), 5-15.
15
[29] H.H. Lipowsky. Rheology of blood flow in the microcirculation. In: Microvascular
research. Shepro D. Ed Elsevier. (2006), 233-238.
[30] H.H. Lipowsky, L.E. Cram, W. Justice and M.J. Eppihimer. Effect of erythrocyte
deformability on in vivo red cell transit time and hematocrit and their correlation with
in vitro filterability. Microvasc Res 46 (1993), 43-64.
[31] R.M. McAllister and M.H. Laughlin. Vascular nitric oxide: effects of physical activity,
importance for health. Essays Biochem 42 (2006), 119-131.
[32] G.S. Oostenbrug, R.P. Mensink, M.R. Hardeman, T. De Vries, F. Brouns and G.
Hornstra. Exercise performance, red blood cell deformability, and lipid peroxidation:
effects of fish oil and vitamin E. J Appl Physiol 83 (1997), 746-752.
[33] M.L. O'Toole. Gender differences in the cardiovascular response to exercise.
Cardiovasc Clin 19 (1989), 17-33.
[34] K. Parthasarathi and H.H. Lipowsky. Capillary recruitment in response to tissue
hypoxia and its dependence on red blood cell deformability. Am J Physiol 277 (1999),
H2145-2157.
[35] D.N. Proctor and S.C. Newcomer. Is there a difference in vascular reactivity of the
arms and legs? Med Sci Sports Exerc 38 (2006), 1819-1828.
[36] W.H. Reinhart, M. Stäubli and W. Straub. Impaired red cell filterability with
elimination of old red blood cells during a 100-km race. J Appl Physiol 54 (1983),
827-830.
[37] R. Richard, E. Lonsdorfer-Wolf, A. Charloux, S. Doutreleau, M. Buchheit, M.
Oswald-Mammosser, E. Lampert, B. Mettauer, B. Geny and J. Lonsdorfer. Non-
invasive cardiac output evaluation during a maximal progressive exercise test, using a
new impedance cardiograph device. Eur J Appl Physiol 85 (2001), 202-207.
[38] R. Richard, E. Lonsdorfer-Wolf, S. Dufour, S. Doutreleau, M. Oswald-Mammosser,
V.L. Billat and J. Lonsdorfer. Cardiac output and oxygen release during very high-
intensity exercise performed until exhaustion. Eur J Appl Physiol 93 (2004), 9-18.
[39] B.Y. Salazar Vazquez, R. Wettstein, P. Cabrales, A.G. Tsai and M. Intaglietta.
Microvascular experimental evidence on the relative significance of restoring oxygen
carrying capacity vs. blood viscosity in shock resuscitation. Biochim Biophys Acta
1784 (2008), 1421-1427.
[40] B. Saltin. Exercise hyperaemia: magnitude and aspects on regulation in humans. J
Physiol 583 (2007), 819-823.
[41] P.M. Scholz, J.H. Karis, F.E. Gump, J.M. Kinney and S. Chien. Correlation of blood
rheology with vascular resistance in critically ill patients. J Appl Physiol 39 (1975),
1008-1011.
[42] T.W. Secomb and R. Hsu. Resistance to blood flow in nonuniform capillaries.
Microcirculation 4 (1997), 421-427.
[43] J. Stenberg, P.O. Astrand, B. Ekblom, J. Royce and B. Saltin. Hemodynamic response
to work with different muscle groups, sitting and supine. J Appl Physiol 22 (1967), 61-
70.
[44] N. Tordi, L. Mourot, B. Matusheski and R.L. Hughson. Measurements of cardiac
output during constant exercises: comparison of two non-invasive techniques. Int J
Sports Med 25 (2004), 145-149.
[45] K. Toth, T. Habon, I. Horvath, B. Mezey, I. Juricskay and G. Mozsik.
Hemorheological and hemodynamical parameters in patients with ischemic heart
disease at rest and at peak exercise. Clin Hemorheol 14 (1994), 329-338.
[46] O. Traub and B.C. Berk. Laminar shear stress: mechanisms by which endothelial cells
transduce an atheroprotective force. Arterioscler Thromb Vasc Biol 18 (1998), 677-
685.

16
[47] A.G. Tsai, C. Acero, P.R. Nance, P. Cabrales, J.A. Frangos, D.G. Buerk and M.
Intaglietta. Elevated plasma viscosity in extreme hemodilution increases perivascular
nitric oxide concentration and microvascular perfusion. Am J Physiol Heart Circ
Physiol 288 (2005), H1730-1739.
[48] M. Uyuklu, M. Cengiz, P. Ulker, T. Hever, J. Tripette, P. Connes, N. Nemeth, H.J.
Meiselman and O.K. Baskurt. Effect of storage duration and temperature after blood
sampling on red blood cell deformability and aggregation parameters. Clin Hemorheol
Microcirc (In press).
[49] S.C. Wood, M.P. Doyle and O. Appenzeller. Effects of endurance training and long
distance running on blood viscosity. Med Sci Sports Exerc 3 (1991), 1265-1269.
[50] O. Yalcin, M. Bor-Kucukatay, U.K. Senturk and O.K. Baskurt. Effects of swimming
exercise on red blood cell rheology in trained and untrained rats. J Appl Physiol 88
(2000), 2074-2080.
[51] O. Yalcin, A. Erman, S. Muratli, M. Bor-Kucukatay and O.K. Baskurt. Time course of
hemorheological alterations after heavy anaerobic exercise in untrained human
subjects. J Appl Physiol 94 (2003), 997-1002.
[52] T. Ziegler, P. Silacci, V.J. Harrison and D. Hayoz. Nitric oxide synthase expression in
endothelial cells exposed to mechanical forces. Hypertension 32 (1998), 351-355.

17
Table 1: Hemodynamic parameters; values are means ± S.D.
Rest 50 W 100 W 150 W Recovery
HR (beats/min) 78 ± 12 104 ± 10* 124 ± 11* 153 ± 19* 97 ± 16*
SV (l) 0.10 ± 0.02 0.11 ± 0.02* 0.11 ± 0.02* 0.12 ± 0.02* 0.10 ± 0.02
Qc (l/min) 7.5 ± 1.5* 11.5 ± 1.5* 14.1 ± 2.3* 18.7 ± 2.9* 9.6 ± 2.0*
MAP (mmHg) 94 ± 6 97 ± 8 106 ± 9* 114 ± 6* 104 ± 7*
SVR (dynes/cm5/m
2) 2043 ± 451 1359 ± 299* 1219 ± 270* 978 ± 200* 1772 ± 439
*different from resting value (p < 0.05).
18
Table 2: Oxygen uptake, oxyhemoglobin saturation and arterio-venous oxygen content
difference; Values are means ± SD.
Rest 50 W 100 W 150 W Recovery
VO2 (l/min) 0.21 ± 0.05 0.71 ± 0.07* 1.12 ± 0.08* 1.63 ± 0.10* 0.23 ± 0.09
(a-v)O2 diff (vol%) 3.0 ± 1.0 6.3 ± 1.2* 8.2 ± 1.2* 8.9 ± 1.5* 2.5 ± 1.1
SaO2 (%) 98 ± 1 98 ± 1 99 ±1 97 ± 2 99 ± 1
*different from resting value (p < 0.05).

19
Figure captions
Fig. 1. A: Time course of venous hematocrit; B: Time course of blood viscosity; C: Time
course of red blood cell aggregation; D: Time course of red blood cell deformability,
*different from resting value (p < 0.05). Measurements were made at rest, at the 6th
minute
point of each exercise step and at 10 min recovery.
Fig. 2. Time course of systemic vascular hindrance, *different from resting value (p < 0.05).
Measurements were made at rest, at the 6th
minute point of each exercise step and at 10 min
recovery.

20
Figures 1A, 1B, 1C and 1D

21
Figure 2