relationship between the synthesis of prussian blue
TRANSCRIPT

Relationship between the Synthesis of Prussian Blue Pigments, TheirColor, Physical Properties, and Their Behavior in Paint LayersLouise Samain,*,†,⊥ Fernande Grandjean,‡,§ Gary J. Long,§ Pauline Martinetto,∥ Pierre Bordet,∥
and David Strivay†
†European Center of Archaeometry, University of Liege, Sart Tilman B15, B-4000 Liege, Belgium‡Faculty of Sciences, University of Liege, Sart Tilman B6, B-4000 Liege, Belgium§Department of Chemistry, Missouri University of Science and Technology, University of Missouri, Rolla, Missouri 65409-0010,United States∥ Institut Neel, CNRS and Universite Joseph Fourier, BP 166, F-38042 Grenoble Cedex 9, France
*S Supporting Information
ABSTRACT: Prussian blue pigments, highly insoluble mixed-valence iron(III)hexacyanoferrate(II) complexes of typical stoichiometry Fe4
III[FeII(CN)6]3·xH2O orKFeIII[FeII(CN)6]·xH2O, have been used as pigments in oil paintings and watercolorsfor 300 years. For poorly understood reasons, these pigments often fade with time.Although the preparation methods have been recognized since the mid-eighteenth centuryas a contributory factor in the fading of the pigment, the spectral and physical properties ofPrussian blue that vary with the type of synthesis were not precisely identified. SeveralPrussian blue pigments have been prepared by different methods and characterized bythermogravimetric analyses, high-energy powder X-ray diffraction, atomic absorption andflame emission, UV−visible, iron-57 Mossbauer, iron K-edge X-ray absorption, and Ramanspectroscopy. The type of synthesis influences the hue, tinting strength, and hiding powerproperties of the Prussian blue pigments. Two major features appear to be stronglydependent on the preparative methods, the particle size and the local disorder. Both anitrogen atmosphere and an intermediate aging step of the Berlin white, Fe2
II[FeII(CN)6], during the synthesis are required toobtain a highly colored pigment through the optimization of particle size, minimization in the perturbations to the FeII−CN−FeIII intervalence electron transfer pathway, and the minimization of disordered vacancies. The potassium containing Prussianblue structure has been revisited. It can be described with the Pm3m space group, where approximately one-quarter of the[FeII(CN)6]
4− sites are vacant and where the potassium cation is located at a zeolitic-like position inside the lattice cavities. Thedegree of ordering of the [FeII(CN)6]
4− vacancies in all Prussian blues was quantified using atomic pair distribution analysis, anordering that is consistent with the iron K-edge X-ray absorption spectra. The presence of strain in the crystals is observed byboth powder X-ray diffraction and Mossbauer spectroscopy. The structural similarity between the alkali-free, improperly referredto as “insoluble”, and the alkali containing, “soluble”, Prussian blues may explain why the two varieties are almostundistinguishable by spectroscopic techniques.
■ INTRODUCTION
Prussian blue has been widely used and studied since itsdiscovery ca. 300 years ago because of its various unusualproperties, for example, its intense blue color and its electro-chromism,1−3 magnetism at low temperature,4,5 zeoliticcharacter,6,7 and semiconductor behavior.8,9
Prussian blue is known to contain a hydrated iron(III)hexacyanoferrate(II) anion, {FeIII[FeII(CN)6]·xH2O}
−, withvarying values of x up to 16, and various cations, such as K+,NH4
+ , o r Na + . An a l k a l i - f r e e P r u s s i a n b l u e ,FeIII4[Fe
II(CN)6]3·xH2O, which must have an increased amountof iron(III) to maintain charge balance, is commonly referred toas the insoluble Prussian blue, whereas those Prussian bluescontaining alkali cations are referred to as the soluble Prussianblues. Even though all Prussian blues are highly insoluble, with asolubility product of ca. 1 × 10−41, the soluble appellation refers
to those Prussian blues that are easily dispersed in an aqueoussolution to form a colloidal suspension. Although perhapsunfortunate, the widely used historical soluble and insolubledesignation will be used herein. The blue color of Prussian blue isproduced by an intervalent electron transfer10 from an iron(II) toan iron(III) ion in different local atomic environments when lightis absorbed at ca. 700 nm.Because of its composition, Prussian blue is considered as the
prototype of mixed valence compounds and of cubic polynucleartransition-metal cyanide complexes.11 These transition-metalcyanide complexes are characterized by an open frameworkstructure and an inherent structural disorder,12 two features that
Received: November 10, 2012Revised: March 19, 2013Published: April 11, 2013
Article
pubs.acs.org/JPCC
© 2013 American Chemical Society 9693 dx.doi.org/10.1021/jp3111327 | J. Phys. Chem. C 2013, 117, 9693−9712

make their analytical and structural characterization ratherproblematic.Although Prussian blue has been known for more than 300
years, many problems related to its crystal structure and fadingbehavior in paint layers remain unsolved. First, Prussian bluepigments often irreversibly fade when used in paint layers. Thepreparation methods of Prussian blue have been recognized as acontributory factor in the fading of the pigment, but, to date, nosatisfactory explanation for this alteration is known.13,14 A betterunderstanding of the mechanisms associated with thisdegradation is of primary importance in the preventiveconservation and restoration of paintings in which Prussianblue pigments have been used. Second, confusion exists over thedistinction between the “soluble” and the “insoluble” varieties ofPrussian blue pigments. Third, the crystal structure of solublePrussian blue is still open to debate. The commonly acceptedstructural model of soluble Prussian blue that was proposed byKeggin and Miles15 in 1936 has been recently revisited.16 Inparticular, the location of the water molecules and the alkalication and the quantification of the local disorder in the solublevariety remain unclear. These points cannot be clarified withoutinvestigating the preparation conditions of Prussian blue.The synthesis of Prussian blue is based on a precipitation
reaction between an iron salt and an alkali hexacyanoferrate.Prior to the mid-nineteenth century, the alkali hexacyanoferratecould not be produced in bulk because of limited chemicalknowledge. Thus, before the mid-nineteenth century, theessential alkali hexacyanoferrate starting reagent was indirectlyproduced17 by calcination of animal matter with an alkali. Arelated paper18 is devoted to the synthesis and study of the fadingof eighteenth-century Prussian blue pigments. By the mid-nineteenth century, it was discovered that potassium hexacya-noferrate could be extracted from gas purification products.19
This discovery marks the beginning and the commercialization ofthe so-called modern methods for producing Prussian blue,methods that are completely inorganic in nature in contrast to
the eighteenth-century methods that used an organic startingmaterial.Herein, the modern preparative methods of bulk Prussian blue
are reviewed and reproduced to identify the spectral and physicalproperties that vary with the type of synthesis. The disorder, thedifferences between the soluble and insoluble Prussian blues, andtheir behavior in paint layers have been investigated through adetailed analytical and structural characterization of the Prussianblues with the long-term goal of better understanding thephysical basis for their fading over time. The degradationmechanisms associated with this fading effect have beeninvestigated in two related papers.18,20
■ EXPERIMENTAL SECTIONSynthesis. The modern methods for the production of
Prussian blue pigments are based on the precipitation reactionbetween an iron salt and a hexacyanoferrate complex and are oftwo types, direct and indirect; see Figure 1.The direct method of preparing Prussian blue is a one-step
process and consists of mixing a solution of an iron(III) salt witha solution of a hexacyanoferrate(II) salt. The deep blueprecipitate is filtered and carefully washed with distilled water.Alternatively, a mixture of solutions of an iron(II) salt and ahexacyanoferrate(III) salt produces the so-called Turnbull’s blueconsidered to be a ferrous ferricyanide. In the 1960s, Mossbauerspectroscopy and X-ray diffraction revealed that both reactionsyield the same compound,5,21 that is, iron(III) hexacyanoferrate-(II). If the iron salt is present in excess, the precipitate is thei n s o l u b l e P r u s s i a n b l u e p i g m e n t , t y p i c a l l yFe4
III[FeII(CN)6]3·xH2O, whereas if the reagents are mixed ina 1:1 molar ratio or with the hexacyanoferrate present in excess, as o l u b l e P r u s s i a n b l u e p i g m e n t , t y p i c a l l yKFeIII[FeII(CN)6]·xH2O, results.The indirect method is the most commonly used preparative
method in the pigment industry, which currently produces22 ca.107 kg per year. It is a two-step process based on the reactionbetween an iron(II) salt and a hexacyanoferrate(II) salt. From
Figure 1. Schematic representation of the direct and indirect methods used to produce modern Prussian blue pigments (left) and classification of all ofthe Prussian blue pigments reported in this work according to their synthesis routes (right). The underlined pigments are insoluble Prussian blues,whereas the others are soluble Prussian blues.
The Journal of Physical Chemistry C Article
dx.doi.org/10.1021/jp3111327 | J. Phys. Chem. C 2013, 117, 9693−97129694
the solution a precipitate of the so-called Berlin white, the ferrousferrocyanide, Fe2
II[FeII(CN)6], is obtained, a precipitate that isthen treated with a powerful oxidizing agent such as hydrogenperoxide, or an alkali metal chlorate or chromate, to yieldPrussian blue. Again, depending on the starting reagent that is inexcess, the soluble or insoluble Prussian blue is obtained.Three types of modern syntheses may be distinguished: the
synthesis of bulk Prussian blue reported in scientific papers, thesynthesis used by the pigment industry and described in patents,and the synthesis of well-crystallized Prussian blue.From the literature and from patents, the parameters that
apparently influence the properties of a Prussian blue pigment,such as its “apparent” solubility, color shade, or particle size, havebeen identified; see the Supporting Information for details.These parameters are the nature and the relative proportion ofthe starting reagents, the atmosphere, the rate of formation of theintermediate Berlin white, and the aging of the precipitate beforeoxidation. Syntheses of Prussian blue pigments were thus carriedout by varying these parameters. The general procedure isdetailed below. A blue precipitate was successfully obtained in allattempted syntheses. Unless otherwise stated, all reagents usedherein for the synthesis of Prussian blue were of reagent gradeand obtained from Sigma-Aldrich, Steinheim, Germany.The starting reagents were dissolved in deionized water in the
appropriate relative concentration. They were mixed togetherunder magnetic stirring. In case of an indirect process, Berlinwhite was formed and aged for 2 h at 90 °C. Before oxidation thesolution was acidified by adding hydrochloric acid. An excess ofhydrogen peroxide was added to accelerate and complete theoxidation of Berlin white into Prussian blue. Filtration wasdifficult to achieve because of the tendency of Prussian blue toform colloidal solutions, and thus centrifugation was preferred tofiltration. The precipitate was thoroughly washed with deionizedwater and collected by centrifugation. The pigment was oven-dried at ca. 55 °C for 1 h and then ground into a fine powder.Details of the syntheses of samples 1−8 are given in Table S1
along with the entire list of the additional Prussian blue pigmentsthat have been prepared but not reported on in detail herein. Thespecific “expected” stoichiometries of 1−4, 7, and 8 are given inthe first column of Table 1.The syntheses of 1−4 produce Prussian blue as a fine colloidal
precipitate. This colloidal nature of Prussian blue pigments hasbeen a major difficulty in determining the exact composition andthe crystal structure of Prussian blue pigments. In 1977, Buser etal.23 succeeded in growing Prussian blue single-crystals. Theyprepared a solution of iron(II) and [FeII(CN)6]
4− inconcentrated hydrochloric acid and allowed crystals to grow byvery slow diffusion of water vapor into the solution. After 8 weeksthey collected cubic crystals as large as 0.15 mm in length. TheBuser et al.23 synthesis has been reproduced here and was
adapted to produce both the insoluble well-crystallized Prussianblue, Fe4
III[FeII(CN)6]3·xH2O, 5, and the soluble well-crystal-lized Prussian blue, NH4Fe
III[FeII(CN)6]·xH2O, 6.Insoluble crystallized Prussian blue, 5, see Table S1, was
prepared by separately dissolving 7.5 mmol of FeCl2·4H2O and2.5 mmol of K4Fe(CN)6·3H2O in 35 mL of deionized water. Thetwo solutions were added to 430 mL of 36% HCl to obtain 500mL of a solution containing 10 mol/L of HCl. The beakercontaining this solution and another beaker containing ca. 500mL of water were both placed in a vacuum desiccator whosestopcock was open. The diffusion of air into the solution slowlyoxidizes the iron(II) ions. After 8 weeks in the dark, cubic crystalsof 5 were collected by filtration, thoroughly washed with 2 MHCl, 0.1 M HCl, and finally with deionized water, until theabsence of turbidity was observed upon addition of AgNO3 to thewash water.The procedure used to prepare soluble well-crystallized
Prussian blue, 6, containing NH4+ ions is identical to that for
insoluble Prussian blue, 5, except for the proportion of startingreagents. Equimolar quantities, 5.0 mmol of FeCl2·4H2O and 5.0mmol of (NH4)4Fe(CN)6·xH2O, obtained from Fluka with apurity of at least 85%, were used. In this case, 3 weeks wasrequired to obtain large cubic crystals of 6.Commercial Prussian blue pigments, 7 and 8, have been
obtained to compare their properties with those of 1−6 preparedherein. A commercial soluble Prussian blue pigment, with anu n d e fi n e d b u t p r o b a b l e s t o i c h i o m e t r y o fKFeIII[FeII(CN)6]·xH2O, 7, manufactured prior to 1948 byWinsor and Newton, London, was provided by the RoyalInstitute for Cultural Heritage, Brussels, Belgium. The insolublePrussian blue, Fe4
III[FeII(CN)6]3·xH2O, 8, was purchased fromSigma Aldrich, Steinheim, Germany.In total, 20 Prussian blue pigments, including three well-
crystallized pigments, and five commercial pigments wereavailable for analyses; see Table S1. With the goal of identifyingthe role that the various synthesis parameters play upon theproperties of Prussian blue pigments, the detailed character-ization of the selected samples, 1−8, is reported herein. Moredetails of the remaining samples may be found in the SupportingInformation and in ref 24.
UV−Visible Spectroscopy. UV−visible absorption spectrawere obtained between 350 and 900 nm in a quartz cell by using aKontron Uvikon 941 double-beam spectrophotometer. Prussianblue colloidal solutions were prepared by dispersing 1 mg ofPrussian blue pigment in 10 mL of deionized water. To obtain asfine as possible dispersions of the pigments, the blue colloidalsuspensions were sonicated for 15 min in an ultrasonic bath. Thisprocess led to “solutions” that exhibited no visual scattering forthe soluble pigments, 3 and 4, but was less successful for theinsoluble pigment 8.
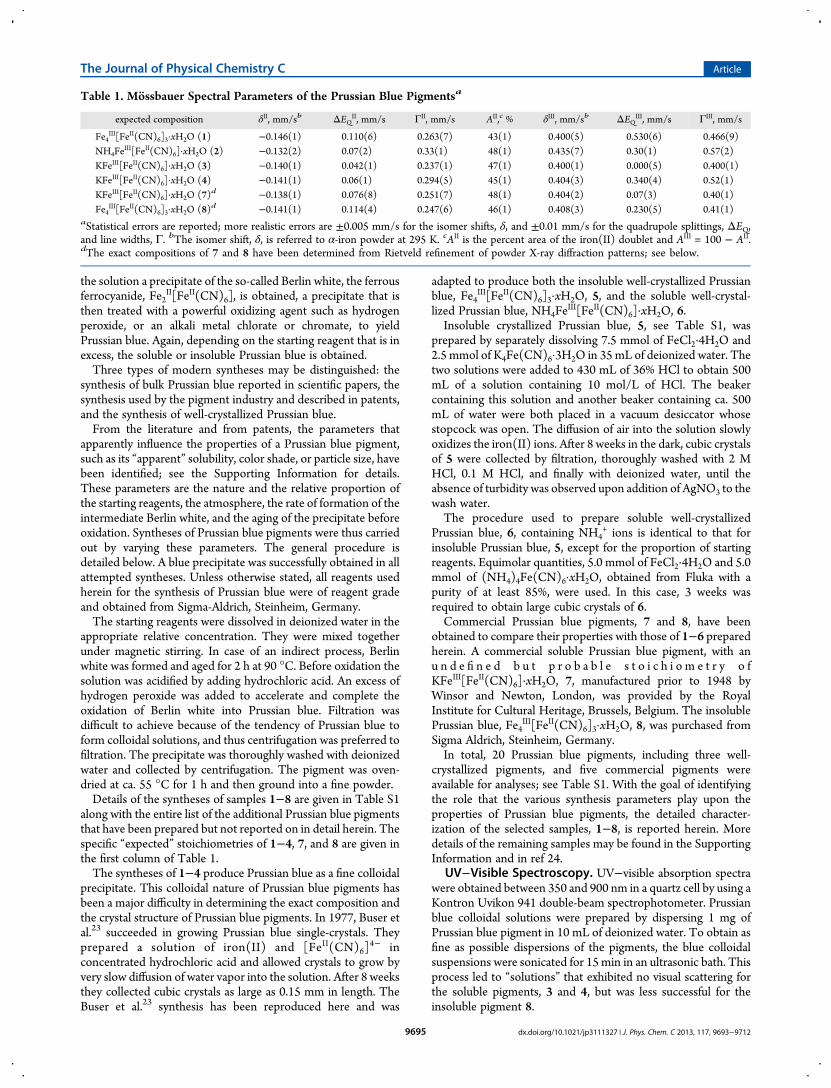
Table 1. Mossbauer Spectral Parameters of the Prussian Blue Pigmentsa
expected composition δII, mm/sb ΔEQII, mm/s ΓII, mm/s AII,c % δIII, mm/sb ΔEQIII, mm/s ΓIII, mm/s
Fe4III[FeII(CN)6]3·xH2O (1) −0.146(1) 0.110(6) 0.263(7) 43(1) 0.400(5) 0.530(6) 0.466(9)
NH4FeIII[FeII(CN)6]·xH2O (2) −0.132(2) 0.07(2) 0.33(1) 48(1) 0.435(7) 0.30(1) 0.57(2)
KFeIII[FeII(CN)6]·xH2O (3) −0.140(1) 0.042(1) 0.237(1) 47(1) 0.400(1) 0.000(5) 0.400(1)KFeIII[FeII(CN)6]·xH2O (4) −0.141(1) 0.06(1) 0.294(5) 45(1) 0.404(3) 0.340(4) 0.52(1)KFeIII[FeII(CN)6]·xH2O (7)d −0.138(1) 0.076(8) 0.251(7) 48(1) 0.404(2) 0.07(3) 0.40(1)Fe4
III[FeII(CN)6]3·xH2O (8)d −0.141(1) 0.114(4) 0.247(6) 46(1) 0.408(3) 0.230(5) 0.41(1)aStatistical errors are reported; more realistic errors are ±0.005 mm/s for the isomer shifts, δ, and ±0.01 mm/s for the quadrupole splittings, ΔEQ,and line widths, Γ. bThe isomer shift, δ, is referred to α-iron powder at 295 K. cAII is the percent area of the iron(II) doublet and AIII = 100 − AII.dThe exact compositions of 7 and 8 have been determined from Rietveld refinement of powder X-ray diffraction patterns; see below.
The Journal of Physical Chemistry C Article
dx.doi.org/10.1021/jp3111327 | J. Phys. Chem. C 2013, 117, 9693−97129695
The UV−visible reflectance spectra were obtained with aStellarNet EPP2000C spectrometer equipped with a charge-coupled detector. The optical-fiber probe consists of sixilluminating fibers and a single fiber that collects the reflectedlight. The sample is illuminated over a surface area of ca. 4 mm2 atan angle of 45° to avoid direct reflection. A Halon D50 whitelamp reference was used for calibration. The spectra wererecorded in reflection mode between 350 and 880 nm, with aresolution of 1 nm.Scanning Electron Microscopy. The scanning electron
microscopy measurements were obtained with a JEOL JSM-7500F field-emission electronic scanning microscope. Thescanning electron micrographs were obtained with an emissioncurrent of 10 μA and a 15 keV electron beam. The micrographswere recorded in the secondary electron emission mode; thecontrast is thus related to the topography of the sample surface.Powder Prussian blue samples were deposited on a double-sidedcarbon tape on the sample holder and introduced in themicroscope. Because of the semiconducting behavior of Prussianblue, no sample charging was observed during themeasurements.Nitrogen Adsorption−Desorption. The nitrogen adsorp-
tion−desorption isotherms of selected Prussian blues have beenrecorded using a Sorptomatic 1900 Fisons instrument. Thespecific surface area was determined by using the Brunauer−Emmett−Teller theory.Iron-57 Mossbauer Spectroscopy. Iron-57 Mossbauer
spectra were obtained by using a constant-accelerationspectrometer and a Janis Supervaritemp cryostat. TheMossbauerspectral absorbers were prepared with 10 mg/cm2 of powderedPrussian blue pigment mixed with boron nitride. Thespectrometer was calibrated at 295 K with α-iron powder. TheMossbauer spectra were fitted with Lorentzian symmetricdoublets from 7 to 295 K or with a doublet and a sextet at 4.2 K.Atomic Absorption and Flame Emission Spectroscopy.
The Prussian blue pigments were dissolved in concentratedsulfuric acid and then treated with hydrochloric acid to dissolvethe iron sulfate formed. The concentrations of iron andpotassium are given in weight percent and are the average ofthree successive measurements. The accuracy of the measure-ment is estimated to be ±0.01 wt %.Thermogravimetric Analyses. Thermogravimetric anal-
yses, coupled with differential thermal analyses, were obtainedwith a Netzsch STA 447 C instrument. The Prussian bluepigments were placed in an alumina crucible and heated with aconstant heating rate of 2 °C/min in air. The thermogravimetriccurves were normalized, that is, divided by the sample mass, sothat they begin at 100%.Particle-Induced X-ray Emission Spectroscopy. The
particle-induced X-ray emission measurements were performedby using an external proton beam of ca. 3.12 MeV with anintensity of 5 nA, produced by the cyclotron of the University ofLiege. Description and recent improvements of the PIXE lineand extraction nozzle have been described by Weber et al.25 Thespecific experimental conditions and the fitting procedure aredetailed in the Supporting Information.The spectra were analyzed with the GUPIXWIN software.26
Calibration in energy and adjustment of the experimentalparameters were achieved by fitting a diorite, DR-N, standard.Prussian blue powders were analyzed in the form of pressedpellets and were considered as thick targets. The elementalcomposition was calculated by taking into account the invisibleelements, that is, the light elements that are known to be presentin the sample but whose X-rays are not detected, such as C and
N; see Supporting Information for details. The water was notconsidered in the elemental composition.
X-ray Diffraction. The Prussian blue pigments were studiedby X-ray powder diffraction with a PANalytical PW-3710diffractometer. The radiation was provided by an iron anodethat produced iron Kα radiation of 1.9373 Å wavelength. The useof iron radiation reduces the fluorescence of the sample, becauseiron is the main constituent of Prussian blue. Unless otherwisestated, the diffraction patterns were recorded over a 2θ anglerange from 5° to 75°, with a time per step of 1 s.The high-energy X-ray diffraction experiments were carried
out at the beamline ID11, European Synchrotron RadiationFacility (ESRF), Grenoble. This beamline is equipped with aSi(111) double crystal monochromator and a X-ray transfocator.The beam size was approximately 50 × 200 μm2 area. The X-rayenergy was 99.428 keV, and the wavelength is 0.124968 Å. ThePrussian blue pigments were stored in quartz capillaries of 0.3mm in diameter and placed in front of the detector. A total of 812D diffraction images per sample, with an acquisition time of 20 sper image, were collected with the ESRF FreLoN camera placedat ca. 107 mm from the sample. The 2D diffraction images werethen averaged and integrated into a linear scattering signal withthe software Fit2D.27 The distance between the sample and thedetector was determined with a LaB6 standard.According to the formalism developed by Proffen and
Billinge,28 the pair distribution function, G(r), may be obtainedfrom the powder X-ray diffraction pattern by a Fourier transformof the normalized scattering intensity, S(Q), which contains thecoherent scattering intensity; see the Supporting Information fordetails.
∫π ρ ρ
π
= −
= −∞
G r r r
Q S Q Qr Q
( ) 4 [ ( ) ]2
[ ( ) 1] sin d
0
0 (1)
where ρ(r) is the microscopic pair density, ρ0 is the atomicnumber density, that is, the number of electrons per Å3, and Q isthe magnitude of the scattering vector. For elastic scattering Q =4π sin θ/λ, where 2θ is the scattering angle and λ the wavelengthof the radiation used. The functionG(r) in eq 1, which is referredto as the reduced pair distribution function, gives the probabilityof finding an atom or ion at a distance, r, from any given atom orion.The pair distribution function is extracted by using the
PDFgetX2 software.29 The pair distribution function wasobtained by using a Gaussian damping of 15−20 Å−1, and amaximum Q-value, Qmax, of 30 Å
−1. Details of this extraction aregiven in the Supporting Information.The software PDFGui30 was used for the pair distribution
function refinement. The refinement is based on the least-squares minimization in direct space of the experimental pairdistribution with a structural periodic model; see the SupportingInformation for details. In the pair distribution function analysisof the Prussian blue pigments, the lattice parameter, a, the scalefactor for each phase, and the position, the occupancy, andisotropic atomic displacement parameters for each atom or ion ineach phase were refined up to a maximum distance, herein fixedat 10.2 Å, that is, ca. the lattice parameter of Prussian blue. Theresolution damping factor accounts for the progressive decreasein the amplitude of the pair distribution function peaks at largerdistances due to the resolution of the diffraction experiment. Thisfactor was determined to be 0.05 from the LaB6 standard pairdistribution analysis. This value was used in all of the fits
The Journal of Physical Chemistry C Article
dx.doi.org/10.1021/jp3111327 | J. Phys. Chem. C 2013, 117, 9693−97129696

presented herein as the data were recorded under similarexperimental conditions.The high-resolution X-ray powder diffraction data used for the
Rietveld refinement were collected at the CRISTAL beamline,Soleil, Paris. The beamline is located at an undulator port andprovides a beam in the energy range of 4−30 keV, with a relativeenergy resolution, ΔE/E, of approximately 10−4. The beamcross-section on the sample is ca. 450 × 100 μm2. The X-raypowder diffraction data were collected at a wavelength of0.442930 Å in high resolution, parallel beam geometry using amultianalyzer/detector stage. The samples were placed in 0.7mm diameter glass capillaries. The data were refined by theRietveld method using the FULLPROF software.31
Iron K-Edge X-ray Absorption Spectroscopy. The ironK-edge X-ray absorption near-edge experiments were performedat the DUBBLE Dutch-Belgian beamline BM26, which is locatedat a 0.4 T bending magnet port of the electron storage ring, at theESRF, Grenoble, France. This beamline,32 which is equippedwith a Si(111) double crystal monochromator, delivers an X-raybeam with an energy of 9.6 keV and a relative energy resolution,ΔE/E, of ca. 2 × 10⁻⁴. The higher harmonics were suppressedwith a silicon reflecting strip on a mirror behind themonochromator.The energy scale was calibrated with a 4 μm thick iron foil,
whose spectrum was recorded in transmission mode; the energyof the first maximum in the derivative of the absorption at theiron K-edge was taken to be 7112 eV. In transmission mode, theintensities of the incident and transmitted X-ray beams weremeasured with Oxford Instrument ionization detectors. Groundmixtures of Prussian blue pigments with boron nitride werepressed into self-supporting pellets and then measured intransmission mode.The X-ray absorption near-edge spectral data reduction and
analysis were performed with the XDAP software.33 A modifiedVictoreen curve34 was used for the pre-edge backgroundsubtraction in the X-ray absorption spectra obtained intransmission mode, and a linear function or a constant wasused for the same subtraction in the spectra obtained influorescence detection mode. A cubic spline routine35 was usedfor the atomic background subtraction. The pre-edge back-ground subtracted spectra were normalized to the edge height,which was taken to be the value of the atomic background at 50eV above the K-edge. The fit parameters were determined bymultiple shell fitting in R-space, by applying the difference filetechnique using Fourier transforms.36 The phase shifts andbackscattering amplitudes were obtained form FEFF8.0calculations37 on the Prussian blue crystal structure, by takingthe iron(II) ion as the central ion site. Details about the fitprocedure used herein can be found elsewhere.14
Raman Spectroscopy. The Prussian blue powders werestudied by using a Horiba Jobin Yvon LabRAM 300 Ramanspectrometer that used either a Krypton ion laser at a wavelengthof 647 nm, which enhances the band intensities of Prussian blueby resonance Raman effects, or an Ar laser at a wavelength of 514nm with a power of 0.3 mW. All spectra are the result of the sumof two scans with an integration time of 100 s between 2800 and100 cm−1; the resolution is 5 cm−1. The baseline of the Ramanspectra was corrected with a polynomial function.
■ RESULTSOur long-range goal is the study of the causes of fading ofPrussian blue pigments in eighteenth- and nineteenth-centurypaintings, and the main objective of this article is to investigate
the Prussian blue synthesis−properties relationship. Our startingpoint is the characterization of the color of Prussian bluepigments painted both pure and mixed with a white pigmentbecause the color is the key property for the study of anysubsequent fading. Because of the well-known dependence of thecolor properties on the intrinsic grain size distribution, theparticle size of the pigments has been determined and related tothe color characteristics. The color of Prussian blue arises fromthe presence of the FeII−CN−FeIII exchange pathway, whichallows intervalent electron transfer when light is absorbed atapproximately 700 nm. Any subsequent color change is thusrelated to this specific structural pathway, which is extensivelystudied herein by X-ray diffraction, pair distribution functionanalysis, and iron K-edge absorption spectroscopy. Prior to thisthorough structural characterization, the composition of thePrussian blue pigments has been carefully investigated.Mossbauer spectroscopy has been used to identify the ferricferrocyanide complex and determine the iron(III)/iron(II) ratio.The elemental composition of the Prussian blue pigments wasobtained by combining atomic thermogravimetric analyses,atomic absorption and flame emission spectroscopy, andparticle-induced X-ray emission studies. As will be shownbelow, the iron(III)/iron(II) ratio obtained from Mossbauerspectroscopy and the elemental composition do not agree withthe usual stoichiometry for soluble potassium containingPrussian blue, that is, KFeIII[FeII(CN)6]·xH2O, and a newstructural model derived from the Rietveld refinement of a high-resolution X-ray powder diffraction pattern is proposed toresolve these discrepancies.
Color, Spectral Reflectance, and Absorbance. Bothbecause of the importance of Prussian blue as an artist’s pigmentand because of its tendency to fade with time, its color must becarefully evaluated to better delineate future painting con-servation and restoration methods.In Figure 2, the different Prussian blue pigments mixed with
gum arabic have been painted in a pure state or mixed with 100
parts of titaniumwhite, TiO2, a modern white pigment purchasedfrom Kremer Pigmente Gmbh & Co. KG, Alchstetten, Germany.Although the commercial and laboratory-synthesized Prussianblue pigments are all qualitatively blue in color, it is visuallyobvious in Figure 2 that the color is not identical for all of thepigments painted either pure or mixed with TiO2.The color of a pigmented paint layer is best evaluated in terms
of three parameters. First is the hue or shade, that is, the propertyof a color that differentiates it from an achromatic color such asgray or black.38 Second is the tinting strength, which is defined asthe ability of a pigment to color a white mixture.38 Third is thehiding power, a parameter that refers to the ability of a pigment toscatter light to the maximum possible extent.39
Several of the Prussian blue pigments, 1, 2, 5, and 6, and, to alesser extent, 4, are characterized by a duller shade, a lower tintingstrength, and a smaller hiding power than 3 and the commercial
Figure 2. Paint layers of Prussian blue pigments, 1−8, mixed with gumarabic and painted pure, left of each pair, and mixed with 100 parts ofTiO2, right of each pair.
The Journal of Physical Chemistry C Article
dx.doi.org/10.1021/jp3111327 | J. Phys. Chem. C 2013, 117, 9693−97129697

pigments, 7 and 8. These tinctorial properties are directlyassociated with the absorption and scattering power of thepigments, the refractive indices of the pigments and the gumarabic medium, the particle size and shape of the pigments, andtheir distribution.Prussian Blue Hue. The hue of a pigment is influenced by its
absorption of light, that is, by the possible electronic transitionswithin the molecules making up the pigment. The color ofPrussian blue pigments results from an intervalence electrontransfer absorption band at ca. 700 nm that corresponds to thetransfer of an electron from an iron(II) to an iron(III) ion whenlight is absorbed.UV−visible absorption spectral studies of aqueous dispersions
of Prussian blue pigments confirm this absorption of light; seeFigure 3. As expected for Prussian blue, the maxima in the
absorbance are at 693(2), 678(2), and 692(2) nm for 3, 4, and 8,respectively. A tentative fit of this UV−visible absorptionspectrum is presented in the Supporting Information; see FigureS1.The alkali metal ions present in the soluble Prussian blues also
affect the hue of the pigment;40 that is, a sodium cationcontaining Prussian blue is slightly greenish, whereas anammonium cation containing Prussian blue is red-tinged. Thisvariation in color is caused by the spectral lines of the alkali ion; asodium ion is characterized by yellow spectral lines, a potassiumion by violet, and an ammonium cation by intense violet lines.Analyses of the UV−visible diffuse reflectance spectra of
pigments 1 and 2 painted from gum arabic with TiO2 in a 1:100dilution ratio revealed a shift of the maximum in reflectancetoward longer wavelengths. The results are shown in Figure S2.Such a change in shade may be caused by a smaller pigmentparticle size.38 The particle size of the Prussian blue pigments hasbeen investigated by scanning electron microscopy and 4 has thesmallest particle size; see Figure 4. At high magnification, theprimary particles of the pigments, defined as the smallest entitiesthat can be distinguished, can be identified; some of them arecircled as a guide to the eye in the micrographs on the right inFigure 4. In the well-crystallized pigments 5 and 6, the primaryparticles are cubic crystals of ca. 5 μm length. In the otherpigments, the primary particles most often consist of aggregatesof several crystallites. The primary particles can in turn aggregateas a result of van der Waals or Coulombic forces to formagglomerates.All of the Prussian blue pigments studied herein as fine
precipitates have formed rather shapeless agglomerates, exceptfor the commercial pigment 8, whose agglomerates are spherical.The commercial S15 and S17 Prussian blues, not shown inFigure 4, also consist of spherical agglomerates. The method forobtaining such uniform spherically shaped and lightly agglom-erated particles has been described in several patents.41 This
method requires the simultaneous and very slow introduction ofthe aqueous solution of ferrocyanide and ferrous solution into acontainer with optimum mixing during the precipitation. Theresulting Berlin white precipitate is then aged at temperaturesbetween 80 and 120 °C, at a nitrogen pressure of 1−2 atm.To complete the particle size investigation, the specific surface
area of 1, 8, and S15 has been measured by nitrogen adsorption−desorption. The commercial pigments 8 and S15 have verysimilar specific surface areas of 55 and 61 m2/g, whereas 1 has aspecific surface area of 201 m2/g. Because dinitrogen cannotpenetrate into the lattice cavities of the Prussian blue pigments,these specific surface areas correspond to the total particlesurface areas. The above values cannot be compared directly to,for instance, the BET surface area of 550 m2/g obtained42 fordehydrated Fe4
III[FeII(CN)6]3 to probe its porosity. Thus, thespecific surface area measurements confirm the smaller particlesize characteristic of 1 that has been prepared in an ambientatmosphere with no aging before or during the synthesis. Thissmaller particle size may explain the shift in shade observed for 1because the presence of small particles favors absorption in awavelength region other than that of the maximum absorptionobserved at ca. 700 nm for Prussian blue pigments; see theSupporting Information for more details.
Tinting Strength. The shift in shade is not the most strikingfeature in Figure 2. The commercial pigments 7 and 8 as well as 3are much more efficient in coloring titanium white than the otherpigments. The ability of a pigment to confer color to a lightscattering material is called its tinting strength. In practice, thedetermination of the tinting strength is based on the measure-ment of the reflectance corrected by the Kubelka−Munktheory.43 This theory predicts that the tinting strength dependsboth on the particle size and on the wavelength of the light.According to the Mie theory,44 there is an optimum particle
size for the absorption of light. Commercial pigments 7 and 8, aswell as 3, have a very high tinting strength; only 1 wt % of thepigment is sufficient to color TiO2. In contrast, the well-crystallized Prussian blue pigment 5 has an extremely low tintingstrength as a result of the presence of much larger primaryparticles of ca. 5 μm length; see Figure 4. These larger particlesare not easily penetrated by the light, and their cores remainineffective for absorption.Normally a reduction in particle size is expected to increase the
tinting strength because additional pigment volume is accessiblefor absorption. However, in the case of Prussian blue pigments 1and 2, the smaller than optimum particle size does not enhancethe tinting strength, because the light passes through the particleswithout absorption.
Hiding Power. The hiding power of a paint layer is related toboth the absorption and scattering coefficients and the refractiveindices of the pigment and the medium. The refractive index ofthe Prussian blue, titanium white (rutile), and gum arabicsolution 10% is 1.56, 2.71, and 1.334, respectively.45 In paintlayers, the larger is the difference in refractive index between thepigment and the binder, whose refractive index is taken as 1, thehigher is the hiding power because light scattering is enhanced bythis large difference. With its very large refractive index and,consequently, its large scattering coefficient, titanium white ismore hiding than Prussian blue, which can be considered as atransparent pigment because of its small refractive index; seeFigure S3 and the Supporting Information for details. The hidingpower is also influenced by the surface roughness and opticaldiscontinuities in the paint layer.
Figure 3. UV−visible absorption spectra of the soluble pigments, 3 and4, and the insoluble pigment, 8.
The Journal of Physical Chemistry C Article
dx.doi.org/10.1021/jp3111327 | J. Phys. Chem. C 2013, 117, 9693−97129698

As was the case for absorption, there is an optimum particlesize for scattering. Unfortunately, for a given wavelength, theoptimum particle size for scattering does not correspond to theoptimum particle size for absorption. The scattering powerreaches a maximum when the particle diameter is ca. one-half thewavelength of the incident light.38
Because the commercial 7 and 8, as well as the 3 pigments arecomposed of particles of ca. 60−80 nm diameter, their particlesize lies below the optimum size for scattering. These pigmentsthus have a relatively low scattering power. In contrast, 1, 2, and 4are characterized by a size of ca. 20−30 nm. For particles muchsmaller than the wavelength of the incident light, the scatteringpower is better described by Rayleigh scattering than by Miescattering. Thus, their scattering power is even weaker than that
of the commercial pigments 7 and 8, as well as that of 3. As a pureshade they thus appear more transparent because of their smallscattering power and, consequently, their poor hiding power; seeFigure 2. Thus a variation in particle size explains the differencein color perception of the different Prussian blue pigments.From Figures 2 and 4, it is obvious that the well-crystallized 5
and 6 pigments strongly differ from the 1−4, 7, and 8 pigmentsbecause of their well-crystallized character and their extremelylow tinting strength. Such samples cannot be properly calledpigment, which is most typically a fine coloring powder oforganic or inorganic material. Because the main objective of thisarticle is to clarify the relationship between the synthesis ofPrussian blue pigments used for artistic purposes and theirphysical properties, 5 and 6 will not be discussed any further.
Figure 4. Scanning electronmicrographs of the 3−8 Prussian blue pigments obtained with 15 keV secondary electrons. The scale bar is 50 μm, 1 μm, and200 nm from left to right, except for the micrographs of pigments 5 and 6, where the scale bar is 50, 10, and 5 μm.
The Journal of Physical Chemistry C Article
dx.doi.org/10.1021/jp3111327 | J. Phys. Chem. C 2013, 117, 9693−97129699
In conclusion, our rather qualitative study of the color ofvarious Prussian blue pigments indicates that the synthesisprocedure strongly affects the hue, tinting strength, and hidingpower of Prussian blue. Only the pigments prepared by theindirect method both in a nitrogen atmosphere and with anintermediate aging step of the Berlin white exhibit the optimumparticle size to obtain a highly colored pigment.Iron-57 Mossbauer Spectra. Iron-57 Mossbauer spectros-
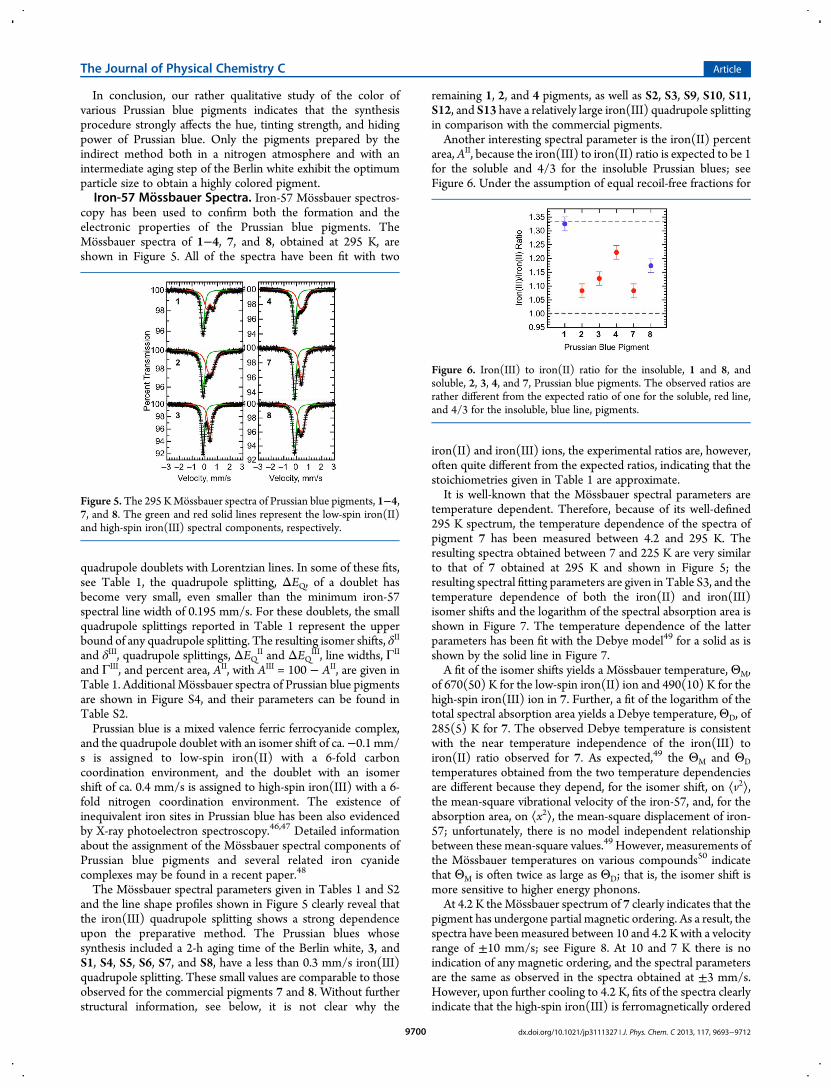
copy has been used to confirm both the formation and theelectronic properties of the Prussian blue pigments. TheMossbauer spectra of 1−4, 7, and 8, obtained at 295 K, areshown in Figure 5. All of the spectra have been fit with two
quadrupole doublets with Lorentzian lines. In some of these fits,see Table 1, the quadrupole splitting, ΔEQ, of a doublet hasbecome very small, even smaller than the minimum iron-57spectral line width of 0.195 mm/s. For these doublets, the smallquadrupole splittings reported in Table 1 represent the upperbound of any quadrupole splitting. The resulting isomer shifts, δII
and δIII, quadrupole splittings, ΔEQII and ΔEQIII, line widths, ΓII
and ΓIII, and percent area, AII, with AIII = 100 − AII, are given inTable 1. Additional Mossbauer spectra of Prussian blue pigmentsare shown in Figure S4, and their parameters can be found inTable S2.Prussian blue is a mixed valence ferric ferrocyanide complex,
and the quadrupole doublet with an isomer shift of ca.−0.1 mm/s is assigned to low-spin iron(II) with a 6-fold carboncoordination environment, and the doublet with an isomershift of ca. 0.4 mm/s is assigned to high-spin iron(III) with a 6-fold nitrogen coordination environment. The existence ofinequivalent iron sites in Prussian blue has been also evidencedby X-ray photoelectron spectroscopy.46,47 Detailed informationabout the assignment of the Mossbauer spectral components ofPrussian blue pigments and several related iron cyanidecomplexes may be found in a recent paper.48
The Mossbauer spectral parameters given in Tables 1 and S2and the line shape profiles shown in Figure 5 clearly reveal thatthe iron(III) quadrupole splitting shows a strong dependenceupon the preparative method. The Prussian blues whosesynthesis included a 2-h aging time of the Berlin white, 3, andS1, S4, S5, S6, S7, and S8, have a less than 0.3 mm/s iron(III)quadrupole splitting. These small values are comparable to thoseobserved for the commercial pigments 7 and 8. Without furtherstructural information, see below, it is not clear why the
remaining 1, 2, and 4 pigments, as well as S2, S3, S9, S10, S11,S12, and S13 have a relatively large iron(III) quadrupole splittingin comparison with the commercial pigments.Another interesting spectral parameter is the iron(II) percent
area, AII, because the iron(III) to iron(II) ratio is expected to be 1for the soluble and 4/3 for the insoluble Prussian blues; seeFigure 6. Under the assumption of equal recoil-free fractions for
iron(II) and iron(III) ions, the experimental ratios are, however,often quite different from the expected ratios, indicating that thestoichiometries given in Table 1 are approximate.It is well-known that the Mossbauer spectral parameters are
temperature dependent. Therefore, because of its well-defined295 K spectrum, the temperature dependence of the spectra ofpigment 7 has been measured between 4.2 and 295 K. Theresulting spectra obtained between 7 and 225 K are very similarto that of 7 obtained at 295 K and shown in Figure 5; theresulting spectral fitting parameters are given in Table S3, and thetemperature dependence of both the iron(II) and iron(III)isomer shifts and the logarithm of the spectral absorption area isshown in Figure 7. The temperature dependence of the latterparameters has been fit with the Debye model49 for a solid as isshown by the solid line in Figure 7.A fit of the isomer shifts yields a Mossbauer temperature, ΘM,
of 670(50) K for the low-spin iron(II) ion and 490(10) K for thehigh-spin iron(III) ion in 7. Further, a fit of the logarithm of thetotal spectral absorption area yields a Debye temperature, ΘD, of285(5) K for 7. The observed Debye temperature is consistentwith the near temperature independence of the iron(III) toiron(II) ratio observed for 7. As expected,49 the ΘM and ΘDtemperatures obtained from the two temperature dependenciesare different because they depend, for the isomer shift, on ⟨v2⟩,the mean-square vibrational velocity of the iron-57, and, for theabsorption area, on ⟨x2⟩, the mean-square displacement of iron-57; unfortunately, there is no model independent relationshipbetween these mean-square values.49 However, measurements ofthe Mossbauer temperatures on various compounds50 indicatethat ΘM is often twice as large as ΘD; that is, the isomer shift ismore sensitive to higher energy phonons.At 4.2 K theMossbauer spectrum of 7 clearly indicates that the
pigment has undergone partial magnetic ordering. As a result, thespectra have beenmeasured between 10 and 4.2 K with a velocityrange of ±10 mm/s; see Figure 8. At 10 and 7 K there is noindication of any magnetic ordering, and the spectral parametersare the same as observed in the spectra obtained at ±3 mm/s.However, upon further cooling to 4.2 K, fits of the spectra clearlyindicate that the high-spin iron(III) is ferromagnetically ordered
Figure 5.The 295 KMossbauer spectra of Prussian blue pigments, 1−4,7, and 8. The green and red solid lines represent the low-spin iron(II)and high-spin iron(III) spectral components, respectively.
Figure 6. Iron(III) to iron(II) ratio for the insoluble, 1 and 8, andsoluble, 2, 3, 4, and 7, Prussian blue pigments. The observed ratios arerather different from the expected ratio of one for the soluble, red line,and 4/3 for the insoluble, blue line, pigments.
The Journal of Physical Chemistry C Article
dx.doi.org/10.1021/jp3111327 | J. Phys. Chem. C 2013, 117, 9693−97129700
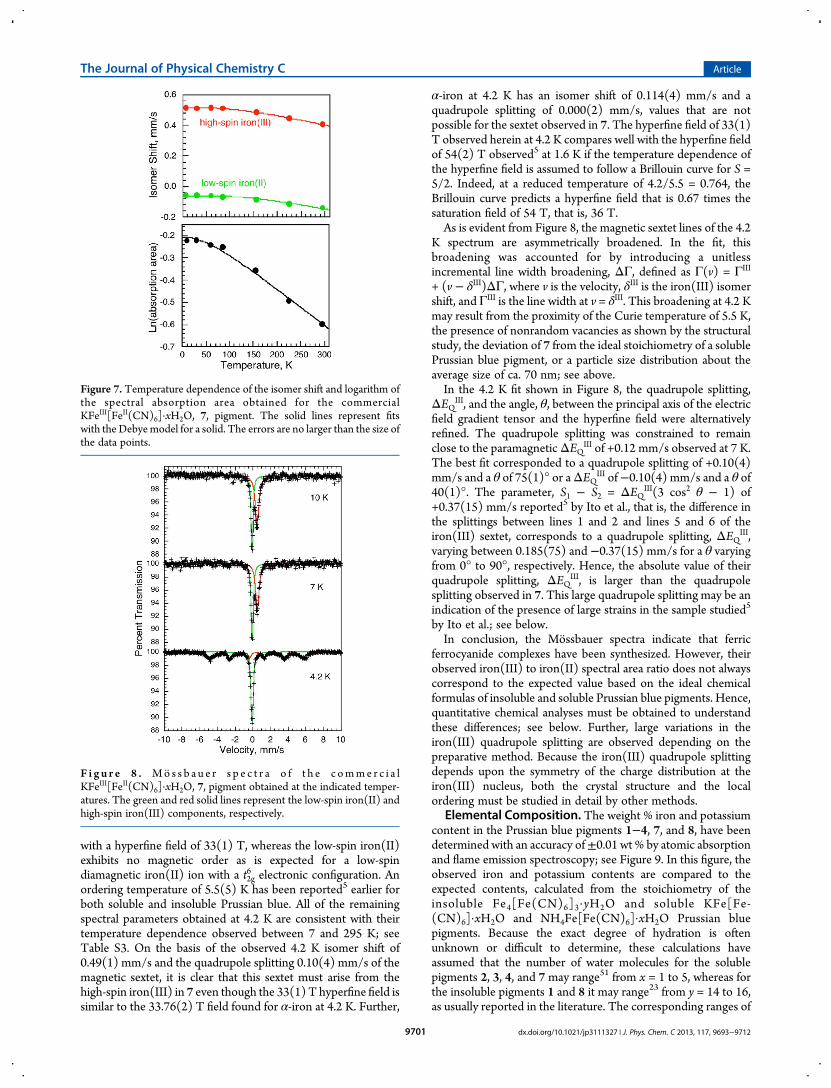
with a hyperfine field of 33(1) T, whereas the low-spin iron(II)exhibits no magnetic order as is expected for a low-spindiamagnetic iron(II) ion with a t2
6g electronic configuration. An
ordering temperature of 5.5(5) K has been reported5 earlier forboth soluble and insoluble Prussian blue. All of the remainingspectral parameters obtained at 4.2 K are consistent with theirtemperature dependence observed between 7 and 295 K; seeTable S3. On the basis of the observed 4.2 K isomer shift of0.49(1) mm/s and the quadrupole splitting 0.10(4) mm/s of themagnetic sextet, it is clear that this sextet must arise from thehigh-spin iron(III) in 7 even though the 33(1) T hyperfine field issimilar to the 33.76(2) T field found for α-iron at 4.2 K. Further,
α-iron at 4.2 K has an isomer shift of 0.114(4) mm/s and aquadrupole splitting of 0.000(2) mm/s, values that are notpossible for the sextet observed in 7. The hyperfine field of 33(1)T observed herein at 4.2 K compares well with the hyperfine fieldof 54(2) T observed5 at 1.6 K if the temperature dependence ofthe hyperfine field is assumed to follow a Brillouin curve for S =5/2. Indeed, at a reduced temperature of 4.2/5.5 = 0.764, theBrillouin curve predicts a hyperfine field that is 0.67 times thesaturation field of 54 T, that is, 36 T.As is evident from Figure 8, the magnetic sextet lines of the 4.2
K spectrum are asymmetrically broadened. In the fit, thisbroadening was accounted for by introducing a unitlessincremental line width broadening, ΔΓ, defined as Γ(v) = ΓIII
+ (v − δIII)ΔΓ, where v is the velocity, δIII is the iron(III) isomershift, and ΓIII is the line width at v = δIII. This broadening at 4.2 Kmay result from the proximity of the Curie temperature of 5.5 K,the presence of nonrandom vacancies as shown by the structuralstudy, the deviation of 7 from the ideal stoichiometry of a solublePrussian blue pigment, or a particle size distribution about theaverage size of ca. 70 nm; see above.In the 4.2 K fit shown in Figure 8, the quadrupole splitting,
ΔEQIII, and the angle, θ, between the principal axis of the electric
field gradient tensor and the hyperfine field were alternativelyrefined. The quadrupole splitting was constrained to remainclose to the paramagneticΔEQIII of +0.12 mm/s observed at 7 K.The best fit corresponded to a quadrupole splitting of +0.10(4)mm/s and a θ of 75(1)° or aΔEQ
III of−0.10(4) mm/s and a θ of40(1)°. The parameter, S1 − S2 = ΔEQIII(3 cos2 θ − 1) of+0.37(15) mm/s reported5 by Ito et al., that is, the difference inthe splittings between lines 1 and 2 and lines 5 and 6 of theiron(III) sextet, corresponds to a quadrupole splitting, ΔEQ
III,varying between 0.185(75) and −0.37(15) mm/s for a θ varyingfrom 0° to 90°, respectively. Hence, the absolute value of theirquadrupole splitting, ΔEQ
III, is larger than the quadrupolesplitting observed in 7. This large quadrupole splitting may be anindication of the presence of large strains in the sample studied5
by Ito et al.; see below.In conclusion, the Mossbauer spectra indicate that ferric
ferrocyanide complexes have been synthesized. However, theirobserved iron(III) to iron(II) spectral area ratio does not alwayscorrespond to the expected value based on the ideal chemicalformulas of insoluble and soluble Prussian blue pigments. Hence,quantitative chemical analyses must be obtained to understandthese differences; see below. Further, large variations in theiron(III) quadrupole splitting are observed depending on thepreparative method. Because the iron(III) quadrupole splittingdepends upon the symmetry of the charge distribution at theiron(III) nucleus, both the crystal structure and the localordering must be studied in detail by other methods.
Elemental Composition. The weight % iron and potassiumcontent in the Prussian blue pigments 1−4, 7, and 8, have beendetermined with an accuracy of±0.01 wt % by atomic absorptionand flame emission spectroscopy; see Figure 9. In this figure, theobserved iron and potassium contents are compared to theexpected contents, calculated from the stoichiometry of theinsoluble Fe4[Fe(CN)6]3·yH2O and soluble KFe[Fe-(CN)6]·xH2O and NH4Fe[Fe(CN)6]·xH2O Prussian bluepigments. Because the exact degree of hydration is oftenunknown or difficult to determine, these calculations haveassumed that the number of water molecules for the solublepigments 2, 3, 4, and 7 may range51 from x = 1 to 5, whereas forthe insoluble pigments 1 and 8 it may range23 from y = 14 to 16,as usually reported in the literature. The corresponding ranges of
Figure 7. Temperature dependence of the isomer shift and logarithm ofthe spectral absorption area obtained for the commercialKFeIII[FeII(CN)6]·xH2O, 7, pigment. The solid lines represent fitswith the Debyemodel for a solid. The errors are no larger than the size ofthe data points.
F i g u r e 8 . Mo s s b a u e r s p e c t r a o f t h e c omme r c i a lKFeIII[FeII(CN)6]·xH2O, 7, pigment obtained at the indicated temper-atures. The green and red solid lines represent the low-spin iron(II) andhigh-spin iron(III) components, respectively.
The Journal of Physical Chemistry C Article
dx.doi.org/10.1021/jp3111327 | J. Phys. Chem. C 2013, 117, 9693−97129701
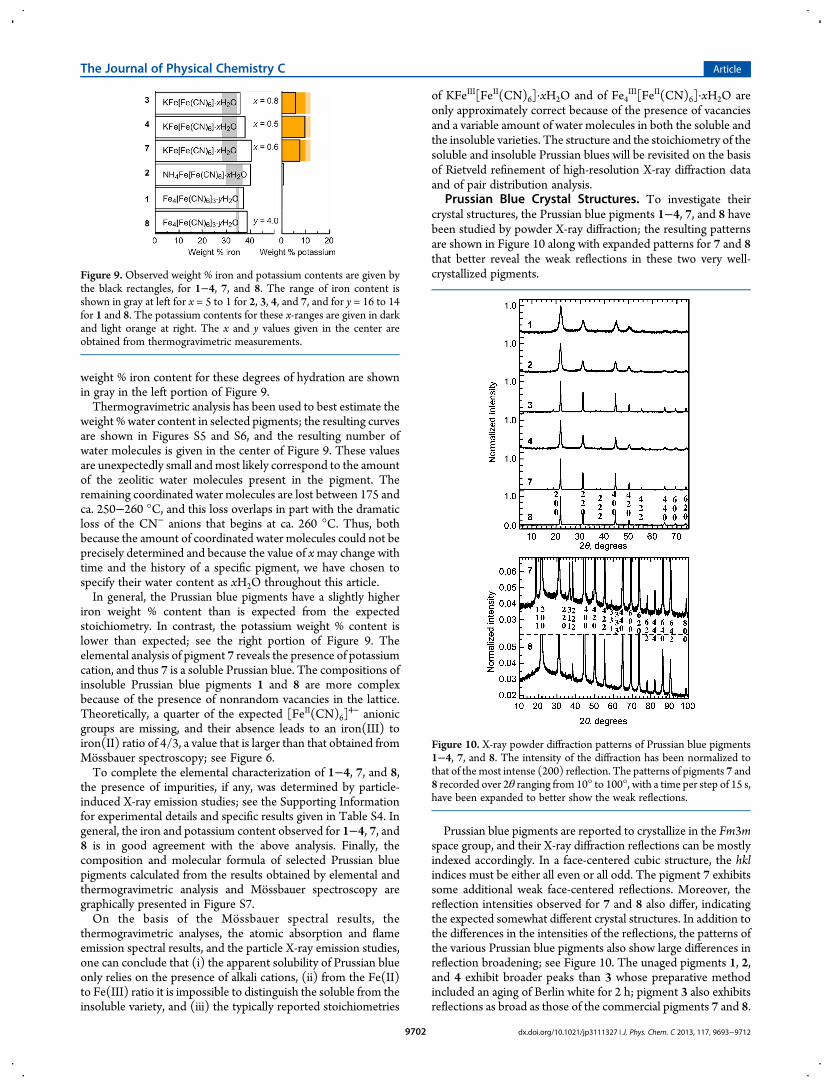
weight % iron content for these degrees of hydration are shownin gray in the left portion of Figure 9.Thermogravimetric analysis has been used to best estimate the
weight % water content in selected pigments; the resulting curvesare shown in Figures S5 and S6, and the resulting number ofwater molecules is given in the center of Figure 9. These valuesare unexpectedly small andmost likely correspond to the amountof the zeolitic water molecules present in the pigment. Theremaining coordinated water molecules are lost between 175 andca. 250−260 °C, and this loss overlaps in part with the dramaticloss of the CN− anions that begins at ca. 260 °C. Thus, bothbecause the amount of coordinated water molecules could not beprecisely determined and because the value of xmay change withtime and the history of a specific pigment, we have chosen tospecify their water content as xH2O throughout this article.In general, the Prussian blue pigments have a slightly higher
iron weight % content than is expected from the expectedstoichiometry. In contrast, the potassium weight % content islower than expected; see the right portion of Figure 9. Theelemental analysis of pigment 7 reveals the presence of potassiumcation, and thus 7 is a soluble Prussian blue. The compositions ofinsoluble Prussian blue pigments 1 and 8 are more complexbecause of the presence of nonrandom vacancies in the lattice.Theoretically, a quarter of the expected [FeII(CN)6]
4− anionicgroups are missing, and their absence leads to an iron(III) toiron(II) ratio of 4/3, a value that is larger than that obtained fromMossbauer spectroscopy; see Figure 6.To complete the elemental characterization of 1−4, 7, and 8,
the presence of impurities, if any, was determined by particle-induced X-ray emission studies; see the Supporting Informationfor experimental details and specific results given in Table S4. Ingeneral, the iron and potassium content observed for 1−4, 7, and8 is in good agreement with the above analysis. Finally, thecomposition and molecular formula of selected Prussian bluepigments calculated from the results obtained by elemental andthermogravimetric analysis and Mossbauer spectroscopy aregraphically presented in Figure S7.On the basis of the Mossbauer spectral results, the
thermogravimetric analyses, the atomic absorption and flameemission spectral results, and the particle X-ray emission studies,one can conclude that (i) the apparent solubility of Prussian blueonly relies on the presence of alkali cations, (ii) from the Fe(II)to Fe(III) ratio it is impossible to distinguish the soluble from theinsoluble variety, and (iii) the typically reported stoichiometries
of KFeIII[FeII(CN)6]·xH2O and of Fe4III[FeII(CN)6]·xH2O are
only approximately correct because of the presence of vacanciesand a variable amount of water molecules in both the soluble andthe insoluble varieties. The structure and the stoichiometry of thesoluble and insoluble Prussian blues will be revisited on the basisof Rietveld refinement of high-resolution X-ray diffraction dataand of pair distribution analysis.
Prussian Blue Crystal Structures. To investigate theircrystal structures, the Prussian blue pigments 1−4, 7, and 8 havebeen studied by powder X-ray diffraction; the resulting patternsare shown in Figure 10 along with expanded patterns for 7 and 8that better reveal the weak reflections in these two very well-crystallized pigments.
Prussian blue pigments are reported to crystallize in the Fm3mspace group, and their X-ray diffraction reflections can be mostlyindexed accordingly. In a face-centered cubic structure, the hklindices must be either all even or all odd. The pigment 7 exhibitssome additional weak face-centered reflections. Moreover, thereflection intensities observed for 7 and 8 also differ, indicatingthe expected somewhat different crystal structures. In addition tothe differences in the intensities of the reflections, the patterns ofthe various Prussian blue pigments also show large differences inreflection broadening; see Figure 10. The unaged pigments 1, 2,and 4 exhibit broader peaks than 3 whose preparative methodincluded an aging of Berlin white for 2 h; pigment 3 also exhibitsreflections as broad as those of the commercial pigments 7 and 8.
Figure 9. Observed weight % iron and potassium contents are given bythe black rectangles, for 1−4, 7, and 8. The range of iron content isshown in gray at left for x = 5 to 1 for 2, 3, 4, and 7, and for y = 16 to 14for 1 and 8. The potassium contents for these x-ranges are given in darkand light orange at right. The x and y values given in the center areobtained from thermogravimetric measurements.
Figure 10. X-ray powder diffraction patterns of Prussian blue pigments1−4, 7, and 8. The intensity of the diffraction has been normalized tothat of the most intense (200) reflection. The patterns of pigments 7 and8 recorded over 2θ ranging from 10° to 100°, with a time per step of 15 s,have been expanded to better show the weak reflections.
The Journal of Physical Chemistry C Article
dx.doi.org/10.1021/jp3111327 | J. Phys. Chem. C 2013, 117, 9693−97129702
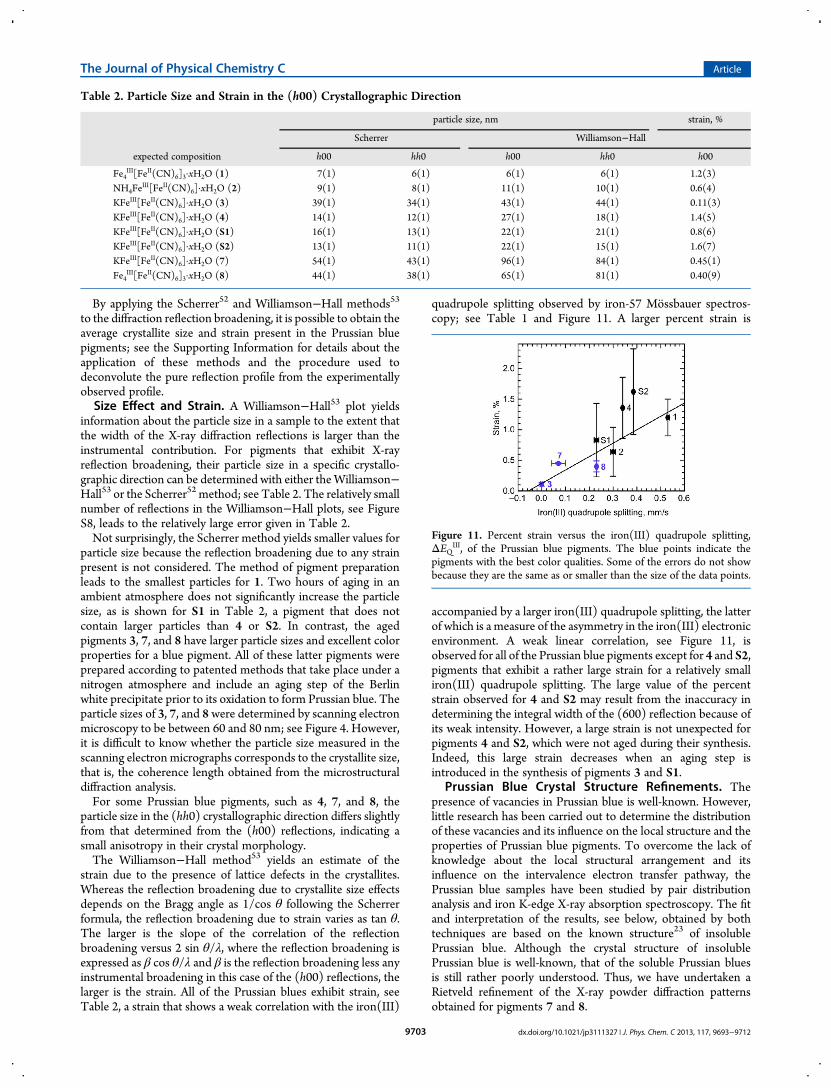
By applying the Scherrer52 and Williamson−Hall methods53to the diffraction reflection broadening, it is possible to obtain theaverage crystallite size and strain present in the Prussian bluepigments; see the Supporting Information for details about theapplication of these methods and the procedure used todeconvolute the pure reflection profile from the experimentallyobserved profile.Size Effect and Strain. A Williamson−Hall53 plot yields
information about the particle size in a sample to the extent thatthe width of the X-ray diffraction reflections is larger than theinstrumental contribution. For pigments that exhibit X-rayreflection broadening, their particle size in a specific crystallo-graphic direction can be determined with either theWilliamson−Hall53 or the Scherrer52 method; see Table 2. The relatively smallnumber of reflections in the Williamson−Hall plots, see FigureS8, leads to the relatively large error given in Table 2.Not surprisingly, the Scherrer method yields smaller values for
particle size because the reflection broadening due to any strainpresent is not considered. The method of pigment preparationleads to the smallest particles for 1. Two hours of aging in anambient atmosphere does not significantly increase the particlesize, as is shown for S1 in Table 2, a pigment that does notcontain larger particles than 4 or S2. In contrast, the agedpigments 3, 7, and 8 have larger particle sizes and excellent colorproperties for a blue pigment. All of these latter pigments wereprepared according to patented methods that take place under anitrogen atmosphere and include an aging step of the Berlinwhite precipitate prior to its oxidation to form Prussian blue. Theparticle sizes of 3, 7, and 8 were determined by scanning electronmicroscopy to be between 60 and 80 nm; see Figure 4. However,it is difficult to know whether the particle size measured in thescanning electron micrographs corresponds to the crystallite size,that is, the coherence length obtained from the microstructuraldiffraction analysis.For some Prussian blue pigments, such as 4, 7, and 8, the
particle size in the (hh0) crystallographic direction differs slightlyfrom that determined from the (h00) reflections, indicating asmall anisotropy in their crystal morphology.The Williamson−Hall method53 yields an estimate of the
strain due to the presence of lattice defects in the crystallites.Whereas the reflection broadening due to crystallite size effectsdepends on the Bragg angle as 1/cos θ following the Scherrerformula, the reflection broadening due to strain varies as tan θ.The larger is the slope of the correlation of the reflectionbroadening versus 2 sin θ/λ, where the reflection broadening isexpressed as β cos θ/λ and β is the reflection broadening less anyinstrumental broadening in this case of the (h00) reflections, thelarger is the strain. All of the Prussian blues exhibit strain, seeTable 2, a strain that shows a weak correlation with the iron(III)
quadrupole splitting observed by iron-57 Mossbauer spectros-copy; see Table 1 and Figure 11. A larger percent strain is
accompanied by a larger iron(III) quadrupole splitting, the latterof which is a measure of the asymmetry in the iron(III) electronicenvironment. A weak linear correlation, see Figure 11, isobserved for all of the Prussian blue pigments except for 4 and S2,pigments that exhibit a rather large strain for a relatively smalliron(III) quadrupole splitting. The large value of the percentstrain observed for 4 and S2 may result from the inaccuracy indetermining the integral width of the (600) reflection because ofits weak intensity. However, a large strain is not unexpected forpigments 4 and S2, which were not aged during their synthesis.Indeed, this large strain decreases when an aging step isintroduced in the synthesis of pigments 3 and S1.
Prussian Blue Crystal Structure Refinements. Thepresence of vacancies in Prussian blue is well-known. However,little research has been carried out to determine the distributionof these vacancies and its influence on the local structure and theproperties of Prussian blue pigments. To overcome the lack ofknowledge about the local structural arrangement and itsinfluence on the intervalence electron transfer pathway, thePrussian blue samples have been studied by pair distributionanalysis and iron K-edge X-ray absorption spectroscopy. The fitand interpretation of the results, see below, obtained by bothtechniques are based on the known structure23 of insolublePrussian blue. Although the crystal structure of insolublePrussian blue is well-known, that of the soluble Prussian bluesis still rather poorly understood. Thus, we have undertaken aRietveld refinement of the X-ray powder diffraction patternsobtained for pigments 7 and 8.
Table 2. Particle Size and Strain in the (h00) Crystallographic Direction
particle size, nm strain, %
Scherrer Williamson−Hall
expected composition h00 hh0 h00 hh0 h00
Fe4III[FeII(CN)6]3·xH2O (1) 7(1) 6(1) 6(1) 6(1) 1.2(3)
NH4FeIII[FeII(CN)6]·xH2O (2) 9(1) 8(1) 11(1) 10(1) 0.6(4)
KFeIII[FeII(CN)6]·xH2O (3) 39(1) 34(1) 43(1) 44(1) 0.11(3)KFeIII[FeII(CN)6]·xH2O (4) 14(1) 12(1) 27(1) 18(1) 1.4(5)KFeIII[FeII(CN)6]·xH2O (S1) 16(1) 13(1) 22(1) 21(1) 0.8(6)KFeIII[FeII(CN)6]·xH2O (S2) 13(1) 11(1) 22(1) 15(1) 1.6(7)KFeIII[FeII(CN)6]·xH2O (7) 54(1) 43(1) 96(1) 84(1) 0.45(1)Fe4
III[FeII(CN)6]3·xH2O (8) 44(1) 38(1) 65(1) 81(1) 0.40(9)
Figure 11. Percent strain versus the iron(III) quadrupole splitting,ΔEQIII, of the Prussian blue pigments. The blue points indicate thepigments with the best color qualities. Some of the errors do not showbecause they are the same as or smaller than the size of the data points.
The Journal of Physical Chemistry C Article
dx.doi.org/10.1021/jp3111327 | J. Phys. Chem. C 2013, 117, 9693−97129703

A refinement of an X-ray powder diffraction pattern by theRietveld method54 typically requires a prior knowledge of thecomposition and a structural model for the sample understudy.The above compositional results have revealed that the Prussianblues under study are hydrated ferric ferrocyanide complexes,with a low impurity content; X-ray powder diffraction patternsalso confirm the presence of a single crystalline phase. In aRietveld refinement, the choice of the structural model is crucial,especially because the crystal structures of Prussian bluepigments are notoriously complex because of both their colloidalcharacter and the possible presence of lattice vacancies. Theaverage structure of an insoluble Prussian blue is generallydescribed with the Fm3m space group, where a quarter of the[FeII(CN)6]
4− sites are vacant and replaced by water molecules;see Figure S9.55 The water molecules in Prussian blue pigmentscan be either in the lattice vacancy and coordinated to iron(III),or hydrogen bonded to one of these coordinated watermolecules, or completely interstitial in a zeolitic-like position.Accordingly, the stoichiometry is FeIII4[Fe
II(CN)6]3·xH2O,where x is between 14 and 16, that is, with 6 coordinatedwater molecules and 8−10 hydrogen-bonded or zeolitic-likewater molecules.The Fm3m space group implies a statistically random
distribution of the vacancies in the lattice. However, in practice,in single crystals the [FeII(CN)6]
4− vacancies are often notrandomly distributed, and the X-ray diffraction pattern indicatesthat the structure belongs to the lower symmetry Pm3m spacegroup.23 In the cubic primitive model, Buser et al.23 introducedan occupancy parameter, p, that is the probability that the[FeII(CN)6]
4− site in the center of the unit cell is occupied; seeTable 3. When p is zero the structure is completely ordered, and
all occupancies are integral. A p value of 3/4 indicates that 1/4 ofthe [FeII(CN)6]
4− sites are vacant, the situation that correspondsto the cubic face-centered Fm3m model previously described.23
The structure of an insoluble Prussian blue pigment is nowwell established, and the model developed23,55 by Buser andHerren has been used as the initial model for the Rietveldrefinement of the structure of 8, a commercial insoluble Prussianblue pigment. By using the Pm3m space group and an occupancyparameter p, any possible nonrandom distribution of vacancies istaken into account.Regarding the structure of soluble Prussian blue, the model
developed15 by Keggin and Miles in 1936 is usually taken asviable. It consists of a perfect cubic FeII−CN−FeIII frameworkwith no vacancies. The alkali cations and the water molecules arelocalized in the center of the lattice cavities, at zeolitic-likepositions. Recently, this model for soluble potassium cationcontaining Prussian blue has been revisited16 by Bueno et al. whostudied electrochemically synthesized potassium cation contain-ing ferric ferrocyanide by X-ray synchrotron radiation powderdiffraction. They concluded that about 25% of the [FeII(CN)6]
4−
sites were vacant. Moreover, they unexpectedly claimed that thepotassium cations were part of the water crystalline substructureand occupied the 24e site in the Fm3m space group, with an xpositional parameter only slightly different from that of thecoordinated water. They proposed a new stoichiometry todescribe the structure, Fe3+4[Fe
2+(CN)6]3·[K+h·OH
−h·mH2O].
The charge balance is ensured by the presence of the appropriatenumber of OH− anions, which compensate the positive charge ofthe potassium cations.Rietveld refinements have been performed for the commercial
soluble 7, and insoluble 8, Prussian blue pigments; see Tables 4and 5 and Figure 12. Because the diffraction data previouslyshown in Figure 10 were inadequate for Rietveld analysis, high-energy X-ray powder diffraction patterns of 7 and 8 wererecorded. The primitive cubic model reported23 by Buser et al.with an occupancy parameter, p, was used as an initial structuralmodel for both the soluble and the insoluble samples. Thebackground was linearly interpolated. An isotropic Thomson−Cox−Hastings function was used to describe the reflectionprofiles. The instrumental profile was obtained from a LaB6pattern recorded in the same conditions. Refinement of theadditional sample broadening parameters yielded values ofparticle size and strain very close to those reported above fromScherrer and Williamson−Hall methods. To reduce correlationsbetween structural parameters, an overall isotropic atomicdisplacement parameter, common to all atoms, was refined.Individual isotropic atomic displacement parameters wereconstrained to zero for the iron cations and cyanide anions, tothe same refined value for all of the water oxygens on the 6e, 6f,and 12h sites, and to an independent value for the water oxygenson the 8g site. The total atomic displacement parameters
Table 3. Site Distribution and Occupancies in Fm3m andPm3m
Fm3m Pm3m
Wyckoff position occupancy Wyckoff position occupancy
4 FeIII 4a 1 1a 13c 1
3 FeII 4b 3/4 1b p3d 1 − p/3
18 C 24e 3/4 6e 1 − p/36f p12h 1 − p/3
18 N 24e 3/4 6e 1 − p/36f p12h 1 − p/3
6 O 24e 1/4 6e p/36f 1 − p12h p/3
8 O 8c 1 8g 1
Table 4. Lattice Parameter and Average Bond Distances
distance, Å Fe4III[FeII(CN)6]3·xH2O (8) Fe4
III[FeII(CN)6]3·15H2Oa Fe4
III[FeII(CN)6]3·15H2Ob KFeIII[FeII(CN)6]·xH2O (7) Fe4
III[FeII(CN)6]3·[Kh·OHh·mH2O]c
a 10.2178(1) 10.166(3) 10.155(4) 10.2059(1) 10.2058(1)
Fe(II)−C 1.830(4) 1.923(8) 1.92(1) 1.947(5) 1.86(6)
Fe(III)−N 2.096(2) 2.029(6) 2.01(1) 1.926(4) 2.00(7)
C−N 1.183(4) 1.131(6) 1.148 1.155(5) 1.17(4)
Fe(III)−O 2.297(10) 2.138(19) 1.96 2.568(15) 2.00(7)
aLattice parameter and average bond distances as reported in ref 23. bLattice parameter and average bond distances as reported in ref 55. cLatticeparameter and average bond distances as reported in ref 16.
The Journal of Physical Chemistry C Article
dx.doi.org/10.1021/jp3111327 | J. Phys. Chem. C 2013, 117, 9693−97129704

reported in Table 5 on a given site are obtained by summing theoverall and corresponding individual atomic displacementparameters. Moreover, soft constraints were used to limit theFe−O bond distances within the range reported in the literature.The Rietveld refinement for 8, see the lower portion of Figure
12, yields an occupancy parameter, p, of 0.61(1) for the iron(II)1b site, indicating that the central [FeII(CN)6]
4− site is vacantwith a 39% probability. The occupancy parameter is thus lowerthan expected in the Fm3m model, which is characterized by anoccupancy parameter of 3/4 = 0.75 that indicates a random
distribution of vacancies. Thus, sample 8 presents a rather highdegree of ordering of the [FeII(CN)6]
4− vacancies.The resulting lattice parameter and the bond distances
obtained for 8 are compared to those previously published16,23,55
in Table 4. More specifically, the lattice parameter of a =10.2178(1) Å obtained for 8 is significantly larger than the valuesof a = 10.166(3) and 10.155(4) Å reported23,55 earlier. Theatomic displacement parameter values of the oxygens areunusually large, but various attempts to constrain them tostandard values led to significantly worse refinements. Such largevalues may result from displacement disorder of the oxygens
Table 5. Crystal Structure of Two Prussian Blue Pigments in the Pm3m Space Groupa
insoluble pigment, 8, p = 0.61(1) soluble pigment, 7, p = 0.72(1)
FeIII4FeII3.00(2)(CN)18.0(1)·11.2(1)H2O K1.9(2)[Fe
III4Fe
II3.00(2)(CN)18.0(1)]·{7.0(2)H2O+1.9(2)OH}
site x occupancy U, Å2 x occupancy U, Å2
Fe(III) 1a 0 1 0.0096(1) 0 1 0.0113(1)3c 0 1 0.0096(1) 0 1 0.0113(1)
Fe(II) 1b 1/2 0.609(11) 0.0096(1) 1/2 0.736(11) 0.0113(1)3d 1/2 0.799(4) 0.0096(1) 1/2 0.755(4) 0.0113(1)
C 6e 0.3207(3) 0.7989(18) 0.0096(1) 0.2945(4) 0.7551(19) 0.0113(1)6f 0.3207(3) 0.6046(18) 0.0096(1) 0.2945(4) 0.7354(19) 0.0113(1)12h 0.1788(3) 0.7989(9) 0.0096(1) 0.1834(4) 0.7551(9) 0.0113(1)
N 6e 0.2074(2) 0.7989(18) 0.0096(1) 0.1887(3) 0.7551(19) 0.0113(1)6f 0.2074(2) 0.6046(18) 0.0096(1) 0.1887(3) 0.7353(19) 0.0113(1)12h 0.2971(2) 0.7989(9) 0.0096(1) 0.3113(3) 0.7551(9) 0.0113(1)
O 6e 0.2248(7) 0.2021(18) 0.225(8) 0.2478(11) 0.2451(19) 0.191(6)6f 0.2248(7) 0.3964(18) 0.225(8) 0.2478(11) 0.2649(19) 0.191(6)12h 0.2752(7) 0.2021(9) 0.225(8) 0.2714(11) 0.2450(9) 0.191(6)8g 0.2469(16) 0.649(5) 0.110(3) 0.23051 0.356(16) 0.035(3)
K 8g 0.23051 0.107(13) 0.070(8)8g 0.28715 0.129(10) 0.070(8)
aThe values given in parentheses are the estimated standard deviations. Their absence indicates that the parameter was constrained to the valuegiven.
Figure 12. Rietveld refinement of the high-resolution X-ray powder diffraction patterns of KFeIII[FeII(CN)6]·xH2O, 7, with Rp = 15.3%, Rwp = 15.5%, χ2
= 1.031, and RBragg = 3.87% (top) and Fe4III[FeII(CN)6]3·xH2O, 8, with Rp = 18.3%, Rwp = 19.6%, χ2 = 0.962, and RBragg = 5.03% (bottom).
The Journal of Physical Chemistry C Article
dx.doi.org/10.1021/jp3111327 | J. Phys. Chem. C 2013, 117, 9693−97129705
because of their different natures, such as in the OH− anion andin a water molecule, and their different environments, such as incoordination with an iron(III) ion or in a zeolitic-like position.This displacement disorder could also explain why some refinedbond distances such as Fe(III)−O are different from those givenin the literature.For pigment 8, the Rietveld refinement yields 11.2(1) oxygens,
of which six on the 6e, 6f, and 12h sites in the Pm3m space groupcorrespond to water bonded to the open iron(III) coordinationsites adjacent to the missing [FeII(CN)6]
4− anion. The remaining5.2(1) uncoordinated water molecules are on the 8g site in thePm3m space group, and either occupy zeolitic-like positions orare hydrogen bonded to the coordinated water. This 5.2(1) watercontent of 8.8 wt % is in relatively good agreement with the 7.7 wt% loss of four uncoordinated water molecules between roomtemperature and ca. 175 °C for 8 as determined bythermogravimetric analyses.The Rietveld refinement of soluble potassium cation
containing Prussian blue pigment 7 yields interesting results.First, our attempts to use the model proposed by Bueno et al.16
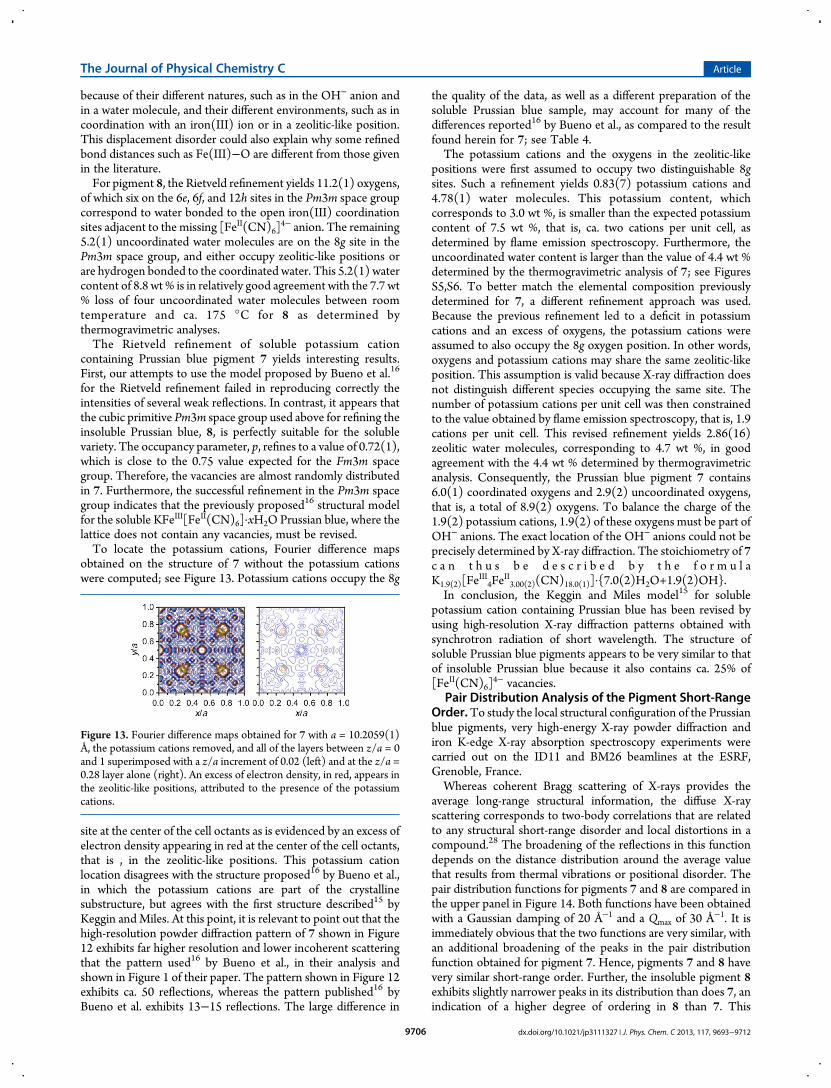
for the Rietveld refinement failed in reproducing correctly theintensities of several weak reflections. In contrast, it appears thatthe cubic primitive Pm3m space group used above for refining theinsoluble Prussian blue, 8, is perfectly suitable for the solublevariety. The occupancy parameter, p, refines to a value of 0.72(1),which is close to the 0.75 value expected for the Fm3m spacegroup. Therefore, the vacancies are almost randomly distributedin 7. Furthermore, the successful refinement in the Pm3m spacegroup indicates that the previously proposed16 structural modelfor the soluble KFeIII[FeII(CN)6]·xH2O Prussian blue, where thelattice does not contain any vacancies, must be revised.To locate the potassium cations, Fourier difference maps
obtained on the structure of 7 without the potassium cationswere computed; see Figure 13. Potassium cations occupy the 8g
site at the center of the cell octants as is evidenced by an excess ofelectron density appearing in red at the center of the cell octants,that is , in the zeolitic-like positions. This potassium cationlocation disagrees with the structure proposed16 by Bueno et al.,in which the potassium cations are part of the crystallinesubstructure, but agrees with the first structure described15 byKeggin andMiles. At this point, it is relevant to point out that thehigh-resolution powder diffraction pattern of 7 shown in Figure12 exhibits far higher resolution and lower incoherent scatteringthat the pattern used16 by Bueno et al., in their analysis andshown in Figure 1 of their paper. The pattern shown in Figure 12exhibits ca. 50 reflections, whereas the pattern published16 byBueno et al. exhibits 13−15 reflections. The large difference in
the quality of the data, as well as a different preparation of thesoluble Prussian blue sample, may account for many of thedifferences reported16 by Bueno et al., as compared to the resultfound herein for 7; see Table 4.The potassium cations and the oxygens in the zeolitic-like
positions were first assumed to occupy two distinguishable 8gsites. Such a refinement yields 0.83(7) potassium cations and4.78(1) water molecules. This potassium content, whichcorresponds to 3.0 wt %, is smaller than the expected potassiumcontent of 7.5 wt %, that is, ca. two cations per unit cell, asdetermined by flame emission spectroscopy. Furthermore, theuncoordinated water content is larger than the value of 4.4 wt %determined by the thermogravimetric analysis of 7; see FiguresS5,S6. To better match the elemental composition previouslydetermined for 7, a different refinement approach was used.Because the previous refinement led to a deficit in potassiumcations and an excess of oxygens, the potassium cations wereassumed to also occupy the 8g oxygen position. In other words,oxygens and potassium cations may share the same zeolitic-likeposition. This assumption is valid because X-ray diffraction doesnot distinguish different species occupying the same site. Thenumber of potassium cations per unit cell was then constrainedto the value obtained by flame emission spectroscopy, that is, 1.9cations per unit cell. This revised refinement yields 2.86(16)zeolitic water molecules, corresponding to 4.7 wt %, in goodagreement with the 4.4 wt % determined by thermogravimetricanalysis. Consequently, the Prussian blue pigment 7 contains6.0(1) coordinated oxygens and 2.9(2) uncoordinated oxygens,that is, a total of 8.9(2) oxygens. To balance the charge of the1.9(2) potassium cations, 1.9(2) of these oxygens must be part ofOH− anions. The exact location of the OH− anions could not beprecisely determined by X-ray diffraction. The stoichiometry of 7c a n t h u s b e d e s c r i b e d b y t h e f o r m u l aK1.9(2)[Fe
III4Fe
II3.00(2)(CN)18.0(1)]·{7.0(2)H2O+1.9(2)OH}.
In conclusion, the Keggin and Miles model15 for solublepotassium cation containing Prussian blue has been revised byusing high-resolution X-ray diffraction patterns obtained withsynchrotron radiation of short wavelength. The structure ofsoluble Prussian blue pigments appears to be very similar to thatof insoluble Prussian blue because it also contains ca. 25% of[FeII(CN)6]
4− vacancies.Pair Distribution Analysis of the Pigment Short-Range
Order.To study the local structural configuration of the Prussianblue pigments, very high-energy X-ray powder diffraction andiron K-edge X-ray absorption spectroscopy experiments werecarried out on the ID11 and BM26 beamlines at the ESRF,Grenoble, France.Whereas coherent Bragg scattering of X-rays provides the
average long-range structural information, the diffuse X-rayscattering corresponds to two-body correlations that are relatedto any structural short-range disorder and local distortions in acompound.28 The broadening of the reflections in this functiondepends on the distance distribution around the average valuethat results from thermal vibrations or positional disorder. Thepair distribution functions for pigments 7 and 8 are compared inthe upper panel in Figure 14. Both functions have been obtainedwith a Gaussian damping of 20 Å−1 and a Qmax of 30 Å−1. It isimmediately obvious that the two functions are very similar, withan additional broadening of the peaks in the pair distributionfunction obtained for pigment 7. Hence, pigments 7 and 8 havevery similar short-range order. Further, the insoluble pigment 8exhibits slightly narrower peaks in its distribution than does 7, anindication of a higher degree of ordering in 8 than 7. This
Figure 13. Fourier difference maps obtained for 7 with a = 10.2059(1)Å, the potassium cations removed, and all of the layers between z/a = 0and 1 superimposed with a z/a increment of 0.02 (left) and at the z/a =0.28 layer alone (right). An excess of electron density, in red, appears inthe zeolitic-like positions, attributed to the presence of the potassiumcations.
The Journal of Physical Chemistry C Article
dx.doi.org/10.1021/jp3111327 | J. Phys. Chem. C 2013, 117, 9693−97129706

narrower distribution is consistent with the occupancy, p =0.61(1) obtained for 8, determined by Rietveld refinement ascompared to the p = 0.72(1) obtained for 7.Finally, the pair distribution functions of both pigments were
fitted with the PDFGui software.30 The results of the pairdistribution analysis of soluble pigment 7 and insoluble pigment8 are shown in Figure 14, middle and lower panels. The quality ofa pair distribution refinement is given by two agreement factorssimilar to those used for a Rietveld refinement, Rw, and a reducedχ2, which is equivalent to the χ2 factor divided by the number ofdegrees of freedom.The effect of the experimental resolution on the pair
distribution function was determined by fitting the pairdistribution of a LaB6 standard recorded in the same conditions.This effect manifests itself by the decrease of peak amplitudes atlonger distances, as seen in the top panel of Figure 14. The pairdistribution was first fitted for 7 and 8, respectively, and then thesame model has been applied to pigments 3 and 4.As evidenced by the Rietveld refinement, insoluble pigment 8
crystallizes in the Pm3m space group with an occupancyparameter p of 0.61(1) for the 1b site, indicating a probability
of 39% of having the central [FeII(CN)6]4− site vacant. This
model is believed to be suitable to describe the long-rangeordering. In contrast, it fails to describe the local order on alength-scale shorter than or comparable to the lattice parameter;see the middle portion of Figure 14. The difficulty in refining thecrystal structure of Prussian blue pigments results from theinherent structural disorder arising from the presence ofvacancies, a disorder that is characteristic of all cubic polynucleartransition metal-cyanides complexes.12 As Herren et al.55
proposed, the structure of an insoluble Prussian blue pigment,that is, Fe4
III[FeII(CN)6]3·xH2O, 8, can be considered as a sum ofordered substructures containing zero to four [FeII(CN)6]
4−
vacancies, vacancies whose relative probabilities are given by abinomial distribution if the substructures are randomlydistributed.If the occupancy parameter, p, is 0.75, in the Pm3m space
group, as was proposed by Herren et al.53 in the Fm3m spacegroup, the probability of having in a given unit cell 0, 1, 2, 3, or 4vacant [FeII(CN)6]
4− sites, whose iron(II) ion positions are the1b and/or 3d crystallographic sites, is 31.6%, 42.2%, 21.1%, 4.7%,and 4%, respectively. In the above Rietveld refinements, therefined occupancy parameter, p, yields the probability of havingthe central iron(II) ion only on the 1b site. Hence, a p value of0.61 indicates that additional [FeII(CN)6]
4− vacancies occur onthe 3d positions with a p/3 of ca. 0.2 probability. In the bond-length range of one unit cell, the pair distribution function ofPrussian blue can be considered as the sum of the pairdistribution functions of unit cells containing 0, 1, 2, 3, or 4ordered vacancies, weighed by their respective probabilities.The pair distribution function for 8 was thus refined by
building a three “phase”model, with “phases” labeled A, B, and C,corresponding to “substructures” in which there are zero, one,and two [FeII(CN)6]
4− vacancies, respectively. The substruc-tures with three and four vacancies were neglected for simplicity,because of their small probability. The corresponding phases areshown in Figure S10. Cell parameters and linear atomiccorrelation factors were considered equal for the three structures,and their scale factors were refined. Constraints resulting fromthe space group symmetry Pm3m were applied to the atomicpositional parameters. Individual isotropic atomic displacementsparameters were refined for the iron ions and were constrained tobe the same in the Fe(II)−C and Fe(III)−N octahedra. Isotropicatomic displacement parameters were constrained to the samerefined value for all of the water oxygens on the 6e, 6f, and 12hsites, and to an independent value for the water oxygens on the 8gsite. Hydrogen atoms were not introduced. Because therefinement range was limited to one unit cell, all occupancyparameters were fixed to unity. This led to a total of 34independent refined parameters.The relative phase content can be determined by considering
both the scale factor and the atomic content of the unit cell. Itshould be noted that each contribution in the pair distributionfunction is weighed according to the product of the scattering
Figure 14. Pair distribution functions of pigments 7, red ○, and 8, blue○, obtained with a Gaussian damping of 20 Å−1 and aQmax of 30 Å
−1, toppanel. Refinement of the pair distribution function,G(r), for pigments 8,left, and 7, right, obtained with the average Pm3m structure andoccupancy, p, of 0.61 and 0.72, respectively, center panels, and with arandom distribution of three different substructures containing zero,one, and two vacancies, bottom panels.
Table 6. Lattice Parameters and Bond Distances Obtained from the Pair Distribution Analysis
pigment lattice parameter, a, Å Fe(II)−C distance,a Å Fe(III)−N distance,a Å C−N distance,a Å Fe(III)−O distance,a Å
KFeIII[FeII(CN)6]·xH2O (3) 10.17(1) 1.93(8) 2.01(6) 1.17(8) 2.3(2)KFeIII[FeII(CN)6]·xH2O (4) 10.16(1) 1.95(9) 1.94(8) 1.18(7) 2.2(1)KFeIII[FeII(CN)6]·xH2O (7) 10.18(1) 1.96(9) 1.99(6) 1.18(6) 2.3(2)Fe4
III[FeII(CN)6]3·xH2O (8) 10.17(1) 1.92(5) 2.04(4) 1.13(6) 2.5(1)
aThe values in parentheses correspond to the standard deviation of a given interatomic distance taken over the three substructures.
The Journal of Physical Chemistry C Article
dx.doi.org/10.1021/jp3111327 | J. Phys. Chem. C 2013, 117, 9693−97129707
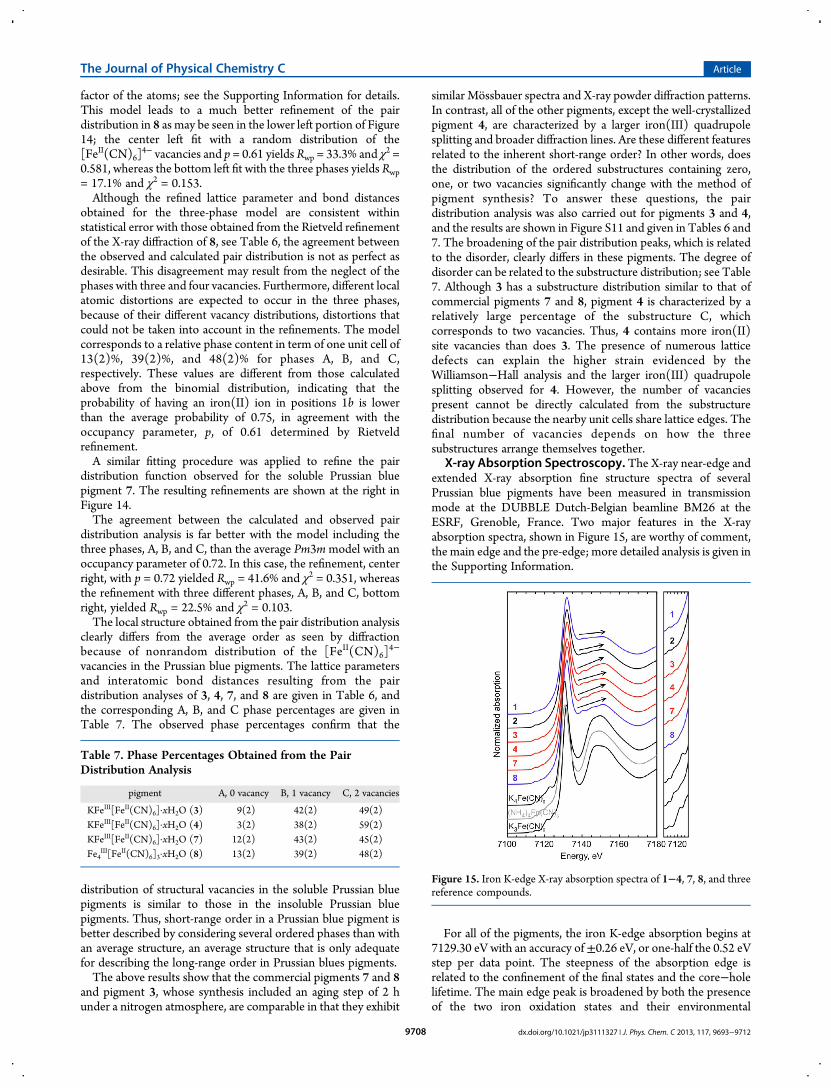
factor of the atoms; see the Supporting Information for details.This model leads to a much better refinement of the pairdistribution in 8 as may be seen in the lower left portion of Figure14; the center left fit with a random distribution of the[FeII(CN)6]
4− vacancies and p = 0.61 yields Rwp = 33.3% and χ2 =0.581, whereas the bottom left fit with the three phases yields Rwp= 17.1% and χ2 = 0.153.Although the refined lattice parameter and bond distances
obtained for the three-phase model are consistent withinstatistical error with those obtained from the Rietveld refinementof the X-ray diffraction of 8, see Table 6, the agreement betweenthe observed and calculated pair distribution is not as perfect asdesirable. This disagreement may result from the neglect of thephases with three and four vacancies. Furthermore, different localatomic distortions are expected to occur in the three phases,because of their different vacancy distributions, distortions thatcould not be taken into account in the refinements. The modelcorresponds to a relative phase content in term of one unit cell of13(2)%, 39(2)%, and 48(2)% for phases A, B, and C,respectively. These values are different from those calculatedabove from the binomial distribution, indicating that theprobability of having an iron(II) ion in positions 1b is lowerthan the average probability of 0.75, in agreement with theoccupancy parameter, p, of 0.61 determined by Rietveldrefinement.A similar fitting procedure was applied to refine the pair
distribution function observed for the soluble Prussian bluepigment 7. The resulting refinements are shown at the right inFigure 14.The agreement between the calculated and observed pair
distribution analysis is far better with the model including thethree phases, A, B, and C, than the average Pm3mmodel with anoccupancy parameter of 0.72. In this case, the refinement, centerright, with p = 0.72 yielded Rwp = 41.6% and χ2 = 0.351, whereasthe refinement with three different phases, A, B, and C, bottomright, yielded Rwp = 22.5% and χ2 = 0.103.The local structure obtained from the pair distribution analysis
clearly differs from the average order as seen by diffractionbecause of nonrandom distribution of the [FeII(CN)6]
4−
vacancies in the Prussian blue pigments. The lattice parametersand interatomic bond distances resulting from the pairdistribution analyses of 3, 4, 7, and 8 are given in Table 6, andthe corresponding A, B, and C phase percentages are given inTable 7. The observed phase percentages confirm that the
distribution of structural vacancies in the soluble Prussian bluepigments is similar to those in the insoluble Prussian bluepigments. Thus, short-range order in a Prussian blue pigment isbetter described by considering several ordered phases than withan average structure, an average structure that is only adequatefor describing the long-range order in Prussian blues pigments.The above results show that the commercial pigments 7 and 8
and pigment 3, whose synthesis included an aging step of 2 hunder a nitrogen atmosphere, are comparable in that they exhibit
similar Mossbauer spectra and X-ray powder diffraction patterns.In contrast, all of the other pigments, except the well-crystallizedpigment 4, are characterized by a larger iron(III) quadrupolesplitting and broader diffraction lines. Are these different featuresrelated to the inherent short-range order? In other words, doesthe distribution of the ordered substructures containing zero,one, or two vacancies significantly change with the method ofpigment synthesis? To answer these questions, the pairdistribution analysis was also carried out for pigments 3 and 4,and the results are shown in Figure S11 and given in Tables 6 and7. The broadening of the pair distribution peaks, which is relatedto the disorder, clearly differs in these pigments. The degree ofdisorder can be related to the substructure distribution; see Table7. Although 3 has a substructure distribution similar to that ofcommercial pigments 7 and 8, pigment 4 is characterized by arelatively large percentage of the substructure C, whichcorresponds to two vacancies. Thus, 4 contains more iron(II)site vacancies than does 3. The presence of numerous latticedefects can explain the higher strain evidenced by theWilliamson−Hall analysis and the larger iron(III) quadrupolesplitting observed for 4. However, the number of vacanciespresent cannot be directly calculated from the substructuredistribution because the nearby unit cells share lattice edges. Thefinal number of vacancies depends on how the threesubstructures arrange themselves together.
X-ray Absorption Spectroscopy. The X-ray near-edge andextended X-ray absorption fine structure spectra of severalPrussian blue pigments have been measured in transmissionmode at the DUBBLE Dutch-Belgian beamline BM26 at theESRF, Grenoble, France. Two major features in the X-rayabsorption spectra, shown in Figure 15, are worthy of comment,the main edge and the pre-edge; more detailed analysis is given inthe Supporting Information.
For all of the pigments, the iron K-edge absorption begins at7129.30 eV with an accuracy of±0.26 eV, or one-half the 0.52 eVstep per data point. The steepness of the absorption edge isrelated to the confinement of the final states and the core−holelifetime. The main edge peak is broadened by both the presenceof the two iron oxidation states and their environmental
Table 7. Phase Percentages Obtained from the PairDistribution Analysis
pigment A, 0 vacancy B, 1 vacancy C, 2 vacancies
KFeIII[FeII(CN)6]·xH2O (3) 9(2) 42(2) 49(2)KFeIII[FeII(CN)6]·xH2O (4) 3(2) 38(2) 59(2)KFeIII[FeII(CN)6]·xH2O (7) 12(2) 43(2) 45(2)Fe4
III[FeII(CN)6]3·xH2O (8) 13(2) 39(2) 48(2)
Figure 15. Iron K-edge X-ray absorption spectra of 1−4, 7, 8, and threereference compounds.
The Journal of Physical Chemistry C Article
dx.doi.org/10.1021/jp3111327 | J. Phys. Chem. C 2013, 117, 9693−97129708

vacancies. It is worth noting that the contributions of the iron(II)and iron(III) ions to the main edge peak cannot be separated.The pre-edge is the typically weak absorption found just below
the energy of the K-edge. These transitions are related to thelocal site symmetry and iron electronic configuration56 andinvolve linear combinations of molecular orbitals of specificsymmetry. Strong pre-edge absorptions are associated with abreaking of the inversion symmetry, and, in the case ofcentrosymmetric molecules, such as in Prussian blue pigments,the pre-edge absorptions are very weak and result rather fromquadrupole transitions.56
The X-ray absorption near-edge spectra of all of the Prussianblue pigments studied herein are rather similar, and there is nosignificant difference between the soluble and insoluble Prussianblues. The different feature that should be noted is the slope,indicated by the arrows in Figure 15 of the absorption just abovethe main iron K-edge absorption. This feature may be related to aspecific vacancy distribution, as evidenced by the pairdistribution analysis. Some authors have explained this featurein terms of a distorted FeII−C−N−-FeIII−N−C−FeII arrange-ment and its deviation from linearity.57
Both soluble and insoluble Prussian blues exhibit similarextended X-ray absorption spectra in k-space and in R-space; thespectra for soluble pigment 7 are shown in Figure 16 and are
similar to those previously published58 for a soluble commercialpigment. This similarity suggests that the incorporation of alkalications does not appear to significantly modify the coordinationenvironment of the iron ions and supports the revised structuralmodel for soluble Prussian blue pigments proposed herein.Bond distances, coordination numbers, Debye−Waller factors,
and inner potential corrections obtained by fitting the X-rayabsorption spectra of 1−4, 7, and 8 are reported in Table S5. Theinitial fitting model has been described elsewhere;14 the Debye−Waller factors, σ2, and the inner potentials, E0, are reportedrelative to those of K4Fe(CN)6, used as a reference compound,and thus are reported as Δσ2 andΔE0. No significant differencesin the X-ray absorption spectra of the insoluble and solublepigments were observed, and the same model over a k-range ofca. 5.3−13.9 Å−1 was used; a virtually perfect fit for soluble
pigment 7 is shown in Figure 16 and is representative of all of thefits.The definition of the coordination number, N, in the fitting
model of the extended X-ray absorption spectra differs from thatof the usual coordination number. Because the two iron(II) andiron(III) ions are not differentiated by this technique, only theaverage iron ionic environment is probed. In one perfect cubicunit cell of either the soluble, 7, or the insoluble, 8, Prussian bluepigments, the iron(II) ions have six carbon, six nitrogen, and sixiron(III) neighbors in their first, second, and third shells,respectively. Similarly, the iron(III) ions have six nitrogen, sixcarbon, and six iron(II) neighbors in their first, second, and thirdshells, respectively. Hence, the average coordination environ-ment of one iron ion is composed of three carbon and threenitrogen, three nitrogen and three carbon, and six iron(II/III)neighbors, in the first, second, and third shells, respectively.Although all of the Prussian blue pigments exhibit very similar
bond distances, the pigments exhibit significantly differentrefined coordination numbers, N, especially in the iron(II)−iron(III) coordination number; see Figure 17. As expected for a
perfect cubic unit cell, pigments 3, 7, and 8 all have an iron(II)−iron(III) coordination number of ca. 6; this similarity is expectedbecause the preparation of 3 was based on the synthesis ofPrussian blue described in patents and includes an aging time ofthe Berlin white precipitate under nitrogen as is the case for 7 and8. The remaining pigments were synthesized either in ambientatmosphere or without any aging and have smaller iron(II)−iron(III) coordination numbers. This reduction is undoubtedlycorrelated with the presence of vacancies in the lattice with somelocal order, as previously observed in the above pair distributionanalysis.
Raman Spectral Analysis. The Raman spectra of pigments3, 4, 7, and 8, and potassium ferrocyanide, K4Fe(CN)6·3H2O,and potassium ferricyanide, K3Fe(CN)6, are shown in Figure 18.Because these samples are all cyanides, they all exhibit59 sharpCN− stretching scattering, ν(CN), between 2000 and 2200 cm−1.In aqueous solution, the ν(CN) stretching mode for free CN−
anion occurs at 2080 cm−1; ν(CN) is observed to increase uponcoordination to a metal cation. For example, the ν(CN) bandsare at 2135 and 2130 cm−1 in K3Fe
III(CN)6 and at 2082 and 2066cm−1 in K4Fe
II(CN)6·3H2O. The difference results because ofthe differences in the iron oxidation state; the higher is the ironoxidation state, the more effective is the iron cation to CN− σ-bonding.The Prussian blue pigments, potassium ferrocyanide, and
ferricyanide all crystallize such that many or most of the ironcations experience a local Oh point group symmetry and thushave a local center of symmetry and the two ν(CN) stretchingmodes are assigned to the A1g and Eg vibrations; only the F1umode is infrared active, as is stated by the mutual exclusion rule.
Figure 16. Iron K-edge χ(k)·k2 and FT[χ(k)·k2] spectra withΔk≈ 5.3−13.9 Å−1 and ΔR = 1.0−5.2 Å for soluble pigment 7. The experimentaldata, solid line, and the fit, dotted line, agree well.
Figure 17. Iron(II)−iron(III) coordination number, N, for Prussianblue pigments.
The Journal of Physical Chemistry C Article
dx.doi.org/10.1021/jp3111327 | J. Phys. Chem. C 2013, 117, 9693−97129709

Recent studies60,61 of the vibrational spectra of the cyanide ligandin Prussian blue analogues indicate that the totally symmetric A1gRaman mode often has both higher energy and intensity.The Prussian blue pigment Raman scattering in the low-
frequency spectral region corresponds to the stretching andbending modes, ν(Fe−C) at 600−350 cm−1, δ(Fe−C−N) at500−350 cm−1, and δ (C−Fe−C) at 130−60 cm−1.59,62
However, the assignment of each specific low-frequency bandhas not been reported in the literature.To a first approximation, all of the Raman spectra appear to be
very similar, see Figure 18, and there does not seem to be anycharacteristic feature that is correlated with the Prussian bluepreparation. By taking into account the experimental errorestimated to be ±2 cm−1, the positions of the A1g mode at 2154cm−1 and the Eg mode at 2090 cm−1 are all identical and agreewith previously reported results.59,62 It is noteworthy that theν(CN) scattering is broader in the pigments than in the highlycrystalline K3Fe
III(CN)6 and K4FeII(CN)6·3H2O. The broad-
ening of the scattering varies slightly in the pigments. Forexample, 4, which has been prepared with no aging of the Berlinwhite precipitate, exhibits broader scattering and a less well-resolved Eg mode. This may be due to poor crystallinity and localdisorder in 4 as is evidenced above.
■ DISCUSSION AND CONCLUSIONSThe objective in this investigation has been the identification ofthe various compositional, structural, and spectral properties ofPrussian blue pigments that vary with their method of synthesis.The longer term goal of the investigation is to use this newlyacquired knowledge to better understand how the color of bothmodern and ancient Prussian blue pigments changes with timeand light exposure and how to better conserve painting andrelated cultural objects that contain Prussian blue pigments.From the thorough characterization of the modern Prussian
blue pigments studied herein, two major features appear to bestrongly dependent on the preparative method of the pigments,the particle size and the local disorder. Both features stronglyinfluence the color of the pigment. As a result, well-crystallizedPrussian blues, with cubic crystals of ca. 5 μm length, cannot beconsidered as artist’s pigments because they are so poorlycolored. Commercial Prussian blues pigments and pigments thatwere prepared according to an indirect method under a nitrogenatmosphere and with an aging of the Berlin white precipitateexhibit larger pigment particles of ca. 50−80 nm size than do theremaining pigments, which consist of particles smaller than 15nm. The particle size in the pigments has been directly
determined by scanning electron microscopy, and the crystallitesize, that is, the coherence length, has been indirectly derivedfrom the reflection broadening in the X-ray powder diffractionpatterns. Although the primary particle size does not necessarilycorrespond to the crystallite size, both crystallites and particlesseem to have similar dimensions in the pigments studied.The Berlin white aging step and the atmosphere during aging
have been identified as the most significant factors that affect theparticle size. It is well-known that an aging step can help apigment to tend toward or to reach a longer-term stability.Thermodynamic stability implies a minimization of the surfacearea of the precipitate. Therefore, an aging of colloidalsuspension, as is observed herein, usually tends to increase theparticle size and stability.63 As is evidenced by X-ray powderdiffraction, Prussian blue pigments that have been aged duringsynthesis are indeed more crystalline and exhibit sharperreflections. Crystal growth and aging time are thus directlycorrelated. However, the crystal growth is less significant whenthe aging step occurs in the ambient air atmosphere because theoxygen in air rapidly oxidizes the Berlin white precipitate intoPrussian blue and no further crystallite growth and stabilizationthen occurs.Results obtained by iron K-edge X-ray absorption spectros-
copy, pair distribution analysis, and iron-57 Mossbauer spec-troscopy indicate a local disorder in all of the Prussian bluepigments. This inherent structural disorder, which is representa-tive of the entire class of cubic polynuclear transition-metalcyanide complexes, is well-known.12 This is the reason thestructures of Prussian blues and related transition-metal cyanidesare usually approximated by the Fm3m space group. However,the Rietveld refinement of X-ray powder diffraction resultsalways using a cubic primitive Pm3m model, as has been clearlydemonstrated herein, permits an evaluation of the degree ofordering bymeans of the occupancy parameter, p, in both solubleand insoluble Prussian blues. The soluble potassium cationcontaining Prussian blue structure has been revisited, and it canbe described with the Pm3m space group where approximatelyone-quarter of the [Fe(CN)6]
4− anion sites are vacant. Thestructural similarity between the insoluble and soluble Prussianblues may explain why the iron-57 Mossbauer spectra and theiron K-edge absorption spectra of both insoluble and solublePrussian blue are so similar.The local short-range disorder observed in Prussian blue
pigments by pair distribution analysis can be quantified byconsidering three different ordered substructures. The proba-bility of having a unit cell containing more than one vacancyincreases for the poorly crystallized Prussian blue pigments. As aresult, the number of FeII−CN−FeIII pathways is decreasing, asrevealed by iron K-edge X-ray absorption studies. Consequently,highly disordered Prussian blue pigments are less intensely bluebecause the probability of intervalent electron transfer isweakened. Because the small particle size results from a rapidcrystallization, the presence of additional defects in the lattice isalso expected.In conclusion, the preparation methods of Prussian blue
determine the permanence of Prussian blue in paint layers. If notprepared to optimize particle size, the pigment will contain smallparticles that will tend to fade more rapidly upon light exposurethan larger particles because of their increased surface area.18
Further, the presence of [Fe(CN)6]4− vacancies in the Prussian
blue pigment is also expected to play a key role in the degradationmechanism in paint layers because of increased interaction
Figure 18. Raman spectra of selected Prussian blue pigments. Eachspectrum has been normalized to the intensity of the ν(CN) scattering.
The Journal of Physical Chemistry C Article
dx.doi.org/10.1021/jp3111327 | J. Phys. Chem. C 2013, 117, 9693−97129710
between the medium and the admixed pigment, as was recentlyreported.20
■ ASSOCIATED CONTENT*S Supporting InformationSynthetic information, spectral reflectance and absorbance ofpaint layers containing Prussian blue and titanium white, opticalphotomicrograph of a Prussian blue pigment, iron-57Mossbauerspectral results on various Prussian blue pigments, thermogravi-metric and differential scanning calorimetry of several Prussianblue pigments, experimental information and results of particleinduced X-ray emission spectral analysis, background informa-tion and application of the Scherrer and Williamson−Hallmethods to Prussian blue pigments, extraction and fittingprocedure for the pair distribution analysis of the pigment short-range order, and detailed results of the X-ray near-edgeabsorption spectral analysis. This material is available free ofcharge via the Internet at http://pubs.acs.org.
■ AUTHOR INFORMATIONCorresponding Author*Tel.: +32 4 3663696. Fax: +32 4 3662884. E-mail: [email protected] Address⊥Department of Materials and Environmental Chemistry,Stockholm University, Svante Arrhenius vag 16C, SE-106 91Stockholm, Sweden.NotesThe authors declare no competing financial interest.
■ ACKNOWLEDGMENTSWe thank Drs. Geert Silversmit and Bart Vekemans for their helpwith the measurements on BM26, Drs. Raphael Hermann andMoulay T. Sougrati for help in measuring some of theMossbauerspectra, and Dr. Frederic Hatert for help in recording the X-raypowder diffraction patterns. We also thank Prof. Bernard Gilbertfor his support for Raman spectroscopy measurements. Wegratefully acknowledge the Fonds National de la RechercheScientifique of Belgium for financial support through grants9.456595, 1.5.064.05, and FC 78482, SOLEIL for provision ofsynchrotron radiation facilities, and the ESRF for granting beamtime on ID11 and BM26 (proposals EC 763 and 26-01-875).
■ REFERENCES(1) Neff, V. D. Electrochemical Oxidation and Reduction of ThinFilms of Prussian Blue. J. Electrochem. Soc. 1978, 125, 886−887.(2) Mortimer, R. J. Electrochromic Materials. Annu. Rev. Mater. Res.1997, 41, 147−156.(3) De Tacconi, N. R.; Rajeshwar, K.; Lezna, R. O. MetalHexacyanoferrates: Electrosynthesis, in Situ Characterization, andApplications. Chem. Mater. 2003, 15, 3046−3062.(4) Verdaguer, M.; Bleuzen, A.; Marvaud, V.; Vaissermann, J.;Seuleiman, M.; Desplanches, C.; Scuiller, A.; Train, C.; Garde, R.;Gelly, G.; et al. Molecules to Build Solids: High TC Molecule-basedMagnets by Design and Recent Revival of Cyano Complexes Chemistry.Coord. Chem. Rev. 1999, 190−192, 1023−1047.(5) Ito, A.; Suenaga, M.; Ono, K. Mossbauer Study of Soluble PrussianBlue, Insoluble Prussian Blue, and Turnbull’s Blue. J. Chem. Phys. 1968,48, 3597−3599.(6) Faustino, P. J.; Yang, Y.; Progar, J. J.; Brownell, C. R.; Sadrieh, N.;May, J. C.; Leutzinger, E.; Place, D. A.; Duffy, E. P.; Houn, F.; et al.Quantitative Determination of Cesium Binding to Ferric Hexacyano-ferrate: Prussian Blue. J. Pharm. Anal. 2008, 47, 114−25.
(7) Pyrasch, M.; Toutianoush, A.; Jin, W.; Schnepf, J.; Tieke, B. Self-assembled Films of Prussian Blue and Analogues: Optical andElectrochemical Properties and Application as Ion-sieving Membranes.Chem. Mater. 2003, 15, 245−254.(8) Xidis, A.; Neff, V. D. On the Electronic Conduction in Dry ThinFilms of Prussian Blue, Prussian Yellow, and Everitt’s Salt. J. Electrochem.Soc. 1991, 138, 3637−3642.(9) Wojdel, J. C.; Bromley, S. T. Band Gap Variation in Prussian Bluevia Cation-Induced Structural Distortion. J. Phys. Chem. B 2006, 110,24294−24298.(10) Robin,M. B. The Color and Electronic Configurations of PrussianBlue. Inorg. Chem. 1962, 1, 337−342.(11) Chadwick, B. M.; Sharpe, A. G. Transition Metal Cyanides andTheir Complexes. In Advances in Inorganic Chemistry and Radio-chemistry; Emeleus, H. J., Sharpe, A. G., Eds.; Academic Press: New Yorkand London, 1966; Vol. 8, p 83.(12) Ludi, A. InMixed-Valence Compounds: Theory and Applications inChemistry, Physics, Geology, and Biology; Brown, D. B., Ed.; Springer:New York, 1979; Vol. 58, p 25.(13) Kirby, J.; Saunders, D. Fading and Colour Change of PrussianBlue: Methods of Manufacture and the Influence of Extenders. Natl.Gallery Technical Bull. 2004, 25, 73−99.(14) Samain, L.; Silversmit, G.; Sanyova, J.; Vekemans, B.; Salomon,H.; Gilbert, B.; Grandjean, F.; Long, G. J.; Hermann, R. P.; Vincze, L.;et al. Fading of Modern Prussian Blue Pigments in Linseed Oil Medium.J. Anal. At. Spectrom. 2011, 26, 930−941. Typographical errors occurredin Table 3 of this reference. All iron(II) isomer shifts are negative.(15) Keggin, J. F.; Miles, F. D. Structures and Formulae of the PrussianBlues and Related Compounds. Nature 1936, 137, 577−578.(16) Bueno, P. R.; Ferreira, F. F.; Gimenez-Romero, D.; Oliveira Setti,G.; Faria, R. C.; Gabrielli, C.; Perrot, H.; Garcia-Jareno, J. J.; Vicente, F.Synchrotron Structural Characterization of Electrochemically Synthe-sized Hexacyanoferrates Containing K+: A Revisited Analysis ofElectrochemical Redox. J. Phys. Chem. C 2008, 112, 13264−13271.(17) Woodward, J. Praeparation Caerulei Prussiaci ex Germania Missaad Johannem Woodward. Philos. Trans. R. Soc., A 1724, XXXIII, 15.(18) Samain, L.; Grandjean, F.; Long, G. J.; Martinetto, P.; Bordet, P.;Sanyova, J.; Strivay, D. Synthesis and Fading of Eighteenth-centuryPrussian Blue Pigments: a Combined Study by Spectroscopic andDiffractive Techniques using Laboratory and Synchrotron RadiationSources. J. Synchrotron Rad. 2013, 20, 460−473.(19) Krafft, S. Pour l’emploi d’une nouvelle substance propre a fabriquer le bleu de Prusse. Description des machines et procedes pourlesquels des brevets d’invention ont ete pris sous le regime de la loi du 5 juillet1844; Paris, 1854; Vol. 17, pp 159−160.(20) Samain, L.; Gilbert, B.; Grandjean, F.; Long, G. J.; Strivay, D.Redox Reactions in Prussian Blue Containing Paint Layers as a Result ofLight Exposure. J. Anal. At. Spectrom. 2013, 28, 524−535.(21) Maer, K., Jr.; Beasley, M. L.; Collins, R. L.; Milligan, W. O.Structure of the Titanium-iron Cyanide Complexes. J. Am. Chem. Soc.1968, 90, 3201−3208.(22) Delamare, F. Bleus en Poudres, de l’Art a l’Industrie, 5000 Ansd’Innovations; Ecole des Mines de Paris: Paris, 2007; p 231.(23) Buser, H.; Schwarzenbach, D.; Petter, W.; Ludi, A. The CrystalStructure of Prussian Blue: Fe4[Fe(CN)6]3·xH2O. Inorg. Chem. 1977,16, 2704−2710.(24) Samain, L. DegradationMechanisms of Prussian Blue Pigments inPaint Layers. Ph.D. Thesis, University of Liege, March 2012.(25) Weber, G.; Martinot, L.; Strivay, D.; Garnir, H.-P.; George, P.Application of PIXE and PIGE under Variable Ion Beam Incident Angleto Several Fields of Archaeometry. X-Ray Spectrom. 2005, 34, 297−300.(26) Weatherstone, A.; Vormwald, M.; Boyd, N.; Campbell, I. TheGUPIXWIN Manual and User Guide; University of Guelph, 2000.(27) Hammersley, A. P.; Svensson, S. O.; Hanfland, M.; Fitch, A. N.;Hausermann, D. Two-dimensional Detector Software: From RealDetector to Idealised Image or Two-theta Scan. J. High Pressure Res.1996, 14, 235−248.
The Journal of Physical Chemistry C Article
dx.doi.org/10.1021/jp3111327 | J. Phys. Chem. C 2013, 117, 9693−97129711

(28) Proffen, T.; Billinge, S. J. L. PDFFIT, a Program for Full ProfileStructural Refinement of the Atomic Pair Distribution Function. J. Appl.Crystallogr. 1999, 32, 572−575.(29) Qiu, X.; Thompson, J. W.; Billinge, S. J. L. PDFgetX2: a GUIDriven Program to Obtain the Pair Distribution Function from X-rayPowder Diffraction Data. J. Appl. Crystallogr. 2004, 37, 678−678.(30) Farrow, C. L.; Juhas, P.; Liu, J. W.; Bryndin, D.; Bozin, E. S.; Bloch,J.; Proffen, T.; Billinge, S. J. L. PDFfit2 and PDFgui: ComputerPrograms for Studying Nanostructure in Crystals. J. Phys.: Condens.Matter 2007, 19, 335219.(31) Rodriguez-Carvajal, J. Recent Advances in Magnetic StructureDetermination by Neutron Powder Diffraction. Physica B 1993, 192,55−69.(32) Silversmit, G.; Poelman, H.; Balcaen, V.; Heynderickx, P. M.;Olea, M.; Nikitenko, S.; Bras, W.; Smet, P. F.; Poelman, D.; De Gryse,R.; et al. In-situ XAS study on the Cu andCe Local Structural Changes ina CuO-CeO2/Al2O3 Catalyst under Propane Reduction and Re-oxidation. J. Phys. Chem. Solids 2009, 70, 1274−1284.(33) Vaarkamp, M.; Linders, J. C.; Koningsberger, D. C. A NewMethod for Parameterization of Phase Shift and BackscatteringAmplitude. Physica B 1995, 208−209, 159−160.(34) Vaarkamp, M.; Dring, I.; Oldman, R. J.; Stern, E. A.;Koningsberger, D. C. Comparison of Theoretical Methods for theCalculation of Extended X-ray-Absorption Fine Structure. Phys. Rev. B1994, 50, 7872−7883.(35) Cook, J. W., Jr.; Sayers, D. Criteria for Automatic X-rayAbsorption Fine Structure Background Removal. J. Appl. Phys. 1981, 52,5024−5031.(36) Koningsberger, D. C.; Mojet, B.; van Dorssen, G.; Ramaker, D.XAFS Spectroscopy; Fundamental Principle and Data Analysis. Top.Catal. 2000, 10, 143−145.(37) Ankudinov, A.; Ravel, B.; Rehr, J.; Conradson, S. Real-spacemultiple-scattering calculation and interpretation of X-ray-absorptionnear-edge structure. Phys. Rev. B 1998, 58, 7565−7576.(38) Oyarzun, J. M. Pigment Processing, Physico-chemical Principles;Vincentz Verlag: Hannover, 2000.(39) Buxbaum, G.; Pfaff, G. Industrial Inorganic Pigments, 3rd ed.;Wiley-VCH Verlag: Weinheim, 2005.(40) Rosseinsky, D. R.; Lim, H.; Jiang, H. J.; Chai, J. W. OpticalCharge-transfer in Iron(III) Hexacyanoferrate(II): Electro-intercalatedCations Induce Lattice-energy-dependent Ground-State Energies. Inorg.Chem. 2003, 42, 6015−6023.(41) Gratzfeld, E.; Clausen, E.; Reinhardt, H.; Schaefer, H. Iron BluePigment, Process for Making the Same and Use. U.S. Patent 4,378,995,April 5, 1983.(42) Kaye, S. S.; Long, J. R. The Role of Vacancies in the HydrogenStorage Properties of Prussian Blue Analogues. Catal. Today 2007, 120,311−316.(43) Kubelka, P.; Munk, F. Ein Beitrag zur Optik der Farbanstriche. Z.Tech. Phys. 1931, 12, 593−601.(44) Mie, G. Beitrage zur Optik truber Medien, Speziell KolloidalerMetallosungen. Ann. Phys. 1908, 330, 377−445.(45) Taft, W. S.; Mayer, J. W. The Science of Paintings; Springer: NewYork, 2000.(46)Wertheim, G. K.; Rosencwaig, A. Characterization of InequivalentIron Sites in Prussian Blue by Photoelectron Spectroscopy. J. Chem.Phys. 1971, 54, 3235−3237.(47) Fluck, E.; Inoue, H.; Yanagisawa, S. Mossbauer and X-rayPhotoelectron Spectroscopic Studies of Prussian Blue and its RelatedCompounds. Z. Anorg. Allg. Chem. 1977, 430, 241−249.(48) Grandjean, F.; Long, G. J.; Samain, L. The Pivotal Role ofMossbauer Spectroscopy in the Characterization of Prussian Blue andRelated Iron Cyanide Complexes. Mossbauer Effect Research Data J.2012, 35, 143−153.(49) Shenoy, G. K.; Wagner, F. E.; Kalvius, G. M. InMossbauer IsomerShifts; Shenoy, G. K., Wagner, F. E., Eds.; North-Holland: Amsterdam,1978; p 49.(50) Owen, T.; Grandjean, F.; Long, G. J.; Domasevitch, K. V.;Gerasimchuk, N. N. Synthesis and Characterization of Two Intensely
Colored Tris(benzoylcyanoxime)iron(II) Anionic Complexes. Inorg.Chem. 2008, 47, 8704−8713.(51)Ware, M. Prussian Blue: Artists’ Pigment and Chemists’ Sponge. J.Chem. Educ. 2008, 85, 612−620.(52) Guinebretiere, R. Diffraction des Rayons X sur EchantillonsPolycristallins, Instrumentation et Etude de la Microstructure; HermesScience and Lavoisier: Paris, 2006.(53) Williamson, G. K.; Hall, W. H. X-ray Line Broadening from FiledAluminium and Wolfram. Acta Metall. 1953, 1, 22−31.(54) Rietveld, H.M. Line Profiles of Neutron Powder-diffraction Peaksfor Structure Refinement. Acta Crystallogr. 1967, 22, 151−152.(55) Herren, F.; Fischer, P.; Ludi, A.; Haelg, W. Neutron DiffractionStudy of Prussian Blue, Fe4[Fe(CN)6]3·xH2O. Location of WaterMolecules and Long-range Magnetic Order. Inorg. Chem. 1980, 19,956−959.(56) Bunker, G. Introduction to XAFS, A Practical Guide to X-rayAbsorption Fine Structure Spectroscopy; Cambridge University Press:Cambridge, UK, 2010.(57) Kulesza, P. J.; Zamponi, S.; Berrettoni, M.; Marassi, R.; Malik, M.A. Preparation, Spectroscopic Characterization and ElectrochemicalCharging of the Sodium-containing Analogue of Prussian Blue.Electrochim. Acta 1995, 40, 681−688.(58) Glatzel, P.; Jacquamet, L.; Bergmann, U.; de Groot, M. F. M.;Cramer, S. P. Site-Selective EXAFS in Mixed-Valence CompoundsUsing High-Resolution Fluorescence Detection: A Study of Iron inPrussian Blue. Inorg. Chem. 2002, 41, 3121−3127.(59) Nakamoto, K. Infrared and Raman Spectra of Inorganic andCoordination Compounds; Wiley-Interscience Publication: New York,1978; p 178.(60) Kettle, S. F. A.; Aschero, G. L.; Diana, E.; Rossetti, R.; Stanghellini,P. L. The Vibrational Spectra of the Cyanide Ligand Revisited: TerminalCyanides. Inorg. Chem. 2006, 45, 4928−4937.(61) Kettle, S. F. A.; Diana, E.; Marchese, E. M. C.; Boccaleri, E.;Stanghellini, P. L. The Vibrational Spectra of the Cyanide LigandRevisited: the ν(CN) Infrared and Raman Spectroscopy of PrussianBlue and its Analogues. J. Raman Spectrosc. 2011, 42, 2006−2014.(62) Barsan, M. M.; Butler, I. S.; Fitzpatrick, J.; Gilson, D. F. R. High-pressure Studies of the Micro-Raman Spectra of Iron CyanideComplexes: Prussian Blue (Fe4[Fe(CN)6]3), Potassium Ferricyanide(K3[Fe(CN)6]) , and Sod ium Ni t roprus s ide (Na2[Fe -(CN)5(NO)]·2H2O). J. Raman Spectrosc. 2011, 42, 1820−1824.(63) Jolivet, J. P.; Henry, M.; Livage, J. Metal Oxide Chemistry andSynthesis: From Solution to Solid State; John Wiley & Sons: Chichester,2000; pp 39−40.
The Journal of Physical Chemistry C Article
dx.doi.org/10.1021/jp3111327 | J. Phys. Chem. C 2013, 117, 9693−97129712