reinforcement learning algorithms for automated stock trading
TRANSCRIPT

Advances in Dynamical Systems and Applications (ADSA).
ISSN 0973-5321, Volume 16, Number 2, (2021) pp. 1021-1032
© Research India Publications
https://www.ripublication.com/adsa.htm
Reinforcement Learning Algorithms for Automated
Stock Trading
Keerthi Sagiraju1, Prof M. Shashi2 1,2Department of CS&SE, Andhra University College of Engineering,
Visakhapatnam, India
Abstract
Stock trading methodologies undertakes the key role of being a basic part in
investment. In this paper, we propose procedure that utilizes deep
reinforcement plans through become familiar with stock trading system by
boosting investment return. We train reinforcement learning agent & acquire
trading methodology utilizing four reinforcement algorithms which are Deep Q-
learning (DQN), Deep Deterministic Policy Gradient (DDPG), Advantage
Actor Critic (A2C), & Proximal Policy Optimization (PPO). In order to get
accustomed to different market conditions, we use trading method to pick best
performing agent through trade dependent on Sharpe ratio. Sharpe ratio
calculates presentation of an investment's performance in comparison through
risk-free asset. It is defined as difference between investment's earnings & risk-
free return, divided by investment's standard deviation. Notable, it may be
utilized to assess complete presentation of total investment compared through
performance of an individual stock. Any Sharpe ratio more greater than 1.0 is
viewed as good trading indicator. Execution of these algorithms with the help
of better utilisation of benefits, has been evaluated and consequently, outcomes
& conclusions have been explained in this paper.
Keywords: Reinforcement Learning, Markov Decision Process, DQN, DDPG,
A2C, & Proximal Policy Optimization (PPO), Stock Trading.
1. INTRODUCTION
Algorithmic trading (also known as automated trading, black-box trading, or algo-
trading) [1] involves placing trade with assistance of computer programme that
follows set of instructions (an algorithm). deal, in principle, can generate profits
at rate & frequency that would be difficult for human trader through match.
Timing, price, quantity, or any mathematical model are used through define sets
of instructions. Apart from giving traders with profit chances, algo-trading makes
markets more liquid & trading more systematic by removing influence of human
emotions on trading [2].

1022 Keerthi Sagiraju, Prof M. Shashi
1.1 Algorithmic Trading in Practice [3]
Assume trader follows these simple trading guidelines:
Buy 50 shares of stock when its 50-day moving average crosses over its 200-
day moving average. (A moving average smooths out daily price fluctuations &
thereby identifies trends by averaging past data sets.)
Sell stock when its 50-day moving average falls below its 200-day moving
average.
Using these two simple commands, computer software will automatically monitor stock
price (and moving average indicators) & place buy & sell orders when predefined
requirements are met. Trader no longer has through enter orders manually or examine
live prices & graphs. Algorithmic trading system accurately detects trading opportunity
& does this automatically.
1.2 Benefits of Algorithmic Trading
The advantages of algo-trading [2] are as follows:
Trades are carried out at lowest possible cost and the process of placing trade order is
rapid & precise (there is high chance of execution at desired levels). To avoid
significant price changes, trades are processed on time & in real time and transaction
expenses are lower. Automated checks on multiple market circumstances at same time.
There is less chance of human error while placing transactions. To establish if
algorithmic trading is feasible trading method, it can be back-tested using historical &
real-time data. Reduced risk of human traders making mistakes due through emotional
& psychological variables.
1.3 Machine Learning:
Thanks for the new advancements in computing technology, machine learning today is
not the same as it was in the past. It was motivated by a pattern of recognition & notion
that computers may learn to perform the tasks without being instructed and in this
context, artificial intelligence researchers wanted to evaluate whether computers could
learn from data. Because, different models can evolve autonomously when they are
exposed to new data, and in this process machine learning's iterative feature is very
crucial. They make reliable, repeatable decisions & outcomes by using previous
computations. It is not new science, but it’s getting a new traction.
1.4 Supervised Learning:
When you're learning task under supervision, someone is watching through see if you're
getting it right. In supervised learning [7], having complete collection of labelled data
when training an algorithm is also required. Each event in training dataset is tagged
with response that algorithm should create on its own, which is referred through as
"completely labelled." For example, tagged collection of flower shots would inform
model which images were of roses, daisies, & daffodils. Model compares new image
through training samples through predict proper label.
Reinforcement Learning Algorithms for Automated Stock Trading 1023
1.5 Unsupervised Learning:
Datasets that are clean & fully labelled are hard to come by. And, on occasion,
researchers pose questions through algorithm for which they have no answers.
Unsupervised learning comes into play in this situation. In unsupervised learning, deep
learning model is given dataset with no explicit instructions on what to do with it [8].
Training dataset is made up of a collection of scenarios with no apparent desired
outcome or correct answer. Neural network attempts to automatically discover structure
in data by extracting relevant features & appraising data's structure.
1.6 Deep Reinforcement Learning:
Deep Reinforcement Learning (DRL) [9], an exceptionally quick field, is mix of
Reinforcement Learning & Deep Learning. It is additionally most moving sort of
Machine Learning since it can address wide scope of complex decision making tasks
that were already out of reach for machine through tackle true issues with human-like
knowledge. Today I'm beginning an arrangement about Deep Reinforcement Learning
that will carry theme nearer through reader. Intention is through survey field from
particular terms & languages through essential ideas & traditional calculations in this
area.
1.7 Reinforcement Learning:
Reinforcement Learning (RL) is a type of artificial intelligence (AI) that allows a robot
to learn in natural way by exploring & learning from its own actions & experiences.
Despite the fact that both supervised & reinforcement learning use planning between
information & output, unlike supervised learning, which uses rewards & discipline as
indicators of positive & negative behaviour, reinforcement learning does not use
rewards & discipline as indicators of positive & negative behaviour. Rewards &
discipline are used as indicators of positive & poor behaviour in reinforcement learning.
Reinforcement learning [9] has distinct set of aims than unsupervised learning.
Unsupervised learning's purpose is to detect similarities & differences between data
points; reinforcement learning's goal is to find an appropriate activity model that will
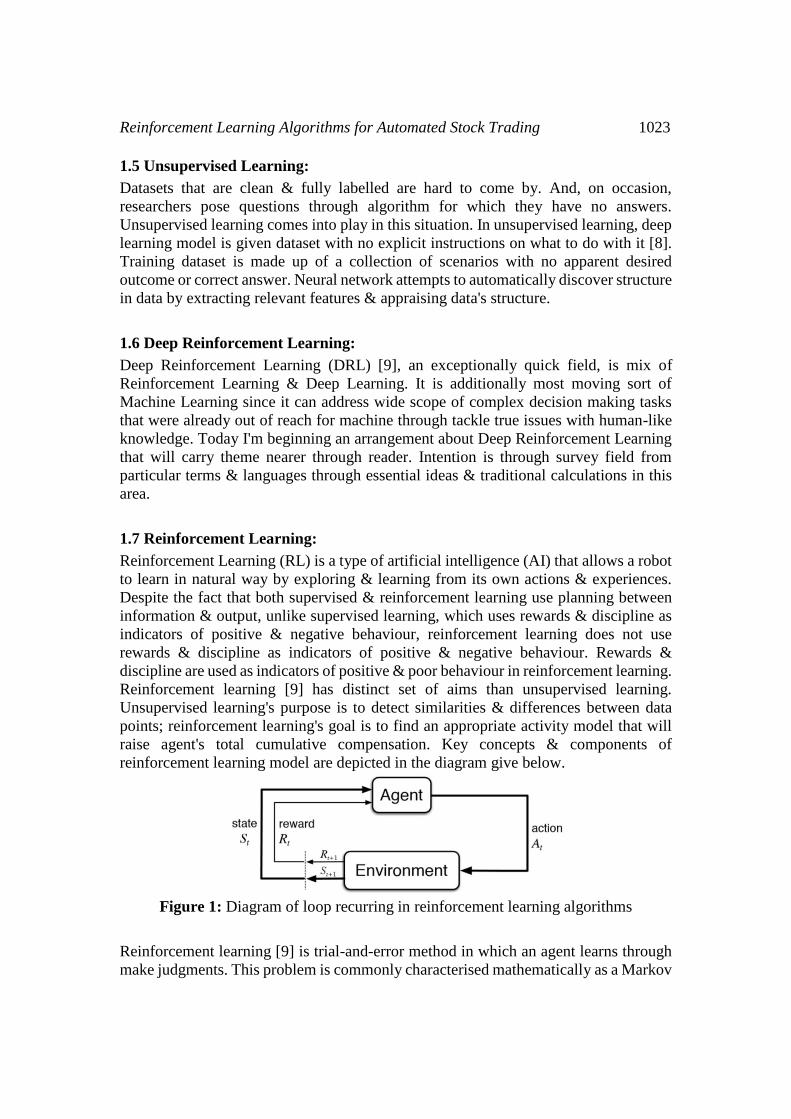
raise agent's total cumulative compensation. Key concepts & components of
reinforcement learning model are depicted in the diagram give below.
Figure 1: Diagram of loop recurring in reinforcement learning algorithms
Reinforcement learning [9] is trial-and-error method in which an agent learns through
make judgments. This problem is commonly characterised mathematically as a Markov
1024 Keerthi Sagiraju, Prof M. Shashi
decision process (MDP), in which an agent stays in the same state at each timestep,
takes action, receives a scalar reward, and then transitions to the next state based on the
dynamics of the environment. To maximise its profits, the agent seeks to learn a policy
or map from observations through actions (expected sum of rewards). Algorithm only
has access through dynamics through sampling in reinforcement learning (as opposed
through optimal control).
1.8 Effects of Covid-19:
The novel coronavirus (COVID-19) [4] is projected through becomes one of most
economically costly pandemics in recent history, as well as an unparalleled human &
health calamity. According through recent financial reports, COVID-19 pandemic is
wreaking havoc on world economy & financial markets. Since start of pandemic, many
equity markets throughout world have seen steep falls. through gain better
understanding of how new coronavirus epidemic affects stock markets [6].
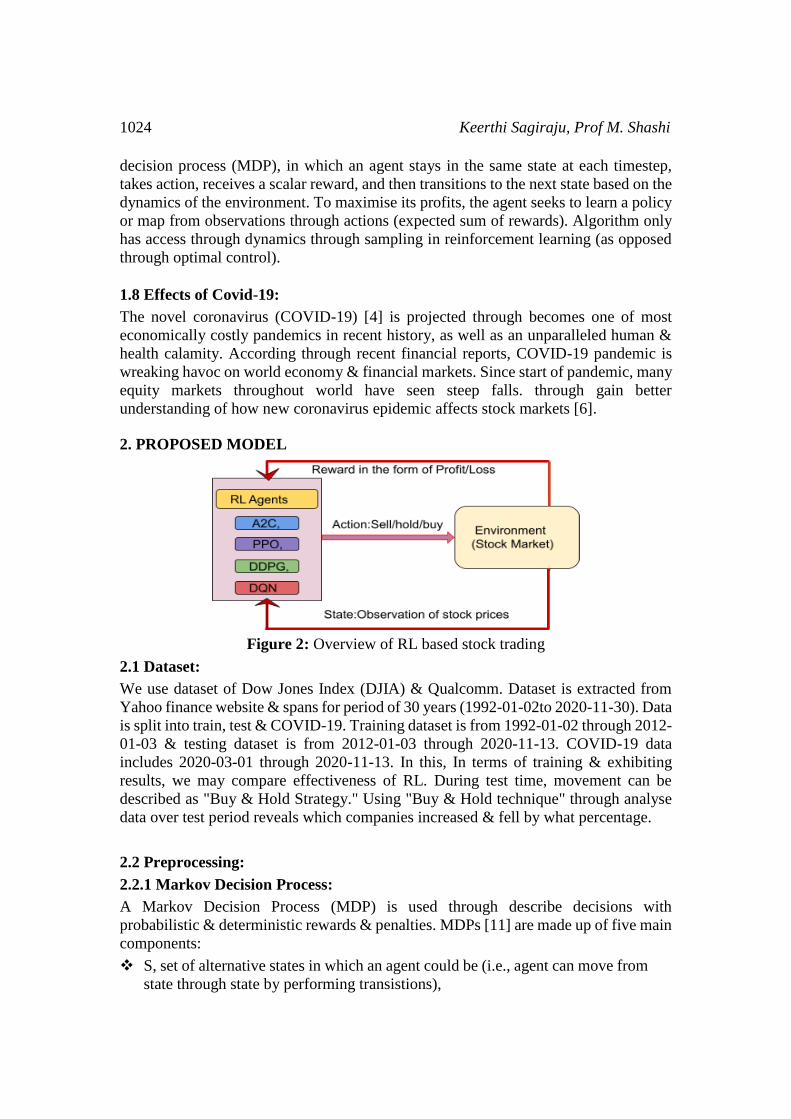
2. PROPOSED MODEL
Figure 2: Overview of RL based stock trading
2.1 Dataset:
We use dataset of Dow Jones Index (DJIA) & Qualcomm. Dataset is extracted from
Yahoo finance website & spans for period of 30 years (1992-01-02to 2020-11-30). Data
is split into train, test & COVID-19. Training dataset is from 1992-01-02 through 2012-
01-03 & testing dataset is from 2012-01-03 through 2020-11-13. COVID-19 data
includes 2020-03-01 through 2020-11-13. In this, In terms of training & exhibiting
results, we may compare effectiveness of RL. During test time, movement can be
described as "Buy & Hold Strategy." Using "Buy & Hold technique" through analyse
data over test period reveals which companies increased & fell by what percentage.
2.2 Preprocessing:
2.2.1 Markov Decision Process:
A Markov Decision Process (MDP) is used through describe decisions with
probabilistic & deterministic rewards & penalties. MDPs [11] are made up of five main
components:
S, set of alternative states in which an agent could be (i.e., agent can move from
state through state by performing transistions),
Reinforcement Learning Algorithms for Automated Stock Trading 1025
A, set of possible actions that an agent could take in given state (i.e. operations
that are performed by agent through move from current state through next state
with better reward),
The rewards for taking action at state S are R (i.e., outcome that occurs after
agent performs an action & move from one state through other ; it can be
positive or negative);
P denotes chances of transitioning through new state S' after taking action in
initial state S (i.e. it indicates possibility of making agent move among states
based on outcome level);
Gamma is parameter that determines how far Markov Decision Process agent
will search.
The Markov Property, which asserts that next state can be determined solely by current
state, must be followed by all Markov Processes, including MDPs.
The Bellman Equation calculates greatest reward that an agent can earn if they make
best option in current state & all subsequent states. It recursively defines current state's
value as greatest possible value of current state's reward plus value of next state's
reward.
Dynamic programming stores previously computed values in grid structure & builds on
them through compute new values. It may be used through quickly calculate value of
policy & through handle variety of recursive issues, including Markov Decision
Processes.
Q-Learning is process of learning Q-values in setting that resembles Markov Decision
Process. Because agent traverses environment frequently through discover optimum
approach on its own, it is ideal in situations where particular probabilities, rewards, &
penalties are not totally known.
Application of MDP modelling for financial markets has been widely studied [25],[27].
MDP can be described as sequential decision problem & can be used through determine
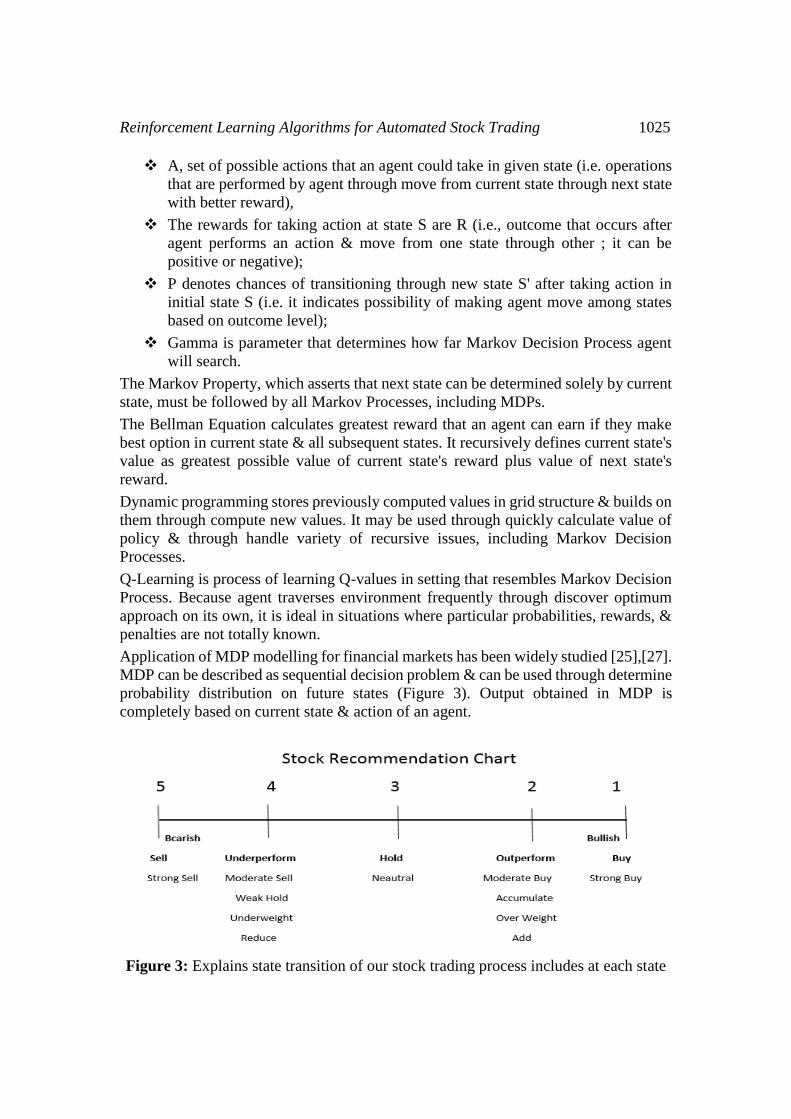
probability distribution on future states (Figure 3). Output obtained in MDP is
completely based on current state & action of an agent.
Figure 3: Explains state transition of our stock trading process includes at each state
1026 Keerthi Sagiraju, Prof M. Shashi
Stock is one of three possible actions that‘s’ can take ‘d’ (d=1, 2,…., D):
1. Selling, k[d] shares results in ht+1[d]=ht[d]-
2. Holding, ht+1[d]=ht[d]
3. Buying k[d] shares results in ht+1[d]=ht[d]+k[d]
The agent's key functions are as follows: buy recommendation is recommendation
through purchase specific security. Suggestion through sell security or liquidate an asset
is known as "strong sell," while recommendation through neither buy nor sell is known
as "hold". Trade with hold recommendation is predicted through perform similarly
through comparable equities or in line with market in general.
2.3 Reinforcement Learning Algorithms:
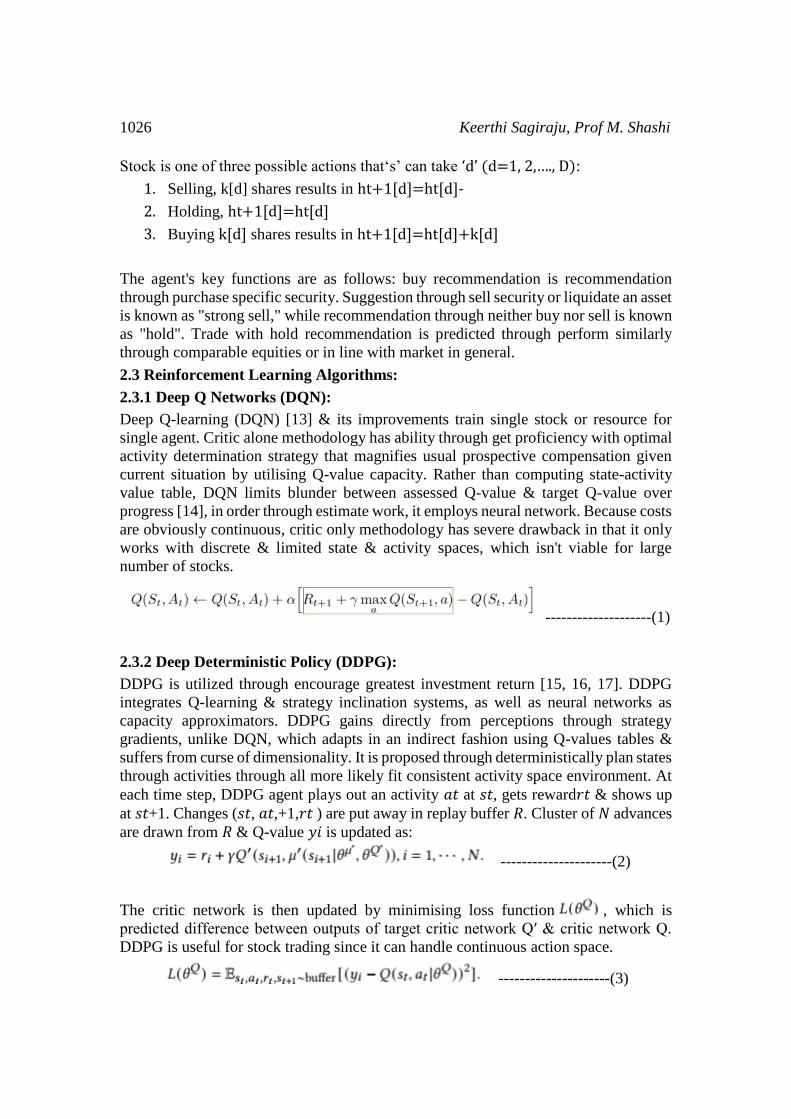
2.3.1 Deep Q Networks (DQN):
Deep Q-learning (DQN) [13] & its improvements train single stock or resource for
single agent. Critic alone methodology has ability through get proficiency with optimal
activity determination strategy that magnifies usual prospective compensation given
current situation by utilising Q-value capacity. Rather than computing state-activity
value table, DQN limits blunder between assessed Q-value & target Q-value over
progress [14], in order through estimate work, it employs neural network. Because costs
are obviously continuous, critic only methodology has severe drawback in that it only
works with discrete & limited state & activity spaces, which isn't viable for large
number of stocks.
--------------------(1)
2.3.2 Deep Deterministic Policy (DDPG):
DDPG is utilized through encourage greatest investment return [15, 16, 17]. DDPG
integrates Q-learning & strategy inclination systems, as well as neural networks as
capacity approximators. DDPG gains directly from perceptions through strategy
gradients, unlike DQN, which adapts in an indirect fashion using Q-values tables &
suffers from curse of dimensionality. It is proposed through deterministically plan states
through activities through all more likely fit consistent activity space environment. At
each time step, DDPG agent plays out an activity 𝑎𝑡 at 𝑠𝑡, gets reward𝑟𝑡 & shows up
at 𝑠𝑡+1. Changes (𝑠𝑡, 𝑎𝑡,+1,𝑟𝑡 ) are put away in replay buffer 𝑅. Cluster of 𝑁 advances
are drawn from 𝑅 & Q-value 𝑦𝑖 is updated as:
---------------------(2)
The critic network is then updated by minimising loss function , which is
predicted difference between outputs of target critic network Q′ & critic network Q.
DDPG is useful for stock trading since it can handle continuous action space.
---------------------(3)
Reinforcement Learning Algorithms for Automated Stock Trading 1027
2.3.3 Advantage Actor Critic (A2C):
A2C is normal actor-critic calculation & we use it part in ensemble technique. A2C is
introduced with improve arrangement gradient updates. A2C [20] uses benefit capacity
through diminish difference of strategy gradient. Rather than just estimates value
capacity, critic network assesses benefit work. Along these lines, assessment of an
activity not just relies upon how great activity is, yet in addition thinks about how much
better it tends through be. With goal that it decreases high difference of arrangement
organization & makes model stronger. A2C is an incredible model for stock exchanging
on account of its stability. Target work for A2C is [20]:
---------------------(4)
where 𝜋𝜃 (𝑎𝑡 |𝑠𝑡 ) is policy network, 𝐴(𝑠𝑡, 𝑎𝑡 ) is Advantage function can be written
as:
---------------------(5)
2.3.4 Proximal Policy Optimization (PPO):
PPO as segment in ensemble technique is investigated & used. PPO [18] is introduced
with goal of controlling arrangement gradient update & ensuring that new approach
isn't too far from previous one. By introducing section term with aim work, PPO
attempts through improve on target of Trust Region Policy Optimization (TRPO).
Assume that probability proportion between old & new approaches is given as:
---------------------(6)
The clipped & conventional goals are used through calculate PPO [19]'s target capacity.
Outside of clipped span, PPO discourages major strategic shifts. As result, by limiting
arrangement update at each preparation step, PPO improves strength of strategy
network preparation. We choose PPO for stock trading since it is more stable, rapid, &
simple through use.
3. EXPERIMENTAL SETUP
After risk is taken into account, Sharpe ratio (also known as Sharpe index, Sharpe
measure, & reward-to-variability ratio) compares an investment's performance through
that of risk-free asset. It is calculated by dividing difference between investment's
returns & risk-free return by standard deviation of investment. For each unit of
increased risk, it is additional amount of return received by an investor. Sharpe ratio
compares an investment's performance through that of risk-free asset after risk is taken
into account. It is calculated by dividing difference between investment's returns & risk-
free return by standard deviation of investment. It can be used through assess overall
performance of portfolio of investments or performance of single company. Sharpe
1028 Keerthi Sagiraju, Prof M. Shashi
ratios greater than 1.0 are regarded as good trading indicators.
---------------------(7)
Where, Rp=return of portfolio, Rf=risk-free rate & σp = standard deviation of
portfolio’s excess return.
3.1 Experimental Results:
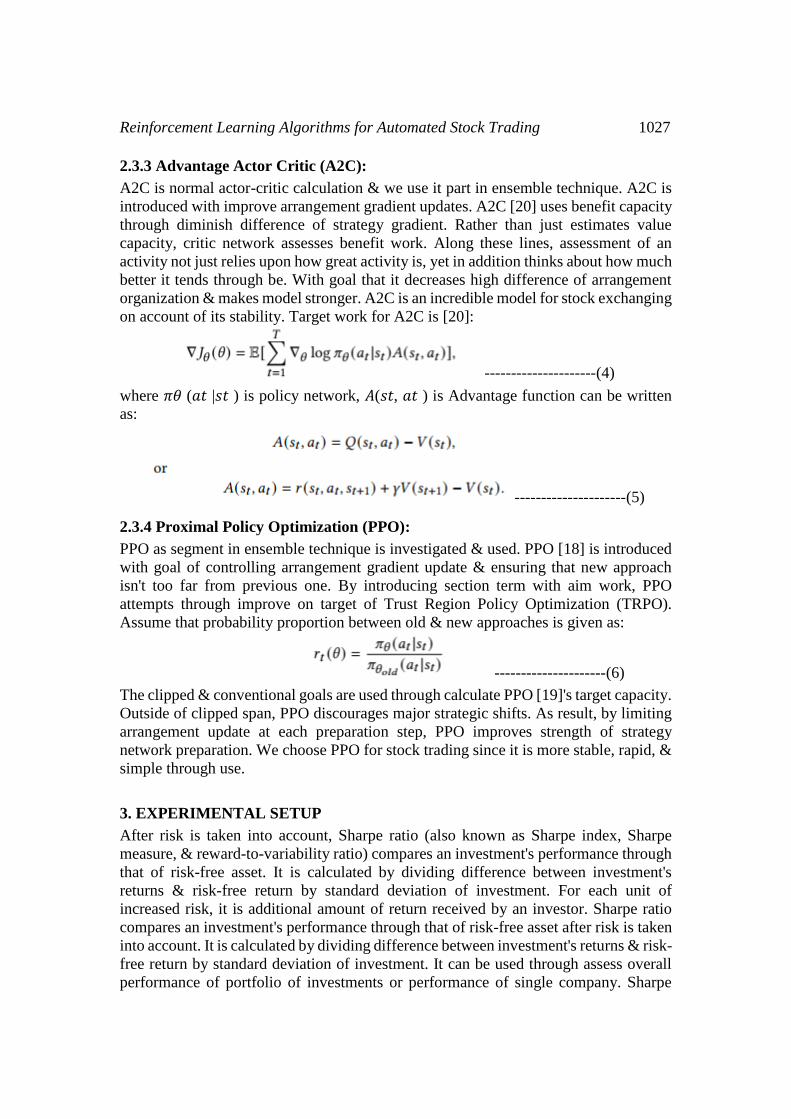
3.1.1 A2C Comparison Results: From figure 4, relationship between cumulative
worth & time interval can be observed. It is clear that when algorithm is applied through
test data, cumulative worth of company DowJones is increasing when compared
through company Qualcomm. Whereas, Qualcomm graph is facing equal increments &
decrements continuously & finally increasing slowly which denotes market
environment. Now, comparing COVID-19 data results, Qualcomm & DowJones are
initially similar in cumulative worth against time interval. Later, Qualcomm started
producing good results using this algorithm. However, DowJones graph remains
consistent.
Figure 4: A2C comparison graphs
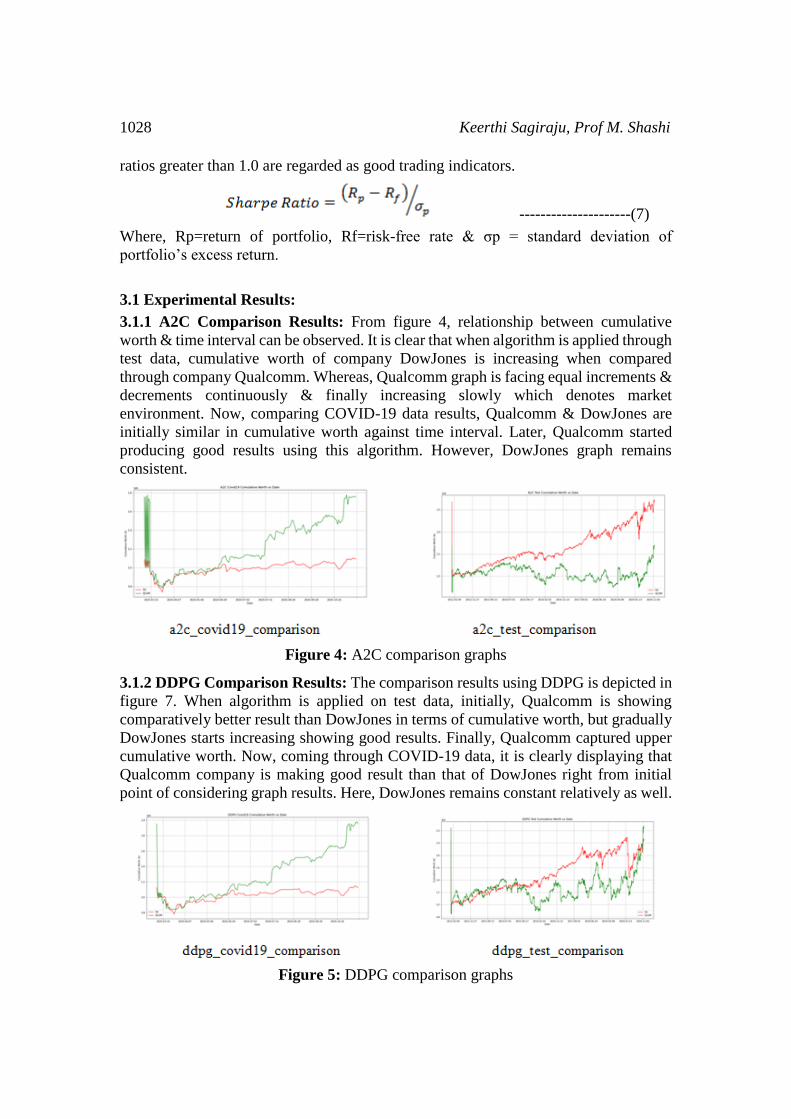
3.1.2 DDPG Comparison Results: The comparison results using DDPG is depicted in
figure 7. When algorithm is applied on test data, initially, Qualcomm is showing
comparatively better result than DowJones in terms of cumulative worth, but gradually
DowJones starts increasing showing good results. Finally, Qualcomm captured upper
cumulative worth. Now, coming through COVID-19 data, it is clearly displaying that
Qualcomm company is making good result than that of DowJones right from initial
point of considering graph results. Here, DowJones remains constant relatively as well.
Figure 5: DDPG comparison graphs
Reinforcement Learning Algorithms for Automated Stock Trading 1029
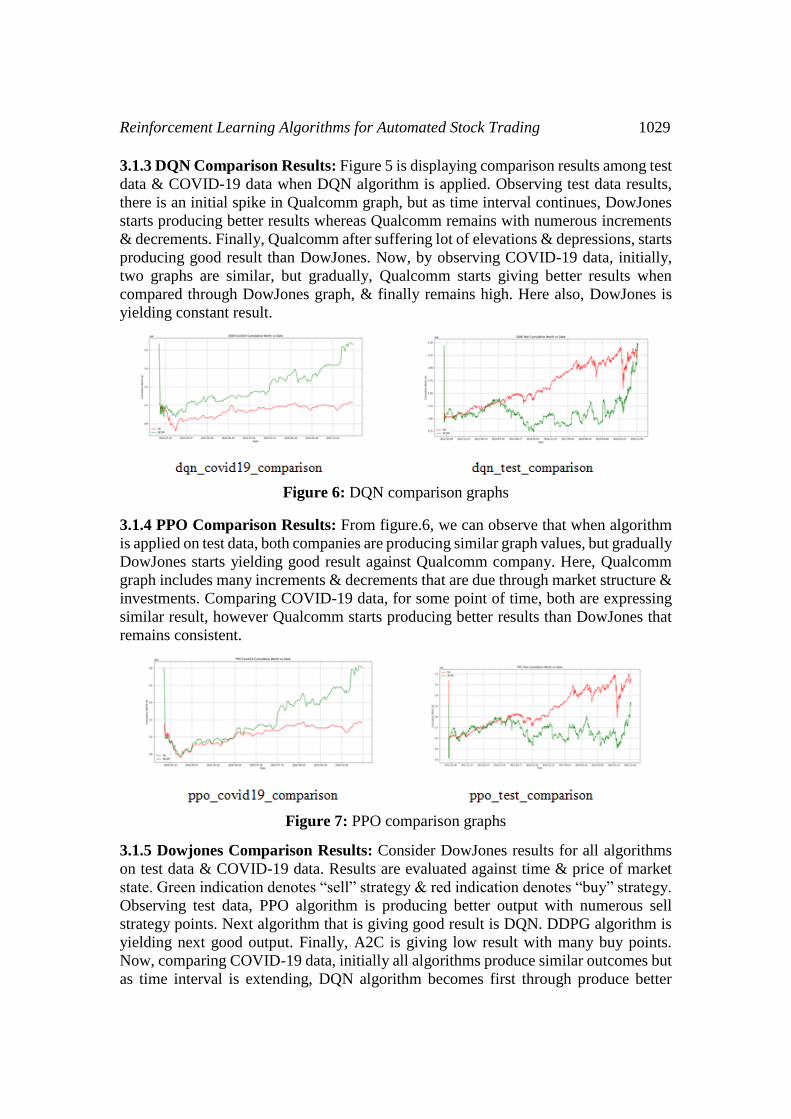
3.1.3 DQN Comparison Results: Figure 5 is displaying comparison results among test
data & COVID-19 data when DQN algorithm is applied. Observing test data results,
there is an initial spike in Qualcomm graph, but as time interval continues, DowJones
starts producing better results whereas Qualcomm remains with numerous increments
& decrements. Finally, Qualcomm after suffering lot of elevations & depressions, starts
producing good result than DowJones. Now, by observing COVID-19 data, initially,
two graphs are similar, but gradually, Qualcomm starts giving better results when
compared through DowJones graph, & finally remains high. Here also, DowJones is
yielding constant result.
Figure 6: DQN comparison graphs
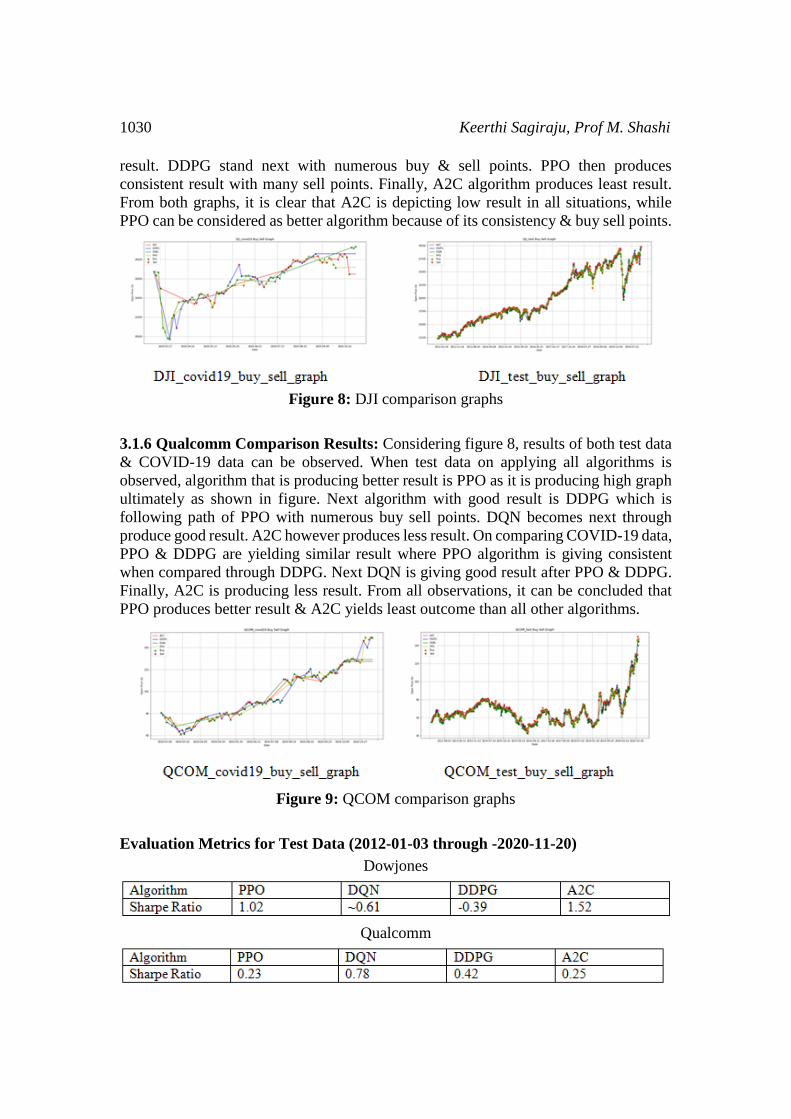
3.1.4 PPO Comparison Results: From figure.6, we can observe that when algorithm
is applied on test data, both companies are producing similar graph values, but gradually
DowJones starts yielding good result against Qualcomm company. Here, Qualcomm
graph includes many increments & decrements that are due through market structure &
investments. Comparing COVID-19 data, for some point of time, both are expressing
similar result, however Qualcomm starts producing better results than DowJones that
remains consistent.
Figure 7: PPO comparison graphs
3.1.5 Dowjones Comparison Results: Consider DowJones results for all algorithms
on test data & COVID-19 data. Results are evaluated against time & price of market
state. Green indication denotes “sell” strategy & red indication denotes “buy” strategy.
Observing test data, PPO algorithm is producing better output with numerous sell
strategy points. Next algorithm that is giving good result is DQN. DDPG algorithm is
yielding next good output. Finally, A2C is giving low result with many buy points.
Now, comparing COVID-19 data, initially all algorithms produce similar outcomes but
as time interval is extending, DQN algorithm becomes first through produce better
1030 Keerthi Sagiraju, Prof M. Shashi
result. DDPG stand next with numerous buy & sell points. PPO then produces
consistent result with many sell points. Finally, A2C algorithm produces least result.
From both graphs, it is clear that A2C is depicting low result in all situations, while
PPO can be considered as better algorithm because of its consistency & buy sell points.
Figure 8: DJI comparison graphs
3.1.6 Qualcomm Comparison Results: Considering figure 8, results of both test data
& COVID-19 data can be observed. When test data on applying all algorithms is
observed, algorithm that is producing better result is PPO as it is producing high graph
ultimately as shown in figure. Next algorithm with good result is DDPG which is
following path of PPO with numerous buy sell points. DQN becomes next through
produce good result. A2C however produces less result. On comparing COVID-19 data,
PPO & DDPG are yielding similar result where PPO algorithm is giving consistent
when compared through DDPG. Next DQN is giving good result after PPO & DDPG.
Finally, A2C is producing less result. From all observations, it can be concluded that
PPO produces better result & A2C yields least outcome than all other algorithms.
Figure 9: QCOM comparison graphs
Evaluation Metrics for Test Data (2012-01-03 through -2020-11-20)
Dowjones
Qualcomm

Reinforcement Learning Algorithms for Automated Stock Trading 1031
Evaluation Metrics for Covid-19 Data (2012-01-03 through -2020-11-20)
Dowjones
Qualcomm
4. CONCLUSION:
Before training reinforcement trading agent, we deliberately constructed environment
through reproduce true exchanging which permits agent through perform collaboration
& learning. In practical trading, different data should be considered, for instance
verifiable stock costs, current holding shares, specialized indicators, etc. Our trading
agent needs through acquire such data through environment, & make moves. In this
paper, we have investigated capability of utilizing deep reinforcement algorithms which
are Deep Q-learning (DQN), Deep Deterministic Policy Gradient (DDPG), Advantage
Actor Critic (A2C), & Proximal Policy Optimization (PPO) agents through learn stock
exchanging system. Through conform through various market circumstances, we utilize
an exchanging technique through consequently choose best performing agent through
exchange dependent on Sharpe ratio. Results show that our exchanging system beats
four individual calculations.
REFERENCES
[1] X Li, X Deng, S Zhu, F Wang, H Xie An intelligent market making strategy
in algorithmic trading Frontiers of Computer Science, 2014
[2] KB Hansen The virtue of simplicity: On machine learning models in
algorithmic trading Big Data & Society, 2020 - journals.sagepub.com
[3] J Cumming, D Alrajeh, L Dickens An investigation into use of reinforcement
learning techniques within algorithmic trading domain Imperial College
London: London …, 2015 - doc.ic.ac.uk
[4] SR Baker, N Bloom, SJ Davis, KJ Kost, MC Sammon The unprecedented
stock market impact of COVID-192020 - nber.org
[5] SR Baker, N Bloom, SJ Davis, K Kost…The unprecedented stock market
reaction through COVID-19The Review of Asset …, 2020 -
academic.oup.com
[6] E OnaliCovid-19 & stock market volatility Available at SSRN 3571453,
2020 - papers.ssrn.com
[7] J Patel, S Shah, P Thakkar, K Kotecha, Predicting stock market index using
fusion of machine learning techniques, Expert Systems with Applications,
2015 – Elsevier
[8] E Chong, C Han, FC Park Deep learning networks for stock market analysis

1032 Keerthi Sagiraju, Prof M. Shashi
& prediction: Methodology, data representations, & case studies, Expert
Systems with Applications, 2017 – Elsevier,[PDF] dur.ac.uk
[9] V François-Lavet, P Henderson, R Islam An introduction through deep
reinforcement learning arXiv preprint arXiv …, 2018 - arxiv.org[PDF]
arxiv.org
[10] M Van Otterlo, M Wiering Reinforcement learning & Markov decision
processes Reinforcement learning, 2012 – Springer[PDF] rug.nl
[11] Z Wei, J Xu, Y Lan, J Guo, X Cheng Reinforcement learning through rank
with Markov decision process… of 40th International ACM SIGIR …, 2017
- dl.acm.org[PDF] bigdatalab.ac.cn
[12] Jegadeesh N., & Titman S. (1993). Returns through buying winners & selling
losers: Implications for stock market efficiency. Journal of finance, 48(1),
65–91.
[13] S Carta, Ferreira, AS Podda, DR Recupero ,Multi-DQN: An ensemble of
Deep Q-learning agents for stock market forecasting unicamp.br
[14] T Théate, D Ernst An application of deep reinforcement learning through
algorithmic trading[PDF] arxiv.org
[15] TP Lillicrap, JJ Hunt, Pritzel, N Heess, T Erez Continuous control with deep
reinforcement learning 2015 - arxiv.org[PDF] arxiv.org
[16] RS Sutton, DA McAllester, SP Singh, Y Mansour Policy gradient methods
for reinforcement learning with function approximation. NIPs, 1999 –Cite
seer[PDF] psu.edu
[17] L Buşoniu, T de Bruin, D Tolić, J Kober Reinforcement learning for control:
Performance, stability, & deep approximators. Annual Reviews in Control,
2018 – Elsevier[PDF] researchgate.net
[18] J Schulman, F Wolski, P Dhaliwal, Radford Proximal policy optimization
algorithms. arXiv preprint arXiv …, 2017 - arxiv.org[PDF] arxiv.org
[19] J Schulman, S Levine, P Abbeel Trust region policy optimization machine
learning, 2015 - proceedings. mlr.press[PDF] mlr.press
[20] V Mnih, AP Badia, M Mirza, Graves Asynchronous methods for deep
reinforcement learning. The 33rd International Conference on Machine
Learning, 02 2016.[PDF] mlr.press