regulatory framework for distributed generation … · regulatory framework for ... november 16,...
TRANSCRIPT

REGULATORY FRAMEWORK FOR
DISTRIBUTED GENERATION IN USA
ERRA – TENVA CONSULTATION
November 16, 2016
David Vognsen – Lead Regulatory Affairs Consultant

2
Alliant Energy Background

3
Investor Owned Utility
Two Utilities:
Interstate Power and Light (IPL)
Wisconsin Power and Light (WPL)
Retail rates regulated by the state
Wholesale markets for capacity and energy
Wholesale markets regulated by the US (Federal Energy
Regulatory Commission)
All generation resources are submitted into wholesale
market for economic dispatch.
Transmission assets owned by third parties
Transmission rates also regulated by FERC
Alliant Energy Background
4
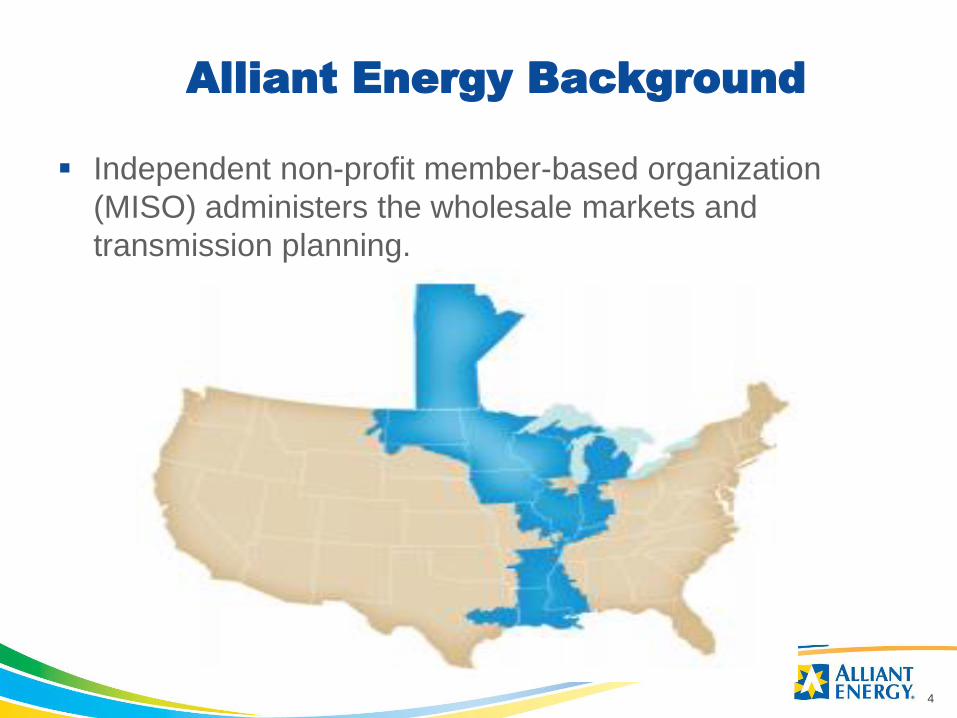
Independent non-profit member-based organization
(MISO) administers the wholesale markets and
transmission planning.
Alliant Energy Background

5
Alliant Generation Capacity Mix

6
Alliant Electric Sales Mix
IPL WPL

7
Transitioning Resources

8
Federal law provides for non-discriminatory access to the
grid for small DG customers.
Utilities must offer to interconnect small DG to operate in parallel
with the electrical system
Interconnection rules govern the safe and reliable interconnection
of DG
Federal law also obligates utilities to purchase generation
from small DG customers.
Small renewables are defined as “Qualifying Facilities”
Purchase rates are not to exceed a utilities avoided cost
Net metering is a billing arrangement versus a purchase of power
Federal law also provides that utilities provide standby
and supplementary service at non-discriminatory rates
Regulatory Support for Small DG

9
US Tax law provides for:
Investment Tax Credits of 30% of cost of system
Accelerated depreciation (business)
US Department of Agriculture provides:
Grants for renewables
Loan Guarantees
US Department of Energy provides loan guarantees
Federal Support for Small DG

10
Iowa and Wisconsin provide the interconnection
engineering rules and specifications for small DG to
interconnect with the grid.
Determination of the appropriate avoided cost rate for
payment of generation from small DG is determined by
the state unless otherwise negotiated by the parties.
Standard purchase rates for generators 100 kW or less.
Iowa and Wisconsin have Renewable Portfolio Standards
(RPS) for the amount of energy utilities must purchase or
generate from renewable sources.
State Support for Small DG

11
Net metering Tariffs
Iowa allows up to 1 MW nameplate capacity for net metering
Wisconsin allows up to 20 kW
Utility rebate programs
As part of IPL’s energy efficiency programs renewable rebates
were provided to DG (discontinued in 2014)
Feed-in / Value-of-Solar (VOS) tariffs
Purchase rates for solar energy that may be above full retail rate
Community Based Energy Development (CBED) tariffs
Front loading a purchase power rate
State Support for Small DG

12
Avoidance of energy kWh purchases by utility
May eliminate need to purchase power during high cost
periods
Avoidance of the need to purchase or build kW capacity
Power pool accredits some or a portion of the capacity
Operational characteristics of the generation
Coincidence with utility peak demand (kW) time periods
Helps utility meet an RPS standard
Potential Roles for Small DG

13
Avoidance of the need to build distribution capacity
May help on circuits that are overloaded
May require smart inventors and two-way communication with
the grid
Reduction in line losses
Generation closer to the source
Fuel diversity
Potential Roles for Small DG

14
Potential Roles for Small DG

15
Example-- Daily Residential Load Profile
kW
0
0,5
1
1,5
2
2,5
3
3,5
1 2 3 4 5 6 7 8 9 10 11 12 13 14 15 16 17 18 19 20 21 22 23 24K
W
Hour
DG (8/30/2013) Res System (08/30/2013)

Small DG on Peak Days
0
20
40
60
80
100
120
140
160
180
200
12:00:00 de. 4:00:00 de. 8:00:00 de. 12:00:00 du. 4:00:00 du. 8:00:00 du. 12:00:00 de.
H
o
u
r
l
y
K
W
Hour
07/18/2013
08/21/2013
08/26/2013
08/27/2013
07/17/2013
16

Small DG on Peak Day – KW Demand
17

Small DG on Peak Day - KVA
18

Small DG on Peak Day - KVAR
19

20
Avoidance of the need to build distribution capacity
May help on circuits that are overloaded
May require smart inventors and two-way communication with
the grid
Reduction in line losses
Generation closer to the source
DER = Distributed Energy Resources
Potential Roles for Small DG

21
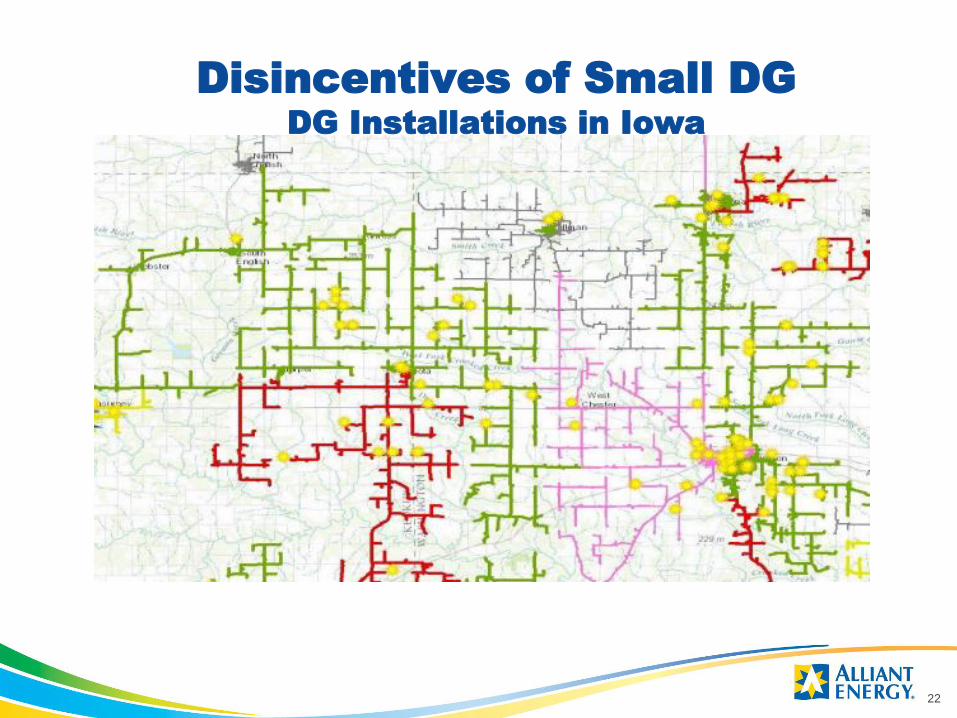
Disincentives of Small DG
DG Installations in Iowa
22
Disincentives of Small DG
DG Installations in Iowa

23
Customer ServiceMeter and Service
Line Transformer & Secondary Lines
Primary Distribution & Substations
Transmission Generation—Capacity & Energy
Fixed Charge
Current Full Requirements Customer Rate Design
Energy Rate
Pricing Components of a Customer Bill
Disincentives of Small DG

Solar Profile
24
0
0,5
1
1,5
2
2,5
3
3,5
1 2 3 4 5 6 7 8 9 10 11 12 13 14 15 16 17 18 19 20 21 22 23 24
K
W
Hour
Residential - Partial vs Full Requirements
DG (8/27/2013) DG (8/30/2013) Res Class (08/27/2013) Res System (08/30/2013)
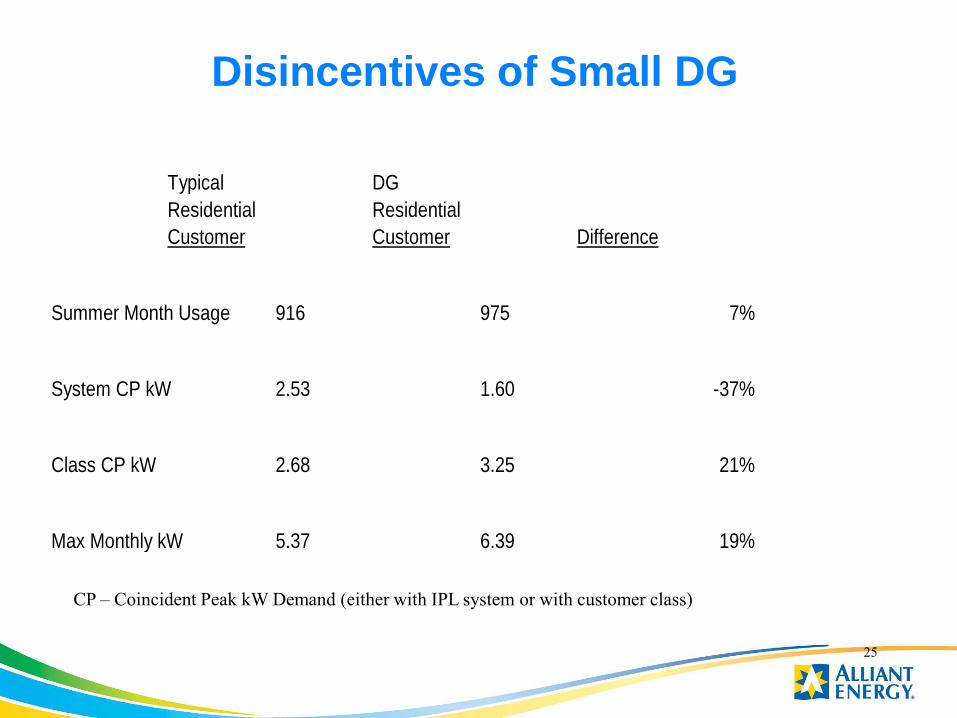
Disincentives of Small DG
Typical
DG
Residential
Residential
Customer
Customer
Difference
Summer Month Usage
916
975
7%
System CP kW
2.53
1.60
-37%
Class CP kW
2.68
3.25
21%
Max Monthly kW
5.37
6.39
19%
25
CP – Coincident Peak kW Demand (either with IPL system or with customer class)

Economics of DG on Utility Business
Model
• DG owners should be compensated for the value DG provides
the grid
• Utility model is based upon providing shareholders a return for
the capital invested by the utility
• Capital invested in utility assets increases rate base to provide a
return
• Utility has an obligation to provide service to customer 24
hours per day every day of the year
• DG is an intermittent resource 26

Economics of DG on Utility Business
Model• Who should pay to modernize the grid to accept 2-way flow of
power and capitalize of DG benefits?
• Will DG additions increase rates?
• Are current rate designs applicable for additional DG
additions?
• Should DG customers be provided an incentive to install DG?
If so what is the incentive based on?
• DG costs continue to drop while there continues to be upward
pressure on rates for investments to make the grid more
resilient and reliable.27
DG Business Models
• Direct sales of DG systems
• Lease of system
• Third Party Purchase Power Agreements
• Community Solar
28

DG Business Models
• Value proposition is typically to not only offset usage
but to take advantage of net metering tariffs
• Federal investment tax credit reduces cost of systems
by 30%
• Business can also take advantage of accelerated
depreciation for tax purposes
• Variety of either federally subsidized loans or direct
grants 29

DG Business Models
• Business customers typically require shorter payback
periods than residential customers.
• When tax credits and other government incentives are
coupled with the availability of net metering,
customers may have a payback period of 4-6 years if
not less.
30

DG Business Models
• Leases typically work best when a customer does not
have tax liabilities (for example non-profits) or do not
want to tie up capital
• For residential customers, long-term leases may create
issues if customer wants to sell the residence
31

DG Business Models
• Third party purchase agreements similar to leases
except customer pays a per kWh charge for each kWh
generated by the DG system
• DG owner is able to take advantage of tax credits to
lower the kWh charge
• DG owner may end up selling/assigning the purchase
power agreement in a secondary market
32

DG Business Models
• Third party purchase agreements attractive to non-
profits and governmental bodies
• Third party purchase agreement more prevalent under
a net metering tariff.
• Typically the third party PPA rate is slightly less than
the corresponding utility rate but escalates each year
of the PPA.
33

DG Business Models
• Community Solar is seen as a way to offer solar to
customers that have no other way to take advantage of
solar
• Customers typically make an initial payment of $300-
$400 which entitles them to a share of the community
solar project
• Community solar installation may range in size from
50 kW to 3 MWs
34

DG Business Models
• Community Solar may be owned by a third party or
by the utility
• Participants are granted a block share of the project,
for example 1 kW. That entitles them to the energy
production associated with their share.
• The energy share may be reflected as a dollar credit
on their bill or an offset to their kWh consumption.
35

DG Business Models
36
Community Solar

Net Metering
• Most contentious issue regarding customer-owned DG
• Each state has different variations on the net metering
tariff (if offered)
• FERC has ruled that the state not the Fed has
jurisdiction on net metering since it involves a billing
arrangement
37

Net Metering
• Most of the growth in small DG has come about
through net metering
• Utilities see net metering as compensating DG at full
retail rate (for example, DG customer may possibly
offset all usage from the grid and not pay any charges
for grid)
• Solar industry sees net metering as compensating for
the “Value of Solar”
• Main growth in small DG in Iowa is solar (90%).38

Net Metering Examples
Various constructs of net metering
39
Offset Example Net Metering Example
Customer Net after Customer
Net
after
Period Load Generation offset Period Load Generation offset
1 100 0 100 1 100 0 100
2 100 0 100 2 100 0 100
3 100 0 100 3 100 0 100
4 100 0 100 4 100 50 50
5 100 25 75 5 100 75 25
6 100 50 50 6 100 100 0
7 100 50 50 7 100 125 -25
8 100 50 50 8 100 150 -50
9 100 25 75 9 100 50 50
10 100 0 100 10 100 25 75
11 100 0 100 11 100 0 100
12 100 0 100 12 100 0 100
Total 1200 200 1000 Total 1200 575 625
Customer billed for 1,000 kWH Customer billed for 625 kWH
Net Metering with banking Example
Customer
Net
after
Period Load Generation offset
1 100 0 100
2 100 0 100
3 100 0 100
4 100 100 0
5 100 200 -100
6 100 300 -200
7 100 300 -200
8 100 200 -100
9 100 100 0
10 100 75 25
11 100 0 100
12 100 0 100
Total 1200 1275 -75
Customer billed for 0 kWH with 75 kWh banked

40
Potential Growth of DG Net Metering

41
Net Energy Metering and Revenue
Impacts
Classification: CONFIDENTIAL
Full Requirements Bill$1,356 ($113 monthly)
NEM Bill*$744 ($62 monthly)
Avoided fuel savings - $113
Revenue Impact - $612
Average Usage
System Output
Net MeteredNEM = Net Energy Metering

42
Net Energy Metering and Revenue Impacts
$(30,90)
$36,21
$18,10
$42,23
$21,27
$10,64
$24,81
$15,64
$7,82
$18,24
$21,82
$16,16
$23,70
$18,93
$9,46
$18,92
-$40
-$20
$0
$20
$40
$60
$80
$100
$120
$140
Baseline Residential Customer DG Net-metered Customer Non-DG Customer
Av
era
ge
Mo
nth
ly B
ill
Transfer Payment for Net Metering
Production variable
Customer-related
Distirbution
Transmission
Production Capacity
Transfer Payment
$113
$62
$127
Tra
nsfe
r P
aym
ents

43
Net Energy Metering Rate Alternatives
Increase Customer Charge
Fixed monthly charge
Minimum bill
Capacity / standby charge
Demand charges

44
Recent Rate Reform Activity
Source> Edison Electrical Institute