regression using serial data jyoti sarkar, iupui october 30, [email protected]
TRANSCRIPT

The ProblemGiven: On n units, (x,y) “before” and
(x,y) “after” a treatmentGoal: Regress y on x
• X=a predictor (easy/inexpensive)• Y=a response (difficult/expensive)• Assume n units are independent
October 30, 2002 [email protected] 2

ExampleConcern: Many Japanese exhibit a bigger lower jaw
than upper jaw.Treatment (for growth of upper jaw):
Children (4 -12 years old) wore a mouth gear 8 -10 hours daily for 1- 2 years.
Questions• Was the treatment effective? … no control gp• How did measurements change with age?
October 30, 2002 [email protected] 3

October 30, 2002 [email protected] 4

Face Mask Experiment
Sample: 25 boys, 18 girls“before” and “after” treatment
– age (year day)
From X-ray plates measure:– ccorr = corrected C-axis SM (mm)– theta = (C-axis, anterior cranial base SN) – alpha = (C-axis, palatal plane thro’ M)
( ½ degree)
Objective: Regress y=ccorr on x=ageOctober 30, 2002 [email protected] 5

Face Mask data ☺ patient gender age1 theta1 alpha1 ccorr1 age2 theta2 alpha2 ccorr2
☺ 1 2 4.99 39.0 35.0 76.076 5.99 40.5 32.0 77.064
☺ 2 2 9.90 43.0 32.0 68.666 11.43 47.0 34.0 72.124etc.
October 30, 2002 [email protected] 6

Regress y=ccorr on x=age:(1) “before” data: (n=18)
>Regress ccorr1 on 1 age1
ccorr1=66.97 + 0.2530 age1• r2=.023, r2(adj)=.000• S=3.632, SE(b1)=0.4096, p-value=.545
• t.975,16=2.120
• 95% CI(1) = (-0.6153,1.1214)
October 30, 2002 [email protected] 7

121110 9 8 7 6 5 4
75
70
65
age1_
cco
rr1_
S = 3.63205 R-Sq = 2.3 % R-Sq(adj) = 0.0 %
ccorr1_ = 66.9668 + 0.252973 age1_
"Before" Treatment: 18 Girls
October 30, 2002 [email protected] 8

(2) “after” data: girls (n=18)>Regress ccorr2 on 1 age2
ccorr2=71.30 + 0.1142 age2• r2=.006, r2(adj)=.000• S=3.321, SE(b1)=0.3738, p-value=.764
• t.975,16=2.120
• 95% CI(1) = (-0.6782, 0.9066)
October 30, 2002 [email protected] 9

1413121110 9 8 7 6 5
80
75
70
age2_
cco
rr2_
S = 3.32165 R-Sq = 0.6 % R-Sq(adj) = 0.0 %
ccorr2_ = 71.3030 + 0.114175 age2_
"After" Treatment: 18 Girls
October 30, 2002 [email protected] 10
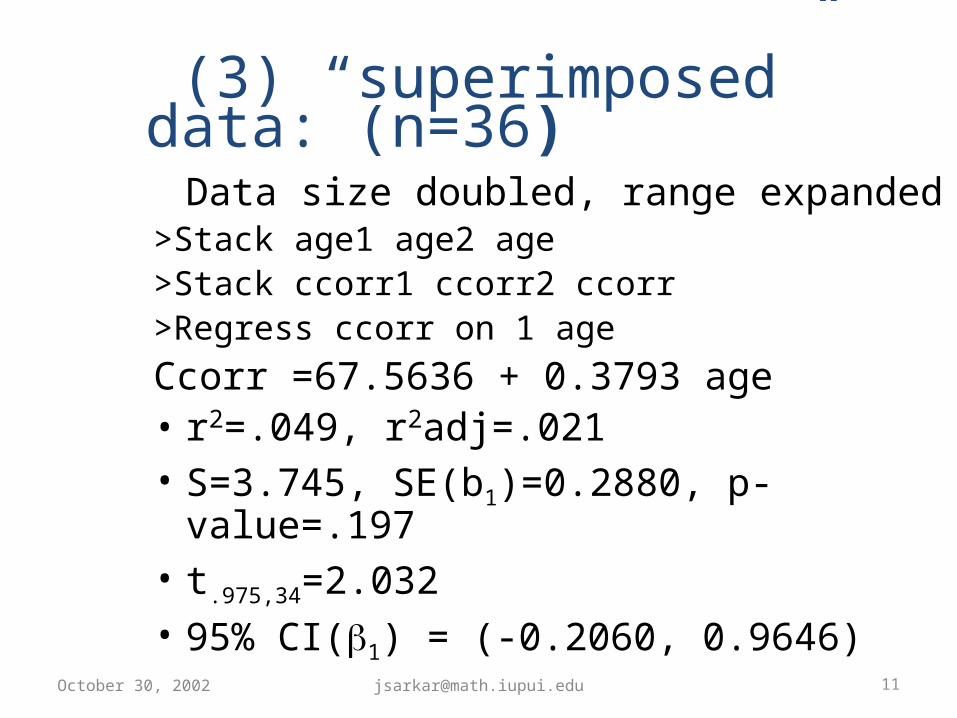
Data size doubled, range expanded>Stack age1 age2 age>Stack ccorr1 ccorr2 ccorr>Regress ccorr on 1 ageCcorr =67.5636 + 0.3793 age• r2=.049, r2adj=.021• S=3.745, SE(b1)=0.2880, p-value=.197• t.975,34=2.032• 95% CI(1) = (-0.2060, 0.9646)
October 30, 2002 [email protected] 11
(3) “superimposed” data: (n=36)

1413121110 9 8 7 6 5 4
80
75
70
65
age
cco
rr
S = 3.74537 R-Sq = 4.9 % R-Sq(adj) = 2.1 %
ccorr = 67.5636 + 0.379335 age
"Superimposed" Data: 18 Girls
October 30, 2002 [email protected] 12

Regress y on x: naïve attempts
All 3 naïve attempts yield• Low r2
• Large p-value => slope=0• CI э 0Conclusion:• Either “ccorr does not depend on age”• Or “we need a better regression model”
October 30, 2002 [email protected] 13

1413121110987654
80
75
70
65
age
cco
rr
Serial Bivariate Data: n=18 girls
October 30, 2002 [email protected] 14

Serial Bivariate Plot • ccorr increases with age (for most girls)• Regression of ccorr on age should have
positive slope, especially under treatment
Why then is r2 low?Between-subject variation is high.
Study within-subject change, to see if ccorr depends on age.
October 30, 2002 [email protected] 15

Within-subject change
• age = age2 - age1 = Treatment duration • ccorr = ccorr2 – ccorr1 = Change in ccorr• ccorr / age = within-subject slopeMeans (n=18 girls)
age2 = 8.39 ccorr2 = 72.26 age1 = 7.26 ccorr1 = 68.80 age = 1.13 ccorr = 3.46 ccorr/ age = 3.0251
Recall b1= (1) 0.2530 (2) 0.1142 (3) 0.3793
October 30, 2002 [email protected] 16

1.51.00.50.0
10
9
8
7
6
5
4
3
2
1
0
dage
dcco
rr
Within Subject Change: n=18 girls
October 30, 2002 [email protected] 17

Regress ccorr on age
>Regress dccorr on 1 dage;>noconstant.
dccorr = 3.0763 dageS=2.374, SE(b1)=0.4847, p-value = .000 t.975,17=2.11095% CI(1) = (2.0536,4.0990)Conclusion: ccorr increases with age
October 30, 2002 [email protected] 18
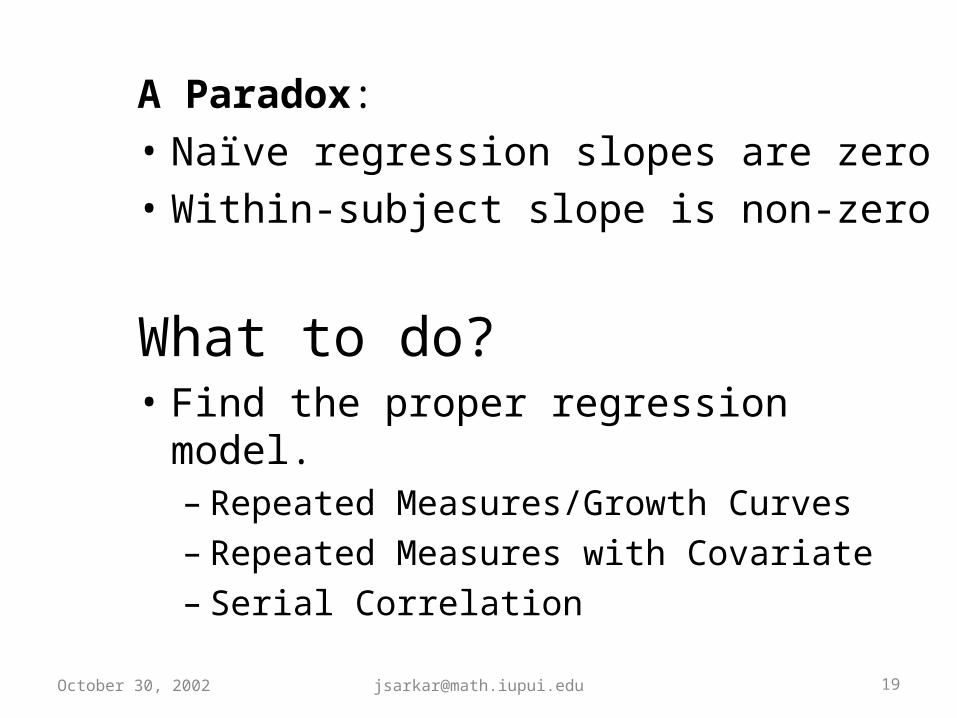
A Paradox:• Naïve regression slopes are zero• Within-subject slope is non-zero
What to do?• Find the proper regression model.
– Repeated Measures/Growth Curves– Repeated Measures with Covariate– Serial Correlation
October 30, 2002 [email protected] 19
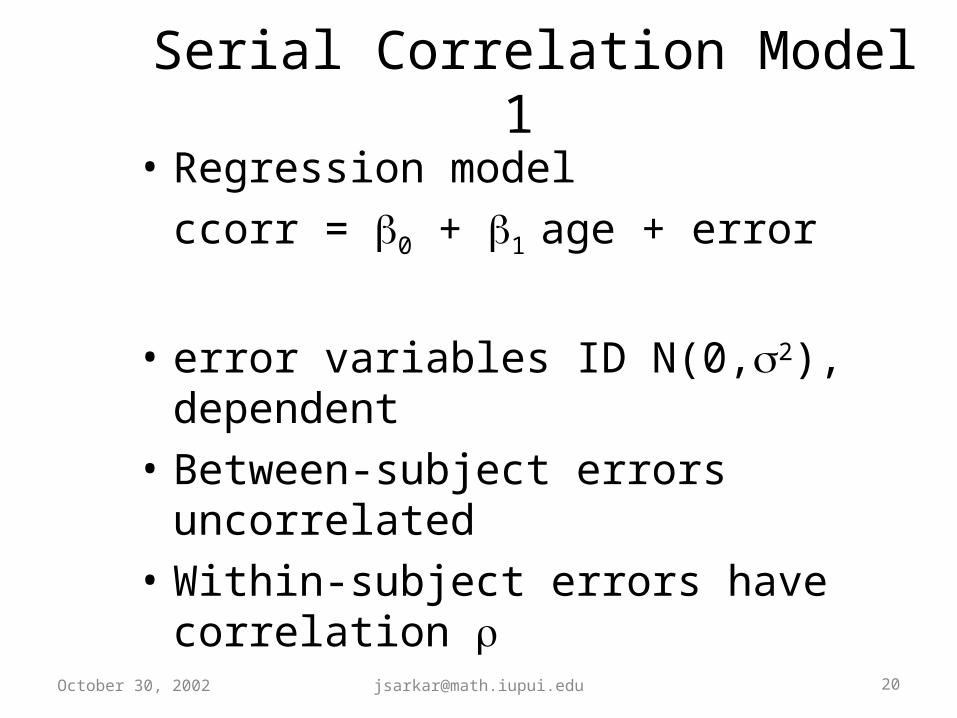
Serial Correlation Model 1 • Regression model
ccorr = 0 + 1 age + error
• error variables ID N(0,2), dependent• Between-subject errors uncorrelated• Within-subject errors have correlation
October 30, 2002 [email protected] 20

Regression Model 1
1
1
2
1
0
2
2
1
2
1
2
1
2
1
2
1
Cov
,*)0(with
1
1
,...,1For
IID
j
j
j
j
j
j
j
j
j
j
N
x
xy
y
nj
October 30, 2002 [email protected] 21

If unknownPre-multiply by
1
1
1
1
2
1
1
1
1
1
2
1
12
212/1
1
1
2
1
where
k
k
kk
kk
October 30, 2002 [email protected] 22

Orthogonalized Model 1
10
01~
~
2
1
0
2
2
1
2IID
2~
1~
2
1
21
1
11
1
2
1
Cov
),0(with
~
~
~
~
~
~
,...,1For
2
j
j
j
j
j
j
j
j
j
j
IN
x
x
y
y
nj
October 30, 2002 [email protected] 23


If unknown
)(SE)CI( )100%-(1 (5)
)SE(32
22)SE( RMSE,
32
22ˆ)4(
andˆ1where
Set (3)
~~Regress (2)
and izeOrthogonal Algorithm. usingˆGet (1)
132,2/111
11
1100
10
10
btbβ
cn
nb
n
n
cbcb
xbby
xccy
yx
n
October 30, 2002 [email protected] 25
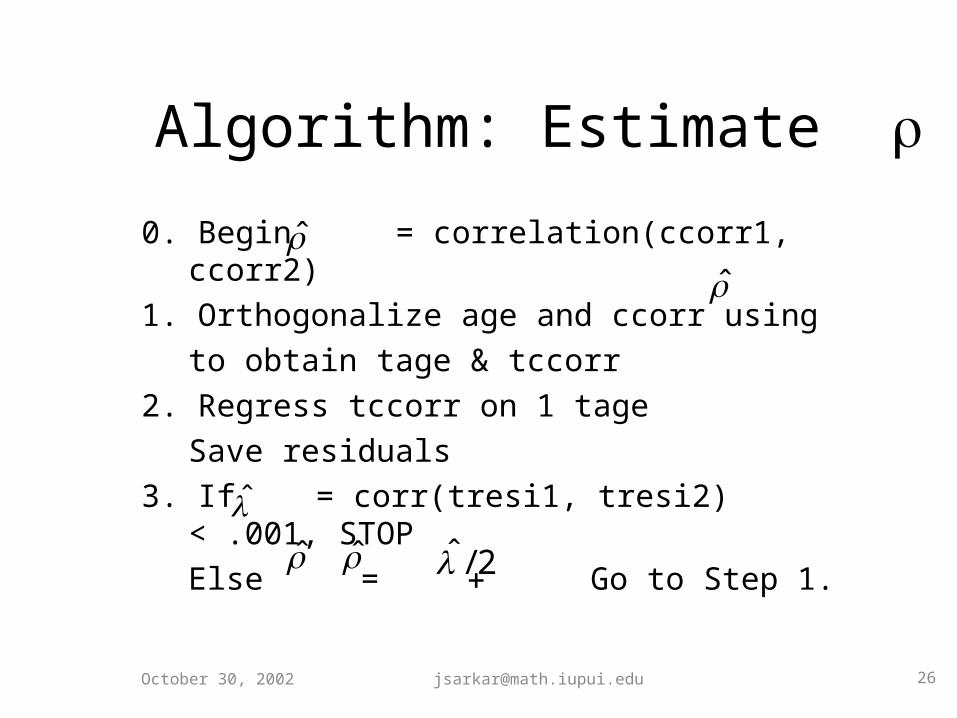
Algorithm: Estimate
0. Begin = correlation(ccorr1, ccorr2)1. Orthogonalize age and ccorr using
to obtain tage & tccorr2. Regress tccorr on 1 tage
Save residuals3. If = corr(tresi1, tresi2) < .001,
STOPElse = Go to Step 1.
October 30, 2002 [email protected] 26
2/

MINITAB codes1>corr c7 c12 # initial rho>let k3=.730 # enter above/updated rho>let k1=(1/sqrt(1+k3)+1/sqrt(1-k3))/2>let k2=(1/sqrt(1+k3)-1/sqrt(1-k3))/2
# orthogonalize age>let c21=k1*c3+k2*c8>let c22=k2*c3+k1*c8>stack c21 c22 c31>name c31 'tage'
October 30, 2002 [email protected] 27

MINITAB codes2>let c23=k1*c7+k2*c12 # orthog… ccorr>let c24=k2*c7+k1*c12>stack c23 c24 c32 >name c32 'tccorr'>regress 'tccorr' 1 'tage'; >resi c33; >coef c34.>unstack c33 c35 c36; subs c18.>corr c35 c36 # STOP if <.001, else>let k3=k3+corr(c35,c36)/2
October 30, 2002 [email protected] 28

1413121110987654
80
75
70
65
age
cco
rr
Serial Bivariate Data: n=18 girls
October 30, 2002 [email protected] 29
757065
80
75
70
ccorr1_
cco
rr2_
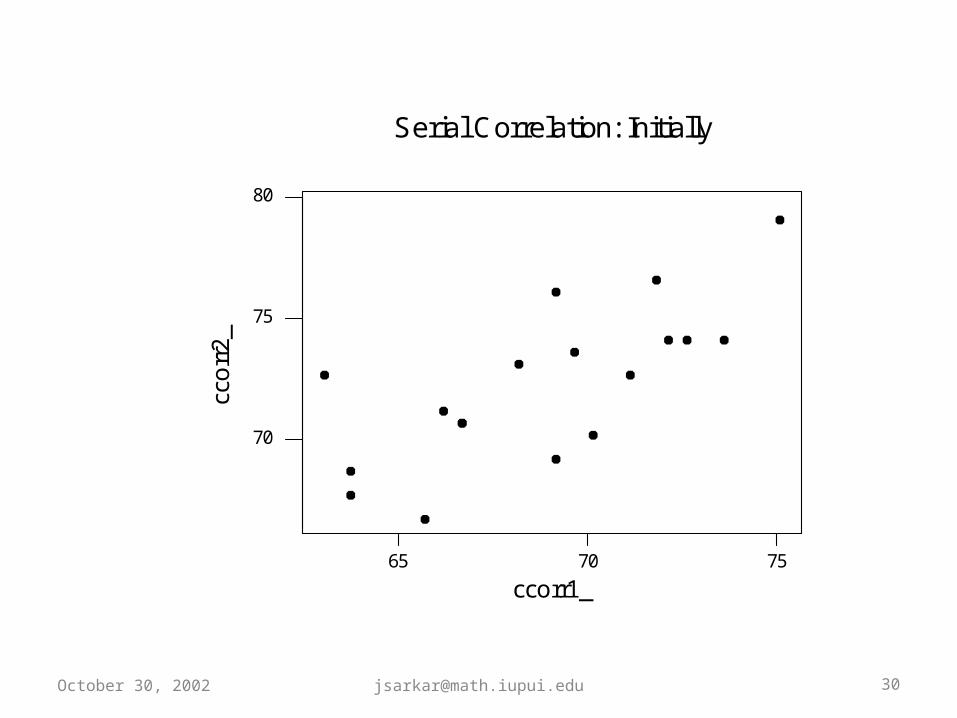
Serial Correlation: Initially
October 30, 2002 [email protected] 30

“Orthogonalized” data: (n=36)
First iteration: (Model 1)
Initial =.730
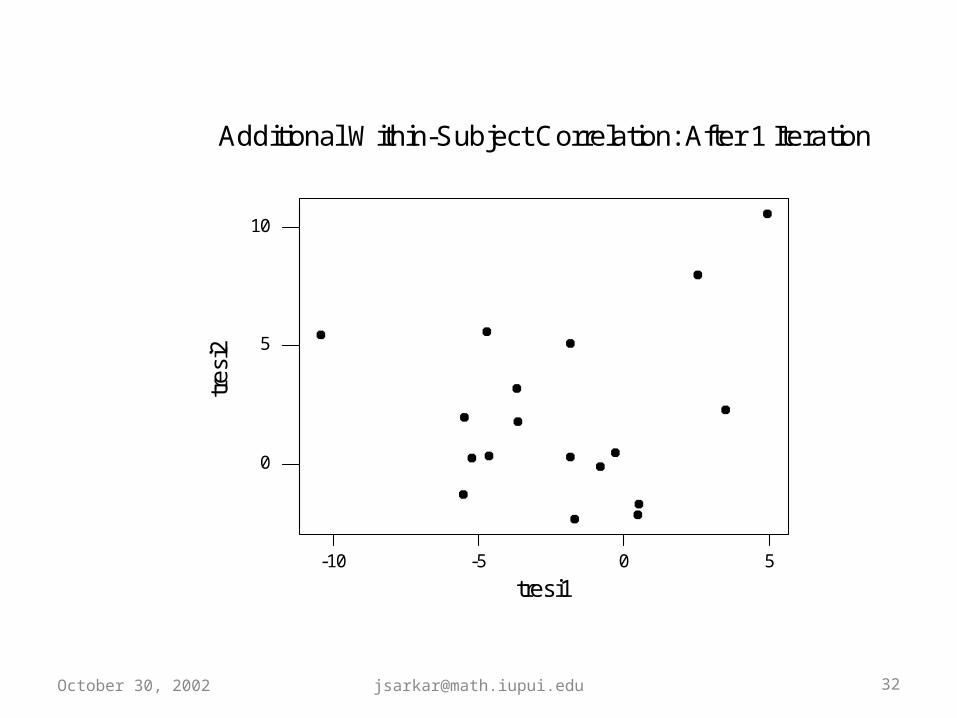
• tccorr =46.9184 + 1.1271 tage• r2=.216, r2(adj)=.193, p-value=.004• Corr(tresi1, tresi2)=.191
Revised =.82545
0
1
October 30, 2002 [email protected] 31
50-5-10
10
5
0
tresi1
tres
i2
Additional Within-Subject Correlation: After 1 Iteration
October 30, 2002 [email protected] 32


50-5-10-15
10
5
0
tresi1
tres
i2
Additional Within-Subject Correlation: After 5 Iterations
October 30, 2002 [email protected] 34

“Orthogonalized” data: (n=36)
After Five iterations: =.8646
• Corr(tresi1, tresi2)=.000
• tccorr =42.132 + 1.6613 tage• r2=.347, r2(adj)=.328, • S=5.1319, SE(c1)=0.3908, p-value=.000
5
October 30, 2002 [email protected] 35

10 5 0
60
50
40
tagec
tcco
rr
S = 5.13827 R-Sq = 34.7 % R-Sq(adj) = 32.8 %
tccorr = 42.1316 + 1.66135 tagec
Regression with Serial Data: After 5 iterations
October 30, 2002 [email protected] 36

Regress y on x : (Model 1)ccorr = 57.532 + 1.6613 age
• =0.8646• =5.2091, SE(b1)=.3967, p-value=.000
• t.975,33=2.0345
• 95% CI(1) = (0.8560, 2.4683)
October 30, 2002 [email protected] 37

1494
82
72
62
age
ccor
r
Regression Using Serial Data (Model1)
October 30, 2002 [email protected] 38
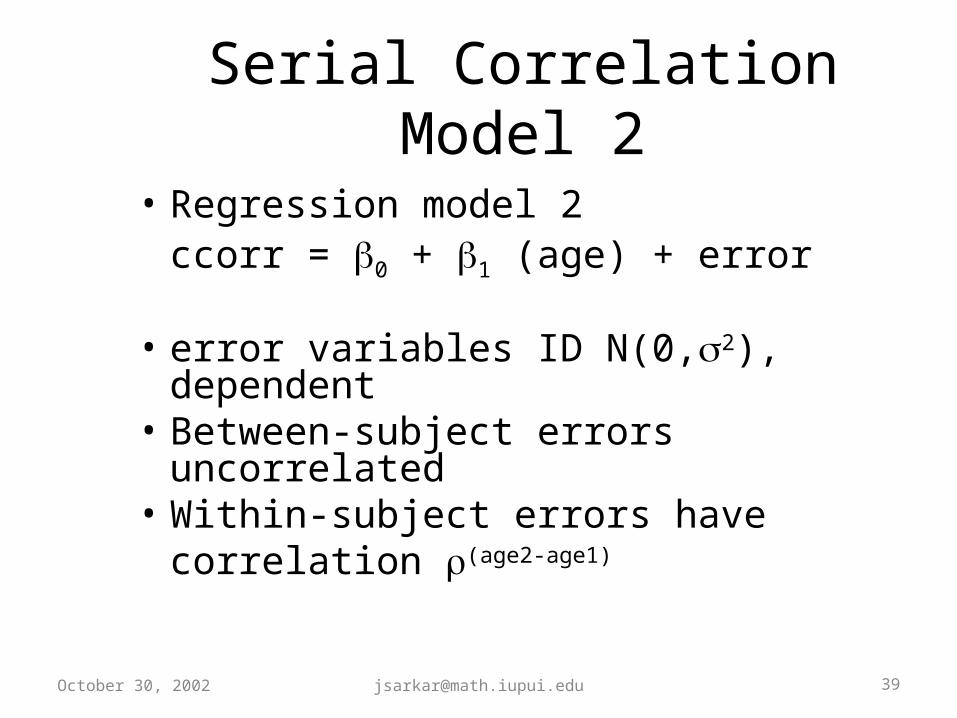
Serial Correlation Model 2
• Regression model 2ccorr = 0 + 1 (age) + error
• error variables ID N(0,2), dependent• Between-subject errors uncorrelated• Within-subject errors have correlation (age2-age1)
October 30, 2002 [email protected] 39

Regression Model 2
1
1
1
0
2
2
1
2
1
2
1
2
1
Cov
with
1
1
,...,1For
1jx
2jx
1jx
2jx
j
j
j
j
j
j
j
j
x
x
y
y
nj
October 30, 2002 [email protected] 40

MINITAB Codes 3>let c19=‘age2’ – ‘age1’ >name c19 ‘dage’>corr c7 c12>let k3=.730 # enter above/updated correlation
# use age to orthogonalize>let c51=(1/sqrt(1+k3**c19)+1/sqrt(1-k3**c19))/2>let c52=(1/sqrt(1+k3**c19) -1/sqrt(1-k3**c19))/2
>let c21=c51*c3+c52*c8>let c22=c52*c3+c51*c8 etc.
October 30, 2002 [email protected] 41

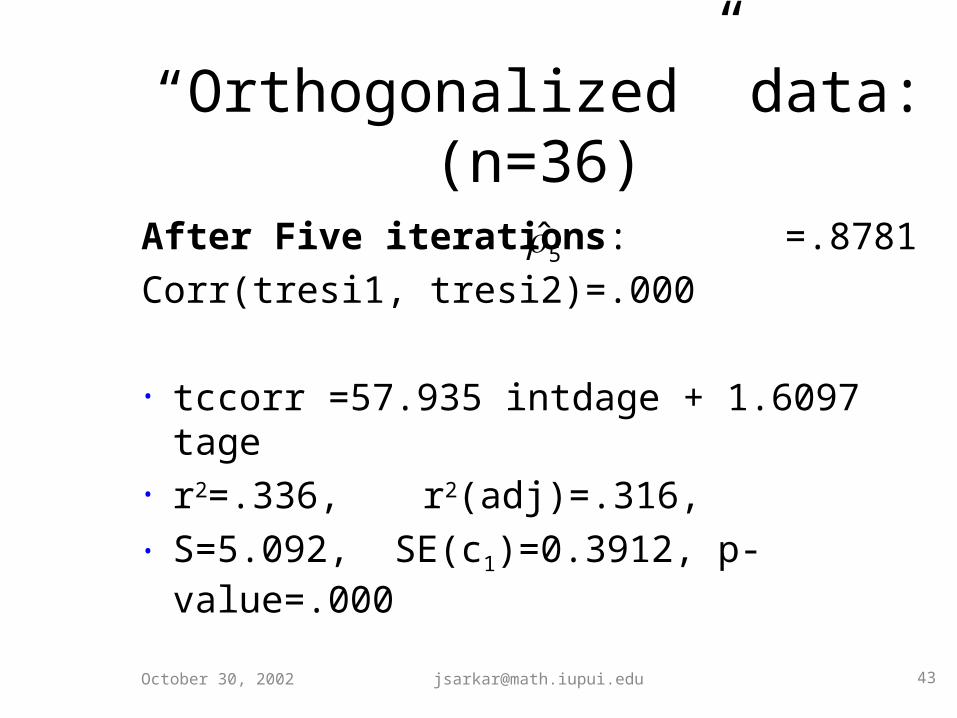
“Orthogonalized” data: (n=36)
After Five iterations: =.8781Corr(tresi1, tresi2)=.000
• tccorr =57.935 intdage + 1.6097 tage• r2=.336, r2(adj)=.316, • S=5.092, SE(c1)=0.3912, p-value=.000
5
October 30, 2002 [email protected] 43

Regress y on x : (Model 2)
October 30, 2002 [email protected] 44
ccorr = 57.935 + 1.6098 age
=0.8781 =5.169, SE(b1)=0.3971, p-
value=.000
t.975, 33=2.0345
95% CI(1) = (0.8018, 2.4176)

1494
80
75
70
65
age
ccor
rRegression Using Serial Data (Model 2)
October 30, 2002 [email protected] 45

1494
82
72
62
age
ccor
rRegression using Serial Data (Models 1 & 2)
October 30, 2002 [email protected] 46
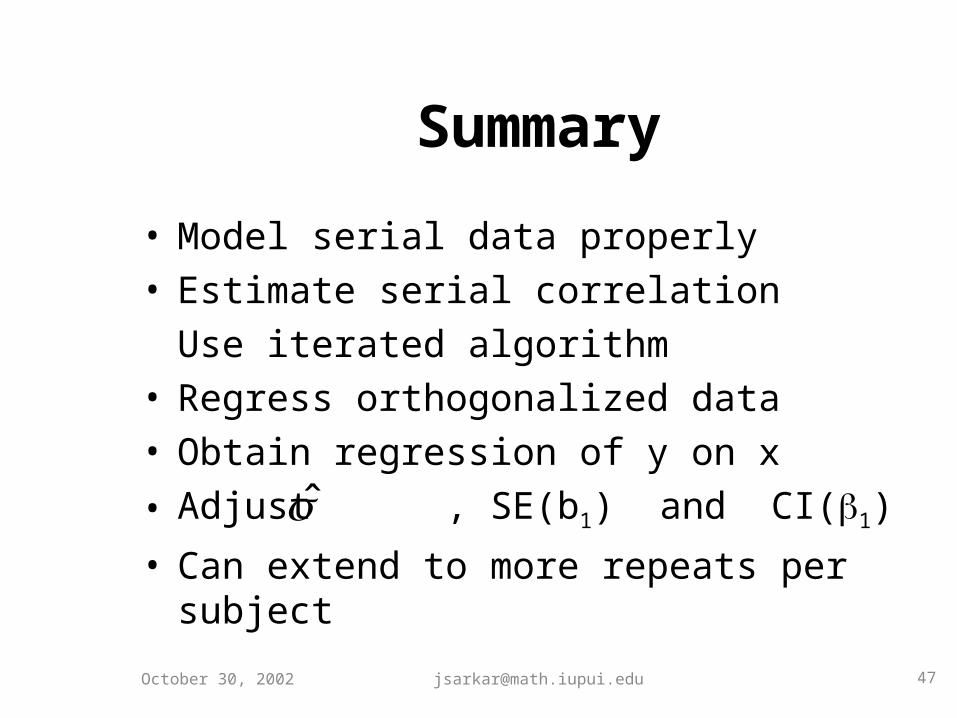
Summary
• Model serial data properly• Estimate serial correlation
Use iterated algorithm• Regress orthogonalized data• Obtain regression of y on x• Adjust , SE(b1) and CI(1)
• Can extend to more repeats per subject
October 30, 2002 [email protected] 47
